Embed Size (px)
Citation preview

Metabolic engineering of isoprenoid biosynthesis
in Synechococcus elongatus PCC 7942
Zachary D. Wiltshire
A Thesis
in
The Department
of
Biology
Presented in Partial Fulfillment of the Requirements
for the Degree of Master of Science (Biology) at
Concordia University
Montreal, Quebec, Canada
June 2016
© Zachary D. Wiltshire, 2016

CONCORDIA UNIVERSITY
School of Graduate Studies
This is to certify that the thesis prepared
By: Zachary D. Wiltshire
Entitled: Metabolic engineering of isoprenoid biosynthesis in Synechococcus elongatus
PCC 7942
and submitted in partial fulfillment of the requirements for the degree of
Master of Science (Biology)
complies with the regulations of the University and meets the accepted standards with respect to
originality and quality.
Signed by the final examining committee:
_______________________________________ Chair
Dr. Grant Brown
_______________________________________ External Examiner
Dr. David Walsh
_______________________________________ Examiner
Dr. William Zerges
_______________________________________ Examiner
Dr. Luc Varin
_______________________________________ Supervisor
Dr. Vincent Martin
Approved by: ______________________________________________________________
Dr. Grant Brown, Graduate Program Director
____________ _____________________________________________________________
Date Dr. André Roy, Dean of the Faculty of Arts and Sciences
iii
Abstract
Metabolic engineering of isoprenoid biosynthesis
in Synechococcus elongatus PCC 7942
Zachary D. Wiltshire
The feasibility of increasing isoprenoid biosynthesis in the obligate photoautotrophic
cyanobacterium Synechococcus elongatus PCC 7942 was explored through the use of a
heterologous mevalonate pathway. Incorporation of heterologous genes that produce non-native
metabolic intermediates has previously been demonstrated as a method of increasing product
formation while bypassing endogenous regulatory mechanisms. While this design strategy has
been exhaustively explored in model heterotrophic microbes, far less work has been carried out
in photoautotrophs. Practically, this disparity is due to the preference of using faster growing
heterotrophs, greater understanding of metabolic regulation in model heterotrophs, and more
limited characterisation of genes and genetic regulatory elements in cyanobacterial hosts
(particularly S. elongatus). Here the host response to incorporation of a heterologous mevalonate
pathway under the control of non-native promoters is characterised. Analysis was focused on
metabolic intermediates, endogenous isoprenoid products, and cell growth indicators, primarily
using HPLC and GC-MS. The heterologous route for isoprenoid biosynthesis was found to be
functional. An intermediate in this pathway, mevalonate, accumulated to 70µM under standard
laboratory conditions. Recorded changes to endogenous isoprenoid products were smaller, but
still apparent. Because of commercial interest in phototrophic production of isoprenoids,
particularly for fuels, I also attempted to generate a previously demonstrated biofilm phenotype
in S. elongatus. This phenotype is of interest for testing in evanescent field based
photobioreactors, but I was unable to replicate it during the period of work.

iv
Acknowledgements
I want to extend my thanks to past and current members of the Martin and Walsh labs for
their support and friendship. There was always someone willing to provide advice, whether
technical or personal. I would also like to acknowledge the support of my committee members. I
particularly want to acknowledge my supervisor Dr. Vincent Martin who provided an enormous
amount of leeway and support for me to pursue side projects, including involvement with the
iGEM program and Hyasynth Bio. And of course my family and friends for their constant love,
support, and belief in me.

v
Table of Contents
List of Figures ............................................................................................................................................ vii
List of Tables ............................................................................................................................................. viii
List of Equations ....................................................................................................................................... viii
List of Abbreviations ................................................................................................................................... ix
Goal and Objectives ..................................................................................................................................... 1
Introduction .................................................................................................................................................. 2
Metabolic engineering ........................................................................................................................... 2
Economics, biology, and engineering of biofuels ................................................................................. 3
Algal biofuels ................................................................................................................................ 4
Current limitations to photosynthetic approaches ......................................................................... 5
Metabolic engineering in cyanobacteria ................................................................................................ 7
Carotenoids .................................................................................................................................... 8
Hydrophilic commodity chemicals ................................................................................................ 8
Biofuels and polymers ................................................................................................................... 9
Isoprenoid biosynthesis ....................................................................................................................... 15
Metabolic pathways for isoprenoid precursors ............................................................................ 15
Isoprenoid diversity ..................................................................................................................... 16
Metabolic engineering of isoprenoids in cyanobacteria .............................................................. 19
Increasing isoprenoid biosynthesis for farnesene production in cyanobacteria .................................. 20
Materials and Methods .............................................................................................................................. 21
Metabolic engineering strategy ........................................................................................................... 21
Strains and media ................................................................................................................................ 23
Escherichia coli ........................................................................................................................... 23
Synechococcus elongatus PCC 7942 ........................................................................................... 23
DNA handling ..................................................................................................................................... 24
Oligonucleotides, synthetic double stranded fragments, laboratory DNA preparation ............... 24
PCR for DNA part generation ..................................................................................................... 25
PCR for screening ........................................................................................................................ 25
Strain engineering ............................................................................................................................... 26

vi
Plasmids and strains .................................................................................................................... 26
Tri-parental mating for transformation of S. elongatus ............................................................... 26
Natural transformation of S. elongatus ........................................................................................ 27
Analytical methods .............................................................................................................................. 29
GC-MS analysis........................................................................................................................... 29
Chlorophyll quantification ........................................................................................................... 30
HPLC analysis of carotenoids ..................................................................................................... 30
Results ........................................................................................................................................................ 32
Transformations of S. elongatus .......................................................................................................... 32
Validation of PCR screen for S. elongatus integration events ............................................................ 32
Mevalonate biosynthesis by S. elongatus cells harboring a recombinant upper mevalonate pathway 34
Mevalonate uptake and utilization by S. elongatus cells harbouring a lower mevalonate pathway ... 37
Changes to host metabolism while harbouring a complete heterologous mevalonate pathway.......... 39
Chlorophyll content in the MVA containing strain ..................................................................... 40
β-Carotene content....................................................................................................................... 43
Biosynthesis of α-farnesene ................................................................................................................ 44
Genetic knockout induced biofilm formation in S. elongatus ............................................................. 46
Discussion .................................................................................................................................................. 48
Photosynthetic isoprenoid production for commodity chemicals ....................................................... 48
Examination of metabolic intermediates in isoprenoid biosynthesis .................................................. 49
Relationship between chlorophyll, carotenoids, and isoprenoid flux .................................................. 51
S. elongatus permeability to metabolites ............................................................................................. 52
Biofilm formation ................................................................................................................................ 53
Design-build-test cycles in S. elongatus.............................................................................................. 54
References .................................................................................................................................................. 57
Appendices .................................................................................................................................................. 66

vii
List of Figures
Figure 1. General isoprenoid biosynthesis routes. ................................................................................ 17
Figure 2. Heterologous operons for isoprenoid production .................................................................. 22
Figure 3. Standard curves used for quantitative analysis of metabolites .............................................. 31
Figure 4. Validation of PCR based screen for S. elongatus chromosomal integration events ............. 33
Figure 5. Verification of upper MVA pathway integration by PCR. ................................................... 35
Figure 6. Mevalonate biosynthesis in a S. elongatus strain containing an upper MVA pathway ........ 36
Figure 7. Verification of lower MVA pathway integration by PCR. ................................................... 38
Figure 8. Mevalonate feeding in S. elongatus harbouring a lower MVA pathway .............................. 39
Figure 9. Verification of complete MVA pathway integration by PCR. .............................................. 40
Figure 10. Chlorophyll a biosynthesis in a MVA pathway containing S. elongatus strain .................. 42
Figure 11. β-carotene biosynthesis in a MVA pathway containing S. elongatus strain ....................... 43
Figure 12. Functional testing of the α-farnesene synthase in a S. elongatus shuttle vector ................. 45
Figure 13. Screening for farnesene synthase integration by PCR. ....................................................... 46
Figure 14. S. elongatus biofilm-related genome features ..................................................................... 47

viii
List of Tables
Table 1. Examples of microalgal derived products .............................................................................. 14
Table 2. Categories of isoprenoids ....................................................................................................... 18
Table 3. Mevalonate pathway genes used in this study ........................................................................ 21
Table 4. Plasmids and strains in this study ........................................................................................... 28
List of Equations
(A) Eq. 1: Mevalonolactone 1 standard curve fit ................................................................................. 31
(B) Eq. 2: Mevalonolactone 2 standard curve fit .................................................................................. 31
(C) Eq. 3: β-carotene standard curve fit ............................................................................................... 31
(D) Eq. 4: Farnesene isomers standard curve fit .................................................................................. 31

ix
List of Abbreviations
2YT ................................. Yeast extract/tryptone based growth medium
Abs#nm
............................. Absorbance measurement at the indicated wavelength (OD -
"optical density")
ATP ................................. Adenosine triphosphate
BG-11 .............................. Blue-green medium #11
bp ..................................... Base pairs
CDS ................................. Coding sequence
CRISPR-Cas ................... Clustered regularly-interspaced short palindromic repeats -
CRISPR associated gene
DOXP pathway ............... 1-deoxy-D-xylulose 5-phosphate pathway (see MEP pathway)
FS .................................... α-Farnesene synthase
GC-MS ............................ Gas chromatography mass spectrometry
HPLC .............................. High performance liquid chromatography
IPTG ................................ Isopropyl β-D-1-thiogalactopyranoside
LB ................................... Lysogeny broth
MEP pathway .................. 2C-methyl-D-erythritol 4-phosphate pathway (Non-mevalonate
pathway; also known as DOXP pathway)
MVA pathway ................. Mevalonate (Mevalonate pathway)
NADH/NAD+ .................. Reduced/oxidised forms of nicotinamide adenine dinucleotide
NADPH/NADP+ ............. Reduced/oxidised forms of nicotinamide adenine dinucleotide
phosphate
NS# ................................. S. elongatus neutral site for genomic integration
PCC ................................. Pasteur Culture collection of Cyanobacteria
Sa ..................................... Staphylococcus aureus
S. elongatus ..................... Synechococcus elongatus PCC 7942
Synechocystis .................. Synechocystis sp. PCC 6803
Synpcc7942_# ................. S. elongatus gene reference number
1
Goal and Objectives
This work aims to explore metabolic engineering of the cyanobacterium Synechococcus
elongatus PCC 7942 (S. elongatus) for increased isoprenoid production. Isoprenoids are a
diverse class of molecules with many uses including fuel, fragrances, health products, and as
flexible chemical building blocks for synthetic products. S. elongatus is photoautotrophic,
enabling direct-from-CO2 (photosynthetically-fixed carbon based) production of these
molecules.
Currently, many of these isoprenoids are derived from expensive plant sources or
environmentally damaging petroleum products. Carrying out photofermentation of engineered
microbes has the potential to increase product yield, decrease losses to side product formation,
and sequester the atmospheric greenhouse gas, carbon dioxide.
Production of desired isoprenoids can be improved by manipulating the host cell's
metabolism. Two distinct metabolic pathways can carry out isoprenoid biosynthesis. One of
these pathways is found natively in S. elongatus. I introduced the non-native version of this
pathway in two parts into S. elongatus and examined the resulting metabolic changes to the host.
The changes examined included metabolism of both native and foreign metabolites, as well as
metabolic burden resulting from added genes.
Improvements to molecule production in photoautotrophic microbes like S. elongatus can be
sometimes negated by poor industrial photobioreactor design, particularly for low cost products
like fuels. To complement the metabolic engineering carried out, I briefly explored biological
design considerations for the growth of S. elongatus in higher efficiency evanescent field based
bioreactors.
Taken together, improvements in metabolic efficiency and growth at production scales have
the potential to enable economically efficient synthesis of commodity and specialty chemicals
with a decreased environmental impact compared to traditional industrial methods.

2
Introduction
Metabolic engineering
Metabolic engineering, and the related field of synthetic biology, are quickly becoming a
major contributor to industrial chemical synthesis. It has been estimated that biologically
produced chemicals will compose 10% of global chemical production by the year 2020.1 Even
without considering petroleum fuels, nearly 90 million metric tons of organic chemicals and
lubricants are produced annually in the United States.2 Bioproducts can enter this market as
ready-to-use chemicals, platform molecules for further synthesis, functional biopolymers, and
mixed pools of biomolecules for processing into functional products.3
Metabolic engineering, often using synthetic biology tools, is the cellular design process that
is creating economically viable systems for producing these bioproducts. Early metabolic
engineering efforts relied on slow and inadequate tools for rapid prototyping and, limited data on
how genes and genetic regulatory elements behave in different contexts (host cell, plasmid,
expression system). It is these problems that synthetic biology is attempting to remedy.4
Synthetic biology has developed into such a wide umbrella term for fields inside biological
engineering that these names are often used interchangeably. At their core, these fields are
working to introduce engineering rigour into biology that early “genetic engineering” only
provided in name. New tools, particularly for DNA assembly, have increased the speed of the
engineering design-build-test cycle in biology. Synthetic biology has yielded significantly more
complex systems than its predecessor through the characterisation of genes and genetic
regulatory elements, and the creation of novel (or rebuilt) biological systems, giving clearer
insight into design guidelines for biological networks. As synthetic biology provides new tools
and knowledge, metabolic engineering will continue to benefit.
Metabolic engineering's major focuses are improving existing metabolic systems (for a
desired metabolite) and the creation of metabolism that does not exist in the cell being
engineered.5 Examples include biosynthesis of molecular precursors for therapeutics in bacteria
and yeast, manufacture of polymer feedstocks, and microbial production of jet fuel.6–9
3
While not limited to microbial species, this is where a large majority of work has been
carried out. Non-microbial targets are typically agricultural plants, which can be similarly grown
on large scales.10
Economics, biology, and engineering of biofuels
Photosynthetic microorganisms have not seen the same widespread industrial adoption as
obligate heterotrophs fed plant biomass for biofuel production. This has been partially due to
historical industrial organisms (such as Saccharomyces cerevisiae - brewing yeast) having
greater existing infrastructure, and because of the lower entry barrier for obtaining an
economically viable strain.
S. cerevisiae strains naturally demonstrate significant ethanol production ability and
tolerance to the ethanol produced. This trait is regularly employed at the largest industrial
fermentation scales in the world for the production of fermented beverages, particularly beer.
While there are significant markets and distribution infrastructure for ethanol-containing
beverages, ethanol biofuels have been mainly limited to major distribution in Brazil and in
blends with traditional gasoline elsewhere. Ethanol biofuel production in Brazil is strongly
incentivised by the high availability of sugarcane to use as a feedstock in heterotrophic
fermentation. In the United States, economic viability of traditional heterotrophs has been
artificially increased through the use of feedstock subsidies, particularly corn, in order to produce
"greener" fuels. These subsidies have in some cases resulted in higher food costs and a decrease
in the proportion of agricultural land use for food production.11 Use of agricultural wastes (by
themselves or from dedicated fuel crops,) that are high in lignocellulosic materials, will help
decrease fermentation wastes and feedstock costs, and "green" the biofuel fermentation process
further by more completely utilising the products of photosynthesis.
4
Algal biofuels
Because heterotrophic biofuels are generated by organisms consuming biomass generated by
photosynthetic organisms, significant energy loss occurs in the transition from sunlight to fuel.
Using a photosynthetic microbe (ie. a photosynthetic microalgaeA) directly for the production of
biofuels eliminates this second biomass generation step, and decreases the associated carbon
emissions in the fuel generation process.
Algae can be used for biofuel generation in three main ways, with each method having been
demonstrated at pilot or production scale:
Growth as an alternative "crop" to feed heterotroph fermentation as described
above.12
Whole cell conversion by pyrolysis to "biocrude".13,14
Secretion or accumulation of biofuel or biofuel precursor chemicals generated by
engineering the algae's metabolism.15
When used as feedstock, cultivated microalgae reduces the complexity involved in using the
total photosynthetic biomass. Unlike plants, the carbon-rich, degradation-resistant structural
polymers lignin and cellulose are not found in microbial algae.16
The biocrude approach can readily use natural or engineered algae. These algae are typically
highly lipid-rich eukaryotes. In this approach, more than 50% of dry cell weight can be
converted into biocrude, and substantial amounts of nitrogen is left behind that can be processed
for use in fertiliser.17 In some cases, the environmental benefits of using a photosynthetic
organism are lost because product yields may be substantially better when eukaryotic algae are
fed heterotrophically. In an example using the mixotrophic green algae Chlorella protothecoides,
A Algae being a polyphyletic group consisting of organisms containing a photosynthetic apparatus (or
ancestrally containing a functional plastid,) while lacking the structural features that characterise land plants.
Organisms in this group include cyanobacteria, archaeplastidans (rhodophyta, chloroplastida/viridiplantae,
glaucophyta), and a subset of the remaining Bikonts that underwent secondary endosymbiotic events. To distinguish
single and multicellular algae, single celled species are often referred to as microalgae.136

5
when fed heterotrophically, lipid accumulation was nearly four times greater than during
photoautotrophic growth.18
Production and secretion of liquid biofuels generally involve metabolic engineering to
generate sufficient fuel yields. In some cases, natural metabolic process, such as those designed
to combat environmental stress, can augment yields by helping redirect carbon flux.19,20
Examples include ethanol secretion by Synechococcus elongatus PCC 7942 (S. elongatus) and
free fatty acid generation by Synechocystis sp. PCC 6803.21,22 Generally, secretion is preferred
over accumulation because of decreased recovery and purification costs. When lipids are the
target molecule, an accumulation approach can result in 30% of production costs going towards
purification.23
Current limitations to photosynthetic approaches
The main drawbacks to using photosynthesis, rather than heterotrophic systems, include
slower growth rates, more expensive/inefficient infrastructure required for large scale production
facilities, and structural inefficiencies in the photosynthetic process such as energetic waste due
to chlorophyll antenna size.24
Heterotrophic microbes display very rapid growth when nutrients are not limiting in their
environment. Under optimal conditions, common laboratory Escherichia coli strains have
doubling times of approximately eighteen minutes.25 Saccharomyces cerevisiae are roughly 5.5
times slower at 100 minutes per optimal doubling.26 Reported growth rates for common
photosynthetic organisms are significantly slower still. S. elongatus has a typical doubling time
of approximately 420 minutes.27 Under heavily optimized conditions, the doubling time may be
as low as 246 minutes.28 A model eukaryotic algae, Chlorella pyrenoidosa doubles every 11
hours when grown photoautotrophically.29 Dunaliella sp., investigated for carotenoid production,
have recorded doubling rates of 15-20 hours.30,31 Recently, Synechococcus UTEX 2973, a close
relative of Synechococcus elongatus PCC 7942, was described by Yu et al. as having an
optimised doubling time of only 114 minutes under autotrophic conditions.28
Growing algae under phototrophic conditions necessitates each cell have access to light.
Raceway style ponds are the traditional growth system for microalgae, having been used for the

6
past 60 years.32 They provide an inexpensive (depending on land cost,) low complexity growth
system. Raceway pond efficiency as a bioreactor is directly proportional to their physical area
and local climate. The density of the microalgal culture is limited by the ability of the raceway
design to efficiently mix the culture and, the ability for light to penetrate into the culture.33
Contamination is often cited as a concern with this type of open reactor design, but raceway
designs remain one of the systems of choice for non-transgenic microalgae such as Arthrospira
spp. (Spirulina) because of their ease of implementation.34 Because raceway systems are an open
reactor design, environmental biodiversity concerns are raised when transgenic algae are used.
These concerns have lead some algal fuel companies to pursue the development of suicide
systems for their strains that limit strain viability outside of their reactor systems.35
Closed reactor systems exist in a variety of formats, but are generally composed of
interconnected tubing or panels that increase the photosynthetically productive surface area of
the system. Further efficiency gains can be realised through the increased environmental control
available in closed systems. However, these productivity increases come at a financial cost. The
physical infrastructure of closed systems is more expensive than open ponds. Traditional
fermentation tanks are generally not considered a viable option for scaled photosynthetic growth
because of their very low surface area to volume ratio.
The economic viability of photobiofuels will benefit the most from new photobioreactor
designs that increase cell density while maintaining light availability. One of the more novel
approaches to this photobioreactor problem has been the use of waveguides designed for the
efficient distribution of light to algal monolayers. In a traditional photobioreactor the surface
tends to be too bright and the interior too dark, resulting in only a small percentage of the reactor
volume maintaining optimal growth conditions. Using the evanescent field generated by
waveguides to grow algal monolayers promises order-of-magnitude improvements in the
proportion of maximally productive algae in the reactor. These productivity increases will be
most notable where cyanobacteria are employed, due to their size. Their diameter corresponds to
the 1µm optimal penetration depth of the evanescent field beyond the waveguide.36 Eukaryotic
algae can have a diameter ten times larger than this.37,38

7
Alongside improved growth regimes for photosynthetic microbes, improvements to
photosynthesis may greatly improve photobiofuel economic viability. Significant energy loss
occurs at every conversion step in oxygenic photosynthesis. Less than half of the incident
sunlight is absorbed, and at most two-thirds of that absorbed energy can be converted to
chemical energy in the photosystems.24 Further energy loss occurs at the point of molecular
hydrogen generation. When energy loss due to metabolism for biomass accumulation is factored
in, the highest possible total energy conversion efficiency from sunlight is only 10%.24 When
cells are placed in light conditions that exceed the system's photosynthetic ability, mechanisms
such as non-photochemical quenching are employed to limit over-production of damaging
reactive oxygen species. These type of issues are beginning to be addressed by improvements to
light harvesting antenna, increased diversity of functional pigments, and enzyme/metabolism
efficiency improvments.24
To investigate and improve metabolic inefficiencies in photosynthetic microbes,
cyanobacteria have proven to be one of the best test systems. This is due to their simpler cellular
organisation, earlier fully sequenced genomes, and the better stability of transformed strains.39
Coupled with improved techniques for metabolic engineering, these reasons have resulted in a
larger body of work of molecular studies applicable to metabolic engineering work.
Metabolic engineering in cyanobacteria
Only within the last decade have cyanobacteria become a production platform for metabolites
outside their natural biochemistry. Endogenous metabolites targeted include biohydrogen and the
carotenoids (Table 1).40–43 Outside of this rudimentary biotechnological use of cyanobacteria,
major studies with cyanobacteria have focused on ecological aspects, photosynthesis, and
chronobiology.44
S. elongatus has been particularly important in moving chronobiology forward by allowing
for more robust, large scale studies. Prior to the introduction of S. elongatus, generation of
circadian clock mutants in various eukaryotes was haphazard and was coupled with a poor
understanding of the underlying genetics.45 While not evolutionarily related to the eukaryotic
circadian clocks, the S. elongatus kaiABC system provided a simpler regulatory network that
could be easily manipulated. Studies of kaiABC have supplied an excellent understanding of
8
oscillatory genetic circuit dynamics. The promoters related to this circuit have also been widely
used historically for expression of genes in this and related species.46
S. elongatus and similarly named (but not directly related) freshwater cyanobacteria have
become the focus of engineering efforts for a variety of commodity chemicals including
endogenous chemicals, sugars,47,48 other hydrophilic compounds,49,48,50 and a wide variety of
fuels (Table 1).
Carotenoids
Carotenoid production in algae has been investigated for decades (Table 1).41–43,51 These
endogenous compounds are of particular interest for the health food/supplement industry. Under
certain stress conditions, particular natural algal strains have been measured to produce extreme
quantities of carotenoids. β-carotene levels in Dunaliella salina were measured in one study to
compose 40% of the culture's dry cell weight (DCW).41 Although subsequent studies have not
reported such high yields in Dunaliella sp., DCW yields between 3-10% have been
reproduced.42,51 However, it must be kept in mind that these yields generated in highly controlled
systems are order(s) of magnitude higher than those reported at production scale.51
Hydrophilic commodity chemicals
Glucose
These hydrophobic endogenous chemicals provided an obvious starting point for the
biotechnological use of algae (Table 1). The use of stress regimes has also allowed for the
exploitation of underlying metabolic processes involving hydrophilic compounds. In
Synechococcus spp., osmotic stress induced by high salt concentrations was shown to be
managed by the production of sucrose as an osmolyte.52–54 Utilising this natural metabolic
process, Niederholtmeyer et al. (2010) converted S. elongatus into a sugar secreting microbial
factory.48 Their system involves enzymatic cleavage of the sucrose osmolyte into glucose and
fructose, followed by facilitated diffusion out of the cell. This type of system contrasts directly
with heterotrophic fermentation systems that require a reduced carbon (often sugar) input. The
9
use of the sugar secreting strain has been shown to support co-cultures at laboratory scale, and
has even been proposed for use with artificial chloroplast/endosymbiotic systems.48,55
One reported problem with this system was a plateau reached in sugar concentration. Further
investigation by the authors suggested this was due to biochemical and metabolic limitations
inherent in the system as presented. The hexose sugar transporter employed was bidirectional
and passive and, S. elongatus was only able to produce sucrose during the light phase of its
diurnal cycle, likely consuming the hexose sugars during the dark phase.48
Sucrose
A similar study was carried out where S. elongatus was engineered to excrete sucrose
directly. Yields were substantially higher with a final estimated titre of 2.6 g/L at a consistent
rate of 36.1 mg/L/h. In a variety of the better environmental conditions reported in the study,
sucrose production represented at least 40% of the biomass generated.20
Lactate
With another hydrophilic compound in S. elongatus, lactate, this concentration plateau was
not observed, likely due to the secretion transporter chosen.48 The lactate transporter, LldP,
transports lactate using coupled transport driven by a proton gradient. During normal growth, S.
elongatus can easily alkalise its growth medium to above pH 9, creating a proton gradient that
can consistently export lactate. Lactate concentrations observed were roughly 2.5 times greater
than the hexose sugars (Table 1). A similar engineering experiment in Synechocystis sp. PCC
6803, which did not include transporters, yielded lactate concentrations 3.2 mM (5x more than in
S. elongatus.)50
Biofuels and polymers
Fuel production continues to be the most researched area for metabolic engineering in algae.
For this reason, only examples in cyanobacteria will be discussed at length. This research boom
has been driven by the need to generate energy production systems that can be used regionally
for energy security and, to reduce the "carbon footprint" associated with the energy generation.
The majority (but not all) have been chosen for their ability to function as "drop-in" fuels that do

10
not require modifications to the existing liquid fuel distribution and consumption systems.
Criteria for being considered a drop-in fuel typically consist of having octane/cetane numbers
similar to existing gasoline or diesel, the ability to blend with petroleum fuels over a wide range
of concentrations, very limited hygroscopicity, and similar viscosity/gelling properties.56
Since many of these biofuels have chemical structures similar to the petroleum products they
are designed to replace, they may also be utilised for processes beyond combustion just as
petroleum products are. One of the most economically relevant of these uses is as precursor
material for structural polymer synthesis. Example use cases include ethylene for the common
thermoplastic polyethylene and isoprene for synthetic rubber.
Ethylene
Three well-studied enzymatic systems can facilitate ethylene biosynthesis, with two of these
having been added to cyanobacterial hosts. The first, found in higher plants, is a two-enzyme
process that uses 1-aminocyclopropane-1-carboxylic acid (ACC) synthase and ACC oxidase
(ACS-ACO.) Ethylene synthesis through this route is dependent on methionine availability.
These enzymes have been used in Synechocystis sp. PCC 6803 without any additional
engineering, generating poor yields (10nl/ml/h/OD750) (Table 1).57
The second pathway is bacterial and also methionine dependent. However, instead of
proceeding through s-adenosylmethionine like ACS-ACO, 2-keto-4-methyl-thiobutyric acid
(KMBA) is used.58 Use of the bacterial KMBA enzymes have not yet been explored in
cyanobacteria.
The third route, found in some bacterial plant pathogens (eg. Pseudomonas syringae,) is
composed of a single enzyme, "ethylene forming enzyme" (EFE). EFE requires 2-oxoglutarate
(2-OG), arginine, and dioxygen. This 2-OG dependent route is currently the most explored
method for ethylene biosynthesis, particularly in cyanobacteria. Until recently, all ethylene work
in cyanobacteria had focused only on the EFE (or ACS-ACO) enzyme(s) and environmental
conditions. Productivity of EFE expressing strains could not be maintained beyond a few
passages of the culture. Ungerer et al. improved the stability of EFE expression in Synechocystis
sp. PCC 6803, leading to multiple order-of-magnitude yield improvements.59 Further metabolic

11
engineering, focused particularly around 2-OG in the tricarboxylic acid cycle, has provided an
additional 1.5-fold improvement to ethylene yield. At 7514μl/l/h, this represents >7% of the total
carbon fixed by the cell.
Ethanol
While engineering for ethanol has been long carried out in heterotrophic microbes,
particularly S. cerevisiae, work in algae for ethanol production began in 1999 (Table 1). Deng
and Coleman's seminal paper entitled "Ethanol synthesis by genetic engineering in
cyanobacteria" expanded the field of rational metabolic engineering for exogenous metabolites
into the use of cyanobacteria.21 Using a two-gene operon containing pyruvate decarboxylase and
alcohol dehydrogenase II from Zymomonas mobilis they demonstrated total ethanol
accumulation of up to 1.71mM by S. elongatus. Production was recorded with both the
endogenous rbcLS and E. coli PLAC promoters.
Butanol
Isobutyraldehyde is a biological precursor isobutanol production and other petroleum derived
commodity chemicals. Atsumi et al. introduced genes for increased valine biosynthesis to S.
elongatus to enable high level production of isobutyraldehyde.60 Their maximum production of
723mg/l was higher than all similar systems in S. elongatus at the time of publication. When
genes for isobutanol production were added, yield dropped to approximately 60% of the
precursor total. These yields were shown to be related concentration limits for product toxicity in
the host. 2-methyl-1-butanol was later demonstrated by similar means, using isoleucine
biosynthesis for precursor production. Total yield only reached 200mg/l, with 2-methyl-1-
butanol biosynthesis resulting in a lower toxicity threshold (Table 1).61
Fatty acids and alkanes
Continuous free fatty acid biosynthesis presents a challenge because of the need to decouple
production from cell growth. Natural cyanobacteria with the highest lipid accumulation are
typically under environmental stress, with a correspondingly slow growth rate. The most
effective free fatty acid engineering in cyanobacteria has so far followed a similar methodology

12
to that used in E. coli (Table 1). The introduction of an acyl-acyl carrier protein (ACP)
thioesterase (ACP-TE) converts an acyl-ACP molecule to the corresponding fatty acid.
In Synechocystis sp. PCC 6803, an E. coli ACP-TE was added along with modifications to
weaken the cell wall, and knockouts to reduce diversion of carbon to side products. One of these
knockouts eliminated diversion of acetyl-CoA to acetyl phosphate. Acetyl phosphate has been
suggested to function as a global genetic response regulator in Synechocystis sp. PCC 6803.62
Yields of secreted free fatty acids in this system (primarily C12/C14/C16) were as high as 197
mg/l.22
Targeted production of alkanes from fatty acid metabolism has been reported as high as 26
mg/l in Synechocystis sp. PCC 6803.63 The dedicated enzymes taking fatty aldehydes to alkanes
and alkenes were overexpressed and, enzymes diverting carbon away from fatty acid metabolism
were knocked out. Newer single cell screening techniques for fatty acid/alkane production in
cyanobacteria promise to increase the speed that new strains can be analysed.64
Isoprenoids and terpenoids
Lindberg et al. (2010) provided the first demonstration of metabolic engineering for
isoprenoid fuels in cyanobacteria (Table 1). Using Synechocystis sp. PCC 6803, the authors
introduced only an isoprene synthase and demonstrated isoprene production.65 In a later study
focused on bioreactor design using the same strain, the authors calculated that maximally 0.08%
of fixed carbon was being partitioned into isoprene.66 Bentley et al. (2014) continued this work
with the addition of a heterologous mevalonate pathway to increase isoprenoid flux. Isoprenoid
biosynthesis is described in detail in the section that follows. Over an eight-day growth period,
the total isoprene generated was approximately 250μg/gDCW. This final strain was 2.5 times
13
more productive than the original with only the isoprene synthase.67,B
Limonene biosynthesis was demonstrated by Halfmann et al. (2014) in the filamentous
cyanobacterium Anabaena sp. PCC 7120. In this study, the limonene synthase from the Sitka
spruce was introduced into the cyanobacterium, along with genes for three rate limiting enzymes
in the endogenous MEP isoprenoid pathway.68 Photosynthetic production of farnesene was also
very recently demonstrated in the filamentous cyanobacterium Anabaena sp. PCC 7120. Similar
to the original work with isoprene biosynthesis in Synechocystis sp. PCC 6803, only the single
gene required for synthesis of the final product was introduced. The authors recorded the rate of
farnesene synthesis as 69.1μg/l/OD700/day. Of interest in their results was a 60% increase in
photosystem II activity when the farnesene synthase was expressed. (Photosystem II activity was
also recorded to be higher in the limonene producing strain.) Although this filamentous,
heterocyst-forming cyanobacterium is interesting for its ability to fix nitrogen, it is largely
unexplored for industrial biosynthesis.
B In all three studies, the isoprene-synthase-only base strains were reported to result in the same isoprene yields
when compared side by side.67 This conflicts with the preliminary values presented in 2010. Assuming the 2014 data
is correct, the 2010 isoprene yields were over-reported by 3.4 times. This discrepancy may be assigned to
differences in growth conditions; in 2014 the strains were grown in the novel photobioreactor described in their
2012 study. Although along with improved isoprene harvesting, this reactor was designed specifically to increase the
carbon available to the strains.

14
Table 1. Examples of microalgal derived products
Product
Organism
Total yield
Rate
Reference
Health Products
Carotenoids: β-carotene
Zeaxanthin
Dunaliella salina
Dunaliella bardawil
Synechocystis sp. PCC 6803
3 - 40% DCW
8% DCW
0.98 mg/l/Abs730
51,41 42 43
Hydrophilic commodity chemicals
Glucose/fructose Synechococcus elongatus PCC 7942 250 µM (45 mg/l) 47,48
Sucrose Synechococcus elongatus PCC 7942 (2.6 g/l) 36.1 mg/l/h
Lactate Synechococcus elongatus PCC 7942
Synechocystis sp. PCC 6803
620 µM (55 mg/l)
3200 µM
54 mg/l/day/Abs750 48 50
D-mannitol Synechococcus sp. PCC 7002 (84.6 mg/l/OD730)
1100 mg/l
0.15 g/l/day 69
Biofuels and Polymers
Hydrogen Synechococcus elongatus PCC 7942 40(70)
Ethylene Synechococcus elongatus PCC 7942
Synechocystis sp. PCC 6803
-
9739 μl/l/h (2-OG fed)
7514 μl/l/h (not fed)
451 nl/ml/h/OD730
858 µl/ml/h/OD730 (fed)
71 (72) 73 (57,59)
Ethanol Synechococcus elongatus PCC 7942
Synechocystis sp. PCC 6803
1.71 mM
12 mM
9.8 mM
54 nmol/OD730/l/day
5.2 mmol/OD730/l/day
21 74
Butanol: 2-methyl-1-butanol
Isobutyraldehyde
Synechococcus elongatus PCC 7942
Synechococcus elongatus PCC 7942
200 mg/l
723 mg/l
20 mg/l/day
2.5 mg/l/h
61 60
Fatty Acid Derived: Free FA
Alkanes
Synechocystis sp. PCC 6803
Synechococcus elongatus PCC 7942
Synechococcus sp. PCC 7002
Synechococcus elongatus PCC 7942
Synechocystis sp. PCC 6803
197 mg/l (secreted)
49.3 mg/l
131 mg/l
5% DCW
26 mg/l (1.1% DCW)
(2.3 mg/l/OD730)
0.273 mg/l/h
0.103 mg/l/h
0.438 mg/l/h
22 75 76 77 63 77
Isoprenoids: Isoprene
Limonene
Farnesene
Synechocystis sp. PCC 6803
Anabaena sp. PCC 7120
Anabaena sp. PCC 7120
250 µg/gDCW
114 µg/l
305 µg/l
31 µg/gDCW/day
86.4 μg/l/OD700/day
69.1 μg/l/OD 700/day
65,67 68 78
14

15
Isoprenoid biosynthesis
Metabolic pathways for isoprenoid precursors
Isoprenoids and terpenoids make up a wide array of molecules that have shown promise as
biofuels and their precursors. These secondary metabolites can be produced through two
evolutionarily distinct metabolic pathways. These pathways are known as the mevalonate
(MVA) pathway and the 2C-methyl-D-erythritol 4-phosphate (MEP; or 1-deoxy-D-xylulose 5-
phosphate (DOXP); or non-mevalonate) pathway (Figure 1). The MVA route is found in
eukaryotes, archaea, and some eubacteria. The MEP genes are found in plant and algal
chloroplasts and most eubacteria. These categorisations of where the pathways are found can
only be considered general guidelines. Lateral gene transfer has played a significant role in the
genes used to produce isoprenoids.79
While both pathways have seven core enzymatic steps and result in the production of
isopentenyl pyrophosphate (IPP) and dimethylallyl pyrophosphate (DMAPP), the pathways'
precursors differ. The MEP route uses pyruvate and glyceraldehyde-3-phosphate (G3P) and, the
MVA route begins with acetyl-CoA. Following the MEP route, pyruvate and G3P generate
DOXP and release one CO2 molecule via the DOXP synthase. DOXP is then taken to MEP by
DOXP reductoisomerase (DXR). This DXR mediated reaction is NADPH dependent. A
cytidylyltransferase then adds a cytidine phosphate group (from cytidine triphosphate - CTP) to
MEP, forming 4-diphosphocytidyl-2-C-methylerythritol (CDP-ME) and releasing a free
pyrophosphate. A CDP-ME kinase then adds a phophate group (from adenosine triphosphate -
ATP) to form 4-diphosphocytidyl-2-C-methyl-D-erythritol 2-phosphate (CDP-MEP) and a free
adenosine diphophate. CDP-MEP is then cyclised to 2-C-methyl-D-erythritol 2,4-
cyclopyrophosphate (MEcPP) by MEcPP synthase, releasing a cytidine monophosphate (CMP)
molecule. Using two oxidised ferredoxin units, (E)-4-hydroxy-3-methyl-but-2-enyl
pyrophosphate (HMB-PP) synthase then catalyses the reaction of MEcPP into HMB-PP. The
final step in the MEP pathway takes HMB-PP to IPP or DMAPP via the NADPH dependent
HMB-PP reductase.

16
Following the MVA route, two acetyl-CoA molecules are combined with a thiolase enzyme,
forming acetoactyl-CoA. The next reaction forms 3-hydroxy-3-methylgluaryl-CoA (HMG-CoA)
via HMG-CoA synthase. HMG-CoA is then taken to mevalonate by the NADPH-dependent
HMG-CoA reductase. Two successive ATP-dependent phosphorylations then occur, taking
mevalonate to mevalonate-5-phosphate and then mevalonate-5-pyrophosphate. These reactions
are mediated by mevalonate kinase and phosphomevalonate kinase, respectively. Mevalonate-5-
pyrophosphate (MPP) then undergoes an ATP-dependent enzymatic decarboxylation, by MPP
decarboxylase, to IPP. A bidirectional isomerase may then interconvert IPP and DMAPP.
Further enzymatic steps may take IPP/DMAPP to longer chain isoprenoid pyrophosphates.
All of these elongated pyrophosphates are composed of multiple isoprene (IPP/DMAPP) units
combined in a chain. IPP and DMAPP combined by a farnesyl pyrophosphate synthase (FPPS)
result in geranyl pyrophosphate (GPP). FPPS can then add a second IPP molecule to GPP to
result in farnesyl pyrophosphate (FPP). A third IPP molecule may then be added to FPP by a
geranylgeranyl pyrophosphate synthase (GGPPS) to form GGPP. These pyrophosphates are used
as the building blocks for all isoprenoids, including carotenoids and chlorophyll precursors. The
MVA route is commonly referenced in engineering studies as being composed of two blocks: a
"top" or "upper" mevalonate pathway composed of the first three enzymatic steps, and a
"bottom" or "lower" mevalonate pathway composed of the remaining steps.6
Isoprenoid diversity
Tens of thousands of natural isoprenoid molecules have been described.80 The chemical basis
for all of this molecular diversity is IPP and DMAP (isoprene units), although extensive
modification can be carried out on the base isoprenoid molecule. Isoprenoids can range from
simple undecorated chains of isoprene units to heavily modified multi-cyclic structures that bear
little resemblance to the starting precursors.

17
2C-methyl-D-erythritol 4-phosphate (MEP) and mevalonate (MVA) isoprenoid biosynthesis routes with relevant products shown. Abbreviations: G3P, glyceraldehyde 3-phosphate; DOXP, 1-deoxy-D-xylulose 5-phosphate; MEP, 2C-methyl-D-erythritol 4-phosphate; CDP-ME, 4-
diphosphocytidyl-2-C-methylerythritol; CDP-MEP, 4-diphosphocytidyl-2-C-methyl-D-erythritol 2-phosphate; MEcPP, 2-C-methyl-D-erythritol 2,4-
cyclopyrophosphate; HMB-PP, (E)-4-hydroxy-3-methyl-but-2-enyl pyrophosphate; FD, ferredoxin; IPP, isopentyl pyrophosphate; DMAP, dimethylallyl
pyrophosphate; HMG-CoA, 3-hydroxy-3-methylgluaryl-CoA; MevP, mevalonate-5-phosphate; MPP, mevalonate-5-pyrophosphate; GPP, geranyl
pyrophosphate; FPP, farnesyl pyrophosphate; GGPP, geranylgeranyl pyrophosphate; '__'PP-S, '__' pyrophoshate synthase; FS, farnesene synthase.
Figure 1. General isoprenoid biosynthesis routes.

18
The number of these isoprene units incorporated into the final molecule help provide a
general naming system for the compounds. (Table 2) Hemiterpenes (ie. isoprene), containing
only five carbon atoms, are highly volatile and have combustion properties similar to
components of blended jet fuel.81 Because of its simplicity and ease of purification, isoprene can
readily be used as a chemical feedstock for producing synthetic rubber and other compounds
typically generated from petroleum. Monoterpenes (with 10 carbon atoms,) such as limonene and
pinene, have higher boiling points that make them suitable for use in both everyday products and
high performance fuels. (Dimerised pinene has been demonstrated to have characteristics nearly
identical to JP-10 tactical fuel. Petroleum based production of JP-10 is generally regarded as
prohibitively expensive for general use).82,83 Hydrogenated sesquiterpenes (with 15 carbon
atoms,) such as farnesane, behave similarly to petroleum diesel during combustion. Similar to
isoprene and pinene, sesquiterpenes have value as building blocks for larger molecules in
chemical synthesis processes.84–86
Table 2. Categories of isoprenoids
Isoprenoid
category
Number of
carbons
Number of
isoprene units
Examples and Uses
(*denotes fuel use)
Hemi-terpene 5 1 *Isoprene (Platform chemical)
Mono-terpene 10 2 *Limonene (Cleaning products)
*Pinene (Perfumery)
Sesqui-terpene 15 3 *Farnesene (Platform chemical)
Humulene (Medical)
CoQ (Health supplements)
Bacteriochlorophyll precursor
Di-terpene 20 4 Retinal
Taxadiene
Bacteriochlorophyll precursor
Chlorophyll precursor (phytol)
Sester-terpene 25 5 (Comparatively rare in nature)
Tri-terpene 30 6 Squalene (Cosmetics)
Steroid precursor
Sesquar-terpene 35 7 (Primarily microbial)
Tetra-terpene 40 8 Carotenoids (Health supplements)
Poly-terpene >40 >8 Natural rubber
19
Metabolic engineering of isoprenoids in cyanobacteria
Work carried out for the metabolic engineering of these isoprenoids has typically involved
increasing metabolic flux through to IPP/DMAP. In eukaryotes harbouring the MVA pathway,
this has been accomplished through over-expression of MVA genes or expression of a
heterologous MEP pathway. Work in prokaryotes has involved the opposite: over-expression of
MEP genes or expression of a heterologous MVA pathway.87
Over-expression of existing enzymes can be a useful tool in metabolic engineering. Such
systems have traditionally been easier to construct because of the ability to PCR the relevant
genes directly from the target organism. A serious drawback to relying on the organism's existing
metabolism is the set of constraints imposed on any engineering designs by the cell's existing
regulatory mechanisms. These mechanisms include transcriptional or translational effects, and
direct regulation of the relevant enzymes. Changes induced by these mechanisms can include
concentration dependent negative regulation and redirection of carbon flux to unwanted
products. Using heterologous genes/enzymes can help reduce or eliminate problems associated
with a cell's endogenous regulatory mechanisms.
Early (and some more recent) metabolic engineering work for isoprenoids often utilised the
coloured carotenoid tetraterpenes as a screen of metabolic flux through the MEP/MVA
pathway.88–93 Carotenoids, (with the particular exceptions of phytoene and phytofluene which
absorb in the ultraviolet,) range in colour from pale yellow to deep red. Including heterologous
genes leading to a particular carotenoid allows for a quantifiable colourmetric assay of
MEP/MVA pathway output. This type of assay is most functional in cell types with low levels of
similarly coloured pigments.
As mentioned earlier, metabolic engineering of cyanobacteria for isoprenoid production is
just starting to be explored.65,67,78 Like chloroplasts and other eubacteria, cyanobacteria use the
MEP pathway to generate IPP/DMAPP.
20
Increasing isoprenoid biosynthesis for farnesene production in cyanobacteria
The work presented here explores the use of a heterologous MVA pathway in Synechococcus
elongatus PCC 7942 (S. elongatus) for α-farnesene production. Strain design for improved use in
evanescent light based photobioreactors is also considered.
S. elongatus was chosen as the photosynthetic platform for exploring industrially relevant
sesquiterpene production because of the broader knowledge of its physiology and genetics
compared to many other microalgae. It also has a high degree of genetic tractability compared to
other systems. Reliable transformation protocols have been demonstrated, including natural and
conjugation based methods and, the species has a high efficiency of spontaneous, DNA
sequence-mediated genomic recombination.94,95 Additionally, multiple genomic regions have
been characterised ("neutral sites") that enable foreign DNA integration with limited effect on
the host.48,96 However, a known complication to genomic integrations in S. elongatus is its
polyploidy. The majority of cells have four or more (up to ten) copies of its chromosome at any
given time.97
The choice of S. elongatus was also made because of its size. This metabolic engineering
project was designed to run concurrently with the development of novel evanescent light based
photobioreactors. The evanescent field generated by waveguides in this type of reactor does not
penetrate far enough for optimal use of the photosynthetic machinery in larger microbes.36,98
Because optimal light harvesting in these systems requires a constant monolayer of
cyanobacteria along the waveguide surface, it is preferable to maintain the bacteria adsorbed to
the surface while flowing only media through the reactor's dysphotic/aphotic zones. To facilitate
this monolayer, I attempted to reproduce a recently described knockout-induced biofilm
phenotype in S. elongatus.99 The original authors describe the major cause of the phenotype as
inactivation of homologues of the type II secretion/type IV pilus assembly, resulting in impaired
protein secretion. This impaired secretion is hypothesised to limit the functionality of a secreted
peptide that facilitates self-suppression of biofilm formation.

21
Materials and Methods
Metabolic engineering strategy
The MVA pathway components tested here were originally designed for use in E. coli to
increase isoprenoid production.6 Gene components were primarily from S. cerevisiae, with some
exceptions (Table 3). The original version of this pathway was noted to have problems with flux
balances that reduced its efficiency. These imbalances (particularly HMG-CoA accumulation)
have been addressed in multiple later publications.100–103 One of the simpler methods used to
improve pathway balance was carried out by screening variants of the HMG-CoA reductase.103
Variants included a NADH-preferring version from Delftia acidovorans and NADPH-preferring
version from Staphylococcus aureus. As NADPH is the major carrier of reducing equivalents in
photosynthetic cells, the Staphylococcus aureus HMG-CoA reductase variant was chosen to be
examined here first.48
Table 3. Mevalonate pathway genes used in this study
Pathway
Gene
symbol Gene name Source organism
Codon
optimised?
Reference
source
Upper
MVA
atoB Acetoacetyl-CoA thiolase Escherichia coli 6,103
HMGS
(EG13)
HMG-CoA synthase Saccharomyces cerevisiae
HMGR HMG-CoA reductase Staphylococcus aureus Yes
(E. coli)103
Lower
MVA
ERG12 Mevalonate kinase Saccharomyces cerevisiae 6
ERG8 Phosphomevalonate kinase Saccharomyces cerevisiae
MVD1 Mevalonate pyrophosphate
decarboxylase
Saccharomyces cerevisiae
idi Isopentenyl pyrophosphate
isomerase
Escherichia coli
ispA Farnesyl pyrophosphate
synthase
Escherichia coli
Farnesene FS α-Farnesene synthase Malus × domestica (apple) Yes
(E. coli)104
104
Suitability of these pathway components for enhancing isoprenoid production in S. elongatus
was assessed using relevant metabolites and cell growth rates. Each component block was
contained in an independent operon, under the control of a single promoter (Figure 2).

22
Figure 2. Heterologous operons for isoprenoid production
Genes were expressed in three separately controlled operons. The top MVA block (atoB-HMGS-HMGR) was under
the control of a PLAC promoter. The bottom MVA block (ERG12-ERG8-MVD1-idi-ispA) also used PLAC. The
farnesene synthase (FS) was under the control of a PLacUV5 promoter. Genes in each translational block contained
separate ribosome binding sites for independent translation, indicated by ® marks. Species of origin for genes are
listed in Table 3.
Functionality of the upper and lower MVA operons were assessed both independently and
together. Functionality of the farnesene synthase was assessed only independently in this work.
The upper pathway and farnesene synthase were assessed by end product formation (mevalonate
and α-farnesene, respectively.) The lower pathway was assessed by supplying mevalonate to the
culture medium.
While efficient substrate uptake is common for heterotrophic species, obligate
photoautotrophs can have significantly impaired abilities to make use of fed substrates. The
opposite has also been shown to occur, where synthesised small molecules remain trapped in the
production host. This behaviour is linked to the loss of metabolite transporter proteins not
required by photosynthetic hosts.48
Effects of the complete MVA pathway were examined by looking at changes to endogenous
metabolism. Of particular relevance for this are the tetraterpene carotenoids, which are required
for photosynthetic light capture and reduction of oxidative damage. Chlorophyll a (with its
phytol {a diterpene} derived side chain,) is similarly relevant. Environmental and physiological
studies also often use chlorophyll a as an additional indicator of differences in biomass.
Carotenoid levels have been demonstrated to be flexible and are typically varied by the cell
to deal with changes to environmental conditions, particularly light stress. In S. elongatus, the
major carotenoid species are β-carotene, zeaxanthin, and echinenone.105 β-carotene is the major
23
species under typical laboratory conditions.106 In this work I examine whether increased
isoprenoid flux results in changes to this major isoprenoid species in S. elongatus. In parallel,
changes to chlorophyll a content are monitored. In all instances, growth rates are recorded to
assess the metabolic burden to the cell when expressing the transgenes.
All operons tested were under the control of common chemically inducible lac promoters.
The upper and lower MVA operons used PLAC promoters. PLacUV5 was used for the farnesene
synthase. The lac repressor enzyme was expressed in parallel to the experimental genes, under
the control of its own promoter. Lac promoters have had varying levels of efficacy in different
cyanobacterial systems. In S. elongatus, they have seen limited, but effective use.40,48,107–111
Strains and media
Escherichia coli
Escherichia coli (E. coli) strain DH5α was used for the construction and maintenance of
plasmids and, assaying of α-farnesene production. For general use, E. coli was grown in pre-
sterilized Miller lysogeny broth (LB) at 37°C. For selection of E. coli on solid media, LB was
mixed with 1.5% (w/v) agar. Where appropriate, antibiotics were added at the following final
concentrations: ampicillin 100µg/mL, spectinomycin 50µg/mL, chloramphenicol 35µg/mL, and
kanamycin 50µg/mL. For long-term storage, transformed strains were frozen at -80°C in either
7.5% dimethyl sulfoxide (DMSO) or 25% glycerol. Growth conditions for assaying of α-
farnesene production were modified as listed in the GC-MS analysis section below. Culture
absorbance measurements were taken in microcentrifuge tubes with a Varian Cary 50 Bio UV-
Vis probe spectrophotometer.
Synechococcus elongatus PCC 7942
Synechococcus elongatus PCC 7942 (S. elongatus) (formerly Anacystis nidulans R2) was the
cyanobacterial species used. S. elongatus was grown in blue-green medium #11 (BG-11)
supplemented with 20mM HEPES/NaOH pH 8.1 at 34°C.112 For solid media, BG-11 was mixed
with 1.5% (w/v) agar. Active liquid cultures were grown under 50μmol∙m-2s-1 of light and 60%
humidity. Agar plates were also incubated under 50μmol∙m-2s-1 of light, except during the initial

24
stage of transformations. Light included in this measure was only photosynthetically active
radiation (PAR) between 400 and 700nm. Light output was verified periodically with an LI-190
quantum sensor and LI-250A light meter from LI-COR Biosciences. The source used for light
production was Sylvania GRO-LUX F20T12 A/WS fluorescent lamps. Non-commercial
incubators used are shown in Supplementary Figure 1. For long-term storage, transformed
strains were frozen at -80°C in either 7.5% dimethyl sulfoxide (DMSO) or 25% glycerol. Culture
absorbance measurements were taken in microcentrifuge tubes with a Varian Cary 50 Bio UV-
Vis probe spectrophotometer.
DNA handling
Oligonucleotides, synthetic double stranded fragments, laboratory DNA preparation
All oligonucleotides for PCR were purchased from Integrated DNA Technologies with
'standard desalting' as the only purification step. Lyophilised oligonucleotides were suspended in
sterile double distilled water to a storage concentration of 100µM and stored at -20°C when not
in use. Synthetic double stranded DNA fragments ("gBlocks Gene Fragments"), also purchased
from Integrated DNA Technologies, were suspended from their lyophilised state and stored
according to manufacturer instructions.
Enzymatic procedures, including restriction digestion and phosphorylation, were carried out
as specified by the manufacturer. Analytical and preparative gel electrophoresis were typically
carried out with 0.8% (w/v) agarose gels and standard TAE buffer, under appropriate voltage,
followed by ethidium bromide based visualisation.113
Extraction of DNA from analytical/preparative agarose gels and clean up of enzymatic
reactions were performed using spin column based kits according to manufacturer instructions
(Thermo Scientific GeneJET and Qiagen). Plasmid DNA was prepared from E. coli cultures
using spin column based 'miniprep' kits according to manufacturer instructions (Thermo
Scientific GeneJET and Qiagen).
Preparation of genomic DNA from S. elongatus was performed using a phenol-chloroform
based extraction.46 Up to 50mL of culture was harvested by centrifugation and then suspended in

25
500µl 50mM Tris–HCl (pH 8.0) with 10mM EDTA, 100ul 0.6-mm-diameter glass beads, 25µL
10% sodium dodecyl sulfate, and 500uL of phenol-chloroform (1:1, v/v). Cells were then
disrupted by bead homogeniser with three 2min cycles at 3000rpm, with 2min rests between
cycles. The aqueous phase was separated out by centrifugation three times, with a new, equal
volume of chloroform being mixed in prior to centrifugation. Genomic DNA was then
precipitated with 1/10 volume 3M sodium acetate (pH 5.2) and 2.5 volumes anhydrous ethanol (-
20°C) overnight. The precipitated DNA was then washed with 70% ethanol (-20°C), dried, and
finally suspended in nuclease free water.
PCR for DNA part generation
High fidelity PCR for DNA part generation was carried out using Phusion High-Fidelity
DNA Polymerase from Thermo Scientific or New England Biolabs. Fifty µl reactions were set
up according to manufacturer instructions, including the addition of optional reaction
components (1x HF buffer, 200µM dNTP mix, 0.5µM forward primer, 0.5µM reverse primer,
1ng DNA template {200ng if genomic}, 3% DMSO, 1U polymerase, nuclease free water).
Standard cycling conditions were employed (typical conditions: 98°C 30sec, 30 cycles:{98°C
5sec, Primer annealing temperature +3°C 20sec, 72°C 15sec}, 72°C 5min).
PCR for screening
PCR based screening of cultures or colonies was done with ChoiceTaq DNA Polymerase
(Denville Scientific). Primers used are listed in Supplementary Table 1. Fifty µl reactions were
set up on ice according to manufacturer instructions (1x reaction buffer, 200µM dNTP mix,
0.5µM forward primer, 0.5µM reverse primer, cell mass as template {quantity as appropriate},
2.5U polymerase, nuclease free water). When cells in liquid culture were required as the
template, an aliquot of the culture was pelleted by centrifugation, washed with ddH20, and
pelleted again. Standard cycling conditions were employed (94°C 2min, 30 cycles:{94°C 45sec,
60°C 30sec, 72°C 1-2min}, 72°C 10min).
26
Strain engineering
Plasmids and strains
Plasmids and strains used in this study are listed in Table 4. S. elongatus transformants were
generated by tri-parental mating as described in the following section. Natural transformation
was also used, but found to be typically unreliable. E. coli transformants used to generate or
maintain plasmids were generated using chemically competent cells.114 Plasmids made in this
study were generated by directional restriction cloning and non-directional restriction cloning,
unless otherwise indicated. DNA parts used in assemblies were generated from existing
plasmids, PCR products (including multi-template SOEing115 products), and synthetic DNA
fragments. Experimental plasmids were constructed with backbones derived from integrative
shuttle vectors (pAM1573, pAM1579) from Susan Golden's laboratory at UC San Diego,
modified versions of these vectors (pHN1_lacUV5) from Pamela Silver's laboratory at Harvard
Medical School and, GeneArt's pSyn series shuttle vectors.48,116,117 Knockout vectors were
generated with backbone components from pTrc99a.118
Tri-parental mating for transformation of S. elongatus
Mating agar plates were prepared in 50mm diameter petri dishes with BG-11 agar
supplemented with 5% (v/v) LB broth. Mating agar plates were then overlaid with sterile
nitrocellulose disks. Alternatively, 250mm square plates can be used with multiple nitrocellulose
disks per plate. One ml of S. elongatus culture (Abs750nm ≈ 1) was mixed with 100µl of an
overnight culture of E. coli transformed with pRL443 and 100µls of an overnight culture of E.
coli transformed with the S. elongatus shuttle vector of interest. Three plates were used for each
transformation mixture: 10µl, 100µl, and the remainder of the mixture concentrated by
centrifugation were spread on the nitrocellulose disks in the mating agar plates. The plates were
then transferred to an incubator for 24-48 hours, cell side up, at a reduced (30μmol∙m-2s-1) light
intensity. Reduced light intensity was achieved with cheesecloth or similar material. The
nitrocellulose disk was then transferred with sterile tweezers to a new petri dish with BG-11 agar
supplemented with the appropriate antibiotic. The selective plates were transferred to an
incubator, cell side up, with full light intensity. False positives die under the selective conditions,

27
leaving behind putative transformant colonies. Colonies were then picking into 24-well plates
containing selective BG-11 and grown under standard conditions. Antibiotic concentrations used
for solid media: spectinomycin 20µg/ml, chloramphenicol 25µg/ml, and kanamycin 15µg/ml.
Antibiotic concentrations for maintenance of liquid cultures were as follows: spectinomycin
10µg/ml, chloramphenicol 10µg/ml, and kanamycin 10µg/ml. Concentrations were varied from
those listed when multiple selection markers were present in a strain.
Natural transformation of S. elongatus
The following protocol is as described in the literature and updated from personal
communications. 96,119,120 Synechococcus elongatus PCC 7942 is grown to an Abs750nm of 0.7.
Approximately 15ml of culture is harvested by centrifugation for 10 minutes at 6000×g. The
pellet is suspended in 1.5ml of sterile 10mM sodium chloride, transferred to a microcentrifuge
tube, and harvested by centrifugation for 10 minutes at 6000×g. The pellet is then re-suspended
in 300µl of BG-11. Fifty ng - 2µg of the DNA for transformation is added to the concentrated
culture. Tubes are wrapped in aluminum foil and incubated shaking overnight at 30°C. Tubes are
transferred to a shaking light incubator for four hours. Cells are spread (30µl and 270µl) onto
pre-warmed BG-11 Nobel agar plates containing the appropriate antibiotic. Plates are incubated
until colonies appear (1 to 2 weeks.)

28
Table 4. Plasmids and strains in this study
Plasmid Description (S. elongatus integration cassette contents) Reference
pSyn_2/Control Synechococcus-E. coli NS1 shuttle vector, 2012 version, SpR (NS1a-SpR-NS1b)
GeneArt (ThermoFisher)
pAM1573 Synechococcus-E. coli NS2 shuttle vector, AmpR and CmR
(NS2a-CmR-NS2b)
116
pHN1_lacUV5 Synechococcus-E. coli NS3 shuttle vector, CmR
(NS3a-PLacUV5-CmR-lacI-NS3b)
48
pTrc99a Contains lacIq cassette, AmpR 118
pMTSa Contains top MVA pathway operon: PLACMTSa, CmR 103
pMBIS Contains bottom MVA pathway operon: PLACMBIS, TetR 6
pRL443 Conjugal plasmid for tri-parental mating, AmpR TetR KmR 121
pZW-(NS1:MevTSa)
pSyn2_control-version1.0_2012 derivative (NS1a-SpR-PLACMTSa-rrnB-NS1b)
This study
pZW-(NS2:MCSe) pAM1573 derivative, enhanced multiple cloning site
(NS2a-MCSe-rrnB-CmR-NS2b)
This study
pZW-(NS2:lacIq) pAM1573 shuttle vector derivative
(NS2a-lacIq-rrnB-CmR-NS2b)
This study
pZW-(NS2:lacIq.MBIS) Synechococcus-E. coli NS2 shuttle vector, AmpR and CmR
(NS2a- lacIq-PLACMBIS-rrnB-CmR-NS2b)
This study
pZW-psbA2aFS pUC57_simple derivative, PpsbA2-FS-TBBa_B1002 , AmpR
Synthesized by GenScript
104,122 & this study
pZW-(NS3:lacI.FS) pHN1_lacUV5 derivative
(NS3a- PLacUV5FS-CmR-lacI-NS3b)
This study
pZW-(2069-71:KmR) Knockout plasmid for Synechococcus, pTrc99a derivative, KmR (2069frag-KmR-2071frag) for targeted knockout of Synpcc7942_2069, 2070, 2071 genes
99 & this study
Strain
Description Reference
Escherichia coli DH5α fhuA2 Δ(argF-lacZ)U169 phoA glnV44 Φ80 Δ(lacZ)M15 gyrA96 recA1 relA1 endA1 thi-1 hsdR17 ThermoFisher
Synechococcus elongatus PCC 7942
(Anacystis nidulans R2)
Wild type 123
ZW-(NS1:MevTSa-NS2:lacIq) S. elongatus strain, (NS1a-SpR-PLACMTSa-rrnB-NS1b ; NS2a-lacIq-rrnB-CmR-NS2b) This study
ZW-(NS2:lacIq) S. elongatus strain, (NS2a-lacIq-rrnB-CmR-NS2b) This study
ZW-(NS2:lacIq.MBIS) S. elongatus strain, (NS2a- lacIq-PLACMBIS-rrnB-CmR-NS2b) This study
ZW-(NS1:MevTSa-NS2:lacIq.MBIS) S. elongatus strain, (NS1a-SpR-PLACMTSa-rrnB-NS1b ; NS2a- lacIq-PLACMBIS-rrnB-CmR-NS2b) This study
ZW-(2069-71:KmR) S. elongatus strain; Knockout of Synpcc7942_2069 (partial), 2070 (full), 2071 (partial); KmR Δ(2144977-2147246):KmR
99 & this study
Abbreviations: SpR - spectinomycin resistance cassette, AmpR - ampicillin resistance cassette, CmR - chloramphenicol resistance cassette, TetR - tetracycline resistance cassette,
KmR - kanamycin resistance cassette, NS# - S. elongatus neutral integration site (genomic homology region), lacI/lacIq - lac repressor
Note 1: Current pSyn plasmids (version 2.0, 2013 release) offered by GeneArt differ from their original release (version 1.0, 2012 release.)
Note 2: The previously unavailable sequence for HMGR-Sa from pMTSa provided in Appendix: 'Codon optimised HMGR-Sa sequence'.
28

29
Analytical methods
GC-MS analysis
Mevalonate was analysed by conversion to mevalonolactone. Five hundred and sixty µl of
culture was added to 140µl of 500mM hydrochloric acid and vortexed. Seven hundred µl of ethyl
acetate was added to the mixture, followed by vortexing immediately for 5 minutes. The ethyl
acetate phase was then transferred to an autosampler vial for analysis. Gas chromatography
analysis was carried out with an Agilent 6890N gas chromatograph, 7683B injector, 5975C mass
spectrometer, and Agilent DB-5MS (25m×0.2mm, 0.33µm film thickness) column. Oven
program was as follows: Initial 60°C for 2 minutes, increased to 125°C at 60°C/minute,
increased to 140°C at 5°C/minute, increased to 300°C at 80°C/minute, and hold at 300°C for 3
minutes. Samples were injected in 2µl volumes in pulsed-splitless mode. The injection inlet was
maintained at 200°C. Hydrogen carrier gas was used, maintaining a purge flow of 60ml/minute
and flow of 20ml/minute. Samples exiting the oven passed through a 240°C MSD transfer line,
and onto the MS source at 230°C, MS quad at 150°C. Data was recorded at the detector
following a 3.7 minute solvent delay, with m/z 43, 58, and 71 monitored as representative ion
masses. Standard curves for DL-mevalonolactone were prepared as shown in Figure 3A-B.
Mevalonate feeding was carried out with DL-mevalonate converted from 1 volume 2M DL-
mevalonolactone with 1.02 volumes 2M KOH.6
Strains containing genes for farnesene synthesis were grown as 5ml cultures in 2YT medium
with a 1ml decane overlay at 34°C. Volumes for analysis were taken directly from the decane
overlay. Gas chromatography analysis was carried out with an Agilent 6890N gas
chromatograph, 7683B injector, 5975C mass spectrometer, and Agilent DB-5MS column. Oven
temperatures were as follows: 60°C for 2 minutes, increased to 160°C at 50°C/minute, increased
to 170°C at 3°C/minute, increased to 300°C at 50°C/minute, 300°C for 3 minutes. Two µl of
samples were injected with an inlet temperature of 250°C, purge flow 60ml/minute, flow
20ml/minute, pulsed-splitless mode injection, hydrogen carrier gas, 240°C MSD transfer line,
230°C MS source, 150°C MS quad, and 3.7 minute detector solvent delay. Representative ion
masses monitored were 105, 161, 204 m/z. A standard curve for farnesene was prepared using an
isomeric mixture as shown in Figure 3D-E.
30
Chlorophyll quantification
One ml aliquots of culture were taken and centrifuged to pellet in amber microcentrifuge
tubes. The supernatant was discarded and 1ml of 100% methanol was added. Tubes were then
vortexed for 10 minutes in the dark for pigment extraction. Cultures were again pelleted to
remove cell debris. Chlorophyll determination was carried out by absorbance recordings at
663nm in a 1cm cuvette.43,124
HPLC analysis of carotenoids
Sample extraction was carried out in the same manner as for chlorophyll quantification.
Methanol extracts were transferred to amber autosampler vials for analysis. Carotenoids were
separated by HPLC on a Agilent Zorbax Eclipse XDB-C18 column (3.5µm, 150×4.6mm) using a
15 minute gradient of ethyl acetate (0-100%) in an acetonitrile-water-triethylamine solution
(9:1:0.01, vol:vol:vol) at 1.5ml/minute.43 β-carotene was identified by its typical retention time
and appropriate analytical standard. A standard curve for β-carotene was prepared as shown in
Figure 3C.

31
Figure 3. Standard curves used for quantitative analysis of metabolites
(A) DL-Mevalonolactone standard curve for GC-MS analysis using selected ion monitoring data. (B) DL-
Mevalonolactone standard curve for GC-MS analysis using total ion count data. (C) β-carotene standard curve for
HPLC analysis. (D) Farnesene (isomeric mixture) standard curve for GC-MS analysis using total ion count data. (E)
GC chromatogram of farnesene (isomeric mixture) used to generate the standard curve shown in D. Insert shows
magnified section of chromatogram, with arrows indicating major farnesene isomer peaks.
(A) Eq. 1: Mevalonolactone 1 standard curve fit
𝑦 = (0.0002𝑥 + 4.47416) × 0.118 × (6 0.7⁄ ) ; 𝑅2 = 0.9996
(B) Eq. 2: Mevalonolactone 2 standard curve fit
𝑦 = (0.0002𝑥 + 17.726) × 0.118 ; 𝑅2 = 0.9859 (C) Eq. 3: β-carotene standard curve fit
𝑦 = (0.0002𝑥 + 1.491) ; 𝑅2 = 0.9884 (D) Eq. 4: Farnesene isomers standard curve fit
𝑦 = (0.0002𝑥 + 8.2254) ; 𝑅2 = 0.9916
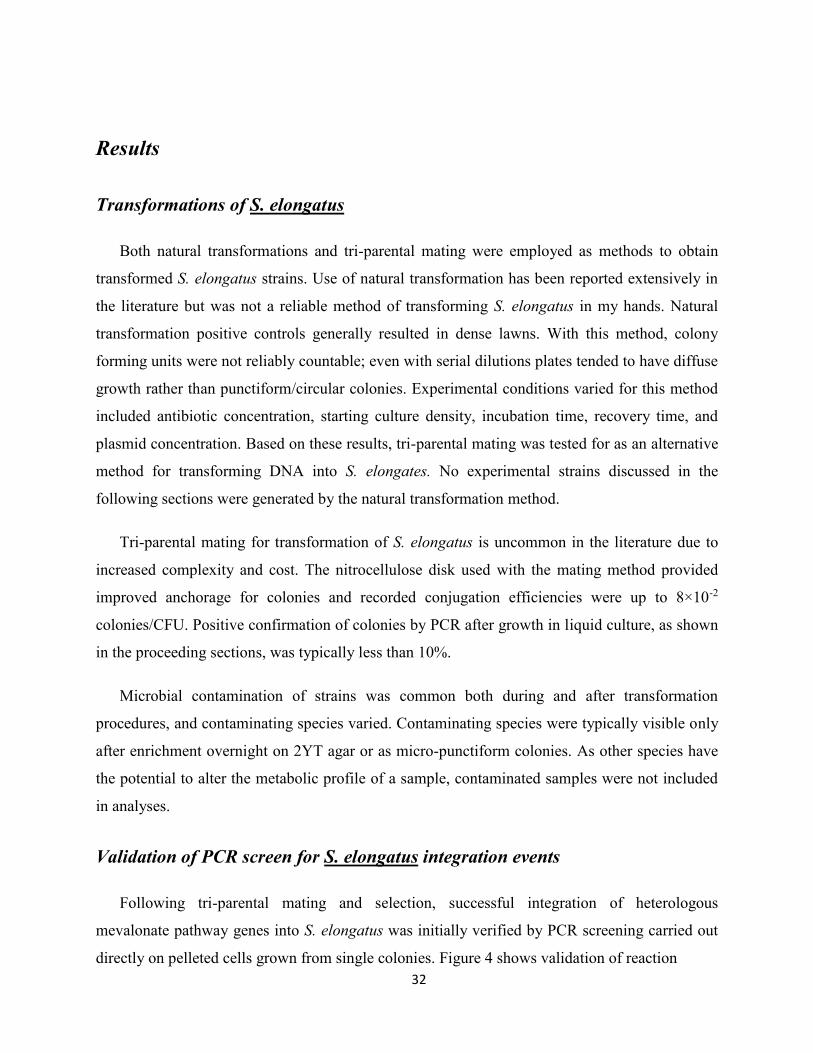
32
Results
Transformations of S. elongatus
Both natural transformations and tri-parental mating were employed as methods to obtain
transformed S. elongatus strains. Use of natural transformation has been reported extensively in
the literature but was not a reliable method of transforming S. elongatus in my hands. Natural
transformation positive controls generally resulted in dense lawns. With this method, colony
forming units were not reliably countable; even with serial dilutions plates tended to have diffuse
growth rather than punctiform/circular colonies. Experimental conditions varied for this method
included antibiotic concentration, starting culture density, incubation time, recovery time, and
plasmid concentration. Based on these results, tri-parental mating was tested for as an alternative
method for transforming DNA into S. elongates. No experimental strains discussed in the
following sections were generated by the natural transformation method.
Tri-parental mating for transformation of S. elongatus is uncommon in the literature due to
increased complexity and cost. The nitrocellulose disk used with the mating method provided
improved anchorage for colonies and recorded conjugation efficiencies were up to 8×10⁻²
colonies/CFU. Positive confirmation of colonies by PCR after growth in liquid culture, as shown
in the proceeding sections, was typically less than 10%.
Microbial contamination of strains was common both during and after transformation
procedures, and contaminating species varied. Contaminating species were typically visible only
after enrichment overnight on 2YT agar or as micro-punctiform colonies. As other species have
the potential to alter the metabolic profile of a sample, contaminated samples were not included
in analyses.
Validation of PCR screen for S. elongatus integration events
Following tri-parental mating and selection, successful integration of heterologous
mevalonate pathway genes into S. elongatus was initially verified by PCR screening carried out
directly on pelleted cells grown from single colonies. Figure 4 shows validation of reaction
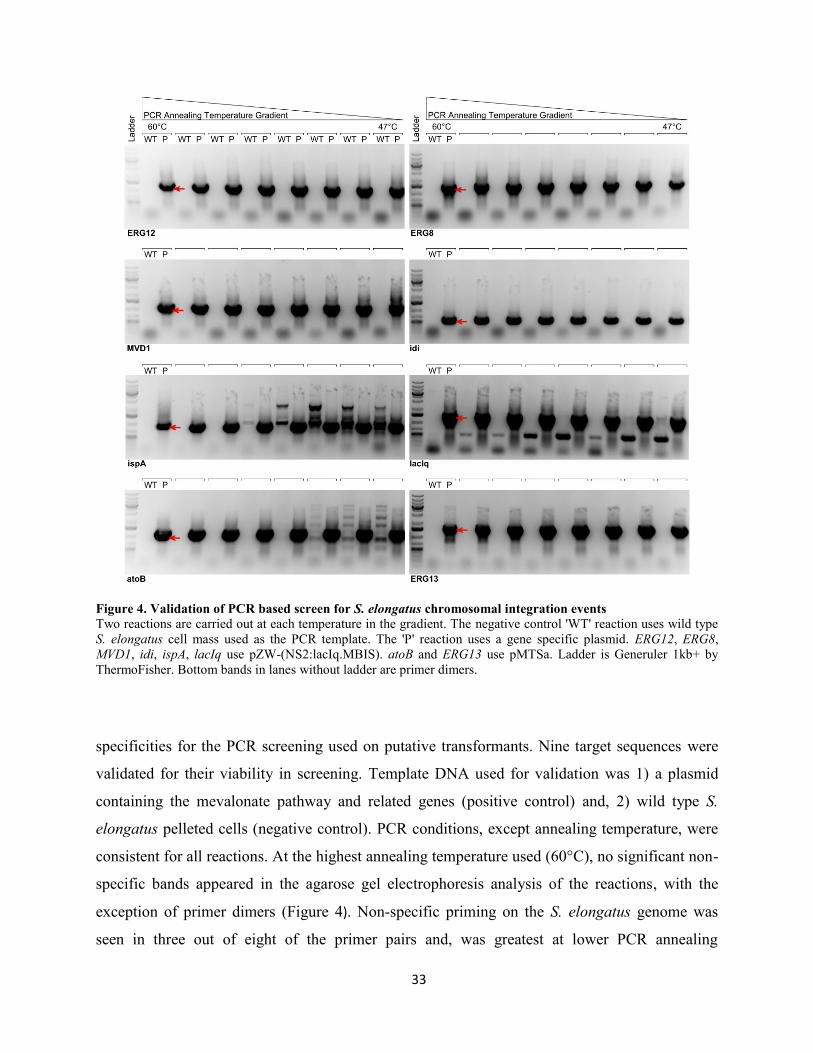
33
Figure 4. Validation of PCR based screen for S. elongatus chromosomal integration events
Two reactions are carried out at each temperature in the gradient. The negative control 'WT' reaction uses wild type
S. elongatus cell mass used as the PCR template. The 'P' reaction uses a gene specific plasmid. ERG12, ERG8,
MVD1, idi, ispA, lacIq use pZW-(NS2:lacIq.MBIS). atoB and ERG13 use pMTSa. Ladder is Generuler 1kb+ by
ThermoFisher. Bottom bands in lanes without ladder are primer dimers.
specificities for the PCR screening used on putative transformants. Nine target sequences were
validated for their viability in screening. Template DNA used for validation was 1) a plasmid
containing the mevalonate pathway and related genes (positive control) and, 2) wild type S.
elongatus pelleted cells (negative control). PCR conditions, except annealing temperature, were
consistent for all reactions. At the highest annealing temperature used (60°C), no significant non-
specific bands appeared in the agarose gel electrophoresis analysis of the reactions, with the
exception of primer dimers (Figure 4). Non-specific priming on the S. elongatus genome was
seen in three out of eight of the primer pairs and, was greatest at lower PCR annealing
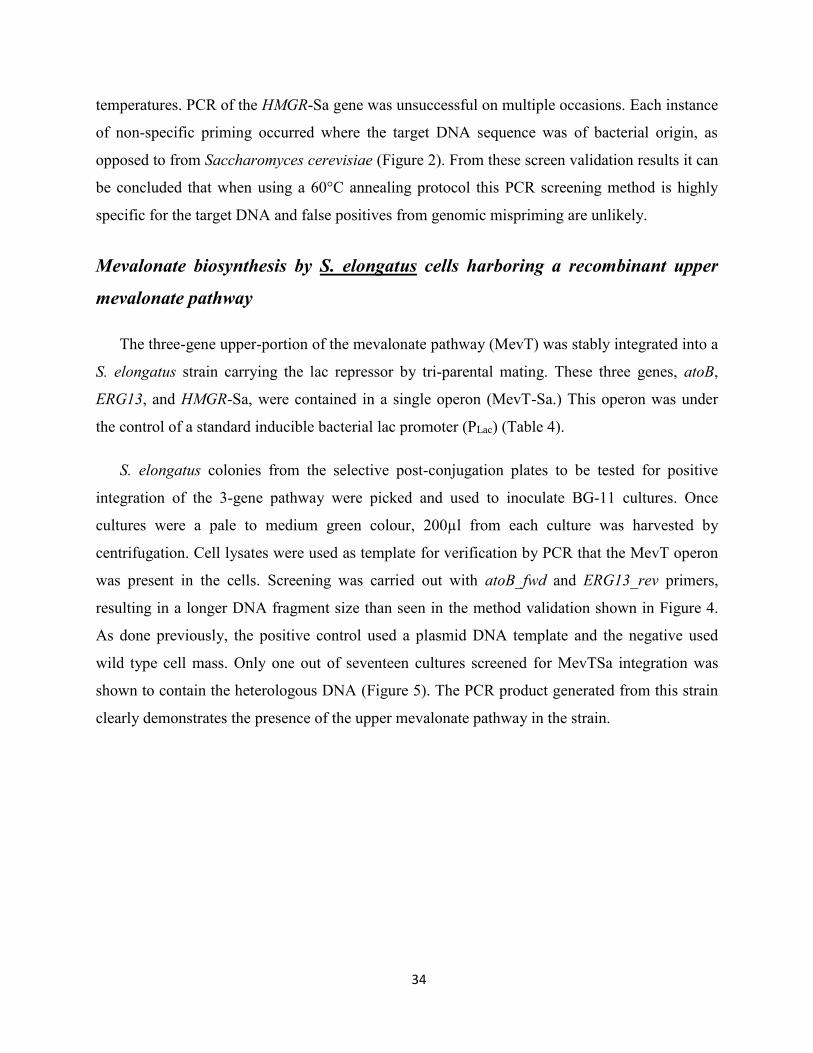
34
temperatures. PCR of the HMGR-Sa gene was unsuccessful on multiple occasions. Each instance
of non-specific priming occurred where the target DNA sequence was of bacterial origin, as
opposed to from Saccharomyces cerevisiae (Figure 2). From these screen validation results it can
be concluded that when using a 60°C annealing protocol this PCR screening method is highly
specific for the target DNA and false positives from genomic mispriming are unlikely.
Mevalonate biosynthesis by S. elongatus cells harboring a recombinant upper
mevalonate pathway
The three-gene upper-portion of the mevalonate pathway (MevT) was stably integrated into a
S. elongatus strain carrying the lac repressor by tri-parental mating. These three genes, atoB,
ERG13, and HMGR-Sa, were contained in a single operon (MevT-Sa.) This operon was under
the control of a standard inducible bacterial lac promoter (PLac) (Table 4).
S. elongatus colonies from the selective post-conjugation plates to be tested for positive
integration of the 3-gene pathway were picked and used to inoculate BG-11 cultures. Once
cultures were a pale to medium green colour, 200µl from each culture was harvested by
centrifugation. Cell lysates were used as template for verification by PCR that the MevT operon
was present in the cells. Screening was carried out with atoB_fwd and ERG13_rev primers,
resulting in a longer DNA fragment size than seen in the method validation shown in Figure 4.
As done previously, the positive control used a plasmid DNA template and the negative used
wild type cell mass. Only one out of seventeen cultures screened for MevTSa integration was
shown to contain the heterologous DNA (Figure 5). The PCR product generated from this strain
clearly demonstrates the presence of the upper mevalonate pathway in the strain.
35
Figure 5. Verification of upper MVA pathway integration by PCR.
Ladder is Generuler 1kb+ by ThermoFisher. 'S' denotes experimental S. elongatus strains. Sample S12 represents the
only successful integrant in this screen where the upper band matches expected atoB-ERG13 fragment size.
Negative control with wild type S. elongatus. Positive control with pMTSa plasmid. Bottom bands in lanes without
ladder are primer dimers.
To test for functionality of the chromosomally-integrated upper mevalonate pathway in the
engineered S. elongatus, cells were tested for the production of mevalonate. Four biological
replicate cultures of S. elongatus containing the MevT-Sa operon were grown under maintenance
conditions until log phase was reached after approximately four days. The four cultures were
then diluted to 0.1 Abs750nm (time 0 - t0) and split into two sets of flasks. IPTG was added to one
of the sets at t0 to induce MevT operon expression. Cultures were tested for contamination by
spot plating 10µl of each culture onto LB agar plates at each analysis time point. No
contamination was recorded in any of the samples during this time course. At the same time a
sample was taken for spot testing, additional samples were taken to monitor cell density and for
mevalonate analysis.
Similar growth rates were recorded for both induced and uninduced cultures, although the
statistical confidence interval (and standard deviation) for the absorbance measurements were
noted to increase substantially as the time course progressed (Figure 6A).
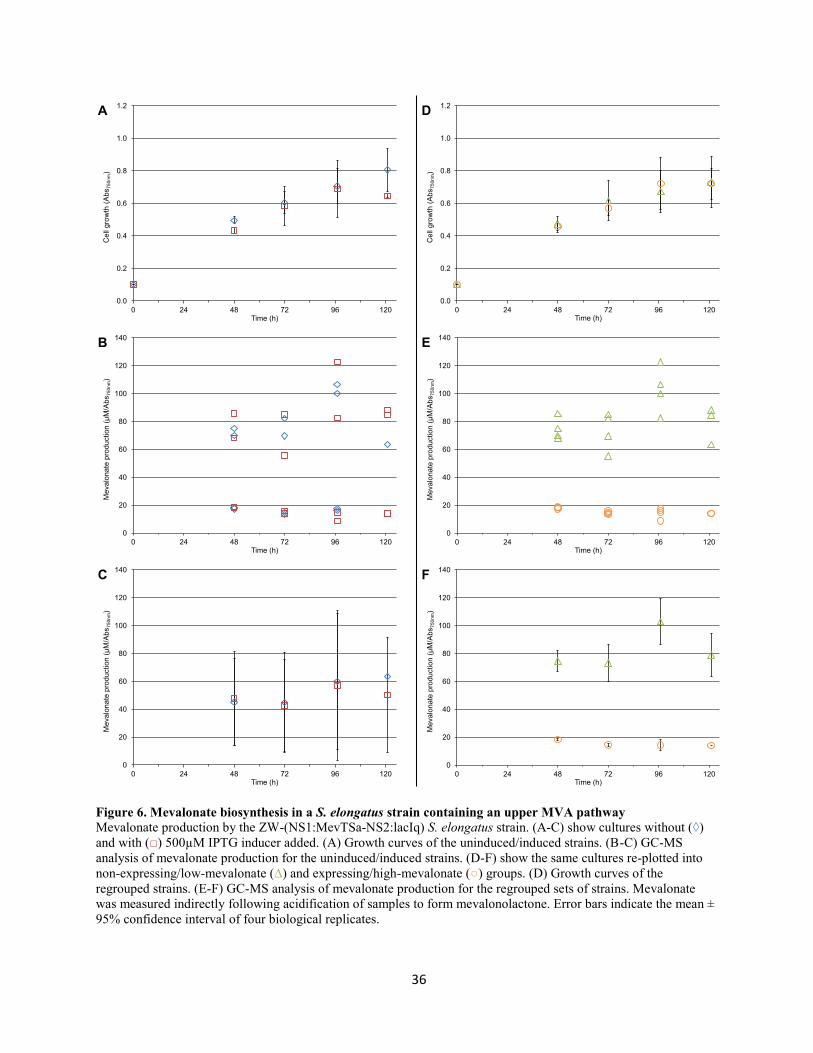
36
Figure 6. Mevalonate biosynthesis in a S. elongatus strain containing an upper MVA pathway
Mevalonate production by the ZW-(NS1:MevTSa-NS2:lacIq) S. elongatus strain. (A-C) show cultures without (◊)
and with (□) 500µM IPTG inducer added. (A) Growth curves of the uninduced/induced strains. (B-C) GC-MS
analysis of mevalonate production for the uninduced/induced strains. (D-F) show the same cultures re-plotted into
non-expressing/low-mevalonate (∆) and expressing/high-mevalonate (○) groups. (D) Growth curves of the
regrouped strains. (E-F) GC-MS analysis of mevalonate production for the regrouped sets of strains. Mevalonate
was measured indirectly following acidification of samples to form mevalonolactone. Error bars indicate the mean ±
95% confidence interval of four biological replicates.

37
Solvent extracted samples were analysed for mevalonate by GC-MS. Measured ion counts
were converted to molar concentrations based on a standard curve and then normalized to cell
density. Figure 6B shows the individual replicates for uninduced and induced cultures at each
time point. Averaging these replicates (Figure 6C) results in the 95% confidence interval being
approximately as large as the measurements themselves, suggesting no correlation between strain
induction and mevalonate production.
Figure 6E shows the same individual data points reorganized into low and high mevalonate
concentration samples. All previous data points were retained. These re-clustered data points are
shown averaged together in Figure 6F. Both low and high mevalonate categories are noted to
remain at approximately the same concentration, at a 95% confidence interval, between the
measured time period of 48-121 hours. When re-clustered in this way, growth rates (Figure 6D)
remain similar in appearance, with limited change in the mean growth rates and associated
confidence intervals.
Analysis of mevalonate content in these culture extracts demonstrates that 1) mevalonate
production under the control of PLac is independent of IPTG induction in this system and, 2) that
two distinct populations of mevalonate producing cells were present. One population produced
just under 20µM/Abs750nm, while the other was approximately four times higher at
80µM/Abs750nm (Figure 6E-F).
Mevalonate uptake and utilization by S. elongatus cells harbouring a lower
mevalonate pathway
Conjugation based integration of the five-gene lower half of the mevalonate pathway was
also screened for by PCR. Both pZW-(NS2:lacIq.MBIS) containing the lac repressor and the
lower MVA pathway and, pZW-(NS2:lacIq) containing only the lac repressor were transformed.
The PCR screening was performed directly on pelleted cell mass from liquid cultures of putative
transformants, as described in the previous section.
The lac repressor PCR product seen from both recombinant strains clearly shows the
presence of the gene in these strains (Figure 7). The presence of the ERG12 PCR product for the
lower mevalonate pathway demonstrates the presence of the operon in the NS2:lacIq.MBIS

38
Figure 7. Verification of lower MVA pathway integration by PCR.
Ladder is Generuler 1kb+ by ThermoFisher. 'S' denotes experimental S. elongatus strains. '1/10' denotes dilution of
cell culture template by factor of 10. Upper bands in S1/10 columns match expected product sizes. (lacIq used for lac
repressor screen; ERG12 used for lower MVA screen.) Negative control with wild type S. elongatus. Positive
control with corresponding pZW-(NS2:lacIq) and pZW-(NS2:lacIq.MBIS) plasmids. Genomic DNA can be seen
retained at the top of the agarose gel in S and S1/10 lanes. ' * ' denotes lane with failed positive control for lower
MVA pathway.
strain. Although previously validated (Figure 4), the positive control for the lower MVA
pathway PCR reaction failed (Figure 7).
Functional screening of the MBIS-harbouring recombinant strains was carried out by
measuring mevalonate utilization. Both NS2:lacIq and NS2:lacIq.MBIS strains were grown in
quadruplicate in the presence of IPTG and displayed growth rates with no significant differences
at the 95% confidence interval (Figure 8A). These similar growth rates suggest no apparent
metabolic burden in the strain caused by the lower MVA genes. Cultures were tested for
contamination by spot plating 10µl of each culture onto LB agar plates at each analysis time
point. No contamination was recorded in any of the samples during this time course. No change
in mevalonate concentration, which would point to a functional lower mevalonate pathway, is
seen in either the experimental NS2:lacIq.MBIS strain or NS2:lacIq control strain (Figure 8B).
This lack of utilization of mevalonate by the lower MVA strain suggests either pathway
inactivity or limited intracellular substrate availability.

39
Figure 8. Mevalonate feeding in S. elongatus harbouring a lower MVA pathway
Metabolism of fed mevalonate by the ZW-(NS2:lacIq.MBIS) S. elongatus strain (□) and the control ZW-(NS2:lacIq)
strain (◊). (A) Growth curves of the strains with supplemented mevalonate. (B) GC-MS analysis of the total
mevalonate present in the cultures over the recorded growth period. Mevalonate was measured indirectly following
acidification of samples to form mevalonolactone. Error bars indicate the mean ± 95% confidence interval of four
biological replicates.
Changes to host metabolism while harbouring a complete heterologous
mevalonate pathway
To test if limited intracellular substrate availability was responsible for the lack of
mevalonate utilization, the upper MevT-Sa operon-(NS1:MevTSa plasmid) was integrated into
NS2:lacIq.MBIS by tri-parental mating. Successful integration of both the upper and lower
mevalonate pathway operons into a single strain was once again screened by PCR following
selection and growth of putative transformants on the appropriate antibiotics (Figure 9). Two
correct transformants were recovered out of the thirty cultures screened. One of these
transformants shown in Figure 9, strain S7, was then chosen for functional screening. The
presence of PCR products for both the lower ('B' lane) and upper ('T' lane) clearly demonstrates
the presence of the complete heterologous pathway in the strain.
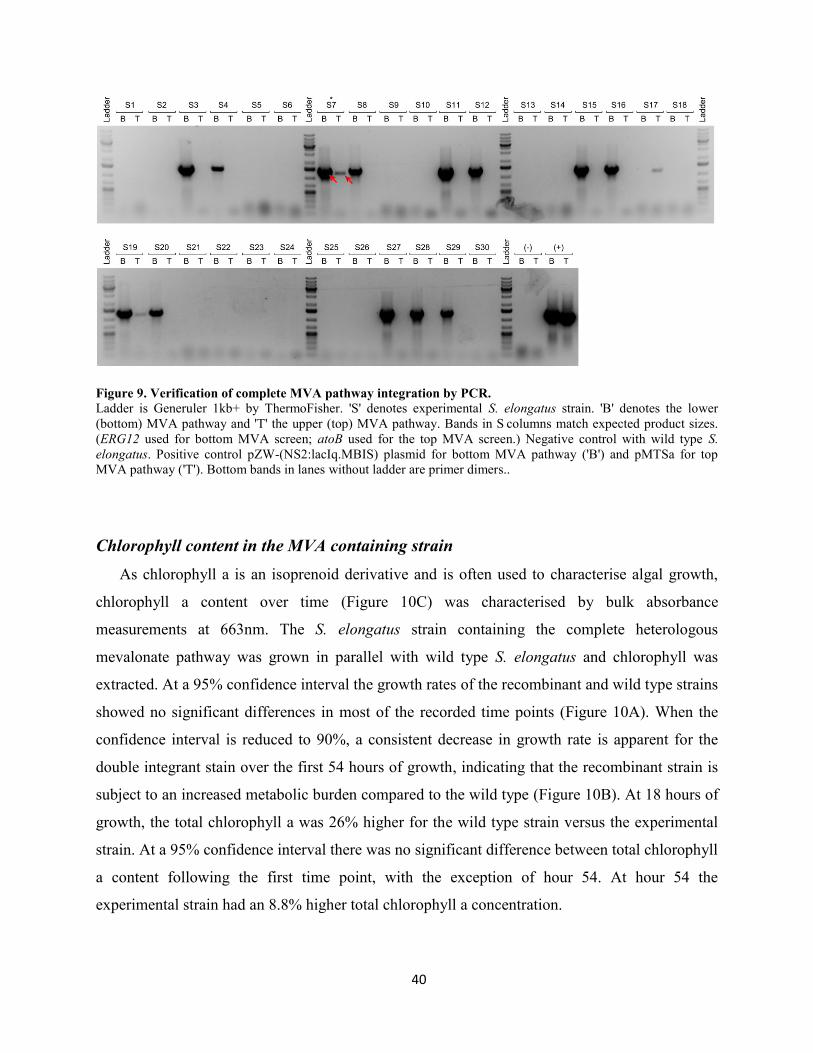
40
Figure 9. Verification of complete MVA pathway integration by PCR.
Ladder is Generuler 1kb+ by ThermoFisher. 'S' denotes experimental S. elongatus strain. 'B' denotes the lower
(bottom) MVA pathway and 'T' the upper (top) MVA pathway. Bands in S columns match expected product sizes.
(ERG12 used for bottom MVA screen; atoB used for the top MVA screen.) Negative control with wild type S.
elongatus. Positive control pZW-(NS2:lacIq.MBIS) plasmid for bottom MVA pathway ('B') and pMTSa for top
MVA pathway ('T'). Bottom bands in lanes without ladder are primer dimers..
Chlorophyll content in the MVA containing strain
As chlorophyll a is an isoprenoid derivative and is often used to characterise algal growth,
chlorophyll a content over time (Figure 10C) was characterised by bulk absorbance
measurements at 663nm. The S. elongatus strain containing the complete heterologous
mevalonate pathway was grown in parallel with wild type S. elongatus and chlorophyll was
extracted. At a 95% confidence interval the growth rates of the recombinant and wild type strains
showed no significant differences in most of the recorded time points (Figure 10A). When the
confidence interval is reduced to 90%, a consistent decrease in growth rate is apparent for the
double integrant stain over the first 54 hours of growth, indicating that the recombinant strain is
subject to an increased metabolic burden compared to the wild type (Figure 10B). At 18 hours of
growth, the total chlorophyll a was 26% higher for the wild type strain versus the experimental
strain. At a 95% confidence interval there was no significant difference between total chlorophyll
a content following the first time point, with the exception of hour 54. At hour 54 the
experimental strain had an 8.8% higher total chlorophyll a concentration.
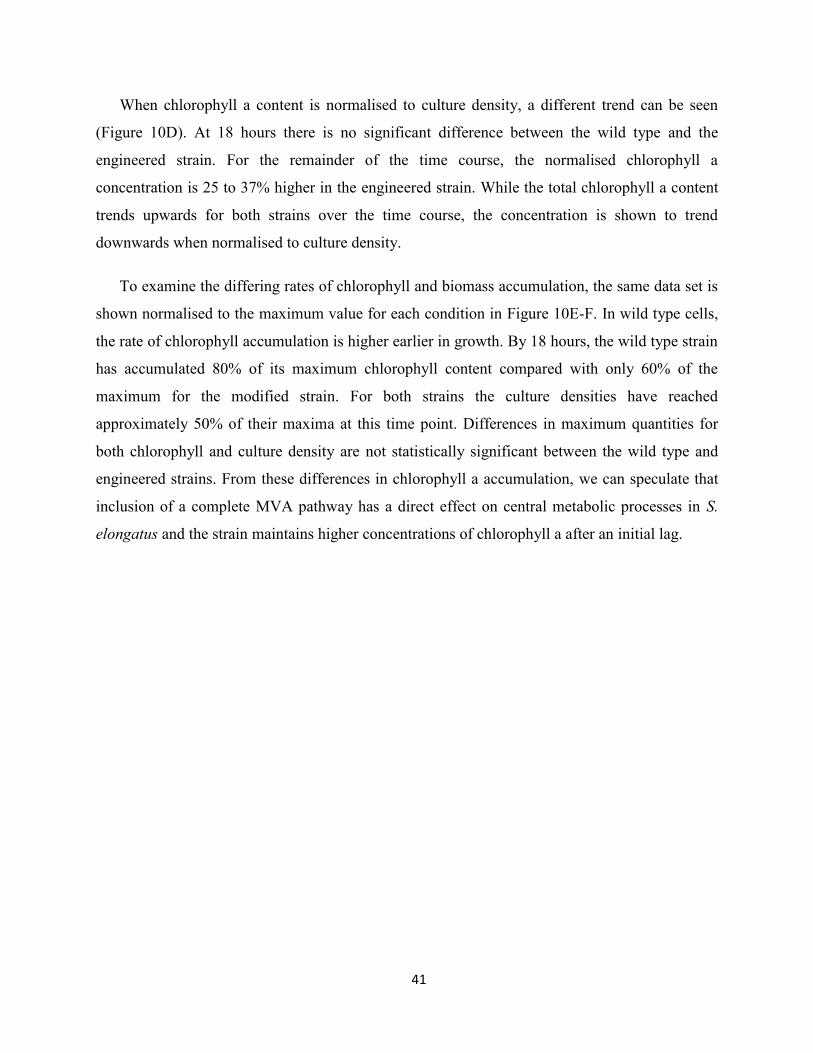
41
When chlorophyll a content is normalised to culture density, a different trend can be seen
(Figure 10D). At 18 hours there is no significant difference between the wild type and the
engineered strain. For the remainder of the time course, the normalised chlorophyll a
concentration is 25 to 37% higher in the engineered strain. While the total chlorophyll a content
trends upwards for both strains over the time course, the concentration is shown to trend
downwards when normalised to culture density.
To examine the differing rates of chlorophyll and biomass accumulation, the same data set is
shown normalised to the maximum value for each condition in Figure 10E-F. In wild type cells,
the rate of chlorophyll accumulation is higher earlier in growth. By 18 hours, the wild type strain
has accumulated 80% of its maximum chlorophyll content compared with only 60% of the
maximum for the modified strain. For both strains the culture densities have reached
approximately 50% of their maxima at this time point. Differences in maximum quantities for
both chlorophyll and culture density are not statistically significant between the wild type and
engineered strains. From these differences in chlorophyll a accumulation, we can speculate that
inclusion of a complete MVA pathway has a direct effect on central metabolic processes in S.
elongatus and the strain maintains higher concentrations of chlorophyll a after an initial lag.
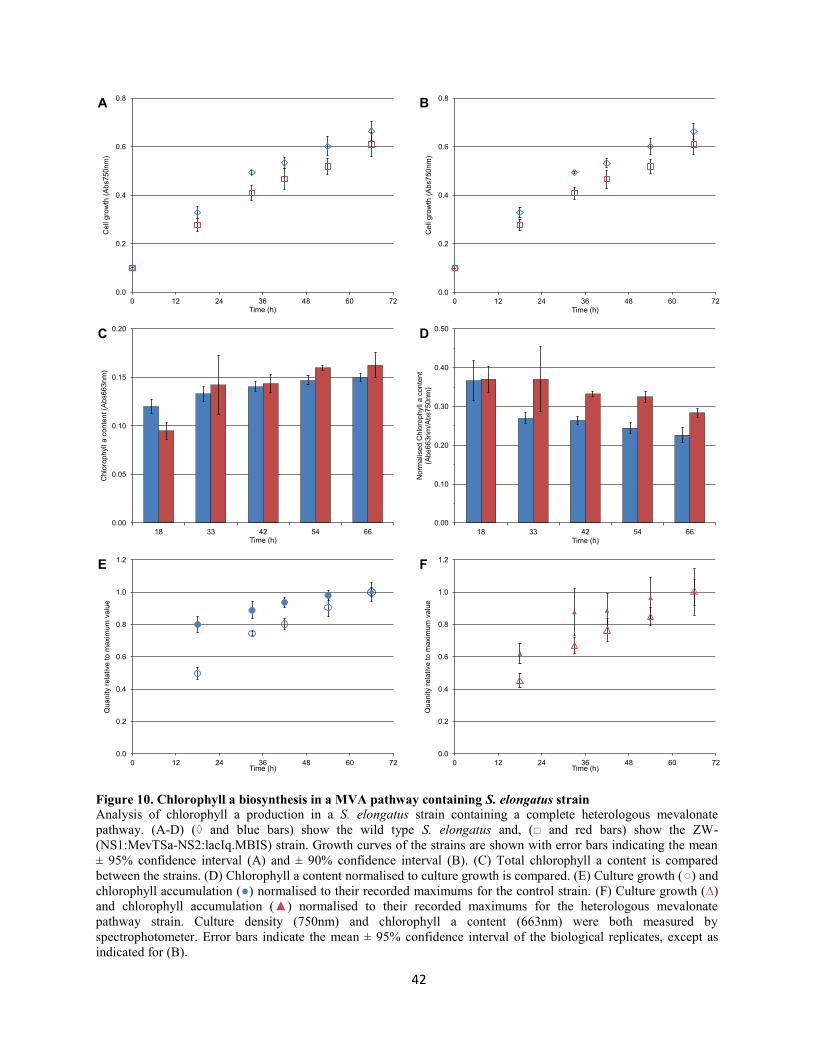
42
Figure 10. Chlorophyll a biosynthesis in a MVA pathway containing S. elongatus strain
Analysis of chlorophyll a production in a S. elongatus strain containing a complete heterologous mevalonate
pathway. (A-D) (◊ and blue bars) show the wild type S. elongatus and, (□ and red bars) show the ZW-
(NS1:MevTSa-NS2:lacIq.MBIS) strain. Growth curves of the strains are shown with error bars indicating the mean
± 95% confidence interval (A) and ± 90% confidence interval (B). (C) Total chlorophyll a content is compared
between the strains. (D) Chlorophyll a content normalised to culture growth is compared. (E) Culture growth (○) and
chlorophyll accumulation (●) normalised to their recorded maximums for the control strain. (F) Culture growth (∆)
and chlorophyll accumulation (▲) normalised to their recorded maximums for the heterologous mevalonate
pathway strain. Culture density (750nm) and chlorophyll a content (663nm) were both measured by
spectrophotometer. Error bars indicate the mean ± 95% confidence interval of the biological replicates, except as
indicated for (B).

43
β-Carotene content
The same cultures used for chlorophyll analysis were also analyzed by HPLC for changes to
β-carotene content as a general indicator of cellular isoprenoid production. The strain expressing
the heterologous mevalonate pathway showed no statistically significant trend in total β-carotene
levels compared to the wild type strain (Figure 11A). However, differences were apparent when
β-carotene content was normalised to culture density (Figure 11B). At a 95% confidence
interval, normalised β-carotene content is seen to be higher in the engineered strain up until hour
42. At a 90% confidence interval, all time points except at hour 54 show significantly higher
normalised β-carotene content. From this we can conclude that the recombinant strain maintains
Figure 11. β-carotene biosynthesis in a MVA pathway containing S. elongatus strain
Analysis of β-carotene production in a S. elongatus strain containing a complete heterologous mevalonate pathway.
(◊) show wild type S. elongatus and (□) show the ZW-(NS1:MevTSa-NS2:lacIq.MBIS) strain. β-carotene was
measured by HPLC. (A) Total β-carotene content in the cultures. (B) β-carotene content normalised to culture
growth. (C) The ratio of β-carotene to chlorophyll a shown normalised to the highest recorded ratio. Error bars
indicate the mean ± 95% confidence interval of 3 (◊) or (□) 5 biological replicates.

44
higher concentrations of the isoprenoid β-carotene even as concentrations drop during the
stationary growth phase.
In the wild type cells, the ratio of β-carotene to chlorophyll shows limited variation over the
time course (Figure 11C). This contrasts with the engineered strain where, a downward trend in
the β-carotene:chlorophyll ratio is apparent, similar to that seen in the β-carotene:Abs750nm
values. The ratio of β-carotene to chlorophyll shows a similar trend to that of β-carotene to
culture density. From these ratios we can conclude that β-carotene is a potential sink for
additional flux of isoprenoid precursors generated by the MVA pathway. This relationship is
considered further in the Discussion.
Biosynthesis of α-farnesene
For a direct measurement of increased isoprenoid flux in the engineered S. elongatus, an α-
farnesene synthase, previously codon optimised for E. coli by Wang et al., was synthesised and
expressed under the control of the native S. elongatus psbA2 diurnal promoter. To validate the
functionality of the encoded protein, the farnesene synthase was cloned into the pHN1_lacUV5
shuttle vector under the control of a lac promoter to form pZW-NS3:lacI.FS and transformed into
E. coli. The synthase is known to produce a single isomer of farnesene, however, I was unable to
obtain an analytical standard containing only α-farnesene and instead used an isomeric mix. As
the multiple isomers were resolved as separate peaks during GC-MS analysis, all peaks were
integrated and summed together to construct the standard curve (Figure 12A).
E. coli cultures harbouring the synthase-expressing plasmid were grown under selection at
37°C and diluted to a starting Abs600nm of 0.05 (Figure 12B). Cultures were then switched to
34°C to better approximate S. elongatus growth conditions and overlayed with decane to trap
produced farnesene. After approximately 9 hours, cultures reached an Abs600nm of 0.5 and one set
of the cultures had IPTG inducer added. Decane samples were taken at the time of induction as
well as at 12 and 24 hours post induction. At 12 and 24 hours post-induction, culture density in
the induced samples was noted to be higher. Farnesene was already detectable at the time of
induction and total extracted farnesene increased only slightly over the following 24 hours.
(Figure 12C-D). From these data from E. coli data, it was concluded that the synthase is
functional in its expression system.
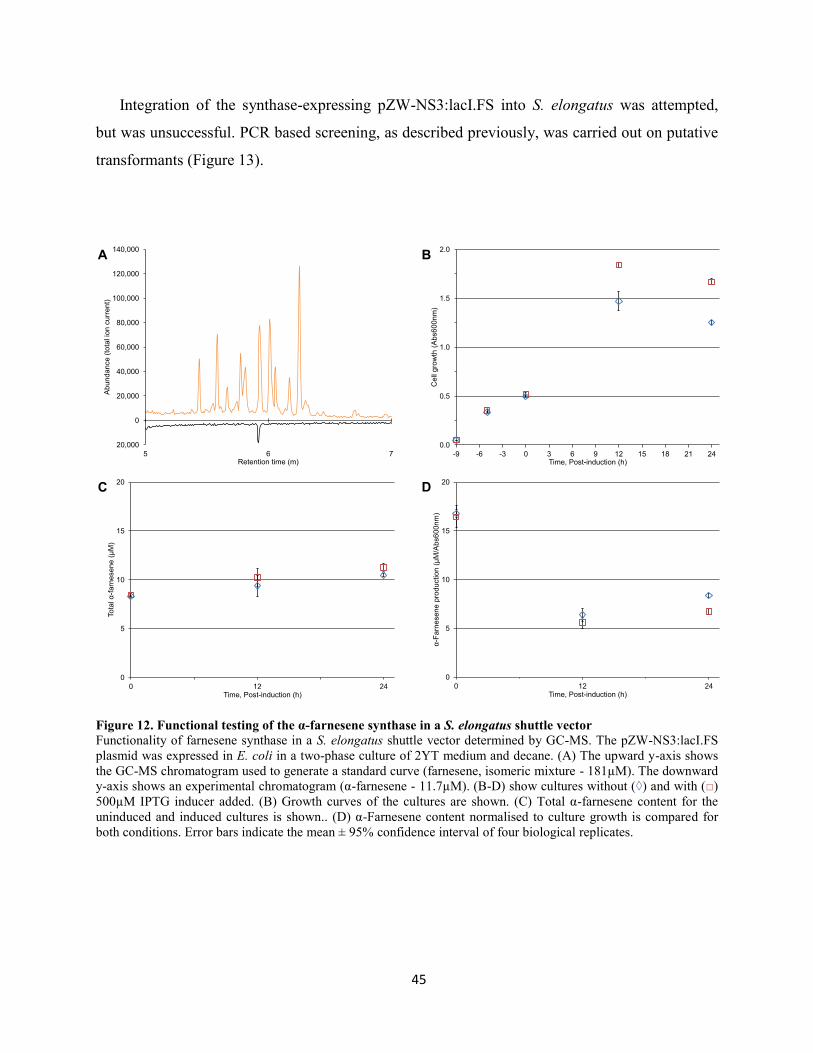
45
Integration of the synthase-expressing pZW-NS3:lacI.FS into S. elongatus was attempted,
but was unsuccessful. PCR based screening, as described previously, was carried out on putative
transformants (Figure 13).
Figure 12. Functional testing of the α-farnesene synthase in a S. elongatus shuttle vector
Functionality of farnesene synthase in a S. elongatus shuttle vector determined by GC-MS. The pZW-NS3:lacI.FS
plasmid was expressed in E. coli in a two-phase culture of 2YT medium and decane. (A) The upward y-axis shows
the GC-MS chromatogram used to generate a standard curve (farnesene, isomeric mixture - 181µM). The downward
y-axis shows an experimental chromatogram (α-farnesene - 11.7µM). (B-D) show cultures without (◊) and with (□)
500µM IPTG inducer added. (B) Growth curves of the cultures are shown. (C) Total α-farnesene content for the
uninduced and induced cultures is shown.. (D) α-Farnesene content normalised to culture growth is compared for
both conditions. Error bars indicate the mean ± 95% confidence interval of four biological replicates.

46
Figure 13. Screening for farnesene synthase integration by PCR.
Ladder is Generuler 1kb+ by ThermoFisher. 'S' denotes experimental S. elongatus strain. Positive control uses a
490bp segment (lower, higher intensity band) of the farnesene synthase from pZW-NS3:lacI.FS. Negative control
with wild type S. elongatus. Bottom bands in lanes without ladder are primer dimers.
Genetic knockout induced biofilm formation in S. elongatus
Optimal light harvesting in evanescent-field based photobioreactors requires a constant
monolayer of cyanobacteria along the waveguide surface. Use of a biofilm phenotype was
hypothesised to allow consistent light and nutrient availability to such a cell monolayer in this
type of photobioreactor. Currently, the only reported biofilm phenotype in S. elongatus was
reported by Schatz et al. in 2013. Their strain displayed a distinct biofilm phenotype, as well as a
loss of competence. The authors showed that a knockout of S. elongatus gene 2069 or gene 2071
was necessary and sufficient under normal conditions to generate the phenotype in wild type
cells (Figure 14A). Because of the competency loss, I constructed a knockout vector - analogous
to that used by Schatz et al. - which could be used as a final transformation with any
experimental strain (Figure 14B).
Transformation by bacterial conjugation was attempted with an appropriate, broad range of
kanamycin concentrations (5, 10, 15, 20, 25µg/ml) on solid media. Individual colonies were then
transferred to liquid media in 24-well plates under continued selection or re-streaked and then
transferred to liquid media. Over multiple rounds of conjugation, in excess of 200 colonies were
screened for phenotypic changes. I was unable to reproduce the desired biofilm phenotype under
any of the tested selective conditions.

47
Figure 14. S. elongatus biofilm-related genome features
S. elongatus biofilm phenotype-associated locus. (A) Shows the genomic region containing biofilm linked genes.
Each block is a native gene listed with its identification number. Genome nucleotide positions are listed above the
blocks. (B) Shows the functional components of an insertional knockout plasmid. The recombination event is
selected for by the kanamycin resistance cassette shown between the genomic sequence fragments. Not shown is the
plasmid's pUC origin for propagation in E. coli.

48
Discussion
Photosynthetic isoprenoid production for commodity chemicals
Biosynthetic farnesene production has been demonstrated in a variety of industrial
microorganisms. Production in S. cerevisiae is now commercially viable, with it being sold under
the trade name Biofene by Amyris.125 While I was able to demonstrate only preliminary
functionality an α-farnesene production vector for use in S. elongatus here, similar work done in
other cyanobacteria species and with different target molecules suggests the strategy proposed
here is feasible (Table 1). A 2.5-fold increase in heterologous isoprenoid production in the
related Synechocystis species when a complete MVA pathway was expressed suggests
isoprenoid production can benefit in this type of host by the inclusion of the MVA pathway.67
Because the endogenous MEP isoprenoid pathway in S. elongatus is directly linked to
multiple components of the photosynthetic process (i.e. chlorophyll and carotenoids) (Figure 1),
balancing metabolic flux in a strain with engineered MEP over-expression may be more
challenging. Engineering efforts for increasing production of heterologous isoprenoids by
increasing flux through the endogenous MEP pathway have focused on pushing more carbon
into the pathway by the addition of a DOXP synthase (Figure 1) and pulling more carbon out of
the pathway into the required isoprenoid pyrophosphate building block, both of which are rate
limiting steps in the MEP pathway (Table 1).126 When this type of MEP pathway engineering
was done for heterologous limonene production in Synechocystis, production was only seen to
increase 1.36-fold.127 In the unrelated Anabena sp. PCC 7120, production increased 2.3-fold in
comparable environmental conditions, although at substantially lower titres.68
When this strategy was followed in E. coli for amorphadiene (a sesquiterpene) production,
the production increase was comparable, at a 3.6-fold improvement.6 When heterologous
expression of a MVA pathway was carried out rather than targeted improvement to the
endogenously regulated MEP pathway, amorphadiene yield increased a further 10-fold.6
A large proportion of published work in this area with cyanobacteria has focused on
generating a basic strain that produces a specified isoprenoid and improving production by
means other than metabolic engineering. Demonstrating increased production titres under higher
light conditions or specialised photobioreactor designs are common strategies for this.66–
49
68,78,128,129 Given the relatively low titre improvements demonstrated under standard laboratory
conditions in cyanobacteria, significant gains can be expected in the future. A variety of early
efforts in improving MVA-based isoprenoid production in E. coli readily generated
improvements, including order-of-magnitude production increases.6,100,101,103 As has been
demonstrated, only over-expressing of enzymes is not always the best choice in pathway
engineering if the efficiency of that reaction is not optimised for the context it is occurring in.100
At the most basic level, the production host and even growth stage of the host can impact
functioning of an enzyme. Some effective improvement strategies have included balancing off-
target effects by cell-wide functional genomics analysis, screening enzyme variants for optimal
context-dependent kinetics and cofactor use, and reduction of metabolic burden by physically
associating pathways to synthetic protein scaffolds for improved efficiency.101–103
Examination of metabolic intermediates in isoprenoid biosynthesis
I am currently unaware of any studies examining heterologous mevalonate production in
cyanobacteria, particularly those closely related to S. elongatus. Determining the concentrations
of intermediate metabolites can provide insight into flux bottlenecks in a pathway.
In the upper MVA HMGR variants tested using E. coli by Ma et al., including the S. aureus
variant used in this study, the measured mevalonate concentration roughly correlated to
concentration of the final heterologous isoprenoid molecule.103 My measurements in S. elongatus
showed a maximum mevalonate concentration of 70µM. While not atypical of results shown in
photosynthetic systems, the reported mevalonate concentration using the same system in E. coli
was more than 30-fold higher.103
When isoprene production was carried out in Synechocystis by Bentley et al., the addition of a
different complete MVA pathway only increased isoprene production from 1.9 to 4.7µM.67 As
one isoprene unit is generated per molecule of mevalonate, this suggests the MVA pathway used
by the authors operates at a lower efficiency than the MVA pathway tested here. (Isoprene is
rapidly lost into the headspace and is unlikely to be implicated in reduced pathway efficiency.)
The authors chose to construct a MVA pathway with parts of bacterial origin to increase the
chances of functional expression in their host and, the chosen isoprene synthase plus MVA
pathway had been previously used in E. coli. In E. coli, introduction of the MVA pathway

50
resulted in an order of magnitude improvement.130 In Synechocystis, the authors reassembled the
pathway with different transcription/translation control sequences. The reassembly of their
pathway may have resulted in a negative effect on its efficiency in the new host and
correspondingly poor increase in isoprene production. Additionally, although the MVA genes
were shown to be functional in E. coli, and protein accumulation was shown in Synechocystis, it
is possible the new host exerted an unobserved regulatory effect on one of the translated proteins.
When a complete MVA pathway was expressed in the S. elongatus host, total measured β-
carotene content (the major isoprenoid sink) was maximally 3µM (24µM mevalonate equivalent)
higher than the wild type (Figure 11). If β-carotene was the only available carbon sink, it would
suggest a pathway bottleneck. Since limited regulatory feedback from the cell on the
heterologous MVA pathway can be expected, it is likely any negative regulation is occurring in
the endogenous carotenoid pathway or that the carbon is being distributed more broadly to other
endogenous isoprenoid derivatives. These would include pigments normally found in lower
relative abundance and to phytol for chlorophyll a biosynthesis.
Because additional fixed carbon, ATP, and reducing equivalents are consumed by the MVA
pathway (Figure 1), more must be generated to ensure regular functioning of the cell. Under light
saturating conditions, significant growth defects when pulling fixed carbon into an engineered
sink molecule are uncommon. When a carbon sink is present, increased photosystem II activity
has been recorded (as measured by oxygen evolution).68 While I did not measure rate changes in
oxygen evolution, it would not be unreasonable to assume that the expressing the MVA pathway
alone could also result in increased oxygen evolution. Expression of only the MVA pathway still
diverts fixed carbon and energy away from endogenously regulated processes. This would
necessitate increased photosynthetic activity to maintain a consistent growth rate.
The maximal production of 70µM of mevalonate in S. elongatus was done with the PLAC
promoter. While functional, PLAC is known to be a weak foreign promoter in cyanobacterial
systems. The demonstrated plasticity in cyanobacterial systems to fulfill the carbon and energy
needs saturating light conditions suggests that use of a stronger foreign promoter would cause a
corresponding increase in flux through the MVA pathway.

51
When the full MVA pathway was expressed here in S. elongatus, a small growth rate defect
was detectable. As carbon, ATP, and NADPH do not seem to be limiting factors, the two most
likely possibilities appear to be limited availability of transcription/translation machinery, or
more likely, increased burden from continued selective pressure with two antibiotics.
Addition of the inducer IPTG had no apparent effect on mevalonate product levels. This
suggests that although PLAC can drive transcription in S. elongatus, the lac repressor is ineffective
in this context with PLAC.
Curiously, in two out of the four strain lineages a deficiency in mevalonate production was
clearly present. In the analysis I reclassified the cultures from uninduced/induced to low/high
expressing. If we assume a proportional increase in mevalonate concentrations with pathway
copy number, the data suggests complete chromosome segregation occurred in only two of the
lineages. Mean maximum mevalonate concentrations are approximately 4-fold greater in the
high expressing cultures. Given that the median (and modal) number of chromosomes is 4 copies
per cell (with approximately 1/3 of cells having 4 copies) it is likely the low expressing lineages
were only carrying one correct chromosome per cell on average.97 Gene dosage has previously
been described as a design concern for systems in another cyanobacterial polyploid,
Synechocystis sp. PCC 6803.109
Relationship between chlorophyll, carotenoids, and isoprenoid flux
When I assessed chlorophyll a production in S. elongatus after the addition of a MVA
pathway I saw the engineered cells maintained an equivalent per cell quantity of chlorophyll
compared to the wild type during log phase (18 hours; Figure 10). The lower total chlorophyll
quantity in the MVA strain at this time point can be attributed to the slightly lower rate of growth
of the strain.
As the strains exit their log phase growth, per cell chlorophyll content drops by more than
25% in the wild type strain while the MVA containing strain maintains its per cell chlorophyll
content (Figure 10). For the remainder of the measured time points chlorophyll content gradually
decreases in both strains, but the per cell values for the MVA containing strain remain at least
20% higher than the wild type. It could be presumed that the retention of higher per cell

52
chlorophyll concentrations is due to the increased requirements for fixed carbon, ATP, and
reducing equivalents by an active MVA pathway. The decreased chlorophyll concentration in the
wild type can likely be considered a quantity sufficient for housekeeping once biomass
generation begins to slow down.
The β-carotene concentrations display a similar trend of staying higher in the MVA strain
after entering late log phase (Figure 11). However, unlike the equal amounts seen with
chlorophyll, more β-carotene is seen on a per cell basis at the first time point in the MVA stain.
This suggests that the regulation of carotenoid biosynthesis is not as strict as with chlorophyll a.
Consideration should also be given to the possibility that reduction of per cell β-carotene
concentrations over time is due to self-shading within the culture and a reduced need for photo-
protection.
No clear trend is apparent in the ratio of β-carotene to chlorophyll over time in either strain.
This ratio stays relatively consistent for the wild type strain at all time points. This suggests that
β-carotene content is directly linked to the requirements of the photosystems for it in the wild
type strain under the light intensity used here. The greater β-carotene content relative to
chlorophyll in the MVA strain reinforces the idea that β-carotene can be assumed to be a sink for
the additional flux of isoprenoids precursors generated by the MVA pathway and changes to
chlorophyll levels are related to the level of photosystem activity required to meet the metabolic
demands of the cell.
S. elongatus permeability to metabolites
In the lower MVA pathway strain, I was unable to generate a co-transformant containing a
heterologous farnesene synthase that could act as a carbon sink. Because of this, to assay the
functionality of the lower pathway alone, I chose to screen for consumption of mevalonate rather
than product formation.
When fed with mevalonate, no reduction in mevalonate concentration was detectable in the
cultures (Figure 8). This effect has two likely causes. The first potential cause is pathway
inactivity, either by extremely low processivity by the yeast mevalonate kinase (ERG12) in S.
elongatus or knockdown by the heterologous host.
53
While ERG12 catalyzes an ATP consuming reaction it is unlikely that ATP availability
would limit this reaction. No significant growth defect was seen during strain growth.
Additionally, increased metabolic burden on cyanobacteria appears to be linked with increased
photosystem I activity - directly resulting in higher ATP production rates.20,67,68 Additionally, the
enzyme's reaction kinetics (in yeast) are not favourable for reversal of production formation.131
While knockdown of the genes by the host is a possibility, this is not reported as a common
occurrence in S. elongatus, unlike model eukaryotic algae such as Chlamydomonas reinhardtii
which carry out RNA interference.132
The second, and more likely, potential cause of no apparent reduction in mevalonate
concentration is limited substrate availability within the cells. This low availability in the fed
substrate assay may be due to very low efficiency of metabolite membrane permeability in S.
elongatus. The annotated genome of S. elongatus lists the majority of transporters as being
involved with metal ions, as well as the type II secretion system for peptides.123 Low membrane
permeability has been previously demonstrated for small metabolites (lactate, fructose, glucose)
in S. elongatus.48 (Contrary to the higher membrane permeability seen for the same weak acid
{lactate} in Synechocystis.50) When the relevant transporter was transformed into S. elongatus,
membrane permeability issues were eliminated for the metabolite. In the case of an added hexose
sugar transporter, S. elongatus cells were even able to sustain heterotrophic growth in dark
conditions.
The addition of a transporter for mevalonate along with the lower MVA pathway would help
to provide better insight into membrane permeability of heterologous metabolites in S. elongatus.
Without the inclusion of a functional transporter, the use of radio-labelled mevalonate fed at
much higher concentrations may be the most effective experimental option to probe this issue.
Biofilm formation
I attempted to reproduce a biofilm phenotype demonstrated in S. elongatus by Schatz et al,
but was unsuccessful with my knockout strategy. I was most likely unable to fully segregate any
transformants to a homo-polyploid state. Any remaining genome copies without the knockout
would remain capable of secreting the presumed biofilm self-inhibitory small molecule/peptide.
54
Additionally, the authors had demonstrated the expression of two endogenous genes
(Synpcc7942_1133 and Synpcc7942_1134) were necessary in addition to the knockout to
generate the desired phenotype. While I did not validate protein expression for these genes in my
strain, expression would be expected in the wild type stock unless a random inactivating
mutation occurred in the original stock.
I am currently unaware of any laboratories that have reproduced the results generated, but the
experiments used to characterise the cause of the phenotype appear well controlled. As the
publication did not specify the origin or age of their S. elongatus stock, the clearest additional
validation experiment for the phenotype's cause may be a whole genome analysis against the
current reference genome.
Design-build-test cycles in S. elongatus
In my attempt to add this model organism to the collection of those already in use in our
laboratory, I experienced multiple challenges with technical procedures specific to S. elongatus.
I initially experienced non-viable transformation efficiencies when using the common natural
transformation method for S. elongatus. I was unable to determine the cause of the low
efficiency and switched to using the more robust tri-parental mating method. While marginally
more labour intensive, the gain in transformation efficiency was a necessity. While
electroporation can be carried out in some cyanobacteria species (Synechocystis PCC6803,
Nostoc PCC 7120,) it has not been demonstrated in Synechococcus elongatus PCC 7942.46
Even with a robust transformation method, contamination of strains by environmental
microbes was a recurring concern. Cultures could have no apparent contaminating growth at
inoculation, but become unusable over their period of growth as additional carbon was fixed
photosynthetically. The slow growth rate of S. elongatus made this problematic as the
cyanobacteria were not able to multiply at a rate that would make contaminating heterotrophs a
negligible issue. As done here, and in other laboratories, the most effective method to manage
this challenge appears to be frequently spotting the cultures onto heterotrophic media to screen
for heterotrophic contaminants.48
55
The need to maintain strains in liquid culture for ease of use likely aggravates this issue.
When putative transformants are picked from solid media they are first transferred to a small
volume starter culture (typically a 24-well plate) before passaging the viable cultures into larger
volumes. The recovery of strains from frozen stocks requires a similarly lengthy process.
The slow rate of growth also made attempting to separate out the desired strain from
contaminating colonies on solid media highly challenging. In my experience, once the culture
was identified as contaminated, heterotrophic colonies would form at a high enough rate on
photoautotrophic solid media that the S. elongatus colonies could not be easily picked without
carrying contaminating cells over. Attempting to mechanically separate the cell types by
streaking proved similarly problematic.
CRISPR-Cas facilitated engineering presents an interesting opportunity to speed up the
engineering cycle in Synechococcus elongatus PCC 7942 and other polyploids with random
genome segregation.133,134 S. elongatus has no known CRISPR-Cas system that could be
repurposed for genome editing, making the addition of a heterologous construct necessary.135
A 'clonal' population following a transformation protocol is Synechococcus elongatus PCC
7942 can result in cells within the population having between 0-100% of their genomes
containing the integration of interest. This mixed population can maintain itself in culture, or
result in the complete gain or loss of the genome of interest following further culturing. To
achieve a true clonal population, repeated sub-culturing can be required.
Traditional integration tools for Synechococcus elongatus PCC 7942 rely on large homology
regions for their efficiency.96 These regions are typically seen in practice ranging from 500-
1500bp. Targeted CRISPR-Cas cutting of the genome in regions expected to be ablated by an
integration event could eliminate additional weeks sub-culturing and potentially reduce the
required size of the homology regions for efficient transformations. Additionally, knockouts
would be able to propagate immediately within a cell's multiple genomes from only a single copy
of the required CRISPR-Cas guide RNAs.
As also discussed by others, the two areas required for increased reliability in cyanobacterial
engineering are better understood parts and more efficient tools. Much like with more unrelated
species groups, inferences can not necessarily be made about part functionality in one

56
cyanobacterial species from data collected in another. Multiple review articles have attempted to
compile part data sheets out of the existing literature, but little quantitative or context-normalised
data is available still. While successful approaches to faster genome modification in S. elongatus
will undoubtedly appear, the biggest hurdle to rapid engineering of model photoautotrophic
cyanobacterial systems remains growth rate.
I am hopeful that further characterisation of the fast growing Synechococcus elongatus
UTEX 2973 species will result in its greater use as a host species for engineered systems, and
that the better comprehension of its biology can be used to enhance our understanding of carbon
partitioning regulation in other related species and possibly even improve their growth rates.

57
References
1. Chang, J. Green Chemicals: Biomass chemicals to be competitive in 10–15 years. (2012).
at <http://www.icis.com/Articles/2012/04/02/9546230/green-chemicals-biomass-
chemicals-to-be-competitive-in-1015.html>
2. Proceedings of the Twenty-Fifth Symposium on Biotechnology for Fuels and Chemicals
Held May 4–7, 2003, in Breckenridge, CO. (Humana Press, 2004). doi:10.1007/978-1-
59259-837-3
3. Gallezot, P. Conversion of biomass to selected chemical products. Chem. Soc. Rev. 41,
1538–58 (2012).
4. Yadav, V. G., De Mey, M., Giaw Lim, C., Kumaran Ajikumar, P. & Stephanopoulos, G.
The future of metabolic engineering and synthetic biology: Towards a systematic practice.
Metab. Eng. 14, 233–241 (2012).
5. Koffas, M., Roberge, C., Lee, K. & Stephanopoulos, G. Metabolic engineering. Annu.
Rev. Biomed. Eng. 1, 535–57 (1999).
6. Martin, V. J. J., Pitera, D. J., Withers, S. T., Newman, J. D. & Keasling, J. D. Engineering
a mevalonate pathway in Escherichia coli for production of terpenoids. Nat. Biotechnol.
21, 796–802 (2003).
7. Ro, D.-K. et al. Production of the antimalarial drug precursor artemisinic acid in
engineered yeast. Nature 440, 940–3 (2006).
8. Yim, H. et al. Metabolic engineering of Escherichia coli for direct production of 1,4-
butanediol. Nat. Chem. Biol. 7, 445–52 (2011).
9. Wang, C. et al. Farnesol production from Escherichia coli by harnessing the exogenous
mevalonate pathway. Biotechnol. Bioeng. 107, 421–9 (2010).
10. Wu, S. & Chappell, J. Metabolic engineering of natural products in plants; tools of the
trade and challenges for the future. Curr. Opin. Biotechnol. 19, 145–52 (2008).
11. Serra, T. & Zilberman, D. Biofuel-related price transmission literature: A review. Energy
Econ. 37, 141–151 (2013).
12. Hays, S. G. & Ducat, D. C. Engineering cyanobacteria as photosynthetic feedstock
factories. Photosynth. Res. 123, 285–95 (2015).
13. Bridgwater, A. V. Review of fast pyrolysis of biomass and product upgrading. Biomass
and Bioenergy 38, 68–94 (2012).
14. Chiaramonti, D., Prussi, M., Buffi, M., Rizzo, A. M. & Pari, L. Review and experimental
study on pyrolysis and hydrothermal liquefaction of microalgae for biofuel production.
Appl. Energy (2016). doi:10.1016/j.apenergy.2015.12.001
15. Daroch, M., Geng, S. & Wang, G. Recent advances in liquid biofuel production from algal
feedstocks. Appl. Energy 102, 1371–1381 (2013).
16. Martone, P. T. et al. Discovery of lignin in seaweed reveals convergent evolution of cell-
wall architecture. Curr. Biol. 19, 169–75 (2009).

58
17. Elliott, D. C. et al. Process development for hydrothermal liquefaction of algae feedstocks
in a continuous-flow reactor. Algal Res. 2, 445–454 (2013).
18. Miao, X. & Wu, Q. Biodiesel production from heterotrophic microalgal oil. Bioresour.
Technol. 97, 841–6 (2006).
19. Rodolfi, L. et al. Microalgae for oil: strain selection, induction of lipid synthesis and
outdoor mass cultivation in a low-cost photobioreactor. Biotechnol. Bioeng. 102, 100–12
(2009).
20. Ducat, D. C., Avelar-Rivas, J. A., Way, J. C. & Silver, P. A. Rerouting carbon flux to
enhance photosynthetic productivity. Appl. Environ. Microbiol. 78, 2660–8 (2012).
21. Deng, M. D. & Coleman, J. R. Ethanol synthesis by genetic engineering in cyanobacteria.
Appl. Environ. Microbiol. 65, 523–8 (1999).
22. Liu, X., Sheng, J. & Curtiss, R. Fatty acid production in genetically modified
cyanobacteria. Proc. Natl. Acad. Sci. U. S. A. 108, 6899–904 (2011).
23. Kovacevic, V. & Wesseler, J. Cost-effectiveness analysis of algae energy production in
the EU. Energy Policy 38, 5749–5757 (2010).
24. Melis, A. Solar energy conversion efficiencies in photosynthesis: Minimizing the
chlorophyll antennae to maximize efficiency. Plant Sci. 177, 272–280 (2009).
25. Reshes, G., Vanounou, S., Fishov, I. & Feingold, M. Timing the start of division in E.
coli: a single-cell study. Phys. Biol. 5, 046001 (2008).
26. Di Talia, S., Skotheim, J. M., Bean, J. M., Siggia, E. D. & Cross, F. R. The effects of
molecular noise and size control on variability in the budding yeast cell cycle. Nature 448,
947–51 (2007).
27. Savage, D. F., Afonso, B., Chen, A. H. & Silver, P. A. Spatially ordered dynamics of the
bacterial carbon fixation machinery. Science 327, 1258–61 (2010).
28. Yu, J. et al. Synechococcus elongatus UTEX 2973, a fast growing cyanobacterial chassis
for biosynthesis using light and CO2. Sci. Rep. 5, 8132 (2015).
29. Goulding, K. H. & Merrett, M. J. The Photometabolism of Acetate by Chlorella
pyrenoidosa. J. Exp. Bot. 17, 678–689 (1966).
30. Greene, R. M., Geider, R. J., Kolber, Z. & Falkowski, P. G. Iron-induced changes in light
harvesting and photochemical energy conversion processes in eukaryotic marine algae.
Plant Physiol. 100, 565–75 (1992).
31. Lynch, D. V & Thompson, G. A. Low Temperature-Induced Alterations in the
Chloroplast and Microsomal Membranes of Dunaliella salina. Plant Physiol. 69, 1369–75
(1982).
32. A ! Realistic ! Technology ! and ! Engineering ! Assessment ! of ! Algae ! Biofuel !
Production ! (2010).
33. Handbook of Microalgal Culture: Biotechnology and Applied Phycology. (2007).
doi:10.1002/9780470995280

59
34. Jiménez, C., Cossı́o, B. R., Labella, D. & Niell, F. X. The Feasibility of industrial
production of Spirulina (Arthrospira) in Southern Spain. Aquaculture 217, 179–190
(2003).
35. Gendy, T. S. & El-Temtamy, S. A. Commercialization potential aspects of microalgae for
biofuel production: An overview. Egypt. J. Pet. 22, 43–51 (2013).
36. Ooms, M. D. et al. Evanescent photosynthesis: exciting cyanobacteria in a surface-
confined light field. Phys. Chem. Chem. Phys. 14, 4817–23 (2012).
37. Iwamura, T. Change of nucleic acid content in Chlorella cells during the course of their
life-cycle. J. Biochem. 42, 575–589 (1955).
38. Curtain, C., Looney, F., Regan, D. & Ivancic, M. Changes in the ordering of lipids in the
membrane of Dunaliella in response to osmotic-pressure changes. An e.s.r. study.
Biochem. J. (1983). at <http://www.biochemj.org/bj/213/bj2130131.htm>
39. Jensen, P. E. & Leister, D. Cyanobacteria as an Experimental Platform for Modifying
Bacterial and Plant Photosynthesis. Front. Bioeng. Biotechnol. 2, 7 (2014).
40. Ducat, D. C., Sachdeva, G. & Silver, P. A. Rewiring hydrogenase-dependent redox
circuits in cyanobacteria. Proc. Natl. Acad. Sci. U. S. A. 108, 3941–6 (2011).
41. Aasen, A. J., Eimhjellen, K. E. & Liaaen-Jensen, S. An extreme source of beta-carotene.
Acta Chem. Scand. 23, 2544–5 (1969).
42. Ben-Amotz, A., Katz, A. & Avron, M. Accumulation of β-carotene in halotolerant algae:
Purification and characterization of β-carotene-rich globules from Dunaliella bardawil
(Chlorophyceae). J. Phycol. 18, 529–537 (1982).
43. Lagarde, D., Beuf, L. & Vermaas, W. Increased Production of Zeaxanthin and Other
Pigments by Application of Genetic Engineering Techniques to Synechocystis sp. Strain
PCC 6803. Appl. Environ. Microbiol. 66, 64–72 (2000).
44. The Cyanobacteria : Molecular Biology, Genomics, and Evolution. (Caister Academic
Press, 2008). at
<https://encore.concordia.ca/iii/encore/record/C__Rb2536631?lang=eng&suite=def>
45. Kondo, T. et al. Circadian clock mutants of cyanobacteria. Science 266, 1233–6 (1994).
46. Heidorn, T. et al. Synthetic biology in cyanobacteria engineering and analyzing novel
functions. Methods Enzymol. 497, (2011).
47. Aikens, J. & Turner, R. J. Transgenic photosynthetic microorganisms and photobioreactor.
(2013). at <http://patft.uspto.gov/netacgi/nph-
Parser?Sect2=PTO1&Sect2=HITOFF&p=1&u=/netahtml/PTO/search-
bool.html&r=1&f=G&l=50&d=PALL&RefSrch=yes&Query=PN/8367379>
48. Niederholtmeyer, H., Wolfstädter, B. T., Savage, D. F., Silver, P. A. & Way, J. C.
Engineering cyanobacteria to synthesize and export hydrophilic products. Appl. Environ.
Microbiol. 76, 3462–6 (2010).
49. Angermayr, S. A. et al. Exploring metabolic engineering design principles for the
photosynthetic production of lactic acid by Synechocystis sp. PCC6803. Biotechnol.
60
Biofuels 7, 99 (2014).
50. Angermayr, S. A., Paszota, M. & Hellingwerf, K. J. Engineering a cyanobacterial cell
factory for production of lactic acid. Appl. Environ. Microbiol. 78, 7098–106 (2012).
51. Lamers, P. P. et al. Carotenoid and fatty acid metabolism in light-stressed Dunaliella
salina. Biotechnol. Bioeng. 106, 638–48 (2010).
52. Blumwald, E., Mehlhorn, R. J. & Packer, L. Studies of osmoregulation in salt adaptation
of cyanobacteria with ESR spin-probe techniques. Proc. Natl. Acad. Sci. U. S. A. 80,
2599–602 (1983).
53. Miao, X., Wu, Q., Wu, G. & Zhao, N. Sucrose accumulation in salt-stressed cells of agp
gene deletion-mutant in cyanobacterium Synechocystis sp PCC 6803. FEMS Microbiol.
Lett. 218, 71–7 (2003).
54. Martínez-Noël, G. M. A. et al. First evidence of sucrose biosynthesis by single
cyanobacterial bimodular proteins. FEBS Lett. 587, 1669–74 (2013).
55. Agapakis, C. M. et al. Towards a synthetic chloroplast. PLoS One 6, e18877 (2011).
56. Rude, M. a & Schirmer, A. New microbial fuels: a biotech perspective. Curr. Opin.
Microbiol. 12, 274–81 (2009).
57. Guerrero, F., Carbonell, V., Cossu, M., Correddu, D. & Jones, P. R. Ethylene synthesis
and regulated expression of recombinant protein in Synechocystis sp. PCC 6803. PLoS
One 7, e50470 (2012).
58. Ogawa, T., Takahashi, M., Fujii, T., Tazaki, M. & Fukuda, H. The Role of
NADH:Fe(III)EDTA Oxidoreductase in Ethylene Formation from 2-Keto-4-
Methylthiobutyrate. J. Ferment. Bioeng. 69, 287–291 (1990).
59. Ungerer, J. et al. Sustained photosynthetic conversion of CO2 to ethylene in recombinant
cyanobacterium Synechocystis 6803. Energy Environ. Sci. 5, 8998 (2012).
60. Atsumi, S., Higashide, W. & Liao, J. C. Direct photosynthetic recycling of carbon dioxide
to isobutyraldehyde. Nat. Biotechnol. 27, 1177–80 (2009).
61. Shen, C. R. & Liao, J. C. Photosynthetic production of 2-methyl-1-butanol from CO2 in
cyanobacterium Synechococcus elongatus PCC7942 and characterization of the native
acetohydroxyacid synthase. Energy Environ. Sci. 5, 9574 (2012).
62. Morrison, S. S., Mullineaux, C. W. & Ashby, M. K. The influence of acetyl phosphate on
DspA signalling in the Cyanobacterium Synechocystis sp. PCC6803. BMC Microbiol. 5,
47 (2005).
63. Wang, W., Liu, X. & Lu, X. Engineering cyanobacteria to improve photosynthetic
production of alka(e)nes. Biotechnol. Biofuels 6, 69 (2013).
64. Hu, P. et al. Metabolic phenotyping of the cyanobacterium Synechocystis 6803
engineered for production of alkanes and free fatty acids. Appl. Energy 102, 850–859
(2013).
65. Lindberg, P., Park, S. & Melis, A. Engineering a platform for photosynthetic isoprene
production in cyanobacteria, using Synechocystis as the model organism. Metab. Eng. 12,

61
70–9 (2010).
66. Bentley, F. K. & Melis, A. Diffusion-based process for carbon dioxide uptake and
isoprene emission in gaseous/aqueous two-phase photobioreactors by photosynthetic
microorganisms. Biotechnol. Bioeng. 109, 100–9 (2012).
67. Bentley, F. K., Zurbriggen, A. & Melis, A. Heterologous expression of the mevalonic acid
pathway in cyanobacteria enhances endogenous carbon partitioning to isoprene. Mol.
Plant 7, 71–86 (2014).
68. Halfmann, C., Gu, L. & Zhou, R. Engineering cyanobacteria for the production of a cyclic
hydrocarbon fuel from CO2 and H2O. Green Chem. 16, 3175 (2014).
69. Jacobsen, J. H. & Frigaard, N.-U. Engineering of photosynthetic mannitol biosynthesis
from CO2 in a cyanobacterium. Metab. Eng. 21, 60–70 (2014).
70. Berg, A., Lindblad, P. & Svensson, B. H. Cyanobacteria as a source of hydrogen for
methane formation. World J. Microbiol. Biotechnol. 30, 539–45 (2014).
71. Takahama, K., Matsuoka, M., Nagahama, K. & Ogawa, T. Construction and analysis of a
recombinant cyanobacterium expressing a chromosomally inserted gene for an ethylene-
forming enzyme at the psbAI locus. J. Biosci. Bioeng. 95, 302–305 (2003).
72. Sakai, M., Ogawa, T., Matsuoka, M. & Fukuda, H. Photosynthetic conversion of carbon
dioxide to ethylene by the recombinant cyanobacterium, Synechococcus sp. PCC 7942,
which harbors a gene for the ethylene-forming enzyme of Pseudomonas syringae. J.
Ferment. Bioeng. 84, 434–443 (1997).
73. Zhu, T., Xie, X., Li, Z., Tan, X. & Lu, X. Enhancing photosynthetic production of
ethylene in genetically engineered Synechocystis sp. PCC 6803. Green Chem. (2014).
doi:10.1039/C4GC01730G
74. Dexter, J. & Fu, P. Metabolic engineering of cyanobacteria for ethanol production. Energy
Environ. Sci. 2, 857 (2009).
75. Ruffing, A. M. & Jones, H. D. T. Physiological effects of free fatty acid production in
genetically engineered Synechococcus elongatus PCC 7942. Biotechnol. Bioeng. 109,
2190–9 (2012).
76. Ruffing, A. M. Improved Free Fatty Acid Production in Cyanobacteria with
Synechococcus sp. PCC 7002 as Host. Front. Bioeng. Biotechnol. 2, (2014).
77. Reppas, N. B. ; & Ridley, C. P. Methods and compositions for the recombinant
biosynthesis of n-alkanes. (2013). at
<https://www.google.ca/patents/US8481285?dq=Methods+and+compositions+for+the+re
combinant+biosynthesis+of+n-
alkanes&hl=en&sa=X&ei=RZFMVK3tNc2wyATM9YLACw&ved=0CDEQ6AEwAw>
78. Halfmann, C., Gu, L., Gibbons, W. & Zhou, R. Genetically engineering cyanobacteria to
convert CO2, water, and light into the long-chain hydrocarbon farnesene. Appl. Microbiol.
Biotechnol. (2014). doi:10.1007/s00253-014-6118-4
79. Lange, B. M., Rujan, T., Martin, W. & Croteau, R. Isoprenoid biosynthesis: the evolution
of two ancient and distinct pathways across genomes. Proc. Natl. Acad. Sci. U. S. A. 97,
62
13172–7 (2000).
80. Sacchettini, J. C. & Poulter, C. D. Creating Isoprenoid Diversity. Science (80-. ). 277,
1788–1789 (1997).
81. Which Fuels for Low CO2 Engines?: Proceedings of the International Conference Held in
Rueil-Malmaison, France, September, 22-23, 2004. in IFP Int. Conf. (Duret, P. &
Montagne, X.) 233 (Editions TECHNIP, 2004). at
<http://books.google.com/books?hl=en&lr=&id=OPecQt9Fc-kC&pgis=1>
82. Harvey, B. G., Wright, M. E. & Quintana, R. L. High-Density Renewable Fuels Based on
the Selective Dimerization of Pinenes. ACS Energy Fuels (2010). doi:10.1021/ef900799c
83. Sarria, S., Wong, B., García Martín, H., Keasling, J. D. & Peralta-Yahya, P. Microbial
synthesis of pinene. ACS Synth. Biol. 3, 466–75 (2014).
84. Fisher, K., Schofer, S. J. & Kanne, D. B. Squalane and isosqualane compositions and
methods for preparing the same. (2013). at
<https://www.google.ca/patents/US8586814?dq=industrial+%22farnesene%22+use+amyr
is&hl=en&sa=X&ved=0ahUKEwiI2s79pYrLAhVBdT4KHTI0CekQ6AEIMDAD>
85. McPhee, D. J. & Graham, M. J. Adhesive compositions comprising a polyfarnesene.
(2010). at
<https://www.google.ca/patents/US7655739?dq=industrial+%22farnesene%22+use+amyr
is&hl=en&sa=X&ved=0ahUKEwiFxqWTporLAhXMaD4KHVtsDOk4FBDoAQgoMAI>
86. McPhee, D. J. Farnesene interpolymers. (2012). at
<https://www.google.ca/patents/US8217128?dq=industrial+%22farnesene%22+use+amyr
is&hl=en&sa=X&ved=0ahUKEwiI2s79pYrLAhVBdT4KHTI0CekQ6AEINzAE>
87. Alper, H. & Stephanopoulos, G. Engineering for biofuels: exploiting innate microbial
capacity or importing biosynthetic potential? Nat. Rev. Microbiol. 7, 715–23 (2009).
88. Dietrich, J. A., McKee, A. E. & Keasling, J. D. High-throughput metabolic engineering:
advances in small-molecule screening and selection. Annu. Rev. Biochem. 79, 563–90
(2010).
89. Harker, M. & Bramley, P. M. Expression of prokaryotic 1-deoxy-d-xylulose-5-
phosphatases in Escherichia coli increases carotenoid and ubiquinone biosynthesis. FEBS
Lett. 448, 115–119 (1999).
90. Kim, S. W. & Keasling, J. D. Metabolic engineering of the nonmevalonate isopentenyl
diphosphate synthesis pathway in Escherichia coli enhances lycopene production.
Biotechnol. Bioeng. 72, 408–15 (2001).
91. Alper, H., Miyaoku, K. & Stephanopoulos, G. Construction of lycopene-overproducing E.
coli strains by combining systematic and combinatorial gene knockout targets. Nat.
Biotechnol. 23, 612–6 (2005).
92. Yoon, S.-H. et al. Increased beta-carotene production in recombinant Escherichia coli
harboring an engineered isoprenoid precursor pathway with mevalonate addition.
Biotechnol. Prog. 23, 599–605
93. Özaydın, B., Burd, H., Lee, T. S. & Keasling, J. D. Carotenoid-based phenotypic screen of

63
the yeast deletion collection reveals new genes with roles in isoprenoid production. Metab.
Eng. 15, 174–83 (2013).
94. Vioque, A. Transformation of cyanobacteria. Adv. Exp. Med. Biol. 616, 12–22 (2007).
95. Ruffing, A. M. Engineered cyanobacteria: Teaching an old bug new tricks. Bioeng. Bugs
2, 136–149 (2011).
96. Clerico, E. M., Ditty, J. L. & Golden, S. S. Specialized techniques for site-directed
mutagenesis in cyanobacteria. Methods Mol. Biol. 362, 155–71 (2007).
97. Chen, A. H., Afonso, B., Silver, P. A. & Savage, D. F. Spatial and temporal organization
of chromosome duplication and segregation in the cyanobacterium Synechococcus
elongatus PCC 7942. PLoS One 7, e47837 (2012).
98. Ooms, M. D., Erickson, D. & Sinton, D. Evanescent Cultivation of Cyanobacteria for
Bioenergy. in CLEO2011 - Laser Appl. to Photonic Appl. (Optical Society of America,
2011). doi:10.1364/CLEO_SI.2011.CTuF6
99. Schatz, D. et al. Self-suppression of biofilm formation in the cyanobacterium
Synechococcus elongatus. Environ. Microbiol. 15, 1786–94 (2013).
100. Pitera, D. J., Paddon, C. J., Newman, J. D. & Keasling, J. D. Balancing a heterologous
mevalonate pathway for improved isoprenoid production in Escherichia coli. Metab. Eng.
9, 193–207 (2007).
101. Kizer, L., Pitera, D. J., Pfleger, B. F. & Keasling, J. D. Application of functional genomics
to pathway optimization for increased isoprenoid production. Appl. Environ. Microbiol.
74, 3229–41 (2008).
102. Dueber, J. E. et al. Synthetic protein scaffolds provide modular control over metabolic
flux. Nat. Biotechnol. 27, 753–9 (2009).
103. Ma, S. M. et al. Optimization of a heterologous mevalonate pathway through the use of
variant HMG-CoA reductases. Metab. Eng. 13, 588–97 (2011).
104. Wang, C. et al. Metabolic engineering of Escherichia coli for α-farnesene production.
Metab. Eng. 13, 648–55 (2011).
105. Marasco, E. Identification and characterization of bacterial carotenoid cleavage
oxygenases. (2008). at <http://search.proquest.com/docview/304581863>
106. Schafer, L., Sandmann, M., Woitsch, S. & Sandmann, G. Coordinate up-regulation of
carotenoid biosynthesis as a response to light stress in Synechococcus PCC7942. Plant,
Cell Environ. 29, 1349–1356 (2006).
107. Design and characterization of molecular tools for a Synthetic Biology approach towards
developing cyanobacterial biotechnology. Nucleic Acids Res. 38, 2577–93 (2010).
108. McEwen, J. T., Machado, I. M. P., Connor, M. R. & Atsumi, S. Engineering
Synechococcus elongatus PCC 7942 for continuous growth under diurnal conditions.
Appl. Environ. Microbiol. 79, 1668–75 (2013).
109. Camsund, D. & Lindblad, P. Engineered transcriptional systems for cyanobacterial
biotechnology. Front. Bioeng. Biotechnol. 2, 40 (2014).

64
110. Geerts, D., Bovy, A., de Vrieze, G., Borrias, M. & Weisbeek, P. Inducible expression of
heterologous genes targeted to a chromosomal platform in the cyanobacterium
Synechococcus sp. PCC 7942. Microbiology 141 ( Pt 4, 831–41 (1995).
111. Lan, E. I. & Liao, J. C. Metabolic engineering of cyanobacteria for 1-butanol production
from carbon dioxide. Metab. Eng. 13, 353–63 (2011).
112. Mori, T. et al. Circadian clock protein KaiC forms ATP-dependent hexameric rings and
binds DNA. Proc. Natl. Acad. Sci. U. S. A. 99, 17203–8 (2002).
113. Sambrook, J. & Russell, D. W. Molecular Cloning: A Laboratory Manual. (CSHL Press,
2001). at <https://books.google.com/books?id=Bosc5JVxNpkC&pgis=1>
114. Seidman, C. E., Struhl, K., Sheen, J. & Jessen, T. Introduction of plasmid DNA into cells.
Curr. Protoc. Mol. Biol. Chapter 1, Unit 1.8 (2001).
115. Horton, R. M., Cai, Z. L., Ho, S. N. & Pease, L. R. Gene splicing by overlap extension:
Tailor-made genes using the polymerase chain reaction. Biotechniques 54, 528–535
(2013).
116. Andersson, C. R. et al. Application of bioluminescence to the study of circadian rhythms
in cyanobacteria. Methods Enzymol. 305, (Elsevier, 2000).
117. Way, J. C., Niederholtmeyer, H., Wolfstaedter, B. & Savage, D. Production of secreted
bioproducts from photosynthetic microbes. (2012). at
<http://www.google.com/patents/US20120220007>
118. Amann, E., Ochs, B. & Abel, K. J. Tightly regulated tac promoter vectors useful for the
expression of unfused and fused proteins in Escherichia coli. Gene 69, 301–15 (1988).
119. Shestakov, S. V. & Khyen, N. T. Evidence for genetic transformation in blue-green alga
Anacystis nidulans. MGG Mol. Gen. Genet. 107, 372–375 (1970).
120. Niederhotmeyer, H. , personal communication.
121. Elhai, J., Vepritskiy, A., Muro-Pastor, A. M., Flores, E. & Wolk, C. P. Reduction of
conjugal transfer efficiency by three restriction activities of Anabaena sp. strain PCC
7120. J. Bacteriol. 179, 1998–2005 (1997).
122. Huang, H. Design and characterization of artificial transcriptional terminators. (2007). at
<http://dspace.mit.edu/handle/1721.1/45981>
123. Copeland, A. et al. Synechococcus elongatus PCC 7942, complete genome. (2005). at
<http://www.ncbi.nlm.nih.gov/nuccore/NC_007604>
124. Diego, S. & Jolla, L. Changes in the cyanobacterial photosynthetic apparatus during
acclimation to macronutrient deprivation. 173–183 (1994).
125. Leavell, M. D., McPhee, D. J. & Paddon, C. J. Developing fermentative terpenoid
production for commercial usage. Curr. Opin. Biotechnol. 37, 114–9 (2016).
126. Angermayr, S. A., Gorchs Rovira, A. & Hellingwerf, K. J. Metabolic engineering of
cyanobacteria for the synthesis of commodity products. Trends Biotechnol. 33, 352–361
(2015).
65
127. Kiyota, H., Okuda, Y., Ito, M., Hirai, M. Y. & Ikeuchi, M. Engineering of cyanobacteria
for the photosynthetic production of limonene from CO2. J. Biotechnol. 185, 1–7 (2014).
128. Masamoto, K. & Furukawa, K. Accumulation of zeaxanthin in cells of the
cyanobacterium, Synechococcus sp. Strain PCC 7942 grown under high irradiance. J.
Plant Physiol. 151, 257–261 (1997).
129. Kudoh, K. et al. Prerequisite for highly efficient isoprenoid production by cyanobacteria
discovered through the over-expression of 1-deoxy-d-xylulose 5-phosphate synthase and
carbon allocation analysis. J. Biosci. Bioeng. 118, 20–8 (2014).
130. Zurbriggen, A., Kirst, H. & Melis, A. Isoprene Production Via the Mevalonic Acid
Pathway in Escherichia coli (Bacteria). BioEnergy Res. 5, 814–828 (2012).
131. Caspi, R. et al. The MetaCyc database of metabolic pathways and enzymes and the
BioCyc collection of Pathway/Genome Databases. Nucleic Acids Res. 42, D459–71
(2014).
132. Harris, E. H. The Chlamydomonas Sourcebook: Introduction to Chlamydomonas and Its
Laboratory Use, Volume 1. (Academic Press, 2009). at
<https://books.google.com/books?id=xTjJGV5GWY0C&pgis=1>
133. Charpentier, E. & Doudna, J. A. Biotechnology: Rewriting a genome. Nature 495, 50–1
(2013).
134. Cong, L. et al. Multiplex genome engineering using CRISPR/Cas systems. Science 339,
819–23 (2013).
135. Cai, F., Axen, S. D. & Kerfeld, C. A. Evidence for the widespread distribution of
CRISPR-Cas system in the Phylum Cyanobacteria. RNA Biol. (Taylor & Francis, 2013). at
<http://www.tandfonline.com/doi/full/10.4161/rna.24571>
136. Lee, R. E. Phycology. (Cambridge University Press, 2008).
doi:10.1017/CBO9780511812897

66
Appendices
Non-commercial incubators
Supplementary Figure 1
Non-commercial incubators used for S. elongatus plates. (A) Small plate incubator. 34°C set point maintained from
heat output of bulbs. Maximum 50μmol∙m-2s-1 light output. (B) Converted anaerobic hood for plate incubation.
Variable temperature set point. Variable atmospheric gas mixture possible. Maximum 70μmol∙m-2s-1 light output.

67
Primer table
Supplementary Table 1. List of primers used
Primer Sequence
ERG12_fwd ATGTCATTACCGTTCTTAACTTCT
ERG12-nostop_rev TGAAGTCCATGGTAAATTCGTG
ERG8_fwd ATGTCAGAGTTGAGAGCCTT
ERG8-nostop_rev TTTATCAAGATAAGTTTCCGGATCT
MVD1_fwd ATGACCGTTTACACAGCATC
MVD1-nostop_rev TTCCTTTGGTAGACCAGTCTTT
idi_fwd ATGCAAACGGAACACGTC
idi-nostop_rev TTTAAGCTGGGTAAATGCAGA
ispA_fwd ATGGACTTTCCGCAGCAA
ispA-nostop_rev TTTATTACGCTGGATGATGTAGT
atoB_fwd ATGAAAAATTGTGTCATCGTCAGTGC
atoB-nostop_rev ATTCAACCGTTCAATCACCATCG
ERG13_fwd ATGAAACTCTCAACTAAACTTTGTTG
ERG13_rev CTTATTTTTTAACATCGTAAGATCTTC
seqpsbA2aFS-f2 GCCAATCTGTTCGAAAAAGAAA
seqpsbA2aFS-r3 TGCCTGCACCACGTTAAAAT

68
Codon optimised HMGR-Sa sequence
LOCUS pZW(NS1:MTSa) 8211 bp ds-DNA circular DEFINITION . FEATURES Location/Qualifiers misc_recomb 744..1543 /label="NS1 CDS" CDS 1550..2694 /label="SpecR cassette CDS" misc_feature 2728..2757 /label="lacProm primer" misc_recomb 7431..8210 /label="NS1 CDS" CDS 2956..4137 /label="atoB CDS" CDS 5646..6926 /label="HMGR-Sa (codon optimised Staphylococcus aureus origin)" misc_feature 7332..7359 /label="rrnB T2 terminator primer" CDS 4154..5626 /label="ERG13 CDS" ORIGIN 1 gataatctca tgaccaaaat cccttaacgt gagttttcgt tccactgagc gtcagacccc 61 gtagaaaaga tcaaaggatc ttcttgagat cctttttttc tgcgcgtaat ctgctgcttg 121 caaacaaaaa aaccaccgct accagcggtg gtttgtttgc cggatcaaga gctaccaact 181 ctttttccga aggtaactgg cttcagcaga gcgcagatac caaatactgt tcttctagtg 241 tagccgtagt taggccacca cttcaagaac tctgtagcac cgcctacata cctcgctctg 301 ctaatcctgt taccagtggc tgctgccagt ggcgataagt cgtgtcttac cgggttggac 361 tcaagacgat agttaccgga taaggcgcag cggtcgggct gaacgggggg ttcgtgcaca 421 cagcccagct tggagcgaac gacctacacc gaactgagat acctacagcg tgagctatga 481 gaaagcgcca cgcttcccga agggagaaag gcggacaggt atccggtaag cggcagggtc 541 ggaacaggag agcgcacgag ggagcttcca gggggaaacg cctggtatct ttatagtcct 601 gtcgggtttc gccacctctg acttgagcgt cgatttttgt gatgctcgtc aggggggcgg 661 agcctatgga aaaacgccag caacgcggcc tttttacggt tcctggcctt ttgctggcct 721 tttgctcaca tgtgtgctgg gccccaatgc cttctccaag ggcggcattc ccctgactgt 781 tgaaggcgtt gccaatatca agattgctgg ggaagaaccg accatccaca acgcgatcga 841 gcggctgctt ggcaaaaacc gtaaggaaat cgagcaaatt gccaaggaga ccctcgaagg 901 caacttgcgt ggtgttttag ccagcctcac gccggagcag atcaacgagg acaaaattgc 961 ctttgccaaa agtctgctgg aagaggcgga ggatgacctt gagcagctgg gtcaagtcct 1021 cgatacgctg caagtccaga acatttccga tgaggtcggt tatctctcgg ctagtggacg 1081 caagcagcgg gctgatctgc agcgagatgc ccgaattgct gaagccgatg cccaggctgc 1141 ctctgcgatc caaacggccg aaaatgacaa gatcacggcc ctgcgtcgga tcgatcgcga 1201 tgtagcgatc gcccaagccg aggccgagcg ccggattcag gatgcgttga cgcggcgcga 1261 agcggtggtg gccgaagctg aagcggacat tgctaccgaa gtcgctcgta gccaagcaga 1321 actccctgtg cagcaggagc ggatcaaaca ggtgcagcag caacttcaag ccgatgtgat 1381 cgccccagct gaggcagctt gtaaacgggc gatcgcggaa gcgcgggggg ccgccgcccg 1441 tatcgtcgaa gatggaaaag ctcaagcgga agggacccaa cggctggcgg aggcttggca 1501 gaccgctggt gctaatgccc gcgacatctt cctgctccag aagtctagac cagccaggac 1561 agaaatgcct cgacttcgct gctacccaag gttgccgggt gacgcacacc gtggaaacgg 1621 atgaaggcac gaacccagtg gacataagcc tgttcggttc gtaagctgta atgcaagtag 1681 cgtatgcgct cacgcaactg gtccagaacc ttgaccgaac gcagcggtgg taacggcgca 1741 gtggcggttt tcatggcttg ttatgactgt ttttttgggg tacagtctat gcctcgggca 1801 tccaagcagc aagcgcgtta cgccgtgggt cgatgtttga tgttatggag cagcaacgat 1861 gttacgcagc agggcagtcg ccctaaaaca aagttaaaca ttatgaggga agcggtgatc 1921 gccgaagtat cgactcaact atcagaggta gttggcgtca tcgagcgcca tctcgaaccg 1981 acgttgctgg ccgtacattt gtacggctcc gcagtggatg gcggcctgaa gccacacagt 2041 gatattgatt tgctggttac ggtgaccgta aggcttgatg aaacaacgcg gcgagctttg 2101 atcaacgacc ttttggaaac ttcggcttcc cctggagaga gcgagattct ccgcgctgta 2161 gaagtcacca ttgttgtgca cgacgacatc attccgtggc gttatccagc taagcgcgaa 2221 ctgcaatttg gagaatggca gcgcaatgac attcttgctg gtatcttcga gccagccacg 2281 atcgacattg atctggctat cttgctgaca aaagcaagag aacatagcgt tgccttggta 2341 ggtccagcgg cggaggaact ctttgatccg gttcctgaac aggatctatt tgaggcgcta 2401 aatgaaacct taacgctatg gaactcgccg cccgactggg ctggcgatga gcgaaatgta 2461 gtgcttacgt tgtcccgcat ttggtacagc gcagtaaccg gcaaaatcgc gccgaaggat 2521 gtcgctgccg actgggcaat ggagcgcctg ccggcccagt atcagcccgt catacttgaa 2581 gctagacagg cttatcttgg acaagaagaa gatcgcttgg cctcgcgcgc agatcagttg 2641 gaagaatttg tccactacgt gaaaggcgag atcaccaagg tagtcggcaa ataacccatg 2701 catgctcact cattaggcac cccaggcttt acactttatg cttccggctc gtatgttgtg 2761 tggaattgtg agcggataac aatttcacac aggaaacagc tatgaccatg attacgccaa 2821 gcgcgcaatt aaccctcact aaagggaaca aaagctgggt accgggcccc ccctcgaggt 2881 cgacggtatc gataagcttg atatcgaatt cctgcagccc ggggatcctc tagagtcgac 2941 taggaggaat ataaaatgaa aaattgtgtc atcgtcagtg cggtacgtac tgctatcggt 3001 agttttaacg gttcactcgc ttccaccagc gccatcgacc tgggggcgac agtaattaaa 3061 gccgccattg aacgtgcaaa aatcgattca caacacgttg atgaagtgat tatgggtaac 3121 gtgttacaag ccgggctggg gcaaaatccg gcgcgtcagg cactgttaaa aagcgggctg 3181 gcagaaacgg tgtgcggatt cacggtcaat aaagtatgtg gttcgggtct taaaagtgtg 3241 gcgcttgccg cccaggccat tcaggcaggt caggcgcaga gcattgtggc ggggggtatg 3301 gaaaatatga gtttagcccc ctacttactc gatgcaaaag cacgctctgg ttatcgtctt 3361 ggagacggac aggtttatga cgtaatcctg cgcgatggcc tgatgtgcgc cacccatggt 3421 tatcatatgg ggattaccgc cgaaaacgtg gctaaagagt acggaattac ccgtgaaatg 3481 caggatgaac tggcgctaca ttcacagcgt aaagcggcag ccgcaattga gtccggtgct
3541 tttacagccg aaatcgtccc ggtaaatgtt gtcactcgaa agaaaacctt cgtcttcagt 3601 caagacgaat tcccgaaagc gaattcaacg gctgaagcgt taggtgcatt gcgcccggcc 3661 ttcgataaag caggaacagt caccgctggg aacgcgtctg gtattaacga cggtgctgcc 3721 gctctggtga ttatggaaga atctgcggcg ctggcagcag gccttacccc cctggctcgc 3781 attaaaagtt atgccagcgg tggcgtgccc cccgcattga tgggtatggg gccagtacct 3841 gccacgcaaa aagcgttaca actggcgggg ctgcaactgg cggatattga tctcattgag 3901 gctaatgaag catttgctgc acagttcctt gccgttggga aaaacctggg ctttgattct 3961 gagaaagtga atgtcaacgg cggggccatc gcgctcgggc atcctatcgg tgccagtggt 4021 gctcgtattc tggtcacact attacatgcc atgcaggcac gcgataaaac gctggggctg 4081 gcaacactgt gcattggcgg cggtcaggga attgcgatgg tgattgaacg gttgaattaa 4141 ggaggacagc taaatgaaac tctcaactaa actttgttgg tgtggtatta aaggaagact 4201 taggccgcaa aagcaacaac aattacacaa tacaaacttg caaatgactg aactaaaaaa 4261 acaaaagacc gctgaacaaa aaaccagacc tcaaaatgtc ggtattaaag gtatccaaat 4321 ttacatccca actcaatgtg tcaaccaatc tgagctagag aaatttgatg gcgtttctca 4381 aggtaaatac acaattggtc tgggccaaac caacatgtct tttgtcaatg acagagaaga 4441 tatctactcg atgtccctaa ctgttttgtc taagttgatc aagagttaca acatcgacac 4501 caacaaaatt ggtagattag aagtcggtac tgaaactctg attgacaagt ccaagtctgt 4561 caagtctgtc ttgatgcaat tgtttggtga aaacactgac gtcgaaggta ttgacacgct 4621 taatgcctgt tacggtggta ccaacgcgtt gttcaactct ttgaactgga ttgaatctaa 4681 cgcatgggat ggtagagacg ccattgtagt ttgcggtgat attgccatct acgataaggg 4741 tgccgcaaga ccaaccggtg gtgccggtac tgttgctatg tggatcggtc ctgatgctcc 4801 aattgtattt gactctgtaa gagcttctta catggaacac gcctacgatt tttacaagcc 4861 agatttcacc agcgaatatc cttacgtcga tggtcatttt tcattaactt gttacgtcaa 4921 ggctcttgat caagtttaca agagttattc caagaaggct atttctaaag ggttggttag 4981 cgatcccgct ggttcggatg ctttgaacgt tttgaaatat ttcgactaca acgttttcca 5041 tgttccaacc tgtaaattgg tcacaaaatc atacggtaga ttactatata acgatttcag 5101 agccaatcct caattgttcc cagaagttga cgccgaatta gctactcgcg attatgacga 5161 atctttaacc gataagaaca ttgaaaaaac ttttgttaat gttgctaagc cattccacaa 5221 agagagagtt gcccaatctt tgattgttcc aacaaacaca ggtaacatgt acaccgcatc 5281 tgtttatgcc gcctttgcat ctctattaaa ctatgttgga tctgacgact tacaaggcaa 5341 gcgtgttggt ttattttctt acggttccgg tttagctgca tctctatatt cttgcaaaat 5401 tgttggtgac gtccaacata ttatcaagga attagatatt actaacaaat tagccaagag 5461 aatcaccgaa actccaaagg attacgaagc tgccatcgaa ttgagagaaa atgcccattt 5521 gaagaagaac ttcaaacctc aaggttccat tgagcatttg caaagtggtg tttactactt 5581 gaccaacatc gatgacaaat ttagaagatc ttacgatgtt aaaaaataaa ttcaggaaac 5641 agaccatgtc catgcaaagt ttagataaga attttcgaca tttatctcgt aaagaaaagt 5701 tacaacaatt ggttgataag caatggttat cagaagaaca attcgacatt ttactgaatc 5761 atccattaat cgatgaagaa gtagccaata gtttaattga aaatgtcatc gcgcaaggtg 5821 cattacccgt tggattatta ccgaatatca ttgtggacga taaggcatat gttgtaccta 5881 tgatggtgga agagccttca gttgtcgctg cagctagtta tggtgcaaag ctagtgaatc 5941 agactggcgg atttaaaacg gtatcttctg aacgtattat gataggtcaa atcgtctttg 6001 atggcgttga cgatactgaa aaattatcag cagacattaa agctttagaa aagcaaattc 6061 ataaaattgc ggatgaggca tatccttcta ttaaagcgcg tggtggtggt taccaacgta 6121 tagcgattga tacatttcct gagcaacagt tactatcttt aaaagtattt gttgatacga 6181 aagatgctat gggcgctaat atgcttaata cgattttaga ggccataact gcatttttaa 6241 aaaatgaatt tccgcaaagc gacattttaa tgagtatttt atccaatcat gcaacagcgt 6301 ccgttgttaa agttcaaggc gaaattgatg ttaaagattt agcaaggggc gagagaactg 6361 gagaagaggt tgccaaacga atggaacgtg cttctgtatt ggcccaagta gatattcatc 6421 gtgcagcaac acataataaa ggtgttatga atggcataca tgctgttgtt ttagcaacag 6481 gaaatgatac gcgtggtgca gaagcaagtg cgcatgcata cgcgagtcgt gacggacagt 6541 atcgtggtat tgctacatgg cgttacgatc aagatcgtca acgattgatt ggtacaattg 6601 aagtgcctat gacattggca atcgttggcg gtggtacaaa agtattacca attgctaaag 6661 cttcattaga gctactaaat gtagagtcag cacaagaatt aggtcatgta gttgctgccg 6721 ttggtttagc gcaaaacttt gcagcatgtc gcgcgcttgt gtcagaaggt attcaacaag 6781 gtcatatgag tttacaatat aaatcattag ctatcgttgt aggggcaaaa ggtgatgaaa 6841 ttgctaaagt agctgaagct ttgaaaaaag aaccccgtgc aaatacacaa gcagcggaac 6901 atattttaca agaaattaga caacaataat tacctgcagg catgcaagct tggctgtttt 6961 ggcggatgag agaagatttt cagcctgata cagattaaat cagaacgcag aagcggtctg 7021 ataaaacaga atttgcctgg cggcagtagc gcggtggtcc cacctgaccc catgccgaac 7081 tcagaagtga aacgccgtag cgccgatggt agtgtggggt ctccccatgc gagagtaggg 7141 aactgccagg catcaaataa aacgaaaggc tcagtcgaaa gactgggcct ttcgttttat 7201 ctgttgtttg tcggtgaacg ctctcctgag taggacaaat ccgccgggag cggatttgaa 7261 cgttgcgaag caacggcccg gagggtggcg ggcaggacgc ccgccataaa ctgccaggca 7321 tcaaattaag cagaaggcca tcctgacgga tggccttttt gcgtttctac aaactctttt 7381 gtttattttt ctaaatacat tcaaatatgt atccgctcat gacctaggtc tcgagtccct 7441 gctcgtcacg ctttcaggca ccgtgccaga tatcgacgtg gagtcgatca ctgtgattgg 7501 cgaaggggaa ggcagcgcta cccaaatcgc tagcttgctg gagaagctga aacaaaccac 7561 gggcattgat ctggcgaaat ccctaccggg tcaatccgac tcgcccgctg cgaagtccta 7621 agagatagcg atgtgaccgc gatcgcttgt caagaatccc agtgatcccg aaccatagga 7681 aggcaagctc aatgcttgcc tcgtcttgag gactatctag atgtctgtgg aacgcacatt 7741 tattgccatc aagcccgatg gcgttcagcg gggtttggtc ggtacgatca tcggccgctt 7801 tgagcaaaaa ggcttcaaac tggtgggcct aaagcagctg aagcccagtc gcgagctggc 7861 cgaacagcac tatgctgtcc accgcgagcg ccccttcttc aatggcctcg tcgagttcat 7921 cacctctggg ccgatcgtgg cgatcgtctt ggaaggcgaa ggcgttgtgg cggctgctcg 7981 caagttgatc ggcgctacca atccgctgac ggcagaaccg ggcaccatcc gtggtgattt 8041 tggtgtcaat attggccgca acatcatcca tggctcggat gcaatcgaaa cagcacaaca 8101 ggaaattgct ctctggttta gcccagcaga gctaagtgat tggaccccca cgattcaacc 8161 ctggctgtac gaataaggtc tgcattcctt cagagagaca ttgccatgcc g //


![Metabolic Flux Analysis of Plastidic Isoprenoid ... · Metabolic Flux Analysis of Plastidic Isoprenoid Biosynthesis in Poplar Leaves Emitting and Nonemitting Isoprene1[W] Andrea Ghirardo,](https://img.dokumen.tips/doc/110x75/5eba3d05e80e91171e460648/metabolic-flux-analysis-of-plastidic-isoprenoid-metabolic-flux-analysis-of-plastidic.jpg)