Embed Size (px)
Citation preview

BIOANALYTICAL METHOD DEVELOPMENT AND VALIDATION
FOR THE ESTIMATION OF ESCITALOPRAM OXALATE IN
HUMAN PLASMA BY USING RP-HPLC METHOD
Dissertation Submitted to
The Tamil Nadu Dr. M.G.R. Medical University, Chennai
In partial fulfillment for the requirement of the Degree of
MASTER OF PHARMACY
(Pharmaceutical Analysis)
OCTOBER-2016
DEPARTMENT OF PHARMACEUTICAL ANALYSIS
KMCH COLLEGE OF PHARMACY,
KOVAI ESTATE, KALAPATTI ROAD,
COIMBATORE-641048.
BIOANALYTICAL METHOD DEVELOPMENT AND VALIDATION FOR
THE ESTIMATION OF ESCITALOPRAM OXALATE IN HUMAN PLASMA
BY USING RP-HPLC METHOD
Dissertation Submitted to
The Tamil Nadu Dr. M.G.R. Medical University, Chennai
In partial fulfillment for the requirement of the Degree of
MASTER OF PHARMACY(Pharmaceutical Analysis)
OCTOBER-2016
Submitted by
(REG. NO. 261430753)
DEPARTMENT OF PHARMACEUTICAL ANALYSIS
KMCH COLLEGE OF PHARMACY,
KOVAI ESTATE, KALAPATTI ROAD,
COIMBATORE-641048

CERT IFICAT ES

Prof. Dr. A.Rajasekaran, M. Pharm., Ph.D.,
Principal,
KMCH College of Pharmacy,
Kovai Estate, Kalapatti Road,
Coimbatore - 641 048.
Tamil Nadu
CERTIFICATE
This is to certify that the dissertation work entitled” BIOANALYTICAL
METHOD DEVELOPMENT AND VALIDATION FOR THE ESTIMATION OF
ESCITALOPRAM OXALATE IN HUMAN PLASMA BY USING RP-HPLC ” is a
bonafide work carried out by Reg. No: 261430753, student in Master of Pharmacy ,
Department of Pharmaceutical Analysis, KMCH College of Pharmacy, Coimbatore,
Tamil Nadu, during the academic year 2015-2016.
Date: Dr. A. RAJASEKARAN, M.Pharm., Ph.d.,
Place: Coimbatore Principal

GUIDE,
Dept. of Pharmaceutical analysis,
KMCH College of Pharmacy,
Kovai Estate, Kalapatti Road,
Coimbatore -641 048.
Tamil Nadu
CERTIFICATE
This is to certify that the dissertation work entitled” BIOANALYTICAL
METHOD DEVELOPMENT AND VALIDATION FOR THE ESTIMATION OF
ESCITALOPRAM OXALATE IN HUMAN PLASMA BY USING RP-HPLC ” is
a bonafide work carried out by Reg. No: 261430753, student in Master of Pharmacy at
Department of Pharmaceutical Analysis, KMCH College of Pharmacy, Coimbatore,
Tamil Nadu, under my supervision and guidance during the academic year 2015-2016.
Date : Signature of the Guide
Place: Coimbatore

DECLARATION
I do here by declare that to the best of my knowledge and belief ,the dissertation
work entitled BIOANALYTICAL METHOD DEVELOPMENT AND “
VALIDATION FOR THE ESTIMATION OF ESCITALOPRAM OXALATE IN
HUMAN PLASMA BY USING RP- submitted to the Tamil Nadu Dr. M.G.R.
Medical university , Chennai, Master of
in Pharmaceutical Analysis, was carried out at Department of
Pharmaceutical Analysis, KMCH College of Pharmacy, Coimbatore during the
academic year 2015-2016 .
Date:
Place: Coimbatore (Reg. No.261430753)

EVALUATION CERTIFICATE
This is to certify that the work embodied in the dissertation work entitled
“
THE ESTIMATION OF ESCITALOPRAM OXALATE IN HUMAN PLASMA
BY USING RP- Reg. to the Tamil Nadu
Dr. M.G.R. Medical university , Chennai, in the partial fulfillment for the Degree
is a bonafide research work
carried out by the candidate at Department of Pharmaceutical Analysis, KMCH
College of Pharmacy, Coimbatore during the academic year 2015-2016.
K.M.C.H College of Pharmacy, Coimbatore
Date:
Internal Examiner External Examiner
Convener of Examination

Dedicated to AlmightyMy Parents, My Dear Sister
& Friends

ACKNOWLEDGEMENT
It is the grace and blessing of God the Almighty that strengthen and guided
me throughout the task, that I was able to complete my investigational study
successfully. It would be incomplete without mentioning the name of people who
made it possible with their support, ideas, encouragement and immense help directly
or indirectly.
It gives a great pleasure to acknowledge my immense respect and deep sense
of gratitude to my esteemed guide Prof. J. Dharuman, M.Pharm., Department of
Pharmaceutical Analysis, KMCH College of Pharmacy, Coimbatore, who has been a
constant source of encouragement and for his timely advice, guidance, help, dedicated
support and intellectual supervision throughout the work.
I would like to express my gratitude to Dr.Nalla G. Palani swami,
Chairman and Dr. Thavamani D. Palani swami, Managing Trustee for providing
me with sufficient facilities to complete my project work successfully.
It’s my privilege to thank and owe great respect to Dr. A.Rajasekaran,
M.Pharm, Ph.D., Principal, K.M.C.H College of Pharmacy for his valuable
suggestions and support throughout my work. I extent my heartfelt thanks to my
beloved staffs Dr.K.Suresh Kumar, M.Pharm, Ph.D and Mr. I. Ponnilavarasan,
M.Pharm and Dr. K. T. Manisenthil Kumar M. Pharm, Ph.D., HOD, Department
of pharmacology, for their invaluable support and encouragement in completing my
project successfully.
My special thanks to Mrs.Tamilselvi N, M.Pharm, for her unparalleled
guidance, determined support, keen interest and co-operation throughout the work to
make it into completion.
I am thankful to lab technicians Mrs. Anandhi, and Mrs. Sudha,, Chemical
store in-charge, computer lab technicians, library staff and all those who have co-
operated with me during my project work.

It was a pleasure to share my master studies and life with wonderful people.
I am greatly indebted to all of my batch mates - PINK PANTHERS, Jopson,
Manimaran , Aaron, Jeny, Sangeetha, Gibi and Kanchana.
Sometimes the most ordinary things could be made extra ordinary, simply by
doing it with the right people. My heartfelt love and wishes for my dearest friends,
Aswathi, Divya, Nisha, Revathy, Sreekala and Swathi, who have been always
participating with my happiness, my problems and disappointments and rebuilding
my confidence at appropriate stages.
It gives me immense pleasure to express my heartfelt gratitude and love to my
dear most seniors Blessymol Baby, Linda Mathew and Dinimol V.S, for the advice,
affection and encouragement throughout this journey.
A journey is easier when you travel together. My heartfelt love and wishes to
my dearest junior Alga Antony, for your support, and encouragement in the
successful completion of the project.
Whether it is the way you comforted me when I was down or the way your
talks magically wiped out my frowns, you have been there day after day to make sure
my life turned out this way. I express my whole hearted gratitude to my Father,
Mother and my Sister for being so supportive.
Last but not the least; I would like to thank everyone who was important for
the successful completion of this thesis.
DEEPTHI VISAKH
(Reg. No. 261430753)

ABBREVATIONS
HPLC High Performance Liquid Chromatography
UV Ultra violet
BA Bioavailability
MW. Molecular weight
e.g. Example
i.e. That is
% Percentage
PDA Photo Diode Array
IS Internal Standard
ACN Acetonitrile
MET Methanol
RF Response Factor
mg Milligram
mL Milliliter
mM Milli molar
µg Microgram
w/w Weight by weight
v/v Volume by volume
µg/ml Microgram per milliliter
ng /ml Nanogram per milliliter
pH Hydrogen ion concentration
0C Degree centigrade
T Time

Abs. Absorbance
Conc. Concentration
Fig. Figure
Tab. Table
M.P. Melting Point
AUC Area under curve
CV Coefficient of variance
RSD Relative standard deviation
L/h Liter per hour
L/kg Liter per kilogram
Rpm Rotation per minute
SP Stationary Phase
MP Mobile Phase
λ max Wavelength maxima
Rt Retention time
SPE Solid Phase Extraction

LIST OF TABLES
Table no:
Particulars Page No
1 Commonly used solvents in solid phase extraction 12
2 Method validation requirements for example (ICH) 28
3 System suitability parameters and recommendations 29
4 System suitability parameters and recommendations 52
5 Retention time of escitalopram oxalate and tinidazole (IS) 60
6 Recovery study of escitalopram oxalate 61
7 Accuracy and precision studies of escitalopram oxalate
(Intraday)
63
8 Accuracy and precision studies of escitalopram oxalate
(Interday)
64
9 Calibration standards peak area 65
10 Recovery studies of escitalopram oxalate 72
11 Ruggedness studies for escitalopram oxalate 73
12 System suitability studies 76

LIST OF FIGURES
FIGURE NO:
PARTICULARS PAGE NO:
1 Schematic diagram of protein precipitation technique 5
2 Schematic representation of LLE process 7
3 Solid phase extraction separation process 9
4 Schematic diagram of HPLC Chromatograph 17
5 Molecular structure of escitalopram oxalate 36
6 Overlay spectrum of escitalopram oxalate 53
7 Chromatogram of escitalopram oxalate 55
8 Chromatogram of escitalopram oxalate 56
9 Chromatogram of escitalopram oxalate 57
10 Chromatogram of both internal standard and
escitalopram
58
11 Typical chromatogram obtained for the tinidazole and
escitalopram oxalate
59
12 Chromatogram of blank plasma 60
13 Chromatogram of escitalopram oxalate and internal
standard without SPE
62
14 Calibration curve for escitalopram oxalate 66
15 Chromatogram of IS and Escitalopram oxalate in human
plasma 100ng/ml
67
16 Chromatogram of IS and Escitalopram oxalate in human
plasma 200ng/ml
68
17 Chromatogram of IS and Escitalopram oxalate in human
plasma 400ng/ml
69
18 Chromatogram of IS and Escitalopram oxalate in human
plasma 600ng/ml
70
19 Chromatogram of IS and Escitalopram oxalate in human
plasma 800ng/ml
71
20 Peak profile of standard escitalopram oxalate 74
21 Peak profile of escitalopram oxalate in human plasma 74
22 Purity profile of Escitalopram oxalate 75
23 Purity profile of Escitalopram oxalate in human plasma 75

CONTENTS
Slno: TOPIC Page No.
1 INTRODUCTION 1
2 REVIEW OF LITERATURE 31
3 DRUG PROFILE 36
4 AIM AND OBJECTIVE 40
5 PLAN OF WORK 41
6 METHODOLOGY 42
7 RESULTS AND DISCUSSION 53
8 SUMMARY AND CONCLUSION 77
9 BIBLIOGRAPHY 79

ABSTRACT
A simple, precise, accurate, rapid and sensitive reverse –phase High Performance
Liquid Chromatography method for the estimation of Escitalopram oxalate in human
plasma was developed and validated. Sample preparation was carried out using solid
phase extraction (SPE) method. The separation of Escitalopram in biological fluid
with the internal standard Tinidazole was achieved by Enable C18 column using 0.2%
ortho phosphoric acid and acetonitrile in the ratio of 65:35%v/v as mobile phase at a
flow rate of 1.0ml/min at ambient temperature. Detection was carried out at 240nm.
The retention time of internal standard and Escitalopram was found to be 4.7 and
10.5 min respectively. The standard curve was linear (R2 >0.995) over the
concentration range of 100-800 ng/ml. All the analytical validation parameters were
determined as per ICH guidelines. The bioanalytical method developed was
selective, robust and reliable as accuracy, precision, recovery and other validation
parameters were within the limits as specified by the guidelines. The peaks obtained
for the drug of interest and internal standard were well resolved from each other
without any plasma interferences and the peaks were symmetrical in nature with
acceptable tailing factor. The method can be very useful for the therapeutic drug
monitoring (TDM), in bioequivalence studies, for pharmacokinetics study and also
in toxicology and biomedical investigations.
Key words: RP-HPLC, Escitalopram oxalate, Solid phase extraction, Human plasma

Department of Pharmaceutical Analysis Introduction
K.M.C.H College of Pharmacy Page 1
INTRODUCTION
BIOANALYSIS [1-3]
Bioanalysis is the method used to determine the concentration of drugs, their
metabolites and / or endogenous substances in the biological matrices such as blood plasma,
serum, cerebrospinal fluid, urine and saliva. Bioanalytical methods are widely used to
quantitative drugs and their metabolites in the physiological matrices and the methods could be
applied to studies in areas of human clinical pharmacology and non human pharmacology /
toxicology. Bioanalytical method employed for the quantitative determination of drugs and their
metabolites in biological fluids plays a significant role in the evaluation and interpretation of
bioequivalence, pharmacokinetics and toxic kinetic studies. It helps in carrying studies like
pharmacodynamics, toxicology, pharmacokinetics, bioequivalence, therapeutic drug monitoring
(TDM) and clinical studies. Initial stages these studies are done only to find out over dosage
conditions and in toxicological studies. When concentration of drug in biological matrix is
known, then pharmacokinetic parameters are calculated from that. Bioanalytical studies are
important in drug discovery and development. So these studies are performed carefully.
Therapeutic efficacy of the particular drug can be known by bioanalysis. In pharma field
bioanalysis plays a significant role .Bioanalysis involves the following steps.
v Selection and collection of biological fluid.
v Preparation of sample –Analyte extraction from biological matrix.
v Analyte detection done by various methods.
ANALYSIS OF DRUG IN VARIOUS BIOLOGICAL MEDIA [4, 5]
The most common samples obtained for biopharmaceutical analysis are blood, urine, and
feces, especially if the drug or metabolite is poorly absorbed or extensively excreted in the bile.
Other media that can be utilized includes saliva, breath and tissue.
The choice of sampling media is determined largely by the nature of used in the study.
For example, drug levels in a clinical pharmacokinetic study demand the use of blood, urine, and
saliva. A bioavailability study may require drug level data in blood and / or urine whereas a drug
identification or drug abuse problem may be solved with only one type of biological sample.

Department of Pharmaceutical Analysis Introduction
K.M.C.H College of Pharmacy Page 2
Detection of drug or its metabolite in biological media is usually complicated by the
matrix. Because of this, various types of cleanup procedures involved i.e. solvent extraction and
chromatography are employed to effectively separate drug components form endogenous
biological materials. The sensitivity and selectivity of the assay method was limited by the
efficiency of the clean up methodology.
If the blood is allowed to clot and is then centrifuged, about 30 to 50% of the original
volume is collected as serum (upper level). Plasma generally is preferred because of its greater
yield from blood. Blood, serum or plasma samples can be utilized for bioanalytical studies and
may require protein denaturation steps before further processes.
If plasma or serum is used for the analytical procedure, the fresh whole blood should be
centrifuged immediately at 5000 rpm for approximately 5 to 10 min, and the supernatant should
be transferred by means of a suitable device, such as pasture pipette, to a clean container of
appropriate size of storage.
Urine is the easiest one to obtain from the patient and also permits collection of large and
frequently more concentrated samples. The lack of protein in a healthy individual’s urine
obviates the need for denaturation steps, because urine samples are readily obtained and often
provide the greatest source of metabolites, they are frequently analyzed in drug metabolism
studies.
PREPARATION AND PRESERVATION OF BIOLOGICAL SAMPLES
Sample preparation is important step for analysis of drugs and metabolites in
bioanalytical study. Biological samples contain proteins, various endogenous and exogenous
substances that may interfere with analyte. The objective of sample preparation is to free analyte
of interest from all possible unwanted substances without significant loss of analyte. When drugs
are susceptible to plasma esterase, the addition of esterase inhibitors, such as sodium fluoride
was immediately added after collection helps to prevent decomposition.
When collecting and storing biological samples, there are chances for the analyte to get
contaminated with storage vessels , For example, plastic containers contains high boiling liquid
bis (2-ethylhexyl) phthalate; similarly, the plunger-plugs may contain tri-butoxyethyl phosphate,

Department of Pharmaceutical Analysis Introduction
K.M.C.H College of Pharmacy Page 3
which can be interfere with certain drug analysis. Hence care should be taken in selecting the
material of containers for sample storage and preservation.
ESTIMATION OF DRUGS BY BIOLOGICAL FLUIDS [6, 7]
The choice of sampling media is determined largely by the nature of the drug study. For
example, drug levels in a clinical pharmacokinetic study demand the use of blood, urine, and
possibly saliva. A bioavailability study may require drug level data in blood or urine. Steps
involved in the estimation of drugs in biological fluid are collection of the sample, sample
treatment and separation of the compound of interest from the matrix and analysis.
EXTRACTION PROCEDURE FOR BIOLOGICAL SAMPLE [8-10]
Sample preparation is a technique used to clean up a sample before analysis and /or to
concentrate a sample to improve its detection. When samples are biological fluids such as
plasma, serum or urine, this technique is described as bioanalytical sample preparation.
Objectives of Bio-analytical sample preparation:-
1. Removal of unwanted matrix components (primarily protein) that would interfere
with analyte determination.
2. Concentration of analyte to meet the detection limits of the analytical instrument.
3. Exchange of the solvent or solution in which the analyte resides so that it is
compatible with mobile phase for injection into a chromatographic system.
4. Dilution to reduce solvent strength or avoid solvent incompatibility.
5. Stabilization of analyte to avoid hydrolytic or enzymatic degradation.
After selection of biological fluid the required analyte should be extracted from it. This step
in bioanalytical method is more important because sample preparation can be done by different
methods of extraction .The sample preparation is a time taking process and it should be done
carefully because of its importance. If biological matrix is in liquid state like blood, plasma and
urine then liquid-liquid extraction is used or it is solid then liquid-solid extraction can be done.

Department of Pharmaceutical Analysis Introduction
K.M.C.H College of Pharmacy Page 4
Different types of extracting methods are
∑ Dilution followed by injection
∑ Solid Phase extraction (off line/online)
∑ Protein precipitation
∑ Filtration
∑ Liquid-liquid extraction
∑ Protein removal by equilibrium dialysis or ultrafiltration
∑ Restricted access media
∑ Solid-supported liquid-liquid extraction
∑ Monolithic columns
∑ Immunoaffinity extraction
Out of all these methods the most prominent and widely used techniques for extraction are:
ß Protein precipitation method.
ß Liquid-liquid extraction method.(LLE)
ß Solid-phase extraction method.(SPE)
Protein precipitation [11, 12]
Protein precipitation is based on the interaction between the precipitation reagent and
protein groups. Soluble proteins generally have a hydrophobic core surrounded by a hydrophilic
surface including ionic groups that are not involved in intra-molecular binding. Organic solvents
interfere with the intra-molecular hydrophobic interactions of proteins.
The addition of a volume of solvent (frequently acetonitrile) to the serum causes the
proteins of the serum to precipitate and leaves the analyte of interest in the solvent, which
can either be injected directly or dried down and reconstituted in a smaller volume to
concentration before injection. While this is the fastest and simplest method for sample
preparation, it is the most likely to cause ion suppression issues, especially in ESI, where the co-
elution of endogenous compounds such as lipids, phospholipids and fatty acids affect the ESI
droplet desolvation process.

Department of Pharmaceutical Analysis Introduction
K.M.C.H College of Pharmacy Page 5
Fig 1: Schematic diagram of protein precipitation technique.
Procedure
a) In case of acids: Take 0.5 to 1.0 ml of plasma/serum/urine and add 100 to 200µl of 10 to
20 % perchloric acid or trichloroacetic acid or sometimes decreasing the volume and
increasing the percentage of acid are also recommended.
b) In case of organic solvents: Take 0.5 to 1.0 ml of plasma and add 0.5 to 2.0ml of solvent
methanol or acetonitrile.
After adding the acid or solvent vortex the vial for complete precipitation of protein
then centrifuge and inject the supernatant. It is recommended to filter the sample whenever the
technique is used to avoid clogging of the column.
Liquid-Liquid Extraction [13, 14]
Liquid- liquid extraction is a common technique used to extract analytes from liquid
matrices Isolation of analyte from interferences is done by partitioning or distribution of the
sample between two immiscible liquids or phases. Typically, with LLE one phase will be
aqueous (often the denser or heavier phase) and the second phase is an organic solvent (usually
the lighter phase). Hydrophilic compounds prefer the polar aqueous phase, whereas hydrophobic
compounds will prefer the organic solvent. The two phases used in this method should be
immiscible to each other. It is very useful for separating analytes from interferences by
partitioning the sample between these two immiscible liquids or phases.
Department of Pharmaceutical Analysis Introduction
K.M.C.H College of Pharmacy Page 6
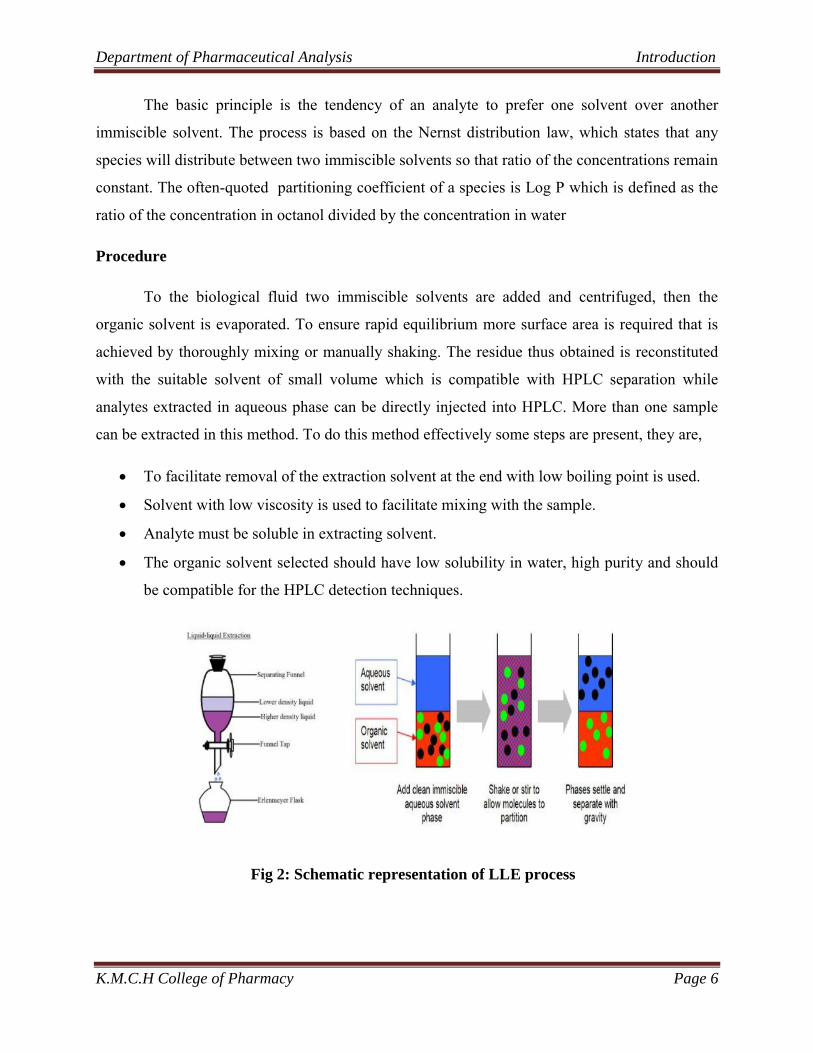
The basic principle is the tendency of an analyte to prefer one solvent over another
immiscible solvent. The process is based on the Nernst distribution law, which states that any
species will distribute between two immiscible solvents so that ratio of the concentrations remain
constant. The often-quoted partitioning coefficient of a species is Log P which is defined as the
ratio of the concentration in octanol divided by the concentration in water
Procedure
To the biological fluid two immiscible solvents are added and centrifuged, then the
organic solvent is evaporated. To ensure rapid equilibrium more surface area is required that is
achieved by thoroughly mixing or manually shaking. The residue thus obtained is reconstituted
with the suitable solvent of small volume which is compatible with HPLC separation while
analytes extracted in aqueous phase can be directly injected into HPLC. More than one sample
can be extracted in this method. To do this method effectively some steps are present, they are,
∑ To facilitate removal of the extraction solvent at the end with low boiling point is used.
∑ Solvent with low viscosity is used to facilitate mixing with the sample.
∑ Analyte must be soluble in extracting solvent.
∑ The organic solvent selected should have low solubility in water, high purity and should
be compatible for the HPLC detection techniques.
Fig 2: Schematic representation of LLE process

Department of Pharmaceutical Analysis Introduction
K.M.C.H College of Pharmacy Page 7
Solid Phase Extraction [15-19]
Solid-phase extraction (SPE) is a sample preparation process by which compounds that
are dissolved or suspended in a liquid mixture are separated from other compounds in the
mixture according to their physical and chemical properties. Solid phase extraction can be used
to isolate analytes of interest from a wide variety of biological matrices. SPE uses the affinity of
solutes dissolved or suspended in a liquid for a solid through which the sample is passed to
separate a mixture into desired and undesired components. The result is that either the desired
analytes of interest or undesired impurities in the sample are retained on the stationary phase.
The portion that passes through the stationary phase is collected or discarded, depending on
whether it contains the analytes or impurities. If the portion retained on the stationary phase
includes the desired analytes, they can then be removed from the stationary phase for collection
in an additional step, in which the stationary phase is rinsed with an appropriate eluent.
Solid–phase extraction method also contains two phases, one is solid and other is liquid phase.
In this method analyte is retained on the solid phase, while sample passes through, followed by
elution of an analyte with an suitable solvent. The solid phase used here is plastic disposable
column or cartridge which is packed with sorbent like reversed phase material (C-18silica) which
has been bonded a hydrocarbon phases. SPE involves a solid-liquid phase separation of the
analytes from the biological sample, by the selective transfer between a liquid and solid state.
The analyte is physically separated from the biological matrix by the differential interacting
with a solid phase sorbent material. These sorbents, packed primarily into either disposable
cartridges or discs, can be polar, non-polar or ionic depending on the experimental requirements.
The principle of SPE is similar to that of liquid-liquid extraction (LLE), involving a
partitioning of solutes between two phases. However, instead of two immiscible liquid phases, as
in LLE, SPE involves partitioning between a liquid (sample matrix or solvent with analytes) and
a solid (sorbent) phase. This sample treatment technique enables the concentration and
purification of analytes from solution by sorption on a solid sorbent and purification of extract
after extraction. The general procedure is to load a solution onto the SPE solid phase, wash away
undesired components, and then wash off the desired analytes with another solvent into a
collection tube.

Department of Pharmaceutical Analysis Introduction
K.M.C.H College of Pharmacy Page 8
Mechanism of Solid Phase Extraction Process
Solid phase extraction involves four distinct steps, which is as follows:
a) Conditioning of the packing
b) Loading of the sample
c) Washing the packing/ sorbent
d) Recovery of the analyte
Fig 3: Solid phase extraction separation process
a) Conditioning of the packing
Prior to the addition of the sample conditioning and packing of the cartridge is done. The
hydrophobic packing is dry initially and the ligands are all collapsed. Organic phase
extends the ligands and prepares them for interaction with the analyte.
b) Loading of the sample
A solution containing the sample, as well as, any contaminants or interfering
substances, is introduced onto the stationary phase by dissolving in a weak solvent.
This weak solvent helps in retention of strong analyte. The stationary phase will interact
with the analyte molecules, retaining them until the final elution step. As the separation
of the analytes is achieved by the selective transfer between a liquid and solid state, the analyte is

Department of Pharmaceutical Analysis Introduction
K.M.C.H College of Pharmacy Page 9
physically separated from the biological matrix by the differential interacting with a solid
phase sorbent material.
c) Washing of the packing / sorbent
Washing step aids in the removal of contaminants and interfering compounds. This step
is conducted again with the solvent composition of the sample matrix. During this step, the
analyte will be bound by the stationary phase and will not be released by the column.
d) Recovery of the analyte
An elution solvent is introduced to the column. The elution solvent will have distinctly
different properties than the solvent used for the previous three steps. For example, considering a
hydrophobic pharmaceutical compound should the sample be loaded in an aqueous plasma
solution, an organic solvent such as acetonitrile may be used to elude the compound. Strong
elution solvent is passed through the cartridge and it gives 100% collection of analyte from this
method. The eluted solution collected may be evaporated in order to control the concentration.
SOLID PHASE EXTRACTION THEORY
How compounds are retained by the sorbent
1) Reversed Phase
(Polar liquid phase, non polar modified solid phase)
Hydrophobic interactions
∑ Non polar-non polar interactions
∑ Van der Waals or dispersion forces
2) Normal Phase
(Non polar liquid phase, polar modified solid phase)
Hydrophilic interactions
∑ polar-polar interactions
∑ hydrogen bonding
∑ pi-pi interactions
∑ dipole-dipole interactions
∑ dipole-induced dipole interactions

Department of Pharmaceutical Analysis Introduction
K.M.C.H College of Pharmacy Page 10
3) Ion Exchange
Electrostatic attraction of charged group on compound to a charged group on the
sorbent’s surface
4) Adsorption (Interaction of compounds with unmodified materials)
Reversed Phase SPE
Reversed phase separations involve a polar or moderately polar sample matrix (mobile phase)
and a non polar stationary phase. The analyte of interests will be typically non polar or less polar
in nature. Several SPE materials, such as the alkyl- or aryl-bonded silicas (LC-18, ENVI-18,
LC-8, ENVI-8, LC-4, and LC-Ph) are in the reversed phase category.
Here, the hydrophilic silanol groups at the surface of the raw silica packing (60Å pore size,
40μm particle size) have been chemically modified with hydrophobic alkyl or aryl functional
groups by reaction with the corresponding silanes.
The Role of pH in solid phase extraction
Solutions used in SPE procedures have a very broad pH range. Silica-based packings,
such as those used in HPLC columns, usually have a stable pH range of 2 to 7.5. At pH levels
above and below this range, the bonded phase can be hydrolyzed and cleave off the silica
surface, or the silica itself may dissolve. In SPE, the solutions are usually in contact with the
sorbent for short periods of time and also since the SPE cartridges are disposable, and are meant
to be used only once, any pH can be used to optimize retention or elution of analytes. If stability
of the SPE cartridge at an extreme pH is crucial, then polymeric or carbon-based SPE materials
may be used as these materials are stable over the pH range of 1-14.
For reversed phase SPE procedures on bonded silicas, if trapping the analyte in the tube is
desired, the pH of the conditioning solution and sample should be adjusted for optimum analyte
retention. If the compound of interest is acidic or basic we can use a pH at which the compound
is not charged. Retention of neutral compounds is usually not affected by pH. Conversely, you

Department of Pharmaceutical Analysis Introduction
K.M.C.H College of Pharmacy Page 11
can use a pH at which the unwanted compounds in the sample are retained on the SPE packing,
but the analyte of interest passes through unretained. For adsorption media that are used under
reversed phase conditions, a pH should be chosen to maximize retention of analyte on the
sorbent as with reversed phase bonded silica. Elution is usually done with an organic solvent, so
pH is usually not a factor at this point.
Table 1 : Commonly used solvents in solid phase extraction
Analytical methods for quantitative determination of drugs in biological fluids
Numerous methods are employed for the quantitative determination of drugs in biological
fluids. According to biological fluid and drug to be quantitated these methods are selected. They
are:
a) Methods based on immunoassay procedure
¸ Radioimmunoassay (RIA).
¸ Enzyme-multiplied immunoassay technique.
¸ Enzyme-linked immunosorbent assay (ELISA).
b) Microbiological methods.
c) Capillary electrophoresis.
d) Chromatographic methods.
¸ Gas chromatography (GC).
¸ High performance liquid chromatography (HPLC).
¸ Liquid chromatography-mass spectroscopy (LC-MS).
¸ Gas chromatography –mass spectroscopy (GC-MS).

Department of Pharmaceutical Analysis Introduction
K.M.C.H College of Pharmacy Page 12
The role of chromatography in bioanalytical studies:
Liquid chromatography with UV or fluorescence detector has been used successfully for
drug discovery development and clinical trials. Compounds with low circulating levels or low
dosed compounds such as inhaled products, a method has to be developed with necessary
sensitivity could take a particular laboratory time with derivatisation schemes being required.
For shorter run times the selective ion monitoring (SIM), multiple reaction monitoring
(MRM) are used to reduce need for complete resolution of analyte in chromatographic method.
In order, to know the concentration of drug and its metabolites in biological fluids can be done
by chromatography which are useful in preclinical, clinical and drug discovery and development
process. The hyphenated techniques such as LC-MS, GC-MS are important for bioanalytical
studies. In chromatography separation of particular compound is possible and quantity of the
compound can be also known. The separation of compounds in chromatography is based on
different principles.
ESTIMATION OF DRUGS IN BIOLOGICAL SAMPLES BY HPLC: [19-22]
High performance liquid chromatography is one of important techniques in
chromatography. HPLC is an advanced form of liquid chromatography used in separating the
complex mixture of molecules encountered in chemical and biological systems. HPLC is really
the automation of traditional liquid chromatography under conditions which provides enhanced
separations during shorter periods of time. It is ideally suited for separation and identification of
amino acids, proteins, nucleic acids, hydrocarbons, carbohydrates, pharmaceuticals, pesticides,
antibiotics, steroids etc. Its simplicity high specificity and wide range of sensitivity make it ideal
for the analysis of many drugs in both dosage forms and biological fluids. HPLC is a versatile
analytical tool useful in identification and quantitative estimation of low concentration of drugs
and metabolites in biological matrices. HPLC is having many advantages most of drugs in
biological matrix can be estimated by this. Some of its advantages than other methods are:
v Rapid speed.
v Improved resolution (wide variety of stationary phase).
v Precise and reproducible.
v Easy recovery of sample, handling and maintenance.

Department of Pharmaceutical Analysis Introduction
K.M.C.H College of Pharmacy Page 13
v Greater sensitivity.
v Calculations are done by integrator itself.
v Ideal for substances of low volatility.
v Reusable column
HPLC, revealed by the late Prof. Csaba Horváth for his 1970 Pittcon paper,
originally presented the fact that high pressure was used to generate the flow required for liquid
chromatography in packed columns. In the starting, pumps only had a pressure capability of 500
psi. This is called high pressure liquid chromatography [HPLC]. The early 1970s saw a
tremendous move in technology. These new HPLC instruments could develop up to 6,000 psi
[400 bars] of pressure, incorporate improved injectors, detectors and columns. High-performance
liquid chromatography [HPLC] is now one of the most important tools in analytical chemistry. It
has the ability to separate, identify and quantitate the compounds that are present in any sample
that can be dissolved in a liquid. Today, compounds in less concentrations as low as parts per
trillion [ppt] may easily be identified. Hence HPLC can be applied to any sample, such as
pharmaceuticals, nutraceuticals, cosmetics, environmental matrices, forensic samples, industrial
chemicals.
PRINCIPLE:
The principle of separation is based on the typical modes of separation of that of a classical
chromatography i.e., Adsorption, Partition, Ion exchange and Gel permeation.
a) Adsorption chromatography
Here the separation of the components on the mixture is achieved by
adsorption which is a surface phenomenon. It involves the accumulation of the liquid or
gaseous solute on to the surface of the solid particle. The separation is based on the
affinity characters of the solutes with solid (stationary phase). Compounds having less
affinity with the stationary phase will be eluted faster while those compounds with high
affinity with the stationary phase will elute later.

Department of Pharmaceutical Analysis Introduction
K.M.C.H College of Pharmacy Page 14
b) Partition chromatography
In this method the stationary phase will be liquid coated with solid support. Here the
separation is achieved based on the relative distribution of solute between the two liquid
phases i.e., based on their partition co efficient value. This type of chromatography may be
either Normal phase or Reverse phase depending on the nature of mobile phase and
stationary phase.
c) Ion –exchange chromatography
This method involves the reversible exchange like sign ions between the stationary ion
exchange resin and liquid mobile phase. Separation is achieved due to the difference in
strength of electrostatic interactions of the solutes with the stationary phase.
d) Gel permeation chromatography
Here the mechanical sorting of molecules are based on the size of the molecules in
solution. Small molecules are able to permeate more pores and are, therefore, retained longer
than large molecules and hence large molecules are eluted first.
HPLC is historically divided into two different sub classes based on the polarity of the mobile
and stationary phases.
1. Normal phase high performance liquid chromatography
2. Reverse phase high performance liquid chromatography
ÿ Normal phase high performance liquid chromatography:
Techniques in which the stationary phase is more polar than the
mobile phase is call normal phase high performance liquid chromatography.
¸ Stationary Phase –Polar nature e.g.: SiO2, Al2O3.
¸ Mobile Phase – Non-polar nature e.g.: Heptane, hexane, cyclohexane, CHCl3, CH3OH
¸ Mechanism:
ß Polar compounds travels slower and eluted slowly due to higher affinity b/w solute and
stationary phase.

Department of Pharmaceutical Analysis Introduction
K.M.C.H College of Pharmacy Page 15
ß No polar compound travels faster and eluted first due to lower affinity b/w solute and
stationary phase.
ß This technique is not widely used in pharmaceutical separation.
ÿ Reverse phase high performance liquid chromatography:
Techniques in which the mobile phase is more polar than the stationary phase is called
reverse phase high performance liquid chromatography.
¸ Stationary phase – Non-polar nature. e.g.: n-octadecyl, n-octyl, ethyl, phenyl diol
¸ Mobile Phase – polar nature. e.g.: Methanol or Acetonitrile/water or buffers
¸ Mechanism:
ß A polar compound travels faster and eluted first due to lesser affinity b/w solute and
stationary phase.
ß Non polar compounds travel slower and eluted slowly due to higher affinity b/w solute and
stationary phase.
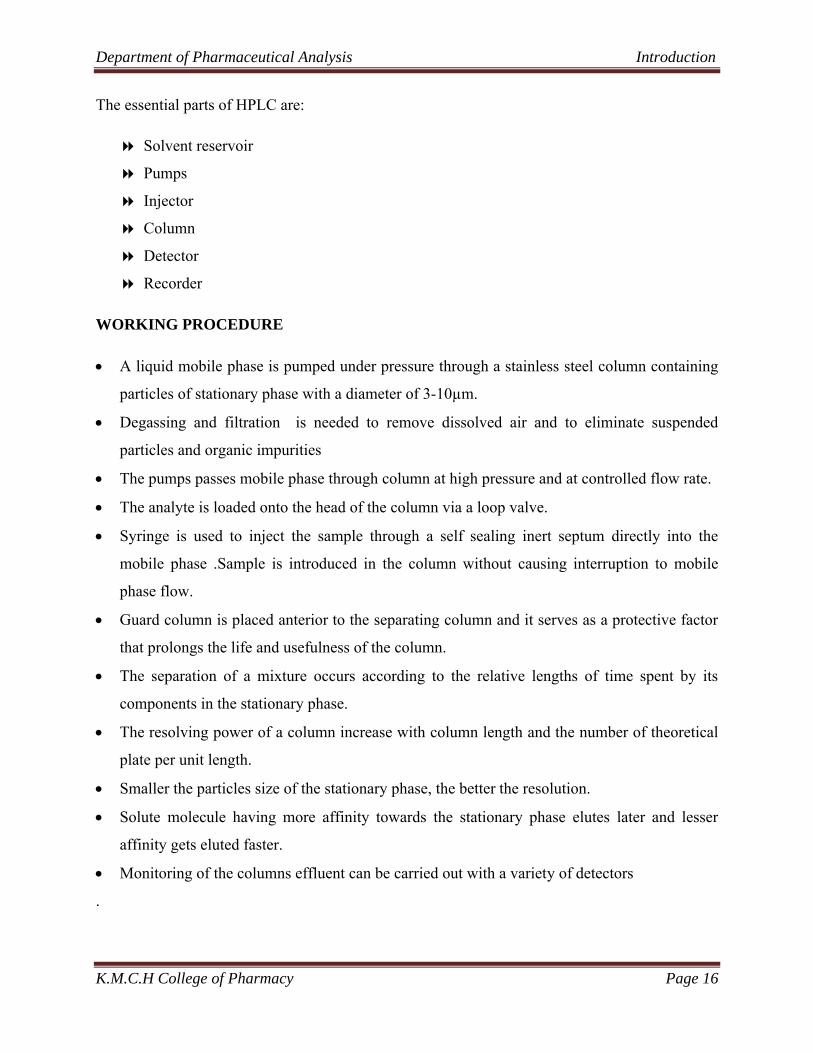
HPLC INSTRUMENTATION
Fig 4: Schematic diagram of HPLC
Department of Pharmaceutical Analysis Introduction
K.M.C.H College of Pharmacy Page 16
The essential parts of HPLC are:
8 Solvent reservoir
8 Pumps
8 Injector
8 Column
8 Detector
8 Recorder
WORKING PROCEDURE
∑ A liquid mobile phase is pumped under pressure through a stainless steel column containing
particles of stationary phase with a diameter of 3-10µm.
∑ Degassing and filtration is needed to remove dissolved air and to eliminate suspended
particles and organic impurities
∑ The pumps passes mobile phase through column at high pressure and at controlled flow rate.
∑ The analyte is loaded onto the head of the column via a loop valve.
∑ Syringe is used to inject the sample through a self sealing inert septum directly into the
mobile phase .Sample is introduced in the column without causing interruption to mobile
phase flow.
∑ Guard column is placed anterior to the separating column and it serves as a protective factor
that prolongs the life and usefulness of the column.
∑ The separation of a mixture occurs according to the relative lengths of time spent by its
components in the stationary phase.
∑ The resolving power of a column increase with column length and the number of theoretical
plate per unit length.
∑ Smaller the particles size of the stationary phase, the better the resolution.
∑ Solute molecule having more affinity towards the stationary phase elutes later and lesser
affinity gets eluted faster.
∑ Monitoring of the columns effluent can be carried out with a variety of detectors
.

Department of Pharmaceutical Analysis Introduction
K.M.C.H College of Pharmacy Page 17
Quantitative analysis by HPLC: [23- 25]
For quantitative of analysis in HPLC generally three methods are used. They are
1) External standard method.
2) Internal standard method.
3) Standard addition method.
External standard method:
In this method standard and sample peak area or height are directly compared. In external
standard method can be done by using single standard or up to three different standard solutions.
In this method standard and unknown sample are injected and then the concentration of unknown
sample can be determined by plotting calibration curve graphically or by numerically using
response factors. For good quantitation in this method constant chromatographic conditions
should be maintained for both standard and sample separation.
Internal standard method:
In this method a known quantity of a compound is added to known amount of sample to
give separate peaks, which compensates the loss of compound of interest during sample
pretreatment. In order to overcome various analytical errors addition of internal standard is
commonly is used quantitation method. The compound selected for internal standard should be
completely separate from the sample and should not interfere it. In chromatographic analysis
internal standard is added to the compound to be analyzed are desirable, if any loss of compound
may occur during handling.
In this way both internal standard and concentration of sample ratio remains constant
regardless of amount of solution lost. Any loss of compound of interest will be accompanied by
the loss of an equivalent fraction of internal standard. The internal standard selected should have
similar properties of that of the interested compound or any other compound with other
properties also can be taken. In chromatographic analysis internal standards are frequently used.

Department of Pharmaceutical Analysis Introduction
K.M.C.H College of Pharmacy Page 18
The internal standard used should be added to sample before sample preparation and mixed
properly. By using response factor (Rf) concentration of sample can be known.
Necessary of internal standard
¸ It should elute closely to the interested compound.
¸ No interferences should present in a completely resolved peak.
¸ Stable one, unreactive with compound of interest, mobile phase and column packing.
¸ Behaved equally to the compound of interest for analysis like pretreatment, derivative
formation.etc
¸ Not be present in the original ample.
¸ Available in high purity.
¸ It should be added at a concentration, which gives peak area or peak height equal or
unity with the compound of interest.
Standard addition method:
In this method for the sample solution known amount of standard is added. By plotting
calibration curve graphically the quantitative analysis is carried out. This method is used for
sample which contains which contains very small quantity of element to be analyzed. In trace
analysis also this method is used. By adding the standard to sample solution the peak area is
increased and concentration of sample will be computed by interpretation.
BIOANALYTICAL METHOD VALIDATION (BMV): [26-28]
A bioanalytical method is a set of procedures involved in the collection, processing,
storage, and analysis of a biological matrix for a chemical compound. Bioanalytical method
validation (BMV) is the process used to establish that a quantitative analytical method is suitable
for biomedical applications. Method validation includes all of the procedures that demonstrate
that a particular method used for quantitative measurement of analytes in a given biological
matrix, such as blood, plasma, serum, or urine, is reliable and reproducible for the intended use.

Department of Pharmaceutical Analysis Introduction
K.M.C.H College of Pharmacy Page 19
Validation involves documenting, through the use of specific laboratory investigations, that the
performance characteristics of the method are suitable and reliable for the intended analytical
applications.
Bioanalytical method validation is vital not only in terms of regulatory submission but
also for ensuring generation of high quality data during drug discovery and development. BMV
assures that the quantification of analyte in biological fluids is reproducible, reliable and suitable
for the application. Method validation is a process that demonstrates that the method will
successfully meet or exceed the minimum standards recommended in the Food and Drug
Administration (FDA) Guidance for accuracy, precision, selectivity, sensitivity, reproducibility,
and stability of the developed method.
Need for Bioanalytical Method Validation:
The reason for validating a bioanalytical procedure is to demonstrate the performance and
reliability of a method and hence the confidence that can be placed on the results. It is mandatory
that all bioanalytical methods must be validated if the results are used to support registration of a
new drug or the reformulation of an existing one. Validation involves documenting, through the
use of specific laboratory investigations, that the performance characteristics of the method are
suitable and reliable for the intended analytical applications.
1. It is essential to used well-characterized and fully validated bioanalytical methods to
yield reliable results that can be satisfactorily interpreted.
2. It is recognized that bioanalytical methods and techniques are constantly undergoing
changes and improvements; they are at the cutting edge of the technology.
3. It is also important to emphasize that each bioanalytical technique has its own
characteristics, which will vary from analyte to analyte, specific validation criteria may
need to be developed for each analyte.

Department of Pharmaceutical Analysis Introduction
K.M.C.H College of Pharmacy Page 20
4. Moreover, the appropriateness of the technique may also be influenced by the ultimate
objective of the study. When sample analysis for a given study is conducted at more than
one site, it is necessary to validate the bioanalytical method(s) at each site and provide
appropriate validation information for different sites to establish inter-laboratory
reliability.
Types of Bioanalytical Method Validation:
A. Full validation:
The full validation is an establishment of all validation parameters to apply to sample
analysis for the bioanalytical method for each analyte. It is important
a) When developing and implementing a bioanalytical method for the first time
b) For a new drug entity
c) When metabolites are added to an existing assay for quantification then Full
validation is done.
B. Partial validation:
These are modifications to bioanalytical methods for which Full validation is not necessary.
Modifications done for bioanalytical methods such as, small changes like change in species with
matrix(from rat plasma to mouse plasma),change in matrix with in a species(from human urine
to human plasma)change in laboratories or analysts, instruments, change in sampling process
procedures, change in analytical method like changing detector.
C. Cross validation:
In this two bioanalytical methods are compared. The “reference” method which is original
one is compared with the revised one “comparator”. This is done where two bioanalytical
methods are compared and from that same data is prepared for study. This is done in two ways.
Spiked matrix samples and subjected samples validation done at sane site or done at different
sites i.e. different laboratories or by using different techniques in same laboratory.
Department of Pharmaceutical Analysis Introduction
K.M.C.H College of Pharmacy Page 21
FDA guidelines on bioanalytical method validation: [29, 30]
For bioanalytical method validation FDA had given some guidelines. These guidelines are
given the validation performed was to be accurate. They are:
ÿ Analyte stability in biological matrix at intended storage and operating conditions should
be kept.
ÿ Standard curve for matrix-based one should contain minimum 5 standards without
including blank and it should cover the entire range of concentrations expected.
ÿ Essential parameters that are performed for acceptability of bioanalytical method are
precision, accuracy, selectivity, sensitivity and reproducibility.
ÿ Then the lower limit of quantitation should serve as lowest concentration on the standard
curve and that is not confused with limit of detection.
ÿ All these parameters are to be defined during the Full validation of a bioanalytical
method.
Validation parameters: [31-34]
The common parameters used in the bioanalytical validation is given as follows,
1. Accuracy
2. Precision
a. Repeatability
b. Intermediate Precision
c. Reproducibility
3. Linearity / Range
4. Specificity / Selectivity
5. Limit of Detection (LOD)
6. Limit of Quantification (LOQ)
7. Range
8. Robustness
9. Ruggedness.
10. System suitability
Department of Pharmaceutical Analysis Introduction
K.M.C.H College of Pharmacy Page 22
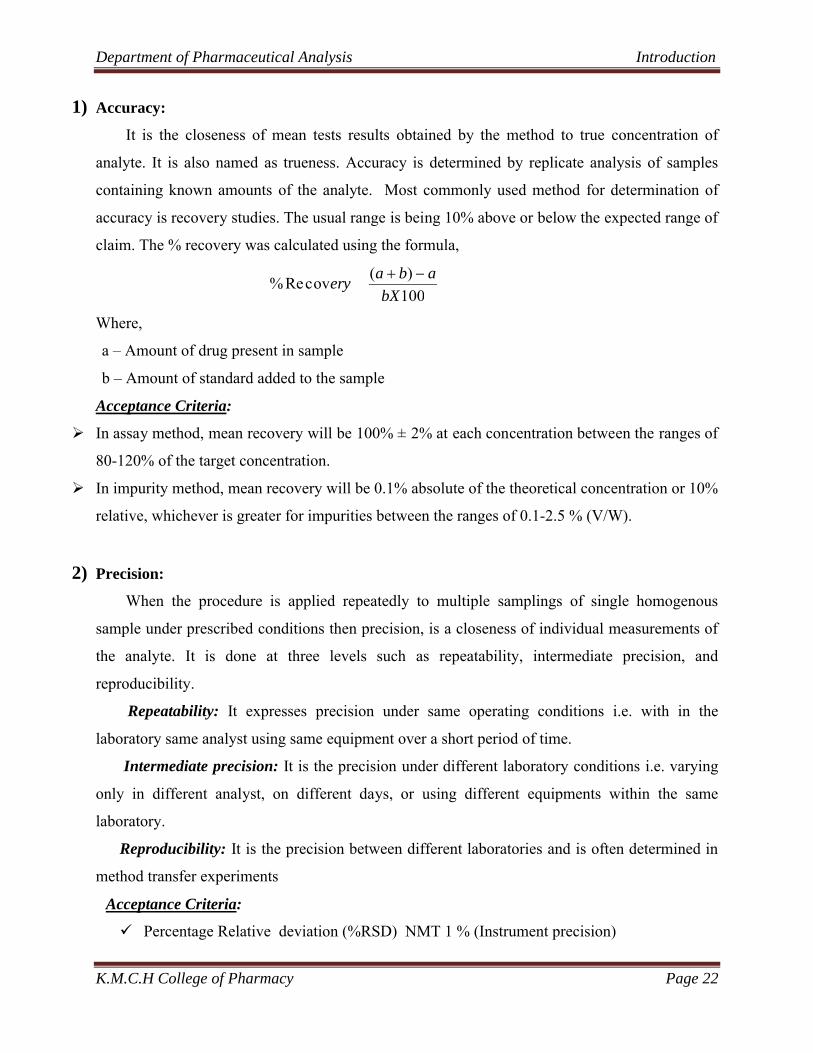
1) Accuracy:
It is the closeness of mean tests results obtained by the method to true concentration of
analyte. It is also named as trueness. Accuracy is determined by replicate analysis of samples
containing known amounts of the analyte. Most commonly used method for determination of
accuracy is recovery studies. The usual range is being 10% above or below the expected range of
claim. The % recovery was calculated using the formula,
100
)(covRe%
bX
abaery
-+
Where,
a – Amount of drug present in sample
b – Amount of standard added to the sample
Acceptance Criteria:
ÿ In assay method, mean recovery will be 100% ± 2% at each concentration between the ranges of
80-120% of the target concentration.
ÿ In impurity method, mean recovery will be 0.1% absolute of the theoretical concentration or 10%
relative, whichever is greater for impurities between the ranges of 0.1-2.5 % (V/W).
2) Precision:
When the procedure is applied repeatedly to multiple samplings of single homogenous
sample under prescribed conditions then precision, is a closeness of individual measurements of
the analyte. It is done at three levels such as repeatability, intermediate precision, and
reproducibility.
Repeatability: It expresses precision under same operating conditions i.e. with in the
laboratory same analyst using same equipment over a short period of time.
Intermediate precision: It is the precision under different laboratory conditions i.e. varying
only in different analyst, on different days, or using different equipments within the same
laboratory.
Reproducibility: It is the precision between different laboratories and is often determined in
method transfer experiments
Acceptance Criteria:
¸ Percentage Relative deviation (%RSD) NMT 1 % (Instrument precision)

Department of Pharmaceutical Analysis Introduction
K.M.C.H College of Pharmacy Page 23
¸ (%RSD) NMT -2% (Intra- assay precision)
3) Linearity:
As per ICH definition “the ability to obtain test results which are directly proportional to the
concentration of an analyte within given range is known as linearity of an analytical procedure”.
By using correlation coefficient this can be tested. Using correlation coefficient is a benefit as it
is a relationship between concentration and response data. In this data is analyzed by linear least
square regression co-efficient and b of the linear equation,
Y= aX + b
By the above equation regression r value can be known. For the method to be linear the r value
should be close to1. Where Y is the measured output signal, X is the concentration of sample, a
is the slope, b is the intercept.
Acceptance criteria:
Coefficient of correlation should be NLT 0.99.
4) Specificity / selectivity:
A method is said to be specific when it produces proper response only for a single analyte. It can
be demonstrated by performing Placebo / blank interference and forced degradation studies. If
the expected impurities or related substances are available, then they should be analyzed along
with the analyte or sample to check the system suitability, retention factor, tailing factor and
resolution etc. In this peak purity studies are done for specificity.
5) Limit of detection (LOD):
The limit of detection is the lowest concentration of analyte in the sample which can be detected
but not quantified under given experimental conditions. The lowest concentration which can be
distinguished from the background noise with a certain degree of confidence is defined as limit
of detection. Prepare the blank solution as per test method and inject six times into the
chromatographic system. Similarly prepare the linearity solution staring from lowest possible
concentration of analyte to 150 % (or as per protocol) of target concentration and establish the
linearity curve.

Department of Pharmaceutical Analysis Introduction
K.M.C.H College of Pharmacy Page 24
The detection limit (DL) may be expressed as:
LOD = 3.3 X Standard deviation of the response of the blank (σ)
Slope
The slope shall be estimated from the calibration curve of the analyte.
6) Lower Limit of quantification (LLOQ):
It is also the lowest concentration of analyte in the sample but quantitatively determined with
suitable accuracy and precision.
In calibration curve it is the lowest concentration point. It is determined by accuracy by the
presence of background signal and by precision i.e. reproducibility of analyte in the method.
LOD = 10 X Standard deviation of the response of the blank (σ)
Slope
Acceptance Criteria:
ÿ In Pharmaceutical application, the LOQ is typically set at minimum 0.05% for active
pharmaceutical ingredients.
ÿ LOQ defined as the lowest concentration providing a RSD of 5%.
ÿ LOQ should be at least 10% of the minimum effective concentration for clinical applications.
7) Range:
The range of an analytical procedure is the interval between the upper and lower concentration
(amounts) of analyte in the sample (including these concentrations) for which it has been
demonstrated that the analytical procedure has a suitable level of precision, accuracy and
linearity. The range of a bioanalytical assay is the concentration interval over which an analyte
can be measured with acceptable precision and accuracy.
8) Robustness:
It is the measure of its capacity to remain unaffected by small, but deliberate variations in
method parameters and provides an indication of its reliability during normal usage.

Department of Pharmaceutical Analysis Introduction
K.M.C.H College of Pharmacy Page 25
9) Ruggedness:
Ruggedness according to the USP is “the degree of reproducibility of test results obtained by the
analysis of the same samples under a variety of normal test conditions, such as different labs,
different analysts, and different lots of reagents. The following are the typical method parameters
need to test during method validation:
ÿ Analyst-to-analyst variability.
ÿ Column-to-column variability.
ÿ On different days.
ÿ In different laboratories
Table 2: Method Validation Requirements for Example (ICH)
METHOD VALIDATION
REQUIREMENTS
ACCEPTANCE
CRITERIA
Precision
Assay repeatability
Intermediate precision (Ruggedness)
≤ 1% RSD
≤ 2% RSD
Accuracy
Mean recovery per concentration 100.0% ± 2.0%
Limit of detection
Signal to-to-noise ratio ≥ 3:1
Limit of quantification
Signal to-to-noise ratio ≥ 10:1
Linearity/Range
Correlation coefficient
y-Intercept
Visual
>0.99
± 10%
Linear
Robustness
System suitability met
Solution stability
yes
± 2% change from time zero
Specificity
Resolution from main peak >2 min. (retention time)

Department of Pharmaceutical Analysis Introduction
K.M.C.H College of Pharmacy Page 26
System suitability:
System suitability testing is an integral part of analytical procedures. System suitability
test parameters to be established for a particular procedure depend on the type of procedure
being validated. The simplest form of system suitability test involves a comparison of the
chromatogram trace with a standard trace. This allows a comparison of the peak shape, peak
width, and baseline resolution.
These are the parameters that can be calculated experimentally to provide a quantitative system
suitability test report:
∑ Number of theoretical plates (efficiency)
∑ HETP
∑ Capacity factor,
∑ Peak asymmetry factor
∑ Resolution,
∑ Tailing factor
System Suitability Parameters and Recommendations (ICH Guidelines)
Table 3: System suitability parameters and recommendations
Parameter Formula Recommendation
Theoretical Plates (N) N=5.54*(tR/W0.5)2 In general should be > 2000
HETP(H) H= L/N HETP↓ Column efficiency↑
Peak asymmetry (As) As= b/a In general it should be 1
Tailing Factor (T) T= (b+a)/2a In general it should be 1
Resolution (R)
( )21
122
WW
ttRs +
-
Rs of > 2 between the peaks of interest.

Department of Pharmaceutical Analysis Introduction
K.M.C.H College of Pharmacy Page 27
APPLICATION OF A VALIDATED BIOANALYTICAL METHOD TO ROUTINE [35]
In general, biological samples can be analyzed with a single
determination without duplicate or replicate analysis of the assay method has acceptable
variability as defined by the validation data, This is ture for procedures where precision and
accuracy variability’s routinely fall within acceptable tolerance limits.
The following recommendations should be noted in applying a bioanalytical method to routine
drug analysis:
¸ A matrix-based standard curve should consist of a minimum of five to eight standard points,
excluding blanks (either single or replicate), covering the entire range.
¸ Response Function: Typically, the same curve fitting, weighting and goodness of fit
determined during pre-study validation should be utilized for the standard curve within
study. Response function is determined by appropriate statistical tests based on the actual
standard points during each run in the validation.
¸ The QC samples should be used to accept or reject the run. These QC samples are matrix
spiked with analyte.
¸ System suitability: Based on the analyte and technique, a specific standard operating
procedure (or sample) can be identified to assure the optimum operation of the system
employed.
¸ Any required sample dilutions must utilize like matrix (e.g. human to human) obviating the
need to incorporate actual within-study dilution matrix QC samples.
¸ Repeat Analysis: It is important to establish an SOP or guideline for repeat analysis and
acceptance criteria. This SOP or guideline should explain the reasons for repeating sample
analysis.
Bioanalysis and the production of Pharmacokinetic, toxic kinetic and
metabolic data plays a fundamental role in the pharmaceutical research and development
involved in the drug discovery and development process. Therefore the data must be
produced to the acceptable scientific standards and specifications lay by the different
regulatory agencies worldwide. Bioanalytical methods must be validated to objectively
demonstrate the fitness for their intended use.
Department of Pharmaceutical Analysis Review of literature
K.M.C.H College of Pharmacy Page 31
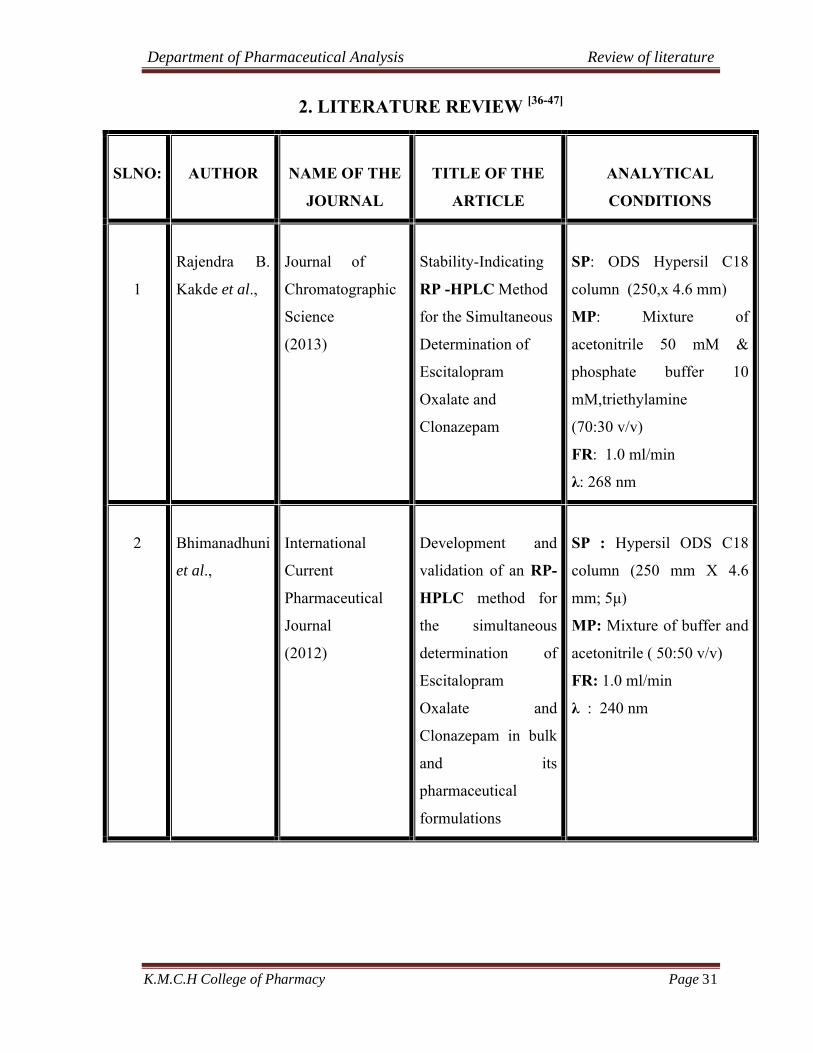
2. LITERATURE REVIEW [36-47]
SLNO: AUTHOR NAME OF THE
JOURNAL
TITLE OF THE
ARTICLE
ANALYTICAL
CONDITIONS
1
Rajendra B.
Kakde et al.,
Journal of
Chromatographic
Science
(2013)
Stability-Indicating
RP -HPLC Method
for the Simultaneous
Determination of
Escitalopram
Oxalate and
Clonazepam
SP: ODS Hypersil C18
column (250,x 4.6 mm)
MP: Mixture of
acetonitrile 50 mM &
phosphate buffer 10
mM,triethylamine
(70:30 v/v)
FR: 1.0 ml/min
λ: 268 nm
2 Bhimanadhuni
et al.,
International
Current
Pharmaceutical
Journal
(2012)
Development and
validation of an RP-
HPLC method for
the simultaneous
determination of
Escitalopram
Oxalate and
Clonazepam in bulk
and its
pharmaceutical
formulations
SP : Hypersil ODS C18
column (250 mm X 4.6
mm; 5μ)
MP: Mixture of buffer and
acetonitrile ( 50:50 v/v)
FR: 1.0 ml/min
λ : 240 nm

Department of Pharmaceutical Analysis Review of literature
K.M.C.H College of Pharmacy Page 32
3 R. D. Chakole
et al.,
International
Journal of
Phytopharmacy
(2012)
Simultaneous
estimation of
escitalopram and
clonazepam by RP-
HPLC in various
pharmaceutical
formulations
SP : C18 column ( 250 ×
4.6 mm, 5 μ)
MP: Mixture of methanol
and buffer of pH 4.0
(90:10 v/v)
FR: 1.0 ml/min
λ : 248 nm
4 Bhosale
Suryakant D
et al.,
Journal of
pharmaceutical
and biomedical
sciences
(2012)
RP-HPLC Method
for simultaneous
estimation of
Escitalopram
Oxalate and
Etizolam in a tablet
formulation
SP: HiQ-sil C18 HS
column (250 x 4.6 mm)
MP: Mixture of methanol
and phosphate buffer pH-5
(70:30,v/v)
FR: 1.0 ml/min
λ : 254 nm
5 Lasan V M
et al.,
International
Journal for
Pharmaceutical
Research Scholars
(2012)
Analytical Method
Development and
Method Validation
for Escitalopram
Oxalate in
Pharmaceutical
Dosage Forms by
HPLC Method
SP : Inertsil ODS-2 C18
column (250 x 4.6 mm, 5
μm)
MP: Mixture of potassium
dihydrogen phosphate
buffer (pH 3.8 adjusted
with OPA) and acetonitrile
and methanol
(670:280:50v/v/v)
FR: 1.0 ml/ min
λ : 238 nm

Department of Pharmaceutical Analysis Review of literature
K.M.C.H College of Pharmacy Page 33
6 Tapobana
samanta et al.,
International
journal of
chemistry research
(2011)
RP-HPLC method
for the estimation of
escitalopram in bulk
and in dosage
forms
SP : Xterra RP C18
column (150 mm ×4.6 mm,
5 μm)
MP : Mixture of
phosphate buffer pH 7.0
and an organic mixture
acetonitrile and methanol
(55: 45 v/v)
FR : 1.2ml/min
λ : 238nm
7 Carlos E.M.
de SOUSA
et al.,
Latin American
Journal of
Pharmacy
(2012)
Determination of
Escitalopram in
Human Plasma by
High
Performance Liquid
Chromatography-
Tandem Mass
Spectrometry (LC-
MS)
SP: ACE C18 Column
(125 x 4,6 mm)
MP: Mixture of
acetonitrile and 0.2 %
formic acid in water
(60:50 v/v)
Detection Method: Triple
quadrupole mass
spectrometer equipped
with an electrospray
ionization source for mass
detection

Department of Pharmaceutical Analysis Review of literature
K.M.C.H College of Pharmacy Page 34
8
Pallavi alegete
et al.,
International
journal of
pharmacy
(2016)
Simultaneous
quantification of
Risperidone and
Escitalopram oxalate
in human plasma by
LCMS/MS:
application to a
pharmacokinetic
Study
SP: x-terra RP8 column
(50 mm × 4.6, 5μm)
MP: Mixture of
acetonitrile:ammonium
acetate buffer 5 mm, pH
5.0±0.05
Detection method:
Tandem mass
spectrometric assay
9
Mahadeo V.
Mahadik
Eurasian Journal
of Analytical
Chemistry
(2007)
Application of
Stability Indicating
HPTLC Method for
the
Quantitative
Determination of
Escitalopram
Oxalate in
Pharmaceutical
Dosage Form
SP: TLC aluminium
plates precoated with
silica gel 60F-254
MP:Mixture of Toluene:
Acetone: Ethanol:
Ammonia (5:1:1:0.2 v/v)
Detection method:
analysis at 239 nm

Department of Pharmaceutical Analysis Review of literature
K.M.C.H College of Pharmacy Page 35
10 Bhumika D.
Sakhreliya et
al.,
Journal of
Pharmaceutical
Science and
Bioscientific
Research (JPSBR)
(2012)
Development and
Validation of U V
Spectrophotometric
Methods for
Simultaneous
Estimation of
Escitalopram oxalate
and Etizolam in their
Combined Tablet
Dosage Form
Solvent : 0.1 N HClMethod I :
simultaneous equation
method λmax of
Escitalopram oxalate 238.2
nm and λmax of Etizolam
251.6 nm
Method II :
Q ratio (absorbance ratio)
method 238.2 nm and
248.8 nm (isoabsorptive
point)
Method III:
absorbance correction
method absorbance
measurement at 238.2 nm
for Escitalopram oxalate
and 292.8 nm for Etizolam
11 Santhosh
D.shelke
et al.,
Journal of
Chemical and
Pharmaceutical
sciences
(2009)
Development and
validation of U V
Spectrophotmetric
method of escitalopram
oxalate in bulk and
pharmaceutical
formulations
Solvent: 0.1 N HCl
λmax :239 nm
12 Sharma S
et al.,
Journal of Young
Pharmacists
(2010)
Zero order – UV
spectrophotomteric
method for estimation
of escitalopram oxalate
in tablet formulations
Solvent : 80% v/v aqueous
methanol
λmax : 238 nm

Department of Pharmaceutical Analysis Drug Profile
K.M.C.H College Of Pharmacy Page 36
3. DRUG PROFILE [48-53]
ESCITALOPRAM OXALATE
1. Chemical profile:
Synonyms:
Escitalopram, (s) - citalopram, (+) - citalopram
Brand name:
Lexapro, Estilo, Citalex, Nexito, Etilopram
Chemical name/ IUPAC Name:
S-(+)-1-[3-(dimethyl-amino) propyl]-1-(p-fluorophenyl)-5-phthalancarbonitrile oxalate.
Molecular formula:
C20H21FN2O•C2H2O4
Molecular mass: 414.40 g/mol
Structure:
Fig 5: Molecular structure of escitalopram oxalate
.C2H2O4

Department of Pharmaceutical Analysis Drug Profile
K.M.C.H College Of Pharmacy Page 37
Pharmacokinetic data:
Bioavailability : 80% relative to an intravenous dose
Metabolism : Hepatic (N-de methylation reaction using CYP3A4 and CYP2C19
enzymes)
Protein binding : ~56%
Half life : 27-32 hours
Excretion : Renal (10%)
Routes : Oral
Description:
Escitalopram oxalate occurs as a fine, white to slightly-yellow powder and is
freely soluble in methanol and dimethyl sulfoxide (DMSO), soluble in isotonic saline
solution, sparingly soluble in water and ethanol, slightly soluble in ethyl acetate, and
insoluble in heptane .
Category:
Selective serotonin reuptake inhibitor (SSRI) which is under the category of
antidepressant drugs.
Dose:
For the treatment of depression it is basically 10-20 mg/ day and for elderly
persons it will be 5-10 mg/day. Escitalopram tablets (LEXAPRO) are film-coated, round
tablets contains escitalopram oxalate in strengths equivalent to 5 mg, 10 mg, and 20 mg
escitalopram base.

Department of Pharmaceutical Analysis Drug Profile
K.M.C.H College Of Pharmacy Page 38
Indications:
Labeled indications include major depressive disorder (MDD) and generalized
anxiety disorder (GAD). Unlabeled indications include treatment of mild dementia-
associated agitation in nonpsychotic patients
2. Pharmacological profile:
Mechanism of action:
The antidepressant, antiobsessive-compulsive, and antibulimic actions of
escitalopram are presumed to be linked to its inhibition of CNS neuronal uptake of
serotonin. Escitalopram blocks the reuptake of serotonin at the serotonin reuptake pump
of the neuronal membrane, enhancing the actions of serotonin on 5HT1A auto receptors.
Antidepressant action of escitalopram is linked to potentiation of serotonergic activity in
the central nervous system (CNS) resulting from its inhibition of CNS neuronal reuptake
of serotonin (5-HT). Escitalopram also does not bind to, or has low affinity for, various
ion channels including Na+, K+, Cl-, and Ca++ channels .Similar to other SSRIs,
Escitalopram also bind with significantly less affinity to histamine, acetylcholine, and
norepinephrine receptors than tricyclic antidepressant drugs.
Pharmacodynamics:
Escitalopram is one of a class of antidepressants known as selective serotonin
reuptake inhibitors (SSRIs). It is used to treat the depression associated with mood
disorders. It is also used on occassion in the treatment of body dysmorphic disorder and
anxiety. The antidepressant, antiobsessive-compulsive, and antibulimic actions of
escitalopram are presumed to be linked to its inhibition of CNS neuronal uptake of
serotonin. In vitro studies show that escitalopram is a potent and selective inhibitor of
neuronal serotonin reuptake and has only very weak effects on norepinephrine and
dopamine neuronal reuptake. Escitalopram has no significant affinity for adrenergic
(alpha1, alpha2, beta), cholinergic, GABA, dopaminergic, histaminergic, serotonergic
(5HT1A, 5HT1B, 5HT2), or benzodiazepine receptors; antagonism of such receptors has
been hypothesized to be associated with various anticholinergic, sedative, and

Department of Pharmaceutical Analysis Drug Profile
K.M.C.H College Of Pharmacy Page 39
cardiovascular effects for other psychotropic drugs. The chronic administration of
escitalopram was found to downregulate brain norepinephrine receptors, as has been
observed with other drugs effective in the treatment of major depressive disorder.
Escitalopram does not inhibit monoamine oxidase.
Drug interactions:
Some medicines may interact with escitalopram like, Buspirone, Fenfluramine
derivatives, anticoagulants, some diuretics, Tramadol, Carbamazepine or
Cyproheptadine etc as some has risk of seizures may be increased or some may decrease
Escitalopram's effectiveness.
Adverse reactions:
Signs of overdose include convulsions, coma, dizziness, hypotension, insomnia,
nausea, vomiting, sinus tachycardia, somnolence and ECG changes (including QT
prolongation).
Department of Pharmaceutical Analysis Aim and Objective
K.M.C.H College of pharmacy Page 40
4. AIM AND OBJECTIVE
Escitalopram is one of the novel antidepressant drugs belonging to the group
of selective serotonin reuptake inhibitors (SSRI) for the treatment of various
affective disorders.
The drug dosage is individualized by maintaining the plasma or blood drug
concentration within the targeted therapeutic window. It is important to understand
the relationship between plasma and tissue concentrations of drugs and the factors
that can cause variations in drug concentration. Therapeutic Drug Monitoring
provides an indirect measurement of drug concentration at effector sites in tissue
compartments of interest. Hence, there is a need to develop simple, rapid, reliable
and cost effective analytical method for the clinical routine drug monitoring and
pharmacokinetic study.
HPLC being a versatile analytical tool for the identification and quantitative
estimation of low concentration of drugs and metabolites in biological matrices, the
present study aims to develop
∑ A precise, accurate, rapid and sensitive analytical method for the estimation
of Escitalopram oxalate in human plasma.
∑ A simple and precise, solid phase extraction for sample preparation.

Department of Pharmaceutical Analysis Plan of Work
K.M.C.H College Of Pharmacy Page 41
5. PLAN OF WORK
HIGH PERFORMANCE LIQUID CHROMATOGRAPHIC
METHOD:
Bioanalytical method development for Escitalopram oxalate:
The present work is planned to two phases.
v PHASE I
1. Optimization of chromatographic conditions
ÿ Selection of wavelength
ÿ Selection of initial separation conditions
ÿ Selection of mobile phase ( pH, peak modifier, solvent strength,
ratio and flow rate)
ÿ Selection of the stationary phase
ÿ Selection of internal standard
ÿ Sample preparation by solid phase extraction method
ÿ Estimation of escitalopram oxalate in human plasma
v PHASE II
2. Validation of the developed method
The developed method were proposed to be validated using various
validation parameters such as,
ÿ Accuracy
ÿ Precision
ÿ Linearity
ÿ Limit of Detection (LOD)
ÿ Lower Limit of Quantitation (LLOQ)
ÿ Selectivity / Specificity
ÿ System suitability.
ÿ Ruggedness

Department of Pharmaceutical Analysis Methodology
K.M.C.H College of Pharmacy Page 42
6. METHODOLOGY
MATERIALS AND INSTRUMENTS USED:
a) Drug sample and study products:
Escitalopram oxalate and Tinidazole were procured from Aurobindo Pharma,
Hyderabad, India
Plasma: Blank plasma was collected from Hi-tech laboratory, SITRA,
Coimbatore
b) Chemicals and solvents used :
Acetonitrile (HPLC grade)
Methanol (HPLC grade)
Ortho phosphoric acid (Analytical grade)
HPLC grade water was prepared by using Millipore MilliQ water
purification system.
c) Instruments used:
Elico pH meter LI 127.
Shimadzu LC-20 AT HPLC.
SPD-M20A Prominence diode array detector.
Shimadzu 1600 LC-UV Spectrophotometer.
Sonica ultrasonic cleaner.
Solvent filtration unit – Millipore.
Shimadzu electronic balance AY 220.
Ultra cooling centrifuge – Remi, India
SPE catridge – strata TM-X (Phenomenex)

Department of Pharmaceutical Analysis Methodology
K.M.C.H College of Pharmacy Page 43
METHOD DEVELOPMENT AND OPTIMIZATION OF CHROMATOGRAPHIC CONDITIONS FOR THE ESTIMATION OF ESCITALOPRAM OXALATE
i. Selection of Wavelength:
An UV spectrum of 10 µg/ml escitalopram oxalate in methanol was recorded by
scanning in the range of 200nm to 400 nm. From the UV spectrum, wavelength of
240nm was selected as the drug showed good absorbance at this wavelength.
ii. Selection of chromatographic method :
Selection of proper chromatographic method depends on the nature of sample
properties like ionic/ ioinizable /neutral character, its molecular weight and solubility.
The drug selected for the study was polar in nature. Hence Reverse phase HPLC or ion-
pair or ion exchange chromatography must be used. The RP-HPLC method was selected
for the initial separations because of its simplicity and suitability.
iii. Initial chromatographic conditions for separation of Escitalopram oxalate:
Thousand µg/ml of escitalopram oxalate was prepared by dissolving 10 mg of
escitalopram oxalate in 10 ml of HPLC grade methanol. A gradient run was performed
for the initial separation. From this the appropriate ratio of the organic phase and the
aqueous required to elute the analyte from the column was determined. An aliquot of the
mixed standard solution containing 10 μg/ml of drug was prepared and chromatographed
using the following chromatographic conditions:
Stationary phase : C8/C18 column
Mobile phase : Solvent A – 0.2% Ortho Phosphoric Acid
Solvent B – Acetonitrile
Solvent ratio : Gradient run, 10 to 100 % solvent B
Flow rate : 0.8 to 1.5 ml/min
Sample injector : Rheodyne 7125 injector
Sample size : 20 μl
Temperature : Room temperature (25ºC)

Department of Pharmaceutical Analysis Methodology
K.M.C.H College of Pharmacy Page 44
From the above gradient run, the approximate percentage of acetonitrile in the
0.2% ortho phosphoric acid solution required to elute the drugs from the column was
determined. This ratio was used for subsequent isocratic separation and the
chromatogram was recorded.
To optimize the chromatographic conditions, the effect of chromatographic
variables such as mobile phase pH, solvent strength, flow rate, solvent ratio and the
nature of stationary phase on the peak separation were studied. The resulting
chromatograms were recorded and the chromatographic parameters such as capacity
factor, asymmetric factor, and resolution and column efficiency were calculated. The
conditions that give the best resolution, symmetry and capacity factor were selected for
the estimation.
a) Effect of pH
The standard solution was chromatographed for 20 minutes using acetonitrile or
methanol in buffer solutions of different pH ranging from 2.0-7.0 (ortho phosphoric acid
solutions and phosphate buffer of pH 2.0 and 3.0) as the mobile phase at a flow rate of
1.5 or 1 ml/min.
b) Effect of nature of stationary phase
Different reversed phase stationary phases (C8 and C18) were used and the
chromatograms were recorded. When C8 columns were used, the retention time and the
separation between the peaks were reduced. Hence C18 column is preferred.
c) Effect of solvent strength
Different mobile phases, namely, acetonitrile and methanol were used at a flow
rate of 1.5 or 1 ml/min. The ratio of acetonitrile or methanol was substituted by the other
solvents; their solvent to buffer ratios was calculated. The resulting ratios of the mobile
phase were prepared and the drugs were chromatographed.

Department of Pharmaceutical Analysis Methodology
K.M.C.H College of Pharmacy Page 45
d) Effect of ratio of the mobile phase
The standard solution was chromatographed with mobile phases of different ratios
of organic and aqueous phases at a flow rate of 1.2 and 1 ml/min.
e) Flow rate
The standard solution was chromatographed at different flow rates namely 1.2,
1.0 and 0.9 ml/min.
f) Selection of internal standard
Based upon polarity and solubility, tinidazole, ornidazole, and diclofenac sodium
were selected and chromatographed along with the standard drug. The elution time of
tinidazole was 4.7 min. The peak of tinidazole was symmetric and well resolved from the
peak of the escitalopram. Hence, for the present study tinidazole was selected as the
internal standard.
PRETREATMENT METHOD FOR BIOLOGICAL FLUID:
Method of sample preparation is an important criterion for biological samples. For
the present study plasma was obtained from HI- TECH Clinical Laboratory Services,
Coimbatore. Solid Phase Extraction (SPE) method was selected for the present study.
Preparation of Standard solutions:
Ten milligrams of standard escitalopram oxalate and internal standard were
separately dissolved in the few ml of methanol and made up the volume with methanol.
Serial dilutions were made with mobile phase to get a final concentration of 1 mg/ml.
Preparation of working standards:
From the stock solution 1 ml was taken and diluted to 10 ml(100 µg/ml), from
this solution 1 ml was further diluted to 10 ml(10µg/ml).From this 1ml was taken and
diluted to 10 ml(1µg/ml) from the resulting solution 1ml was taken and diluted to 10 ml
gives100 ng/ml solution.100, 200, 400 ,600, 800 ng/ml solutions were prepared by

Department of Pharmaceutical Analysis Methodology
K.M.C.H College of Pharmacy Page 46
diluting 1.0 ml, 2.0 ml, 4 ml, 6 ml and 8 ml respectively. In the similar way the working
standards were prepared for internal standard also.
Plasma spiking procedure:
Hundred micro litre of drug and internal standard were added to 0.5 ml plasma
and vortexed for 2 mins. To this 1 ml ACN was added and again vortexed for 2-3 mins. It
was then centrifuged at 3000 rpm for 5 mins and the supernatant was collected and
refrigerated until analysis.
Extraction by SPE
Solid Phase Extraction (SPE) is the most powerful sample preparation technique
in common use now a day, where it involves the use of chromatographic sorbent in a
column format.
Before sample extraction the solid phase extraction cartridge were conditioned
with 1.0ml of methanol followed by 1.00ml of purified water and 1.00ml of 2% ortho
phosphoric acid buffer solution. Prepared plasma samples were then loaded on to the SPE
cartridges and eluted completely under slow vacuum and the cartridges were then washed
with 1.00 ml 2% ortho phosphoric acid buffer solution and 1.00 ml of methanol and
allowed to dry. The analyte and the internal standard were then eluted with 1.00ml
acetonitrile. The eluted samples were then injected into the HPLC system.
The chromatograms of plasma extracted with methanol, acetonitrile and
methanol–acetonitrile mixture, were recorded using the fixed chromatographic
conditions. The chromatogram of blank plasma without any drug was also recorded.
Based up on the percentage recovery acetonitrile was selected as eluting solvent for the
present study because of its higher percentage recovery.

Department of Pharmaceutical Analysis Methodology
K.M.C.H College of Pharmacy Page 47
Preparation of Standard Graph:
Preparation of calibration standards:
SPE cartridge was conditioned with 1.0 ml of methanol followed by 1.0 ml of
purified water and 1.0 ml of 2% ortho phosphoric acid buffer solution. Prepared plasma
samples were then loaded on to the SPE cartridges with the drug concentration of
100,200,400, 600 and 800 ng/ml respectively. The cartridges were then washed with 1.00
ml 2% ortho phosphoric acid buffer solution and 1.00 ml of methanol and allowed to dry.
The drug was then eluted with1.0ml acetonitrile. A quantity of 20 µl was injected into the
HPLC column and chromatograms were recorded. Standard calibration graph was plotted
using ratio of peak area of escitalopram oxalate to its concentration.
ESTIMATION OF ESCITALOPRAM OXALATE IN HUMAN PLASMA:
Recording the chromatogram:
The optimized chromatographic conditions were maintained to record the
chromatograms of the calibration standards of escitalopram oxalate and internal standard.
First, baseline stabilization was done for about 20 minutes. Then standard solutions,
calibration standard solutions and sample from clinical study containing escitalopram
oxalate were injected and chromatograms were recorded.
VALIDATION OF THE METHOD
After developing a method its validation is necessary to prove the suitability of
the method for the intended purpose. Here the procedure followed for the validation of
the developed method is described.
a) Precision:
Intraday and interday precision studies were conducted. In intraday precision
plasma sample containing drug at three different concentrations with internal standard

Department of Pharmaceutical Analysis Methodology
K.M.C.H College of Pharmacy Page 48
were injected and chromatogram was recorded. Similarly interday precision over a two
week period time was evaluated.
Acceptance criteria:
RSD of the mean concentration of five readings should be less than 15% for
bioanalytical method.
b) Accuracy:
It is the closeness of mean tests results obtained by the method to true
concentration of analyte. It is also named as trueness. In this studies the selected
concentration of the plasma were injected six times and mean peak area for each
concentration was calculated. Concentration of the each injection was calculated and
the standard deviation between the readings is calculated. To bioanalytical study the
percentage RSD should be less than 15%.
c) Recovery studies:
The relative recovery of drug from plasma was calculated by comparing the
readings of concentration obtained from the drug spiked plasma to that of equal
concentration from standard sample. Recovery studies were carried out six times for
sample concentration at three levels within the calibration curve.
Acceptance Criteria:
For an assay method, mean recovery should be 85-105% ± 2%.
d) Linearity and Range:
Linearity and range were estimated by using calibration curve. By using
calibration standards prepared by spiking plasma (Escitalopram oxalate) and internal
standard (Tinidazole) at different concentrations like 100ng/ml to 800ng/ml the
calibration graph was plotted taking concentration of spiked plasma on x-axis and

Department of Pharmaceutical Analysis Methodology
K.M.C.H College of Pharmacy Page 49
peak area on y-axis. The linearity is determined from 50% to 150% of the proposed
concentration.
Acceptance Criteria:
Coefficient of correlation of the calibration should be not less than 0.99
e) Lower Limit of Quantification (LLOQ):
The LLOQ is determined by using the calibration curve. Limit of quantitation
is the concentration of substance in the sample that will give a signal-to-noise ratio of
10:1. Detection limit corresponds to the concentration that will give a signal-to-noise
ratio of 3:1. The signal to noise ratio were performed by comparing measured signal of
blank plasma sample with those of known low concentration of drug.
f) Specificity:
Specificity of the method was demonstrated by using diode array detector
peak purity test. The diode array spectrum of both standard and sample peak were
recorded and compared. The other way for doing specificity based in measurement of
absorbance ratio of drug peaks at two different levels. The retention time (Rt),
resolution factor (Rs) and tailing factor (T) were noted for the peaks of escitalopram
oxalate. Peak purity study is done to prove that a developed method is specific for the
drug of interest.
Acceptance criteria:
Purity angle should be less than purity threshold i.e.0.99-1.00
g) Stability:
Stability of the sample, standard and reagent used in HPLC method is required
for a reasonable time to generate reproducible and reliable results. Stability of plasma
sample spiked with drug were subjected to three freeze-thaw cycles, short term stability
at room temperature for 3 hours and long term stability at –200C for four weeks. In
addition, stability of standard solution and internal standard were performed at room

Department of Pharmaceutical Analysis Methodology
K.M.C.H College of Pharmacy Page 50
temperature for 6 hours and under frozen condition for two weeks. The stability of this
solution was studied by performing the experiment and looking for changes in separation,
retention and asymmetry of the peak which were then compared with the pattern of
chromatogram of freshly prepared solutions.
h) Selectivity:
Selectivity is the analytical method ability to differentiate and quantify the
analyte in the presence of other components in the sample. The selectivity was
established by two different methods.
Method I: Chromatograms of six blank plasma samples were compared with
chromatogram obtained from standard solutions. Each chromatogram was tested for
interferences due to endogenous plasma component on the retention times of the selected
drugs.
Method ІІ: This method involves the peak purity test method using diode array detector.
The PDA spectrum, UV spectrum, absorbance ratio curve and first derivative spectrum of
the standard and sample peaks was recorded using PDA detector and compared for the
peak purity of drug.
i) Robustness:
The robustness of the method was studied by changing the chromatographic
conditions slightly. The standard solutions were injected in these changed
chromatographic conditions.
± 1 % difference in the ratio of acetonitrile in the mobile phase.
± 0.5 difference in units of pH of the buffer.
± 1 % difference in flow rate of the mobile phase.
In these changed conditions the separation factor, retention time and peak
symmetry was calculated. Deviation in results from original run should be less than 2%.

Department of Pharmaceutical Analysis Methodology
K.M.C.H College of Pharmacy Page 51
j) System suitability studies:
In system suitability studies certain parameters were calculated namely, column
efficiency, resolution, capacity factor by repeated injection of standard solutions. As
specified in the USP these systems suitability studies were carried out.
Capacity factor (k’) it is measurement of sample molecule how good is retained by a
column during separation. The ideal k value ranges from 2-10.
Capacity Factor (k') = V1 – V0 / V0
Where, V1 is the retention volume at the apex of the peak (solute) and V0 is the
void volume of the system.
Resolution (Rs) is the difference between the retention times of two solutes divided by
their average peak width. The ideal value of (Rs) is 1.5
Resolution (Rs) = Rt1 –Rt2 /0.5(W1-W2)
Where, Rt1 and Rt2 are the retention times of component 1 and 2, respectively.
Column Efficiency (N) of a column is measured by the number of theoretical plates per
meter. For ideal good separation, column efficiency N value ranging from 5,000 to
100,000 plates/meters.
Column efficiency (N) = Rt2 / W2
Where Rt is the retention time and W is the peak width.
Peak asymmetry factor- For better column performance it was calculated by the
formula. When asymmetry factor of value 0.9 to 1.1 then it is achievable for a well
packed column.
Peak asymmetry factor (As) = b / a
Where a and b are the distances on either side of the peak midpoint.
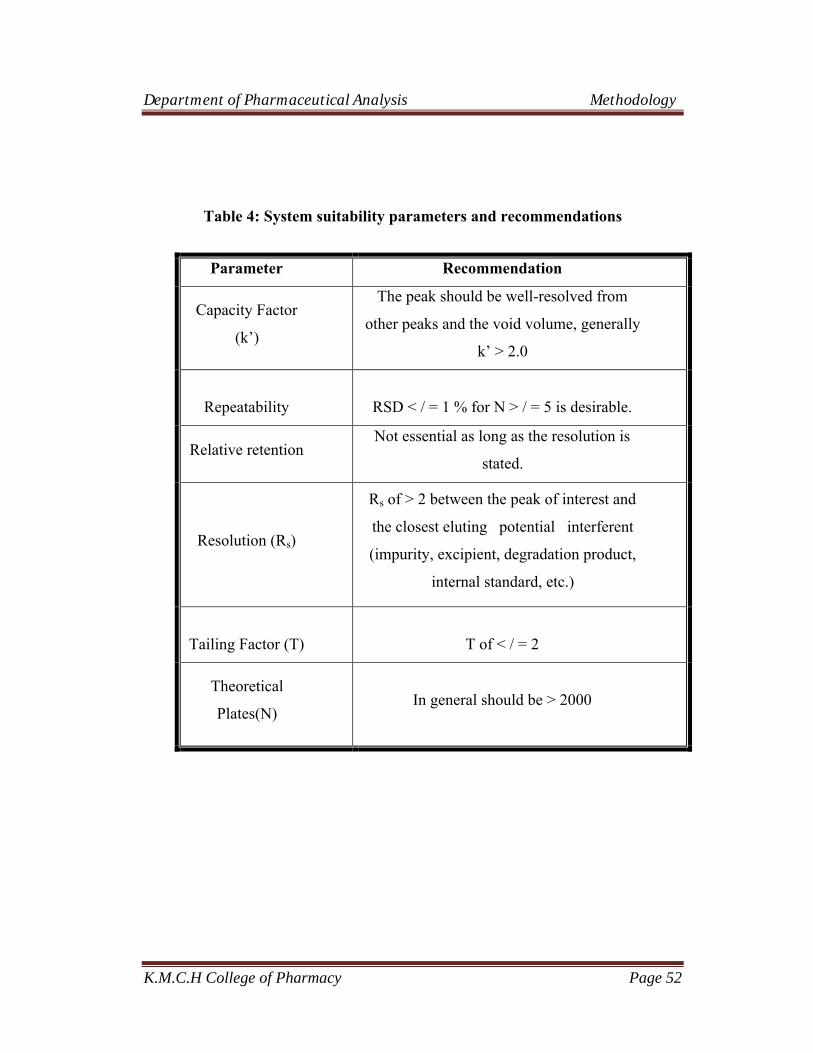
Department of Pharmaceutical Analysis Methodology
K.M.C.H College of Pharmacy Page 52
Table 4: System suitability parameters and recommendations
Parameter Recommendation
Capacity Factor
(k’)
The peak should be well-resolved from
other peaks and the void volume, generally
k’ > 2.0
Repeatability RSD < / = 1 % for N > / = 5 is desirable.
Relative retentionNot essential as long as the resolution is
stated.
Resolution (Rs)
Rs of > 2 between the peak of interest and
the closest eluting potential interferent
(impurity, excipient, degradation product,
internal standard, etc.)
Tailing Factor (T) T of < / = 2
Theoretical
Plates(N)In general should be > 2000

Department of Pharmaceutical Analysis Results and Discussion
K.M.C.H College Of Pharmacy Page 53
7. RESULTS AND DISCUSSION
HIGH PERFORMANCE LIQUID CHROMATOGRAPHIC METHOD
A bioanalytical RP-HPLC method was developed for the escitalopram oxalate. The
chromatographic conditions were stabilized in order to provide a good performance of the
assay. The standard and internal standard solutions were prepared and chromatograms were
recorded. The study proposes a method for the determination of escitalopram oxalate by
solid phase extraction using RP-HPLC.
Optimization of chromatographic conditions:
i) Selection of wavelength:
The sensitivity of a HPLC method depends upon the proper selection of the
wavelength. The overlay spectrum of escitalopram oxalate is given in Figure (Fig 6)
Fig 6: Overlay spectrum of Escitalopram oxalate
From the UV spectrum, wavelength of 240 nm was selected. At this wavelength the drug
showed good absorbance.
200 250 300 350 400 450 500 550 600 650 700 750 nm
-5
0
5
10
15
20
25
30
35
40
45
50
55
mAU 9.78/ 1.00
22
2
26
72
81
69
7
30
1
23
9
64
5
27
52
84
77
3
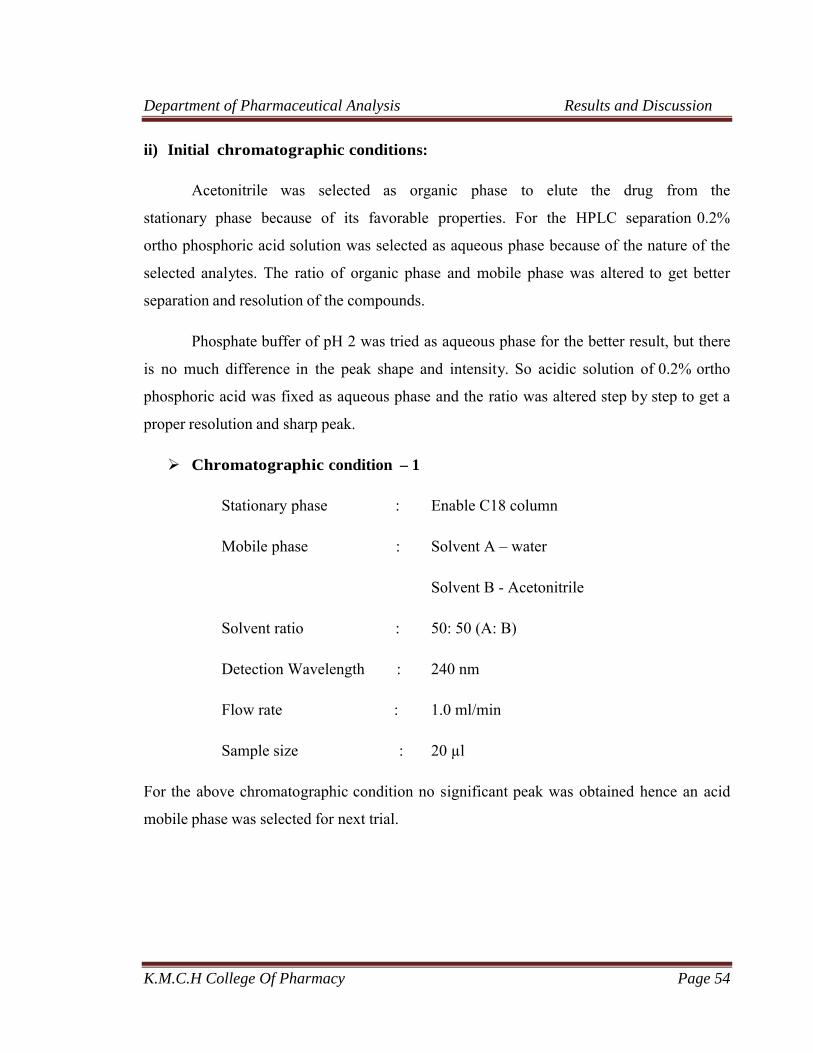
Department of Pharmaceutical Analysis Results and Discussion
K.M.C.H College Of Pharmacy Page 54
ii) Initial chromatographic conditions:
Acetonitrile was selected as organic phase to elute the drug from the
stationary phase because of its favorable properties. For the HPLC separation 0.2%
ortho phosphoric acid solution was selected as aqueous phase because of the nature of the
selected analytes. The ratio of organic phase and mobile phase was altered to get better
separation and resolution of the compounds.
Phosphate buffer of pH 2 was tried as aqueous phase for the better result, but there
is no much difference in the peak shape and intensity. So acidic solution of 0.2% ortho
phosphoric acid was fixed as aqueous phase and the ratio was altered step by step to get a
proper resolution and sharp peak.
ÿ Chromatographic condition – 1
Stationary phase : Enable C18 column
Mobile phase : Solvent A – water
Solvent B - Acetonitrile
Solvent ratio : 50: 50 (A: B)
Detection Wavelength : 240 nm
Flow rate : 1.0 ml/min
Sample size : 20 µl
For the above chromatographic condition no significant peak was obtained hence an acid
mobile phase was selected for next trial.

Department of Pharmaceutical Analysis Results and Discussion
K.M.C.H College Of Pharmacy Page 55
ÿ Chromatographic condition – 2
Stationary phase : Enable C18 column
Mobile phase : Solvent A – 0.2% OPA (O-Phosphoric acid)
Solvent B - Acetonitrile
Solvent ratio : 50: 50 (A: B)
Detection Wavelength : 240 nm
Flow rate : 1.0 ml/min
Sample size : 20 µl
Fig 7: Chromatogram of escitalopram oxalate
At the above chromatographic conditions escitalopram oxalate was eluted at the
retention time of 2.5 min. The peak observed posses asymmetric peak characteristics, hence
not selected for the study
0.0 2.5 5.0 7.5 10.0 12.5 15.0 17.5 min-50
0
50
100
150
200
250
mAU
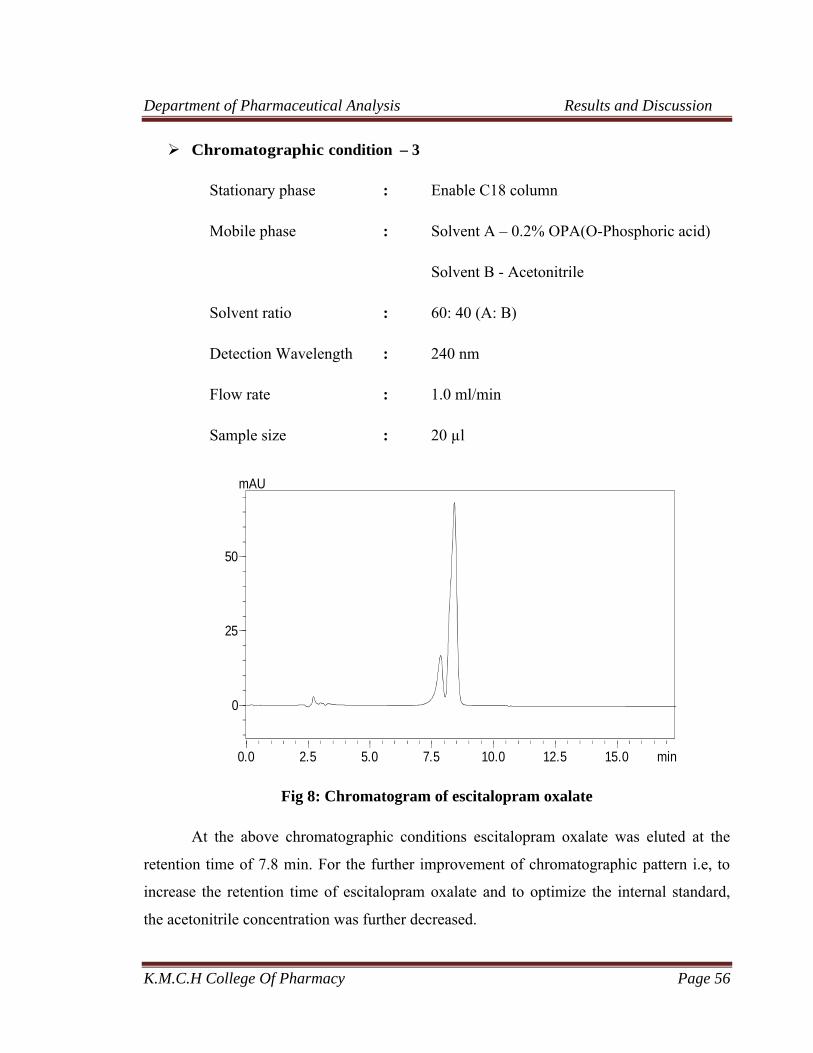
Department of Pharmaceutical Analysis Results and Discussion
K.M.C.H College Of Pharmacy Page 56
ÿ Chromatographic condition – 3
Stationary phase : Enable C18 column
Mobile phase : Solvent A – 0.2% OPA(O-Phosphoric acid)
Solvent B - Acetonitrile
Solvent ratio : 60: 40 (A: B)
Detection Wavelength : 240 nm
Flow rate : 1.0 ml/min
Sample size : 20 µl
Fig 8: Chromatogram of escitalopram oxalate
At the above chromatographic conditions escitalopram oxalate was eluted at the
retention time of 7.8 min. For the further improvement of chromatographic pattern i.e, to
increase the retention time of escitalopram oxalate and to optimize the internal standard,
the acetonitrile concentration was further decreased.
0.0 2.5 5.0 7.5 10.0 12.5 15.0 min
0
25
50
mAU

Department of Pharmaceutical Analysis Results and Discussion
K.M.C.H College Of Pharmacy Page 57
ÿ Chromatographic condition – 4
Stationary phase : Enable C18 column
Mobile phase : Solvent A – 0.2% OPA (O-Phosphoric acid)
Solvent B - Acetonitrile
Solvent ratio : 65: 35 (A: B)
Detection Wavelength : 240 nm
Flow rate : 1.0 ml/min
Fig 9: Chromatogram of escitalopram oxalate
Escitalopram was eluted at 10.5minutes. Peaks were also well resolved and symmetric with
perfect peak properties, hence selected for further studies

Department of Pharmaceutical Analysis Results and Discussion
K.M.C.H College Of Pharmacy Page 58
iii) Selection of internal standard
Based upon polarity and solubility, tinidazole, ornidazole, and diclofenac were
selected and chromatographed along with the standard drug. The elution time of tinidazole
was 4.9 min. The peak of tinidazole was symmetric and well resolved from the peak of the
escitalopram. Hence, for the present study tinidazole was selected as the internal standard.
Fig 10: Chromatogram of both internal standard and escitalopram
FIXED CHROMATOGRAPHIC CONDITION
Stationary phase : Enable C18 column
Mobile phase : Solvent A – 0.2% Ortho PhosphoricAcid in water
Solvent B – Acetonitrile
Solvent ratio : 65:35 (A: B)
Detection Wavelength : 225 nm
Flow rate : 1.2 ml/min
Sample size : 20 µl
Needle wash : HPLC grade water followed by methanol
0.0 2.5 5.0 7.5 10.0 12.5 15.0min
0
5
10
15
mAU

Department of Pharmaceutical Analysis Results and Discussion
K.M.C.H College Of Pharmacy Page 59
Temperature : Room temperature (25ºC)
Fig 11: Typical chromatogram obtained for the tinidazole and escitalopram oxalate
The retention time of escitalopram oxalate and internal standard (tinidazole) was
4.9 and 10.5 min respectively with percent RSD of less than 2%. The results are shown in
table (Table 5). The peak purity study reveals that signal ratios (relative absorbance at
different wavelengths) were constant across the peak profile of escitalopram oxalate. The
peaks obtained in the present study were symmetric, good and no interference was
observed between the peaks. The method developed was advantageous than the reported
methods by its lesser precision values and increased accuracy values.
0.0 2.5 5.0 7.5 10.0 12.5 15.0 min
0
5
10
15
mAU
TIN
IDA
ZO
LE
ES
CIT
AL
OP
RA
M
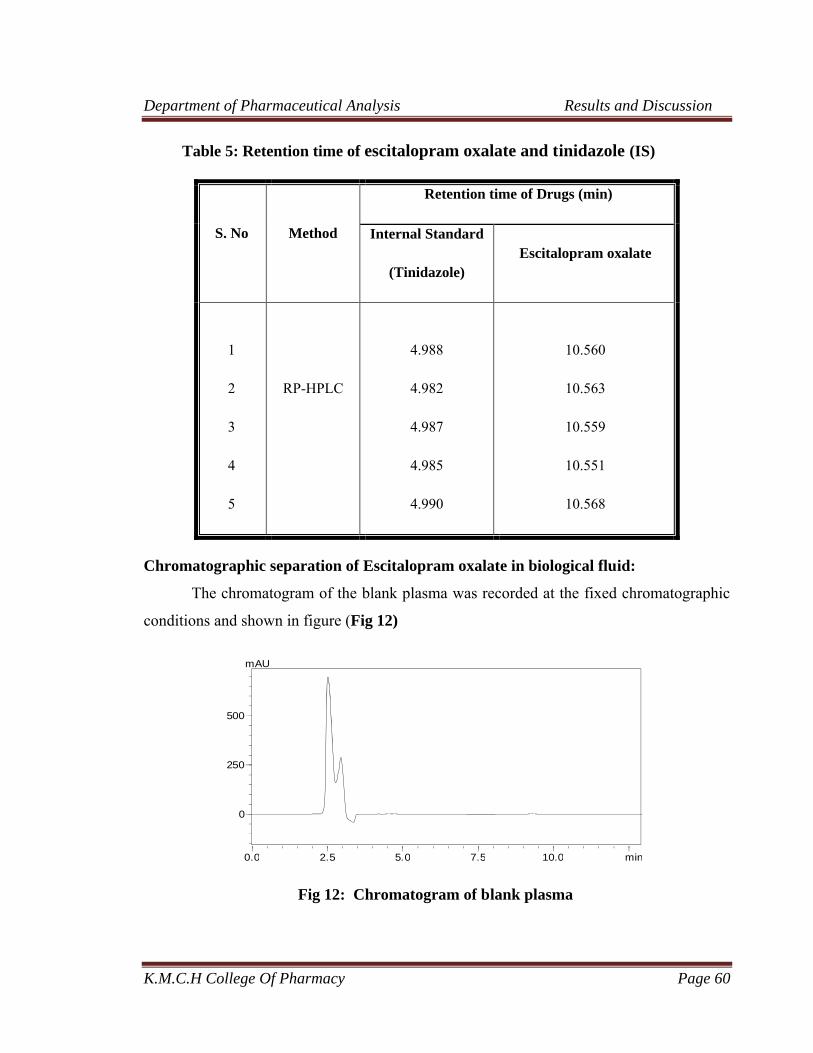
Department of Pharmaceutical Analysis Results and Discussion
K.M.C.H College Of Pharmacy Page 60
Table 5: Retention time of escitalopram oxalate and tinidazole (IS)
Chromatographic separation of Escitalopram oxalate in biological fluid:
The chromatogram of the blank plasma was recorded at the fixed chromatographic
conditions and shown in figure (Fig 12)
Fig 12: Chromatogram of blank plasma
0.0 2.5 5.0 7.5 10.0 min
0
250
500
mAU
S. No Method
Retention time of Drugs (min)
Internal Standard
(Tinidazole)Escitalopram oxalate
1
2
3
4
5
RP-HPLC
4.988
4.982
4.987
4.985
4.990
10.560
10.563
10.559
10.551
10.568
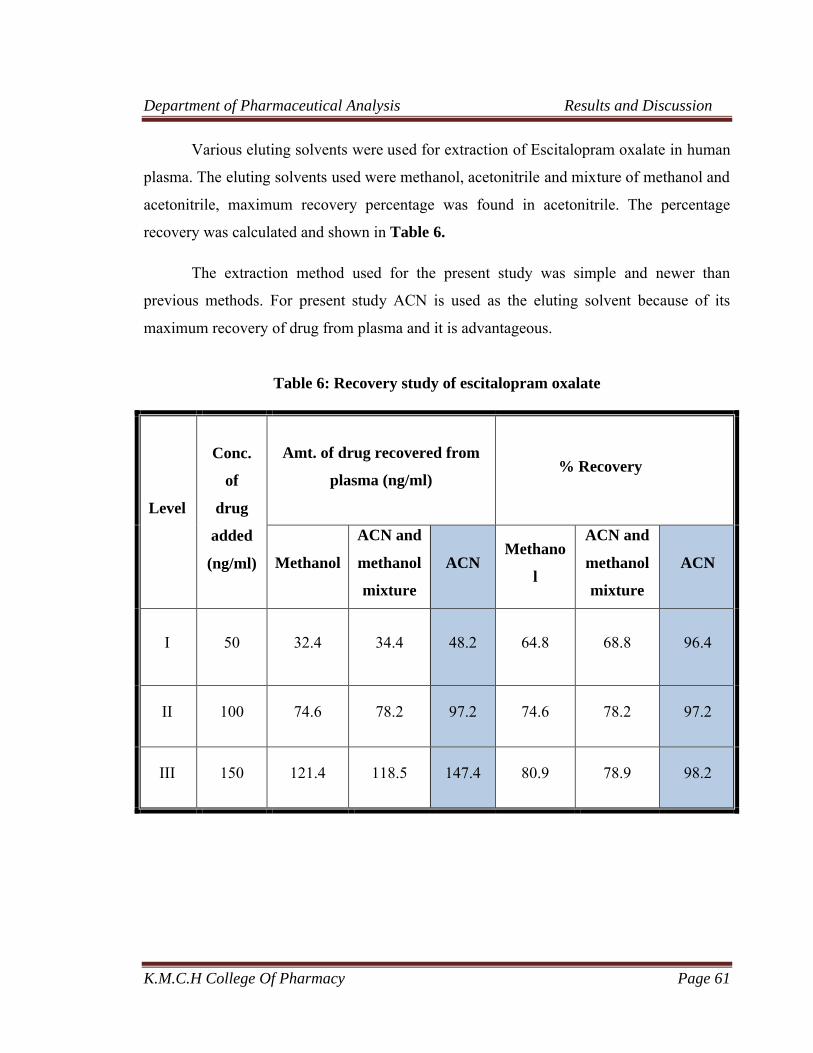
Department of Pharmaceutical Analysis Results and Discussion
K.M.C.H College Of Pharmacy Page 61
Various eluting solvents were used for extraction of Escitalopram oxalate in human
plasma. The eluting solvents used were methanol, acetonitrile and mixture of methanol and
acetonitrile, maximum recovery percentage was found in acetonitrile. The percentage
recovery was calculated and shown in Table 6.
The extraction method used for the present study was simple and newer than
previous methods. For present study ACN is used as the eluting solvent because of its
maximum recovery of drug from plasma and it is advantageous.
Table 6: Recovery study of escitalopram oxalate
Level
Conc.
of
drug
added
(ng/ml)
Amt. of drug recovered from
plasma (ng/ml)% Recovery
Methanol
ACN and
methanol
mixture
ACNMethano
l
ACN and
methanol
mixture
ACN
I 50 32.4 34.4 48.2 64.8 68.8 96.4
II 100 74.6 78.2 97.2 74.6 78.2 97.2
III 150 121.4 118.5 147.4 80.9 78.9 98.2

Department of Pharmaceutical Analysis Results and Discussion
K.M.C.H College Of Pharmacy Page 62
Fig 13: Chromatogram of escitalopram oxalate and internal standard without SPE

Department of Pharmaceutical Analysis Results and Discussion
K.M.C.H College Of Pharmacy Page 63
METHOD VALIDATION
a) Accuracy and precision:
At two –levels these accuracy and precision studies were conducted i.e. intra-
day and inter-day. In this the present developed method, shown the good accuracy and
precision. Accuracy ranges from 99.2% to100.3 % with the precision 3.57% to 5.34% in
intra-day method. In inter-day method the accuracy ranges from 99.5% to 100.08%
with the precision 5.78% to 6.31%. Finally the data obtained here, was found to be
within limits as per ICH guidelines and method was accurate.
Intra-day studies: In this plasma concentration 100-800 ng/ml were injected six times
and mean peak area was calculated separately for each concentration and from that
accuracy and precision percentage RSD values were calculated and shown in table
(Table 7)
Table 7: Accuracy and precision studies of escitalopram oxalate (Intraday)
Sl.noConc. of
drug (ng/ml)
Mean peak
Area*
Accuracy
(%)
RSD
(%)
1. 200 199526 99.2 4.98
2 400 312919 100.3 3.57
3 600 429303 99.9 5.32
*Average of six determinations.

Department of Pharmaceutical Analysis Results and Discussion
K.M.C.H College Of Pharmacy Page 64
Inter-day studies: In this the plasma concentrations of 100-800 ng/ml were injected
into HPLC six times in three different days and mean peak areas were calculated and
from that accuracy and precision percentage RSD were calculated and shown in table
(Table 8 ). The percentage relative standard deviation of precision for Escitalopram
oxalate was less than 15% for the bioanalytical study. The results obtained were within
limits.
Acceptance criteria: The percentage RSD value should be less than 15% for
bioanalytical study.
Table 8: Accuracy and precision studies of escitalopram oxalate (Interday)
Sl.noConc. of
drug (ng/ml)
Mean peak
Area*
Accuracy
(%)RSD
(%)
1 200 191206 99.6 5.78
2 400 336188 99.2 6.31
3 600 419568 100.08 6.11
*Average of three determinations.

Department of Pharmaceutical Analysis Results and Discussion
K.M.C.H College Of Pharmacy Page 65
b) Linearity and range:
This method proved to be linear between ng/ml of Escitalopram oxalate in
human plasma, with a typical calibration curve of correlation equation y = 0.06x +
0.216, correlation coefficient > 0.999 shown in table (Table 9 )
Table 9: Calibration standards peak area
Concentration (ng/ml) Peak area of drug Peak area of IS Response factor
0 0
106856
0
100 123953 1.160
200 196849 1.847
400 308814 2.913
600 434903 4.078
800 546034 5.221
The chromatograms of the plasma calibration standards with concentrations
100,200,400,600 and 800ng/ml were recorded and shown in figures (Fig 14) and their peak
areas of both drug and internal standard were noted. The calibration curve for Escitalopram
oxalate was plotted as peak response Vs concentration of the Escitalopram oxalate
calibration standards in plasma was shown ( Fig : 15-19 ).

Department of Pharmaceutical Analysis Results and Discussion
K.M.C.H College Of Pharmacy Page 66
Fig 14 - Calibration curve for escitalopram oxalate
As we were using internal standard peak response was calculated for
calibration curve. Peak response is the ratio of internal standard peak area to drug peak
area. The correlation coefficient of escitalopram oxalate shown was 0.995 which was
within limits. This calibration curve plotted was linear and showed that the method had
adequate sensitivity to the concentration ( 100-800ng/ml) of the drug. Finally the data
obtained, in this was within limits. Coefficient of correlation of Escitalopram oxalate
was found to be less than 0.99.
Acceptance criteria: The correlation coefficient should not less than 0.99
y = 0.0064x + 0.216R² = 0.9956
0
1
2
3
4
5
6
0 200 400 600 800 1000
Res
pon
se f
acto
r
Concentration (ng/ml)
Calibration curve

Department of Pharmaceutical Analysis Results and Discussion
K.M.C.H College Of Pharmacy Page 67
Fig 15- Chromatogram of IS and Escitalopram oxalate in human plasma100ng/ml

Department of Pharmaceutical Analysis Results and Discussion
K.M.C.H College Of Pharmacy Page 68
Fig 16- Chromatogram of IS and Escitalopram oxalate in human plasma
200ng/ml

Department of Pharmaceutical Analysis Results and Discussion
K.M.C.H College Of Pharmacy Page 69
Fig 17- Chromatogram of IS and Escitalopram oxalate in human
plasma400ng/ml
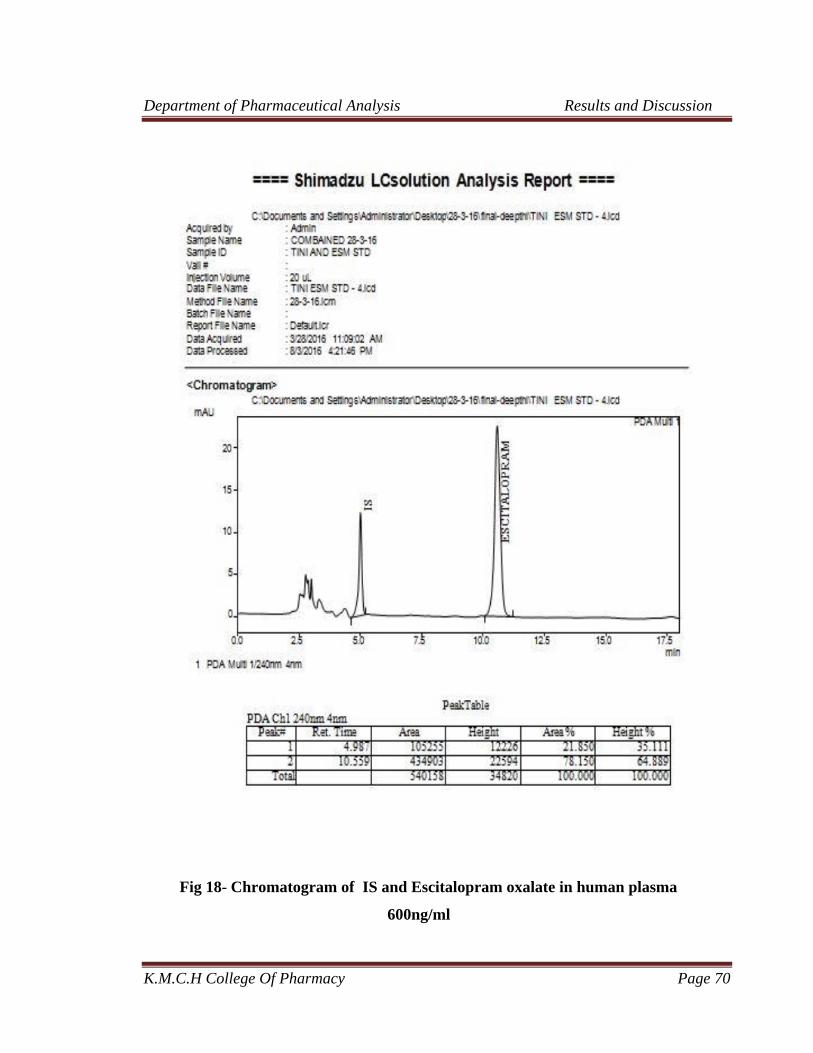
Department of Pharmaceutical Analysis Results and Discussion
K.M.C.H College Of Pharmacy Page 70
Fig 18- Chromatogram of IS and Escitalopram oxalate in human plasma
600ng/ml

Department of Pharmaceutical Analysis Results and Discussion
K.M.C.H College Of Pharmacy Page 71
Fig 19- Chromatogram of IS and Escitalopram oxalate in human plasma
800ng/ml

Department of Pharmaceutical Analysis Results and Discussion
K.M.C.H College Of Pharmacy Page 72
c) Lower Limit of Quantification and Limit of Detection:
The LOD is the smallest concentration of the analyte which shows a measurable
response. The LLOQ is the smallest concentration of the analyte, which shows response
that can be accurately quantified and LLOQ = 10 × D/S and LOD = 3.3× D/S where, D is
the standard deviation of y – intercepts of regression line and S is the slope of the
calibration curve. This signal to noise ratio were performed by comparing measured signal
of known low concentration of drug with those of blank plasma sample.
The Lower limit of quantification (LLOQ) and the Limit of Detection (LOD) for
escitalopram oxalate were separately determined and reported, based on the calibration
curve for spiked plasma solutions was found to be 23.79ng/ml and 7.3ng/ml respectively.
d) Recovery from plasma:
A recovery study for escitalopram oxalate in plasma using acetonitrile was shown
in table (Table 10). With concentrations 200ng/ml, 400ng/ml, 600ng/ml of escitalopram
oxalate recovery was calculated and showed 100.2%, 99.4%, 100.4% relative recoveries
and percentage RSD as 8.6%, 7.9% and 7.3% respectively.
Acceptance criteria: For an assay method, mean recovery should be 85-105% ± 2%.
Table 10: Recovery studies of escitalopram oxalate
Levels
Conc. of drug added
(ng/ml)
Amt of drug recovered in plasma sample
(ng /ml)
Percentagerecovery
(%)
% RSD
I 200 200.08 100.04 4.2
II 400 401.5 100.3 6.8
III 600 598.9 99.75 5.9
**Average of six determinations.

Department of Pharmaceutical Analysis Results and Discussion
K.M.C.H College Of Pharmacy Page 73
e) Ruggedness:
It expresses the precision within laboratories variations like different days,
different analyst, and different equipments. Ruggedness of the method was assessed by
spiking the plasma standard 6 times in two different days with different analyst and the
standard solutions were analyzed by a different chemist and same instruments on a
different day had been performed the reports were shown in table (Table 11 ).
The deviation among the results obtained by two chemists on a different day was
well within the limits. Hence the method was rugged.
Acceptance criteria: The percentage RSD should be less than 15%.
Table 11: Ruggedness studies for escitalopram oxalate
DrugConcentration
(ng/ml)Mean peak
area%RSD
Day I analyst – I
Escitalopram oxalate 200 195392 2.76
Day II analyst – II
Escitalopram oxalate 200 199527 4.98
**Average of six determinations.
f) Specificity:
For specificity the peak purity studies were done. Here for escitalopram oxalate the
peak purity index was 000 and the peak properties like peak profile were good for both
standard and the sample. The peak purity and peak profiles for escitalopram oxalate
standard and sample were shown in figures (Fig 20-23) respectively. By the data obtained
in this, the present method developed was specific as values were within limits.
Acceptance criteria: Purity angle should be less than purity threshold i.e.0.99-1.00

Department of Pharmaceutical Analysis Results and Discussion
K.M.C.H College Of Pharmacy Page 74
Fig 20: Peak profile of standard escitalopram oxalate
Fig 21: Peak profile of escitalopram oxalate in human plasma
10.1
10.2
10.3
10.4
10.5
10.6
10.7
10.8
10.9
11.0
11.1
11.2
min
0
5
10
15
20
25
30
35
mAU
249nm
246nm
243nm
240nm
237nm
234nm
231nm
10.0
10.1
10.2
10.3
10.4
10.5
10.6
10.7
10.8
10.9
11.0
11.2
min
0.0
2.5
5.0
7.5
10.0
12.5
15.0
17.5
20.0
mAU
249nm
246nm
243nm
240nm
237nm
234nm
231nm
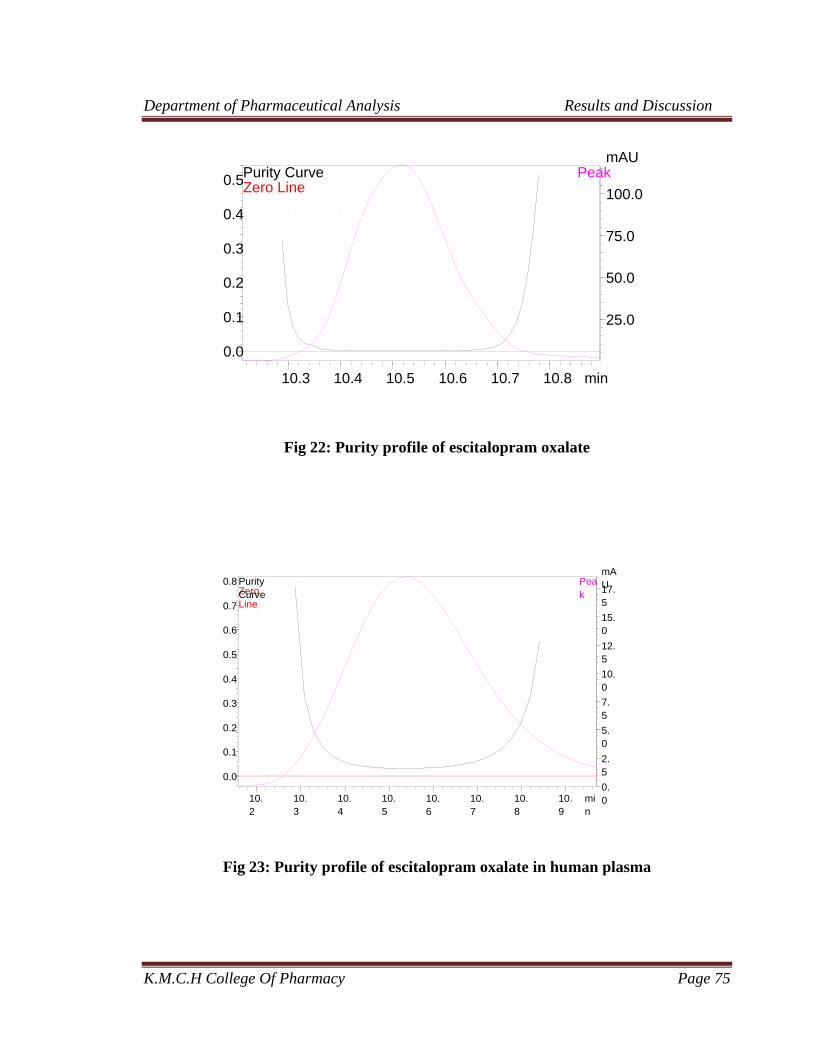
Department of Pharmaceutical Analysis Results and Discussion
K.M.C.H College Of Pharmacy Page 75
Fig 22: Purity profile of escitalopram oxalate
Fig 23: Purity profile of escitalopram oxalate in human plasma
10.2
10.3
10.4
10.5
10.6
10.7
10.8
10.9
min
0.0
0.1
0.2
0.3
0.4
0.5
0.6
0.7
0.8
0.0
2.5
5.0
7.5
10.0
12.5
15.0
17.5
mAUPea
kZero Line
Purity Curve
10.3 10.4 10.5 10.6 10.7 10.8 min
0.0
0.1
0.2
0.3
0.4
0.5
25.0
50.0
75.0
100.0
mAUPeak
Zero LinePurity Curve
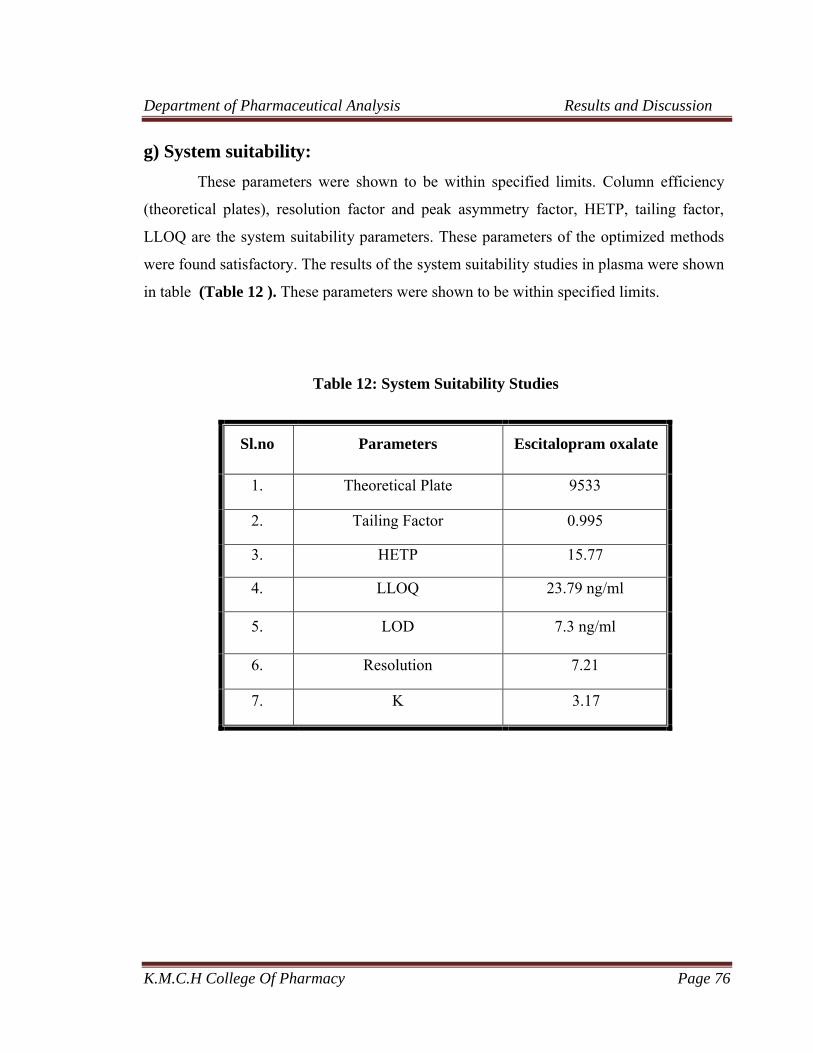
Department of Pharmaceutical Analysis Results and Discussion
K.M.C.H College Of Pharmacy Page 76
g) System suitability:
These parameters were shown to be within specified limits. Column efficiency
(theoretical plates), resolution factor and peak asymmetry factor, HETP, tailing factor,
LLOQ are the system suitability parameters. These parameters of the optimized methods
were found satisfactory. The results of the system suitability studies in plasma were shown
in table (Table 12 ). These parameters were shown to be within specified limits.
Table 12: System Suitability Studies
Sl.no Parameters Escitalopram oxalate
1. Theoretical Plate 9533
2. Tailing Factor 0.995
3. HETP 15.77
4. LLOQ 23.79 ng/ml
5. LOD 7.3 ng/ml
6. Resolution 7.21
7. K 3.17

Department of Pharmaceutical Analysis Summary and Conclusion
K.M.C.H college Of Pharmacy Page 77
8. SUMMARY AND CONCLUSION
A bio-analytical method was developed for the estimation of Escitalopram
oxalate in human plasma by RP -HPLC method and was validated. Escitalopram is an
antidepressant drug from the class called Selective Serotonin Reuptake Inhibitors
(SSRI’s).The method was developed using 0.2% ortho phosphoric acid and acetonitrile
in the ratio of 65:35% v/v. The peaks obtained for the drug of interest and internal
standard by the present method were well resolved from each other without any
interference and from the plasma endogenous proteins by Solid phase Extraction
method (SPE method) and the peaks were symmetrical in nature with acceptable
tailing factor.
All the analytical validation parameters were determined and found in the limit
as per ICH guidelines, which indicates the validity of the method .The method was
validated with respect to specificity, linearity, accuracy, precision, ruggedness and
robustness. The results of linearity, intraday and interday precision study and
capability of the extraction method were within the limits of bioanalytical method
development. The method was linear with a correlation coefficient of acceptable
agreement, which is suitable for the estimation of Escitalopram oxalate in human
plasma and other biological fluids.
The SPE method demonstrated relative recoveries with acceptable relative
standard deviation. The lower limit of quantification (LLOQ) and limit of detection
(LOD) for Escitalopram oxalate was found to be in nanograms. Hence the developed
method is sensitive for the estimation of Escitalopram oxalate in trace amounts. The
Peak purity studies showed that the peak purity index values were closer to unity
hence reveals that the method developed was specific for the estimation of
Escitalopram oxalate in blood and other biological fluids.
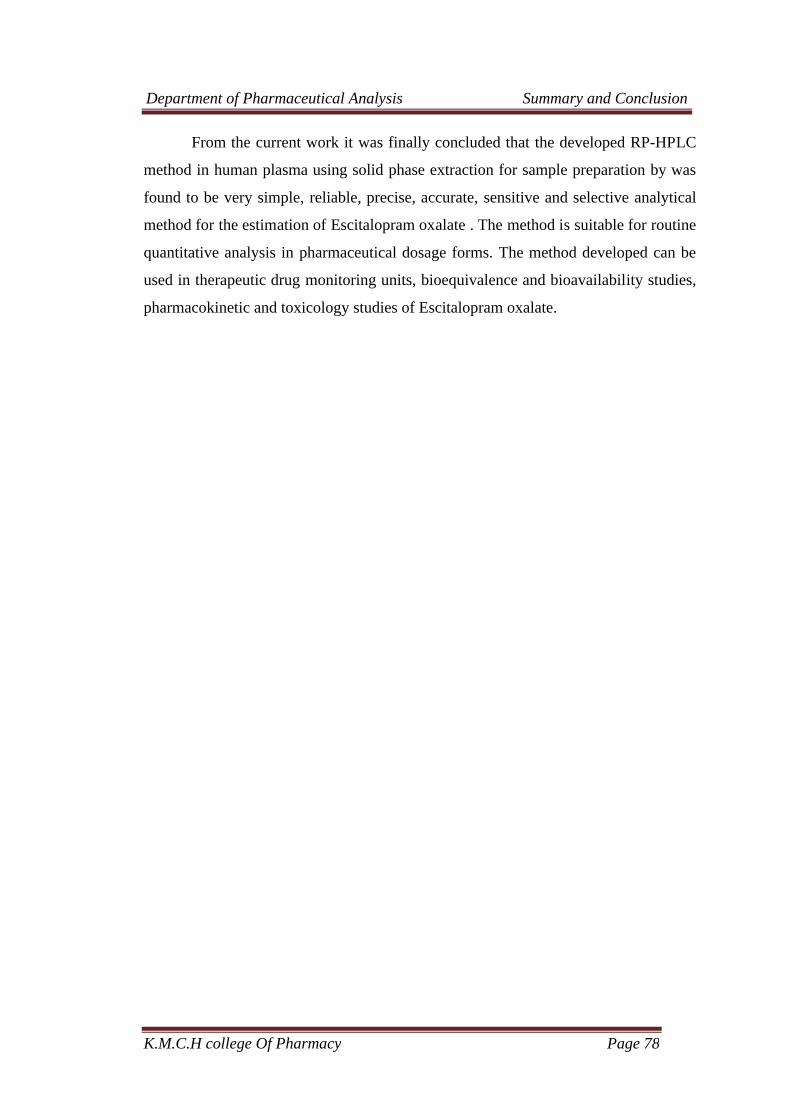
Department of Pharmaceutical Analysis Summary and Conclusion
K.M.C.H college Of Pharmacy Page 78
From the current work it was finally concluded that the developed RP-HPLC
method in human plasma using solid phase extraction for sample preparation by was
found to be very simple, reliable, precise, accurate, sensitive and selective analytical
method for the estimation of Escitalopram oxalate . The method is suitable for routine
quantitative analysis in pharmaceutical dosage forms. The method developed can be
used in therapeutic drug monitoring units, bioequivalence and bioavailability studies,
pharmacokinetic and toxicology studies of Escitalopram oxalate.
Department of Pharmaceutical Analysis Bibliography
K.M.C.H College of Pharmacy Page 79
BIBLIOGRAPHY
1. Patil R, Deshmukh T, Patil V. Review on Analytical Method Development and
Validation. Research and Reviews: Journal of Pharmaceutical Analysis. 2014;
03(3):1-10.
2. Pushpa Latha E, Sailaja B. Bioanalytical Method Development and Validation by
HPLC: A Review. Journal of Medical and Pharmaceutical Innovation.2014 Dec;
1(6S):1-9.
3. Pranay Wal et al. Bioanalytical Method Development –Determination of Drugs in
Biological Fluids .Journal of Pharmaceutical Science and Technology. 2010; 2 (10):
333-347.
4. A. Kirthi R. Shanmugam. A review on bioanalytical method development and
validation by RP – HPLC. Journal of Global Trends in Pharmaceutical Sciences.
2014;5(4) : 2265 - 2271
5. Lloyd R, Snider, Joseph J, Joseph I, Glajch M .Practical HPLC method
development: 2nded. New Jersey: John wiley and sons Inc; 1997. P. 3-4, 25-27, 42,
234-242, 351-352, 653-656.
6. Chang, M.S., Q. Ji, J. Zhang, T.A. El-Shourbagy, Historical review of sample
preparation for chromatographic bioanalysis: pros and cons. Drug Development
Research 2007; 68(3):107-133.
7. James W.Munson. Pharmaceutical Analysis,CRC Press.1984;2-14.
8. Prabu SL, Suriyaprakash TN. Extraction of drug from the biological matrix: a
review. INTECH Open Access Publisher; 2012; 479-506.
9. Reddy K V, Asish Yachawand.Overview of recent extraction techniques in
bioanalysis. Int. Res.J.Pharm.2016;7(2):15-24.
10. Wells MJ. Principles of extraction and the extraction of semivolatile organics from
liquids. Sample Preparation Techniques in Analytical Chemistry. 2003;162: 37.
11. Richard R. Burgess. Protein precipitation techniques. Methods in
Enzymology.2009; 463:331-341
12. www.mic.ucla.edu>ms_pr>proteomics

Department of Pharmaceutical Analysis Bibliography
K.M.C.H College of Pharmacy Page 80
13. Ronald E.Majors, Practical aspects of solvent extraction 2002; 20(12): 1098–1113.
14. http://www.chromacademy.com/lms/sco59/Sample_Preparation_Liquid
Liquid_Extraction_Techniques.pdf
15. https://en.wikipedia.org/wiki/Solid_phase_extraction
16. Wells MJ. Handling large volume samples: applications of SPE to environmental
matrices. Dekker: New York; 2000 Mar 15.
17. Żwir-Ferenc A, Biziuk M. Solid phase extraction technique–trends, opportunities
and applications. Polish Journal of Environmental Studies. 2006 Sep 1;15(5):677-
90.
18. http://www.sigmaaldrich.com/Graphics/Supelco/objects/4600/4538.pdf
19. Satinder Ahuja, Ahuja Consulting, Calabash, North Carolina, Handbook of Modern
Pharmaceutical Analysis, published by Academic Press, A Harcourt Science and
Technology Company, San Francisco: 417
20. Sethi P.D., High performance liquid Chromatography, CBS publishers and
distributors, New Delhi, 1st edition (1996); 27 -29.
21. Dr. A. Rajasekharan. High performance liquid chromatography- Fundamental
principles.Rupi publications.2012.7-45.
22. Pushpa Latha E, Sailaja B. Bioanalytical Method Development and Validation by
HPLC: A Review. Journal of Medical and Pharmaceutical Innovation.2014 Dec;
1(6S):1-9
23. David Watson G, Pharmaceutical Analysis a text book for pharmacy students and
pharmaceutical chemists. Harcourt publishers limited 1999: 92.
24. Sharma BK. Instrumental methods of chemical analysis, Meerut: Goel Publishing
House 2000; 19:1-4
25. Jeffery G H, Basset J et al., Vogel’s Text Book of Quantiative Chemical
Analysis:5th edition. John Wiley and sons Inc.1997;216-217
26. Shah VP, The History of Bioanalytical Method Validation and Regulation:
Evolution of a Guidance Document on Bioanalytical Methods Validation. AAPS
Journal 2007; 9(1): E43-E47

Department of Pharmaceutical Analysis Bibliography
K.M.C.H College of Pharmacy Page 81
27. Lalit V Sonawane, Bhagwat N Poul, et al.. Bioanalytical Method Validation
and Its Pharmaceutical Application-A Review. Pharmaceutica Analytica Acta.
2014 Apr; 05(03):1-7.
28. Shah VP. The history of bioanalytical method validation and regulation:
evolution of a guidance document on bioanalytical methods validation. The
AAPS Journal. 2007 Mar 1;9(1):E43-7.
29. Food and Drug Administration. Guidance for Industry, Bioanalytical Method
Validation. Rockville, MD: US Department of Health and Human Services,
FDA, Center for Drug administration.
30. Anonymous, Guide for Industry. Bioanalytical method validation, U.S
Department of Health and Human Services Food and Drug Administration
(FDA) 2001; (2): 191-210.
31. International Conference on Harmonization, Guideline on Validation of
Analytical Procedure-Methodology, Geneva, Switzerland 1996.
32. ICH, Q2A, 1994, Validation of Analytical procedure: Methodology. In Proc.
Int. Con. Harmonization, Geneva.
33. ICH, Q2B, 1994, Validation of Analytical procedure: Methodology. In Proc.
Int. Con. Harmonization, Geneva.
34. International Conference on Harmonization, "Q2A Text on Validation of
Analytical Procedures," Federal Register 60(40), (1995) 11260–11262.
35. Shah VP, Midha KK, Findlay JW, Hill HM, Hulse JD, McGilveray IJ, McKay
G, Miller KJ, Patnaik RN, Powell ML, Tonelli A. Bioanalytical method
validation—a revisit with a decade of progress. Pharmaceutical research. 2000
Dec 1;17(12):1551-7.
36. Rajendra B. Kakde et al., Stability-Indicating RP-HPLC Method for the
Simultaneous Determination of Escitalopram Oxalate and Clonazepam. Journal of
Chromatographic Science. 2013 November; 51: 490–495.
37. Chusena Narasimharaju Bhimanadhuni et al.,. Development and validation of an
RP-HPLC method for the simultaneous determination of Escitalopram Oxalate and

Department of Pharmaceutical Analysis Bibliography
K.M.C.H College of Pharmacy Page 82
Clonazepam in bulk and its pharmaceutical formulations. International Current
Pharmaceutical Journal. 2012;1(8): 193-198.
38. R. D. Chakole et al., . Simultaneous estimation of Escitalopram and Clonazepam
by RP-HPLC in pharmaceutical formulation. International Journal of
Phytopharmacy. 2012 Jan-Feb; Vol. 2 (1), 25-29.
39. Bhosale Suryakant D and Rajput Sadhana J. RP-HPLC Method for simultaneous
estimation of Escitalopram Oxalate and Etizolam in a tablet formulation. JPBMS,
2012; 19 (05):1-4.
40. Lasan V M, Patel S A. Analytical Method Development and Method Validation for
Escitalopram Oxalate in Pharmaceutical Dosage Forms by HPLC Method.
International Journal for Pharmaceutical Research Scholars. 2015; 4(01):19-25.
41. Tapobana samanta et al., RP HPLC method for the estimation of Escitalopram in
bulk and in dosage forms. International Journal of Chemistry
Research.2011;2(02):11-15.
42. Carlos E.M. de souse et al ., Determination of Escitalopram in Human Plasma by
High Performance Liquid Chromatography-Tandem Mass Spectrometry. Latin
American Journal of Pharmacy. 2012; 31 (2): 310-314.
43. Pallavi Alegete et al., Simultaneous quantification of Risperidone and Escitalopram
in human plasma by LC-MS/MS: Application to a pharmacokinetic study.
International Journal of Pharmacy. 2016; 6(2): 246-256.
44. Mahadeo V. Mahadik et al., Application of Stability Indicating HPTLC Method for
Quantitative Determination of Escitalopram Oxalate in Pharmaceutical Dosage
Form. Eurasian Journal of Analytical Chemistry. 2007; 2(02): 101-117.
45. Bhumika D. Sakhreliya et al., Development and Validation of Spectrophotometric
Methods for Simultaneous Estimation of Escitalopram oxalate and Etizolam in their
Combined Tablet Dosage Form. JPSBR. Sept Oct 2012 ; 2(5): 195-200.
46. Santhosh D.shelke et al.,Development and Validation of UV Spectrophotometric
Method of Escitalopram oxalate in bulk and pharmaceutical formulations. Journal
of Chemical and Pharmaceutical sciences. 2009 October-December; 2(4):256-258.

Department of Pharmaceutical Analysis Bibliography
K.M.C.H College of Pharmacy Page 83
47. Sharma S et al., Zero Order Spectrophotometric Method for Estimation of
Escitalopram Oxalate in Tablet Formulations. Journal of Young Pharmacists.
2010;2(4):420-423.
48. http://www.drugbank.ca/drugs/DB01175
49. https://en.wikipedia.org/wiki/Escitalopram
50. https://medlineplus.gov/druginfo/meds/a603005.html
51. https://www.drugs.com/cdi/escitalopram.html
52. HL Sharma, KK Sharma. Principles of Pharmacology. Paras Medical Publisher, 2nd
edition,2013;463,467
53. R.S.Satoskar etal., Pharmacology and Pharmacotherapeutics.Popular prakashan
publishers,20th edition,208-211.