Embed Size (px)
Citation preview
CHAPTER 1
Produced Water
1.1 COMPOSITION OF PRODUCED WATER
1.1.1. Sources and Treatment of Produced Water
During millions of years of geologic time, petroleum and natural gas may accumulate in porous sediments (e.g., sands) trapped between layers of impermeable rock deep within the earth (Collins, 1975). Water may be trapped during millions of years with the oil and gas. This water may be derived from ancient fresh or seawater (connate water) and often is as old as the fossil fuels in the reservoir. When the hydrocarbon reservoir is tapped by a well, the produced fluids may contain water. Also, in some oil fields, fresh or seawater may be injected into the reservoir through injection wells to displace oil into the production wells. Sometimes, this injection water channels through to the production well and is produced with the oil and gas. The water produced with oil and gas is called produced water, formation water, or oilfield brine (Neff et al., 1987; Black et al., 1994; Patin, 1999).
Before the crude oil can be refined or the gas processed, the water must be removed. During offshore operations, separation of the produced water from the oil and gas may take place on the production platform or the oil/gas/water mixture may be sent through a pipeline to a shore facility where the produced water is separated from the oil and gas. If not re-injected into another well, the produced water is treated to meet local regula- tory limits for oil and grease before it is discharged to the ocean from the platform or from an ocean outfall from a shore-based treatment facility.
In most of the world, national or regional regulatory agencies have set limits on the concentration of petroleum hydrocarbons (or total oil and grease) that can remain in pro- duced water destined for ocean disposal. The current limit for total oil and grease (dis- persed and dissolved oil, measured by gravimetric or infrared analysis) in treated produced water destined for ocean disposal in U.S. Federal waters and state waters of Upper Cook Inlet, AK, is 42 mg/L (ppm) daily maximum and 29 mg/L monthly average (Otto and Arnold, 1996; Veil, 1997). Discharge of produced water to coastal estuarine

2 Bioaccumulation in Marine Organisms
and marine waters is no longer permitted in the United States. The permit limits for treated produced water discharges offshore in Australia are 30 mg/L daily average and 50 mg/L instantaneous maximum (Black et al., 1994). The regulatory limit for total oil and grease in produced waters discharged to most offshore waters of the North Sea, the Mediterranean Sea, the Arabian Gulf, and Asia is 40 mg/L (Ray, 1996).
The oil/gas/water mixture may be processed through separation devices to separate the three phases from one another. The types of equipment used on platforms in the west- ern Gulf of Mexico to remove oil and grease from produced water include, in order of frequency of use, mechanical and hydraulic gas floatation units, skimmers, coalescers, hydrocyclones, and filters (Otto and Arnold, 1996). Hydrocyclones, because of their operating efficiency and limited space requirements, are being used with increasing fre- quency for oil/water separation on offshore platforms in the Gulf of Mexico, North Sea, Australia, the Middle East, and Southeast Asia (Cornitius, 1988). Chemicals may be added to the process stream to improve the efficiency of oil/gas/water separation. Even with the most advanced separation equipment, the oil/water separation is not 100 percent efficient. Treated produced water that is discharged to the ocean often contains small amounts of hydrocarbons, other organic chemicals, dissolved salts, and metals.
Small amounts of specialty chemicals may be added to the production stream at dif- ferent steps in the production and treatment process to prevent corrosion, foaming, scale formation, hydrogen sulfide formation, and bacterial growth, or to improve the efficiency and completeness of oil/water separation (Hudgins, 1989, 1991, 1992). Most of these chemicals remain in the oil or gas phases; others are water soluble, remain in the produced water, and are discharged with it to the ocean. Approximately 19 percent of the offshore production chemicals used on platforms in the North Sea are discharged to the ocean in treated produced water, including more than 50 percent of the emulsifiers, sur- factants, oil removing agents, and scale inhibitors (van Hattum et al., 1992; Ynnesdal and Furuholt, 1994; Hudgins, 1994). Only small amounts (less than 20 percent of the amounts used) of corrosion inhibitors, oxygen scavengers, emulsion breakers, defoamers, and gas treatment agents are discharged with produced water to the ocean.
1.1.2 Naturally-Occurring Chemicals in Produced Water
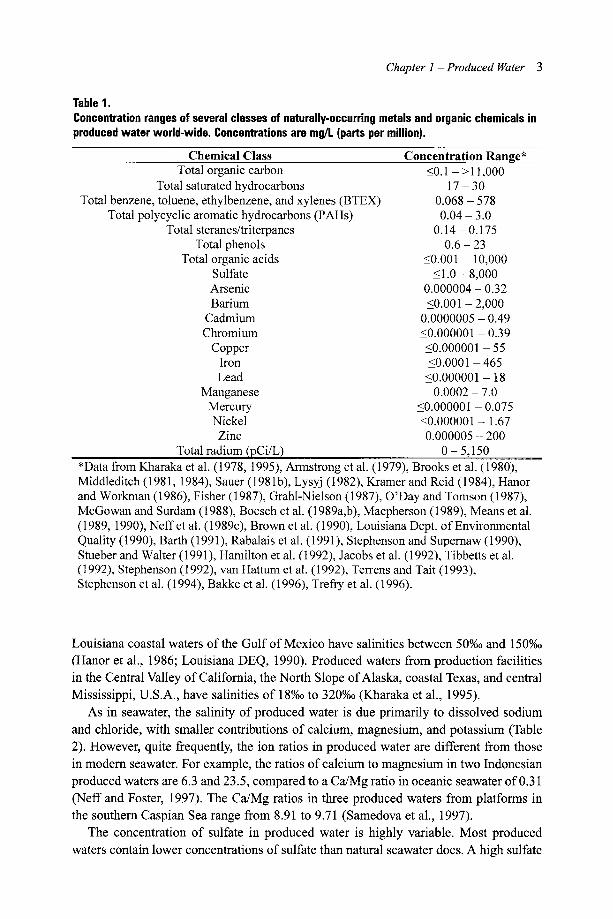
Produced water contains a variety of chemicals that have been dissolved from the geologic formations in which the produced water resided for millions of years (Table 1). These chemicals include inorganic salts (essentially the same salts that are found in sea- water and make the ocean salty), several metals and metalloids, and a wide variety of organic chemicals. It should be noted that the concentrations in Table 1 are the extreme ranges for all reported concentrations in produced water. Many of the high values, par- ticularly for metals, may be anomalous, caused by matrix interferences from the high concentrations of dissolved salts in most produced waters (Neff, 1987). The highest val- ues are extremely rare and concentrations of most constituents in most produced waters fall in the lower part of the ranges listed in Table 1.
Salinity and Inorganic ions. The salt concentration (salinity) of produced water may range from a few parts per thousand (%o) to that of a saturated brine (about 300%o) (Rittenhouse et al., 1969; Large, 1990). Some produced waters have so little salt that they are drinkable. However, most produced waters from offshore sources have salinities greater than that of seawater (about 35%o) (Collins, 1975). Most produced waters from
Chapter 1 - Produced Water 3
Table 1. Concentration ranges of several classes of naturally-occurring metals and organic chemicals in produced water world-wide. Concentrations are mg/L (parts per million).
C h e m i c a l C l a s s
Total organic carbon Total saturated hydrocarbons
Total benzene, toluene, ethylbenzene, and xylenes (BTEX) Total polycyclic aromatic hydrocarbons (PAHs)
Total steranes/triterpanes Total phenols
Total organic acids Sulfate Arsenic Barium
Cadmium Chromium
Copper Iron Lead
Manganese Mercury Nickel Zinc
Total radium (pCi/L)
C o n c e n t r a t i o n R a n g e *
_<0.1 - > 1 1 , 0 0 0
17-30 0.068- 578 0.04- 3.0
0.14-0.175 0 .6-23
<0.001 - 1 0 , 0 0 0
<1.0-8,000 0.000004 - 0.32 < 0 . 0 0 1 - 2 , 0 0 0
0.0000005 - 0.49 <0.000001 - 0.39 <0.000001 - 5 5
< 0 . 0 0 0 1 - 4 6 5
< 0 . 0 0 0 0 0 1 - 18
0.0002 - 7.0 <0.000001 - 0.075 < 0 . 0 0 0 0 0 1 - 1 . 6 7
0.000005 - 200 0 - 5,150
*Data from Kharaka et al. (1978, 1995), Armstrong et al. (1979), Brooks et al. (1980), Middleditch (1981, 1984), Sauer (1981 b), Lysyj (1982), Kramer and Reid (1984), Hanor and Workman (1986), Fisher (1987), Grahl-Nielson (1987), O'Day and Tomson (1987), McGowan and Surdam (1988), Boesch et al. (1989a,b), Macpherson (1989), Means et al. (1989, 1990), Neff et al. (1989c), Brown et al. (1990), Louisiana Dept. of Environmental Quality (1990), Barth (1991 ), Rabalais et al. ( 1991 ), Stephenson and Supernaw (1990), Stueber and Walter (1991), Hamilton et al. (1992), Jacobs et al. (1992), Tibbetts et al. (1992), Stephenson (1992), van Hattum et al. (1992), Yerrens and Tait (1993), Stephenson et al. (1994), Bakke et al. (1996), Trefry et al. (1996).
Louisiana coastal waters of the Gulf of Mexico have salinities between 50%0 and 150%0 (Hanor et al., 1986; Louisiana DEQ, 1990). Produced waters from production facilities in the Central Valley of Califomia, the North Slope of Alaska, coastal Texas, and central Mississippi, U.S.A., have salinities of 18%o to 320%o (Kharaka et al., 1995).
As in seawater, the salinity of produced water is due primarily to dissolved sodium and chloride, with smaller contributions of calcium, magnesium, and potassium (Table 2). However, quite frequently, the ion ratios in produced water are different from those in modem seawater. For example, the ratios of calcium to magnesium in two Indonesian produced waters are 6.3 and 23.5, compared to a Ca/Mg ratio in oceanic seawater of 0.31 (Neff and Foster, 1997). The Ca/Mg ratios in three produced waters from platforms in the southem Caspian Sea range from 8.91 to 9.71 (Samedova et al., 1997).
The concentration of sulfate in produced water is highly variable. Most produced
waters contain lower concentrations of sulfate than natural seawater does. A high sulfate

4 Bioaccumulation in Marine Organisms
Table 2. Salinity (%0) and concentrations (mg/L) of selected inorganic ions in typical seawater and in produced water.
Chemical Seawater* World Produced Water* Salinity (%o) 32 - 36 3 - 320
Sodium 10,560 65 - 97,000 Chloride 18,900 <5 - 201,000 Calcium 400 13 - 118,800
Strontium 13 7 - 3,200 Magnesium 1,270 4 - 11,700 Potassium 380 3 - 6,500
Sulfate 880 <1 - 1,650 Sulfide --- 0.12 - 256
Ammonia --- <0.1 - 650 *Data from Collins (1975), Large and Tibbetts (1990), and Van Hattum et al. (1992), Barth (1991), Kharaka et al. (1995), and Witter and Jones (1999).
concentration in a produced water sample may indicate that saline water injected into the formation to enhance petroleum production has broken through and is appearing in the produced water (Large and Tibbetts, 1990). The sulfate concentration in produced water is important because it controls the solubility and, thereby, the concentration of several other elements, particularly calcium and barium, in solution in the produced water. Produced water in the geologic formation is in the reduced state. Therefore, some of the sulfur may be present as elemental sulfur or sulfide. Produced water from a crude oil pro- cessing facility in California, U.S.A., contains 48 to 256 mg/L sulfides and 0.6 to 42 mg/L elemental sulfur (WiRer and Jones, 1999).
Sulfides, usually as hydrogen sulfide and polysulfides, may be formed by bacterial reduction of sulfate in anoxic produced water (Large, 1990). They are most abundant in water produced with sour gas or crude oils containing high concentrations of sulfur (WiRer and Jones, 1999). Sulfides are highly corrosive and their generation in the production stream usually is controlled by use of biocides. Hydrogen sulfide may also be formed during storage of produced water samples for later analysis or use in toxicity tests. Hydrogen sulfide, because of its high toxicity, may confound the results of toxic- ity tests. Hydrogen sulfide concentrations as high as 1,000 mg/L have been detected in produced water (Kochelek and Stone, 1989).
Ammonia is not frequently analyzed in produced water, but when it is, concentrations are highly variable. Many produced waters do not contain detectable concentrations of ammonia. Among those that do, concentrations may be as high as 650 mg/L (Table 2). Some produced waters from production platforms in the Santa Barbara Channel, California, USA, contain up to 420 mg/L ammonia (Neff, 1997c). Ammonia may be formed by bacterial degradation of organo-nitrogen compounds in the formation or dur- ing storage of produced water. Because it is highly toxic to marine organisms, it may, like sulfide, affect the results of produced water toxicity tests performed in the labora- tory. It is uncertain, because of their volatility and high aqueous solubility (favoring rapid dilution), if ammonia and sulfide actually contribute to the toxicity to marine organisms in the receiving water environment of produced water discharged to the ocean. By way

Chapter 1 - P r o d u c e d Water 5
of comparison, the four largest municipal wastewater plants in the Los Angeles area dis- charge more than 4 x 10¹² liters/day of wastewater containing 23 to 35 mg/L ammonia to the southern California Bight (Raco-Rands, 1996). The volume of produced water dis- charged to the Santa Barbara Channel is about 1.6 x 10⁷ liters/day (Table 14).
Metals. Produced water may contain several metals in solution. The metals present and their concentrations in produced waters from different sources are extremely vari- able, depending on the age and geology of the formations from which the oil and gas are produced (Collins, 1975). There is not a good correlation between concentrations of met- als in crude oil and the water produced with it (Olsen et al., 1995; Samedova et al., 1997). Some metals, such as vanadium and nickel, may be very abundant in crude oils but rare in produced water. These metals are present as metal-organic complexes (por- phyrins) in the oil and do not partition into the produced water phase in contact with the oil. However, some North Sea produced waters contain high concentrations of nickel (Table 3), possibly derived from biodegradation of nickel porphyrins. Several metals, including cadmium, lead, and zinc, dissolve into crude oil and produced water as they migrate through mineral ore deposits containing these metals (Olsen et al., 1995; Samedova et al., 1999). Mercury from cinnabar deposits or complexed with the solid organic phase in the hydrocarbon reservoir may "evaporate" into natural gas in the for- mation and condense out of the gas into the produced water when the gas and water are brought to surface temperature and pressure (Battelle, 1994).
Because produced water is thought to be a concentrate of ancient seawater or fresh water, it is not surprising that the metals present in seawater also are present in produced water. However, a few metals may be present in produced waters from different sources at concentrations substantially higher (1,000-fold or more) than their concentrations in
Table 3. Concentration ranges of several metals in produced water from seven platforms in the north- western Gulf of Mexico and 12 discharges to the Norwegian Sector of the North Sea. Typical concentrations in seawater are included for comparison. Concentrations are/~g/L (ppb).
Metal Seawater Gulf of Mexico North Sea Produced Water Produced Water
Arsenic (As) 1 - 3 0.5 - 31 0 .96- 1.0 Barium (Ba) 3 - 34 81,000- 342,000 107,000- 228,000 Cadmium (Cd) 0.001 - 0.1 <0.05 - 1.0 0.45 - 1.0 Chromium (Cr) 0.1 - 0.55 <0.1 - 1.4 5 - 34 Copper (Cu) 0.03 - 0.35 <0.2 12 - 60 Iron (Fe) 0.008 - 2.0 10,000 - 37,000 4,200 - 11,300 Lead (Pb) 0.001 - 0.1 <0.1 - 28 0.4 - 10.2 Manganese (Mn) 0.03 - 1.0 1,000- 7,000 NA Mercury (Hg) 0.00007 - 0.006 <0.01 - 0.2 0.017 - 2.74 Molybdenum (Mo) 8 - 13 0.3 - 2.2 NA Nickel (Ni) 0.1 - 1.0 <1 .0- 7.0 2 2 - 176 Vanadium (V) 1.9 <1.2 NA Zinc (Zn) 0 .006- 0.12 1 0 - 3,600 10 - 340 From Dept. of Energy (1997a), Offshore Operators Committee (1997), Roe Utvik (1999), and A.G. Melbye, Sintef, Norway (personal communication, 1999).
6 Bioaccumulation in Marine Organisms
clean natural seawater. The metals most frequently present in produced water at elevated concentrations include barium, cadmium, chromium, copper, iron, lead, nickel, and zinc (Neff et al., 1987) (Table 1). Usually only a few of these metals are present at elevated concentrations in a particular produced water sample. For example, Neff et al. (1989c, 1992) reported that only barium, lead, and zinc are present at elevated concentrations in produced water from 2 platforms off Louisiana, U.S.A.
If water flooding with seawater is used to enhance hydrocarbon production, the metal concentrations in produced water often change gradually over time to more closely resemble the metal concentrations in modem seawater (Stephenson et al., 1994). For most metals this is a decrease in concentration. Some chemicals such as barium and radium may precipitate with sulfate if seawater (high in sulfate) is used for water-flood- ing. Therefore, although the volume of produced water usually increases with the age of the well, total mass loadings of metals discharged in produced water may not increase; mass loadings of some metals may actually decrease.
The highest concentrations of arsenic and barium have been recorded for Gulf of Mexico produced waters, probably because these elements usually are not analyzed in produced water from other sources. Barium may be present at high concentrations in produced waters that contain very low concentrations of sulfate (Neff and Sauer, 1995). Water-flooding with seawater may increase the concentration of sulfate (present in sea- water at a concentration of about 900 mg/L) in the formation water, causing barium pre- cipitation as barite, lowering the concentration of barium in the produced water (Stephenson et al., 1994). In the absence of sulfate, barium is soluble in hot, geo- pressured, high ionic strength connate water in the hydrocarbon-beating formation. However, some of the barium may be present as minute particles of barite (Olsen et al., 1995). Arsenic concentrations usually are low, but some produced waters contain ele- vated concentrations. Produced water from the Funan platform in the Gulf of Thailand contains more than 380/~g~ arsenic, more than 65 percent of which is in solution (Frankiewicz et al., 1998). The concentrations of barium, arsenic, and other elements in produced water probably are in equilibrium with elements in the feldspars, plagioclase, biotite, and sandstones in the formation (Bloch and Key, 1981; Macpherson, 1989).
Produced water from seven platforms in the northwest Gulf of Mexico, analyzed by modem analytical methods, contain elevated concentrations of barium, iron, manganese, lead, and zinc, and in a few cases arsenic (Table 3). Several samples of produced water from the Norwegian Sector of the North Sea contain elevated concentrations of mercury and nickel. Produced water from natural gas platforms in the Gulf of Thailand often con- tains elevated concentrations of mercury (1.4 to 235 ~g/L) (Battelle, 1994; Frankiewicz et al., 1998). The mercury is from coal and carbonaceous shales in or near the produc- ing reservoirs and is produced as elemental mercury vapor with the natural gas. Most of the mercury in the produced water is in particulate forms. Unocal Thailand has devel- oped a produced water cleaning process that cleans the produced water to meet proposed environmental standards of <40 mg/L total petroleum hydrocarbons, <10 ktg/L mercury, and <250/~g/L arsenic. Generally, produced water from gas wells contains more mer- cury and probably arsenic than produced water from oil wells.
Nearly all the iron in produced water is particulate and probably is metallic iron or precipitated iron oxide. Naturally biodegraded crude oils often contain a high concen- tration of iron, which may be derived in part from microbial corrosion of steel in the pro- duction tubing and production tank (Olsen et al., 1995). Formation water is anoxic and
Chapter 1 - Produced Water 7
some iron may be present at high concentration in solution. However, when the forma- tion water is brought to the surface and is exposed to the atmosphere, the iron precipi- tates as iron oxides. Manganese behaves like iron; it is soluble in anoxic water but precipitates as various oxyhydroxides in the presence of oxygen.. Several other metals in produced water co-precipitate with iron and manganese oxides. Zinc and possibly lead could be derived in part from galvanized steel structures in contact with the produced water or with other waste streams that may be treated in the oil/water separator system.
The Gulf of Mexico produced waters analyzed recently by advanced methods contain <0.05 to 1.0/tg/L cadmium, similar to concentrations in North Sea produced water (Table 3). Chromium, copper, molybdenum, nickel, and vanadium concentrations usually are low relative to expected concentrations in the environment. Some North Sea produced waters contain copper at a concentration about 200 times higher than the con- centration in seawater.
Radioisotopes. Several naturally occurring radioactive materials (NORM) occur in produced water. The most abundant usually are radium-226 and radium-228 (226Ra and 228Ra). The radium is derived from the radioactive decay of uranium and thorium asso- ciated with certain rocks and clays in the hydrocarbon reservoir (Reid, 1983; Kraemer and Reid, 1984; Michel, 1990). 226Ra (half-life 1,601 years) is an a-emitting daughter of uranium-238 and uranium-234; 228Ra (half-life 5.7 years) is a r-emitting daughter of thorium-232. Although the two radium isotopes are from different sources in the geo- logic formation, their concentrations in produced water tend to covary (Fisher, 1995). Concentrations of both 226Ra and 228Ra increase with salinity in oil and gas well pro- duced waters from coastal and offshore waters of Louisiana, U.S.A. However, the cor- relation between the salinity and concentrations of 226Ra, 228Ra, and total radium in produced water from some formations is not good; many produced waters of all salini- ties contain little or no radium and some low-salinity produced waters contain signifi- cant amounts of radium.
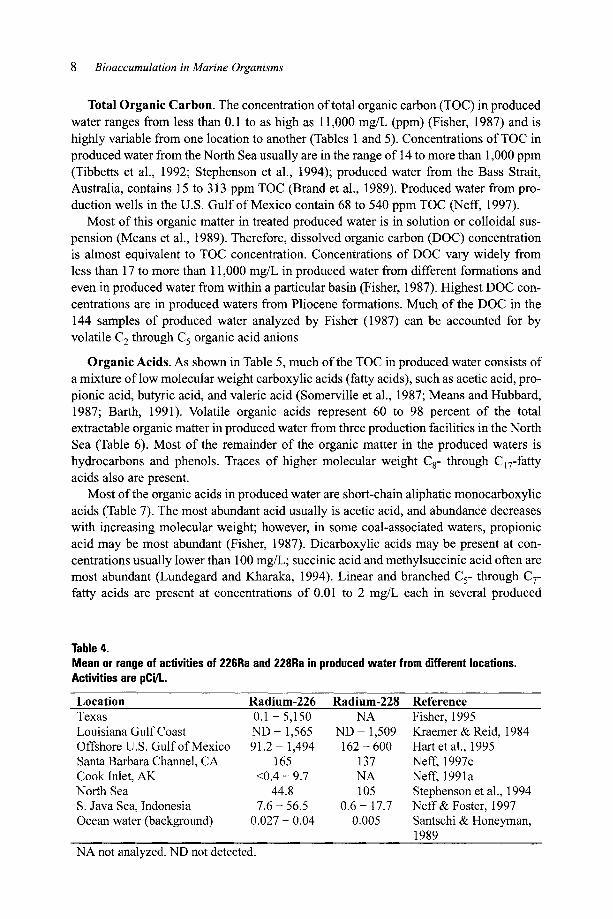
Produced water from 153 oil and gas wells in Texas, U.S.A., contains 0.1 picocurie/L (pCi/L) to 5,150 pCi/L 226Ra, and possibly a similar activity of 228Ra (Fisher, 1995). (1 pCi = 0.037 bequerels [Bq]; 1 Bq = 1 disintegration/sec). A picocurie of 226Ra is equivalent to 1 picogram (pg) of radium; a pCi of 228Ra is equivalent to 0.0037 pg of radium (Santschi and Honeyman, 1989). Concentrations of 226Ra and 228Ra in produced water from platforms along the Louisiana, U.S.A., coast range from below the detection limit to 1,565 pCi/L and 1,509 pCi/L, respectively (Table 4), equivalent to 1.56 ng/L (parts per trillion) and 0.006 ng/L radium, respectively (Kraemer and Reid, 1984; Neff et al., 1989c). Total radium activities in these produced waters range from less than 0.2 pCi/L to more than 5,000 pCi/L. Average concentrations of radium isotopes in pro- duced water from oil and gas wells elsewhere in the world usually are lower than those for produced water from the U.S. Gulf of Mexico region (Table 4). By comparison, the concentration of 226Ra and 228Ra in surface waters of the ocean are 0.027 to 0.040 pCi/L and about 0.005 pCi/L, respectively (Santschi and Honeyman, 1989; Nozaki, 1991).
Several other radionuclides have been identified in the NORM of produced water, including 89Sr, 9~ 212Bi, 214Bi, 228Ac, 21~ 212pb, and 214pb (van Hattum et al., 1992).
Activities of these radionuclides are much lower than those of radium. For example, off- shore produced waters from the U.S. Gulf of Mexico containing 91 to 1,494 pCi/L of 226Ra also contain 5.2 to 16.7 pCi/L of 21~ (Hart et al., 1995).
8 Bioaccumulation in Marine Organisms
Total Organic Carbon. The concentration of total organic carbon (TOC) in produced water ranges from less than 0.1 to as high as 11,000 mg/L (ppm) (Fisher, 1987) and is highly variable from one location to another (Tables 1 and 5). Concentrations of TOC in produced water from the North Sea usually are in the range of 14 to more than 1,000 ppm (Tibbetts et al., 1992; Stephenson et al., 1994); produced water from the Bass Strait, Australia, contains 15 to 313 ppm TOC (Brand et al., 1989). Produced water from pro- duction wells in the U.S. Gulf of Mexico contain 68 to 540 ppm TOC (Neff, 1997).
Most of this organic matter in treated produced water is in solution or colloidal sus- pension (Means et al., 1989). Therefore, dissolved organic carbon (DOC) concentration is almost equivalent to TOC concentration. Concentrations of DOC vary widely from less than 17 to more than 11,000 mg/L in produced water from different formations and even in produced water from within a particular basin (Fisher, 1987). Highest DOC con- centrations are in produced waters from Pliocene formations. Much of the DOC in the 144 samples of produced water analyzed by Fisher (1987) can be accounted for by volatile C 2 through C 5 organic acid anions
Organic Acids. As shown in Table 5, much of the TOC in produced water consists of a mixture of low molecular weight carboxylic acids (fatty acids), such as acetic acid, pro- pionic acid, butyric acid, and valeric acid (Somerville et al., 1987; Means and Hubbard, 1987; Barth, 1991). Volatile organic acids represent 60 to 98 percent of the total extractable organic matter in produced water from three production facilities in the North Sea (Table 6). Most of the remainder of the organic matter in the produced waters is hydrocarbons and phenols. Traces of higher molecular weight C 8- through C17-fatty acids also are present.
Most of the organic acids in produced water are short-chain aliphatic monocarboxylic acids (Table 7). The most abundant acid usually is acetic acid, and abundance decreases with increasing molecular weight; however, in some coal-associated waters, propionic acid may be most abundant (Fisher, 1987). Dicarboxylic acids may be present at con- centrations usually lower than 100 mg/L; succinic acid and methylsuccinic acid often are most abundant (Lundegard and Kharaka, 1994). Linear and branched C 5- through C 7- fatty acids are present at concentrations of 0.01 to 2 mg/L each in several produced
Table 4. Mean or range of activities of 226Ra and 228Ra in produced water from different locations. Activities are pCi/L.
Location Radium-226 Radium-228 Reference Texas 0.1 - 5,150 NA Louisiana Gulf Coast N D - 1,565 N D - 1,509 Offshore U.S. Gulf of Mexico 91.2 - 1,494 162 - 600 Santa Barbara Channel, CA 165 137 Cook Inlet, AK <0.4 - 9.7 NA North Sea 44.8 105 S. Java Sea, Indonesia 7.6 - 56.5 0.6 - 17.7 Ocean water (background) 0.027 - 0.04 0.005
NA not analyzed. ND not detected.
Fisher, 1995 Kraemer & Reid, 1984 Hart et al., 1995 Neff, 1997c Neff, 1991a Stephenson et al., 1994 Neff & Foster, 1997 Santschi & Honeyman, 1989

Chapter 1 - Produced Water 9
Table 5. Concentrations of total dissolved organic carbon (DOC) and total C2- through C5-organic acids in produced water from several geologic basins. The age of each formation is given. Concentrations of DOC and organic acids are mg/L. From Fisher (1987).
Field Age D O C Organic Acids Poui Field, Trinidad Pliocene 234 - 3,777 0 - 3,204
Samaan Field, Trinidad Pliocene 321 - 4,072 0 - 2,428
Teak Field, Trinidad Pliocene 425 - 11,314 0 - 2,795
McAllen Ranch Field, TX Oligocene 124 - 272 27.4 - 54.6
Las Animas County, CO Tertiary 115 - 378 211 - 595
San Juan County, N M Cretaceous 1,000 - 2,185 1,128 - 1,774 La Plata County, CO Cretaceous 553 - 745 60 - 888
Gunnison County, CO Cretaceous 1 9 0 - 355 2 7 2 - 306 Summit County, UT Triassic 4 7 - 172 5 6 - 128 Unita County, WY Triassic 1 7 - 312 13 - 75 Summit County, WY Triassic 323 110
Table 6. Mean concentrations of the main organic fractions in produced water from three offshore production facilities in the Norwegian Sector of the North Sea. BTEX (C6-C8 aromatics) are not included. Concentrations are mg/L (ppm). From Stremgren et al. (1995).
Chemical Class Facility 1 Facility 2 vola t i le Acids (C1-C5+) 817 43
Fatty Acids (C8-C17) 0.5 0.04 Phenols 7.8 0.8
Aliphatic Hydrocarbons (C12-C35) 4.6 25
Aromatic Hydrocarbons (C 10-C35) 1.1 4.5 Total Extractable Organic Matter 831 73 .........
Facility 3 229 0.03 2.8 14.3
2.0 248
Table 7. Concentrations of aliphatic acid anions (organic acids) in produced water from several hydro- carbon-bearing formations. Concentrations are mg/L. From Fisher (1987).
Basin C2 • C3 C4 C5 ~C2-C5 E. Venezuelan Basin 0 - 2859 0 - 1013 0 - 250 0 - 206 0 - 3204 Gulf Coast Basin, TX 2 7 - 51 0 - 4 0 0 2 7 - 55 Raton Basin (Coal) 0 - 170 1 9 8 - 425 0 0 211 - 595 San Juan Basin, NM.(Coal) 0 - 30 51 - 1774 0 0 6 0 - 1774 Piciance Basin, CO (Coal) 8 - 75 231 - 297 0 0 272 - 306 Denver Basin, CO 5 - 6 0 0 - 37 0 - 35 0 - 4 2 0 - 72 Red Desert Basin, WY 195 - 434 40 - 208 0 0 403 - 474 Wamsutter Arch, WY 263 - 491 65 - 423 0 0 556 - 686 Washakie Basin, WY 175 - 557 0.2 - 457 0 0 175 - 1014 Western Overthrust, UT & WY 0 - 81 0 - 19 7 - 4 9 0 13 - 110
* C2, Acetate; C3, Propionate; C4, Butyrate; C5, Valerate.
10 Bioaccumulation in Marine Organisms
waters from California, U.S.A. (Witter and Jones, 1999). Small amounts of aromatic acids (e.g., benzoic acid) also may be present (Means et al., 1989, 1990; Brown et al., 1992). Organic acids are thought to have been produced by hydrous pyrolysis of kero- gen and hydrocarbons in the source rocks and hydrocarbon-bearing formation (Lundegard and Senftle, 1987; Kharaka et al., 1993; Borgund and Barth, 1994).
Phenols. Concentrations of total phenols in produced water usually range from 0.6 to 23 mg/L (Table 1). Highest concentrations are in produced water samples from the North Sea (Grahl-Nielsen, 1987; Stephenson et al., 1994). Methylphenols (cresols) and dimethyl-phenols (xylenols) usually are more abundant than phenol in these samples.
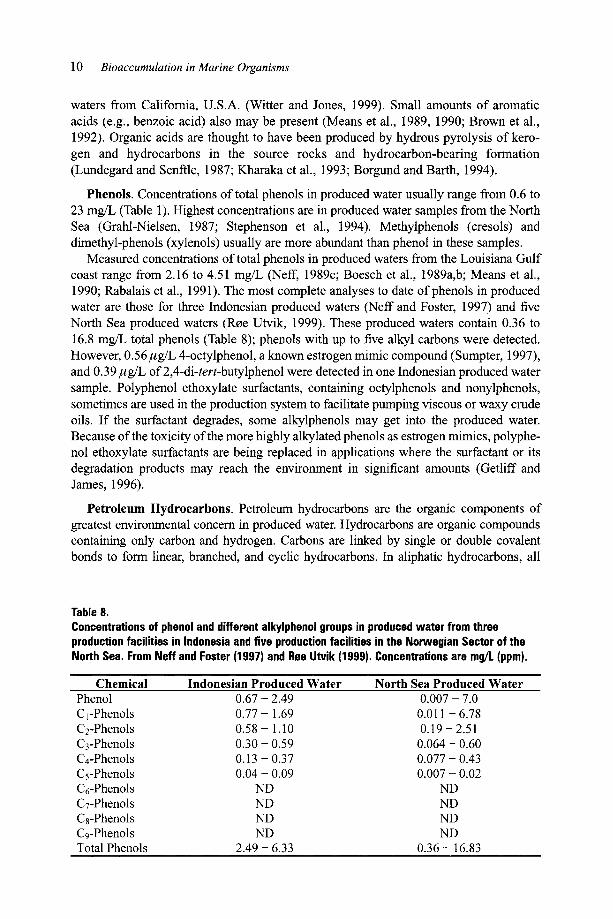
Measured concentrations of total phenols in produced waters from the Louisiana Gulf coast range from 2.16 to 4.51 mg/L (Neff, 1989c; Boesch et al., 1989a,b; Means et al., 1990; Rabalais et al., 1991). The most complete analyses to date of phenols in produced water are those for three Indonesian produced waters (Neff and Foster, 1997) and five North Sea produced waters (Roe Utvik, 1999). These produced waters contain 0.36 to 16.8 m~L total phenols (Table 8); phenols with up to five alkyl carbons were detected. However, 0.56/zg/L 4-octylphenol, a known estrogen mimic compound (Sumpter, 1997), and 0.39/~g/L of 2,4-di-tert-butylphenol were detected in one Indonesian produced water sample. Polyphenol ethoxylate surfactants, containing octylphenols and nonylphenols, sometimes are used in the production system to facilitate pumping viscous or waxy crude oils. If the surfactant degrades, some alkylphenols may get into the produced water. Because of the toxicity of the more highly alkylated phenols as estrogen mimics, polyphe- nol ethoxylate surfactants are being replaced in applications where the surfactant or its degradation products may reach the environment in significant amounts (Getliff and James, 1996).
Petroleum Hydrocarbons. Petroleum hydrocarbons are the organic components of greatest environmental concern in produced water. Hydrocarbons are organic compounds containing only carbon and hydrogen. Carbons are linked by single or double covalent bonds to form linear, branched, and cyclic hydrocarbons. In aliphatic hydrocarbons, all
Table 8. Concentrations of phenol and different alkylphenol groups in produced water from three production facilities in Indonesia and five production facilities in the Norwegian Sector of the North Sea. From Neff and Foster (1997) and Rae Utvik (1999). Concentrations are mg/L (ppm).
Chemical Indonesian Produced Water North Sea Produced Water Phenol 0 .67- 2.49 0.007- 7.0 C1-Phenols 0.77 - 1.69 0.011 - 6.78 C2-Phenols 0.58 - 1.10 0.19 - 2.51 C3-Phenols 0.30 - 0.59 0.064 - 0.60 Ca-Phenols 0.13 - 0.37 0.077 - 0.43 Cs-Phenols 0.04 - 0.09 0.007 - 0.02 C6-Phenols ND ND C7-Phenols ND ND C8-Phenols ND ND C9-Phenols ND ND Total Phenols 2.49 - 6.33 0.36 - 16.83
Chapter 1 - Produced Water 11
carbon-carbon covalent bonds are single. Aromatic hydrocarbons are composed of six- carbon tings in which the six carbon atoms equally share nine covalent bonds.
Petroleum hydrocarbons (measured as oil and grease by infrared spectrometry) account for 25 to 65 percent of the TOC in produced water samples from Cook Inlet (Lysyj, 1982) and 8.5 to 16 percent of the TOC in produced water samples from the Gulf of Mexico analyzed by Neff et al. (1989c). Between 0.6 and 18 percent of the DOC in produced water from a platform on the Northwest Shelf of Australia is petroleum hydro- carbons, measured by GC/FID (Bums and Codi, 1999). C10 through C35 aliphatic and aromatic hydrocarbons account for 0.7 to 40 percent of the total extractable organic mat- ter in three North Sea produced waters (Table 6). It should be pointed out that standard methods required in the U.S. for analysis of oil and grease (e.g., EPA gravimetric Methods 413.1 and 1664 and infrared Method 418.1) are not specific for petroleum hydrocarbons and measure several other ingredients in produced water (e.g., some organic acids) in addition to petroleum hydrocarbons (Brown et al., 1992; Otto and Arnold, 1996).
The aqueous solubility of petroleum hydrocarbons decreases as their size (molecular weight) increases (McAuliffe, 1966; Eastcott et al., 1988). Because the oil/water separa- tor equipment is efficient in removing oil droplets but not dissolved oil from the pro- duced water, most of the petroleum hydrocarbons remaining in the produced water after treatment are low molecular weight aromatic and saturated hydrocarbons that are dis- solved in the produced water.
Volatile Hydrocarbons. The most abundant hydrocarbons in produced water are the one-ring aromatic hydrocarbons, benzene, toluene, ethylbenzene, and xylenes (the BTEX compounds) and low molecular weight saturated hydrocarbons. BTEX may be present in produced water from different sources at concentrations ranging from 0.068 mg/L to occasionally as high 600 mg/L (Table 1). In the North Sea, and probably else- where, produced water from gas wells usually contains higher concentrations of BTEX than produced water from oil wells (Stephenson et al., 1994). Benzene often is the most abundant BTEX compound in effectively-treated produced water, followed by toluene (Table 9). Ethylbenzene and the three xylene isomers usually are present at only a small fraction of the concentrations of benzene and toluene. A large number of C 3- and C 4- benzene isomers may also be present, usually at low concentrations (Table 9).
Aliphatic Hydrocarbons. Saturated (aliphatic) hydrocarbons or alkanes with molec- ular weights in the range of those of BTEX usually are present at much lower concen- trations (usually less than hal0 than those of the monocyclic aromatic hydrocarbons in produced waters (Middleditch, 1981; Sauer, 1981 b; Neff et al., 1989c). For example, two samples of produced water from coastal Louisiana analyzed by Neff et al. (1989c) con- tained 1.09 to 2.14 mg/L C 1 through C s alkanes and 2.43 to 9.51 mg/L BTEX. This is due in large part to the much greater aqueous solubility of BTEX than of saturated hydrocarbons of similar molecular weight (McAuliffe, 1966).
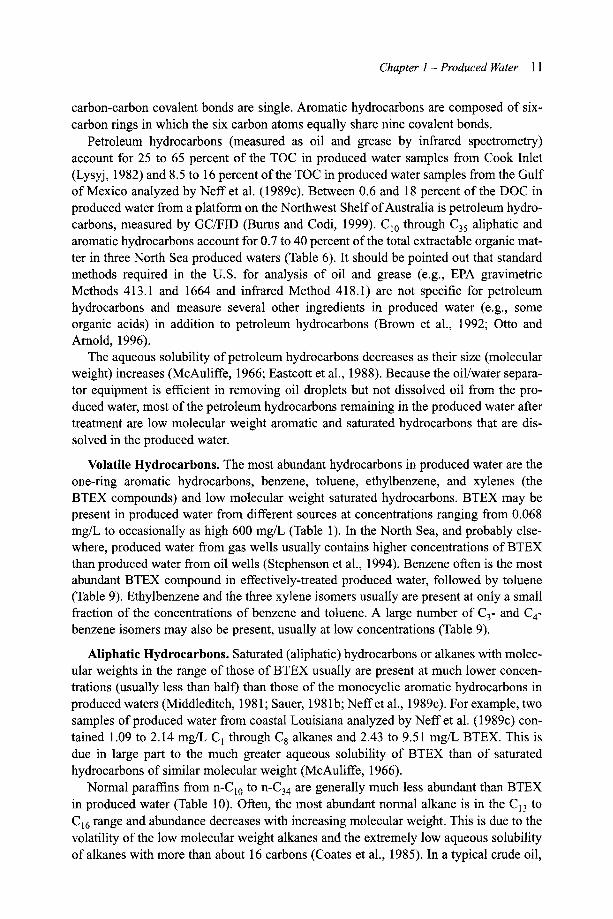
Normal paraffins from n-C10 to n-C34 are generally much less abundant than BTEX in produced water (Table 10). Often, the most abundant normal alkane is in the C13 to C16 range and abundance decreases with increasing molecular weight. This is due to the volatility of the low molecular weight alkanes and the extremely low aqueous solubility of alkanes with more than about 16 carbons (Coates et al., 1985). In a typical crude oil,

12 Bioaccumulation in Marine Organisms
Table 9. Concentrations of BTEX and other selected monocyclic aromatic hydrocarbons in produced water from four platforms in the U.S. Gulf of Mexico (Offshore Operators Committee, 1997a; Dept. of Energy, 1997a) and from three offshore production facilities in Indonesia (Neff and Foster, 1997). Concentrations are pg/L (ppb).
C o m p o u n d 7 G u l f o f M e x i c o 3 I n d o n e s i a n
P r o d u c e d W a t e r s P r o d u c e d W a t e r s Benzene Toluene Ethylbenzene Xylenes (3 isomers) T o t a l BTEX Propylbenzenes (2 isomers) Methylethylbenzenes (3 isomers) Trimethylbenzenes (3 isomers) Tota l C 3 - B e n z e n e s
440 - 2,800 84- 2,300 340- 1,700 89- 800
26- 110 26- 56 160 - 720 13 - 480
960 - 5 ,330 330 - 3 ,640
NA ND - 10 NA 31 - 51 NA 56 - 100
12 - 300 66 - 160
Methylpropylbenzenes (5 isomers) Diethylbenzenes (3 isomers) Dimethylethylbenzenes (6 isomers) Tota l C 4 - B e n z e n e s
NA not analyzed. ND not detected.
NA ND - 6 NA ND NA ND - 33
N D - 120 N D - 68
the concentration of n-paraffins decreases with increasing molecular weight and this is reflected in the relative concentrations of aliphatic hydrocarbons in produced water.
Alkanes have much lower aqueous solubilities than aromatic hydrocarbons of similar molecular weight. Some higher molecular weight alkanes are present in produced water at concentrations higher than their single-phase aqueous solubilities and, therefore, may be in colloidal form or associated with dispersed oil droplets. For example, the solubil- ity of n-alkanes decreases with increasing molecular weight from 52/~g/L for decane (n- C10 ) to less than 6x10 -7/tg/L for tetracosane (n-C24). These solubilities are lower than concentrations of these alkanes in many produced waters (Table 10), indicating that the higher molecular weight alkanes are not in solution in the produced water. The particu- late fraction of produced water from a platform on the Northwest Shelf of Australia con- tains 441 to 13,089/tg/L total alkanes, of which 75 to 81 percent is in the unresolved complex mixture (UCM) (Bums and Codi, 1999). The most abundant alkanes contain 12 to 19 carbons. The alkane composition of the produced water particles resembles that of the light crude oil produced on the platform, indicating that the particles are oil droplets not removed by the oil/water separator. The concentration of dissolved alkanes in the produced water was not measured. The oil/water separator system is designed to efficiently remove oil droplets from the produced water; therefore, there is a strong inverse correlation between the efficiency of oil/water separation and the concentration of n-alkanes in produced water.
Polycyclic A r o m a t i c H y d r o c a r b o n s . Polycyclic aromatic hydrocarbons (PAHs: also called polynuclear aromatic hydrocarbons), defined as hydrocarbons containing two or more fused aromatic tings, are the petroleum hydrocarbons of greatest environmental concern in produced water, because of their toxicity and persistence in the marine
Chapter 1 - Produced Water 13
Table 10. Concentrations of n-alkanes in produced water from two platforms in coastal Louisiana and two platforms in Thailand. Estimated aqueous solubilities of several alkanes are included for comparison. Concentrations are/Jg/L (ppb). From Neff et al. (1989c) and Battelle (1994).
Chemical Aqueous Solubility Louisiana Thailand Decane (n-C10) 52 14 - 19 169 - 1,010 Undecane (n-C11) 40 3 0 - 93 307 - 1,110 Dodecane (n-C12) 3.7 4 4 - 193 3 8 3 - 1,080 Tridecane (n-C13) 1.0 55 - 272 4 5 6 - 1,030 Tetradecane ( r I -Cl4) 0.7 56 - 308 545 - 957 Pentadecane (n-C15) 0.08 5 7 - 266 483 - 830 Hexadecane (I1-C16) 0 . 0 5 55 -- 177 336 -- 629 Heptadecane (n-C17) 0.006 5 6 - 142 3 6 7 - 705 Octadecane (n-C18) 0.004 33 - 215 205 - 384 Nonadecane (!'1-C19) 0.0004 38 - 180 140 - 338 Eicosane (n-C20) 0.0003 3 6 - 171 9 6 - 277 Heneicosane (n-C21) --- 30 - 123 71 - 219 Docosane (n-C22) --- 25 - 107 52 - 172 Tricosane (n-C23) --- 22 - 85 4 0 - 144 Tetracosane (I1-C24) 0.0000006 20 - 69 30 - 105 Pentacosane (n-C25) --- 18 - 57 25 - 87 Hexacosane (I1-C26) - - - 16 - 50 17 - 65 Heptacosane (n-C27) --- 12 - 40 17 - 56 Octacosane (n-C28) --- 10 - 30 8 - 43 Nonacosane (1"!-C29) - - - 8 -- 26 8 -- 36 Triacontane (n-C30) --- 6 - 19 8 - 28 Hentriacosane (n-C31) --- 7 - 18 6 - 24 Dotriacontane (n-C32) --- 4 - 1 1 N D - 16 Tritriacosane (n-C33) --- NA ND - 1 3 Tetratriacosane (I1-C34) - - - 2 - 7 N D - 7 Total n-Alkanes --- 606 - 2,680 3 ,900 - 7,830
ND not detected; N A not analyzed.
envi ronment (Neff, 1987). Concentra t ions o f total PAHs in produced water typical ly range
f rom about 0.04 to 3.0 m g / L (40 to 3 ,000 / t g /L : ppb) (Table 1). Naph tha lene (two fused
aromatic t ings) and occasional ly phenanthrene (three fused aromatic t ings) and their alkyl
homologues are the only PAHs that are somet imes present at h igher than trace concentra-
tions. These low molecu la r weight PAHs usual ly represent more than 95 percent o f the
total PAHs in produced water. They often are present at h igher concentrat ions in produced
water f rom gas wel ls than in produced water f rom oil wel ls (S tephenson et al., 1994).
Individual h igher molecu la r weight PAHs, such as the carcinogen, benzo(a)pyrene,
rarely are present in produced water at concentrat ions greater than about 0 . 1 / t g ~ . The
aqueous solubili ty o fbenzo (a )py rene is so low (-- 1 .6 / tg /L) and its affinity for the oil phase
so high (log octanol /water part i t ion coefficient, log Kow, 6.13) that it wou ld not be expected
to be present in p roduced water in a dissolved form. Crude oils rarely contain more than
about 1 m g / L benzo(a)pyrene (Neff, 1979), so oil droplets would have to be present at a
concentrat ion o f more than 1,000 p p m for the produced water to contain 1 ktg/L
14 Bioaccumulation in Marine Organisms
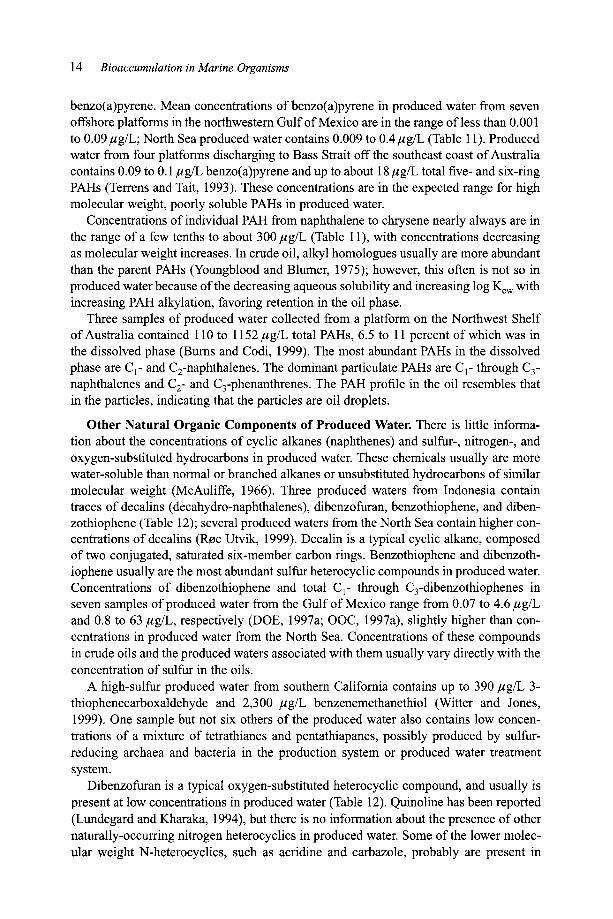
benzo(a)pyrene. Mean concentrations of benzo(a)pyrene in produced water from seven offshore platforms in the northwestem Gulf of Mexico are in the range of less than 0.001 to 0.09 ktg/L; North Sea produced water contains 0.009 to 0.4 ktg/L (Table 11). Produced water from four platforms discharging to Bass Strait off the southeast coast of Australia contains 0.09 to 0.1 l, tg/L benzo(a)pyrene and up to about 18 ktg/L total five- and six-ring PAHs (Terrens and Tait, 1993). These concentrations are in the expected range for high molecular weight, poorly soluble PAHs in produced water.
Concentrations of individual PAH from naphthalene to chrysene nearly always are in the range of a few tenths to about 300 ktg/L (Table 11), with concentrations decreasing as molecular weight increases. In crude oil, alkyl homologues usually are more abundant than the parent PAHs (Youngblood and Blumer, 1975); however, this often is not so in produced water because of the decreasing aqueous solubility and increasing log Kow with increasing PAH alkylation, favoring retention in the oil phase.
Three samples of produced water collected from a platform on the Northwest Shelf of Australia contained 110 to 1152 ktg/L total PAHs, 6.5 to 11 percent of which was in the dissolved phase (Bums and Codi, 1999). The most abundant PAHs in the dissolved phase are C 1- and C2-naphthalenes. The dominant particulate PAHs are C 1- through C 3- naphthalenes and C 2- and C3-phenanthrenes. The PAH profile in the oil resembles that in the particles, indicating that the particles are oil droplets.
Other Natural Organic Components of Produced Water. There is little informa- tion about the concentrations of cyclic alkanes (naphthenes) and sulfur-, nitrogen-, and oxygen-substituted hydrocarbons in produced water. These chemicals usually are more water-soluble than normal or branched alkanes or unsubstituted hydrocarbons of similar molecular weight (McAuliffe, 1966). Three produced waters from Indonesia contain traces of decalins (decahydro-naphthalenes), dibenzofuran, benzothiophene, and diben- zothiophene (Table 12); several produced waters from the North Sea contain higher con- centrations of decalins (Roe Utvik, 1999). Decalin is a typical cyclic alkane, composed of two conjugated, saturated six-member carbon rings. Benzothiophene and dibenzoth- iophene usually are the most abundant sulfur heterocyclic compounds in produced water. Concentrations of dibenzothiophene and total C 1- through C3-dibenzothiophenes in seven samples of produced water from the Gulf of Mexico range from 0.07 to 4.6 ktg/L and 0.8 to 63/zg/L, respectively (DOE, 1997a; OOC, 1997a), slightly higher than con- centrations in produced water from the North Sea. Concentrations of these compounds in crude oils and the produced waters associated with them usually vary directly with the concentration of sulfur in the oils.
A high-sulfur produced water from southern California contains up to 390 ~tg/L 3- thiophenecarboxaldehyde and 2,300 /zg/L benzenemethanethiol (Witter and Jones, 1999). One sample but not six others of the produced water also contains low concen- trations of a mixture of tetrathianes and pentathiapanes, possibly produced by sulfur- reducing archaea and bacteria in the production system or produced water treatment system.
Dibenzofuran is a typical oxygen-substituted heterocyclic compound, and usually is present at low concentrations in produced water (Table 12). Quinoline has been reported (Lundegard and Kharaka, 1994), but there is no information about the presence of other naturally-occurring nitrogen heterocyclics in produced water. Some of the lower molec- ular weight N-heterocyclics, such as acridine and carbazole, probably are present in
Chapter 1 - Produced Water 15
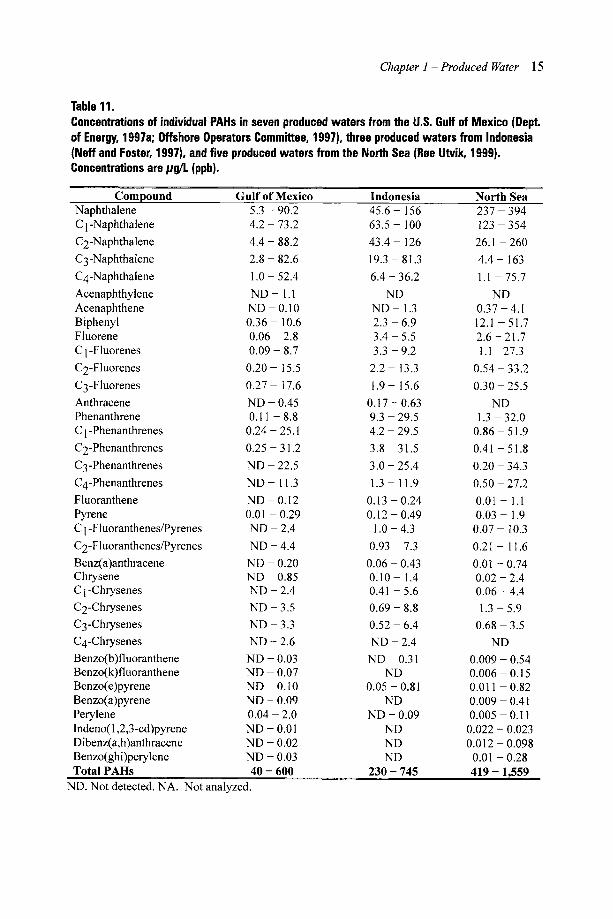
Table 11. Concentrations of individual PAHs in seven produced waters from the U.S. Gulf of Mexico (Dept. of Energy, 1997a; Offshore Operators Committee, 1997), three produced waters from Indonesia (Neff and Foster, 1997), and five produced waters from the North Sea (Ree Utvik, 1999). Concentrations are/Jg/L (ppb).
C o m p o u n d G u l f o f M e x i c o I n d o n e s i a N o r t h Sea
N a p h t h a l e n e 5.3 - 9 0 . 2 4 5 . 6 - 156 2 3 7 - 3 9 4
C 1 - N a p h t h a l e n e 4 .2 - 73 .2 63 .5 - 100 123 - 3 5 4
C 2 - N a p h t h a l e n e 4 .4 - 88 .2 4 3 . 4 - 126 26.1 - 2 6 0
C 3 - N a p h t h a l e n e 2 .8 - 82 .6 19.3 - 81 .3 4 .4 - 163
C 4 - N a p h t h a l e n e 1 . 0 - 5 2 . 4 6 . 4 - 3 6 . 2 1.1 - 7 5 . 7
A c e n a p h t h y l e n e N D - 1.1 N D N D
A c e n a p h t h e n e N D - 0 . 1 0 N D - 1.3 0 . 3 7 - 4.1
B i p h e n y l 0 . 3 6 - 10.6 2 .3 - 6 .9 12.1 - 51 .7
F l u o r e n e 0 . 0 6 - 2 .8 3 . 4 - 5.5 2 . 6 - 2 1 . 7
C 1 - F l u o r e n e s 0 . 0 9 - 8 .7 3 .3 - 9 .2 1.1 - 2 7 . 3
C 2 - F l u o r e n e s 0 . 2 0 - 15.5 2 . 2 - 13.3 0 . 5 4 - 3 3 . 2
C 3 - F l u o r e n e s 0 . 2 7 - 17.6 1.9 - 15 .6 0 . 3 0 - 25 .5
A n t h r a c e n e N D - 0 .45 0 . 1 7 - 0 .63 N D
P h e n a n t h r e n e 0.11 - 8 .8 9.3 - 29 .5 1.3 - 3 2 . 0
C 1 - P h e n a n t h r e n e s 0 . 2 4 - 25 . l 4 .2 - 29 .5 0 . 8 6 - 51 .9
C 2 - P h e n a n t h r e n e s 0 .25 - 31 .2 3 .8 - 31 .5 0 .41 - 51 .8
C 3 - P h e n a n t h r e n e s N D - 2 2 . 5 3 . 0 - 2 5 . 4 0 . 2 0 - 34 .3
C 4 - P h e n a n t h r e n e s N D - 11.3 1.3 - 11 .9 0 . 5 0 - 2 7 . 2
F l u o r a n t h e n e N D - 0 . 1 2 0 .13 - 0 . 2 4 0 .01 - 1.1
P y r e n e 0 .01 - 0 . 2 9 0 . 1 2 - 0 . 4 9 0 .03 - 1.9
C 1 - F l u o r a n t h e n e s / P y r e n e s N D - 2 .4 1.0 - 4 .3 0 . 0 7 - 10.3
C 2 - F l u o r a n t h e n e s / P y r e n e s N D - 4 .4 0 .93 - 7.3 0.21 - 11.6
B e n z ( a ) a n t h r a c e n e N D - 0 . 2 0 0 . 0 6 - 0 .43 0.01 - 0 . 7 4
C h r y s e n e N D - 0 .85 0 . 1 0 - 1.4 0 . 0 2 - 2 .4
C l - C h r y s e n e s N D - 2 .4 0.41 - 5 .6 0 . 0 6 - 4 .4
C 2 - C h r y s e n e s N D - 3 .5 0 . 6 9 - 8 .8 1.3 - 5 .9
C 3 - C h r y s e n e s N D - 3 .3 0 . 5 2 - 6 .4 0 . 6 8 - 3 .5
C 4 - C h r y s e n e s N D - 2 .6 N D - 2 .4 N D
B e n z o ( b ) f l u o r a n t h e n e N D - 0 .03 N D - 0.31 0 . 0 0 9 - 0 . 5 4
B e n z o ( k ) f l u o r a n t h e n e N D - 0 . 0 7 N D 0 . 0 0 6 - 0 .15
B e n z o ( e ) p y r e n e N D - 0 . 1 0 0 .05 - 0 .81 0 . 0 1 1 - 0 . 8 2
B e n z o ( a ) p y r e n e N D - 0 . 0 9 N D 0 . 0 0 9 - 0.41
P e r y l e n e 0 . 0 4 - 2 .0 N D - 0 . 0 9 0 . 0 0 5 - 0 .11
I n d e n o ( 1 , 2 , 3 - c d ) p y r e n e N D - 0 .01 N D 0 . 0 2 2 - 0 . 0 2 3
D i b e n z ( a , h ) a n t h r a c e n e N D - 0 . 0 2 N D 0 . 0 1 2 - 0 . 0 9 8
B e n z o ( g h i ) p e r y l e n e N D - 0 .03 N D 0.01 - 0 . 28
Tota l P A H s 40 - 600 230 - 745 419 - 1 ,559
N D . N o t d e t e c t e d . N A . N o t a n a l y z e d .

16 Bioaccumulation in Marine Organisms
Table 12. Concentration ranges of selected cyclic alkanes and heterocyclic compounds in produced water from three production treatment facilities in the Norwegian Sector of the North Sea and in Indonesia. Concentrations are pg/L. From Neff and Foster (1997) and Ree Utvik (1999).
Compound North Sea Indonesia Decalin 1 . 4 5 - 112 1 . 0 - 16.8 C 1-Decalins 1.51 - 164 1.94 - 38.9
C2-Decalins 1.01 - 178 2.53 - 35.6
C3-Decalins 0.96 - 142 ND - 33.3
C4-Decalins 0 . 8 7 - 127 N D - 35.0
Benzothiophene ND ND - 0.4 C 1-Benzothiophenes 0.48 - 5.44 1.7 - 2.6
C2-Benzothiophenes 0.52 - 6.19 4.2 - 8.2
C3-Benzothiophenes 0.37 - 5.58 2.8 - 4.0
C4-Benzothiophenes 0.14 - 2.06 ND - 1.5
Dibenzothiophene 0.24 - 9.3 0.47 - 3.8 C 1-Dibenzothiophenes 0.28 - 16.1 1.0 - 4.1
C2-Dibenzothiophenes 0.20 - 16.8 1.0 - 4.2
C 3-Dibenzothiophenes 0.15 - 13.2 ND - 3.1
C4-Dibenzothiophenes 0.16 - 5.2 ND
Dibenzofuran 1.2 - 14.1 2.2 - 7.2 ND: Not detected.
some produced waters at low concentrations. N,N-dimethylalkylamines were detected at concentrations up to 2 ,400/ tg /L in California produced water; they may not be natural ingredients of the produced water, but could have been added as production treatment chemicals (Willit and Jones, 1999).
Several other soluble organic chemicals have been identified in produced water (Lundegard and Kharaka (1994). These include cyclohexanone, serine, glycine, alanine, aspartic acid, and citric acid. Barth (1987) identified lactic acid in two samples of
Norwegian produced water.
1.1.3 Production Chemicals in Produced Water
Large numbers of specialty additives are available for use in the production system of a well to aid in recovery and pumping of hydrocarbons, protect the production system from corrosion, and facilitate separation of oil, gas, and water (Table 13). The difference between the mass of a chemical used and the amount discharged or injected in Table 13 is approximately equivalent to the mass that remains with the produced oil and gas streams. Many of these chemicals are more soluble in the oil than in produced water and
remain in the oil phase. Others are water-soluble and concentrate in the produced water and are disposed of with it. The point in the production stream where the chemical is
Chapter 1 - Produced Water 17
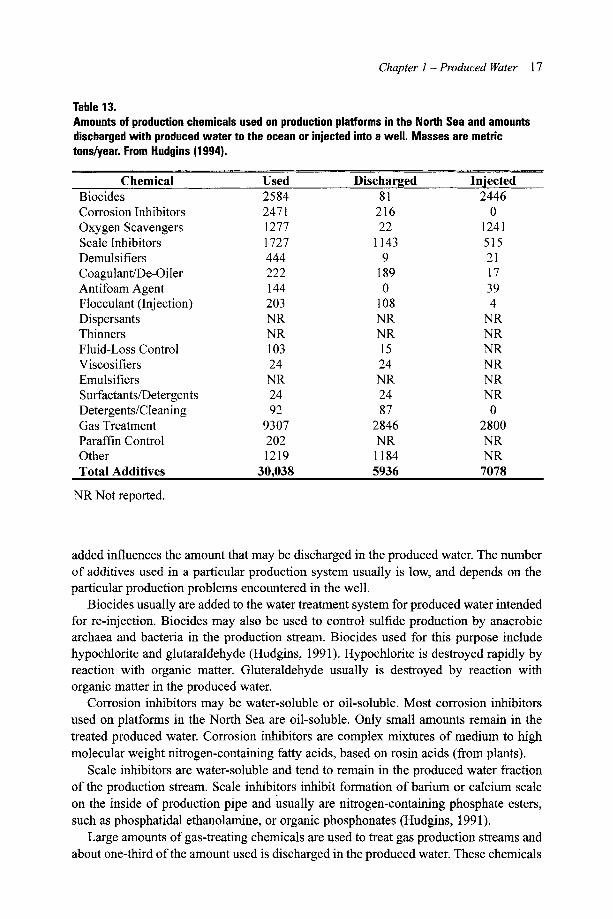
Table 13. Amounts of production chemicals used on production platforms in the North Sea and amounts discharged with produced water to the ocean or injected into a well, Masses are metric tons/year. From Hudgins (1994).
Chemical Used Discharged Injected Biocides 2584 81 2446 Corrosion Inhibitors 2471 216 0 Oxygen Scavengers 1277 22 1241 Scale Inhibitors 1727 1 ! 43 515 Demulsifiers 444 9 21 Coagulant/De-Oiler 222 189 17 Antifoam Agent 144 0 39 Flocculant (Injection) 203 108 4 Dispersants NR NR NR Thinners NR NR NR Fluid-Loss Control 103 15 NR Viscosifiers 24 24 NR Emulsifiers NR NR NR S urfactants/Detergents 24 24 NR Detergents/Cleaning 92 87 0 Gas Treatment 9307 2846 2800 Paraffin Control 202 NR NR Other 1219 1184 NR Total Additives 30,038 5936 7078
NR Not reported.
added influences the amount that may be discharged in the produced water. The number of additives used in a particular production system usually is low, and depends on the particular production problems encountered in the well.
Biocides usually are added to the water treatment system for produced water intended for re-injection. Biocides may also be used to control sulfide production by anaerobic archaea and bacteria in the production stream. Biocides used for this purpose include hypochlorite and glutaraldehyde (Hudgins, 1991). Hypochlorite is destroyed rapidly by reaction with organic matter. Gluteraldehyde usually is destroyed by reaction with organic matter in the produced water.
Corrosion inhibitors may be water-soluble or oil-soluble. Most corrosion inhibitors used on platforms in the North Sea are oil-soluble. Only small amounts remain in the treated produced water. Corrosion inhibitors are complex mixtures of medium to high molecular weight nitrogen-containing fatty acids, based on rosin acids (from plants).
Scale inhibitors are water-soluble and tend to remain in the produced water fraction of the production stream. Scale inhibitors inhibit formation of barium or calcium scale on the inside of production pipe and usually are nitrogen-containing phosphate esters, such as phosphatidal ethanolamine, or organic phosphonates (Hudgins, 1991).
Large amounts of gas-treating chemicals are used to treat gas production streams and about one-third of the amount used is discharged in the produced water. These chemicals

18 Bioaccumulation in Marine Organisms
include methanol, ethylene glycol, and triethylene glycol. Methanol and ethylene glycol are used to prevent gas hydrate formation; they remain associated with the water phase. Triethylene glycol is used in a closed loop system to dehydrate the gas. It is recycled and little enters the produced water stream. Di- or tetra-ethylene glycol may be used instead of triethylene glycol for gas dehydration at some production facilities. If the produced gas is sour (contains high concentrations of H2S and CO2), it may be sweetened in a closed loop system containing polyethylene glycol dimethyl ether, which acts as an absorbent for the sour gases. Little of the polyethylene glycol gets into the produced water stream and is discharged with it.
1.2 VOLUMES OF PRODUCED WATER DISCHARGED TO THE OCEAN
Produced water represents the largest volume waste stream in production operations on most offshore platforms (Stephenson, 1991). The amount of produced water dis- charged from a single platform usually is less than 9,400 barrels/day (bbl/d) (1.5 million L/d), whereas discharges from large facilities that process produced water from several platforms may exceed 25 million liters/day (Menzie, 1982). As a general rule, less produced water is produced from gas than from oil wells. Current discharge permits for the U.S. Gulf of Mexico prohibit discharge of more than 25,000 bbl/d (4 million L/d) of produced water from a single platform.
Elsewhere in the world, produced water discharges to the ocean may be larger than those to the U.S. Gulf of Mexico. In 1992, the Statfjord oil field, the largest offshore field in the world, discharged an average of 194,000 bbl/d (30.9 million liters/d) of treated produced water to the Norwegian sector of the North Sea (Ynnesdal and Furuholt, 1994). Three production processing platforms off the coast of Indonesia each process oil, gas, and water from several wells and each discharges 120,000 to 610,000 bbl/d (19.1 to 97 million liters/d) of produced water to the west Java Sea (Smith et al., 1996). The three offshore production facilities discharged a combined total of 192 million L/d of pro- duced water to the West Java Sea in 1996 (Table 14) and the discharges were expected to increase to about 262 million L/d by 1998.
The total volume of produced water discharged to US waters of the Gulf of Mexico in 1991 was approximately 549 million L/d (Rabalais et al., 1991) (Table 14). Most of the water was from platforms in state waters (less than 4.8 km from shore) (MMS, 1995). In 1991, an average of 438 million L/d of produced water was discharged to the entire North Sea (Stephenson et al., 1994). The average produced water discharge rate to the
Table 14. Volumes of treated produced water discharged in the early and mid 1990s from oil and gas plat- forms to the ocean in different parts of the world. Discharge rates are liters/day. From Neff (1997a).
Location U.S. Gulf of Mexico Santa Barbara Channel, California North Sea Australia West Java Sea (3 production facilities)
, ,
Discharge Rate 549,000,000 16,200,000
789,000,000 100,000,000 192,000,000
Chapter 1 - Produced Water 19
entire North Sea increased to 512 million L/d in 1993 (R~e et al., 1996) and was esti- mated at 789 million L/d in 1996 (Garland, 1998). Fourteen offshore platforms discharge 159,000 L/d to 3.2 million L/d each of produced water to offshore waters of southern California. The total volume of produced water discharge to California waters is about 16.2 million L/d (Neff, 1997c). About 100 million L/d of treated produced water is dis- charged from production platforms and shore-based treatment facilities to Australian waters, most of it from the Gippsland oil and gas field to the Bass Strait (Black et al., 1994). Treated produced water is discharged to the ocean in many other parts of the world, including the Arabian Gulf, South America, the former Soviet Union, and Africa. However, information is not available on the volumes of produced water discharged and its chemical and physical characteristics.
In most oil and gas fields, relatively little water is produced in the initial phases of production. However, the total fraction of production accounted for by produced water often increases as production continues until, in an old, nearly depleted field, production may be as high as 95 percent water and 5 percent fossil fuels (Read, 1978). Over the eco- nomic life of a producing field, the volume of produced water may exceed the volume of fossil fuel produced by a factor of as much as ten (Stephenson, 1991). Most of the oil and gas fields in the western Gulf of Mexico, the North Sea, and the Bass Strait of Australia are mature or declining; produced water production is increasing as fossil fuel production decreases (Brendahaug et al., 1993; Black et al., 1994; MMS, 1995).
1.3 FATE OF CHEMICALS FROM PRODUCED WATER IN THE OCEAN
1.3.1 Modeled Dilution of the Produced Water Plume
Saline produced waters dilute rapidly upon discharge to well-mixed marine waters. Dispersion modeling studies of the fate of produced water differ in specific details but all predict a rapid initial dilution of discharges by 30- to 100-fold within the first few tens of meters of the outfall, followed by a slower rate of dilution at greater distances (Smith, 1993; Terrens and Tait, 1993; Stromgren et al., 1995; Brandsma and Smith, 1996). When discharge volumes of buoyant or neutral-density produced water are very high, dilution may be slower. Factors that affect the rate of dilution of produced water following dis- charge to the ocean include discharge rate, ambient current speed, turbulent mixing regime, water column stratification, water depth, and difference in density (as deter- mined by temperature and total dissolved solids concentration) and chemical composi- tion between the produced water and ambient seawater.
Terrens and Tait (1993) used the Offshore Operators Committee (OOC) model to pre- dict the fate of produced water discharged from Platform Halibut to Bass Strait off south- eastern Australia. At the time of the modeling, the produced water discharge rate from Platform Halibut was 14 million L/d and the median ambient current speed was 26 cm/sec (Table 15). The produced water had a salinity similar to that of ambient seawater and a temperature, at discharge, of 90~ the produced water plume was buoyant. Under these conditions, the produced water was diluted nearly 30-fold within 10 m of the dis- charge (at about the point where the buoyant plume reached the sea surface) and by 1,800-fold 1,000 m down-current of the produced water discharge. At 100 m down- current from the discharge site, the maximum concentration of produced water in the plume was 0.45 percent (Table 15). The temperature of the plume dropped to within I~

20 Bioaccumulation in Marine Organisms
Table 15. Modeled dilutions of produced waters discharged to different offshore waters under different oceanographic regimes. The OOC model was used in all simulations. From Terrens and Tait (1993) and Brandsma and Smith (1996).
Location Discharge Rate Current Speed Concentration at 100 m (L/d) (cm/s) (% Produced Water)
Gulf of Mexico 115,740 3.3 0.043 Gulf of Mexico 115,740 9.5 0.073 Gulf of Mexico 115,740 25,3 0.097 Gulf of Mexico 3,975,000 3.3 0.18 Gulf o f Mexico 3,975,000 9.5 0.32
Gulf of Mexico 3,975,000 25.3 0.32 North Sea 9,992,000 22 1.3 Bass Strait 14,000,000 26 0.45
of ambient within about 15 to 20 m of the discharge and became dynamically indistin- guishable from ambient seawater.
Brandsma and Smith (1996) modeled the fate of produced water discharged under typical Gulf of Mexico conditions. They used two discharge rates: 115,740 L/d, which is the median flow rate for offshore discharges to the Gulf of Mexico; and 3,975,000 L/d, which is the maximum allowable discharge rate from a single port to the Gulf of Mexico. The effluent was a hypersaline brine that was discharged at a temperature of about 29~ Therefore, it was denser than the ambient seawater and tended to sink. For a median produced water discharge rate of 115,740 L/d, the predicted concentration of produced water in the plume 100 m down-current from the discharge ranged from 0.043 to 0.097 percent, depending on ambient current speed (Table 15). At the higher discharge rate for the Gulf of Mexico, dilutions at 100 m down-current from the discharge ranged from 0.18 to 0.32 percent produced water, depending on current speed.
Brandsma and Smith (1996) also reported results of modeling of a North Sea dis- charge. The modeled discharge of 9,992,000 L/d of slightly buoyant produced water (24.6 ppt salinity and 30~ was diluted to 1.3 percent within 100 m of the discharge. These simulations using the OOC model show the effects of discharge rate and current speed on the rate of dilution of the produced water plume. There is an inverse relation- ship between discharge rate and current speed on one hand and dilution rate on the other.
Modeling studies of high-volume discharges of warm high-salinity produced water to the North Sea yielded predicted dilutions of about 500-fold within about 60 m of the out- fall under well-mixed water column conditions; under conditions of a stratified water column, a predicted 300-fold dilution was reached 60 m from the discharge (Stephenson et al., 1994). Further dilution was slower; a 1,000-fold dilution was attained after about 1 hour when the produced water plume had drifted about 1,000 m.
Pertimina/Maxus operates 63 platforms in the West Java Sea north of the Sunda Strait in Indonesian waters (Smith et al., 1996a,b; Smith and Tyler, 1997). Produced water is treated to remove dispersed hydrocarbons and discharged to the ocean through six sub- sea outfalls on three offshore production facilities (Widuri, Krisna, and Cinta). Cinta has two produced water discharges, Widuri has three, and Krisna has one. The current total
Chapter 1 - Produced Water 21
volume of treated produced water discharged from the three offshore facilities is approx- imately 192 million L/d (Smith and Tyler, 1997).
The produced water from the three facilities has a low salinity, ranging from 10 to 18 %o, suggesting that the produced water is derived from ancient fresh water. Discharge tem- peratures range from 62 to 9 I~ Because of their low salinities and high temperatures, produced waters from the three production facilities are buoyant in the ambient seawa- ter. The outfalls are located at 3 to 15 m below the sea surface. However, the buoyant plumes from the three facilities come to the surface within 10 m down-current of the out- falls (Smith et al., 1996b). This usually is under the platforms. The multiple produced water discharges from a platform (either Cinta or Widuri) tend to merge before or immediately upon reaching the sea surface. Thus, the discharges from a given platform can be modeled as a single discharge.
The dilution and potential biological effects of the produced water plumes from the three facilities have been modeled with the BMT PISCES model (Maxus Southeast Sumatra, Inc., 1995; Tyler et al., 1997). Initial dilution (dilution occurring between the time the produced water leaves the outfall and reaches the sea surface) was modeled under different seasonal environmental conditions for each platform using the CORMIX model. Two seasonal monsoons, the southeast monsoon and the northwest monsoon, interspersed with short transitional periods, control net surface water current flows. These net flows are superimposed on diurnal tidal flows. The complex current regime causes the produced water plume to wander in different directions from the platforms on daily and seasonal scales. Plume dilution is slowed during periods of slack surface cur- rents and increases during maximum surface flows that may exceed 2 km/h. This current regime results in pooling of the produced water plume during periods of slack currents; areas of higher produced water concentration are interspersed with zones of lower produced water concentrations. The BMT model predicted that the produced water concentration in a typical pool in the produced water plume from the Widuri facility is 3.3 percent (the pools in the Widuri plume are interspersed by water predicted to contain about 0.17 percent produced water).
The initial dilution of the produced water following discharge to the ocean is differ- ent for each of the three facilities because of differences in produced water discharge rates, temperatures, salinities, and discharge pipe diameter. The initial dilution also varies seasonally because of shifts in surface current speed and direction. Initial dilutions of the effluents from the three platforms vary from 12- to 120-fold. The initial dilutions are inversely related to produced water discharge rate and directly related to surface water current speed.
Because of its great buoyancy, the plume spreads as a thin layer 1 to 2 m thick on the sea surface, with little vertical or lateral dispersion. There appears to be limited vertical and lateral mixing of the produced water plume with ambient seawater. As a result, the produced water is diluted slowly, particularly in pools. A produced water pool more than 6 km down-current from the high-volume discharge from the Widuri facility may still contain 3 percent produced water, representing a 30-fold dilution, according to the model (Smith et al., 1996b).
In most marine environments, current speeds and directions are not constant (Terrens and Tait, 1993; Brandsma and Smith, 1996). Superimposed on a net or residual current direction are tidal currents that form current ellipses that recur according to the local tidal regime. Tidal current speeds vary from near zero at the neap tide to maximum values
22 Bioaccumulation in Marine Organisms
during the middle of ebb and flow tides. Thus, the produced water is discharged into a sur- face current regime that is continuously varying in speed and direction. The diluting plume may follow an elliptical path, returning to near the discharge point, while being advected gradually in the direction of net current flow. Superimposed on these flows are wind-driven surface currents that may alter direction and speed of the surface water cur- rents. Under these conditions, the concentration of the produced water plume at any loca- tion around the discharge site is highly variable over time and space. Modeled dispersion of produced water plumes in the West Java Sea (Smith et al., 1996), Bass Strait (Terrens and Tait, 1996), and Northwest Shelf of Australia (King and McAllister, 1998), and the North Sea (Rye et al., 1999) shows a complex distribution of concentrations of plume constituents around the discharge due to the continuously changing water current field. Attached and mobile marine organisms in the vicinity of the discharge are being exposed to constantly changing produced water concentrations. The daily discharge of 11.6 mil- lion L/d of treated produced water in the vicinity of the Ekofisk facility in the North Sea is diluted on a regional scale by about 100,000-fold (Rye et al., 1999).
1.3.2 Fate of Chemicals in Produced Water Plumes
Field measurements of produced water dilution are highly variable but confirm the predictions of modeling studies, that dilution usually is rapid. Continental Shelf Associates (1993) reported that radium-226 from a 1.07 million L/d produced water dis- charge in a water depth of 18 m in the Gulf of Mexico was diluted by a factor of 426 at 5 m from the discharge, and by a factor of 1,065 at 50 m from the discharge. The current speed at the time of the measurements was 15 cm/sec and there was little vertical strati- fication of the water column. The OOC but not the CORMIX model accurately predicted the dilutions measured in the field. Produced waters from the Gulf of Mexico contain high concentrations of dissolved barium. It is probable that the radium in the produced water co-precipitated rapidly with barium sulfate in the sulfate-rich receiving waters.
Smith et al. (1994) used a dye tracer to measure dilution of produced water being dis- charged at rates of 460,000 L/d to 1.03 million L/d in a water depth of 82 m. The produced water had a salinity of 85 %o and a temperature of 32~ Ambient water sam- ples collected from the dye plume showed that the produced water was diluted 100-fold within 10 m of the discharge and by 1,000-fold within 103 m of the discharge. The field observations were in good agreement with predictions of the OOC produced water dis- persion model. The rhodamine dye probably acts like a conservative component of the produced water over the time periods of the dye study. That is, its concentration is affected by dilution, but the dye is not lost from the plume by evaporation, precipitation, or degradation.
Somerville et al.(1987) also used rhodamine dye to validate modeled dilutions of neu- trally buoyant produced water discharge from the Fulmar A platform in the British North Sea. They measured a 100-fold dilution of the dye at 50 m down-current from the dis- charge and a 2,800-fold dilution 1,000 m down-current from the discharge. Rabalais et al. (1992) were able to measure elevated (compared to background) concentrations of radium, but not volatile hydrocarbons, to about 1,000 m down-current of a high-volume produced water discharge to shallow coastal waters of Louisiana.
The most abundant hydrocarbons of environmental concem in produced water usu- ally are the light, one-ring aromatic hydrocarbons (the BTEX compounds). Because they

C h a p t e r 1 - P r o d u c e d Water 23
are very volatile, they evaporate rapidly from the water following produced water dis- charge. Brooks et al. (1980) reported that the maximum concentration of benzene meas- ured in seawater immediately below the above-water produced water discharge pipe at a production platform in the Buccaneer Field off Galveston, Texas, U.S.A., was 0.065 ~g/L. This represents a nearly 150,000-fold dilution of the concentration of benzene in the produced water effluent (9,500/zg/L). Concentrations of total gaseous and volatile hydrocarbons, including BTEX aromatics (75 percent of the total) decreased from 22,000/tg/L in the effluent, to 65/tg/L at the air/water interface below the outfall, to less than 2/tg/L in the surface water about 50 m away, indicating very rapid evaporation and dilution of the volatile components of the produced water.
Terrens and Tate (1996) measured concentrations of BTEX and several PAHs in ambient seawater 20 m from an 11 million L/d produced water discharge from a plat- form in the Bass Strait off southeastern Australia. There was an inverse relationship between molecular weight (and volatility) and the dilution of individual aromatic hydro- carbons. Individual monocyclic aromatic hydrocarbons were diluted by 53,000-fold (benzene) to 12,000-fold (xylenes). PAHs were diluted by 12,000-fold (naphthalene) to 2,000-fold (pyrene). Concentrations of higher molecular weight PAHs were below the detection limit (0.0002/tg/L) in the ambient seawater 20 m from the outfall. The inverse relationship between molecular weight of the aromatic hydrocarbons and their rates of dilution probably was due in large part to the high temperature (95~ of the discharged produced water, favoring evaporation of the lighter aromatic hydrocarbons.
King and McAllister (1998) modeled and measured concentrations of benzene and toluene in the produced water plume from an oil production platform in approximately 24 m of water on the northwest shelf of Australia. The MUDMAP model (Spaulding et al., 1994) was used for the modeling exercise. Midwater currents were wind-driven with a strong diurnal tidal component. Maximum current speeds were 90 cm/sec and decreased to near zero during the slack tide.
The platform has two treated produced water discharges, a high-volume discharge from the hydrocyclones, averaging 7.155 million L/d, and an overflow discharge via a gas floatation unit that ranges from 0 to 1.279 million L/d.. The high-volume hydrocy- clone discharge is located 4 rn above mean sea level, so the slightly buoyant produced water (salinity, 37 ppt; temperature, 70 ~ density, 1.006 g/ml) free-falls to the water surface.
Under these conditions, the MUDMAP model predicts that the initial dilution of benzene and toluene in the hyrocyclone discharge, following the jet phase, is about 2,000-fold. Actual measured initial dilutions are 100- to 200-fold. The free-fall of the produced water to the sea surface allows the plume to spread on the water surface with- out the high-energy jet phase of turbulent mixing. Because of the variable speed and direction of tidal currents at the discharge site, benzene and toluene concentrations in the surface plume vary with distance from the discharge. Pools of higher concentrations occur in the advecting plume, caused during slack tides when the produced water is being discharged into a static water mass. Predicted concentrations of benzene in the pools are as high as 23/tg/L. The measured concentrations of benzene in the pools are as high as 13/tg/L, in reasonable agreement with the modeled concentrations. The measured concentration represents a 300- to 550-fold dilution of the benzene and toluene concentrations in the produced water. Benzene and toluene concentrations in the undiluted effluent are 4,013 to 7,208/tg/L and 4,036 to 6,154/tg/L, respectively.
24 Bioaccumulation in Marine Organisms
The pools are interspersed with regions of plume containing about 5 to 7/zg/L each of benzene and toluene. Concentrations of benzene and toluene in the pools and inter-pool regions of the produced water plume decrease with time after discharge, through a com- bination of dilution and evaporation. Minimum dilutions for benzene and toluene of greater than 10,000-fold were measured 1 km from the discharge (Holdway and Heggie, 1998). Concentrations of total C 1- through C6-hydrocarbons were diluted by about 2,500-fold in the same distance.
The MUDMAP model predicts concentrations of benzene and toluene in the plume best when horizontal and vertical diffusion were set at 0.1 m2/sec and 1.10-7m2/sec, respectively (King and McAllister, 1998). This shows that horizontal rather than vertical dispersion is the main mechanism of dilution of chemicals in the plume. The measured and predicted rates of dilution of benzene and toluene in the plume from the platform on the Australian Northwest shelf are lower than would be expected based on the high volatility of these aromatic hydrocarbons in tropical seawater (23-24~ Methods for measuring benzene and toluene at very low concentrations in seawater were not described, and could have suffered from interferences.
BTEX concentrations in the upper water column near production platforms off Louisiana ranged from 0.008 to 0.332 ktg/L (Sauer, 1980), compared to background con- centrations of 0.009 to 0.10 ktg/L of benzene in surface waters of the outer continental shelf off Texas and Louisiana (Sauer et al., 1978). These compounds are very volatile with half-lives in the water column of a few hours or days, depending on water temper- ature and mixing conditions.
Total benzenes (sum of benzene and C 1- through C4-benzenes ) were diluted rapidly with distance down-current from produced water discharges from four offshore produc- tion platforms in the northwestern Gulf of Mexico (Table 16). The produced waters all were hypersaline brines (denser than ambient seawater) and were discharged at rates of 838,000 to 3,600,000 L/d (DOE, 1997a). Generally a 1,000-fold or greater dilution was observed within 100 m of the discharge point. Variations among the platforms in appar- ent dilution rates undoubtedly were due to difficulty of tracking and sampling in the produced water plume as it moved away from the platforms.
Dilution of BTEX from produced water is less rapid where a large volume of highly saline produced water is discharged to poorly mixed, low-salinity, estuarine waters. The concentration of total volatile hydrocarbons (including BTEX) approached 100/tg/L on one occasion in bottom water in the vicinity of three produced water discharges (total volume 6.8 million L/d) to Pass Fourchon, a shallow marsh area in south Louisiana (Rabalais et al., 1991).
Concentrations of PAHs were measured in the water column and in blue mussels (Mytilus edulis) and semipermeable membrane devices (SPMDs) deployed at different distances from production platforms in the Norwegian sector of the North Sea (Johnsen et al., 1998; Roe et al., 2000). Slightly elevated (compared to background) concentra- tions of PAHs were detected in samples collected up to 10 km from the platforms. Dilution modeling showed that most of the produced water plume was restricted to the upper 15 to 20 m of the water column. Dilution was very rapid. Potentially toxic con- centrations and contact times of hydrocarbons were not predicted even in the near-field. Rye et al. (1996) reported similar modeling results for produced water discharges from other platforms in the Norwegian sector of the North Sea.

Chapter 1 - P r o d u c e d Water 25
Table 16. Dilution of total benzenes (total CO- through C4-benzenes) in the receiving waters down-current from four offshore produced water discharges to the northwestern Gulf of Mexico. Mean concentrations (based on triplicate analyses) are/~g/L. From Dept. of Energy (1997a).
Platform Sample/Distance Mean Benzenes Concentration
Dilution (Factorial)
HI A-595CF Produced Water 1,800 0 5 m 6.7 260
100 m 0.59 3,000 2,000 m 0.36 4,900
SMI 130B Produced Water 3,000 0 5 m 74 41
100 m 0.90 3,400 2,000 ND oo
SMI 236A Produced Water 5,200 0 5 m 36 140
100 m 6.9 750 2,000 0.68 7,600
VR 214A Produced Water 3,600 0 5 m 2.3 1,600
100 m 24 150 2,000 0.34 11,000
Mussels deployed 500 m down-current from the Statt]ord B platform contained 1.54 mg/kg dry wt total PAHs (Johnsen et al., 1998). The most abundant PAHs in the mus- sel tissues were alkyl naphthalenes, phenanthrenes, and dibenzothiophenes. PAH concen- trations in the water were predicted from concentrations in mussels (Neff and Bums, 1997). The estimated concentration of total PAHs in the water column 500 m from the dis- charge was about 0.023 ~tg~, including 0.009 ktg/L naphthalene and 0.0009 ktg/L phenan- threne. Concentrations generally decreased with distance from the discharges.
Although 89 to 93 percent of the total PAHs in produced water from a platform in 22 m of water on the Northwest Shelf of Australia are in the particulate phase, PAHs in the water column near the platform are mostly in solution (Bums and Codi, 1999). PAH concentrations in the ocean near the platform are highly variable over time and space, reflecting the variability in the PAH concentrations in the produced water and the com-
plex water current regime near the platform. On 20-22 September, 1995, the dissolved
PAH concentration in the upper water column increased from 0.032 ktg/L 414 m from
the platform to 0.244 ktg/L at 972 m from the platform, and then decreased to 0.10 ktg/L at 1890 m. The concentration of particulate PAHs decreased from 0.01 ktg/L at 414 m to 0.002 ~tg/L at 1890 m. A produced water sample collected on 23 September contained 1152 ktg/L total dissolved plus particulate PAHs. Thus, the PAHs were diluted by more
than 27,000-fold within 400 m of the platform. The most abundant PAHs in the dissolved
and particulate phases of the ambient water at 414 m were C:- and C2-naphthalenes and
C 2- through C4-phenanthrenes, respectively. Most of the lighter PAHs had desorbed from
the particles in the receiving water.

26 Bioaccumulation in Marine Organisms
BTEX compounds do not adsorb strongly to suspended or deposited marine sedi- ments. Their concentrations in sediments near produced water discharges nearly always are very low (Armstrong et al., 1979; Neff et al., 1989c). However, higher molecular weight aromatic and aliphatic hydrocarbons may accumulate in sediments near produced water discharges (Armstrong et al., 1979; Neff et al., 1989c; Means et al., 1990; Rabalais et al., 1991), particularly if water depths are shallow. In well-mixed estuarine and off- shore waters, elevated concentrations of saturated hydrocarbons and PAHs in surficial sediments may be observed out to a few hundred meters from a high-volume produced water discharge. The concentrations of PAHs in sediments near offshore produced water discharges often are related to the volume of produced water discharged, the concentra- tion of PAHs in it, water depth, and local mixing regime. These relationships can be seen in data for surficial sediments near four offshore produced water discharges in the north- westem Gulf of Mexico (Table 17). Concentrations of total petroleum hydrocarbons and total PAHs are quite low in coarse carbonate sediments around a production platform in 22 m of water on the Northwest Shelf of Australia (Bums and Codi, 1999). Concentrations of total petroleum hydrocarbons, measured by GC/FID, range from non- detectable to 3.88/tg/g (ppm); PAH concentrations range from 1.65 to 37.15 ng/g (ppb). Water depth seems to be the most important determinant of PAH concentrations in sed- iments near offshore produced water discharges, followed by concentration of PAHs in the produced water and sediment texture.
Although most produced waters contain elevated concentrations of several metals compared to concentrations in clean seawater, concentrations of metals in produced water plumes and in sediments down-current from the discharges rarely are significantly higher than natural background concentrations. Barium, iron, and manganese often are the metals that are most enriched in produced water compared to their concentrations in seawater. These three metals are likely to precipitate rapidly from the produced water plume (DOE, 1997a; OOC, 1997a). Barium will precipitate as barium sulfate in the pres- ence of the high natural concentrations of sulfate (about 800 mg/L) in seawater (Neff and Sauer, 1995; Monnin et al., 1999). Iron and manganese, which probably are present in produced water as reduced species, will oxidize to insoluble oxy-hydroxides when the produced water mixes with oxygen-rich surface waters at the offshore discharge sites (Schindler and Stumm, 1987; Kuma et al., 1996). Because the grain size of these pre- cipitated metals is very small, the particulate metals tend to settle slowly out of the water
Table 17. Concentrations of total PAHs in surficial sediments at 20 and 2000 m down-current from four offshore platforms in the northwestern Gulf of Mexico. Water depths, produced water discharge rates, and PAH concentrations in the produced waters also are given. From Dept. of Energy (1997a).
Platform Water Discharge Produced Water PAH in 20-m PAH in 2000-m Depth Rate (L/d) PAH Concentration Sediments Sediments
(m) (pg/L) (pg/g dry) (ltg/g dry) SMI236A 6 2,353,000 270 0.80 0.29 VR214A 39 1,351,000 130 1.40 0.22 SMI130B 66 3,600,000 600 0.87 0.15 HI595C 122 838,000 58 0.32 0.082
Chapter 1 - Produced Water 27
column and accumulate to slightly elevated concentrations in surficial sediments over a large area around the produced water discharge, keeping their concentrations in the water column and sediments low.
Rapid precipitation of barium, iron, and manganese has the effect of reducing the con- centrations of other dissolved metals in the produced water plume. Iron and manganese oxyhydroxides, because of their small particle size and high charge densities, adsorb or coprecipitate dissolved metals (Schoer, 1985). The adsorbed or coprecipitated metals settle out of the water column with the particulate iron and manganese oxyhydroxides. Some metals may also coprecipitate with barium sulfate. For example, radium, which, like barium, is an alkaline earth element, coprecipitates quantitatively with barium (Fisher, 1995; Neff and Sauer, 1995). Thus, concentrations of dissolved metals nearly always are low, approaching concentrations in the ambient seawater, in produced water plumes.
In three studies of the fate and effects of chemicals from produced water discharges to shallow estuarine and near coastal waters of the Gulf of Mexico, very little evidence was found of accumulation of any metals from produced water in bottom sediments near the produced water discharges (Boesch and Rabalais, 1989; Neff et al., 1989c, 1992; Rabalais et al., 1991, 1992). There was some evidence of accumulation of small amounts of zinc in sediments near two produced water discharge sites. Concentrations of barium in sediments were elevated above expected background at nearly all distances from some shallow-water produced water discharges. At four of the discharge sites monitored by Rabalais et al. (1991, 1992), elevated barium concentrations in sediments extended to 1,000 m from the produced water discharge. The barium may have come from the produced water, discharged drilling muds, or other sources, such as the Mississippi River (Hanor and Chan, 1977).
Radium concentrations were slightly elevated in near-bottom water near the Pass Fourchon produced water discharges (maximum concentration in water, 47 pCi/L ), but not in bottom sediments (Rabalais et al., 1991). Radium from produced water probably is coprecipitated with barium sulfate (Snavely, 1989a). The fine-grained barite crystals probably are dispersed over a wide area of the receiving water environment, so elevations above the background levels of radium in fine-grained nearshore sediments (3 to 8 pCi/g: Schlenker and St. P6, 1990) are difficult to detect. Several studies have shown that there is limited evidence of metal (including radium) accumulation in sediments near dis- charges to shallow, low-energy receiving waters (Boothe and Presley, 1989; Neff et al., 1989c; Rabalais et al., 1991). Therefore, it is unlikely that metals from produced water discharges to high-energy or deeper-water environments collect in sediments to concen- trations higher than natural background. Instead, the dissolved or particulate (adsorbed or coprecipitated ) metals probably are diluted to natural background concentrations in the water column.
1.3.3 Degradation of Produced Water Chemicals in the Ocean
Following discharge to the ocean, produced water undergoes a variety of changes, collectively called weathering. The most important of the changes affecting the fate and environmental impacts of chemicals in the produced water are dilution, evaporation, adsorption/precipitation, biodegradation, and photooxidation (Figure 1). Collectively, these processes tend to decrease the concentrations of chemicals in the produced water
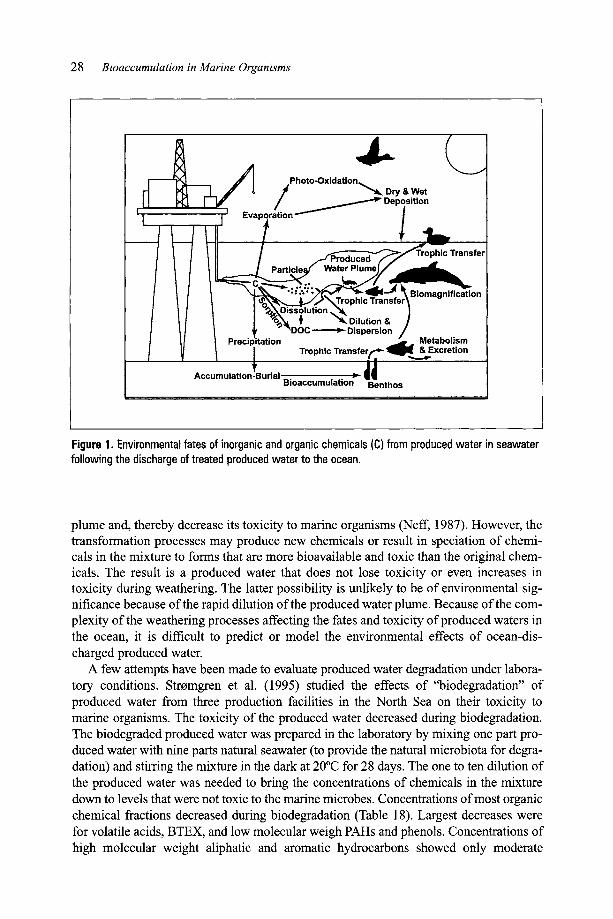
28 Bioaccumulation in Marine Organisms
[ ~ Ph x| n ~ l l l l I ~
or:, I �9 " " " " > Benthos I
Figure 1. Environmental fates of inorganic and organic chemicals (C) from produced water in seawater following the discharge of treated produced water to the ocean.
plume and, thereby decrease its toxicity to marine organisms (Neff, 1987). However, the transformation processes may produce new chemicals or result in speciation of chemi- cals in the mixture to forms that are more bioavailable and toxic than the original chem- icals. The result is a produced water that does not lose toxicity or even increases in toxicity during weathering. The latter possibility is unlikely to be of environmental sig- nificance because of the rapid dilution of the produced water plume. Because of the com- plexity of the weathering processes affecting the fates and toxicity of produced waters in the ocean, it is difficult to predict or model the environmental effects of ocean-dis- charged produced water.
A few attempts have been made to evaluate produced water degradation under labora- tory conditions. Stromgren et al. (1995) studied the effects of "biodegradation" of produced water from three production facilities in the North Sea on their toxicity to marine organisms. The toxicity of the produced water decreased during biodegradation. The biodegraded produced water was prepared in the laboratory by mixing one part pro- duced water with nine parts natural seawater (to provide the natural microbiota for degra- dation) and stirring the mixture in the dark at 20~ for 28 days. The one to ten dilution of the produced water was needed to bring the concentrations of chemicals in the mixture down to levels that were not toxic to the marine microbes. Concentrations of most organic chemical fractions decreased during biodegradation (Table 18). Largest decreases were for volatile acids, BTEX, and low molecular weigh PAHs and phenols. Concentrations of high molecular weight aliphatic and aromatic hydrocarbons showed only moderate
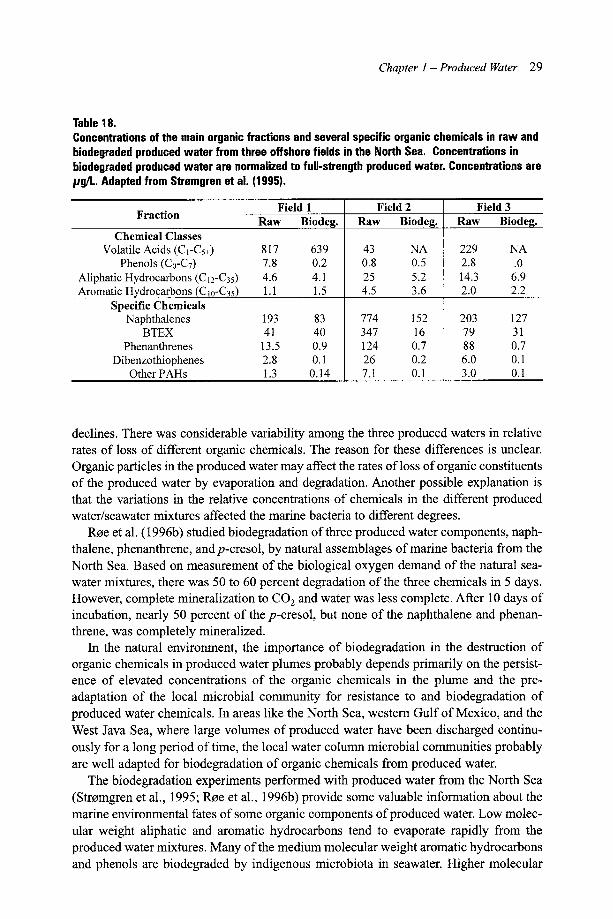
C h a p t e r 1 - P r o d u c e d Water 29
Table 18. Concentrations of the main organic fractions and several specific organic chemicals in raw and biodegraded produced water from three offshore fields in the North Sea. Concentrations in biodegraded produced water are normalized to full-strength produced water. Concentrations are /lg/L. Adapted from Strgmgren et al. (1995).
Field 1 Fraction Raw Biodeg.
Chemical Classes Volatile Acids (C1-Cs+) 817 639
Phenols (C0-C7) 7.8 0.2 Aliphatic Hydrocarbons (C12-C35) 4.6 4.1 Aromatic Hydrocarbons (C10-C35) 1.1 1.5
Specific Chemicals Naphthalenes 193 83
BTEX 41 40 Phenanthrenes 13.5 0.9
Dibenzothiophenes 2.8 0.1 Other PAHs 1.3 0.14
Field 2 Raw Biodeg.
43 NA 0.8 0.5 25 5.2 4.5 3.6
Field 3 Raw
229 2.8 14.3 2.0
774 152 347 16 124 0.7 26 0.2 7.1 0.1
Biodeg.
NA .0
6.9 2.2
203 127 79 31 88 0.7 6.0 0.1 3.0 0.1
declines. There was considerable variability among the three produced waters in relative rates of loss of different organic chemicals. The reason for these differences is unclear. Organic particles in the produced water may affect the rates of loss of organic constituents of the produced water by evaporation and degradation. Another possible explanation is that the variations in the relative concentrations of chemicals in the different produced water/seawater mixtures affected the marine bacteria to different degrees.
Roe et al. (1996b) studied biodegradation of three produced water components, naph- thalene, phenanthrene, and p-cresol, by natural assemblages of marine bacteria from the North Sea. Based on measurement of the biological oxygen demand of the natural sea- water mixtures, there was 50 to 60 percent degradation of the three chemicals in 5 days. However, complete mineralization to CO 2 and water was less complete. After 10 days of incubation, nearly 50 percent of the p-cresol, but none of the naphthalene and phenan- threne, was completely mineralized.
In the natural environment, the importance of biodegradation in the destruction of organic chemicals in produced water plumes probably depends primarily on the persist- ence of elevated concentrations of the organic chemicals in the plume and the pre- adaptation of the local microbial community for resistance to and biodegradation of produced water chemicals. In areas like the North Sea, western Gulf of Mexico, and the West Java Sea, where large volumes of produced water have been discharged continu- ously for a long period of time, the local water column microbial communities probably are well adapted for biodegradation of organic chemicals from produced water.
The biodegradation experiments performed with produced water from the North Sea (Stromgren et al., 1995; Roe et al., 1996b) provide some valuable information about the marine environmental fates of some organic components of produced water. Low molec- ular weight aliphatic and aromatic hydrocarbons tend to evaporate rapidly from the produced water mixtures. Many of the medium molecular weight aromatic hydrocarbons and phenols are biodegraded by indigenous microbiota in seawater. Higher molecular
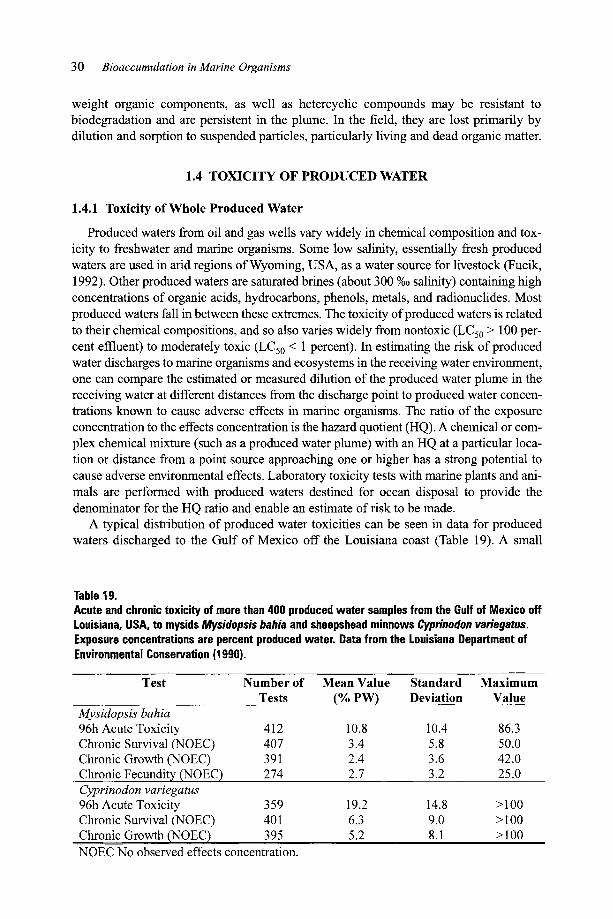
30 Bioaccumulation in Marine Organisms
weight organic components, as well as hetercyclic compounds may be resistant to biodegradation and are persistent in the plume. In the field, they are lost primarily by dilution and sorption to suspended particles, particularly living and dead organic matter.
1.4 TOXICITY OF PRODUCED WATER
1.4.1 Toxicity of Whole Produced Water
Produced waters from oil and gas wells vary widely in chemical composition and tox- icity to freshwater and marine organisms. Some low salinity, essentially fresh produced waters are used in arid regions of Wyoming, USA, as a water source for livestock (Fucik, 1992). Other produced waters are saturated brines (about 300 %o salinity) containing high concentrations of organic acids, hydrocarbons, phenols, metals, and radionuclides. Most produced waters fall in between these extremes. The toxicity of produced waters is related to their chemical compositions, and so also varies widely from nontoxic (LCs0 > 100 per- cent effluent) to moderately toxic (LCs0 < 1 percent). In estimating the risk of produced water discharges to marine organisms and ecosystems in the receiving water environment, one can compare the estimated or measured dilution of the produced water plume in the receiving water at different distances from the discharge point to produced water concen- trations known to cause adverse effects in marine organisms. The ratio of the exposure concentration to the effects concentration is the hazard quotient (HQ). A chemical or com- plex chemical mixture (such as a produced water plume) with an HQ at a particular loca- tion or distance from a point source approaching one or higher has a strong potential to cause adverse environmental effects. Laboratory toxicity tests with marine plants and ani- mals are performed with produced waters destined for ocean disposal to provide the denominator for the HQ ratio and enable an estimate of risk to be made.
A typical distribution of produced water toxicities can be seen in data for produced waters discharged to the Gulf of Mexico off the Louisiana coast (Table 19). A small
Table 19. Acute and chronic toxicity of more than 400 produced water samples from the Gulf of Mexico off Louisiana, USA, to mysids Mysidopsis bahia and sheepshead minnows Cyprinodon variegatus. Exposure concentrations are percent produced water. Data from the Louisiana Department of Environmental Conservation (1990).
Test Number of Mean Value Standard Maximum Tests (% PW) Deviation Value
Mysidopsis bahia 96h Acute Toxicity 412 Chronic Survival (NOEC) 407 Chronic Growth (NOEC) 391 Chronic Fecundity (NOEC) 274 Cyprinodon variegatus 96h Acute Toxicity 359 Chronic Survival (NOEC) 401 Chronic Growth (NOEC) 395 NOEC No observed effects concentration.
10.8 10.4 86.3 3.4 5.8 50.0 2.4 3.6 42.0 2.7 3.2 25.0
19.2 14.8 > 100 6.3 9.0 >100 5.2 8.1 >100

Chapter 1 - Produced Water 31
number of produced waters are moderately toxic to mysids (a standard sensitive marine crustacean widely used in the United States as a standard bioassay test organism) and sheepshead minnows with acute and chronic toxicities less than 0.1 percent (1,000 mg/L) produced water (this value may be an artifact of the data reporting method). A few produced waters are practically nontoxic with acute and chronic toxicities higher than 35 or 40 percent. Most produced waters have moderate toxicities, with acute and chronic toxicities between about 2 and 10 percent for mysids and 5 to 20 percent for sheepshead minnows. Neff (1987) reported, based on earlier toxicity studies for produced waters from the Gulf of Mexico, that nearly 52 percent of all LCs0s were greater than 10 per- cent produced water, 37 percent were between 1 and 9.9 percent, and 11 percent were less than 1 percent. The causative agents of toxicity in the most toxic produced waters is not known, but may be related to the extremely high total dissolved solids (salinity) con- centrations, altered ratios of major seawater ions, and elevated concentrations of ammo- nia in some Gulf of Mexico produced waters (Moffitt et al., 1992).
There are poorly characterized species differences in the toxicity of produced waters to marine organisms. Where bioassays were done with two or more marine taxa and the same sample of produced water, crustaceans usually are more sensitive than fish (Neff, 1987; Louisiana Department of Environmental Conservation, 1990; Jacobs and Marquenie, 1991;Terrens and Tait, 1993).
Stephenson et al. (1994) have summarized recent marine and toxicity data for a large number of species of marine and freshwater organisms and produced waters from throughout the world, particularly the North Sea (Table 20). These toxicity data show no consistent trend between taxon and sensitivity to produced water. This may be due in large part to the extreme variability in the chemical compositions and toxicities of produced waters from different sources. This variability obscures any actual differences in sensitivity of different species.
Acute and sublethal effects concentrations (as ECs0 or LCs0 ) of whole produced water ranged from 0.02 to more than 100 percent. Overall the most sensitive taxa appear to be marine algae, bivalve mollusk larvae, and various species of crustaceans, particularly lar- val forms (Table 20). Among the crustaceans, mysids appear to be as sensitive as or more sensitive than other crustacean species. Generally, fish are more tolerant to produced water than marine invertebrates. Various sublethal responses, such as reproductive suc- cess in Acartia and fecundity in Americamysis are more sensitive indicators of toxic effects than acute mortality.
Given the rapid rate of dilution and dispersion of most produced water discharges to the ocean, as discussed above, most produced waters would be expected to produce min- imal adverse biological effects in the receiving water environment. However, some produced waters are sufficiently toxic to sensitive marine species or dilution in the receiving water environment is sufficiently slow (e.g., a highly buoyant plume) that adverse environmental effects are possible in receiving waters near the discharge.
Gamble et al. (1987) introduced produced water at a concentration equivalent to a 400-500 fold dilution of produced water (expected within 0.5 to 1.0 km from the Auk and Forties platforms in the North Sea) into 300 m 3 mesocosm tanks containing natural assemblages of phytoplankton, zooplankton, and larval fish. Bacterial biomass increased but phytoplankton production and larval fish survival were unaffected in the produced water-dosed containers. However, early life stages of copepods were sensitive to the produced water and suffered large mortalities. The decrease in zooplankton abundance

32 Bioaccumulation in Marine Organisms
resul ted in an increase in the s tanding s tock o f phy top lank ton and a reduc t ion in the
g rowth rates o f the fish larvae. In o ther m e s o c o s m studies s u m m a r i z e d by S tephenson et
al. (1994), larval mol lusks and po lychae te w o r m s also were adverse ly affected. These
m e s o c o s m studies show that apparen t ly low concent ra t ions o f p roduced water m a y have
subtle effects on mar ine p lanktonic communi t i e s . However , it should be po in ted out that
m e s o c o s m studies represent conservat ive, wors t -case exposure scenarios, because
p roduced water chemica ls in the m e s o c o s m enclosures do not degrade and d isappear as
rapid ly as they do in we l l -mixed ocean envi ronments .
Table 20. Summary of the acute, sublethal, and chronic toxicity of produced waters from throughout the world to different taxa of marine and freshwater organisms. Effects concentrations are percent produced water. Adapted from Stephenson et al. (1994).
Taxon Species
Algae Phaeodactylum tricornutum Skeletonema costatum
Endpoint Duration ECso/LCso* (Days)
Growth 4 0 . 0 9 - 3.6 Growth 2 4.5 - 67.6
3 1.0 - 42.5 Coelenterates Bivalve Mollusks
Polychaetes Copepods
Amphipods
Shrimp
Mysids
Campanularia flexuosa Crassostrea gigas larvae
Mytilus californianus larvae Donax faba adults
Neanthes arenaceodentata Tisbe holothuriae
Calanus finmarchicus Acartia tonsa
Alorchestia compressa Chaetogammarus marinus
Penaeus aztecus larvae Penaeus aztecus juveniles
Penaeus aztecus adults Penaeus setiferus adults Crangon crangon adults
Americamysis bahia
Growth 10 5.0 Mortality 2 5.0
Shell Formation 2 2.1 Mortality 4 0.02 - 15.3 Mortality 4 18.1 - 28.6 Mortality 4 35.7 - 66.7 Mortality 1 10.0 Mortality 2 2.0 - 18.0
Reproduction 20 0.3 - 5.0 Immobility 4 2.0 Mortality 4 29.4 - > 100 Mortality 4 0.2 - 3.2 Mortality 2 0 . 8 - 1.2 Mortality 4 6.0 - 18.3 Mortality 4 7.8 - 17.8 Mortality 4 7.0 Mortality 1 2.0 Mortality 4 4.9 - 11.8 Mortality 7 4.4 - 9.0 Fecundity 7 0 . 7 - 7.0
Brine Shrimp Artemia salina Barnacles Balanus tintinabulum Echinoderms Strongylocentrotus
purpuratus gametes Fish Menidia beryllina larvae
Hypleurochilus germinatus Cyprinodon variegatus
Poecilia reticulata Oncorhynchus mykiss
Mortality 1 16.0 - 18.0 Mortality 4 8.3
Fertilization 60 Min. 0 . 7 4 - 1.7
Mortality 4 > 1.1 - 5.5 Mortality 4 15.8 - 40.8 Mortality 4 7.2 - 60.0 Mortality 7 3.7 - >28.0 Mortality 4 0.75 - 42.3 Mortality 2 10.0
* Median effects concentrat ion (ECs0) or median lethal concentration (LCs0).
Chapter I - Produced Water 33
1.4.2 Causes of Produced Water Toxicity
Several recent studies have been performed to idemify the components of produced water that cause or contribute to its toxicity to freshwater and marine organisms. Several chemicals or chemical classes have been idemified. However, each produced water appears to be somewhat different from all others in chemical concentrations and in tox- icity to freshwater and marine organisms, preventing developmem of generalizations about the causes of produced water toxicity.
Studies of the toxicity of produced waters to freshwater, estuarine, and marine organ- isms frequently identify total dissolved solids concentration (salinity) or altered ion ratios as major contributors to produced water toxicity (Boelter et al., 1992; Fucik, 1992; Moffitt et al., 1992; Mount et al., 1992; Pillard et al., 1996). Produced water salinities (either higher or lower than those of seawater) are likely to change rapidly toward that of the ambiem seawater following produced water discharge to the open ocean. Most marine organisms can tolerate salinities ranging from about 10 to 40 ppt, if ion ratios of the water are comparable to those of seawater. Thus, a combination of high or low salin- ity and ion ratios different from those in seawater may be an important causative agent of produced water toxicity to estuarine or marine organisms. Freshwater organisms, par- ticularly invertebrates, of course are very sensitive to produced waters with high salini- ties (Fucik, 1992; Moffitt et al., 1992). Estuarine and marine animals often are very sensitive to high or low concentrations of calcium in the ambiem water and this sensi- tivity may contribute to their sensitivity to produced waters, many of which have calcium concentrations much higher than those in seawater (Schiff et al., 1992; Stromgren et al., 1995; Douglas et al., 1996). Concentrations of potassium and magnesium in produced water higher than those in seawater may also contribute to the toxicity of some produced waters (Pillard et al., 1996a,b).
Higashi et al. (1992) fractionated produced water from a California treatment facility and tested the toxicity of the fractions with larvae of the mussel Myti lus californianus.
They idemified the metals fraction as comaining most of the toxicity of the produced water. The target analytes presem at highest concentration in the produced water were barium and stromium. Therefore, they attributed the toxicity of the California produced water to elevated concentrations of barium in it. Barium, as barium acetate, was toxic to mussel larvae at concentrations similar to those in the produced water (Spangenberg and Chert, 1996). However, as discussed above, barium is expected to precipitate as barite in the receiving waters. The investigators did not measure concentrations of calcium in the produced water. Because strontium (another alkaline earth elemem) concentrations were high in the produced water, it is likely that calcium concentrations also were high, pos- sibly contributing to the toxicity of the produced water.
Sauer et al. (1992) identified hydrogen sulfide and total hydrocarbons as major con- tributors to the toxicity of several low-salinity produced waters to freshwater animals. Schiff et al. (1992) also identified hydrocarbons as contributors to the toxicity of produced water. There was no relationship between concentrations of ammonia (161 to 240 mg/L) and toxicity of the three produced waters they evaluated. Stromgren et al. (1995) and Brendehaug et al. (1992) found no relationship between concentrations of total petroleum hydrocarbons or specific hydrocarbon classes in produced waters from the North Sea and the toxicity of the produced waters to marine organisms. Biodegradation of the produced waters resulted in a loss of volatile hydrocarbons, organic acids, and some phenols and
34 Bioaccumulation in Marine Organisms
reduced the toxicity of the produced waters; these results suggest that these volatile com- pounds may have contributed to the toxicity of the produced waters.
In most cases, loss of volatile hydrocarbons, particularly BTEX, does not substan- tially decrease the toxicity of produced water to marine organisms (Flynn et al., 1996). However, phenols, when they are present at high concentrations, may be important con- tributors to the toxicity of produced water (Brendehaug et al., 1992; Flynn et al., 1996).
Produced water toxicity rarely has been attributed to metals. Most of the metals in produced water are not present at concentrations substantially higher than those in ambi- ent seawater. In addition, many metals may precipitate or coprecipitate with other met- als when anoxic produced water mixes with oxygenated seawater rich in sulfate, carbonate, and hydroxide (Stephenson et al., 1994). Stromgren et al. (1995) attributed some of the toxicity of several North Sea produced waters to high concentrations of zinc in them. Zinc is one of the metals most frequently found at substantially higher concen- trations (more than 1,000-fold) in produced water than in seawater.
Recent modeling studies of the toxicity of produced waters from the North Sea have identified organic acids (mostly acetic acid) as important contributors to the acute toxi- city of produced waters containing high concentrations of these chemicals (Furuholt, 1996; Karman et al., 1996). Production chemicals (additives) also contributed to the tox- icity of these produced waters. For example, Karman et al. (1996) predicted that organic acids contributed 46 percent and production chemicals contributed 25 percent of the acute toxicity of a 1000-fold dilution of produced water from the Statt]ord and Gullfaks Fields. Total petroleum hydrocarbons, phenols, and metals contributed an additional 25, 3, and 1 percent, respectively, to the toxicity of the dilute produced water. The organic acids biodegrade rapidly in the ambient seawater and so probably are not important sources of toxicity of produced water in the ambient environment.
1.4.3 Toxicity of Produced Water Additives
Several chemical additives may be added to the production stream or to the oil-water treatment system to solve problems encountered in the production stream, to aid in fos- sil fuel production, or to enhance separation of produced water from fossil fuels. Although many of these chemicals are oil soluble and remain with the oil following oil- water separation, some are sufficiently water-soluble that a fraction not consumed in oil and water treatment remains with the produced water and is discharged with it to the ocean. Some of the additives or treatment chemicals that are discharged to the ocean in produced water are toxic to freshwater and marine organisms and may contribute to the toxicity of the produced water during its dilution and degradation in the receiving waters.
Only a few of the chemical additives used in large quantities as additives to the oil/water production and treatment systems on platforms are sufficiently water-soluble that most of the total amount used is discharged in the produced water (Table 21). For some chemicals, such as biocides, most of the material added is consumed or degraded during use, so little is discharged. More than 50 percent of the scale inhibitors, coagu- lants, flocculants, surfactants, and detergents used are discharged in the produced waters.
The most toxic additives are biocides, corrosion inhibitors, and paraffin inhibitors. Although biocides may be applied continuously at concentrations of 10 to 50 mg/L or as a periodic 100 to 200 mg/L slug (Hudgins, 1992), concentrations in the discharged produced water usually are much lower. However, because of their high toxicity, they

Chapter 1 - Produced Water 35
Table 21. Quantity and toxicity of additives frequently used in production systems in the North Sea and the Gulf of Mexico. Data for usage and percent discharged are for the North Sea in 1989. From Hudgins (1992, 1994).
Additive Type Amount Used Percen t Discharged Acute Toxicity Range (metr ic tons/y) (mg/L)
Biocides 2,584 3.1 0.22 - > 1000 Corrosion Inhibitors 2471 8.7 0.9 - 1055 Oxygen Scavengers 1277 1.7 100 - >500
Scale Inhibitors 1727 66 600 - > 10,000 Demulsifiers 444 2.0 10 - > 10,000
Coagulant/De-Oiler 222 85 15 - 14,800 Antifoam Agent 144 0 21 - 100
Flocculants (Injection) 203 53 62 - 2370 Surfactants/Detergents 24 100 40 - 429
Detergent/Cleaning 92 95 > 10,000 Gas Treatment 9307 31 31 - 31,000
Paraffin Inhibitor 202 NR 1 . 6 - 37
may contribute to the aquatic toxicity of produced waters from platforms where they are used. Scale inhibitors often are present in produced water at concentrations of 3 to as much as 500 m g ~ (the latter as a slug following a batch treatment), well below toxic concentrations. Paraffin inhibitor, when used, usually appears in the produced water at a concentration below that which is toxic to marine organisms.
Surfactants/detergents and corrosion inhibitors also may be present in some produced waters at concentrations that could be toxic to marine organisms (Hudgins, 1992, 1994). Thus, biocides, corrosion inhibitors and detergents, if present at high concentrations in produced water, could contribute to its toxicity to marine organisms in the receiving water environment.
Henderson et al. (1999) evaluated the contribution of production chemicals to the tox- icity of produced waters from the British Sector of the North Sea. They reported that, although several production chemicals, including antifoam agents, biocides, corrosion inhibitors, and demulsifiers, are moderately toxic in the Mitrotox| test, when they are partitioned against an oil phase, as occurs in the production stream before oil/water sep- aration, they contribute little to the toxicity of the produced water. However, some treat- ment chemicals, if used at high concentration, may substantially increase partitioning of petroleum into the aqueous phase, increasing the toxicity of the produced water. A cor- rosion inhibitor, containing an alkyl quaternary ammonium salt in methanol, increased produced water toxicity the most.


![Laboratory-Based Bioaccumulation Essay for Elements ... · in aquatic environment, including bioaccumulation [10]. Thus, this laboratory-based study assessed the bioaccumulation of](https://img.dokumen.tips/doc/110x75/5f0813d47e708231d42038a6/laboratory-based-bioaccumulation-essay-for-elements-in-aquatic-environment.jpg)


![Residues of some organic pollutants, their bioaccumulation ......Bioaccumulation is the net result of competing processes of absorption, ingestion, digestion, and excretion [22]. Bioaccumulation](https://img.dokumen.tips/doc/110x75/60fbc786322fe552715ef131/residues-of-some-organic-pollutants-their-bioaccumulation-bioaccumulation.jpg)