Embed Size (px)
Citation preview

Tyre modelling for rolling resistance
BHARAT MOHAN REDROUTHU
SIDHARTH DAS
Department of Applied Mechanics
Division of Vehicle Engineering and Autonomous System
Vehicle Dynamics Group
CHALMERS UNIVERSITY OF TECHNOLOGY
Göteborg, Sweden 2014
Master’s thesis 2014:24


MASTER’S THESIS IN AUTOMOTIVE ENGINEERING
Tyre modelling for rolling resistance
BHARAT MOHAN REDROUTHU
SIDHARTH DAS
Department of Applied Mechanics
Division of Vehicle Engineering and Autonomous System
Vehicle Dynamics Group
CHALMERS UNIVERSITY OF TECHNOLOGY
Göteborg, Sweden 2014
Tyre modelling for rolling resistance
BHARAT MOHAN REDROUTHU
SIDHARTH DAS
© BHARAT MOHAN REDROUTHU, SIDHARTH DAS, 2014
Master’s Thesis 2014:24
ISSN 1652-8557
Department of Applied Mechanics
Division of Vehicle Engineering and Autonomous System
Chalmers University of Technology
SE-412 96 Göteborg
Sweden
Telephone: + 46 (0)31-772 1000

I
Tyre modelling for rolling resistance BHARAT MOHAN REDROUTHU
SIDHARTH DAS
Chalmers University of Technology
Göteborg, Sweden 2014
Report No. 2014:24
ABSTRACT
Increased efficiency in road vehicle is a demand in today’s society in the view of
rising fuel cost and emission regulation. An important source for losses in road
vehicles is tyre rolling resistance. For tyres with rolling resistance coefficient of
0.012, the fuel consumption due to tyre rolling resistance losses can amount to 20% -
30% of total consumption depending on the drive cycle, according to the study ‘the
tyre: rolling resistance and fuel savings’ by Michelin, 2003. This study investigates
mathematical models based on physical understanding and literature reviews of tyre
rolling resistance phenomena. The work aims to develop a tyre model that explains
the influence of tyre inflation pressure, tyre size, velocity and normal load on the
rolling resistance coefficient. The model is based on free rolling condition without
taking the longitudinal slip into account. The consideration of the model developed
includes vertical tyre stiffness with geometrical belt constraint accounting for tyre
vertical deflection and counter-deflection, tyre viscous and coulomb damping effect
and rotational aerodynamic drag effect. The vertical stiffness model accounts for tyre
geometry indirectly by means of constants in the model. The stiffness model and the
simple lumped damping model together takes into account various hysteresis losses.
The tyre model developed for rolling resistance gives results which are in very good
agreement with the experimental data. For example an 8.3% increase in tyre outer
radius from 60 cm to 65 cm, the proposed model predicts a reduction of 4.8% in tyre
rolling resistance coefficient compared to 5% suggested by experimental data.
Furthermore, a change to low rolling resistance tyre in LeanNova’s energy simulation
model corresponds to a reduction in the average energy consumption by 3.8% for a
NEDC run in an electric vehicle and a reduction of 1.3% in average fuel consumption
for a NEDC run in a conventional vehicle. Through these findings and the proposed
tyre model that calculates rolling resistance by taking a limited number of tyre
parameters into consideration, a foundation for physical understanding of tyre rolling
resistance phenomena is established.
Keywords: Rolling resistance, tyre model, physical model, belt model, tyre
dimension, energy consumption

II

CHALMERS, Applied Mechanics, Master’s Thesis 2014:24 III
Contents
1 INTRODUCTION 1
1.1 Background 1
1.2 Aim 1 1.2.1 Deliverables 2
1.3 Scope and Limitations 2
2 LITERATURE REVIEW 3
2.1 Understanding tyres 3
2.1.1 Construction of tyres 4
2.1.2 Mechanism of load carrying 6 2.1.3 Mechanism of road grip 7 2.1.4 Mechanism of Rolling Resistance 10
2.2 Influence of tyre parameters on rolling resistance 11
2.2.1 Influence of tyre size 11 2.2.2 Influence of tyre inflation pressure 14
2.2.3 Influence of normal load 15 2.2.4 Influence of longitudinal velocity 16
3 MODELLING 18
3.1 Basic Assumptions 18
3.2 Radial spring and damper distribution 18
3.3 Balloon model and stiffness 21
3.4 Constant Belt Model 23
3.5 Damping Model 25
3.6 Rotational aerodynamic drag 26
3.7 Combined Model 28
3.8 Final tuning coefficients and their significance 29
3.9 Simulink Block for energy simulation 30
4 RESULTS AND DISCUSSION 31
4.1 Influence of longitudinal velocity 31
4.2 Influence of tyre outer diameter 32
4.3 Influence of contact patch width 33
4.4 Influence of tyre inflation pressure 34
4.5 Influence of normal load 35
4.6 Energy simulation results 36
5 CONCLUSION AND FUTURE WORK 41

CHALMERS, Applied Mechanics, Master’s Thesis 2014:24 IV
5.1 Conclusion 41
5.1.1 Combined Model 41 5.1.2 Energy simulations 42
5.2 Future Work 43
6 REFERENCES 44
APPENDIX I 44
CHALMERS, Applied Mechanics, Master’s Thesis 2014:24 V
Preface
In this research work, the influence of various tyre parameters on rolling resistance
has been examined with emphasis on the parameters that influence the development
of a new vehicle platform such as section width and outer radius. This thesis work
was carried out from January 2014 to June 2014 under the supervision of Dr. Gunnar
Olsson and Rudolf Brziak at LeanNova Engineering AB and Professor Bengt
Jacobson at Chalmers University of Technology. This work should enable LeanNova
to perform high-quality tyre selection processes related to vehicle platform
development. The project is carried out partly at the Vehicle Engineering &
Autonomous Systems (VEAS), Chalmers University of Technology, Sweden and
partly at LeanNova Engineering AB, Sweden. The project is financed by LeanNova
Engineering AB.
We would like to thank the supervisors, staff and PhD students in the research group
of vehicle dynamics at Chalmers University of Technology and LeanNova
Engineering AB for their time and guidance despite their hectic schedules and
responsibilities. We would also like to extend our deepest gratitude to Zuzana
Sabartova, PhD student at Chalmers for her valuable inputs in this thesis work.
Gothenburg, Sweden, June 2014
Bharat Mohan Redrouthu
Sidharth Das

CHALMERS, Applied Mechanics, Master’s Thesis 2014:24 VI

CHALMERS, Applied Mechanics, Master’s Thesis 2014:24 VII
Notations
Abbreviations
AEC Average Energy Consumption
CoG Centre of Gravity
EV Electric Vehicle
ICE Internal Combustion Engine
KN Kilo Newton
KPa Kilo Pascal
KWh Kilo Watt Hour
LBs Pounds
NEDC New European Driving Cycle
Psi Pounds per Square Inch
RR Rolling Resistance Force
RRC Rolling Resistance Coefficient
Roman upper case letters
C Elemental spring damping coefficient from balloon model
Cc Coulomb damping coefficient
Cd Aerodynamic drag coefficient
CRR Coefficient of rolling resistance
Cv Viscous damping coefficient
D Tyre outer diameter
Maximum frictional resistance force
Rotational aerodynamic drag
Sliding friction
Fz Sum of spring and damper forces
FRR Rolling resistance force
K elemental spring stiffness from balloon model
Kz Vertical stiffness from constant belt model
L Contact patch length
Normal Load
P Tyre inflation pressure
R Outer Radius
Equivalent reaction force in figure 2.12
Torque on wheel
Vx Longitudinal velocity
W Tyre width or section width
W Watts
Roman lower case letters
a Deformed radius at middle of contact patch
e Pressure centre offset
z Vertical deformation of contact patch element
Rate of Vertical deformation of contact patch element
x Position of the element at the contact patch measured from the centre

CHALMERS, Applied Mechanics, Master’s Thesis 2014:24 VIII
Greek lower case letters
Angle of element from centre line of contact patch
Maximum angle of element from centre line of contact patch
Angular velocity of element in contact patch
Coefficient of static friction
s Coefficient of sliding friction
`CHALMERS, Applied Mechanics, Master’s Thesis 2014:24 1
1 Introduction
Global warming is a huge concern now and the transportation sector is the biggest
contributor to greenhouse gases after electricity production [1]. In efforts to reduce the
greenhouse emissions stricter emission targets are being set. With a current fleet
average CO2 emission target set at 130 g/km for cars in 2015 and a projected target of
95 g/km for 2021 set by the European commission for Europe, there is a huge amount
of research in making green vehicles. Greenhouse emissions are directly proportional
to fuel consumption; hence reducing fuel consumption will reduce CO2 emissions.
There are various ways of improving the fuel efficiency. Some of them include using
better, more efficient powertrains, such as improved downsized engines, using hybrid
vehicles, alternative fuels, or totally electric vehicles. Another area of focus is on
reducing the road load. Road load is a force which opposes the movement of a
vehicle. The main focus is on the forces acting on the car such as aerodynamic drag
and rolling resistance.
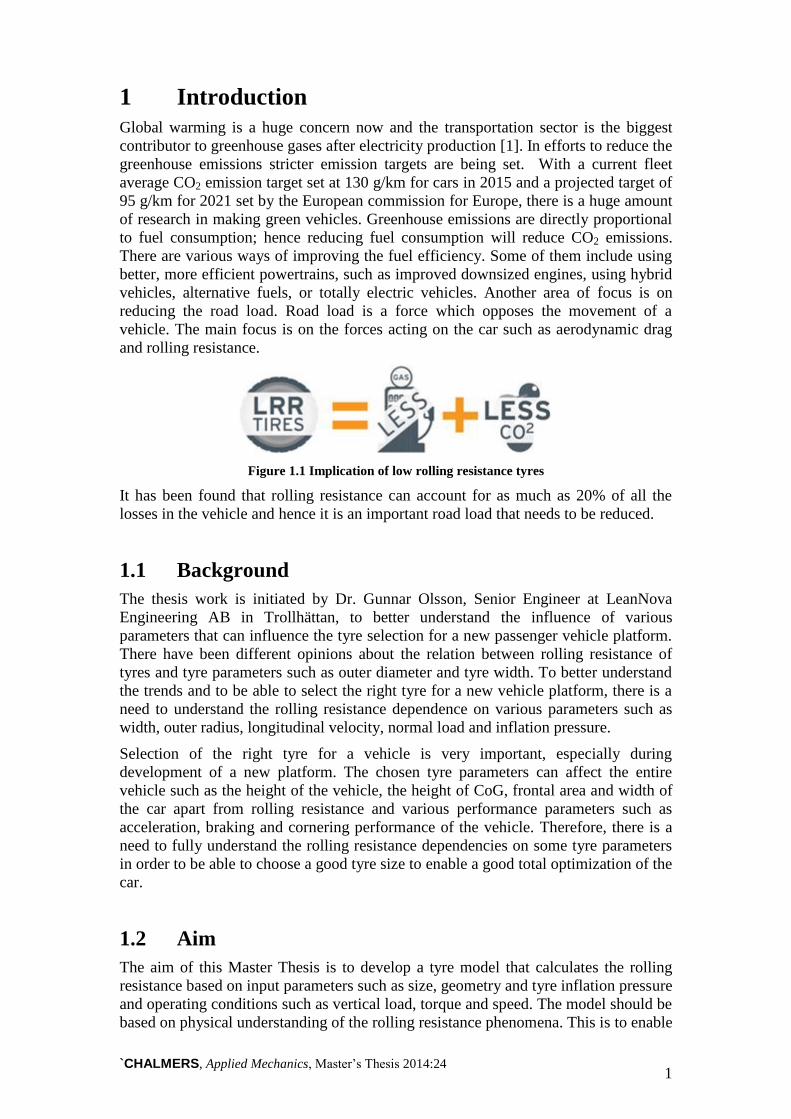
Figure 1.1 Implication of low rolling resistance tyres
It has been found that rolling resistance can account for as much as 20% of all the
losses in the vehicle and hence it is an important road load that needs to be reduced.
1.1 Background
The thesis work is initiated by Dr. Gunnar Olsson, Senior Engineer at LeanNova
Engineering AB in Trollhättan, to better understand the influence of various
parameters that can influence the tyre selection for a new passenger vehicle platform.
There have been different opinions about the relation between rolling resistance of
tyres and tyre parameters such as outer diameter and tyre width. To better understand
the trends and to be able to select the right tyre for a new vehicle platform, there is a
need to understand the rolling resistance dependence on various parameters such as
width, outer radius, longitudinal velocity, normal load and inflation pressure.
Selection of the right tyre for a vehicle is very important, especially during
development of a new platform. The chosen tyre parameters can affect the entire
vehicle such as the height of the vehicle, the height of CoG, frontal area and width of
the car apart from rolling resistance and various performance parameters such as
acceleration, braking and cornering performance of the vehicle. Therefore, there is a
need to fully understand the rolling resistance dependencies on some tyre parameters
in order to be able to choose a good tyre size to enable a good total optimization of the
car.
1.2 Aim
The aim of this Master Thesis is to develop a tyre model that calculates the rolling
resistance based on input parameters such as size, geometry and tyre inflation pressure
and operating conditions such as vertical load, torque and speed. The model should be
based on physical understanding of the rolling resistance phenomena. This is to enable

CHALMERS, Applied Mechanics, Master’s Thesis 2014:24 2
a comparison between different tyres for choosing the best option that gives minimum
rolling resistance for same traction requirement, at a given load and road condition.
1.2.1 Deliverables
A tyre model that evaluates rolling resistance based on the input of different
parameters of the tyre.
● Physical explanation of the rolling resistance dependence on each parameter
● Mathematical model calculating tyre rolling resistance.
● Simulink block for LeanNova energy simulation environment
1.3 Scope and Limitations
A tyre is a very complicated component of the vehicle, impacting the vehicle
performance and behaviour in several ways. There have been many models for tyres.
Depending on the type of output required, the tyre has been modelled with respect to
comfort, traction, noise and so on. In this study, a model is developed to understand
some operational and design parameters of the tyre with respect to rolling resistance,
while not considering few other design parameters such as tyre material, tread pattern,
road types and temperature. They are considered beyond the scope of the thesis work
due to limited time, information and knowledge of the subject. Furthermore, the tyre
model applies to free rolling cases and does not include any torque application to
wheels or longitudinal slip. This means the model does not calculate longitudinal
stiffness and subsequent contribution to longitudinal force due to this. Hence the
contribution to energy consumption values due to the longitudinal slip phenomenon is
unaccounted for.
There are many assumptions in the thesis such as contact patch shape is assumed to be
perfect rectangle; inflation pressure doesn't change with deflection, tyre material and
tread pattern are kept constant; on a modern conventional passenger car tyre. Road
type is fixed to hard, dry and flat surface. The model accounts for pneumatic tyre
designs, however motorcycle tyres or round profile tyres are not considered in the
study. Road type is assumed to be a hard dry surface. Temperature is assumed to be a
constant, steady state parameter. While this may not be entirely true, it has been
found from literature that they are reasonable approximations in the quest to initiate
an understanding of the rolling resistance phenomenon. Due to limited time and
resources, most of the tyre information has been taken from various research papers
and correspondingly, most constants used have been obtained thereof.

`CHALMERS, Applied Mechanics, Master’s Thesis 2014:24 3
2 Literature Review
In this section the contribution of rolling resistance to the total losses in a vehicle is
discussed. In this respect, an understanding of the influence of various parameters on
tyre rolling resistance coefficient and the conflict of reducing rolling resistance with
vehicle requirements is also discussed.
The overall fuel consumption of a vehicle depends on many factors. They are
generally of the following categories.
● Inertia losses dissipated during deceleration or downhill driving
● Aerodynamic drag on both vehicle body and wheels
● Rolling resistance
● Longitudinal slip
Figure 2.1: Resistance on a car [2]
The current trend of making more efficient vehicles has created a considerable interest
in understanding rolling resistance and its dependence on various parameters so that
the overall efficiency of the vehicle can be improved.
2.1 Understanding tyres
A tyre must perform a number of functions in a vehicle. It should cushion, dampen,
assure good directional stability and provide long service life. But primary concern is
the road holding quality such as being able to transmit strong longitudinal and lateral
forces during acceleration, braking and cornering manoeuvres at different road
conditions.
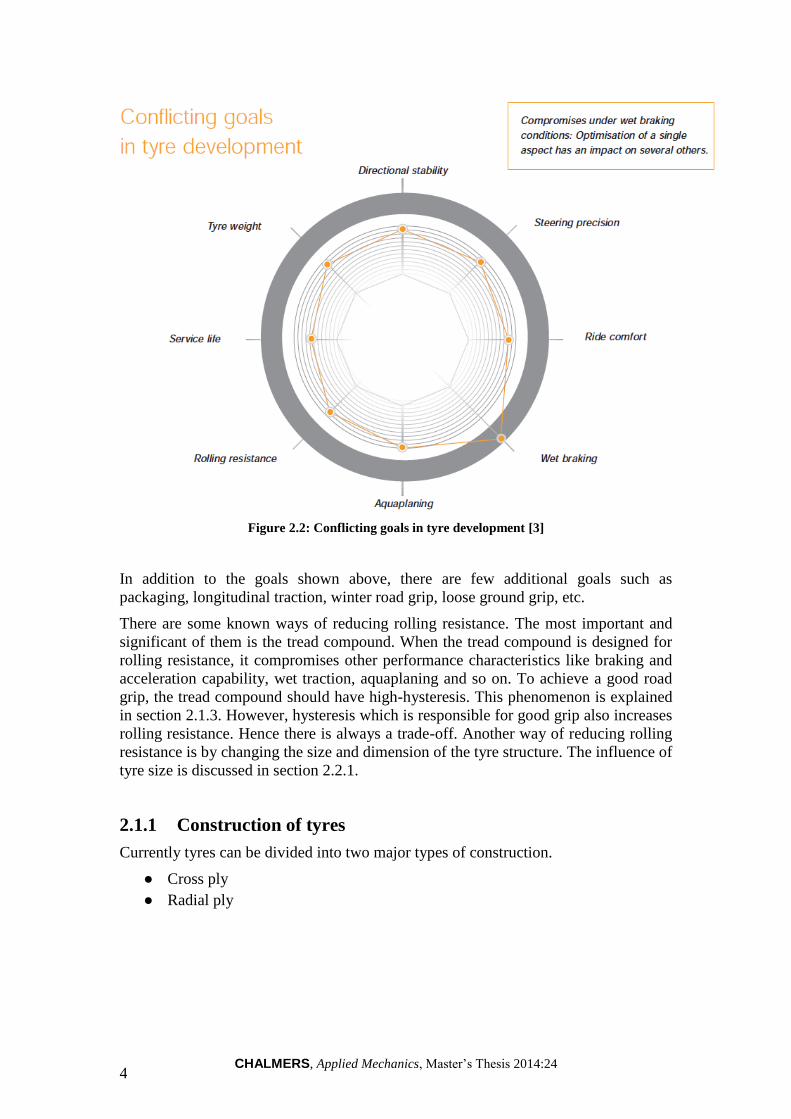
Due to the wide range of demands, optimising tyre design for certain characteristics
can be often a compromise. Some of the characteristics to be considered while
designing are shown figure 2.2.
CHALMERS, Applied Mechanics, Master’s Thesis 2014:24 4
Figure 2.2: Conflicting goals in tyre development [3]
In addition to the goals shown above, there are few additional goals such as
packaging, longitudinal traction, winter road grip, loose ground grip, etc.
There are some known ways of reducing rolling resistance. The most important and
significant of them is the tread compound. When the tread compound is designed for
rolling resistance, it compromises other performance characteristics like braking and
acceleration capability, wet traction, aquaplaning and so on. To achieve a good road
grip, the tread compound should have high-hysteresis. This phenomenon is explained
in section 2.1.3. However, hysteresis which is responsible for good grip also increases
rolling resistance. Hence there is always a trade-off. Another way of reducing rolling
resistance is by changing the size and dimension of the tyre structure. The influence of
tyre size is discussed in section 2.2.1.
2.1.1 Construction of tyres
Currently tyres can be divided into two major types of construction.
● Cross ply
● Radial ply

`CHALMERS, Applied Mechanics, Master’s Thesis 2014:24 5
Figure 2.3 : Cross-ply tyres [4]
Figure 2.4: Radial tyres [4]
Cross ply (or Bias ply) is the older type of construction, where the sidewall and the
tread region are made of similar construction as shown in figure 2.3. Radial tyre is
advancement in tyre technology, effectively separating how the sidewall and tread
region of the tyre behaves as shown in figure 2.4.
The main structural elements of a tyre are the casing assembly and the tread and belt
assembly. The casing contains the volume of air and cushions the tyre. The tread and
belt assembly provides the actual road surface contact responsible for minimal rolling
resistance, optimal handling and a long service life.
Every modern passenger car tyre has a very complex structure and constitutes the
following.
● Tread
○ Tread – High mileage/road grip/water expulsion
○ Joint-less cap plies – enable high speeds
○ The steel - cord belt plies – optimise directional stability and rolling
resistance
● Casing
○ Textile cord ply – maintains inflation pressure and tyre’s shape
○ Inner liner – makes the tyre airtight
○ Side wall – protects from external damage
○ Bead core – ensures firm seating on the rim
○
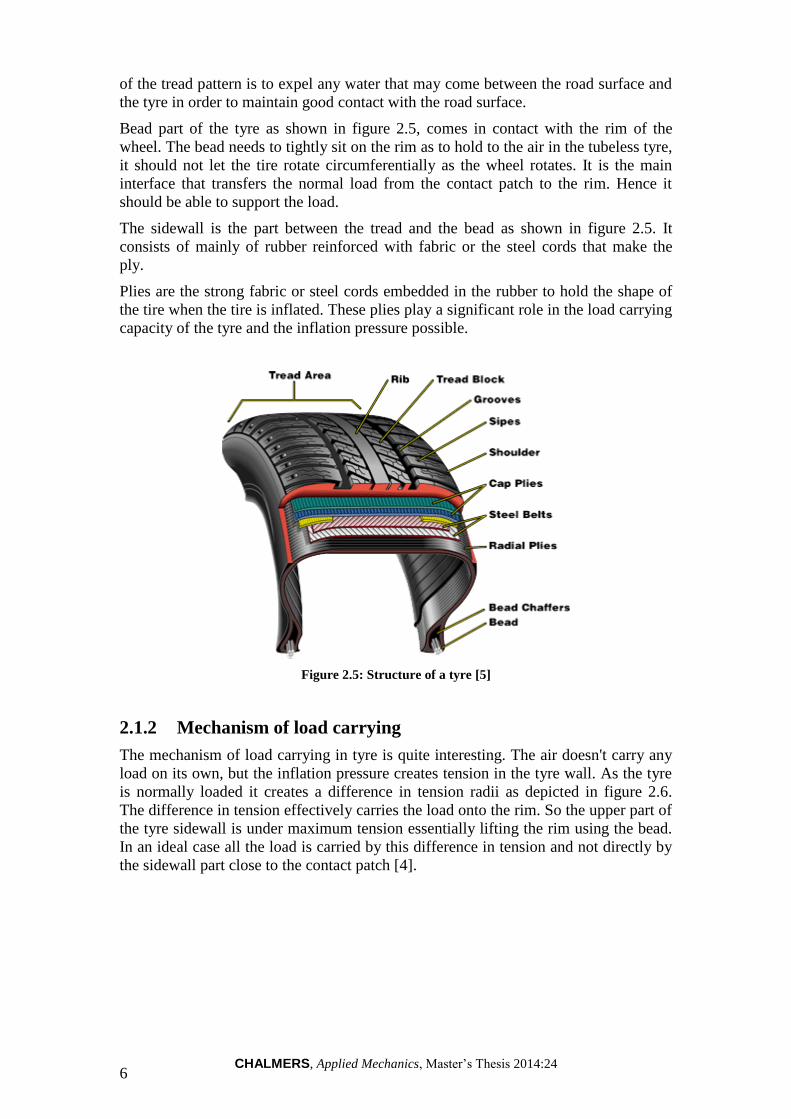
Tread is the outmost surface of the tire that comes in contact with the road surface as
shown in figure 2.5. Its function is to provide a good amount of traction, while being
durable. Tread also contains patterns of grooves, lugs, voids and sipes. The function
CHALMERS, Applied Mechanics, Master’s Thesis 2014:24 6
of the tread pattern is to expel any water that may come between the road surface and
the tyre in order to maintain good contact with the road surface.
Bead part of the tyre as shown in figure 2.5, comes in contact with the rim of the
wheel. The bead needs to tightly sit on the rim as to hold to the air in the tubeless tyre,
it should not let the tire rotate circumferentially as the wheel rotates. It is the main
interface that transfers the normal load from the contact patch to the rim. Hence it
should be able to support the load.
The sidewall is the part between the tread and the bead as shown in figure 2.5. It
consists of mainly of rubber reinforced with fabric or the steel cords that make the
ply.
Plies are the strong fabric or steel cords embedded in the rubber to hold the shape of
the tire when the tire is inflated. These plies play a significant role in the load carrying
capacity of the tyre and the inflation pressure possible.
Figure 2.5: Structure of a tyre [5]
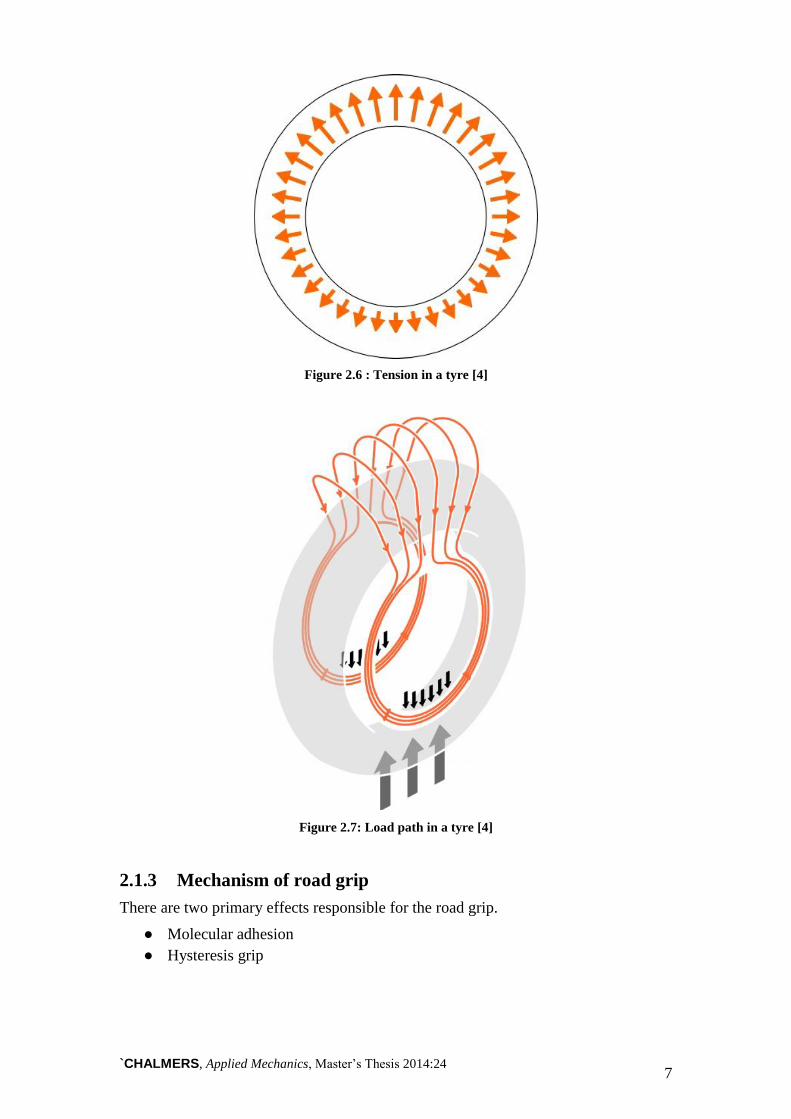
2.1.2 Mechanism of load carrying
The mechanism of load carrying in tyre is quite interesting. The air doesn't carry any
load on its own, but the inflation pressure creates tension in the tyre wall. As the tyre
is normally loaded it creates a difference in tension radii as depicted in figure 2.6.
The difference in tension effectively carries the load onto the rim. So the upper part of
the tyre sidewall is under maximum tension essentially lifting the rim using the bead.
In an ideal case all the load is carried by this difference in tension and not directly by
the sidewall part close to the contact patch [4].
`CHALMERS, Applied Mechanics, Master’s Thesis 2014:24 7
Figure 2.6 : Tension in a tyre [4]
Figure 2.7: Load path in a tyre [4]
2.1.3 Mechanism of road grip
There are two primary effects responsible for the road grip.
● Molecular adhesion
● Hysteresis grip

CHALMERS, Applied Mechanics, Master’s Thesis 2014:24 8
Figure 2.8: Adhesion force and hysteresis forces are shown in the upper part and lower part of
the figure respectively; the orange arrows show the force exerted on the tyre. [4]
2.1.3.1 Molecular adhesion
Adhesion is the force resulting from interactions at the molecular level at the tyre/road
interface. It is also generally known as friction between two surfaces. This is again
divided into static and kinetic friction.
The maximum frictional resistance force can be calculated by multiplying normal
force N multiplied by Coefficient of friction μ (static)
Where μ is a fixed value dependent on the combination of the two materials in
contact. The frictional force is therefore independent of the surface area.
After the object starts moving, the resistance is generally reduced to a lower value, Fs.
This value of sliding friction is proportional to N as well.
There are various models that explain this phenomenon. Friction is caused by
electrical forces between the molecules of both surfaces.
2.1.3.2 Hysteresis grip
Rubber is a material that can absorb lots of energy during loading and unloading. The
path that the rubber follows during loading is different compared to unloading due to
this absorption of energy, this property is called hysteresis.

`CHALMERS, Applied Mechanics, Master’s Thesis 2014:24 9
Figure 2.9: Hysteresis curve [4]
Compared to harder surfaces such as plastic or metal, a rubber surface can better hold
on to the irregularities in the road surface. The irregular peaks on the road surfaces
create indentation on the tyre surface. Now the surface created due to the indentation
gives additional grip otherwise not present in two rigid surfaces.
When the vehicle is moving and there is some acceleration or deceleration, the vehicle
will tend to drag the tyre tread surface along the road surface. As the material is
continuously undergoing compression and expansion due to various asperities along
the road, the hysteresis comes into play, which increases the forces on the
compression (loading) side of the indentation compared to expansion (unloading)
side. The resultant is a horizontal force. This force still does not include the shear
forces created by surface friction.
Figure 2.10: Normal force on a road asperity when stationary [4]

CHALMERS, Applied Mechanics, Master’s Thesis 2014:24 10
Figure 2.11: Normal force on a road asperity when moving [4]
The total horizontal force is now the sum of forces due to both adhesion and
hysteresis, while force due to adhesion is directly proportional to the normal force, the
adhesion force is a function of normal load and sliding speed and sliding speed
direction on a micro level.
2.1.4 Mechanism of Rolling Resistance
Contribution to rolling resistance is accounted for by three important phenomena.
They are tyre deformation in contact patch, the rotational aerodynamic drag of the
wheel and slip between tyre and road or wheel rim. Tyre deformation constitutes a
major part of rolling resistance and is mainly because of bending of the tyre crown at
the leading and trailing edge of the contact patch and bending or bulging out of the
side-wall because of the load on tyre structure, compression of the tread throughout
the contact patch area and finally shearing of tread and sidewall elements. These
phenomena cause a deformation induced viscoelastic energy loss in the tyre [6].
The belt part of the carcass is generally made of belt and is non elastic and of fixed
length. There is rubber beneath and above this belt and in the case of bending of tread
at leading and trailing edges of the contact patch it would mean that the rubber layer
inside gets compressed and the rubber layer outside this belt expands. Now this
change in radius at the edges and rubbing of layers will manifest itself in hysteresis
loss and hence contributing to rolling resistance [7].
In case of braking or acceleration the slip factor contribution to rolling resistance
becomes significant. There is a portion of the tyre where the material shall stick to the
road and the rest part of contact patch shall slip against the road surface. The
rotational aerodynamic drag depends on the tread design since the tyre has to
overcome this to be able to keep rotating at constant velocity. The contribution of
rotational aerodynamic drag becomes significant at high wheel velocities [7].
The major contributors to creation of resistance to rolling of tyre on a straight and flat
road surface are energy dissipated in the process of rolling and aerodynamic drag. The
energy absorbed in heat is a manifestation of hysteresis forces because of radial
deformation of the tyre. The hysteresis damping tends to produce higher pressure by
acting radially inward in the front part of the contact patch and the opposite happens
in the rear half of the contact patch. This leads to a shift in centre of normal pressure
in the contact patch area in the direction of rolling as shown in figure 2.12. The shift
in pressure centre produces a moment about the tyre centre opposing the rolling. The
other component of the radial force acting on the tyre structure is the shear force. This
force exists between the tyre road interface which opposes the longitudinal motion or
acts in negative x-direction. The moment of this shear force cancels the rolling

`CHALMERS, Applied Mechanics, Master’s Thesis 2014:24 11
moment. However, for the overall force diagram of the system to be balanced so that
the vehicle rolls at a constant longitudinal velocity, there has to be a force at the centre
of the hub pushing the wheel longitudinally or acting in positive x-direction and must
measure exactly equal to the longitudinal negative shear force at tyre and road
interface [8].
Figure 2.12: Shift in pressure centre during free rolling [4]
2.2 Influence of tyre parameters on rolling resistance
Various factors affect rolling resistance like tyre radius, width, inflation pressure,
normal load and velocity. Over years, rolling resistance data have been obtained for
various types of tyres from laboratory tests that are used for comparison of rolling
losses and effect on fuel consumption. Many such models are polynomial expressions
and have parameters like velocity, normal load and inflation pressure [9]. These
expressions have coefficients that are determined through curve-fitting to
experimental values. This approach is specific for each kind of tyre and although it
predicts an accurate representation, it does not provide a physical understanding of
tyre rolling resistance phenomena. Hence it is important to know how each of the
parameters influence rolling resistance and how they are varied.
2.2.1 Influence of tyre size
Tyre sizing is a critical parameter with respect to many aspects of a vehicle other than
rolling resistance losses, for example vehicle handling. It is hence indispensable from
vehicle design and loss point of view in the early phase of vehicle platform
development. While varying tyre size, other parameters are kept constant, for
example, inflation pressure, longitudinal velocity, loading capacity and possibly tyre
width. It may be important to note that for increasing the tyre outer diameter while
keeping same loading capacity, it is observed that the size of rim needs to increase
and simultaneously sidewall height should reduce. Increasing tyre diameter decreases
vertical deformation for the same contact patch length from the pure geometry point
of view, when the tyre is considered in terms of a perfect circle. Even though this
might seem purely theoretical, it projects an idea that decreasing the vertical
deformation shall practically mean low transition of radius on the leading and trailing
edges of the contact patch and hence bending of tyre tread region is lower for a bigger
diameter which results in lower hysteresis losses [6].

CHALMERS, Applied Mechanics, Master’s Thesis 2014:24 12
Figure 2.13: Rolling resistance coefficient of tyre 175/70 R14 with outer diameter at 2.1 bars as
per the ISO 8767 standard (with base 100) [6]
Figure 2.13 shows a plot of rolling resistance with respect to tyre outer diameter from
experimental data for a radial, passenger car tyre. A value of 100 is assigned to a tyre
with outer diameter of 60 cm and the rolling resistance coefficient value
corresponding to another tyre diameters are linearly scaled. The dependence linearly
decreases in the range of tyre diameters shown [6].
Figure 2.14: Rolling resistance coefficient change with tyre diameter and surface types [10]
Wong illustrates a plot from experimental data, between rolling resistance coefficient
and tyre diameter in figure 2.14. On hard turf like concrete, the effect is very less
pronounced, however, at medium to hard ground the reduction of the rolling resistance
coefficient with an increase in tyre diameter can be observed distinctly. With
deformable surfaces, the effect is magnified [10].
Figure 2.15 shows rolling resistance coefficient data at two different speeds of 20 mph
and 50 mph for increasing tyre size for the radial type. The investigation suggests a
marked lowering of rolling resistance coefficient with an increase in tyre size from 13
inches to 15 inches, at both speeds. The decreasing trend is in accordance with
previous plots.

`CHALMERS, Applied Mechanics, Master’s Thesis 2014:24 13
Figure 2.15: Rolling resistance coefficient change with tyre size [11]
For same load on a level road surface, the rolling resistance coefficient decreases for
the decrease in an aspect ratio of the tyre, though not very remarkably [12]. This may
be understood as saying that the more the tyre width compared to section height, the
lesser is the rolling resistance coefficient. The contact patch area increases while
increasing width thereby decreasing the force sustained by each element in the patch.
As such, the compression of each element in the tyre is lesser compared to those of a
tyre with a smaller width. Hence the hysteresis loss is lower. Hence, the energy for
overcoming the loss is lower and rolling resistance decreases. However, an increase in
tyre width leads to an increase in aerodynamic drag [10], which is a significant factor
at high speeds when looking at rolling resistance coefficient.
Figure 2.16: Influence of the aspect ratio of fixed tire size and load carrying capacity [13]
Figure 2.16 plots relative rolling resistance efficiency with respect to change in tyre
width at different tyre inflation pressure levels for a truck tyre. Relative rolling
resistance efficiency is defined as a ratio of normal load to rolling resistance. The tyre
diameter, tyre vertical load, section height and tyre tread thickness are kept constant and
at each inflation pressure a section width is plotted for the given load. The study
suggests that moderate improvement in relative rolling efficiency or decrease in rolling
resistance coefficient is possible by means of increasing pressure and having low tyre
width [13]. However the speed at which the data is measured is not mentioned.

CHALMERS, Applied Mechanics, Master’s Thesis 2014:24 14
2.2.2 Influence of tyre inflation pressure
Figure 2.17: Variation of rolling resistance coefficient with inflation pressure of tyres on various
surfaces [10]
Tyre rolling resistance decreases with increase in pressure on level road surface as
other parameters are kept constant. As the pressure increases, the tyre holds its shape
more firmly and vertical deflection decreases. Thus the deformation of rubber is lesser
compared to that in a tyre with lower pressure. Hence the hysteresis losses reduce
thereby decreasing rolling resistance in case of level road surface which is reflected in
the figure above [10]. In case of deformable surfaces, deformation of other contact
surface which is the ground is taken into consideration for overall deformation. As
inflation pressure reduces, there is a lot of bending and shearing of tyre sidewall and
tread region, which amounts to losses in the rubber resulting in an increase in rolling
resistance [6].
Figure 2.18: Rolling resistance measures at 2.1 bars as per the ISO 8767 standard [6]
Figure 2.18 has a value of 100 for the rolling resistance coefficient value of at 2.1
bars. The values corresponding to the rest of the pressure values are linearly scaled.
The coefficient reduces as the pressure increases indicating lowered hysteresis losses
at higher inflation pressure. The dependence tends to be less linear in the region of
low tyre inflation pressure as can be inferred from the figure, compared to the region
of nominal tyre inflation pressure.

`CHALMERS, Applied Mechanics, Master’s Thesis 2014:24 15
Figure 2.19: Dependence of rolling resistance on inflation pressure for the FR78-14 tyre tested at
1280 lbs load and 60 mph [14]
Figure 2.19 illustrates the variation of rolling resistance with respect to tyre inflation
pressure ranging from 16 to 64 psi, which is approximately 1.1 to 4.4 bars, for an old
radial car tyre FR78-14. The rolling resistance data depicted in the figure is concurrent
with trend obtained from pressure influence in previous references.
2.2.3 Influence of normal load
Figure 2.20: Rolling resistance measured at 80% of the tyre’s maximum load capacity as per the
ISO 8767 standard [6]
As understood from section 2.1.4, an increase in normal load will increase radial
deformation of tyre elements. The rolling moment produced due to shift in pressure
centre will now increase because of an increase in the vertical component of
hysteresis damping, thus increasing rolling resistance force. In terms of tyre
behaviour, this may be understood as more bending and shearing of the tyre structure
as the normal load applied increases [6]. The same is depicted in the figure 2.20. The
rolling resistance coefficient, however, is a function of the modelling of the hysteresis
damping.
Figure 2.21: Dependence of rolling resistance on wheel load for FR78-14 tyre tested at 32 psi
pressure and 60 mph speed [14]

CHALMERS, Applied Mechanics, Master’s Thesis 2014:24 16
Figure 2.21 shows the linear dependence of equilibrium rolling resistance (in lbs) on
normal load. Rolling resistance increases as tyre load increases from 640 to 1280 lbs
(290 to 580 kilos approximately) at 32 psi (2.2 bars) and 60 mph (97 km/h) for an old
radial car tyre, FR78-14 [14].
Figure 2.22: Coefficient of rolling resistance as a function of the total vertical force applied to the
bicycle tyres. [15]
In a study to determine the effect of normal loading on rolling resistance for cycling
performance, racing bicycle of 9.8 kg with clincher tyres were used by a cyclist and
then pay-loaded with extra weight in a backpack. The coefficient of rolling resistance
was determined by coasting method, indoors. The value of the coefficient was
observed to increase with increase in normal loading, quite in contrast to the trend
observed in passenger car tyres, figure 2.20. This is shown in figure 2.22. Hence the
behaviour of RRC with vertical force is specific to a type of tyre and may increase or
decrease.
2.2.4 Influence of longitudinal velocity
Figure 2.23: Variation of RRC of radial and bias-ply car tyres with speed on smooth and flat
surface under rated load and inflation pressure [10]
Wong illustrates a plot of longitudinal velocity with respect to rolling resistance
coefficient as shown in figure 2.23. For radial car tyres, it can be observed that the
plot is quite flat till 100 km/h and then increases notably. A similar plot (see figure
2.24), from Michelin (with base 100 at 80 km/h and constant loading of 80% of load
bearing capacity at 2.1 bar) for passenger car tyres with and without capped crown
also suggests that the graph is very much constant till 100 km/h, slightly rises till 120
km/h and then shoots because of aerodynamic drag [6]. From section 2.1.4, it may be
noted that the hysteresis damping which results in a shift in centre of pressure is not
enough to explain or model the complete velocity dependence. At higher velocities,
`CHALMERS, Applied Mechanics, Master’s Thesis 2014:24 17
the rotational aerodynamic drag must be taken into account which has been referred to
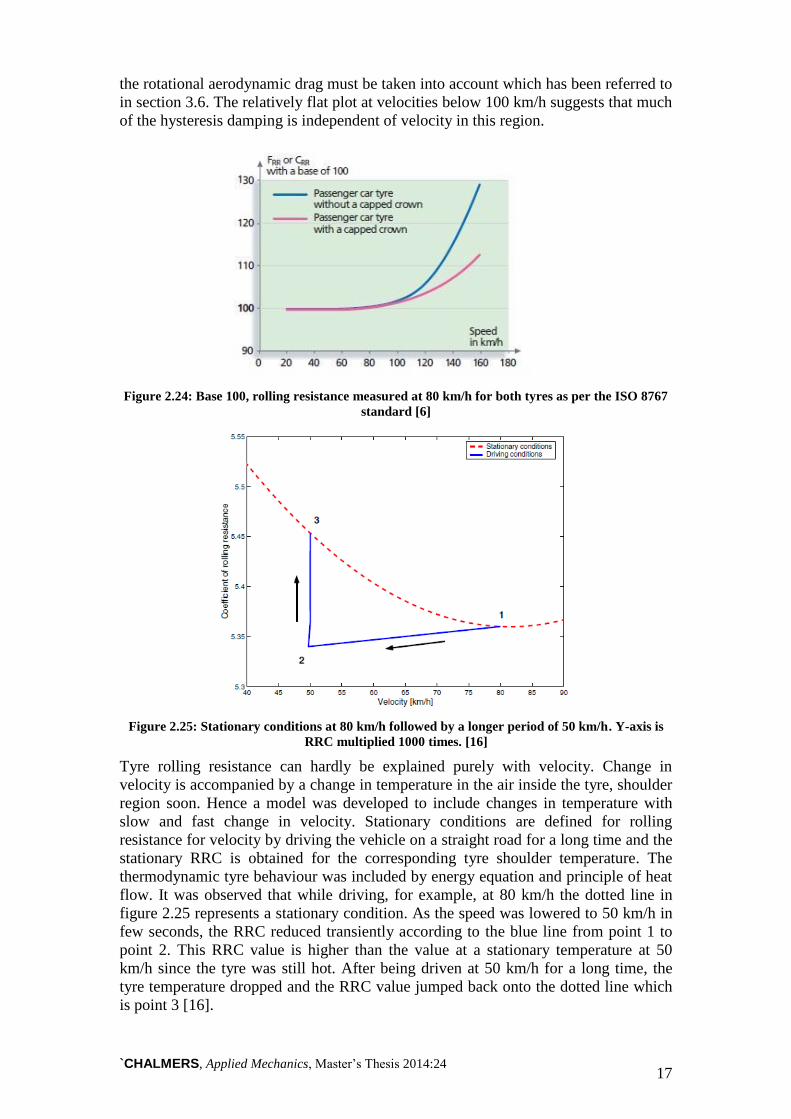
in section 3.6. The relatively flat plot at velocities below 100 km/h suggests that much
of the hysteresis damping is independent of velocity in this region.
Figure 2.24: Base 100, rolling resistance measured at 80 km/h for both tyres as per the ISO 8767
standard [6]
Figure 2.25: Stationary conditions at 80 km/h followed by a longer period of 50 km/h. Y-axis is
RRC multiplied 1000 times. [16]
Tyre rolling resistance can hardly be explained purely with velocity. Change in
velocity is accompanied by a change in temperature in the air inside the tyre, shoulder
region soon. Hence a model was developed to include changes in temperature with
slow and fast change in velocity. Stationary conditions are defined for rolling
resistance for velocity by driving the vehicle on a straight road for a long time and the
stationary RRC is obtained for the corresponding tyre shoulder temperature. The
thermodynamic tyre behaviour was included by energy equation and principle of heat
flow. It was observed that while driving, for example, at 80 km/h the dotted line in
figure 2.25 represents a stationary condition. As the speed was lowered to 50 km/h in
few seconds, the RRC reduced transiently according to the blue line from point 1 to
point 2. This RRC value is higher than the value at a stationary temperature at 50
km/h since the tyre was still hot. After being driven at 50 km/h for a long time, the
tyre temperature dropped and the RRC value jumped back onto the dotted line which
is point 3 [16].

CHALMERS, Applied Mechanics, Master’s Thesis 2014:24 18
3 Modelling
This chapter presents the methodology and various phases of the thesis to achieve the
tyre rolling resistance model. There are several phases of the model that implement
improvements to different phenomena observed. At each phase results were compared
to experimental data obtained from the literature.
3.1 Basic Assumptions
Rolling resistance coefficient (RRC) can be defined in many ways. It is common in
the vehicle industry to define rolling resistance as the ratio of rolling resistance force
to normal force.
But for the purpose of this work, most of the calculations have assumed the other
definition based on the offset “e” of the normal pressure distribution along the contact
patch length. Where rolling resistance coefficient is the ratio of the offset length of the
deformed radius of the tyre.
Some of the other assumptions made throughout the development of the tyre model
for rolling resistance are as follows.
● The contact patch shape is a perfect rectangle
● Contact width is equal to section width
● Contact patch length is a function of vertical deformation purely on the basis
of geometry. (L=f(∆"z " ))
3.2 Radial spring and damper distribution
The tyre contact patch is considered to be constituted of identical radial elements,
each of which is a combination of a linear spring and a viscous damper. The vertical
load on the tyre causes radial deflection in spring and damper elements in the contact
patch, at the bottom of tyre as shown in figure 3.1. The total normal force on the tyre
is then the summation of elemental spring and damper forces throughout the contact
patch where the spring and damper forces are given as follows.
Figure 3.1 Distributed spring and damper elements in tyre

`CHALMERS, Applied Mechanics, Master’s Thesis 2014:24 19
Where = elemental spring force as shown in figure 3.1, K = elemental spring
stiffness and z = vertical component of radial deformation of element at an angle
from centre line of contact patch as shown in figure 3.2.
Where = elemental damper force as shown in figure 3.1, = elemental damping
coefficient and = vertical component of radial deformation velocity of element at
an angle from centre line of contact patch as shown in figure 3.2.
Calculation of rolling resistance coefficient
The vertical displacement of any element in the tyre contact patch can be calculated
from the equation of perfect circle as,
Where R is the unloaded radius of inflated tyre,
= angle between the radius through middle of contact patch and the radius through
any element.
= angle between the radius through middle of the contact patch and the radius
through the element at the leading or trailing edge of the contact patch
The position of this element along the contact patch with axis configuration as shown
in figure 3.2 can be stated as follows.
Figure 3.2 Deformation in tyre using circle geometry
Total normal force on the tyre can be given as below.
The following plots of spring and damper forces separately with respect to the
elements in contact patch can be added to obtain overall normal force.

CHALMERS, Applied Mechanics, Master’s Thesis 2014:24 20
Figure 3.3 : Vertical deformation of each element along contact patch (metres) with maximum
deformation of 6.6 mm
Note that the spring force is part of the equation of perfect circle and appears
parabolic here because of scaling. This spring force is essentially symmetric about the
z-axis in the figure 3.3. Adding this elemental force throughout the contact patch shall
give us a total of zero force.
Figure 3.4: Rate of Vertical deformation of each element in contact patch (metres)
The above plots have been obtained for the conditions of normal load = 5 KN, tyre
inflation pressure = 250 kPa, longitudinal speed = 80 km/h and number of contact
patch element = 100.
The damping force can be seen with respect to rate of vertical deformation of
elements throughout the contact patch in figure 3.4. This force is not symmetric about
the z-axis and adding this elemental force throughout yields a resulting damper force.
Because of this resulting damping force, there is a shift in the centre of pressure or the
resulting normal load in the direction of rolling. This is denoted as the offset ‘e’. This
shift can be comprehended from figure 3.5 which shows overall normal force with
respect to element position in contact patch.

`CHALMERS, Applied Mechanics, Master’s Thesis 2014:24 21
Figure 3.5: Normal Force Distribution (165/70 R13) along contact patch (metres) at Normal load
of 5 KN, tyre inflation pressure of 250 kpa, longitudinal speed of 80 km/h
The offset calculated above can be summarized by the formula
The rolling resistance coefficient is calculated as
.
The spring force weighed over position along contact patch gives zero value since
it is a symmetric distribution across y-axis as seen in figure 3.3. Hence it is the
distribution of damping force that affects RRC.
The rolling resistance force is
.
This definition of RRC is possible to combine with a wheel which is driven or braked.
An alternative definition, RRC = Fx/Fz, presumes that the torque on the wheel is zero.
Since the stiffness does not directly influence the normal load offset value, the model
for damping and stiffness can be separately investigated.
3.3 Balloon modelling and stiffness
The vertical stiffness of a tyre is an important property of the tyre. The stiffness of the
tyre comes mostly due the pneumatic stiffness of the tyre and partly due to the
structural stiffness of the tyre. So in theory it is possible to have a physics-based
formula to predict the vertical stiffness of a tyre using some easily obtainable
parameters.
To understand the physics behind the tyre stiffness, a tyre can be considered as the
balloon inflated with certain pressure. Where the tension in the balloon can be
calculated using the surface tension phenomenal, where the surface tension of a
bubble is dependent on the pressure difference and the radius of the bubble.

CHALMERS, Applied Mechanics, Master’s Thesis 2014:24 22
When a balloon pushes on to a flat surface the pressure at the contact region is
approximately equal to the inflation pressure of the balloon. Then the area of contact
is directly proportional to the normal force applied on the balloon, where the equation
can be written as
Force= Pressure*Area
Figure 3.6: Balloon model [4]
So, according to this model, the material has preloaded tension due to the inflation
pressure, and the load is transferred from the contact region to the hand via the
balloon material, but the balloon by its own virtue does not carry any load.
But in reality the material does carry some part of the load, the proportion of this load
carried due to structural stiffness is especially important at lower loads, and tends to
be quite close to the stiffness predicted by the balloon at higher loads.
Figure 3.7 shows the experimental load vs stiffness relationship for radial passenger
car tyres, here the slope of the curve corresponds to the stiffness of the tyre at each
particular pressure. While the figure 3.8 shows the predicted load-deflection curve
using the balloon model. It can be seen that, the balloon model predicts good stiffness
relationship at higher deflections.
Figure 3.7: Static load-deflection relationship of a radial-ply car tire. [10]

`CHALMERS, Applied Mechanics, Master’s Thesis 2014:24 23
Figure 3.8 : Load -deflection predicted from balloon model
Unfortunately, in the working region of the tyre the there is still a significant
component of structural stiffness. This requires the study to investigate more accurate
vertical stiffness models.
3.4 Constant Belt Model
Constant belt model by T. B. Rhyne [17] is a tyre vertical stiffness model based on the
physics of the tyre derived from the ring model used by Koutny model without regard
to thermodynamics.
The study mainly concentrates on a model based on finding the vertical stiffness of
the tyre using the contained air volume in an elastic enclosure (tyre), or simply air
spring applied within an inextensible ring model. Contact area has been approximated
by assuming a rectangular contact patch.
The assumptions of the model are as follows
1. The tyre is assumed to be a ring of constant length at all times including
loading.
2. The increased radius throughout the tyre other than transition region, away
from the contact patch is called counter-deflection as shown in figure 3.9.
3. The tyre loading results in a concentric circular shape of a tyre with an
increased radius which joins with the contact patch in transition with an arc of
a certain radius.
4. The counter-deflection is directly dependant on the vertical deflection at the
contact patch.

CHALMERS, Applied Mechanics, Master’s Thesis 2014:24 24
Figure 3.9: Deformation due to loading in a constant belt model [17]
The study finally gives a formula for vertical stiffness after setting the constants for
counter deflection from various experimental data.
√
The formula with these constants gives a good fit for a wide array of tyre data [17].
And this formula has been used in the model to calculate the stiffness of a tyre. Note
that the constants take into account geometry and material property of tyre. Hence,
these could be calculated separately and more accurately for a specific tyre through a
set of experiments to give a better fit to the vertical stiffness equation.

`CHALMERS, Applied Mechanics, Master’s Thesis 2014:24 25
3.5 Damping Model
The distributed viscous damper is a reasonable dependence to model the damping
forces that are instrumental in causing rolling resistance so far. However the model
suggests that the rolling resistance coefficient becomes zero at zero velocity which is
not concurrent with experimental observation. This is evident from the section 2.2.4 in
the literature review. Wong presents an experimental plot for radial tyres for
passenger cars as seen in figure 2.23, which suggest that the rolling resistance
coefficient versus longitudinal velocity plot is quite flat for below 50 km/h. Michelin
has measurement from 2003 for passenger car tyre which depicts a flat trend for
rolling resistance coefficient versus longitudinal velocity till about 80 km/h.
Figure 3.10: Forced spring-mass damper system
Figure 3.11: Plot for force versus velocity for mass damper system
The damper forces because of viscous damping can be depicted in figure 3.10 and
figure 3.11. Damping models are not very often purely viscous for example,
aerodynamic drag force is a function of the square of longitudinal velocity and not
only velocity. Introduction of coulomb damping decays with time and reduces
amplitude. The value is independent of frequency or velocity and can be used as a
material model in this case. Here the damping model is just a constant friction model
that opposes motion as shown in the figure 3.12 and figure 3.13.
Figure 3.12: Simple coulomb friction model

CHALMERS, Applied Mechanics, Master’s Thesis 2014:24 26
Figure 3.13: Constant friction with displacement in coulomb friction model
The combined model accounts for damping forces even at zero or low velocities as
depicted below.
Figure 3.14: Combined force due to viscous and coulomb damping
3.6 Rotational aerodynamic drag
While deformation in the contact patch accounts for most of the losses associated with
rolling resistance, aerodynamic drag of a rotating tyre can account for as much as 15%
at high speeds [6]. Rotational drag is not to be confused with the horizontal drag,
which occurs when the tyre is moving is moving horizontally. Rotational drag is the
drag when the wheel just rotates without any horizontal velocity as in the case of
testing on a testing machine.
Figure 3.15: Aerodynamic drag of rotating tyre [6]
Aerodynamic drag, also called as air resistance, is the force opposing the relative
motion of the object with the air, the torque drag for which is shown in figure 3.15.
The aerodynamics drag therefore depends on the relative velocity of the object with
respect to air.

`CHALMERS, Applied Mechanics, Master’s Thesis 2014:24 27
Figure 3.16: Types of drag and dependence on shape [18]
There are two types of aerodynamic drag acting on any object. They are:
● Form drag
Form drag or pressure drag occurs mainly due to the shape of the object. This
directly related to the cross sectional area normal to the flow of the fluid.
● Skin friction
Skin friction occurs because of the friction between the fluid (air) and the skin
of the object. This directly related to the area of the surface in contact with the
fluid
All rotating objects disturb the air around them, hence there is some drag torque
associated with the rotating objects. If the surface of the tyre is very flat as in the case
of ‘racing slick’, it will mainly counter skin friction. However, if there are any
grooves cut into the tread, it will have a component of the form drag as well.
The formula for the aerodynamic drag may be expressed as below.
Here the drag coefficient Cd is calculated from the other values in the equation. The
area refers to the surface area of the tyre tread and sidewalls. This air drag is added to
total longitudinal force, Fx for calculation of RRC.
The Cd depends on many factors such as the tread profile and the tread depth and so
on. And there hasn't been any research done in this particular field. For this work, Cd
as constant based assuming the use of same tyre shape and profile just with different
dimensions.
CHALMERS, Applied Mechanics, Master’s Thesis 2014:24 28
3.7 Combined Model
The final model is a compilation of all the concepts explained in the preceding
sections.
Tyre design parameters are
● Inflation Pressure, for a parked vehicle.
● Outer Radius
● Section Width
● Material stiffness, damping (constant in this model)
● Rim radius (no influence in this model)
Tyre operational variables
● Longitudinal velocity
● Normal load
● Temperature offset from steady state (kept at zero in this work, does not
influence in this work)
All the inputs are taken in SI units to avoid conversions later.
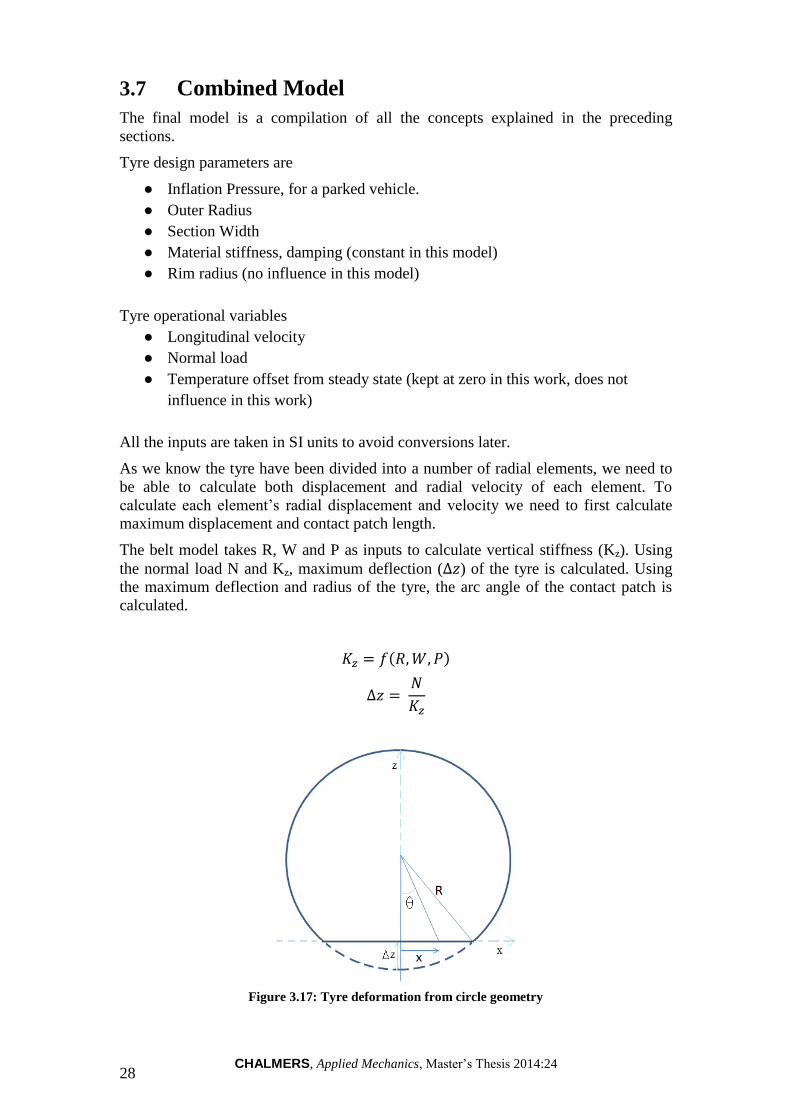
As we know the tyre have been divided into a number of radial elements, we need to
be able to calculate both displacement and radial velocity of each element. To
calculate each element’s radial displacement and velocity we need to first calculate
maximum displacement and contact patch length.
The belt model takes R, W and P as inputs to calculate vertical stiffness (Kz). Using
the normal load N and Kz, maximum deflection ( ) of the tyre is calculated. Using
the maximum deflection and radius of the tyre, the arc angle of the contact patch is
calculated.
Figure 3.17: Tyre deformation from circle geometry

`CHALMERS, Applied Mechanics, Master’s Thesis 2014:24 29
Where arc angle of the contact patch is 2*
The position of each element is
Now the vertical deformation of each element is
Note: Vertical deformation is the vertical component of radial deformation.
The rate of vertical deformation is
Now the vertical component of damping force each element can be calculated using
the Viscous Damping coefficient coulomb/friction damping coefficient (Cv and Cc)
with and sign( ) respectively.
Now damping forces on each element can be integrated along the contact patch
weighted with its position to get the integration of Fz*x*dx (symmetrical components
are cancelled due to the weighting of the position)
This can now be used to calculate the shift in the centre of pressure “e”
∫
Where integration is over the entire length of the contact patch and Fz = N.
And the Rolling Resistance force due to damping is e*N
The resistance force due to the rotational aerodynamic drag can be stated as follows.
= ( )*(W*2*pi*R)*Cd
Where Cd is the drag coefficient.
Now the rolling resistance co-efficient is
RRC = (e*N/R + )/N
Rolling resistance force is simply given as
“RR = e*N/R + ”.
3.8 Final tuning coefficients and their significance
There are three model tuning parameters to tune to model to a particular type of tyre.
● Damping coefficients
○ Viscous damping Cv
○ Coulomb damping Cc
● Aerodynamic drag coefficient
○ Cd
A coulomb damping coefficient is used to tune the RRC at zero velocity in the RRC
vs velocity plot. Viscous damping gives the first order curvature to the RRC vs
velocity curve and the drag coefficient gives the second order curvature. Note that the
coulomb damping forms a major component of the damping model for the most part
of velocity dependence. The first order influence to velocity curve can hardly be seen

CHALMERS, Applied Mechanics, Master’s Thesis 2014:24 30
in the plots from section 2.2.4. The viscous damping coefficient will be much lower
than coulomb damping coefficient. The aerodynamic drag part becomes significant at
higher velocities and hence the drag coefficient value adjusts the curve at high
velocity like 120 km/h.
There are constants (accounts for tyre material and geometry like tread thickness,
sidewall height) from the constant belt model that can be tuned to a given tyre in the
tyre stiffness model. Currently the constants that are given in the general formula for
tyre vertical stiffness in [17] are being used.
3.9 Simulink Block for energy simulation
Figure 3.18 shows the Simulink block representation of the combined model
developed, the block diagram also shows an example of how this model could be
implemented in a simulation environment, the Matlab code uses a discreet method of
integration due to the ease of implementation, the actual Matlab code can be found in
the appendix.
Figure 3.18: Tyre model integration in Simulink
The inputs to the model are
● Radius (R)
● Longitudinal Velocity (Vx)
● Normal Load (N)
● Section Width (W)
● Inflation Pressure (P)
The outputs from the model are
● RRC = Rolling resistance coefficient
● RR = Rolling resistance force.
The rolling resistance force is used outside the block as an input to LeanNova’s
energy simulation.

`CHALMERS, Applied Mechanics, Master’s Thesis 2014:24 31
4 Results and Discussion
This section presents all the results obtained from the combined tyre model for rolling
resistance. The results from the model in section 4.1 to 4.5 are compared to various
experimental data to see how well they correlate. All the results from the model have
been scaled and converted into the same units as in experimental plots to facilitate
comparison between them. Section 4.6 evaluates the working of the tyre model in
terms of energy consumption prediction when integrated in a vehicle model.
4.1 Influence of longitudinal velocity
Figure 4.1 RRC vs Velocity from combined model
Figure 4.2 RRC vs velocity, experimental data from LeanNova (Figure 7.4, Appendix I)
Figure 4.1 shows plot between rolling resistance coefficient and longitudinal velocity,
from the combined model. The x-axis represents velocity from 40 to 180 km/h, the y-
axis represents 1000 times the coefficient of rolling resistance. The plot was generated
for the tyre size 185/65 R15 at 2.5 bar tyre inflation pressure and a vertical load of
2500N. Figure 4. 2 show a similar plot for the same tyre and testing condition from
experimentally generated data from LeanNova (Appendix I). The viscous damping

CHALMERS, Applied Mechanics, Master’s Thesis 2014:24 32
and coulomb damping coefficients were tuned so that figure 4.1 can be calibrated to
data in figure 4.2. For example, at 60 km/h, the y-axis has a value of around 9.8, for
100 km/h the value is 10.5 and at 120 km/h the value is 11. At very high speed of 180
km/h, the y-axis has a value of 13.83 and the slope increases more rapidly than at
lower speeds. At higher speeds the square function of velocity from the rotational
aerodynamic drag component contributes significantly to rolling resistance
coefficient. It is important to consider same tyre and test conditions to obtain the
constants, which change for different tyre size. However, the plot obtained is generic
for a tyre of given size. Different tyres in the same size category, such as summer and
winter tyres, regular and off-road tyres are not accounted for. Note that the
experimental data in figure 4.2 from LeanNova is old data and does not represent
current generation passenger cars. Hence the actual plot can actually be slightly lower
for vehicles today.
4.2 Influence of tyre outer diameter
Figure 4.3 RRC vs outer diameter from combined model
Figure 4.4 Base 100, RRC of a 175/70 R14 tyre measured as per the ISO 8767 standard [6]
Figure 4.3 shows plots between rolling resistance coefficient and tyre outer diameter,
from the combined model. The x-axis represents outer radius from 55 to 70 cm. Y-
axis represents coefficient of rolling resistance with a base 100, which means that the
value of rolling resistance coefficient at 60 cm outer diameter is assigned a value 100
and the corresponding values for other outer diameters are linearly scaled. The plot
`CHALMERS, Applied Mechanics, Master’s Thesis 2014:24 33
was generated for the tyre size 175/70 R14 with 2.1 bar tyre inflation pressure, 80% of
vertical load maximum loading capacity and at 80 km/h. A plot with the actual values
of rolling resistance coefficient with outer diameter is provided in Appendix I.
Figure 4.3 depicts an almost linearly decreasing trend in the range of diameter. As the
radius increases, the transition at leading and trailing edges of contact patch reduces.
It can thus be said that the radial deformation of elements in contact patch and the rate
of radial deformation decrease. Hence the trend is quite expected. Increasing the
diameter by 8.33%, from 60 cm to 65 cm, reduces the rolling resistance coefficient by
approximately 4.84%.
Figure 4.4 shows a plot between rolling resistance coefficient and tyre outer diameter
of the same tyre and testing conditions, from experimental data by Michelin [6].
Increasing the diameter by 8.33%, from 60 cm to 65 cm decreases the rolling
resistance coefficient by approximately 5%. The combined model is seen to be in
close agreement with experimental values and thus provides a very reasonable
understanding of influence of outer diameter on rolling resistance coefficient. The
effect of the influence of outer diameter is further tabled in a sensitivity analysis in
section 4.6.
4.3 Influence of contact patch width
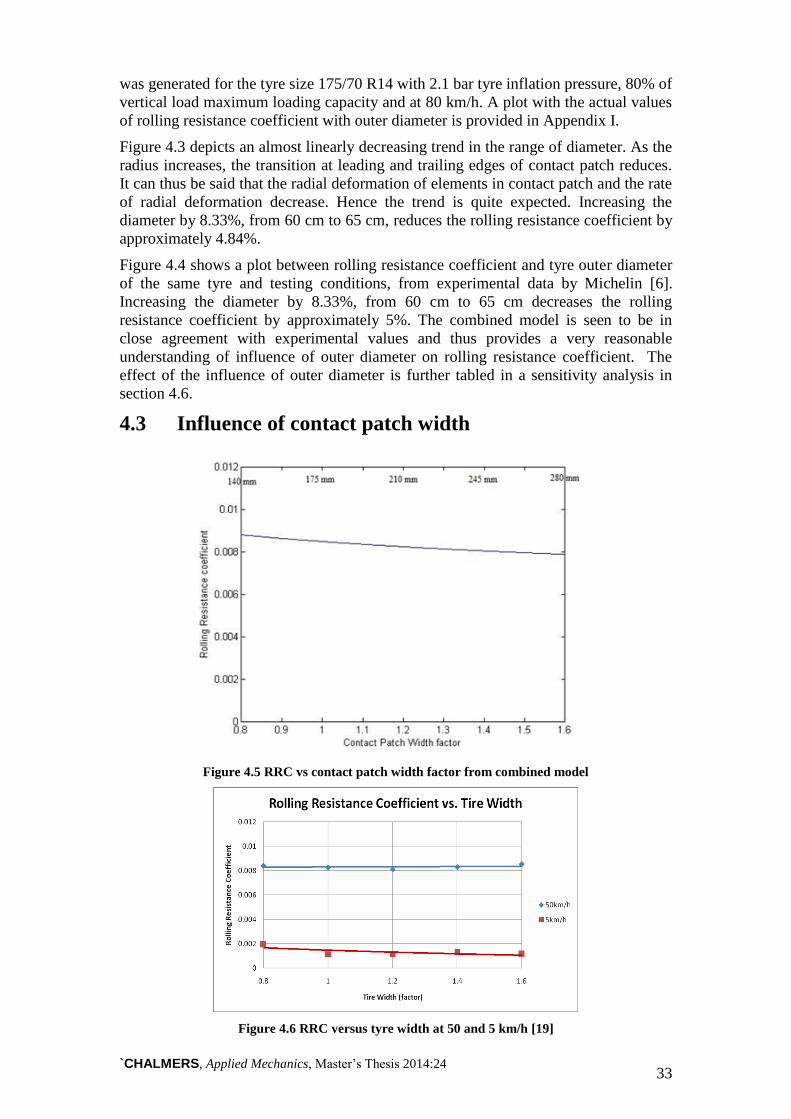
Figure 4.5 RRC vs contact patch width factor from combined model
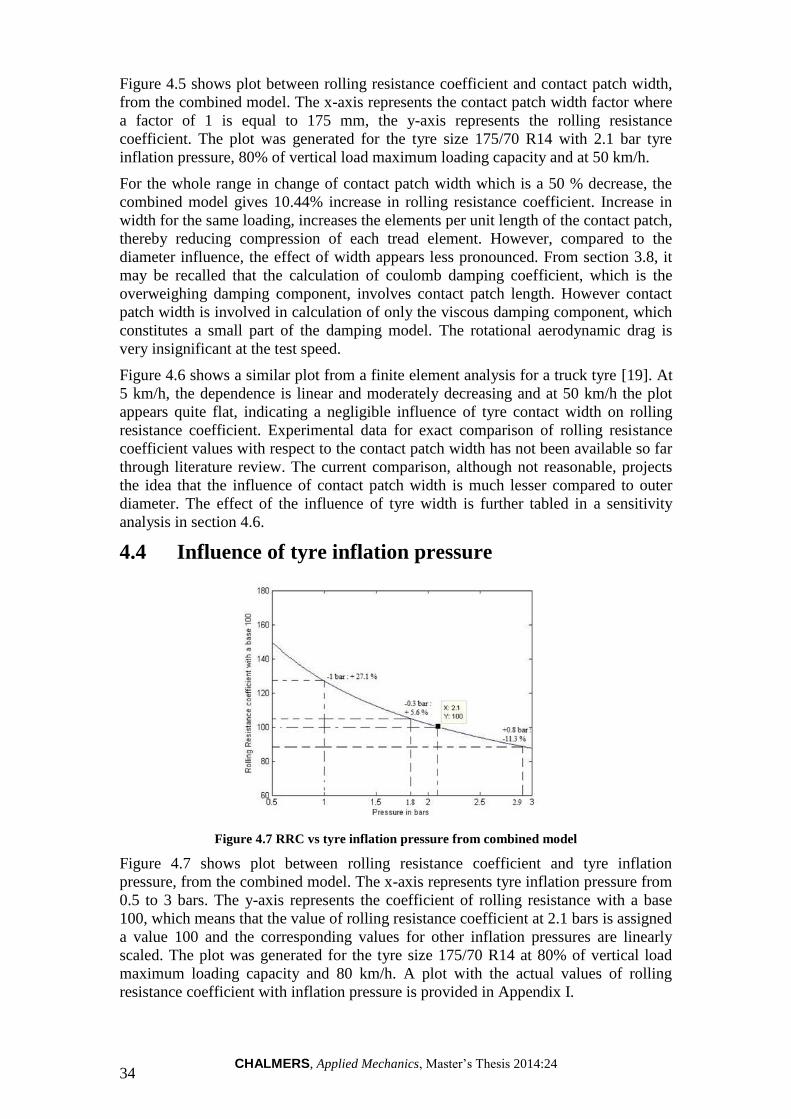
Figure 4.6 RRC versus tyre width at 50 and 5 km/h [19]
CHALMERS, Applied Mechanics, Master’s Thesis 2014:24 34
Figure 4.5 shows plot between rolling resistance coefficient and contact patch width,
from the combined model. The x-axis represents the contact patch width factor where
a factor of 1 is equal to 175 mm, the y-axis represents the rolling resistance
coefficient. The plot was generated for the tyre size 175/70 R14 with 2.1 bar tyre
inflation pressure, 80% of vertical load maximum loading capacity and at 50 km/h.
For the whole range in change of contact patch width which is a 50 % decrease, the
combined model gives 10.44% increase in rolling resistance coefficient. Increase in
width for the same loading, increases the elements per unit length of the contact patch,
thereby reducing compression of each tread element. However, compared to the
diameter influence, the effect of width appears less pronounced. From section 3.8, it
may be recalled that the calculation of coulomb damping coefficient, which is the
overweighing damping component, involves contact patch length. However contact
patch width is involved in calculation of only the viscous damping component, which
constitutes a small part of the damping model. The rotational aerodynamic drag is
very insignificant at the test speed.
Figure 4.6 shows a similar plot from a finite element analysis for a truck tyre [19]. At
5 km/h, the dependence is linear and moderately decreasing and at 50 km/h the plot
appears quite flat, indicating a negligible influence of tyre contact width on rolling
resistance coefficient. Experimental data for exact comparison of rolling resistance
coefficient values with respect to the contact patch width has not been available so far
through literature review. The current comparison, although not reasonable, projects
the idea that the influence of contact patch width is much lesser compared to outer
diameter. The effect of the influence of tyre width is further tabled in a sensitivity
analysis in section 4.6.
4.4 Influence of tyre inflation pressure
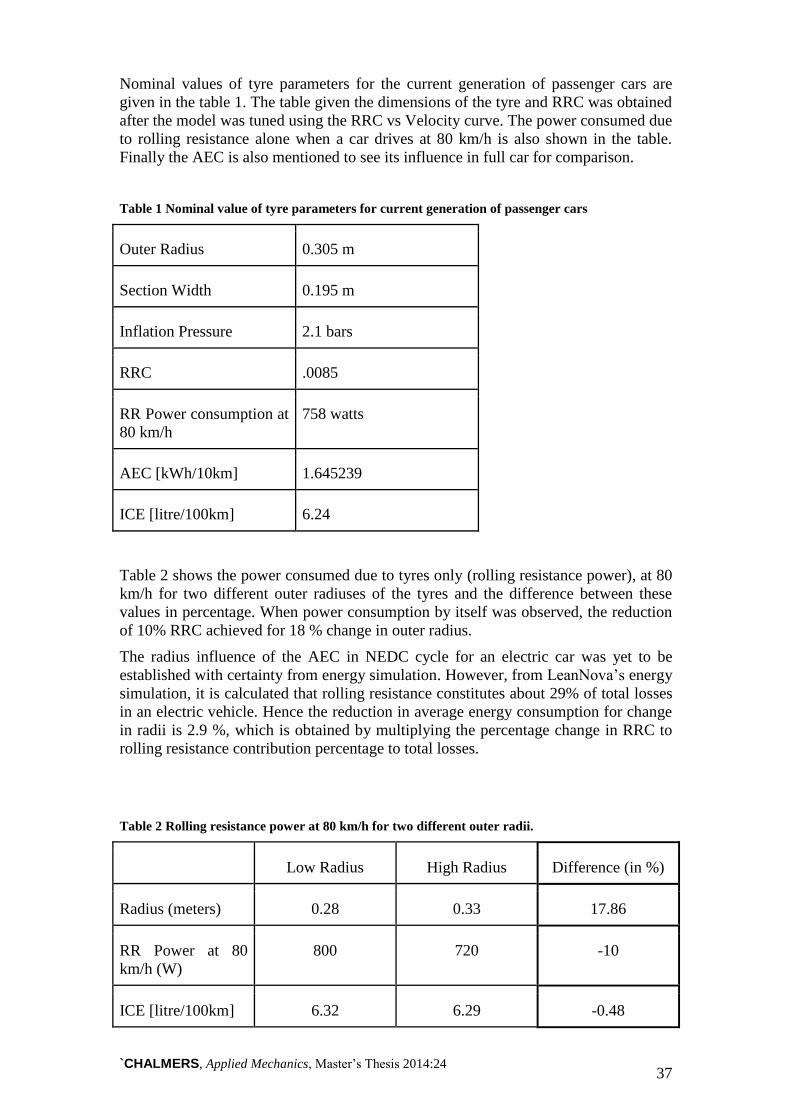
Figure 4.7 RRC vs tyre inflation pressure from combined model
Figure 4.7 shows plot between rolling resistance coefficient and tyre inflation
pressure, from the combined model. The x-axis represents tyre inflation pressure from
0.5 to 3 bars. The y-axis represents the coefficient of rolling resistance with a base
100, which means that the value of rolling resistance coefficient at 2.1 bars is assigned
a value 100 and the corresponding values for other inflation pressures are linearly
scaled. The plot was generated for the tyre size 175/70 R14 at 80% of vertical load
maximum loading capacity and 80 km/h. A plot with the actual values of rolling
resistance coefficient with inflation pressure is provided in Appendix I.

`CHALMERS, Applied Mechanics, Master’s Thesis 2014:24 35
Figure 4.8: Base 100, rolling resistance measured at 2.1 bars as per the ISO 8767 standard [6]
Figure 4.7 depicts an almost curvilinear decreasing trend, more so at lower inflation
pressure. Decreasing the pressure by 14.3%, from 2.1 bars to 1.8 bars, increases the
rolling resistance coefficient by approximately 5.6%. Increasing the pressure by 38 %,
from 2.1 bars to 2.9 bars, decreased the rolling resistance coefficient by 11.3 %. As
inflation pressure decreases, the radial deformation of tyre treads from combined
model increases and so does the rate of radial deformation. Hence the hysteresis
damping increases, causing an increase in rolling resistance coefficient. With an
increase in pressure, the radial deformation is low which can be translated to lesser
tyre sidewall and tread bending and shearing as observed in section 2.2.2.
Figure 4.8 shows a plot between rolling resistance coefficient and tyre inflation
pressure for the same tyre and testing conditions, from experimental data by Michelin.
Decreasing the pressure by 14.3%, from 2.1 bars to 1.8 bars decreases the rolling
resistance coefficient by approximately 6%. Note that at a very low inflation pressure,
for example, below 1 bar, the difference in experimental and predicted value of rolling
resistance coefficient begins to appear. This may be attributed to simple modelling of
tyre rolling resistance phenomena by lumped damping model, which does not take
complete material behaviour into account. The combined model is observed to be in
close agreement with experimental values from Michelin in an operating pressure
range of passenger car tyres. Therefore, it provides a very reasonable understanding of
the influence of tyre inflation pressure on rolling resistance coefficient. The effect of
the influence of inflation pressure is further tabled in a sensitivity analysis in section
4.6.
4.5 Influence of normal load
Figure 4.9 RRC vs percentage of tyre maximum load capacity, from combined model

CHALMERS, Applied Mechanics, Master’s Thesis 2014:24 36
Figure 4.10 Base 100, rolling resistance at tyre’s maximum load capacity as per the ISO 8767
standard [6]
Figure 4.9 shows plot between rolling resistance coefficient and normal load, from the
combined model. The x-axis represents the tyre loading as a percentage of maximum
loading capacity at 2.1 bars. The y-axis represents the coefficient of rolling resistance
with a base 100, which means that the value of the rolling resistance coefficient of
80% of maximum tyre loading capacity is assigned a value 100 and the corresponding
values for other inflation pressures are linearly scaled. The plot was generated for the
tyre size 175/70 R14 at 2.1 bar and 80 km/h. A plot with the actual values of rolling
resistance coefficient with normal load is provided in Appendix I.
The combined model suggests that tyre rolling resistance coefficient decreases with
increase in normal load. Increasing the normal load by 12.5%, from 80% to 90% of
maximum loading capacity, increases the rolling resistance coefficient by 6.5%.
Unlike the influence of inflation pressure and tyre outer diameter, the trend obtained
here is not intuitive. From the damping model, it can be inferred that the ratio of rate
of vertical deformation to normal loading from the viscous damping part purely
decides the behaviour. As the normal load increases, the vertical displacement
increases and this ratio decrease. The rolling resistance coefficient by its definition in
section 3.7 can be thought of as the sum of a constant coulomb damping and the ratio
aforementioned. The overall value decreases as normal loading increases.
Figure 4.10 shows a plot between rolling resistance coefficient and tyre normal
loading for the same tyre and testing conditions, from experimental data by Michelin.
Increasing the normal load by 12.5%, from 80% to 90% of maximum loading
capacity, increases the rolling resistance coefficient by approximately 3%. The
combined model clearly overestimates the trend when compared to the experimental
values. Increasing the normal load can increase temperature, which affects the
damping coefficients [6]. Furthermore, the coulomb model which accounts for a
major part of hysteresis damping does not take the contribution of width and material
behaviour into account.
4.6 Energy simulation results
Energy simulations are done with respect to current nominal values of the tyre
parameters and then to find out how much does each parameter vary from this value.
First, power consumption due to rolling resistance at 80 km/h is found at each
parameter change. Using LeanNova’s energy simulation tool, identical tests are
conducted while only changing the tyres for an electric vehicle. Then the Average
Energy Consumption (AEC) is found in an NEDC cycle, and the sensitivity of each
parameter is analysed in a full energy model of an EV.
`CHALMERS, Applied Mechanics, Master’s Thesis 2014:24 37
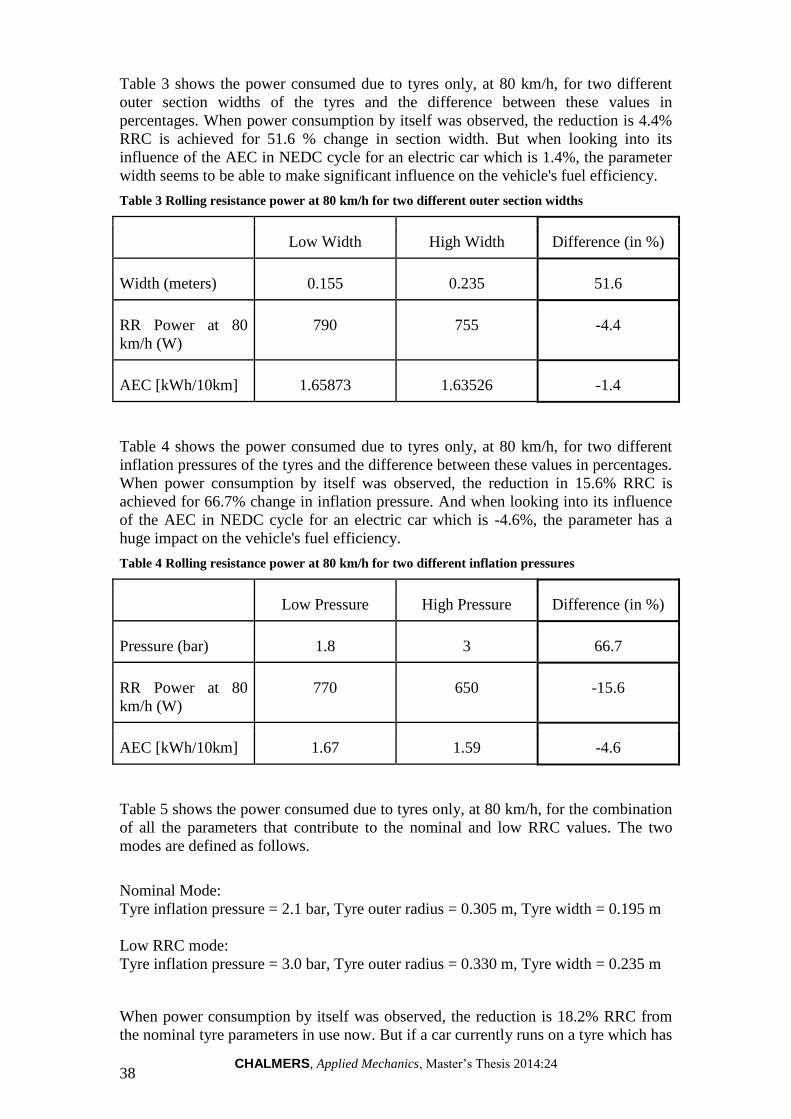
Nominal values of tyre parameters for the current generation of passenger cars are
given in the table 1. The table given the dimensions of the tyre and RRC was obtained
after the model was tuned using the RRC vs Velocity curve. The power consumed due
to rolling resistance alone when a car drives at 80 km/h is also shown in the table.
Finally the AEC is also mentioned to see its influence in full car for comparison.
Table 1 Nominal value of tyre parameters for current generation of passenger cars
Outer Radius 0.305 m
Section Width 0.195 m
Inflation Pressure 2.1 bars
RRC .0085
RR Power consumption at
80 km/h
758 watts
AEC [kWh/10km] 1.645239
ICE [litre/100km] 6.24
Table 2 shows the power consumed due to tyres only (rolling resistance power), at 80
km/h for two different outer radiuses of the tyres and the difference between these
values in percentage. When power consumption by itself was observed, the reduction
of 10% RRC achieved for 18 % change in outer radius.
The radius influence of the AEC in NEDC cycle for an electric car was yet to be
established with certainty from energy simulation. However, from LeanNova’s energy
simulation, it is calculated that rolling resistance constitutes about 29% of total losses
in an electric vehicle. Hence the reduction in average energy consumption for change
in radii is 2.9 %, which is obtained by multiplying the percentage change in RRC to
rolling resistance contribution percentage to total losses.
Table 2 Rolling resistance power at 80 km/h for two different outer radii.
Low Radius High Radius Difference (in %)
Radius (meters) 0.28 0.33 17.86
RR Power at 80
km/h (W)
800 720 -10
ICE [litre/100km] 6.32 6.29 -0.48
CHALMERS, Applied Mechanics, Master’s Thesis 2014:24 38
Table 3 shows the power consumed due to tyres only, at 80 km/h, for two different
outer section widths of the tyres and the difference between these values in
percentages. When power consumption by itself was observed, the reduction is 4.4%
RRC is achieved for 51.6 % change in section width. But when looking into its
influence of the AEC in NEDC cycle for an electric car which is 1.4%, the parameter
width seems to be able to make significant influence on the vehicle's fuel efficiency.
Table 3 Rolling resistance power at 80 km/h for two different outer section widths
Low Width High Width Difference (in %)
Width (meters) 0.155 0.235 51.6
RR Power at 80
km/h (W)
790 755 -4.4
AEC [kWh/10km] 1.65873 1.63526 -1.4
Table 4 shows the power consumed due to tyres only, at 80 km/h, for two different
inflation pressures of the tyres and the difference between these values in percentages.
When power consumption by itself was observed, the reduction in 15.6% RRC is
achieved for 66.7% change in inflation pressure. And when looking into its influence
of the AEC in NEDC cycle for an electric car which is -4.6%, the parameter has a
huge impact on the vehicle's fuel efficiency.
Table 4 Rolling resistance power at 80 km/h for two different inflation pressures
Low Pressure High Pressure Difference (in %)
Pressure (bar) 1.8 3 66.7
RR Power at 80
km/h (W)
770 650 -15.6
AEC [kWh/10km] 1.67 1.59 -4.6
Table 5 shows the power consumed due to tyres only, at 80 km/h, for the combination
of all the parameters that contribute to the nominal and low RRC values. The two
modes are defined as follows.
Nominal Mode:
Tyre inflation pressure = 2.1 bar, Tyre outer radius = 0.305 m, Tyre width = 0.195 m
Low RRC mode:
Tyre inflation pressure = 3.0 bar, Tyre outer radius = 0.330 m, Tyre width = 0.235 m
When power consumption by itself was observed, the reduction is 18.2% RRC from
the nominal tyre parameters in use now. But if a car currently runs on a tyre which has

`CHALMERS, Applied Mechanics, Master’s Thesis 2014:24 39
the combination of parameters that contribute high RRC the power consumption can
be reduced by a very significant 27%. The reduction in AEC in NEDC run for an
electric car is 3.8% for nominal to low RRC mode. The reduction in average fuel
consumption in the NEDC run for a conventional vehicle is 1.3% for nominal to low
RRC mode. Thus, it may be observed that reduction in rolling resistance alone can
make a significant contribution to fuel saving, more so in an electric vehicle. This
may allude to the fact that electric vehicles do not lose so much energy in friction
brakes because of regeneration. For an average reduction in rolling resistance by 30%,
while keeping the vehicle design constant, the fuel consumption is reduced by about
3% to 6% and may vary depending on the type of driving cycle and vehicle [6]. This
means that for a reduction of 18.2 % in rolling resistance the reduction in fuel
consumption can be 1.8% to 3.6% according to Michelin [6]. The model, however,
predicts the fuel consumption reduction to be 1.3%, which is on the lower side of this
experimental data spectrum. This may indicate that there are other parameters that can
affect tyre rolling resistance phenomena. Note that the model considers free rolling
and does not include torque or the contribution of longitudinal slip to rolling
resistance and the influence of transient temperature changes in different parts of the
tyre. Also the experimental data taken to tune the combined model damping
coefficients are old values and not entirely representative of data for present
generation passenger cars.
To have an understanding of the influence of the tyre parameters on rolling resistance
in electric vehicle platform, a comparison is made between the two tyres with similar
load capacities which may be used on a generic electric vehicle.
tyre1: 155/70 R19 at 2.5 bars
tyre2: 175/65 R15 at 2.3 bars
The rolling resistance power calculated for tyre1 and tyre2 from combined model are
670 W and 744 W respectively. The reduction in rolling resistance is approximately
10 % from tyre2 to tyre1. From LeanNova’s energy simulation, it is calculated that
rolling resistance constitutes about 29% of total losses in an electric vehicle. Hence
the reduction in average energy consumption from tyre2 to tyre1 is 2.9%, which is
obtained by multiplying the percentage change in rolling resistance to rolling
resistance contribution to total loss.
From LeanNova's energy simulation package, it is calculated that rolling resistance
constitutes about 29% of total losses in an electric vehicle. The change in tyre
inflation pressure from 2 bars to 3 bars was calculated to be 3.7%. A study conducted
on the influence of tyre inflation pressure on fuel consumption [20] suggests that
rolling resistance constitutes 27% of total losses in a conventional vehicle in NEDC
run. Furthermore, the study observes that a change in tyre inflation pressure from 2
bars to 3 bars leads to a reduction in average fuel consumption by 5.2%. It can only be
fair to compare two simulations that have a similar percentage contribution of rolling
resistance to total vehicle losses. Hence the electric vehicle operation from
LeanNova's energy simulation and the conventional vehicle simulation from the study
can allow for a comparison of average consumption (fuel and energy). The study [20],
suggests a slightly higher sensitivity of inflation pressure compared to the energy
simulation from this thesis.

CHALMERS, Applied Mechanics, Master’s Thesis 2014:24 40
Table 5 Rolling resistance power at 80 km/h for the combination of all the parameters that
contribute to the nominal and low RRC values.
Nominal
mode
Low RRC
mode
Difference from nominal to low
RRC mode (in %)
RRC*1000 8.5 6.9 -18.2
RR Power at 80
km/h [W] 758 620 -18.2
AEC [kWh/10km] 1.64 1.58 -3.78
ICE [Litre/100km] 6.24 6.16 -1.30
In summary, tyre inflation pressure is observed to be the most influencing parameter
in terms of absolute contribution to rolling resistance in the considered range of
parameter variation from table 2, 3 & 4. However, tyre outer radius is the most
sensitive parameter with respect to rolling resistance from table 6, followed by
inflation pressure and finally tyre section width. Even though outer radius seems to be
the most sensitive parameter with respect RRC, its influence on the AEC values needs
to be established from energy simulation (after considering final drive ratio change).
Table 6 Parameter sensitivity to rolling resistance
Parameter % RR power change/ % Parameter change
Diameter/Radius -0.56
Width -0.086
Pressure -0.23
Normal load 0.073
`CHALMERS, Applied Mechanics, Master’s Thesis 2014:24 41
5 Conclusion and Future Work
In this section, a short summary of the important findings of the thesis work is
presented. Some suggestions for future work are also included.
5.1 Conclusion
This work presents the influence of parameters like tyre size, inflation pressure,
longitudinal velocity and normal load on tyre rolling resistance coefficient. It also
presents each of their contributions to average fuel or energy consumption through
energy simulation tool by LeanNova. The rolling resistance models were implemented
in Matlab/Simulink. The important findings from the combined model and the energy
simulations are briefly discussed in the sections below.
5.1.1 Combined Model
A tyre model is developed that encompasses the physical understanding of influence
of parameters like tyre size, inflation pressure etc. on tyre rolling resistance
coefficient. The exercise is a rather simple assumption of rolling resistance
phenomena as stated in section 3.1 and does not account for the complete material
behaviour.
The combined model is a result of many layers of mathematical modelling. It starts
with the basic assumption of a linear spring and damper model. The lumped damping
model includes coulomb damping to explain the velocity dependence at low values.
Further, there is inclusion of tyre geometry and material behaviour in the constant belt
model. Rotational aerodynamic drag is a further addition to explaining the behaviour
of the RRC at high velocity. The results obtained from the combined model are
compared to experimental data in [6], to estimate the ability of the model in
explaining tyre rolling resistance phenomena. After tuning the damping coefficients
for velocity dependence with experimental data from LeanNova (Figure 7.4,
Appendix I), the influence of tyre parameters are assessed. In comparing the results, a
tyre of size 175/70 R14 was assumed for the default test condition of 2.1 bars, 80% of
maximum load capacity, velocity of 80 km/h.
● It is observed that for a decrease of inflation pressure by 14.3%, from 2.1 bars
to 1.8 bars, the RRC value increased by 5.6%. The experimental data suggest
an increase in RRC value by 6%, for the same changes and the test condition.
The result from combined model is in good agreement with the trend observed
from experimental data.
● It is observed that for an increase in tyre diameter by 8.3%, the RRC value
decreased by 4.84%. The experimental data suggest a decrease in RRC value
by 5%, for the same changes and the test condition. The result from combined
model is in good agreement with the trend observed from experimental data.
● It is observed that for a decrease in contact patch width (roughly assumed as
tyre width) by 50% at 50 km/h, from 280mm to 140mm, the RRC value
increased only by 10.4%. The experimental data in [19] for truck tyre suggests
a flat plot for a similar tyre width change and velocity, indicating a rather
moderate influence. An exact comparison of tyre width influence could not be
made, since the experimental plot of passenger car tyres for the parameter
could not be found. However, it gives an idea that the influence is rather
moderate, which is referred to in section 2.2.1.

CHALMERS, Applied Mechanics, Master’s Thesis 2014:24 42
● It is observed that for an increase in normal load, from 80 to 90 % of the
maximum tyre loading at aforementioned test condition, the RRC value
decreased by 6.5%. The experimental data suggest a decrease in RRC value by
3%, for the same changes and the test condition. Clearly the combined model
overestimates the normal load influence on RRC. The contribution of
temperature to viscoelasticity [6], the width dependence of coulomb damping
and influence of complete material behaviour is not explained by the
combined model.
A sensitivity analysis of the parameters’ influence from table 6 in section 4.6 suggests
that change in tyre inflation pressure has the maximum influence on rolling resistance
while outer diameter is the most sensitive parameter. The influence of contact patch
width is very moderate.
5.1.2 Energy simulations
The energy simulation tool from LeanNova was used as a platform for directly
comprehending the influence of various parameters in terms of average fuel or energy
consumption, from a high to low rolling resistance setting. The overall influence of all
the parameters from a nominal to low rolling resistance setting was also obtained for
conventional vehicles and pure electric vehicle in NEDC mode.
● It was observed that changing the tyre parameter from nominal to low rolling
resistance setting translates to a reduction of 1.3% in average fuel
consumption.
● It was observed that changing the tyre parameter from nominal to low rolling
resistance setting in pure electric vehicle mode translated to a reduction of
3.8% in average energy consumption.
● For a change in inflation pressure from high to low rolling resistance (1.8 to 3
bars), which is a 66.7 % increase, the average energy consumption for electric
vehicle decreased by 4.6%.
● For a change in tyre outer radius from high to low rolling resistance (0.28 to
0.33m), which is a 17.9 % increase, the average energy consumption for
electric vehicle decreased by 0.011%. The consumption decrease appears to be
an inconsistent indication of the influence of tyre radius when compared to the
combined model. The corresponding value of conventional vehicle mode in
the energy simulation yields 0.5% decrease in average fuel consumption.
● For a change in inflation pressure from high to low rolling resistance (0.155 to
0.235m), which is a 51.6 % increase, the average energy consumption for
electric vehicle decreased by 1.4%.
`CHALMERS, Applied Mechanics, Master’s Thesis 2014:24 43
5.2 Future Work
This thesis work is a study initiated to understand the physical influence of
operational parameters on tyre rolling resistance. However, the model has potential to
develop in its present form. The possibility of testing a tyre that is being considered in
vertical stiffness calculations can yield exact constants that shall take into account tyre
geometry and material property for the specific tyre. The damping model in the study
has been lumped in terms of sidewall shear and radial transition at contact patch edges
and instead may be delved deeper by looking at models allowing for tread and
sidewall motion in different directions. Effect of temperature can be significant on
viscoelasticity and inflation pressure, which may be included in the combined model.
The effect of rotational aerodynamic drag can be improved by considering data for
drag coefficient and tyre tread geometry. Secondary effect like tyre longitudinal slip
which was stated as a stretched target in the thesis work, can account for dynamic
cases of tyre deformation behaviour. It can impact energy consumption by changing
the offset ‘e’ in rolling resistance phenomena and by speed losses which would
require more energy from vehicle prime mover and hence can be thought of
investigating.

CHALMERS, Applied Mechanics, Master’s Thesis 2014:24 44
6 References
[1] Epa.gov, (2014). Sources | Climate Change | US EPA. [online] Available at:
http://www.epa.gov/climatechange/ghgemissions/sources.html [Accessed 6 Jun.
2014].
[2] Global.yokohamatire.net, (2014). Rolling Resistance and Fuel Consumption |
TIRE CARE & SAFETY | THE YOKOHAMA RUBBER CO.,LTD.. [online]
Available at:
http://global.yokohamatire.net/technology/tirecareandsafety/rolling_resistance.ht
ml [Accessed 6 Jun. 2014].
[3] Anon, (2014). 1st ed. [ebook] Available at: https://www.conti-
online.com/generator/www/au/en/continental/tyres/general/downloads/download
/reifengrundlagen_en.pdf [Accessed 6 Jun. 2014].
[4] The-contact-patch.com, (2014). Book : The Contact Patch. [online] Available at:
http://the-contact-patch.com/book/road/c1610-rubber-tyres [Accessed 6 Jun.
2014].
[5] Ordertyres.com, (2014). Glanworth Tyres. [online] Available at:
http://www.ordertyres.com/default.asp?action=tyres [Accessed 6 Jun. 2014].
[6] Anon, (2014). 1st ed. [ebook] Available at:
http://automotive.ing.unibs.it/~gadola/Michelin/Resistance_UK.pdf [Accessed 6
Jun. 2014].
[7] Sandberg, U., Haider, M., Conter, M., Goubert, L., Bergiers, A., Glaeser, K.,
Schwalbe, G., Zöller, M., Boujard, O., Hammarström, U., Karlsson, R., Ejsmont,
J., Wang, T. and Harvey, J. (2011). Rolling Resistance – Basic Information and
State-of-the-Art on Measurement methods. SP 1 Measurement methods and
source models.
[8] Segel, L. and Xiao-Pei, L. (1982). Vehicular resistance to motion as influenced by
road roughness and highway alignment. Australian Road Research, 12(4).
[9] Grover, P. (1998). Modeling of Rolling Resistance Test Data. [online] Available
at: http://dx.doi.org/10.4271/980251 [Accessed 6 Jun. 2014].
[10] Wong, J. (1978). Theory of ground vehicles. 1st ed. New York: Wiley.
[11] Thompson, G. and Torres, M. (1977). Variations in tire rolling resistance.
[12] A handbook for the rolling resistance of pneumatic tires Clark, Samuel Kelly;

`CHALMERS, Applied Mechanics, Master’s Thesis 2014:24 45
Dodge, Richard N. 1979
[13] Clark, S. (1977). Geometric effects on the rolling resistance of pneumatic tyres.
In: Tire rolling losses and fuel economy.
[14] Hunt, J., Walter, J. and Hall, G. (1997). The effect of tread polymer variations on
radial tire rolling resistance. In: Tite rolling losses and fuel economy.
[15] Grappe, F., Candau, R., Barbier, B., Hoffman, M., Belli, A. and Rouillon, J.
(1999). Influence of tyre pressure and vertical load on coefficient of rolling
resistance and simulated cycling performance. Ergonomics, 42(10), pp.1361--
1371.
[16] Nielsen, L. and Sandberg, T. (2002). A New Model for Rolling Resistance of
Pneumatic Tires. [online] Available at: http://dx.doi.org/10.4271/2002-01-1200
[Accessed 6 Jun. 2014].
[17] Rhyne, T. B. “Development of a Vertical Stiffness Relationship for Belted Radial
Tires,” Tire Science and Technology, TSTCA, Vol. 33, no. 3, July-September
2005, pp. 136-155.
[18] Wikipedia, (2014). Drag (physics). [online] Available at:
http://en.wikipedia.org/wiki/Drag_(physics) [Accessed 6 Jun. 2014].
[19] Ali, R., Dhillon, R., El--Gindy, M., "Oijer, F., Johanson, I. and Trivedi, M.
(2013). Prediction of rolling resistance and steering characteristics using finite
element analysis truck tyre model. International Journal of Vehicle Systems
Modelling and Testing, 8(2), pp.179--201.
[20] Varghese, A. (2013). Influence of Tyre Inflation Pressure on Fuel Consumption,
Vehicle Handling and Ride Quality. Chalmers University of Technology.

CHALMERS, Applied Mechanics, Master’s Thesis 2014:24 46
Appendix I
Matlab code for the combined model:
function [e,RRC,RR] = TyreModel(R,Vx,N,W,P)
% Input parameter units
% % N = 5000; %% Normal Load (Newtons)
% % W = 0.165; %% Section Width (Metres)
% % P = 250000; %% Inflation Pressure (Pascal)
% % Ro = 0.5612/2; %% Tyre Outer Diameter (Metres)
% % Vx = 80*5/18; %% Longitudinal speed (Metres/Second)
% Constants
n= 500; %% number of divisions of contact patch
Cv = 0.5/n; % Viscous Damping coefficient
Cc = 180/n; % Coulumb Damping/Friction damping coefficient
Cd = 1/280; % some kind of Rotational drag constant (skin friction + form drag)
%% Calculation of contact patch lenght L
Kz =(0.0274*(P/100000)*sqrt(2e+6*(W*0.7)*R) +3.38)*10000;
delta_z = N./Kz;
a=R-delta_z;
theta_max = acos(a/R); %% maximum angle corresponding to contact patch
w = Vx/R; %% Angular Velocity
theta = -theta_max;
fx=0;
f=0;
%% vertical calculations
i = (2*theta_max)/n; %% Longitudinal Resolution in contact patch
for Ita = 1:n+1
z = -R*(cos(theta) - cos(theta_max)); %% Vertical deformation of 'i'th element
dz = -w*R*sin(theta); %% Rate of vertical deformation of 'i'th element
Fz = -(Cv*dz+ Cc*sign(dz) ); % Normal Force at 'i'th element due to damping
x=a*tan(theta);

`CHALMERS, Applied Mechanics, Master’s Thesis 2014:24 47
%% For calculation of e, where e =(integration of Fz*x*dx)/(integration of Fz*dx)
fx = fx + Fz*x; %% (integration of Fz*x*dx))
f= f + Fz; %% (integration of Fz*dx without the normal load component due to
pressure)
theta = theta + i;
end
%% Final calculations for output of the model
fx = fx + (Vx^2)*(W*2*pi*R)*Cd; %% 2nd degree velocity dependence due to
rotational aerodynamic drag
f=f + N; %% f = Normal Load (f=0 + N)
e = (fx/f);
RRC= e/R; %% Rolling resistance coefficient calculation
RR= RRC*N;
end

CHALMERS, Applied Mechanics, Master’s Thesis 2014:24 48
Figure 7.1 RRC vs Tyre outer diameter for 175/70 R14, P = 2.1 bar, 80 % Max Load, V = 80
km/h (combined model)
Figure 7.2 RRC vs Tyre inflation pressure for 175/70 R14, V = 80 km/h, 80 % Max Load
(combined model)

`CHALMERS, Applied Mechanics, Master’s Thesis 2014:24 49
Figure 7.3 RRC vs normal load for 175/70 R14, P = 2.1 bar, V = 80 km/h (combined model)
Figure 7.4 RRC vs normal load for 175/70 R14, P = 2.1 bar, V = 80 km/h from LeanNova