Embed Size (px)
Citation preview

MTN Group LimitedIntegrated Business Report – for the year ended 31 December 2011
.beyondWelcome to possibility

About this reportThis year, MTN Group Limited (MTN, the Group or the Company) has moved further in its journey towards providing a more integrated report to its stakeholders. This incorporates the recommendations of the revised King Code of Governance Principles for South Africa (King III) and the latest work of the International Integrated Reporting Committee. A structured approach was implemented to define material report content and provide a more holistic picture incorporating the Group’s financial, economic, social and environmental performance. This approach was achieved through workshops and input from key representatives of various disciplines, including risk management, stakeholder management, financial reporting, investor relations, company secretariat, sustainability and human resources. Consideration was given to feedback from key stakeholders in compiling this report. The key improvement made to the 2011 report is the inclusion of the Group opportunities as part of its risk assessment. This forms the thread through the report, providing insight into the most material aspects of the business across MTN’s markets. MTN has also better incorporated its social, economic and environmental contributions to the countries and societies in which it operates.
The board has recently enhanced its committee structure, details of which appear in governance highlights.
For more detailed information on the Group’s sustainability initiatives, stakeholders are directed to the separate sustainable development report, available at www.mtn.com/sustainability. A separate governance report is also available at www.mtn.com/investors. We welcome feedback on this report, which is dated March 2012, at [email protected].
Reporting principlesMTN is a company incorporated in South Africa under the provisions of the Companies Act, 71 of 2008, as amended (Companies Act), and has adopted many principles of King III, the Companies Act, the JSE Listings Requirements and other legislative requirements. The Group subscribes to high ethical standards and principles of corporate governance and is in the process of ensuring full compliance with King III as far as is practical and feasible and with the provisions of the new Companies Act. For more details, please see the corporate governance section on pages 50 to 57.
The Group follows International Financial Reporting Standards (IFRS) to compile its annual financial statements (AFS). MTN discloses the basis for reporting on joint ventures, subsidiaries, associates and leases in its AFS. For reporting on sustainability issues, it also follows the Global Reporting Initiative’s (GRI) guidelines. MTN assesses itself as level B GRI compliant.
AssuranceThe audit committee oversees the drafting of the integrated report. On the basis of the recommendations from the joint auditors (PricewaterhouseCoopers Inc and SizweNtsalubaGobodo (Inc), the audit committee provides assurance on the annual financial statements which have been prepared under the supervision of the Group CFO, Nazir Patel. While good progress has been made to comply with sustainability assurance in the current year, MTN Group is working towards achieving full compliance on sustainability assurance in 2013.
Board responsibilityThe board of directors acknowledges its responsibility to ensure the integrity of the integrated report. The board has accordingly applied its mind to the integrated report and in its opinion, the report fairly presents the integrated performance of the Group.
Cyril Ramaphosa Sifiso DabengwaChairman Group president and CEO
Navigation aid
Website link
Case study

MTN Group Limited Integrated Business Report for the year ended 31 December 20111
Grou
p ov
ervi
ewPe
rform
ance
revi
ewOp
erat
iona
l and
fin
ancia
l rev
iew
Sust
aina
bilit
yFi
nanc
ial s
tate
men
tsSh
areh
olde
r inf
orm
atio
n
Contents
03 Group overview04 Profile
06 Structure and footprint
08 Strategy
09 Key statistics
10 Interacting with stakeholders
11 Risk and opportunities summary
14 Chairman’s statement
16 Board of directors
20 Executive committee
23 Performance review24 Group president and chief executive officer’s report
28 Group chief financial officer’s report
33 Operational and financial review34 Five-year financial review
38 Operational performance: South Africa
40 Operational performance: Nigeria
42 Operational performance: Iran
44 Operational performance: Ghana
46 Operational performance: Syria
49 Sustainability50 Governance highlights
58 People and remuneration report
74 Social and environmental report
81 Annual financial statements83 Statutory certificates and reports
88 Directors’ report
92 Annual financial statements
210 Glossary – terms and acronyms
213 Notice of the AGM and shareholders’ information
Scope and boundary of this reportMTN’s integrated business report is available annually, at least 15 business days ahead of its AGM, which is scheduled to be held on 29 May 2012. The 2011 report covers the period from 1 January 2011 to 31 December 2011. It provides a general narrative on the performance of the Group’s businesses across 21 markets in the Middle East and Africa, but focuses its more detailed commentary on the performance of its main businesses in South Africa, Nigeria, Iran, Ghana and Syria. This report also includes the Group’s consolidated annual financial statements. The 2010 report was posted to shareholders on 27 May 2011.
Group subscribers up 16,2%
164,5 million
EBITDA margin up by 3,4 percentage points†
44,9%
Adjusted HEPS up 43,2%
1 070,0 cents† Including profit from sale of Ghana towers
Final dividend per share
476 cents
Dividend payout ratio increased to
70%
Share buyback completed
R927,3 million

MTN Group Limited Integrated Business Report for the year ended 31 December 201122
MTN Group Limited Integrated Business Report for the year ended 31 December 2011
Background
As part of its transformation agenda, the Nigerian government committed to accelerating economic growth in rural areas, where citizens comprise 50% of the country’s population. Notionally less than 30% of energy is supplied via grid power. MTN Nigeria set itself a target to increase rural mobile communication coverage and reduce dependency on diesel by over 50% by 2020. MTN Nigeria recognised that it could deepen its service offering while helping the government realise its objectives.
Solution
MTN undertook to provide telecommunication access to 850 villages across Nigeria. Phase 1 is complete: 280 base transceiver sites provide telecommunication services to 350 villages. MTN is implementing network sites using an architecture methodology called “fully meshed satellite networks” which reduces the need to “hop” across connection points or networks at the last mile, thereby reducing communication costs and improving the quality of voice calls. Solar and hybrid solutions displaced the traditional use of diesel to provide power to both sites and villages.
Climate-friendly network and community power to close the digital divide

MTN Group Limited Integrated Business Report for the year ended 31 December 20113
Grou
p ov
ervi
ewPe
rform
ance
revi
ewOp
erat
iona
l and
fin
ancia
l rev
iew
Sust
aina
bilit
yFi
nanc
ial s
tate
men
tsSh
areh
olde
r inf
orm
atio
n
Group overviewProfile
Structure and footprintStrategy
Key statisticsInteracting with stakeholders
Risk and opportunities summaryChairman’s statement
Board of directorsExecutive committee

MTN Group Limited Integrated Business Report for the year ended 31 December 20114
Profile
Botswana, Namibia and Kenya. In
2011, MTN SEA made up 37% of
Group revenue and 29%
of Group EBITDA.*
MTN WECA, comprising MTN
Nigeria, MTN Ghana, MTN
Cameroon, MTN Côte d’Ivoire,
MTN Congo-Brazzaville,
MTN Benin, MTN Guinea-Bissau,
MTN Guinea Conakry (trading
under the Areeba brand) and
MTN Liberia (trading under
Lonestar Cell brand). The Group
has GSM licences in all these
countries. It also has ISP
businesses in Nigeria, Cameroon,
Côte d’Ivoire and Ghana. In 2011,
MTN WECA contributed 43% to
Group revenue and 54% to Group
EBITDA.*
MTN MENA, consisting of MTN
Irancell, MTN Syria, MTN Sudan,
MTN Afghanistan, MTN Yemen
and MTN Cyprus. The Group
has GSM licences in all these
countries. MTN also has ISP
businesses in Syria and Cyprus.
In 2011, MTN MENA made up
20% of Group revenue and 15%
of Group EBITDA.*
* Note: difference in EBITDA percentage calculation is due to head office costs.
mibia a
omprising M
TN Ghana, MTN
on, MTN Côte d’Ivoire,
Congo-Brazzaville,
N Benin, MTN Guinea-Bissau,
MTN Gu
unde
MT
made u
ue and 29%
TDA.*
and Ke
37% of
and
ade up 37% of
A.*
sing MTN
Until recently, the Group organised
its operations into three regions:
South and East Africa (SEA), West
and Central Africa (WECA), and the
Middle East and North Africa
(MENA). It currently discloses
detailed information on its five
largest markets: South Africa,
Nigeria, Iran, Ghana and Syria.
From April 2012, a new organisational
structure will be in place, better
reflecting the contribution of the
various markets and helping to
optimise the business at a Group
level. This replaces the three regional
vice presidents reporting to the
Group President and CEO, with the
CEOs of South Africa and Nigeria and
a chief operations executive,
supported by an operations
executive. For the purposes of the
2011 financial year, the three regions
were the following:
MTN SEA, made up of MTN South
Africa, MTN Zambia, MTN Uganda,
MTN Rwanda, MTN Swaziland and
Mascom Botswana. The Group
has GSM licences in all these
countries. It also has ISP
businesses in South Africa,
Zambia, Uganda, Rwanda,
investments in metropolitan and
long-distance fibre optic cables.
MTN continues accessing more
broadband capacity on undersea
cables.
MTN’s vision is to be the leader in
telecommunications in emerging
markets.
It has 24 252 permanent employees representing around 55 nationalities and conducts its business in five different languages.
In 2011, MTN invested R265 million
in developing its employees,
mainly through the MTN Academies
established in Johannesburg, Accra
and Dubai.
MTN’s head office is in
Johannesburg, South Africa, where
the Group is listed on the JSE Limited
under the share code “MTN”.
MTN is the largest primary listing on the JSE.
Incorporated in 1994, MTN Group
Limited is a multinational
telecommunications company
offering mobile communication and
related products and services to
individuals and businesses on three
continents. MTN has mobile licences
in 21 countries and internet service
provider (ISP) businesses in
13 countries, mostly in Africa and
the Middle East.
Recently, in addition to its mobile communications business, it has also established partnerships, associates and joint ventures to grow revenue and maintain costs.
MTN is also invested in tower
management companies in Ghana
and Uganda. At the end of
December 2011, MTN had
164,5 million subscribers. In 2011,
total revenues reached R121,9 billion
and during the year the Group
invested R17,7 billion in developing
its network infrastructure. Included
in capital expenditure are

MTN Group Limited Integrated Business Report for the year ended 31 December 20115
Grou
p ov
ervi
ewPe
rform
ance
revi
ewOp
erat
iona
l and
fin
ancia
l rev
iew
Sust
aina
bilit
yFi
nanc
ial s
tate
men
tsSh
areh
olde
r inf
orm
atio
n
MTN’s core offerings include:
Voice services
➛ Voice services via 2G and 3G networks, including prepaid and postpaid airtime.
➛ Although the majority of MTN customers are on prepaid packages, South Africa, Syria and Cyprus have a relatively large postpaid base.
➛ MTN Zone is a dynamic tariffing service pioneered successfully by MTN. The service offers discounted call rates based on network use and available capacity.
➛ MTN’s voice offering also includes international roaming, teleconferencing facilities and various community payphones models.
➛ MTN also provides interconnection services to other telecoms networks.
Data services
➛ Mobile and fixed data services via various technologies (including 3G, WiMax, EDGE, HSPA, HSDPA, WCDMA).
➛ Mobile messaging, including basic short message services (SMS), and multimedia message services or MMS, enabling customers to send various media including music, photographs and videos from their phones.
➛ MTN Mobile Money a cash transfer service launched in 12 markets.
➛ MTN Play content portal provides entertainment service.
➛ MTN also has various USSD services (including callback and balance enquiries).
➛ MTN customers can access the Opera Mini Browser in some markets, offering access to the web from mobile phones.
➛ MTN has also launched m-insurance and m-health services in some markets.
➛ As smartphones become more accessible to people, demand for internet service grows and so does MTN’s opportunity.
ICT
➛ MTN Business provides enterprise solutions and cloud computing services.
➛ In 13 of its markets, MTN serves large corporate customers, providing solutions designed to manage costs, improve efficiencies and deliver consistent quality.
➛ Among these are: corporate data solutions, satellite connectivity, infrastructure (data centres and hosting solutions), networking of customer branches (an MPLS network), videoconferencing and ePresence, customer and productivity solutions, system security, converged services, other support and sector-specific services, and cloud computing.

MTN Group Limited Integrated Business Report for the year ended 31 December 20116
Structure and footprint
100%
100%
100%
100% Service provider
100% Business Solutions
30% MTN Swaziland
96% MTN Uganda
53% Mascom Botswana
80% MTN Rwanda
86% MTN Zambia
100% MTN South Africa
MTN Dubai
MTN Holdings
MTN International
MTN Mauritius
70% MTN Cameroon
78,7% MTN Nigeria
65% MTN Côte d’Ivoire
49% MTN Irancell
100% MTN Congo-Brazzaville
49% Uganda Tower Inter Co
100%
60% Lonestar Cell
75% Areeba
98% MTN Ghana
85% MTN Yemen
85% MTN Sudan
75% MTN Benin
75% MTN Syria
100% MTN Guinea Bissau
50% MTN Cyprus
91% MTN Afghanistan
Branded names.
20% Belgacom International Carrier Services
49% Ghana Tower Inter Co

MTN Group Limited Integrated Business Report for the year ended 31 December 20117
Grou
p ov
ervi
ewPe
rform
ance
revi
ewOp
erat
iona
l and
fin
ancia
l rev
iew
Sust
aina
bilit
yFi
nanc
ial s
tate
men
tsSh
areh
olde
r inf
orm
atio
nGr
oup
over
view
Oper
atio
nal a
nd
finan
cial r
evie
wSu
stai
nabi
lity
Fina
ncia
l sta
tem
ents
Shar
ehol
der i
nfor
mat
ion
MTN Irancell (49%)
2012Guidance 2011
Subscribers (’000)** 38 681 34 681Revenue (Rm) 11 050EBITDA margin (%) 42,5Capital expenditure (Rm) 1 306 1 168
**100%
MTN Syria
2012Guidance 2011
Subscribers (’000) 6 166 5 716Revenue (Rm) 6 463EBITDA margin (%) 26,2Capital expenditure (Rm) 869 449
MTN South Africa
2012Guidance 2011
Subscribers (’000) 24 933 22 033Revenue (Rm) 38 597EBITDA margin (%) 35,2Capital expenditure (Rm) 4 599 4 105
MTN Nigeria
2012Guidance 2011
Subscribers (’000) 45 641 41 641Revenue (Rm) 34 879EBITDA margin (%) 61,7Capital expenditure (Rm) 10 500 6 331
MTN Ghana
2012Guidance 2011
Subscribers (’000) 11 106 10 156Revenue (Rm) 5 941EBITDA margin (%) 49,5Capital expenditure (Rm) 1 128 851
Key performance indicators
Group
2012Guidance 2011
Subscribers (’000) 184 801 164 501Revenue (Rm) 121 884EBITDA margin (%) 44,9Capital expenditure (Rm) 24 401 17 717
*Group presence through corporate office.
*

MTN Group Limited Integrated Business Report for the year ended 31 December 20118
Strategy
In Country
Voice services
Data and related services
ICT evolution
Convergence and operational evolution
In country ➛ Changes in local ownership, business
model and new licences and spectrum
Expanding footprint ➛ Bolt-on standalone opportunities in Africa
and the Middle East remain a strategic priority
➛ Scale and size of opportunity ➛ Number one or two operator
Transformation ➛ Limited number of potential opportunities➛ Execution risk high
Consolidation and diversification
Leverage existing scale and intellectual capacity
Revenue Expenditure M&A
Cost optimisation initiatives ➛ Procurement transformation project ➛ Growth of IT shared services initiative ➛ Infrastructure sharing strategy➛ Back office centralisation➛ Implementation of hybrid power systems
to reduce dependence on diesel
R e t u r n s t o s h a r e h o l d e r s
Convergence and operational evolution
Leverage existing scale and intellectual capacity
Consolidation anddiversification

MTN Group Limited Integrated Business Report for the year ended 31 December 20119
Grou
p ov
ervi
ewPe
rform
ance
revi
ewOp
erat
iona
l and
fin
ancia
l rev
iew
Sust
aina
bilit
yFi
nanc
ial s
tate
men
tsSh
areh
olde
r inf
orm
atio
n
Key statistics
2011 2010 % change
Countries in which MTN has GSM licences1 21 21 —
Subscriber numbers (million) 164,5 141,6 16,2%
Countries in which MTN has largest market share 15 15 —
Market capitalisation (billion) at end December R271 R253 7,1%
Dividend payout ratio 70% 55% 15 pct points
Revenue (billion) R121,9 R114,7 6,3%
Data’s contribution to revenue2 6,6% 5,4% 1,2 pct points
EBITDA (billion) R54,8 R47,5 15,2%3
EBITDA margin4 44,9% 41,5% 3,4 pct points
Average foreign exchange rates (rand to local currency)
Nigerian naira 21,76 20,67 (5,3%)
Ghanaian cedi 0,21 0,20 (5%)
Iranian rial 1 474 1 401 (5,2%)
Average rand/dollar rate 7,17 7,34 2,3%
Capital expenditure (billion) R17,7 R19,5 (9,2%)
Internal audit hours 166 000 130 000 27,7%
Employees5 24 252 26 055 (6,9%)
Investment in employee training (million) R265 R246 (7,7%)
CO2 emissions from energy use (tonnes) 950 564 1 127 254 (15,7%)
Scope 1 – direct emissions (tonnes) 536 541 743 646
Scope 2 – indirect emissions (tonnes) 407 492 378 869
Scope 3 – emissions (tonnes) 6 531 4 739
Countries in which MTN deploys alternative energy 14 14 —
Investment by MTN foundations R125 million R155 million (19,4%)
Brand value (million) $5 200 $4 920 5,7%
Note 1: Although MTN operates in South Sudan it has not yet been formally granted its licenceNote 2: Excluding SMS revenueNote 3: Percentage change calculated with full EBITDA numberNote 4: 2011 figure includes the profit from the sale of the Ghana towers and the 2010 figure excludes the MTN Zakhele transactionNote 5: 2010 figure was adjusted to exclude maintenance staff contracted to MTN who had previously been erroneously included in the staff number

MTN Group Limited Integrated Business Report for the year ended 31 December 201110
Interacting with stakeholders
The mobile communications industry is heavily regulated. In many countries, it provides key infrastructure essential to economic development as a de facto provider of communications services and is a large national taxpayer and a significant employer. For these reasons alone, engagement with a wide spectrum of stakeholders is important.
In 2011, MTN, including its board members, made progress on stakeholder engagement and input. A stakeholder framework, which aims to better track and formalise stakeholder engagement and input, will ultimately be rolled out throughout the Group and its operating companies. It takes into account policies and principles defined in King III and the AA 1000 Stakeholder Engagement Standard and Information Privacy: Fair Information Practices and Principles (FTC, 1999).
In our 2010 report we identified some of our key stakeholders. This year, we provide a few select examples of new initiatives to build on these relationships.
EmployeesWe launched a new employee value proposition and a new approach to managing leadership talent. Further details are contained in the people
and people and remuneration report on pages 58 – 73.
RegulatorsMTN has always prioritised constructive engagement with regulators and continues to build on this in light of increased regulation and its impact across our footprint.
Government bodiesMTN closely guards its independence. However, it recognises the importance of balancing this with appropriate engagement with key government bodies by the right people from MTN. The significance of this engagement has recently been highlighted by the increase in Western sanctions against certain of our operating countries.
The mediaMTN recognises the important role of the media in our communication with all stakeholders. The Group is adopting a more proactive approach to this engagement both at a Group and local level.
NGOsThe new social and ethics committee will provide guidance on dealing with the challenges of operating in high-risk countries as well as better engaging with key players on a broad spectrum of issues.
Shareholders and the investor communityDuring the year, we established a new format of engagement with our larger investors. In line with best practice, the chairman and the lead independent director gained valuable first-hand insight into their views during these meetings. We also introduced a new forum for sell-side analysts which is held regularly after the release of the half- and full-year financial results. These meetings have been well attended by our senior executives and a wide range of equity analysts from leading research houses.
CustomersAs competition increases, we recognise the importance of better understanding our customers’ needs and their behaviour. To this end, we are enhancing our business intelligence tools and use thereof.
DistributorsEngagement with distributors is managed on a country-by-country basis, through established corporate structures.
Suppliers and business partnersThe transformation of our procurement processes has led to a more centralised and closer engagement with original equipment manufacturers and other
key suppliers. The role and strategic nature of our business partners such as the tower companies have fundamentally changed as our business model evolves.
CompetitorsAs markets mature, industry forums have become more prevalent. As the leading mobile operator in 15 markets, MTN takes its role in such groupings seriously, without compromising issues of competition.
Local communities and the general publicAs evidenced in this report, our contribution to economic, social and environmental sustainability continues to grow and extends well beyond our basic commercial mandate. This is informed by formally communicated government priorities and the needs of the general public, channelled through various touchpoints with the organisation, including our foundations, corporate affairs departments and staff.
Ratings agenciesWe assist key ratings agencies in better understanding our business and corporate structure. This is managed formally through regular meetings.

MTN Group Limited Integrated Business Report for the year ended 31 December 201111
Grou
p ov
ervi
ewPe
rform
ance
revi
ewOp
erat
iona
l and
fin
ancia
l rev
iew
Sust
aina
bilit
yFi
nanc
ial s
tate
men
tsSh
areh
olde
r inf
orm
atio
n
Low
Low
High
Customer centric approach
Cost optimisation
Slowing revenue
Capital investments
Skilled human resources
Governance and control
Increased regulations
Currencies
High-risk countries
Environmental and social considerations
Risk and opportunities summary
AdvancedLLowLimited
Progress of mitigation of risk or optimisation of opportunity
Deg
ree
of co
ntro
l

MTN Group Limited Integrated Business Report for the year ended 31 December 201112
Integrated risks and opportunities
12MTN Group Limited Integrated Business Report for the year ended 31 December 2011
Risk Opportunity (including socio-economic and environmental development)
Sustainable mitigation
Exposure to currencies other than reporting currency (ZAR) impacting reported financial results and servicing foreign-denominated obligations
Fluctuations in the exchange rate can be favourable to reported rand results and servicing of obligations
Contribution to the development of the local banking industry
Upstreaming of cash Efficient local balance sheets
Local currency funding strategy, including gearing and upstreaming principles
Management of foreign-denominated assets and liabilities to minimise impact
Treasury policy and committee oversight for risk management A sustainable payout ratio coupled with opportunistic buybacks
Exposure to higher risk countries Challenges include but not limited to poor infrastructure, political and social unrest, sanctions, irrational competition and violations of human rights
Potentially higher reward and scope for growth
Provide key communications infrastructure Grow formal economy, bring transparency,
accountability and corporate structure Commitment to support local ownership Enterprise development
Opportunistic diversification of the portfolio Independent and dedicated risk management team which monitors country risks and business continuityAppropriate governance structures MTN adopts a neutral stance although does engage through a dedicated stakeholder function Ongoing vigilance in respect of sanctions compliance through legal support and appropriate policies and controls Social and ethics committee provides direction for decisions on social and ethical challenges
Increased regulatory requirements impacting commercial business
Sufficient spectrum key for providing new products in line with evolving sector
Imposed taxes impacting profitability
Communications is a key element of infrastructure to a country
Proactive engagement with regulators contributing to the development of the sector given the experience and credibility of operating across multi-jurisdictions
Often the largest national taxpayer
Continued constructive and transparent engagement with authorities at a Group and country level to ensure the success of social and commercial imperatives
Group-wide tax risk management process to proactively as well as reactively consider the implications of changing legislation
Local market equity and credit exposure to MTN reduces the risk of irrational behaviour
Slowing revenue growth as a result of increased voice penetration, aggressive competition and substitute products “Go to market” strategies as the market demand shifts
Creating more affordable voice and data technology solutions to lower-income segments of the market
Broader social impact on related services in line with data strategy include banking the “unbanked”, health and relevant social initiatives
Broader and deeper penetration of the traditional voice market A coordinated implementation of new data and related services through
a dedicated Group Commercial Function Investments in undersea cables will allow for cheaper broadband which
will in turn make data products more affordable and accessible Evolution of the business into a fully fledged ICT player

MTN Group Limited Integrated Business Report for the year ended 31 December 201113
Grou
p ov
ervi
ewPe
rform
ance
revi
ewOp
erat
iona
l and
fin
ancia
l rev
iew
Sust
aina
bilit
yFi
nanc
ial s
tate
men
tsSh
areh
olde
r inf
orm
atio
n
13MTN Group Limited Integrated Business Report for the year ended 31 December 2011
Risk Opportunity (including socio-economic and environmental development)
Sustainable mitigation
Efficiently manage costs to offset impact of slowing revenue growth in order to sustain profitability levels
Enhancing shareholder value through the monetisation of assets
Creating efficiencies allowing the Company to maintain competitiveness and enhance speed to market
Improved customer service Leverage scale and improve consistency
and standardisation
Managing costs across the supply chain to better respond to the evolving business model
Focus areas include: – Rationalisation of suppliers through a centralised procurement function – Standardisation of network infrastructure for efficient launch of products
and services – Infrastructure sharing through the establishment of tower companies
(Ghana and Uganda) – Shared services, alternative energy, improving efficiency of the distribution
channel, as well as tools such as ABC to leverage best practice
Shortage of skilled human resources in emerging markets exacerbated by competition in search of similar expertise. This results in high retention costs for experienced staff
Staff advance their learning and development through dynamic nature of business
The diversity of the footprint in terms of size of operations as well as location and maturity adds to the benefits MTN can offer employees
MTN strives to be an employer of choice Ongoing review and enhancement of retention incentives to staff Talent management programme headed by a talent board is aimed at
building leadership succession pools MTN Academy’s learning initiatives including the creation of a leadership
development programme
Timeous, effective and efficient capital investments for the upgrading of network and information technology (IT) to cater for subscriber acquisition and increased traffic as a result of price reductions.Planning of networks and IT upgrades to cater for new product developments and ensure an appropriate ROI
Infrastructure sharing addressing environmental issues including CO2 challenges
Energy-efficient strategies including solar powered base stations and engineered solution
Reductions in costs of network equipment provide an opportunity to penetrate lower income segments of the market
Networks are monitored continuously, ensuring quality and headroom capacity
Standardisation and optimisation of systems and technologies together with outsourcing of non-core activities provide reduced costs and ensure discipline and focus on critical business requirements
Infrastructure sharing Capital expenditure steering committees to drive the initiatives
implemented by the Group’s CTIO’s office
A customer centric approach becomes critical as the business evolves. Key elements include maintaining a positive brand perception, broad availability of products and services, high quality and consistent customer experience at all customer touchpoints
Enterprise development for local entrepreneurs
SME engagement Informal distribution channels have created
job opportunities
Implementation of a streamlined distribution framework which includes an enhanced and effective footprint to ensure broad and deep distribution
Customer service also forms part of the distribution framework and includes the regular training for store and call centre staff on new developments relating to products and services. This is aimed at enhancing customer experience
Governance and control is critical in all areas to maintain profitability and business continuity. Implementation of procedures of mature and well-controlled processes is key
Adequate governance gives comfort and confidence to stakeholders across the value chain when dealing with MTN
Maturity of MTN’s control environment and governance structures continues to improve although there will always be areas of particular focus
Comprehensive governance and oversight structures exist including audit committees, risk committees, internal audit, fraud prevention and risk management measures covering all OPCOs
MTN has done a comprehensive assessment of the King III requirements including combined assurance, IT governance and integrated reporting
Integrating environmental and social considerations in business activities ensuring MTN is responsible and sensitive to the impact of the environment and society when conducting business
Reducing MTN’s environmental impact across operations and value chain
Contributing to the social upliftment and development of communities
Environmental impacts are addressed cross functionally and include infrastructure sharing which reduces MTN carbon footprint, energy-efficient solutions, e-waste management and managing EMF and RF field responsibly
Social development is inherent in the nature of the business and is addressed by providing products and services that are value enhancing to society. MTN’s operations invest in communities through MTN Foundations focused on education, health and other social and economic upliftment projects

Cyril Ramaphosa Chairman
Recognising the challenges of changeThe Greek philosopher Heraclitus is
credited with saying that the only
constant is change. At MTN we have
seen remarkable change in the past
decade and even in the past year.
Emerging economies across Africa
and the Middle East have grown
rapidly, providing an opportunity
to reap attractive returns for those
willing to invest in what traditionally
have been considered high-risk
markets. Several countries in the
region have experienced political
and social volatility, most notably
since the start of the Arab Spring
in 2010. The increased ease of
communication can be credited,
at least in part, for both the rate of
economic development and the
political change we have seen.
Mobile telephony in particular has
been an empowering and liberating
force throughout the emerging
world.
At a sustainable energy conference
in January, UN Secretary-General
Ban Ki-moon put it plainly: “…The
phenomenal spread of mobile
phone technology… has touched
every corner of the world and
empowered billions of people –
a direct result of innovation,
investment and government
support.”
It is fair to say that MTN has played a
fundamental role in the economic
and social development in the
countries in which it operates. It, too,
has benefited from its investments.
Its ambition is to speed up the
progress of the emerging world by
enriching the lives of its people. The
Company is committed to furthering
this journey by expanding its
offering beyond just voice to more
sophisticated services. Numerous
studies show that the effects of
mobile telephony on economic
growth are already significantly
stronger in developing countries
than in developed markets: just
imagine what the impact will be of
greater wireless internet access, not
to mention services such as mobile
banking, all driving development.
Apart from the effect on society,
MTN’s strategy to pursue
investments in emerging markets
has provided considerable value for
the Company. With a market
capitalisation of R271 billion at the
end of 2011, MTN is the largest
primary listed company on the JSE,
a key indicator of its success.
Ensuring sound governanceFor MTN, sound governance and
a strict code of conduct are
fundamental to the way we do
business. Because of the different
dynamics across MTN’s 21 markets,
most risks are managed in-country
through dedicated local stakeholder
teams under the best practice
guidance of the Group.
Chairman’s statement
MTN Group Limited Integrated Business Report for the year ended 31 December 201114

MTN Group Limited Integrated Business Report for the year ended 31 December 201115
Grou
p ov
ervi
ewPe
rform
ance
revi
ewOp
erat
iona
l and
fin
ancia
l rev
iew
Sust
aina
bilit
yFi
nanc
ial s
tate
men
tsSh
areh
olde
r inf
orm
atio
n
contribution in 2011. During the year, we said goodbye to Phuthuma Nhleko as Group president and CEO and to independent non-executive director Doug Band. Sifiso Dabengwa was welcomed as incoming Group president and CEO. He takes over as a new era of telecommunications is beginning, requiring an evolution of the business to changing customer demands while maintaining an appropriate cost base.
Following the decision last year not to form a formalised subsidiary company board for the international operations, Phuthuma Nhleko will not be rejoining the MTN Group board.
Looking forward I have no doubt the year ahead will bring new opportunities, which will no doubt come with new challenges. While the economic and political outlook is quite cautious, I am confident that MTN will continue to strive towards overcoming the obstacles while increasing returns to shareholders.
Cyril RamaphosaChairman
March 2012
MTN has as its core value the imperative to respect the human and privacy rights of people in all the markets in which we operate. These rights are entrenched in the terms of reference of the board’s newly formed social and ethics committee and defined as the 10 principles set out in the UN Global Compact Principles. We oppose abuse of these rights by any party, including governments, and work hard to ensure that our businesses do not contribute to such abuse. South Africa has human rights enshrined as a fundamental principle within its constitution. Given the country’s own recent history and our struggle against suppression and discrimination, we are very conscious of our moral obligations.
Following our announcement on 2 February 2012 of a potential claim by Turkcell and allegations made against MTN, the Group board has proactively responded by setting up the independent Hoffmann Committee. The committee has already started its work. Lord Hoffmann is a former senior British judge, with the highest reputation for independence. His full and detailed investigation will provide the board with deeper understanding of the matter.
MTN will address the recommendations made by the Committee at the end of that process.
Engaging transparentlyEngagement is important, especially as telecommunications is a regulated industry. MTN works to ensure transparency with government bodies and regulators, enabling a balance between the commercial and social success of the industry and the vital infrastructure it provides.
Local ownership is essential to the commercial interests of MTN companies by ensuring local insight and understanding, but is also valuable in fostering local economic participation and empowerment.
In 2011, the Group continued its ongoing engagement with its many stakeholders, furthering real partnerships with key suppliers and other business associates, and developing its employees to ensure that they can advance their careers.MTN also worked harder to understand people’s needs and to better deliver on them, considering existing as well as potential customers. The Group accelerated its efforts to engage with regulators on the requirements for more inclusive
mobile communications that help bridge the digital divide. Access to sufficient radio spectrum is vital to continued growth.
Personally, I found the meetings fellow director Alan van Biljon and I held with large investors very useful, giving us an opportunity to hear shareholders’ views first hand. It mirrored efforts throughout the Group for more interaction with stakeholders.
Accomplishing much in 2011In 2011, MTN accomplished a great deal. The Group achieved a sound operational performance under challenging conditions. Recognising the strength of the balance sheet and the continued healthy cash flows, the board decided to increase the dividend payout policy to 70% of annual adjusted headline earnings per share, up from 55% a year before and 25% the year before that.
The Group also took further steps in its journey to produce a more integrated business report that provides meaningful information about all aspects of MTN’s performance and position.
AppreciationI would like to thank the board and management team for their

Group board of directorsat 31 December 2011
MTN Group Limited Integrated Business Report for the year ended 31 December 201116
1.
2.
4.
6.
Cyril Ramaphosa
Alan Harper
Peter Mageza
Alan van Biljon
Koosum Kalyan
Sifiso Dabengwa
3.
5.

MTN Group Limited Integrated Business Report for the year ended 31 December 201117
Grou
p ov
ervi
ewPe
rform
ance
revi
ewOp
erat
iona
l and
fin
ancia
l rev
iew
Sust
aina
bilit
yFi
nanc
ial s
tate
men
tsSh
areh
olde
r inf
orm
atio
n
7.
10.
11.
12.
Dawn Marole
9.
JJ Njeke
Jan Strydom
Nazir Patel
Jeff van Rooyen
8.
Azmi Mikati
12.

MTN Group Limited Integrated Business Report for the year ended 31 December 201118
Group board of directors continued
1. MC Ramaphosa (59) | BProc, LLD (HC)Independent non-executive director and chairman
Appointed: 1 October 2001
Board committee membership Remuneration and human resources
committee Nominations committee
Other directorshipsDirector of various companies in the MTN Group; founder and executive chairman of Shanduka Group (Pty) Ltd; non-executive chairman of The Bidvest Group Limited; joint executive chairman of Mondi Plc and Mondi Limited. Non-executive chairman of SASRIA Limited, non-executive director of SAB Miller plc, Macsteel Global BV, Alexander Forbes Limited and Standard Bank Group Limited. Cyril is also a director of Kangra Coal (Pty) Ltd, Assore Limited, TBWA Hunt Lascaris Holdings (Pty) Ltd and Lonmin Plc (incorporated in England and Wales).
Skills, expertise and experiencePreviously chairman of the Constitutional Assembly and chairman of the specially formed Black Economic Empowerment Commission. Cyril was also a member of parliament, secretary general of the ANC and secretary of the National Union of Mineworkers. Cyril is currently on the national executive committee of the ANC and has received several honorary doctorates.
2. AF van Biljon (64) | BCom, CA(SA), MBALead independent non-executive director
Appointed: 1 November 2002
Board committee membership Chairman of the audit committee Nominations committee
Other directorshipsDirector of various companies in the MTN Group, Hans Merensky Holdings
(Pty) Ltd, St Augustine College of South Africa, chairman and trustee of Standard Bank Group Retirement Fund and Liberty Group Pension and Provident Funds.
Skills, expertise and experienceBetween 1975 and 2002, Alan held the position of group financial director for the following companies: Truworths Limited, The Greatermans Checkers Group, Sun International, and The Standard Bank Group. In 2002, he established a specialised financial services company named Van Biljon & Associates. His past non-executive directorships include Alexander Forbes, Sage Group and Peermont Ltd.
3. RS Dabengwa (53) | BSc (Eng), MBAGroup president and CEO since 1 April 2011, executive director since 1 October 2001
Appointed: 1 October 2001
Board committee membership Chairman of Group executive and
steering committee Attends various board committee
meetings ex officio Group chief operations officer until
31 March 2011
Other directorshipsDirector of various companies in the MTN Group, Long Street Property Development (Pty) Ltd, Salamax 765 (Pty) Ltd and Tsiya Group (Pty) Ltd.
Skills, expertise and experiencePrior to joining MTN, Sifiso was Eskom’s executive director responsible for sales, customer service, electrification and distribution technology. Before Eskom, he worked as a consulting electrical engineer in the building services industry and in the mining and railway sectors.
4. A Harper (55) (British) | BA (Hons)Independent non-executive director
Appointed: 1 January 2010
Board committee membership Chairman of remuneration and human
resources committee Nominations committee
Other directorshipsDirector of various companies in the MTN Group, Eaton Towers LLP and Venture Partnership Foundation Limited.
Skills, expertise and experienceAlan previously served as group strategy and new business director for Vodafone plc, was a member of the executive committee of the Vodafone Group, a board member of the GSM Association, chairman of Vodafone Ventures and chairman of the board of trustees of the Vodafone UK Foundation.
5. KP Kalyan (57) | BCom (Law) (Hons) Economics, Senior Executive Management Programme (London Business School)Independent non-executive director
Appointed: 1 June 2006
Board committee membership Chairman of social and ethics
committee Risk management, compliance and
corporate governance committee
Other directorshipsDirector of various companies in the MTN Group, Standard Bank Group Ltd, South African Bank Note Company Ltd, South African Mint Company Ltd, Edgo Merap (London) Limited, Omega Risk Solutions, the Tälberg Foundation (Sweden), Hayleys Energy Services (Sri Lanka) Ltd, Kgontsi Holdings Ltd, Kgontsi Investments Ltd, Euromax (London & Mumbai) Ltd, Petmin Mining and chairman of the Thabo Mbeki Foundation.
Skills, expertise and experienceKoosum is currently executive chairman of Edgo Merap in London. Prior to that, she was senior business development manager at Shell International Exploration and Production (Pty) Ltd in London; general manager, corporate, for Shell Southern Africa; senior economist at the Chamber of Mines; and economist at the Electricity Commission of Victoria, Melbourne, Australia. She was also a graduate lecturer at University of Durban Westville.
6. NP Mageza (57) | Fellow of the Association of Chartered Certified AccountantsIndependent non-executive director
Appointed: 1 January 2010
Board committee membership Audit committee Risk management, compliance and
corporate governance committee Chairman of social and ethics
committee
Other directorshipsDirector of various companies in the MTN Group, Eqestra Holdings Limited, Clover Industry Limited, Ethos Private Equity Limited, Four Rivers Trading 261 (Pty) Ltd, Ntamele Investment Company (Pty) Ltd, Tunleys Mail and Print (Pty) Ltd, Songhai Capital (Pty) Ltd, Majorshelf 142 (Pty) Ltd, Bairds Renaissance (Pty) Ltd, ABSA Foundation, Remgro Limited, Sappi Limited, Rainbow Chicken Limited and a Trustee for Kelrose Trust.
Skills, expertise and experiencePeter is a Fellow of the Association of Chartered Certified Accountants United Kingdom and was until June 2009 Absa executive director and group chief operations officer. He has extensive experience in the financial and banking arena.

MTN Group Limited Integrated Business Report for the year ended 31 December 201119
Grou
p ov
ervi
ewPe
rform
ance
revi
ewOp
erat
iona
l and
fin
ancia
l rev
iew
Sust
aina
bilit
yFi
nanc
ial s
tate
men
tsSh
areh
olde
r inf
orm
atio
n
Other directorshipsDirector of various companies in the MTN Group.
Skills, expertise and experienceNazir is a qualified chartered accountant with wide international experience in Europe and the Middle East. Since joining the MTN Group, Nazir has been responsible for the Group financial management and accounting function, has participated in several of the Group’s merger and acquisition activities and serves on a number of MTN’s subsidiary boards.
11. J van Rooyen (62) | BCom, BCompt (Hons), CA(SA)Independent non-executive director
Appointed: 1 July 2006
Board committee membership Chairman of the risk management,
compliance and corporate governance committee
Audit committee Social and ethics committee*
Other directorshipsDirector of various companies in the MTN Group, various companies in the Uranus Group, Pick n Pay Stores Limited, Exxaro Resources Limited and a trustee of the International Financial Reporting Standards (IFRS) Foundation.
Skills, expertise and experienceJeff is a founder member and CEO of Uranus Investment Holdings (Pty) Ltd and previously served as CEO of the Financial Services Board. He is also a founder member and former president of the Association for the Advancement of Black Accountants (ABASA) and was chairperson of the Public Accountants and Auditors Board in 1995.
12. JHN Strydom (73) | MCom (Acc), CA(SA)Non-executive director
Appointed: 1 March 2004
Board committee membership Audit committee Risk management, compliance and
corporate governance committee Social and ethics committee*
Other directorshipsNon-executive director of various companies in the MTN Group, director of the Public Investment Corporation Limited and Growthpoint Properties Limited.
Skills, expertise and experienceJan is a registered chartered accountant and a founding partner of Strydoms Incorporated Chartered Accountants (SA), a firm specialising in business valuations, litigation support and forensic investigations. He is now a professional consultant to Strydoms. He is also a senior member of the Special Income Tax Court for taxation appeals.
� Independent non-executive directors – 8� Non-executive directors – 2� Executive directors – 2
Group board independence status
7. MLD Marole (51) | BCom (Acc), Dip Tertiary Education, MBA, Executive Leadership Development ProgrammeIndependent non-executive director
Appointed: 1 January 2010
Board committee membership Risk management, compliance
corporate governance committee Social and ethics committee*
Other directorshipsDirector of various companies in the MTN Group, African Bank Investments Limited, Incwala Resources (Pty) Ltd, Eyomhlaba Investment Holdings Limited, Hlumisa Investment Holdings Limited, Richards Bay Titanium (Pty) Ltd, Richards Bay Mining (Pty) Limited and DEMA Incwala Investment.
Skills, expertise and experienceDawn’s career has primarily been in the financial services sector and dates back to 1983. She is the current chairperson of POWA (People Opposing Women Abuse).
8. AT Mikati (39) (Lebanese) | BScNon-executive director
Appointed: 1 July 2006
Board committee membership Nominations committee Remuneration and human resources
Other directorshipsDirector of various companies in the MTN Group, CEO of M1 Group Limited (an international investment group with a strong focus on the telecommunications industry), director of various companies in the M1 Group as well as EZ-Link, B-Pro Limited, B-Jet Limited, Horizon Global Services, IMC, Mint Trading, Unioil and Facconable Group.
Skills, expertise and experienceAzmi founded T-One, a telecoms company providing long-distance services between
the United States and other international destinations.
9. MJN Njeke (53) | BCom, BCompt (Hons), CA(SA), H Dip
Tax LawIndependent non-executive director
Appointed: 1 June 2006
Board committee membership Risk management, compliance and
corporate governance committee Audit committee
Other directorshipsDirector of various companies in the MTN Group, Lengau Logistics (Pty) Ltd, ArcelorMittal SA, Ivolve Procurement & Rental Partner, Metropolitan Health Group, MMI Holdings Limited, NM Rothschild and Sons (SA) (Pty) Ltd, PSU Revenue Management trading as PSU International, RTG Fleet Services (Pty) Ltd, Resilient Property Income Fund Limited, Serengeti Properties (Pty) Ltd, Salvage Management and Disposal (SMD), Sameh Properties and Silver Unicorn Trading, Sasol Limited.
Skills, expertise and experienceJohnson is chairman of MMI Holdings Ltd, ArcelorMittal SA and Resilient Property Income Fund. He served as a partner at PricewaterhouseCoopers and is a past chairman of the South African Institute of Chartered Accountants.
10. NI Patel (54) | BCom, BCompt (Hons), CA(SA)Executive director: Group chief financial officer
Appointed: 29 November 2009
Board committee membership Group executive and steering
committee Attends various board committee
meetings ex officio
*Social and ethics committee constituted in 2012.

MTN Group Limited Integrated Business Report for the year ended 31 December 201120
Group executive and steering committee at 31 December 2011
1.2.
3.
4.
5. 6.
7.
8.
9.10.
Sifiso Dabengwa
Nazir Patel
Christian de Faria
Jamal RamadanIgnatius Sehoole
Khumo Shuenyane
Ahmad Farroukh
Shauket Fakie
Jyoti Desai
Paul Norman

MTN Group Limited Integrated Business Report for the year ended 31 December 201121
Grou
p ov
ervi
ewPe
rform
ance
revi
ewOp
erat
iona
l and
fin
ancia
l rev
iew
Sust
aina
bilit
yFi
nanc
ial s
tate
men
tsSh
areh
olde
r inf
orm
atio
n
*Profiles appear on pages 18 to 19 of this report.**Retired in March 2012.
1. RS Dabengwa *
2. NI Patel *
3. C de Faria (55) (French) | Degree in Finance
Administration (CA)Group chief commercial officer
DirectorshipsDirector of various companies in the MTN Group.
Skills, expertise and experiencePrior to joining MTN in 2006, Christian was CEO of PT Excelcomindo Pratama, known as XL, the largest mobile operator in Indonesia. Before joining XL, he was CEO of Telekom Malaysia International, now known as Axiata, and was responsible for international strategy and involved in the rapid growth of investments in Sri Lanka, Bangladesh and Cambodia. From June 2006 to May 2010, Christian was the vice-president for MTN West and Central Africa. Since June 2010 he has had the responsibility for the transformation of the supply chain function. He is leading the way in products, services and innovation at Group level as well as being responsible for Group marketing.
4. S Fakie (58) | BCom, BCompt (Hons), CA(SA)Group chief business risk officer
DirectorshipsDirector of various companies in the MTN Group and director of Absa Group Limited.
Skills, expertise and experienceShauket has over 37 years’ experience in accounting, auditing, consulting and advisory work. In 1999, he was appointed Auditor-General of South Africa for a
seven-year term which ended in November 2006.
5. JA Desai (54) | BA (Hons) BComGroup chief technology and information officer
Other committee membership Group commercial committee Group technical committee
DirectorshipsDirector of various companies in the MTN Group.
Skills, expertise and experienceJyoti started her career at The Standard Bank of SA Limited. She moved to Telkom SA in an executive position before joining MTN Nigeria as chief information officer. She then moved to Iran in 2005 to start up the Iran operation as COO of MTN Irancell before taking up her current role.
6. PD Norman (46) | MA (Psych)Group chief human resources and corporate affairs officer
Other committee membership Risk committee Social and ethics committee Group tender committee (Alternate
member)
DirectorshipsDirector of various companies in the MTN Group and trustee of the Chartered Accountants Medical Aid Fund.
Skills, expertise and experiencePaul has been an executive at MTN since 1997. He has spent more than 20 years in the field of human resources and has worked extensively in the transport and telecommunications industries.
7. A Farroukh (51) (Canadian) | Masters in Business Administration
& Accounting and also a Certified Public Accountant in the USA
Regional vice-president: West and Central Africa region
Other committee membership Commercial committee
DirectorshipsDirector of various companies in the MTN Group.
Skills, expertise and experienceAhmad previously worked for Mediterranean Investor Group, KPMG, Deloitte & Touche and the Investcom Holding Group. Ahmad also lectured in Accounting at the American University of Beirut. Prior to his appointment at MTN, Ahmad was managing director of Scancom Limited (Investcom Holding Group), Ghana and regional manager for West Africa. Prior to taking on his current role, Ahmad was the CEO of MTN Nigeria.
8. KL Shuenyane (41) | B Econ and Internat Stud;
CA (England and Wales)Group chief strategy, mergers and acquisitions officer
DirectorshipsDirector of various companies in the MTN Group.
Skills, expertise and experienceKhumo was previously head of direct investments and a member of the executive committee of Investec’s South African operations. He was also a member of Investec’s corporate finance division.
9. I Sehoole (51) | BCom, BCompt (Hons), CA (SA), Cert
in Theory of AccountancyRegional vice-president – South and East Africa region
Other committee membership Group tender committee
DirectorshipsDirector of various companies in the MTN Group and of the Public Investment Corporation (PIC) and Accounting Standards Board.
Skills, expertise and experienceIgnatius also serves on various committees within the PIC. He was the chairman of the Developing Nations Committee of the International Federation of Accountants (IFAC). He was previously a managing director of the inland region at Fedics (Pty) Limited, senior executive at Murray & Roberts Holdings (Pty) Limited and also the executive president of the South African Institute of Chartered Accountants (SAICA). Ignatius served as a member of the King Committee and was also the chairman of the National Treasury Audit Committee until March 2010.
10. J Ramadan (56)** | (French and Lebanese) | MA (Inf Tech)
Regional vice-president – Middle East and North Africa region
Other committee membership Group technical committee Group tender committee
DirectorshipsDirector of various companies in the MTN Group.
Skills, expertise and experienceJamal was an executive director of Investcom LLC, which he joined in 1996 as operations director. Prior to that, he was director of IT and FTML (a subsidiary of France Telecom) operating in Lebanon.

Background
Agriculture is a critical contributor to Africa’s GDP, and poverty reduction. ICT can help improve the output, value, and impact of agriculture in Africa. The agricultural industry is the backbone of economic development in Ghana.
Solution
MTN Ghana and Esoko partnered to provide agricultural information to MTN customers through SMS services at a cost of 8p per text. Customers can request for information such as produce price alerts, bids and offers, and news and advisories, using a short code. Customers can also access inventory counts and transport information. This solution offers a platform for farmers and agricultural enterprises to interact with their customers. The benefits include increased effectiveness, productivity and sustainability of income generation.
Facilitating agricultural market growth
MTN Group Limited Integrated Business Report for the year ended 31 December 201122

MTN Group Limited Integrated Business Report for the year ended 31 December 201123
Grou
p ov
ervi
ewPe
rform
ance
revi
ewOp
erat
iona
l and
fin
ancia
l rev
iew
Sust
aina
bilit
yFi
nanc
ial s
tate
men
tsSh
areh
olde
r inf
orm
atio
n
Group president and chief executive officer’s reportGroup chief financial officer’s report
Performance review

Group president and CEO’s report
MTN’s long-term vision is to be the leader in telecommunications in emerging markets. In 2011, the Group made good progress towards achieving this with a solid overall performance, while it refined its strategic objectives in light of evolving market dynamics.
Key to our vision is our customers. Increased focus and attention on all aspects of the customer experience are fundamental to us and are evident in all of the main strategic objectives discussed below.
Maintaining and increasing our leadership positionSubscriber numbers increased 16,2% to 164,5 million across 21 markets, helping bring more people closer together. At the same time, MTN increased its EBITDA margin to 44,9%, including the profit from the sale of the Ghana passive infrastructure (from 41,5% in 2010).
This performance was notwithstanding a stronger rand in the year, which depressed foreign earnings when translated back into MTN’s reporting currency. Despite heightened competition, the Group maintained its leadership position in most of its markets and remains the largest mobile communication provider in 15 countries.
Being a leader is not only about subscribers. Superior service, network quality and coverage as well as the best value proposition in the market are absolutely critical to business success. Solid and reliable distributors are also vital. With increasing demands from authorities everywhere, clear communication channels with regulators are also important.
MTN understands that it needs to work to maintain its strong brand preference by meeting customers’ expectations for innovative and broader service offerings and by being first to market. MTN
employees are rewarded for meeting targets related to all these goals. It is not without its challenges.
In the first quarter of the year, MTN Nigeria’s network quality was impacted temporarily by a large promotion which boosted traffic volumes. To maintain network quality, the company – which marked 10 years of operating in Nigeria in the year – had to withdraw the promotion. Again towards the end of the year, network quality was compromised as traffic volumes increased following pricing competition in the market. But
MTN acted quickly and decisively by focusing on immediate quick wins including the redistribution of capacity and the establishment of cross functional teams in the regions to intervene and resolve site issues. As we move forward we will focus on providing a balance between maintaining sound quality levels and increased demands for services from the subscriber base.
In 2011, MTN invested R17,7 billion on developing network infra-structure across its footprint, to ensure network quality and capacity. This is below 2010’s R19,5 billion
MTN Group Limited Integrated Business Report for the year ended 31 December 201124
Sifiso Dabengwa Group president and CEO

MTN Group Limited Integrated Business Report for the year ended 31 December 201125
Grou
p ov
ervi
ewPe
rform
ance
revi
ewOp
erat
iona
l and
fin
ancia
l rev
iew
Sust
aina
bilit
yFi
nanc
ial s
tate
men
tsSh
areh
olde
r inf
orm
atio
n
Close partnerships at a Group level with original equipment manufacturers of handsets; MTN’s focus on getting more data-capable devices into the hands of customers (without subsidies); its strong brand; and its customer segmentation model puts it in a solid position to increase revenues from data services in the year ahead. The latter allows the Group to have a segmented tailored approach to each of the identified customer groupings.
Richer and more relevant content and services are also very important. MTN estimates that some 60% of the data downloads on MTN subscribers’ mobiles is local content. This underscores the importance of continuing to develop good local content, make access easier and improve on quality and price.
At the end of 2011, 6,0 million people in 12 countries were registered MTN Mobile Money subscribers. Uganda and Ghana accounted for the lion’s share. This compares to 4,3 million in 11 markets in 2010. In Uganda, some $200 million a month is transacted through Mobile Money. Its popularity had a significant impact on limiting churn. Equally important is the role of Mobile
after peak spending of R30 billion in 2008/2009 laid a solid foundation. We continue to monitor our markets to ensure that capital spending is appropriate.
Revenue from traditional voice calls remains the largest revenue contributor. There is still potential to grow this as well as augment the Group’s voice offerings. Incoming interconnect revenue grew in the year in key countries such as Nigeria and Ghana as competitors focused on an all-net tariff strategy. In South Africa, incoming interconnect revenue continued to drop as the price per minute declined in line with the pre-determined glide path to lower mobile termination rates.
The higher subscriber base in the year, as well as many enhanced offerings, helped lift Group revenues 6,3% to R121,9 billion and expand the Group’s earnings before interest, taxation, depreciation and amortisation (EBITDA) to R54,75 billion.
Data and the implementation of a full ICT offeringMTN moved ahead with plans to implement a full ICT offering. Central to a comprehensive ICT service is to ensure that the Group has made the appropriate capital investments and has the right skills to execute this strategic objective.
The Group is already connected to two other submarine cables: the Eastern Africa Submarine Cable System (EASSy) and the Europe India Gateway (EIG). These cables, as well as MTN’s investment in the West African Cable System (WACS) and various metropolitan and national fibre optic cables, support new or enhanced data offerings.
Data revenue’s percentage contribution to MTN’s total revenue remains relatively low (in single digits, excluding SMS) in all our markets except for South Africa and Iran. But it is growing. For the Group, data revenue grew by 30,5% while SMS revenue grew by 14,2% to total 12,8% of revenue on a combined basis. In South Africa, where the market is more mature and MTN subscribers have 3,6 million smartphones, total data revenue, including SMS, rose to 21,4% (total revenue excluding revenue from handsets). In Iran it was 23,2%, up 2,4 percentage points. However data in Iran is almost entirely from SMS. MTN’s Nigerian operation more than doubled revenue from data services and total revenue (including SMS) increased to 6% from 4,6% as the Company encouraged the use of smartphones.
In the year, MTN continued to invest in various transmission and radio technologies, from undersea and metropolitan fibre optic cables to 2G, 3G and WiMax. It established the role of Group chief commercial officer, to which Christian de Faria was appointed.
In addition, within the South African group of companies, MTN Business Solutions has provided a valuable platform for the development of ICT services on the corporate side. It is our intention to leverage this capability further across the footprint. However, the more sophisticated products of a full ICT strategy, such as managed network services, managed hosted services “in the cloud” and M2M, are in initial stages of development. Access remains the key offering for most people across our footprint.
The launch in the year of the Main One undersea cable led to a drop in transmission costs in West Africa. In particular, MTN Nigeria’s access to the fibre optic cable system linking West Africa to Europe is helping the Company deliver greater broadband capacity at a reduced cost to customers. This provides more inclusive access to new data services and greater capacity and availability of networks.

MTN Group Limited Integrated Business Report for the year ended 31 December 201126
Employees who make an outstanding contribution to the Group are rewarded every year through the Y’ello Stars programme. Employees also take great satisfaction in volunteering for those less fortunate in the Group’s annual 21 Days of Y’ello Care volunteerism effort. Many enjoy moving between operations to share their knowledge while developing their careers. The Group spent R265 million on training in the year.
Increasing returns to shareholdersA central pillar of MTN’s strategy is to increase cash returns to shareholders while continuing to expand its business and invest in better, faster networks across a wider geography. Management targets improving cash flow, to ensure that the management fees and dividends earned in MTN operations flow back to the Group in an efficient way.
Using both ordinary dividends and share buybacks, MTN is able to return cash to shareholders as part of a sustained returns strategy. During the year, MTN executed its first share buyback totalling R927,3 million. While no decision has been made to further gear the Group balance sheet, dividends on annual earnings
Money in enabling the purchase and monetisation of content and related services offerings. These include insurance (such as the new funeral insurance offering by MTN Ghana) and health services, such as providing medical advice to mobile phone users, which enhance customer loyalty and reduce churn.
MTN’s recent partnership with Visa, allows Mobile Money customers to take advantage of the acceptance of Visa payment methods across the globe. MTN estimates that only a fifth of customers own a credit card. To make paying easier, MTN’s mobile wallet allows the cost of a purchase of – for example – an app to be debited directly to subscribers’ airtime. The Group recently launched a trial at South African universities allowing students to pay for cafeteria meals with their mobiles.
While the increasing affordability of data-capable handsets and the growth in use of social media has stimulated demand for data services, the availability of the appropriate spectrum allocation as well as 3G licence is also vital. In all of MTN’s markets, teams dedicated to engaging with regulators on this essential issue are in place.
By reducing its cost base, MTN is able to profitably service those customers at the lower end of the income scale and increase overall access.
Since MTN initiated its centralised procurement function in late 2010, the Group increased the number of categories purchased centrally, improving pricing across the board.
All MTN’s operating companies – from Afghanistan to Yemen – are focused on enhancing their customer service offerings; ensuring efficiency of the channels used to distribute products and services; and using their marketing expenditure, capital investments and their people effectively.
The Group recognises the importance of properly skilled employees who are motivated by their work. As competitive activity increases, demand for industry talent grows, making retention efforts that much more important. In April the Group launched “The MTN Deal”. This is a mutual commitment between MTN and its employees. It represents MTN’s pledge to understand, develop career opportunities and improve employment offering beyond reward and recognition.
The Group recently established clear targets throughout its operations with regard to growing the contribution of data to overall revenues. These include a KPI on data profitability.
Enhancing operational efficiencyAs more mobile communications licences are issued across MTN’s footprint, and competition intensifies, mobile operators need to become more efficient in everything they do. While many of MTN’s markets continue to grow, many others are maturing as mobile penetration rates move towards 100% and growth slows. The Group understands that it needs to do things more efficiently.
Among several organisation-wide initiatives are: the first shared IT services project (launched in 2011 in the SEA region); the procurement transformation project to ensure a more centralised approach; the spinoff with minority ownership of passive infrastructure including towers (such as the deals in Ghana and Uganda); as well as the back office centralisation project for support services (still in its infancy) and the accelerated implementation of hybrid power systems.
Group president and CEO’s report continued

MTN Group Limited Integrated Business Report for the year ended 31 December 201127
Grou
p ov
ervi
ewPe
rform
ance
revi
ewOp
erat
iona
l and
fin
ancia
l rev
iew
Sust
aina
bilit
yFi
nanc
ial s
tate
men
tsSh
areh
olde
r inf
orm
atio
n
in infrastructure and cost optimisation initiatives are a priority in support of this strategy. Value-accretive opportunities which fit within the parameters of MTN’s M&A strategy will still be considered. We will continue to manage the challenges brought about by sanctions and political instability in some of our markets. There remains a strong commitment to improving shareholder returns.
In 2012, MTN has earmarked capital spending of R24,4 billion, with Nigeria and South Africa accounting for approximately 62% of this investment. The Group expects to sign up 20,3 million new subscribers in the year, of which 53,7% are in Nigeria, South Africa and Iran.
Sifiso DabengwaGroup president and CEO
March 2012
have been increased to 70% and buybacks will continue to be implemented as and when appropriate.
M&A outlook and prioritiesMTN continues to consider bolt-on stand-alone opportunities across Africa and the Middle East. However it is very clear that the following criteria must be met: fit within the organisational strategy of the Group; have sufficient scale and size; and preferably be a number one or number two operator. Financial discipline is crucial in the process. Transformational transactions seem unlikely due to the limited number of opportunities and high execution risk.
Looking aheadAll the changes required ahead, particularly the need to optimise at a Group level, necessitate a change in MTN’s structure. Accordingly, the regional structures will be replaced by a grouping of the various operations based on scale and size. The success of any new strategy is based on successful implementation in our key markets of South Africa and Nigeria. Accordingly, the CEOs of these operations will report directly to me from 1 April 2012. As a third contributor to the Group, to oversee all the other operations, a
these international issues. In partnership with its legal advisers, MTN ensures that it remains compliant with the various sanctions regimes in place.
MTN has set up the independent Hoffmann Committee to investigate Turkcell’s allegations and will carefully consider the recommendations made by the Committee. MTN remains cautiously optimistic about the year ahead with macroeconomic conditions in key
markets not expected to change significantly. The key focus areas over the year are to maintain and improve our market position and improve the customer experience. There will be continued effort to strengthen our position in non-voice services in all markets. Increased efficiency in rolling out investments
new position, Chief Operations Executive (COE) has been created, also reporting to me. An operational structure below the COE will ensure adequate support for various size-based groupings of these operations. This will allow for appropriate sharing of best practice between businesses of similar scale.
I welcome the CEOs Karel Pienaar from South Africa and Brett Goschen from Nigeria onto the exco team and congratulate Ahmad Farroukh on his new role as COE. Finally a big thank you to the outgoing regional
VPs Jamal Ramadan, who will be retiring, and Ignatius Sehoole, who will join the business risk management team within the organisation.
Political unrest in the Middle East remains a concern and MTN continues to be sensitive to
Key to our vision is our customers

Group chief financial officer’s report
MTN delivered satisfactory financial results supported by a sound operational performance. The reduction in tariffs by competitors resulted in a change in traffic patterns impacting voice revenues. Data usage showed an upward trend compensating slower growth in voice revenues, while cost containment initiatives continued to gain momentum, allowing the Group to maintain a healthy EBITDA margin. This enabled MTN to increase returns to shareholders, taking the dividend yield to 5,2% from 3,7% a year earlier.
However, the strong rand against the US$ continued to negatively impact Group results. This is despite the weakening of the rand to the US$ in the second half of the year. The once-off profit impact on the sale of the Ghana towers has been separated in the analysis.
On 14 February 2012, Moody’s upgraded MTN’s global local currency senior unsecured rating to Baa2 from Baa3 and its national scale issuer rating to A1.za from A2.za. The outlook on all ratings is positive.
Considerations for the periodChanges in ownership
In August 2011, MTN settled the Nigeria put option through the
acquisition of the IFC interest and thereby increased its shareholding in the company from 76,08% to 78,83%.In October 2011, MTN increased its shareholding in MTN Rwanda from 55% to 80%.In April 2011, MTN reduced its shareholding in MTN Zambia from 90% to 86%. For IFRS consolidation purposes, the step down in equity shareholding has not impacted the proportionate consolidation at 97,8% as risks and rewards are not deemed to have passed to the purchaser.
In February 2011, MTN Rwanda sold its 70% investment in Supercell.
Put optionsAs detailed above, the Nigerian put option was settled in August 2011, resulting in movements of R254 million in finance costs, R266 million in fair value adjustments, R205 million in forex losses and R138 million in non-controlling interests’ share of profits. The much smaller Afghanistan put option resulted in R31 million of forex gains and R2 million in non-controlling interests’ share of profits in the current year.
CurrencyCurrency continued to have a meaningful impact on the results, reducing local currency growth rates when translated to rand. The average Nigerian naira exchange rate dropped 5% against the rand, the Iranian rial lost 5% and the Ghanaian cedi was 10% weaker.
The individual country analysis is covered in pages 38 to 47, giving more detail on individual country performance. A high-level review of the consolidated results follows.
MTN Group Limited Integrated Business Report for the year ended 31 December 201128
Nazir PatelGroup chief
financial officer

MTN Group Limited Integrated Business Report for the year ended 31 December 201129
Grou
p ov
ervi
ewPe
rform
ance
revi
ewOp
erat
iona
l and
fin
ancia
l rev
iew
Sust
aina
bilit
yFi
nanc
ial s
tate
men
tsSh
areh
olde
r inf
orm
atio
n
operations enjoyed local currency growth of 9,6%, 26,5% and 15,1% respectively. However, with approximately 68% of MTN’s earnings generated outside South Africa, the translation into rand of the 2011 results had a significant impact on final reported Group figures.
Revenue analysisRevenue increased by 6,3% as MTN grew its subscriber base by 16,2% to 164,5 million users. Revenue growth in local currencies continued to reflect more positively due to the dampening effect of a strong rand. In Nigeria, Iran and Ghana, MTN
The contribution of airtime and subscription revenue reduced to 65,5% from 68,4% for the prior year, mainly due to slower growth in Nigeria and Syria. Notwithstanding lower termination rates in some countries, total Group interconnect revenue increased by 8,9% as incoming traffic increased in Nigeria
and Ghana on increased competition. Interconnect revenue in South Africa bucked the trend, reducing 9,8% as termination rates declined in line with the predetermined glide path without a meaningful change in incoming traffic.
Profit analysis R million 2011 2010
Variance%
Airtime and subscription 79 854 78 400 1,9Interconnect 18 530 17 012 8,9Data 8 096 6 206 30,5SMS 7 501 6 570 14,2Mobile telephones and accessories 5 030 3 678 36,7Other 2 873 2 818 1,9
Total revenue 121 884 114 684 6,3
Other income 1 458 — —
Direct network operating costs 18 782 16 818 (11,7)Costs of handsets and other accessories 8 160 6 819 (19,7)Interconnect and roaming costs 13 395 12 593 (6,4)Employee benefits costs 6 754 5 961 (13,3)Selling, distribution and marketing expenses 14 805 14 741 (0,4)Other 6 696 10 215 34,4
Total costs 68 591 64 174 (6,9)
EBITDA 54 750 47 537 15,2EBITDA margin % 44,9% 41,5% 3,4 pct pointsMTN Zakhele costs — 2 973Profit from sale of Ghana towers 1 185 —EBITDA 53 565 50 510 6,0EBITDA margin % 43,9 44,0 (0,1) pct pointsCapex 17 717 19 466 (9,0%)
� RSA � Business Solutions � Nigeria� Iran� Syria � Other
7%4%4%
57%
15%
13%
Total revenue analysis
� Airtime and subscription� Interconnect � Data� SMS � Mobile handset and accessories � Other
2,44,1
6,2%
65,5%15,2%
6,6%
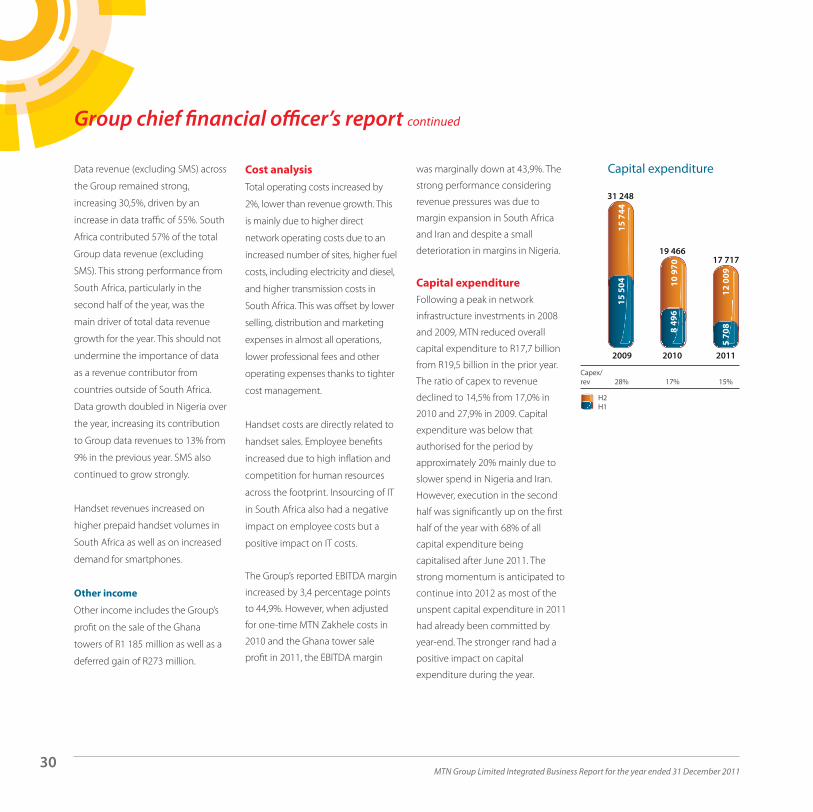
MTN Group Limited Integrated Business Report for the year ended 31 December 201130
Group chief financial officer’s report continued
Data revenue (excluding SMS) across
the Group remained strong,
increasing 30,5%, driven by an
increase in data traffic of 55%. South
Africa contributed 57% of the total
Group data revenue (excluding
SMS). This strong performance from
South Africa, particularly in the
second half of the year, was the
main driver of total data revenue
growth for the year. This should not
undermine the importance of data
as a revenue contributor from
countries outside of South Africa.
Data growth doubled in Nigeria over
the year, increasing its contribution
to Group data revenues to 13% from
9% in the previous year. SMS also
continued to grow strongly.
Handset revenues increased on
higher prepaid handset volumes in
South Africa as well as on increased
demand for smartphones.
Other income
Other income includes the Group’s
profit on the sale of the Ghana
towers of R1 185 million as well as a
deferred gain of R273 million.
Cost analysisTotal operating costs increased by
2%, lower than revenue growth. This
is mainly due to higher direct
network operating costs due to an
increased number of sites, higher fuel
costs, including electricity and diesel,
and higher transmission costs in
South Africa. This was offset by lower
selling, distribution and marketing
expenses in almost all operations,
lower professional fees and other
operating expenses thanks to tighter
cost management.
Handset costs are directly related to
handset sales. Employee benefits
increased due to high inflation and
competition for human resources
across the footprint. Insourcing of IT
in South Africa also had a negative
impact on employee costs but a
positive impact on IT costs.
The Group’s reported EBITDA margin
increased by 3,4 percentage points
to 44,9%. However, when adjusted
for one-time MTN Zakhele costs in
2010 and the Ghana tower sale
profit in 2011, the EBITDA margin
was marginally down at 43,9%. The
strong performance considering
revenue pressures was due to
margin expansion in South Africa
and Iran and despite a small
deterioration in margins in Nigeria.
Capital expenditureFollowing a peak in network
infrastructure investments in 2008
and 2009, MTN reduced overall
capital expenditure to R17,7 billion
from R19,5 billion in the prior year.
The ratio of capex to revenue
declined to 14,5% from 17,0% in
2010 and 27,9% in 2009. Capital
expenditure was below that
authorised for the period by
approximately 20% mainly due to
slower spend in Nigeria and Iran.
However, execution in the second
half was significantly up on the first
half of the year with 68% of all
capital expenditure being
capitalised after June 2011. The
strong momentum is anticipated to
continue into 2012 as most of the
unspent capital expenditure in 2011
had already been committed by
year-end. The stronger rand had a
positive impact on capital
expenditure during the year.
Capex/rev 28% 17% 15%
Capital expenditure
15 5
04 10 9
70
12 0
09
8 49
6
5 70
8
15 7
44
5 7
H2H1
2009 2010 2011
31 248
19 46617 717

MTN Group Limited Integrated Business Report for the year ended 31 December 201131
Grou
p ov
ervi
ewPe
rform
ance
revi
ewOp
erat
iona
l and
fin
ancia
l rev
iew
Sust
aina
bilit
yFi
nanc
ial s
tate
men
tsSh
areh
olde
r inf
orm
atio
n
Interest and tax
Net finance cost breakdown (Rm) 2011 2010
% change
Net finance costsNet interest paid 1 454 1 925 24,4Net forex losses 744 924 19,5Functional currency (gains)/losses (778) 1 223 163,6Put option 162 22 (686,4)
1 582 4 094 61,4
Tax table (Rm) 2011 2010%
change
Tax analysisSTC, WHT and CGT 2 580 1 450 (77,9)Deferred tax 1 089 1 984 45,1Normal tax 10 184 7 834 (30,0)Effective tax rate (%) 36,80 36,27 0,5 pct points
Net finance cost breakdown (Rm) 2011 2010
%change
Tax table (Rm) 2011 2010%
change
Net finance costs decreased sharply
due to functional currency gains of
R778 million compared with losses
of R1,2 billion in the prior year. A
weaker rand in the second half of
the year resulted in realised gains on
the conversion of currency.
The Group’s effective tax rate
increased marginally. The relatively
high effective rate was mainly the
result of the secondary tax on
companies on higher Group
dividends as well as withholding
taxes related to stronger flows of
cash from operations to the Group
and the Ghana tower sale taxes.
Earnings per shareAdjusted headline earnings per
share (HEPS) increased 43,2% to
1 070,0 cents when compared to
the prior year reported number of
747,0 cents. However, the increase in
the current year’s adjusted HEPS was
positively impacted by charges
associated with the implementation
of the MTN Zakhele scheme in the
prior year. If these charges were
excluded, prior year adjusted HEPS
would have been 909,1 cents,
reducing the current year’s growth
in adjusted HEPS to 17,7%.
Highlights of the statement of financial positionAssets and liabilities at 31 December
2011 were impacted by the
movement in year-end foreign
currency exchange rates, and in
particular the weakening of the rand
against the US$ to a closing rate of
8,07 versus 6,61 for the prior year.
Net cash increased meaningfully from
R904 million to R11 817 million mainly
due to an increase in cash balances in
Nigeria and Syria. Gross interest-
bearing liabilities remained largely the
same as in 2010. The Group’s cash and
cash equivalents increased to
R45,8 billion when investments in
treasury bills, foreign currency
deposits and bonds of R9 480 million
in certain subsidiaries are included in
the year-end cash balance. This was
mainly due to a reduction in the
capital expenditure in 2011 and
despite an increase in dividends and
the Company’s first buyback of shares
totalling R927,3 million. The ability to
utilise the strong consolidated
cashflow is limited by the Group’s
ability to upstream cash. There was
continued focus in gearing up
balance sheets of operating
companies. Although there is still
much to do in honing the capital
structure of the underlying
companies, strong upstreaming of
cash has enabled the Group to meet
a key objective of its financial
framework: greater returns to
shareholders.
Looking forwardMTN will continue to focus on
margin management. It will work to
offset slowing airtime revenue
growth by increasing the
contribution of data services, and
implementing cost-containment
strategies. MTN will also continue to
evaluate opportunities to share both
passive infrastructure as well as fibre.
This will promote the strategy of
monetising passive assets for cash in
some instances, as well as reduce
ongoing costs, with ancillary benefits
for the Group’s environmental
footprint. Finally, the ability to
continue to return cash to
shareholders at a Group level requires
attention to the capital structure of
the subsidiary companies and the
continued upstreaming of cash.
Nazir PatelGroup CFO
March 2012
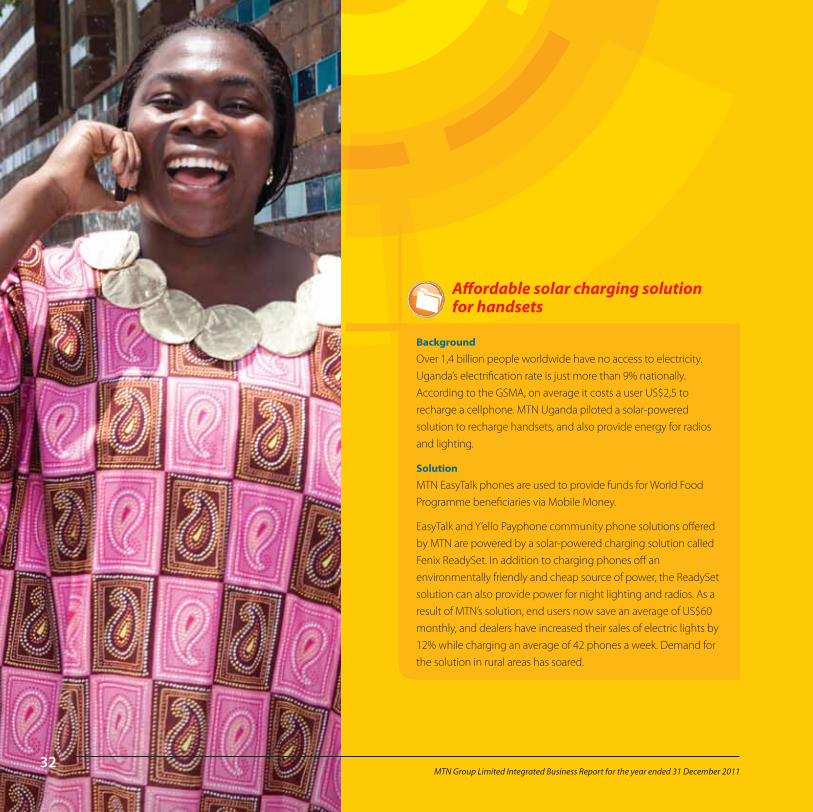
Background
Over 1,4 billion people worldwide have no access to electricity. Uganda’s electrification rate is just more than 9% nationally. According to the GSMA, on average it costs a user US$2,5 to recharge a cellphone. MTN Uganda piloted a solar-powered solution to recharge handsets, and also provide energy for radios and lighting.
Solution
MTN EasyTalk phones are used to provide funds for World Food Programme beneficiaries via Mobile Money.
EasyTalk and Y’ello Payphone community phone solutions offered by MTN are powered by a solar-powered charging solution called Fenix ReadySet. In addition to charging phones off an environmentally friendly and cheap source of power, the ReadySet solution can also provide power for night lighting and radios. As a result of MTN’s solution, end users now save an average of US$60 monthly, and dealers have increased their sales of electric lights by 12% while charging an average of 42 phones a week. Demand for the solution in rural areas has soared.
Affordable solar charging solution for handsets
MTN Group Limited Integrated Business Report for the year ended 31 December 201132
MTN Group Limited Integrated Business Report for the year ended 31 December 201133
Grou
p ov
ervi
ewPe
rform
ance
revi
ewOp
erat
iona
l and
fin
ancia
l rev
iew
Sust
aina
bilit
yFi
nanc
ial s
tate
men
tsSh
areh
olde
r inf
orm
atio
n
Five-year financial reviewOperational performance: South Africa
Operational performance: NigeriaOperational performance: Iran
Operational performance: GhanaOperational performance: Syria
Operational and financial review

MTN Group Limited Integrated Business Report for the year ended 31 December 201134
Five-year financial review
Financial information 2011 2010 2009 2008 2007
Income statement – extracts (Rm)Revenue 121 884 114 684 111 947 102 526 73 145EBITDA 54 750 47 537 46 063 43 166 31 845Operating profit 39 260 32 137 31 588 30 407 22 872Net finance costs (1 582) (4 094) (5 810) (1 917) (3 173)Income tax expense (13 853) (11 268) (8 612) (11 355) (7 791)Profit after tax attributable to– Equity holders of the Company 20 754 14 300 14 650 15 315 10 608– Non-controlling interests 3 033 2 527 2 511 1 820 1 308Headline earnings 19 811 14 011 14 869 15 603 10 886
Statement of financial position – extracts (Rm)Property, plant and equipment 71 610 63 361 67 541 64 193 39 463Goodwill 24 030 20 797 24 756 31 914 25 744Intangible assets 10 510 9 469 11 308 13 872 13 053Investments and loans 15 833 4 693 5 291 4 683 2 493Deferred tax assets 1 284 1 407 1 317 657 1 332Bank balances, deposits and cash 36 352 36 232 24 741 28 738 17 607Other current assets 20 969 18 002 21 283 26 049 15 894Non-current assets held for sale 820 825 — — —Total assets 181 408 154 786 156 237 170 106 115 586Attributable to equity holders of the Company 88 897 71 855 70 011 76 386 47 315Non-controlling interests 3 802 2 219 2 855 4 156 4 187Total equity 92 699 74 074 72 866 80 542 51 502Interest-bearing liabilities 34 016 35 328 36 917 41 590 33 657Non-interest-bearing liabilities 46 657 38 344 40 788 42 985 27 751Deferred tax liabilities 8 036 7 040 5 666 4 989 2 676Total liabilities 88 709 80 712 83 371 89 564 64 084Total equity and liabilities 181 408 154 786 156 237 170 106 115 586
Statement of cash flows (Rm)Cash generated from operations 50 277 50 536 49 632 44 836 34 334Net cash generated from operating activities 27 874 34 728 36 282 34 236 25 850Net cash used in investing activities (20 616) (15 701) (33 192) (27 177) (17 152)Net cash used in financing activities (12 033) (2 055) (926) 292 (2 135)Cash and cash equivalents 35 213 35 907 22 646 25 596 15 546Dividends paid to equity shareholders (11 722) (6 313) (3 381) (2 536) (1 675)Acquisition of property, plant and equipment (14 103) (15 343) (27 720) (26 896) (15 348)

MTN Group Limited Integrated Business Report for the year ended 31 December 201135
Grou
p ov
ervi
ewPe
rform
ance
revi
ewOp
erat
iona
l and
fin
ancia
l rev
iew
Sust
aina
bilit
yFi
nanc
ial s
tate
men
tsSh
areh
olde
r inf
orm
atio
n
Financial information 2011 2010 2009 2008 2007
Performance per ordinary shareBasic earnings (cents) 1 119,5 776,2 791,4 821,0 569,9Headline earnings (cents) 1 068,6 760,6 803,2 836,5 584,8Adjusted headline earnings (cents) 1 070,0 747,0 754,3 904,4 681,9Dividends (cents) 622 (9) 343,0 181,0 136,0 90,0Net asset value – book value (rands)(1) 47,2 38,1 38,2 41,0 25,4
Returns and profitability ratiosReturn on assets (%)(2) 23,3 20,7 19,4 21,3 21,5Return on average shareholders’ funds (%)(3) 24,6 19,8 20,3 25,2 25,3EBITDA margin (%) 44,9 41,5 41,1 42,1 43,5Enterprise value/EBITDA multiple (times)(4) 5,0 5,4 5,3 5,1 8,1Effective taxation rate (%) 36,8 40,1 33,4 39,9 39,5
Solvency and liquidity ratiosGearing (%)(5) (2,5) (1,2) 16,7 16,0 31,2Interest cover (times)(6) 5,9 5,2 2,6 3,5 4,6Dividend cover (times)(7) 1,7 2,2 4,2 4,6 4,3Net debt to EBITDA(8) — — 0,3 0,3 0,5Operating cash flow/revenue (%) 41,2 44,1 44,3 43,7 46,9
Share performanceNumber of ordinary shares in issue (million)– at year-end 1 885 1 885 1 841 1 868 1 865– weighted average during the year 1 854 1 842 1 851 1 865 1 862Closing price (cents per share) 14 373 13 442 11 790 10 850 12 806Market capitalisation (Rm) 270 904 253 318 216 999 202 385 238 806
Definitions(1) Ordinary shareholders’ interest divided by the number of ordinary shares in issue at year-end.(2) Profit from operations as a percentage of the average of the opening and closing balances of total assets.(3) Headline earnings as a percentage of the average of the opening and closing balances of ordinary shareholders’ interest .(4) Market capitalisation less net debt (interest-bearing liabilities less bank balances, deposits and cash) divided by EBITDA .(5) Net debt as a percentage of total equity.(6) Profit from operations divided by finance costs.(7) Headline earnings divided by total dividend.(8) Interest-bearing liabilities less cash, divided by EBITDA.(9) 2010 dividend paid in April 2011.

MTN Group Limited Integrated Business Report for the year ended 31 December 201136
Five-year financial review continued
Operational information 2011 2010 2009 2008 2007
South AfricaMobile penetration (%) 120 105 103 97 86Market share (%) 34 36 32 36 36Subscribers (million) 22 19 16 17 15ARPU (ZAR) 134 154 126 164 149EBITDA margin (%) 35 34 31 33 35Capex/sales (%) 11 11 18 15 10
NigeriaMobile penetration (%) 54 49 42 36 28Market share (%) 50 52 50 44 43Subscribers (million) 42 39 31 23 17ARPU (USD) 10 11 12 16 17EBITDA margin (%) 62 63 59 58 57Capex/sales (%) 18 14 31 30 24
GhanaMobile penetration (%) 78 67 61 50 33Market share (%) 52 53 55 55 52Subscribers (million) 10 9 8 6 4ARPU (USD) 7 7 8 12 15EBITDA margin (%) 50 44 45 46 51Capex/sales (%) 14 54 46 31 31
IranMobile penetration (%) 103 92 80 61 37Market share (%) 45 44 40 37 23Subscribers (million) 35 30 23 16 6ARPU (USD) 8 8 8 9 10EBITDA margin (%) 43 41 35 30 (13)Capex/sales (%) 11 18 44 56 116
SyriaMobile penetration (%) 58 50 46 38 26Market share (%) 46 45 45 46 46Subscribers (million) 6 5 4 4 2ARPU (USD) 14 16 18 19 17EBITDA margin (%) 26 24 20 28 35Capex/sales (%) 7 6 11 16 17
Operational information 2011 2010 2009 2008 2007

MTN Group Limited Integrated Business Report for the year ended 31 December 201137
Grou
p ov
ervi
ewPe
rform
ance
revi
ewOp
erat
iona
l and
fin
ancia
l rev
iew
Sust
aina
bilit
yFi
nanc
ial s
tate
men
tsSh
areh
olde
r inf
orm
atio
n
Background
The government of Ghana, in view of the new global trend in development and socioeconomic advancement, has demonstrated its commitment to the transformation of the agro-based economy into an information-rich and knowledge-based economy and society. This is to be achieved through enhancing training and learning and processing and dissemination of information through ICT offerings.
The government of Ghana within its ICT for accelerated development (ICT4AD) policy, and the growth and poverty reduction strategy II has undertaken a number of projects in collaboration with the United Nations Development Programme (UNDP) and other development partners to deploy ICT infrastructure and capacity building in creating knowledge-based societies.
Solution
MTN Ghana in partnership with the UNDP has established 10 ICT centres in the 10 regions of Ghana. The centres are aimed at complementing the government’s efforts to bridge the digital divide between the served and underserved communities and also to support the implementation of the new educational reform. The project is concentrating on reaching the deprived areas of Ghana that have no access to ICT infrastructure, capacity building and its related benefits.
MTN Group Limited Integrated Business Report for the year ended 31 December 201137
ICT literacy

Operational and financial performance review for the year ended 31 December 2011
MTN Group Limited Integrated Business Report for the year ended 31 December 201138
Profit analysis2011
Rm2010
Rm%
change
Airtime and subscription 20 106 19 297 4,2
Interconnect 5 924 6 568 (9,8)
Data 4 646 3 638 27,7
SMS 2 641 2 490 6,1
Mobile handsets and accessories 4 548 3 130 45,3
Other 732 700 4,6
Total revenue 38 597 35 822 7,7
Direct and network operating costs 2 767 2 569 (7,7)
Costs of handsets and other accessories 6 066 4 677 (29,7)
Interconnect and roaming 5 183 5 483 5,5
Employee benefits 2 099 1 767 (18,8)
Selling, distribution and marketing 7 147 6 794 (5,2)
Other expenses 1 744 2 345 25,6
Total operating costs 25 006 23 634 (5,8)
EBITDA 13 591 12 187 (11,5)
EBITDA margin (%) 35,2 34,0 1,2 pct points
Capex 4 105 3 908 5,0
Profit analysis2011
Rm2010
Rm%
change
3 00
0 2 89
4
2 81
3
1 01
4
1 29
2
3 03
4
1 2
1 0
Capex (R million)
H2H1 2009 2010 2011
6 034
3 908 4 105
13 0
44 15 4
77 18 1
99
3 02
3
3 36
5
3 83
4
3 3
Subscribers (’000)
PrepaidPostpaidARPU (R) 2009 2010 2011
16 067
18 842
22 033
145 15
2
134
Launched
June 1994Mobile penetration
120%Forecast market size in 2014
80 million
Market share
34,1%MTN shareholding
100%Population
50,9 million

MTN Group Limited Integrated Business Report for the year ended 31 December 201139
Grou
p ov
ervi
ewPe
rform
ance
revi
ewOp
erat
iona
l and
fin
ancia
l rev
iew
Sust
aina
bilit
yFi
nanc
ial s
tate
men
tsSh
areh
olde
r inf
orm
atio
n
offered retail clients enhanced information for work, life, learning and fun. MTN Business extended its data offerings to include solutions for air and water quality monitoring, as well as a number of telepresence, cloud computing and smart office management tools for corporate clients.
Eco-responsibility – MTN South Africa’s carbon footprint is 165 000 tonnes CO2e per annum. This has declined as a result of various initiatives and processes to actively reduce energy use and switch to alternative power. MTN is complementing its 2 MW tri-generation plant in Johannesburg, launched in 2010, with a 4 MW site in Pretoria. The company also has 22 off-grid solar, wind, biomass and hybrid BTS sites. Its holistic approach to network energy management includes smart metering, free cooling, battery monitoring and rapid site deployment.
Sustainable societies – MTN South Africa uses software filtering to address customer cyber security concerns. It has met its BBBEE targets for enterprise development, procuring goods from SMEs and has obtained a level 2 contributor rating from Empowerdex. In the year, it spent almost R48 million on community investment projects in education, health and the arts.
Performance overviewMTN South Africa performed well for the year, increasing its subscriber base by 16,9% to 22,0 million. This was mainly due to growth of the prepaid base by 17,6% to 18,2 million subscribers. The postpaid segment grew mainly in the second half of the year, increasing subscribers for the year by 14,0% to 3,8 million. Hybrid packages were the primary contributor to growth in this segment together with telemetry SIMs. SIM and revenue market share declined marginally in the first half of the year but recovered in the second half, with signs of an upward trend.
Total revenue increased 7,7% due to strong growth in data revenue, which was up 27,7% (excluding SMS), as well as growth in total airtime and subscriptions of 4,2%. Prepaid airtime and subscription revenue increased 14,0%. The 45,3% growth in handset revenue was a result of robust demand for both entry-level handsets and smartphones. Data revenue (excluding SMS) now contributes 12,0% of total revenue. At the end of the year, there were 5,5 million 3G devices on the network which included 3,6 million smartphones as well as 1,4 million dongles and other data devices. Interconnect revenue declined 9,8% following the reduction in mobile termination rates. Average revenue
per user per month (ARPU) reduced 12% primarily due to lower interconnect revenue and more lower-revenue SIMs, including telemetry.
MTN South Africa EBITDA margin increased 1,2 percentage point to 35,2% for the year. This was mainly the result of cost savings in general expenses, professional and consulting fees, as well as lower marketing and advertising costs.
Capital expenditure for the period was marginally ahead of the Group’s guidance at R4 105 million as MTN South Africa continued to modernise the network by introducing IP technology to improve network quality. There were 313 2G and 598 3G base transceiver stations (BTS) added during the year, bringing the total BTSs to 9 785. Fibre rollout remains a priority with the national long-distance fibre project still underway. At the end of December, 89% of the Johannesburg to Durban route was trenched, as was 86% of the Johannesburg to Bloemfontein route and 58% of the Bloemfontein to Cape Town route. MTN South Africa has embarked on a pilot of 103 long-term evolution (LTE) base stations in line with its future LTE deployment strategy.
Regulatory update MTN has met the Regulation of Interception of Communications Related Information Act which required all subscribers to register their personal details by June 2011. By the deadline, MTN South Africa had registered more than 90% of its subscriber base.
ICASA introduced radio frequency regulations in the year which was followed by an invitation to apply for the high demand 2,6GHz and 800MHz frequency band spectrum needed to offer LTE services. MTN has submitted comments, although the spectrum allocation decision has been delayed by ICASA.
In March 2011, MTN reduced its termination rates in line with the call termination regulations glide path to 73 cents from 89 cents.
SustainabilitySustainable economic value – MTN South Africa’s effective BEE ownership is more than 44% mainly through the MTN Zakhele scheme. MTN South Africa focused on data integration solutions in 2011, offering value-added solutions such as the MTN Opera Mini Browser for faster downloads and Pay-D, which enables mobile phones to be used as point of sales terminals for online debit card purchases. Through MTN Play, it

MTN Group Limited Integrated Business Report for the year ended 31 December 201140
Operational and financial performance review continued for the year ended 31 December 2011
MTN Group Limited Integrated Business Report for the year ended 31 December 201140
Profit analysis2011
Rm2010
Rm%
changeLC%
change
Airtime and subscription 27 750 28 194 (1,6) 3,7
Interconnect 4 223 2 864 47,5 54,5
Data 1 064 538 97,8 105,3
SMS 1 036 1 009 2,7 7,8
Mobile handsets and accessories 78 126 (38,1) (34,3)
Other 728 761 (4,3) 0,2
Total revenue 34 879 33 492 4,1 9,6
Direct and network operating costs 3 652 3 455 (5,7) (11,1)
Costs of handsets and other accessories 785 763 (2,9) (7,9)
Interconnect and roaming 2 268 1 868 (21,4) (27,2)
Employee benefits 1 027 1 004 (2,3) (7,7)
Selling, distribution and marketing 3 449 3 445 (0,1) (4,7)
Other expenses 2 162 1 878 (15,1) (23,8)
Total operating costs 13 343 12 412 (7,5) (13,2)
EBITDA 21 536 21 080 2,2 7,4
EBITDA margin (%) 61,7 62,9 1,2 pct points
Capex 6 331 4 700 34,7 29,0
Profit analysis2011
Rm2010
Rm%
changeLC%
change
30 8
2711
,9
10,6
9,7
38 6
69
41 6
419,
7
Subscribers (’000)
2009 2010 2011MTN subscribersARPU (US$)
5 70
3 2 16
8 4 26
3
2 53
2
2 06
8
4 51
9
2
2
Capex (R million)
H2H1 2009 2010 2011
10 222
4 700
6 331
Launched
August 2001
Market share
50%
Mobile penetration
54%Forecast market size in 2014
107,4 million
MTN shareholding
79%Population
157 million

MTN Group Limited Integrated Business Report for the year ended 31 December 201141
Grou
p ov
ervi
ewPe
rform
ance
revi
ewOp
erat
iona
l and
fin
ancia
l rev
iew
Sust
aina
bilit
yFi
nanc
ial s
tate
men
tsSh
areh
olde
r inf
orm
atio
n
Performance overviewMTN Nigeria faced a challenging year with aggressive price competition and mandatory SIM registration process. This had a negative impact on gross connections for the entire market. Network quality again became a focus area for the regulator as higher elasticity from lower pricing impacted traffic demand across almost all of the networks. Notwithstanding these challenges, the company increased its subscriber base by 7,7% to 41,6 million and ended the year with a more stabilised market share of 50%. There is no clarity on the deadline for SIM registration although the regulator has initiated a process to form a central database of registration records.
Total naira revenue increased 9,6% mainly driven by a 54,5% increase in interconnect revenue. This was a result of continued changes in traffic patterns during the year as cheaper off-network prices were offered tactically by the competition. More competitive tariffs by MTN in the second half of the year have partially stabilised the traffic mix. Data revenue (excluding SMS) grew 105% as more data packages were introduced to the market. MTN Nigeria has 1,7 million smartphones and 330 000 dongles on the network. Airtime and subscription revenue increased only 3,7% due to a reduction in effective tariffs which was not fully
compensated by a proportionate increase in minutes of use. ARPU declined by 8,1% to $9,7 and by 5,3% in local currency terms.
MTN Nigeria’s EBITDA margin declined by 1,2 percentage points to 61,7% when compared to the prior year. Higher operating costs were mainly the result of a 25% increase in the average diesel price as well as increased site rental and SIM registration costs (professional fees).
The marginally weaker naira against the rand negatively impacted rand reported revenue growth for the year resulting in only a 4,1% increase in revenue to R34 879 million. Reported EBITDA increased 2,2% to R21 536 million.
Network rollout improved in the second half of the year, with the company adding 529 2G and 453 3G BTSs in the year bringing the total number of BTS’s to 9 131. Capital expenditure amounted to R6 331 million compared to R4 700 million in 2010. Corrective action and measures have been put into place to ensure that capital expenditure programmes are delivered more effectively. MTN Nigeria rolled out an additional 1 312 km of fibre in the year and connected fibre to 90 sites in support of its data strategy.
Regulatory updateAmong the regulatory highlights in the year, MTN Nigeria secured
approval for a new mobile number range as well as permission to build new sites in over 150 locations.
The NCC enhanced its monitoring of mobile operators’ quality of service (QoS) and issued letters to three mobile operators including MTN, expressing concern and potential implications of poor QoS in late 2011. MTN Nigeria has improved network quality since and has put measures in place to ensure quality is fast tracked and maintained. This was acknowledged by the authority.
By year-end, in line with regulations, MTN Nigeria had successfully registered the personal details of over 34 million subscribers, representing over 83% of the active subscriber base.
Nigerian regulations limit the role of telecommunications companies in mobile payments. However, MTN continues to engage with the NCC and the central bank to find a commercial solution. It is also engaging on plans for the implementation of mobile number portability and the ongoing review of the national telecoms policy.
SustainabilitySustainable economic value – MTN launched MTN Mobile Money in Lagos in the year, using a slightly different model. This will ultimately be extended across the country in 2012 to help address access to financial services. Nigeria is the
largest social media user on the continent, and mobile phones facilitate this. MTN’s Opera Mini Browser has been taken up widely, with some customers reporting substantial reductions in their data costs .
Eco-responsibility – MTN Nigeria depends on diesel to operate its base stations. Its carbon footprint is 460 tonnes CO2e p.a. However, it has embarked on a drive to reduce this dependency by introducing hybrid power solutions for generators and connecting 1 000 rural base stations to the national power grid. 254 sites have so far been connected, saving over 1 300 litres of diesel a month. MTN has reduced the number of staff vehicles, introducing new buses and more bus routes for staff in an effort to reduce carbon emissions. MTN uses biodegradable recharge cards.
Sustainable societies – MTN Bizlift supports more than 53 000 SME retailers with business ideas and access to finance and sales material. MTN Village Phone has helped more than 4 500 vendors, mostly women, benefit from selling airtime. In 2011, MTN Nigeria invested more than R39 million on education, health and enterprise development. It has developed various policies to support the company’s zero-tolerance approach to corruption.

Operational and financial performance review continued for the year ended 31 December 2011
Operational and financial performance review continued for the year ended 31 December 2011
MTN Group Limited Integrated Business Report for the year ended 31 December 201142
Profit analysis 2011
Rm2010
Rm%
changeLC%
change
Airtime and subscription 5 704 4 895 16,5 22,8
Interconnect 2 434 2 306 5,6 11,4
Data 285 178 60,1 66,5
SMS 2 285 1 633 39,9 47,0
Mobile handsets and accessories — — — —
Other 342 189 81,0 89,9
Total revenue 11 050 9 201 20,1 26,5
Direct and network operating costs 3 761 3 108 (21,0) (27,1)
Costs of handsets and other accessories 135 118 (14,4) (21,9)
Interconnect and roaming 1 439 1 134 (26,9) (33,5)
Employee benefits 133 118 (12,7) (19,1)
Selling, distribution and marketing 534 534 — (5,2)
Other expenses 351 404 13,1 6,3
Total operating costs 6 353 5 416 17,3 (23,6)
EBITDA 4 697 3 786 24,1 30,5
EBITDA margin (%) 42,5 41,3 1,2 pct points
Capex 1 168 1 661 (29,7) (27,2)
All numbers reflect MTN’s 49% share other than subscriber numbers.
Profit analysis2011
Rm2010
Rm%
changeLC%
change
29 7
43
23 2
60
34 6
81
Subscribers (‘000)
MTN subscribersARPU (US$) 2009 2010 2011
7,8
7,8 7,9
1 04
4 765
755
896
413
2 28
2
Capex (R million)
H2H1 2009 2010 2011
3 326
1 661
1 168
Launched
October 2006
Market share
45%
Mobile penetration
103%Forecast market size in 2014
74,6 million
MTN shareholding
49%Proportionately consolidated
Population
74,6 million

MTN Group Limited Integrated Business Report for the year ended 31 December 201143
Grou
p ov
ervi
ewPe
rform
ance
revi
ewOp
erat
iona
l and
fin
ancia
l rev
iew
Sust
aina
bilit
yFi
nanc
ial s
tate
men
tsSh
areh
olde
r inf
orm
atio
n
Performance overviewMTN Irancell delivered a sound performance, increasing its subscriber base by 16,6% in a market where penetration increased to above 100%. The growth was mainly attributable to lower denomination vouchers and seasonal promotions, increasing market share to 45%. The improved distribution of airtime through ATMs has also contributed to higher spend by subscribers.
Total rial revenue grew 26,5% for the year. Airtime and subscription revenue increased 22,8% while interconnect revenue increased 11,4% as the quality of the network improved. Data revenue (excluding SMS) gained momentum, increasing 66,5% off a low base. SMS revenue growth remained robust at 47,0%. ARPU increased by 2,0% to $7,9 and by 5,6% in local currency terms.
The EBITDA margin showed a healthy expansion of 1,2 percentage points to 42,5% as MTN Irancell continues to maintain a low operating cost base. Distribution and commission costs also reduced as physical recharge vouchers were
replaced by logical airtime distribution. These savings were partially reduced by a large increase in rent and utilities following the removal of government subsidies and the increase in fuel prices.
A weaker rial resulted in lower rand reported revenue growth of 20,1% and EBITDA growth of 24,1%.
MTN Irancell continued to invest in its network, improving quality and capacity although rollout of some projects has been slower than anticipated because of delayed equipment delivery. MTN Group’s share of capital expenditure amounted to R1 168 million, lower than that guided at the time of the interim results. Population and geographic coverage increased to 77% and 23% respectively. Seven hundred and eighty-one 2G BTSs were added in the year bringing the total to 7 640.
Regulatory updateMTN Irancell maintained its active engagement with the authorities in the year as it continues to seek clarity from the authorities on
issues such as the right to provide 3G services.
During the second half of the year, the company received additional number ranges required to meet demand. Although a licence was issued to a third mobile operator in 2010, this new entrant only launched its services in a limited area late in 2011.
SustainabilitySustainable economic value – Electronic airtime charging, e-shopping and m-health are some of the value-added solutions offered over MTN Irancell’s GPRS and WiMax infrastructure.
Eco-responsibility – MTN Irancell’s carbon footprint is 89,9 tonnes CO2e per annum. Most sites are powered by the national grid, and only a few sites run on diesel generators. In an effort to reduce emissions and extend services in rural areas, MTN Irancell has invested in 35 off-grid sites, 25 of which use solar power. In one district, GPRS power meters are used to report energy consumption remotely. MTN Irancell is also
making greater use of outdoor network sites, switching off lights after hours and using free cooling and site insulation to manage heat and cooling exchanges.
Sustainable societies – MTN Irancell addresses health and safety through random audits of EMF at network sites, by avoiding building sites close to schools and hospitals, and ensuring compliance with health and safety rules. MTN encourages enterprise growth through its local empowerment procurement plan. All recharge vouchers and SIM cards are sourced locally.

Operational and financial performance review continued for the year ended 31 December 2011
Operational and financial performance review continued for the year ended 31 December 2011
MTN Group Limited Integrated Business Report for the year ended 31 December 201144
Profit analysis2011
Rm2010
Rm%
changeLC%
change
Airtime and subscription 4 255 4 089 4,0 13,9
Interconnect 1 264 1 023 23,5 35,1
Data 180 109 65,1 79,7
SMS 149 288 (48,3) (43,4)
Mobile handsets and accessories 24 62 (61,3) (56,9)
Other 69 79 (12,7) 0,6
Total revenue 5 941 5 651 5,1 15,1
Other income* 1 957
Direct and network operating costs 788 624 (26,3) (37,1)
Costs of handsets and other accessories 159 266 40,4 34,4
Interconnect and roaming 1 009 689 (46,4) (60,1)
Employee benefits 359 334 (7,5) (16,9)
Selling, distribution and marketing 607 647 6,2 (2,3)
Other expenses 847 588 (44,2) (46,3)
Total operating costs 3 769 3 147 (19,8) (28,4)
EBITDA 4 129 2 503 64,9 (1,4)
EBITDA margin (%) 69,5 44,3 25,2 pct points
Capex 851 3 092 (72,7) (70,1)
*Other income is 100% profit from sale of the Ghana towers.
Profit analysis2011
Rm2010
Rm%
changeLC%
change
8 00
1
8 72
1 10 1
56
Subscribers (’000)
MTN subscribersARPU (US$) 2009 2010 2011
7,7
7,2
7,0
1 17
5
1 68
8
714
1 40
4
137
1 41
1
Capex (R million)
H2H1 2009 2010 2011
2 586
3 092
851
Launched
November 1996
Market share
52%
Mobile penetration
78%Forecast market size in 2014
25 million
MTN shareholding
98%Population
25 million

MTN Group Limited Integrated Business Report for the year ended 31 December 201145
Grou
p ov
ervi
ewPe
rform
ance
revi
ewOp
erat
iona
l and
fin
ancia
l rev
iew
Sust
aina
bilit
yFi
nanc
ial s
tate
men
tsSh
areh
olde
r inf
orm
atio
n
Performance overviewMTN Ghana delivered a solid performance as subscribers increased by 16,5% to 10,2 million. This was mainly attributable to attractive promotions including bonus on recharge offers which included “weekend super saver” and a “10 million subscriber promo”. Market share declined marginally to 52% from 53% but is considered satisfactory given the very competitive nature of the market.
Total cedi revenue increased 15,1% for the year. This was mainly due to a 13,9% increase in airtime and subscription revenue and a 35,1% increase in interconnect revenue. Data revenue (excluding SMS) continued to gain traction, albeit off a low base, increasing 79,7%, while SMS revenue decreased 43,4% due to regulatory requirements to change SMS promotions. ARPU declined 2,8% to $7,0 while in local currency ARPU increased 3,5%.
MTN Ghana’s EBITDA margin, excluding the profit from the sale of the towers, decreased 6,2 percentage points to 36,6% in rands and 38,1% in local currency as interconnect costs rose more than interconnect revenue due to competitive off-network tariffs. EBITDA margin was also negatively impacted by an increase in
transmission and utility costs. Although there was an increase in lease costs, the full impact of the new tower arrangements will only be incurred in 2012.
A weaker cedi against the dollar resulted in a lower rand reported revenue growth of 5,1% to R5 941 million while EBITDA decreased 13,2% to R2 172 million, excluding the sale of the towers.
Capital expenditure for the period amounted to R851 million. The lower spend was mainly due to the change in structure following the establishment of the tower company. 430 2G and 125 3G BTS’s were rolled out for the period. The company continued to prioritise capacity and quality on the network as traffic increased, although quality of service remains a challenge.
Regulatory updateIn the year, mobile number portability regulations were passed into law.
In line with subscriber registration regulations, MTN Ghana registered the details of more than 10 million subscribers, representing 99% of its total users by year end.
In November, the Ghana Telecom Chamber was launched to represent the industry. It continues to pursue
cases filed against some metropolitan centres for what mobile operators consider to be arbitrary business operating permit fees.
The National Communications Authority (NCA) imposed penalties on all operators for what it said was a failure to meet network performance indicators. Operators paid the fines, but continue to dispute the methodologies adopted by the NCA in measuring quality of service. A communication service tax on local interconnect charges, also considered a form of double taxation, is also being contested.
In December, the NCA announced new interconnect rates effective 2012 to 2014. These rates are lower for the two smallest operators in the market until the end of 2014.
SustainabilitySustainable economic value – by developing affordable and innovative ICT services, MTN Ghana makes a socio-economic difference while growing its revenues. Among these are MTN Mobile Money, m-health, MTN Zone, m-insurance, MTN Opera Mini Browser, m-agriculture, a telecoms management solution for refugee crises and natural disasters, and community payphones. It also has a partnership with the UN to
distribute credit for food using mobile phones powered by solar and other kinetic (bicycle) power. It continues to roll out 3G technologies.
Eco-responsibility – although MTN Ghana has outsourced its network sites, the company continues to account for the energy and carbon intensity of these sites. Its carbon footprint is 31,7 tonnes CO2e per annum.
Sustainable societies – MTN Ghana invested over R32 million on various initiatives in health and education and national priority areas such as environmental conservation in 2011. It won the Group’s 21 Days of Y’ello Care trophy for its employee volunteering programme which centred on the goals of the UN International Year of Sustainable Forestry. It used TV game shows and other media to build awareness of this issue.

MTN Group Limited Integrated Business Report for the year ended 31 December 2011
Operational and financial performance review continued for the year ended 31 December 2011
Operational and financial performance review continued for the year ended 31 December 2011
MTN Group Limited Integrated Business Report for the year ended 31 December 201146
Profit analysis2011
Rm2010
Rm%
changeLC%
change
Airtime and subscription 5 016 5 373 (6,6) (1,2)
Interconnect 480 497 (3,4) 2,5
Data 331 297 11,4 17,0
SMS 475 447 6,3 11,8
Mobile handsets and accessories 8 8 — 4,7
Other 153 192 (20,3) (15,1)
Total revenue 6 463 6 814 (5,2) 0,3
Direct and network operating costs 3 570 3 719 4,0 (1,6)
Costs of handsets and other accessories 18 69 73,9 70,2
Interconnect and roaming 361 442 18,3 13,6
Employee benefits 209 213 2,2 3,0
Selling, distribution and marketing 119 263 54,5 51,0
Other expenses 496 503 1,5 (4,1)
Total operating costs 4 773 5 210 8,4 3,0
EBITDA 1 690 1 604 5,4 11,1
EBITDA margin (%) 26,2 23,5 2,7 pct points
Capex 449 410 9,5 12,1
Profit analysis2011
Rm2010
Rm%
changeLC%
change
4 24
9 4 89
8 5 71
6
Subscribers (’000)
MTN subscribersARPU (US$) 2009 2010 2011
17,8
16,4
13,9
386
230
363
180
86
362
Capex (R million)
H2H1 2009 2010 2011
748
410 449
8
Launched
June 2002
Market share
46%
Mobile penetration
58%Forecast market size in 2014
17,6 million
MTN shareholding
75% (BOT)
Population
22,5 million

MTN Group Limited Integrated Business Report for the year ended 31 December 201147
Grou
p ov
ervi
ewPe
rform
ance
revi
ewOp
erat
iona
l and
fin
ancia
l rev
iew
Sust
aina
bilit
yFi
nanc
ial s
tate
men
tsSh
areh
olde
r inf
orm
atio
n
Performance overviewMTN Syria’s performance was
dampened by the civil unrest in the
country. The company increased
its subscriber base by 16,7% to
5,7 million, marginally increasing
market share to 46%.
Revenue in Syrian pounds remained
flat as airtime and subscription
revenue declined 1,2% as a result
of the challenges of providing
continuous network service.
Data revenue (excluding SMS)
increased 17,0% while SMS revenue
increased 11,8%.
The EBITDA margin increased
2,7 percentage points to 26,2%. This
was mainly due to lower distribution
and commission costs associated
with reduced sales and tighter cost
management.
Rand reported revenues showed a
decline of 5,2% to R6 463 million
while EBITDA grew 5,3% to
R1 690 million. These results were
also negatively impacted by a
weaker Syrian pound against the
rand. Capital expenditure for the
period amounted to R449 million.
Regulatory updateThe telecoms industry in Syria is
heavily regulated. MTN Syria works
under a build operate transfer (BOT)
arrangement, with conversion to a
freehold mobile operator’s licence
due to have taken place in 2011 but
delayed because of the political
unrest in the country.
The high level of revenue share (50%
of gross revenue) under the BOT
arrangement limits MTN Syria’s
ability to reduce tariffs, which means
costs must be tightly managed. This
also impacts the company’s ability
to acquire new subscribers from the
lower-income segments.
SustainabilitySustainable economic value – MTN
Syria is working to make 3G services
available in most parts of the country
and is deploying large-capacity
microwave and fibre optic links to
transmission nodes. The company is
looking at alternatives to facilitate
customers’ payments for water and
electricity services.
Eco-responsibility – MTN Syria’s
carbon footprint is 18,1 tonnes CO2e
per annum and the company is
working to reduce its energy use.
This includes converting most
indoor BTS and terminal and
sub-hub sites to outdoor sites, using
smart battery backup systems which
use less fuel, and testing new
shelters for transmission sites. MTN
Syria is also researching solar power
solutions. It has implemented a
number of programmes to reduce
the environmental impact of its
facilities, including better
management of generators after
hours, warehouse electrical load loss
management and installing LED
lights at its new head office.
Sustainable societies – MTN Syria is a
member of the UN Global Compact.
An anonymous tipoff service is in
place in support of the company’s
zero-tolerance approach to fraud
and corruption. MTN Syria’s equality
and diversity policy has led to
women making up 36% of
employees, and in 2012 it will
View the report at org/COPs/detail/12966
extend employee benefits to
include child care facilities or
subsidies. While working within the
centralised Group procurement
structures, local businesses also have
an opportunity to supply certain
items to support the growth of local
employment.

MTN Group Limited Integrated Business Report for the year ended 31 December 201148
DIVIDER
Mobiles for food aid
Background
The post-election turmoil in Côte d’Ivoire had a particularly significant impact on the food security of poor communities.
Solution
MTN has partnered with the UN World Food Programme (WFP) to pilot a solution which uses mobile technology to transfer funds to purchase food to families in poor districts. Some 10 000 SMS alerts have let beneficiaries know that they have received credits, of US$75 a household a month, to buy food. During the pilot, some 54 000 people received food aid in this way, and the WFP indicated that this innovative method of payment was particularly suitable for low-income households.
MTN Group Limited Integrated Business Report for the year ended 31 December 201148
MTN Group Limited Integrated Business Report for the year ended 31 December 201149
Grou
p ov
ervi
ewPe
rform
ance
revi
ewOp
erat
iona
l and
fin
ancia
l rev
iew
Sust
aina
bilit
yFi
nanc
ial s
tate
men
tsSh
areh
olde
r inf
orm
atio
n
Governance highlightsPeople and remuneration reportSocial and environmental report
Sustainability

Governance structureThis section provides an overview of the Group’s revised governance structure. This structure is also the basis for governance in major MTN subsidiaries. The governance structures of other subsidiaries are currently being reviewed for alignment with the revised operating structure.
Audit committee: AF van Biljon, NP Mageza, MJN Njeke, JHN Strydom, J van RooyenRisk management, compliance and corporate governance committee: J van Rooyen, KP Kalyan, NP Mageza, MLD Marole, MJN Njeke, JHN StrydomNominations committee: MC Ramaphosa, A Harper, AT Mikati, AF van Biljon Social and ethics committee: KP Kalyan, NP Mageza, MLD Marole, JHN Strydom, J van Rooyen Remuneration and human resources committee: A Harper, AT Mikati, MC Ramaphosa, JHN StrydomExecutive committee (previously known as Group executive committee): RS Dabengwa, CM de Faria, JA Desai, S Fakie, A Farroukh, B Goschen, PD Norman, NI Patel, KW Pienaar, J Ramadan, I Sehoole, KL Shuenyane Group tender committee: WA Nairn, A Farroukh, F Laher, NI Patel, J Ramadan, I Sehoole
Governance highlights
Boardcommittees
Management forums/ Departments
Internalaudit/business risk
management
Talent board
Operations committee
Tier II tender committee
Group Board
s
Risk management,
compliance and corporate
governance
NominationsRemuneration
and human resources
Executive Group tenderSocial and ethicsAudit
MTN Group Limited Integrated Business Report for the year ended 31 December 201150

MTN Group Limited Integrated Business Report for the year ended 31 December 201151
Grou
p ov
ervi
ewPe
rform
ance
revi
ewOp
erat
iona
l and
fin
ancia
l rev
iew
Sust
aina
bilit
yFi
nanc
ial s
tate
men
tsSh
areh
olde
r inf
orm
atio
n
MTN strives to maintain and enhance sound governance practices which are reflective of prevailing international governance trends and the evolving legislative landscape in South Africa. These practices are founded on values of responsibility, accountability, fairness and transparency.
Current year’s initiativesDuring 2011, the key focus was the ongoing review of the Group’s corporate governance framework in line with King III, the JSE Listings Requirements and the Companies Act.
With the mandate of the audit committee, the Group engaged PricewaterhouseCoopers Inc. to undertake a review of MTN’s Integrated Business Report for 2010 and the disclosure framework applied therein. This exercise was performed to identify gaps in disclosure and to highlight best practice disclosure requirements that could be considered from the 2011 reporting cycle onwards. Many of the areas identified for improvement have subsequently been addressed.
MTN also acquired a Governance Assessment Toolkit from the Institute of Directors Southern Africa to facilitate a desktop assessment of the Group’s position in relation to compliance and alignment with the dynamic governance landscape in which the Group operates.
Key compliance achievements
Social and ethics committee The committee has been established, and the inaugural meeting was held in early 2012. The committee’s terms of reference were adopted by the board in the first quarter of 2012.
Existing board committees The board has reviewed and approved a new structure of board committees, which was implemented in the first quarter of 2012. Refer to the Governance structure on page 50. All committees’ terms of reference have been reviewed and adopted by the board in the first quarter of 2012.
Board charter The charter is under review for adoption in 2012.
Review of governance policies Amongst others, the following policies were reviewed:The insider trading policy has been split into two: (a) the insider trading policy to ensure that the Group is compliant with all applicable laws and regulations governing insider trading; and (b) the share dealing policy which ensures more rigorous restrictions on dealings by directors and the company secretary of MTN and its major subsidiaries . These policies will be tabled for adoption in 2012.Other policies that were revised in anticipation of adoption in 2012 were the code of ethics, those relating to prescribed officers, board appointments, independent professional advice and disclosure.
Prescribed officers Prescribed officers have been designated and the policy is being finalised for adoption by the board in 2012. The members of the executive committee (Exco) have been designated as prescribed officers. These designations will be reviewed on an ongoing basis.
Alignment of memorandum of incorporation with the Companies Act
The board has constituted a sub-committee charged with the responsibility of reviewing the current memorandum of incorporation for alignment with the Companies Act.
Lead independent director (LID) Although the chairman of the board is an independent non-executive director, for the first time a lead independent non-executive director of MTN was appointed with effect from 14 March 2011. The position was created to further embed the culture of independence of the board of directors especially in instances of perceived conflict of interest.
Educating directors, prescribed officers and other relevant staff on the provisions of the Companies Act, King III and JSE Listings Requirements
Numerous sessions were held during 2011 to educate and familiarise directors and officers with the Companies Act and other governance instruments. The sessions were facilitated by independent external advisers and management.

MTN Group Limited Integrated Business Report for the year ended 31 December 201152
Governance continued
Although MTN has made significant progress to ensure that King III principles
are applied, the following principles were not fully applied:
Principle 2.19 – Directors should be appointed through a formal process:
Although MTN’s appointment of
directors is transparent and
considered by the full board, it
does not have a formal policy in
this regard. A formal policy will be
introduced in 2012.
Principle 2.25 – Shares and options should not vest or be exercisable within three years from the date of grant:
The vesting periods for all MTN’s
performance share plan (PSP)
awards vest after three years.
However, the vesting period for
the June 2011 PSP awards to a
certain category of employees
who qualified for allocations as at
November 2010, was reduced to
a once-off 30 months.
Board overview and responsibilitiesThe MTN Group has a unitary board
structure comprising a majority
of independent non-executive
directors. The MTN Group board
retains full and effective control over
the Group and is responsible, inter
alia, for the adoption of strategic
plans, the monitoring of operational
performance and management, and
the development of appropriate and
effective risk management policies
and processes. The full extent of the
board’s responsibilities is contained
in an approved board charter. The
directors are of the opinion that
they have adhered to the terms of
reference as detailed in the board
charter for the financial year under
review. Directors’ profiles appear on
pages 16 and 19 of this report.
The roles and duties of the
non-executive chairman and the
Group president and CEO are
separated and clearly defined. This
division of responsibilities ensures a
balance of authority and power,
with no individual having
unrestricted decision-making
powers.
For further details on responsibilities
of board members, please refer to the
detailed governance report which is
available at www.mtn.com.
Group company secretaryThe company secretary is a central
source of information and advice to
the board and within the Company
on matters of ethics, good
governance and compliance with
rules, regulations and best practice.
This is done through the
implementation of policies which
are communicated and monitored.
The Company also ensures that the
board is aware of its legal duties. The
company secretary is not a director
of the Group and has an arm’s
length relationship with the board
and the directors.
Board appointments and rotationThe nominations committee
considers and recommends new
appointments to the board.
The directors undergo a formal
induction programme which
outlines their fiduciary duties
and provides an in-depth
understanding of the Group and its
operations. Directors are subject to
retirement by rotation at least once
every three years and avail
themselves for re-election, in
accordance with the Company’s
memorandum of incorporation.
Independence of directorsDetermination of independence
is guided by the King Code on
Governance for South Africa, the
Companies Act, the JSE Listings
Requirements and accepted
corporate practice.
The board of directors, in the period
under review, adopted a policy in
line with common practice and
King III that a non-executive director
who has served at least a nine-year
term should be subject to a rigorous
annual re-appointment process.
Board effectiveness and evaluationAn internal questionnaire-based
evaluation of the board, its
committees and individual directors
was performed during the year

MTN Group Limited Integrated Business Report for the year ended 31 December 201153
Grou
p ov
ervi
ewPe
rform
ance
revi
ewOp
erat
iona
l and
fin
ancia
l rev
iew
Sust
aina
bilit
yFi
nanc
ial s
tate
men
tsSh
areh
olde
r inf
orm
atio
n
under review. The evaluation
covered the size and composition of
the board; directors’ induction and
development effectiveness and the
independence of the chairman; the
relationship of the board and
management; stakeholder relations;
board meetings; the effectiveness
of committees; skills needed at the
board; visible corporate governance;
and peer evaluation.
The overall outcome of the
evaluation was acceptable and
the board is satisfied with the
independence of the independent
non-executive directors, including
that of the chairman and the LID
who have each served on the board
for at least nine years. Although the
evaluation results were satisfactory,
areas for improvement were
identified. These include, amongst
others, enhancement of board
composition by considering
appointment of members with
industry background; director
selection and appointment; director
development; and succession
planning at board level. The areas of
improvement are being addressed
by the chairman, LID and the
company secretary.
The evaluation of the board by
an external service provider is
performed every two years and
will next be undertaken in 2012.
Succession planningBoard succession is being addressed.
The board, through the nominations
committee, is performing a
comprehensive assessment of the
skills base in the current board of
directors. This will facilitate board
succession planning to ensure that
the board has the requisite skills for
transitioning in the next three to
five years.
During 2011, an executive
succession list was considered and
supported by the board through the
former nominations, remuneration,
human resources and corporate
governance committee.
Board committeesThe MTN Group board recognises
that it is ultimately accountable and
responsible for the performance and
affairs of the Group and that the
issue of delegated authorities to
board committees and
management in no way absolves
the board and its directors from the
obligation to carry out their fiduciary
duties and responsibilities. All board
committees, as detailed in the
graphic on page 50, operate under
written terms of reference approved
by the board. Each committee’s
authority and the discharge of its
responsibilities are directed by a
charter. All committee chairpersons
also provide the board with a report
on recent committee activities.
The audit committee assists the
board in its duties relating to the
safeguarding of assets, the operation
of adequate financial systems and
control processes, and the
preparation of financial statements
and related financial reporting in
compliance with all applicable legal
requirements and accounting
standards.
The remuneration and human
resources committee oversees the
formulation of a remuneration
philosophy and human resources
strategy to ensure that the Company
employs and retains the best human
capital possible relevant to its
business needs.
The nominations committee
oversees improvement of efficiency
to the board in discharging its duties
relating to the nomination of board
members and senior management
as well as board and board
committee’s composition and
oversees development of directors.
The board is satisfied that the board
committees have effectively
discharged their responsibilities as
contained in their respective terms
of reference during the year under
review. Details of the committees
are given in the full corporate
governance report at
www.mtn.com
Special ad hoc board committees In certain instances, the board
constitutes special board
committees which are granted the
necessary authority to deal with the
salient matters under special
projects and to allow for a more
detailed consideration of issues.
Special committees may consist of
different directors depending on
the expertise required to resolve
any special matters under review by
the committee.
A detailed corporate governance
report is available on
www.mtn.com.

MTN Group Limited Integrated Business Report for the year ended 31 December 201154
Governance continued
Directors
Scheduled board
meetings attended
Specialboard
meetings attended Audit
Meetings attended Risk
Meetings attended NRHR & CG
Meetings attended
Ad hoc committees
Meetings attended
Independent non-executivesMC Ramaphosa 4/4 5/6 Member 4/4DDB Band+ 1/1 1/1 Chairman 1/1KP Kalyan 4/4 6/6 Member 4/4 Member 3/4 1/1MJN Njeke 4/4 5/6 Member 4/4 Member 4/4 AF van Biljon 4/4 6/6 Chairman 4/4 Invitee 3/4 Chairman 8/8J van Rooyen 4/4 6/6 Member 4/4 Chairman 4/4 Chairman/
member4/5
A Harper++ 4/4 5/6 Chairman 4/4 Member 1/1MLD Marole 4/4 5/6 Member 4/4 Member 1/1NP Mageza 4/4 5/6 Member 4/4 Invitee 3/4 Member 7/8Non-executivesAT Mikati 4/4 6/6 Member 4/4JHN Strydom 4/4 6/6 Member 4/4 Member 4/4 Member 8/8ExecutivesPF Nhleko+++ 1/1 1/1 Invitee Invitee InviteeRS Dabengwa 3/4 5/6 Invitee Invitee InviteeNI Patel 4/4 5/6 Invitee Invitee
+ Resigned on 11 March 2011 in order to reduce his directorships/workload. ++ Succeeded DDB Band as chairman of NRHR & CG.+++ Resigned on 31 March 2011 following expiry of term of contract of employment.
Group tender committee members (including independent non-executive chairman)
Member
Committeemember
sinceScheduled meetings
WA Nairn 08/2010 6/6RS Dabengwa* 05/2004 3/6A Farroukh 09/2011 1/6F Laher 10/2011 4/6NI Patel 11/2009 6/6J Ramadan 06/2007 6/6I Sehoole 12/2010 6/6
* Resigned as a member on 7 October 2011 by virtue of the fact that the Group president & CEO is not eligible to serve on the Group tender committee. RS Dabengwa’s membership of the committee was in his capacity as the former Group chief operating officer.
Directors
Scheduled board
meetings attended
Specialboard
meetings attended Audit
Meetings attended Risk
Meetings attended NRHR & CG
Meetings attended
Ad hoccommittees
Meetings attended
Member
Committeemember
sinceScheduled meetings

MTN Group Limited Integrated Business Report for the year ended 31 December 201155
Grou
p ov
ervi
ewPe
rform
ance
revi
ewOp
erat
iona
l and
fin
ancia
l rev
iew
Sust
aina
bilit
yFi
nanc
ial s
tate
men
tsSh
areh
olde
r inf
orm
atio
n
discipline within business risk
management is independent from
the risk management discipline.
MTN has business risk management
functions in all of its operations with
oversight from the Group business
risk management function.
Group business risk management is
headed by a Group chief business
risk officer who reports to the Group
president and chief executive officer
and has direct access to and has
regular meetings with the chairpersons
of the Group audit committee and
Group risk management and
compliance committee.
The activities of the business risk
management function are guided
by a set of policies, frameworks and
methodologies which have been
approved by the Group audit
committee and Group risk
management and compliance
committee.
Combined assurance As a public listed company the MTN
Group always tries to keep abreast
with best practice and aims to
review and improve its governance
practices, transparency and
accountability. The implementation
MTN is in the process of
implementing the King III
requirements with regards to risk
management, specifically the
aspects of combined assurance and
IT governance. Group business risk
management (BRM) initiated a
project in 2011 to implement a
revised assurance process in order
to agree the principal risks facing
the organisation and to conclude
and report on the residual risk rating
for each identified principal risk.
With the implementation of a
Combined Assurance Model,
MTN will ensure that assurance
activities throughout the
organisation are standardised.
Independent business risk
management function Business risk management is an
independent function responsible
for the disciplines of enterprise risk
management, internal audit and
fraud risk management and
coordination of combined assurance
across the Group. The business risk
management function has a staff
complement of more than 200,
comprising risk, internal audit, fraud
risk and forensic specialists across
the 21 operating countries of which
more than two thirds are internal
audit specialists. The internal audit
of new King III requirements is an
important part of this initiative.
MTN is in the process of
implementing a full combined
assurance approach in line with best
practice and King III.
This approach will ensure that
maximum value is extracted from
the various assurance providers
including first line of assurance
(management), second line of
assurance (risk management,
including proactive fraud risk
management) and third line of
assurance (internal and external
audit, reactive fraud risk
management).
Combined assurance will provide an
integrated approach to managing
the principal risks that face the
organisation. Assurance from all the
lines will be mapped to the principal
risks and will allow the exco as well
as the Group board to obtain an
improved view of the mitigation of
risk in the organisation as well as the
state of the control environment.
The combined assurance
methodology will be phased in and
will be applicable to the MTN Group,
all MTN operating companies, and
MTN joint ventures and subsidiaries.
Risk management, compliance and corporate governance committee The committee identifies, considers
and monitors risks impacting the
Group and ensures compliance with
prevailing legislation and other
statutory requirements (including
voluntary corporate governance
frameworks). The committee is also
responsible for the sustainability
framework and reporting to the
Group. Three of the five non-
executive directors serving on the
committee including the committee
chairman also serve on the audit
committee, to ensure that
overlapping responsibilities are dealt
with in an efficient manner.
Risk managementAs a group that operates in and
understands emerging markets,
MTN believes that risk management
and internal control are fundamental
to effective corporate governance
and the development of a
sustainable business.
MTN’s objective has been to instil
greater risk awareness throughout
the organisation, and to standardise
the approach to risk management
i.e. identifying, assessing, mitigating
and reporting risks.

MTN Group Limited Integrated Business Report for the year ended 31 December 201156
responsibilities will then follow on
the basis of different functional
responsibilities and outcomes.
The Group has embarked on a
shared services model to improve
technology efficiency and cost
synergy. This will form an integral
part of the IT governance framework
in future along with aspects such as
information security, data privacy
and business continuity.
The IT governance position at
MTN is well on its way but in its
infancy. We aim to establish a
comprehensive framework by
the end of the 2012 year.
Fraud risk management The management of fraud risk
within the MTN Group remains
the responsibility of business risk
management and more specifically
the fraud risk management service
line (FRM) located therein. FRM
continues to mature with greater
emphasis and focus on responding
to fraud risk on a more proactive-
versus-reactive basis.
The proactive monitoring of
significant fraud risks has become an
established routine in all significant
MTN operations and greater traction
was achieved during the year in
During the year under review,
progress was made with the
customisation and implementation
of a risk management software
solution to support the combined
assurance approach and to ensure
improved analysis, monitoring and
reporting of risks.
Risk appetite MTN’s risk appetite is determined
by the type of risk, which allows
for a more controlled approach
to managing risk levels. A formal
risk escalation structure was
implemented based on MTN’s risk-
bearing capacity and a set of risk
thresholds at various levels in the
Group. These risk thresholds are
reviewed and updated annually.
Aggregation of total risk is done
qualitatively and the Group risk
management and compliance
committee assesses the
acceptability of MTN’s consolidated
risk profile.
Enterprise risk management The Group business risk
management function is responsible
for ensuring the existence of an
effective framework for risk
management and driving the
implementation of this framework
throughout the Group. This is done
by assisting and advising
MTN also believes that risk retention
and self-insurance are necessary to
keep premiums at reasonable levels
and show commitment towards risk
management. MTN’s retention levels
differ from policy to policy, guided
by the nature of the risk being
transferred.
IT governance IT governance has always been an
important aspect of the control
environment in MTN as the Group is
technology driven. However, in line
with the new chapter in King III,
MTN is in the process of improving
and formalising certain aspects of its
IT governance framework.
The challenge at MTN has always
been the implementation of
governance requirements across a
globally diverse organisation.
As such, an RACI matrix has been
established to identify the roles and
responsibilities of the board and its
sub-committees in order to
implement IT governance at
MTN within the existing governance
organisation. A mandate to establish
accountability with the committee
holding the highest authority for IT
within the sub-committees of the
board is also underway. The
delegation of IT governance
management on the topic and by
ensuring effective reporting and
escalation of risks.
The process of risk management
in the Group is guided by a risk
framework which is based on
best practice risk management
procedures. This framework formed
the basis of the Group’s revised
combined assurance methodology.
The Group business risk
management function, together
with management, has the mandate
and responsibility of ensuring
that adequate risk management
processes are implemented in all
areas of the business in line with the
risk framework.
Insurance and risk transfer MTN has a comprehensive insurance
programme in place which covers
perils such as physical/material
damage, business interruption,
political risk, public liability, directors’
and officers’ liability, crime and
professional indemnity. The limits of
indemnity for these covers have
been structured to ensure that
MTN has adequate cover for its risks
but similarly to ensure that the
Group gets maximum value from
the programme and that premium
spend is kept under control.
Governance continued

MTN Group Limited Integrated Business Report for the year ended 31 December 201157
Grou
p ov
ervi
ewPe
rform
ance
revi
ewOp
erat
iona
l and
fin
ancia
l rev
iew
Sust
aina
bilit
yFi
nanc
ial s
tate
men
tsSh
areh
olde
r inf
orm
atio
n
ensuring that smaller operations
start proactively managing fraud
risk. The tip-offs anonymous
whistleblowing line has been well
established and is now available in
15 MTN operations.
The year has seen the formal
integration of the FRM methodology
into the internal audit and risk
management disciplines via the
introduction of combined
assurance. This will result in a greater
cohesion between FRM, internal
audit and risk management. Group
FRM has also developed a group-
wide electronic case management
system via the new ERA system. The
case management system will not
only provide an electronic platform
for recording cases, but will ensure
that forensic findings are tracked,
allocated to responsible line
management, and are considered
during the rating of principal risks.
The UK Bribery Act came into effect
during 2011 and BRM is looking at
revising or drafting new policies to
deal with this legislation in the
context of the MTN Group and
the applicability of this legislation
to MTN.
audit hours in 2011 rising to over
166 000 from 130 000 in 2010.
Internal audit assurance is guided by
extensive risk evaluation. Projected
internal audit hours for 2012 are in
excess of 166 000 hours. The Group
is now at the point where internal
audit coverage is extended to most
operations and all high-risk
processes.
Total internal audit hours
201120102009
111
453 13
4 44
2
166
083
166
109
2012 Projected
201120102009
111
453 13
4 44
2
166
083
166
109
FRM will concentrate on the
following inherent fraud risk areas
and FRM strategies during the year:
Mobile Money;
procurement fraud;
airtime fraud and related IT
security weaknesses;
standardisation of reactive
investigation methodologies;
various fraud awareness
initiatives; and
further formalisation of proactive
fraud risk monitoring and
consolidation throughout the
MTN Group.
Internal audit MTN has a substantial internal audit
function which is responsible for
providing independent internal
audit assurance to the Group Exco
and board. The independence of
the internal audit discipline is
maintained and internal audit work
is ultimately governed by the Group
audit committee, within an internal
audit charter. In future, internal
audit will form an integral part of
third line assurance in the
combined assurance methodology.
Internal audit activity in the Group
has increased constantly over the
past few years with total internal

MTN’s peopleThe calibre of MTN’s people will be a key differentiator in the increasingly competitive communications sector. In 2011, MTN had 24 252 permanent employees across 21 operations.*
People and remuneration report
MTN recognises that to achieve its
strategic objectives and sustain its
business, the Group needs
appropriately skilled, culturally
diverse employees who are
motivated by, and enjoy, their work.
MTN people must be encouraged to
develop their careers and be offered
opportunities to hone their skills to
meet the needs of the evolving
business. This will help the Group
grow its leadership position,
implement a full ICT offering,
enhance its operational efficiencies
and ultimately increase its returns to
shareholders.
MTN strives to be an employer of
choice and so retain key skills. As
the number of mobile licences
increases, demand for industry
talent grows, making retention
efforts that much more important.
And as the business evolves towards
a broader service offering, from one
that provides mainly voice services,
MTN’s philosophy is to employ
experienced individuals who share
and relate to MTN’s brand values.
These are:
a ‘can do’ attitude;
innovation;
leadership;
relationships; and
integrity.
The first value, a ‘can do’ approach
refers to the entrepreneurial spirit on
which the business was founded.
MTN people are positive they will
find solutions to problems; they are
energetic and motivated to succeed.
The second value, innovation,
underscores the importance MTN
gives to inventiveness. From
introducing the first ‘pay as you go’
model back in the 1990s to
launching dynamic tariffing with
MTN Zone in 2010, MTN continues
to develop new ways of doing
things. Creating an environment
conducive to innovation is critical.
MTN’s leadership value refers to
the Group’s visionary plans for the
industry and the markets in which
it operates. MTN understands the
importance of sound relationships
with its numerous stakeholders. It
endeavours to treat everyone fairly
and with respect and to coordinate
its efforts with its stakeholders
toward a common goal.
MTN’s integrity value means the
Group acts honestly, guided by
strong ethics in all operations.
In April 2011, the Group launched
‘The MTN Deal’, a revised employee
value proposition which is a pledge
to better understand employees,
develop career opportunities and
improve the employment offering
beyond reward and recognition. It
has five key components aimed at
attracting, engaging and retaining
appropriate talent.
These are:
Brand strength: This is one of
the main features that attract
people to work at MTN. It is
supported by the Group’s
commitment to social
responsibility programmes which
enrich and improve the lives of
the communities in which it
operates.
A leadership brand: In 2011,
MTN created a profile of what it
considers to be the attributes of
an effective and successful leader
at MTN. This profile is aligned to
the Group’s talent management
process and programmes.
Investing in MTN talent:
MTN offers various career
development courses. The Group
is working to enable employees
to better understand the
opportunities available within
MTN to hone their skills.
Operating companies across the
*In the 2010 integrated report, 34 588 employees were reported (this number included contractors which are not permanent employees).
MTN Group Limited Integrated Business Report for the year ended 31 December 201158

MTN Group Limited Integrated Business Report for the year ended 31 December 201159
Grou
p ov
ervi
ewPe
rform
ance
revi
ewOp
erat
iona
l and
fin
ancia
l rev
iew
Sust
aina
bilit
yFi
nanc
ial s
tate
men
tsSh
areh
olde
r inf
orm
atio
n
areas of business acumen,
commerce, leadership and
behaviour, organisational
development and technology
systems. In 2011, the MTN Academy
successfully deployed the Global
Advancement Programme (GAP) for
the highest level executives as well
as The Future Leadership
Investment Growing High-Potential
Talent (FLIGHT) for high-potential
middle managers. In total, 2 668
high-potential employees were
trained in the year.
The MTN Academy also launched an
e-learning system called e-Live which
offers MTN employees access to over
3 000 online courses (including titles
in French and Portuguese) which
cover every aspect of MTN’s business
functions. The uptake by MTN people
of online learning has far exceeded
of the Group’s succession pool for
its highest level of executives
(known as “c-suite” executives). It
has also resulted in an increase
in promotions and rotation
opportunities across the Group.
In 2012, MTN plans to introduce
more rigour and structure to the
identification and management of
critical positions across the Group,
as well as to develop greater skills
among MTN’s talent management
practitioners and improve the
capability of internal talent data
systems.
Learning and developmentThe MTN Academy was launched in
2008 and is now fully operational as
a strategic human investment and
development resource to the
Group and its operations. The
Academy delivers over 100
classroom courses across the key
expectations with 24 591 course
registrations and 7 449 completed
courses by the end of 2011, within
four months of the launch.
MTN uses the Metrics that Matter
global benchmarking solution to
measures delegates’ experiences of
learning services provided by the
MTN Academy and its strategic
partners. In terms of the effectiveness
measure (meaning significant
knowledge and skills were gained),
MTN Academy courses scored 87,8%.
On the value measure (which means
training was considered a very
worthwhile investment), MTN
Academy courses scored 85,4%. Both
these scores were significantly higher
than the global benchmark.
The MTN Academy continues to
evolve as it anticipates changes in
the industry, ensuring that the Group
delivers on its strategic goals. In 2011,
the Group spent R265 million on
employee learning and
development, 97% of its budget for
the year.
Health and safetyNominated employees represent
their colleagues on health and safety
committees, which were formed to
footprint have started hosting
‘trade fairs’ to give employees
an idea of the development
opportunities available.
A globally diverse culture:
MTN’s employees come from
more than 55 different
nationalities. We have five official
business languages. The
Group sees strength in diversity
and is developing global
communication tools and social
networking platforms aimed at
sharing and connecting
employees across operations.
Total reward and recognition:
This is a holistic reward and
recognition framework with
various common components,
although it is customised by
individual operations to
incorporate local priorities.
Talent managementIn 2011, MTN introduced a new
approach to leadership talent
management to better align it to
the business strategy and allow for
the improved identification of key
talent risks. The introduction of this
process has led to a notable increase
in the level of engagement with key
talent and significant development

MTN Group Limited Integrated Business Report for the year ended 31 December 201160
People and remuneration report continued
Remuneration Policy to the Group
Remuneration and Human
Resources Committee (R & HR
committee). The name of this
committee was changed from the
Nominations, Remuneration, Human
Resources and Corporate
Governance committee on
1 January 2012. These changes were
introduced in line with the King
Code (King III) guidelines. Full details
of the committee’s role, constitution
and attendance are outlined in the
corporate governance report
available on www.mtn.com.
In setting remuneration policy, the
Group R & HR committee recognises
the need to be competitive but
responsible in an international
context. This includes the promotion
of a common interest with
shareholders and performance-
linked, share-based incentives.
Remuneration components Although the approach to delivering
the various components of pay may
differ from country to country, the
current remuneration arrangements
for all staff and direction in all Group
companies are outlined in the
following table:
monitor and advise the Group on
occupational health and safety in the
operations. The Group follows strict
procedures in the installation,
operation and maintenance of masts,
base stations and in laying cables.
Of particular concern to some
employees is their exposure to
electro-magnetic fields (EMF) and
radio frequencies (RF) emitted by
mobile phones and the antennae of
base stations. MTN adheres to
international guidelines on exposure
to radio frequencies for its employees
as well as the public at large. Details
on the various guidelines, as well
as answers to frequently asked
questions are in the ‘Sustainable
Societies’ section of the Group
website. In addition to compliance
training for technical staff, MTN
has developed an approach
to certification training for all
employees and contractors working
close to antennas on the network.
This basic RF awareness training
minimises occupational exposure and
MTN intends to ensure that this
teaching forms part of the annual
compliance training carried out
throughout the Group.
MTN operates in many countries
with high rates of HIV/Aids
prevent arbitrary dismissals and unfair
labour practices and treatment. These
processes conform to International
Labour Organisation (ILO) standards.
The Group is committed to
upholding and enforcing codes
of conduct that promote
fundamental human rights as
defined by the Universal Declaration
of Human Rights. In addition, the
ILO convention on the freedom of
association is adhered to and union
recruitment is not prohibited at any
operations.
Remuneration overviewRewards and recognition form part
of MTN’s revised employee value
proposition (EVP). The policy
considers both local and group
perspectives and is reviewed
periodically.
Regular benchmarking exercises
against internal and external
comparatives, including economic
and lifestyle factors, are also carried
out across the Group in order to
provide comparative data.
Remuneration governanceThe MTN Group board of directors
delegates responsibility for the
prevalence. The Group provides
access to wellness programmes for
employees and their immediate
families through its medical scheme
and other professional service
providers. Malaria is a major cause
of death in many of the countries in
which MTN operates and the Group
initiates and supports projects in the
fight against the mosquito-borne
disease.
To mitigate the risks to employees
of sociopolitical instability,
MTN continues to improve its
facilitation of various medical,
security, safe travel and crisis risk
management initiatives.
Equitable labour practicesMTN’s recruitment policy reinforces
the Group’s focus on eliminating all
prejudice based on race, gender,
ethnic origin, marital status, religion,
age, physical disabilities and other
social facts in filling vacant positions
and the management of employees.
Where applicable, the Group gives
preference to employees who are at
risk of being retrenched.
MTN has formal disciplinary
processes in place to guide manager
and employees engagements and

MTN Group Limited Integrated Business Report for the year ended 31 December 201161
Grou
p ov
ervi
ewPe
rform
ance
revi
ewOp
erat
iona
l and
fin
ancia
l rev
iew
Sust
aina
bilit
yFi
nanc
ial s
tate
men
tsSh
areh
olde
r inf
orm
atio
n
for work performed. Base salary does
not include benefits and variable
remuneration such as performance
bonuses or any other potential
compensation from MTN.
The base salary of executive
directors is subject to annual review
and is set with reference to external
market benchmarks, taking
individual performance into
consideration. Executive directors
do not receive payment of director’s
fees or committee fees in respect of
meetings attended.
Benefit programmes
Benefits are forms of value, other
than salary payments, that are
provided to employees in return
for their contribution to the
organisation, that is, for doing
their job. They typically include
retirement plans, health life
insurance, life insurance and
disability insurance. Some benefits,
such as unemployment and other
various forms of leave and worker’s
compensation may be statutory
requirements and vary from country
to country.
Remuneration component Strategic intent
Base salary(fixed)
Provides the non-variable element of an
employee’s package
Typically, base salaries are positioned at the
market median of the identified group of
similar organisations as obtained from
credible survey consultants
Benefit programmes (security)
The purpose of these benefits is to increase
the economic security of employees and
act as an incentive to attract or retain
employees
Short-term incentive(pay at risk)
The purpose of short-term incentives is to
align individual efforts and performance
with the short-term objectives of the
company
Focuses participants on achieving annual
performance goals, which are based on the
Group’s KPIs, to create sustainable
shareholder value
Long-term incentive scheme(pay at risk)
Long-term incentives promote a longer
term view of the business and are a form of
wealth creation to both shareholders and
employees
Other elements(lifestyle)
Supplement the cash earnings outlined
above
One of the key considerations
adopted during the design of the
structure was the alignment of
individual job levels representing job
worth to pay mix with due regard to
the significance and contribution of
the job. The magnitude of the pay
components is associated with the
job’s relative worth to the organisation
as evaluated by a credible job
evaluation system.
Typically, the ratio of basic pay
to variable remuneration differs
between lower level and higher
level jobs. Although within the
available remuneration structuring
options, employees have flexibility
preferences particularly with benefits.
Whereas lower level jobs typically
receive high fixed pay and lower
variable or risk pay, top level jobs tend
to place more emphasis on variable
remuneration, with a low base
salary. The primary basis for this
differentiation is with regard to factors
that define the job hence require
more effort from the job holder as
they impact on the organisation.
Base salary
Refers to the fixed amount of money
paid to an employee by MTN in return

MTN Group Limited Integrated Business Report for the year ended 31 December 201162
People and remuneration report continued
Short-term incentives
These include annual incentives,
performance bonuses, commissions
and the like. The measurement
period for short-term incentives is
most often quarterly, semi-annually,
or annually and can be measured
based on the individual’s own
performance, team performance or
group-wide performance.
Short-term incentives for executive
directors are linked to the
South African-based operations schemes
Plan type EligibilityDate implemented Options/Shares Performance conditions Last vesting period
Share Options Scheme All employees regardless of level 2001 Options N/A 2014
Share Appreciation Rights Scheme (SARS)
All employees at management
level and above
2006 Share Appreciation
Rights
N/A 2016
Share Rights Scheme All employees at management
level and above
2008 Share Appreciation
Rights
N/A 2018
Performance Share Plan (PSP)
All employees at management
level and above
2010 Rights to shares Refer to note below Currently – 2014
Performance Share Plan (PSP) – this is a new employee share incentive plan that was adopted in 2010 and allows qualifying employees to receive shares in
settlement of the plan benefits which would be purchased in the market/or cash in lieu of shares (at the discretion of the Group board). The 2011 PSP grant
has a three-year vesting period from the grant date except as set out in page 70. As soon as reasonably practicable after the end of the award fulfilment
period (period within which the performance conditions of the award are measured), the board of MTN will determine whether and to what extent the
award conditions have been fulfilled and accordingly, whether any vested shares have accrued. Therefore, the PSP awards will accrue once, and to the
extent, that the board is satisfied that the award conditions have been fulfilled.
operational and financial value
drivers pertaining to business
performance against budget for
individual operations and the Group
as a whole. These value drivers are
determined by the board every year
in respect of the next financial
year. Each executive director’s
performance bonus is conditional
upon the achievement of specific
value drivers and key performance
indicators which are structured to
retain a balance between the
performance of entities for which
the director is directly responsible,
and that of the Group. Performance
bonuses are determined by the
Group R & HR committee and are
approved by the board.
Long-term incentives
These include share based and
cash-settled schemes such as share
options, share rights, notional shares,
share appreciation rights and the like.
They measure organisation-wide
performance, typically over several
years of which the intent is to provide
incentives for employees to improve
the overall performance of the
organisation by linking the
employees’ long-term rewards to
MTN’s long-term results.
Long-term incentives are divided
into the South African-based
operations scheme and the
Non-South African-based operations
scheme. The two types of schemes
are as follows:

MTN Group Limited Integrated Business Report for the year ended 31 December 201163
Grou
p ov
ervi
ewPe
rform
ance
revi
ewOp
erat
iona
l and
fin
ancia
l rev
iew
Sust
aina
bilit
yFi
nanc
ial s
tate
men
tsSh
areh
olde
r inf
orm
atio
n
An inflation linked fee increase
proposal of 6,1% for local directors’
retainers as well as for attendance of
board meetings and an increase of
6,1% for committee members was
submitted for approval.
Other remuneration and statutory disclosures Contracts and severance: MTN’s
policies regarding Group executive
employment contracts dictate the
period of the contract as well as
the notice of termination. Presently,
MTN does not enter into limited
duration contracts for Group
executives, with the exception of
the Group president and CEO
(3 years). The inclusion of a period
of restraint in the employment
contract is generic and no specific
timeframes are indicated. Notice of
termination for Group executives
is 3 months, unless otherwise
specified.
Non-South African-based operations’ schemesIt is of prime importance to MTN not
only to attract, but also to motivate
and retain capable human capital
across all its operations. To create a
sense of ‘oneness’ with the MTN
Group brand, the Company offers
eligible mid management and
above, for expatriate and local
employees’ participation in the
Group’s Notional Share Option (NSO)
scheme. This scheme enhances
MTN’s commitment to the ‘One
Group, One MTN’ philosophy.
Qualifying employees not only own
options, but also participate in the
growth of the Group/operations, as
applicable. The primary objective
of this long-term incentive scheme
is to encourage an alignment
between the individual interests of
senior MTN employees and that of
MTN’s long-term success. During
2011, the MTN Group R & HR
committee conducted an evaluation
of the level of understanding and
administration of the NSO Scheme
among the operations. It was
highlighted that although the
scheme was approved for
implementation eight years ago,
there was a lack of effective
administration. This then prompted
the scarcity of certain specialised
skills; and quality of living
adjustments in some countries.
Non-executive directors (NEDs) The R & HR committee is responsible
for setting the fees and determining
the terms of service for the chairman
and NEDs of MTN. The fees for
non-executive directors are
considered annually and are
determined in light of market
best practice and with reference
to the time commitment and
responsibilities associated with
the roles.
MTN Group’s non-executive
directors receive an annual retainer
and meeting attendance fees. They
do not participate in any type of
incentive scheme nor do they
receive any medical and pension-
related benefits. Following the
review of the 2010 fees structure
and in accordance with the
guidelines of King III and other
governance requirements, the fee
structure for external executives was
reviewed during 2011 and
presented to the R & HR committee
(outlined under the directors’
emoluments) in 2012.
an online automated system
proposal which will be administered
centrally by the Group
Compensation and Benefits team.
The project is currently underway
and is expected to be completed
before the last quarter of 2012.
General principles for the remuneration of Group directorsThe requirements of the King III
Code on Corporate Governance
have guided executive and
non-executive remuneration which
are separately distinguished.
Remuneration for senior managementIn accordance with the King III
requirements, the Company is
required to disclose the salaries
of the three most highly paid
employees who are not directors
of the Company. While individual
executive and non-executive
directors’ pay is disclosed, the Group
R & HR committee has determined
that disclosing similar information
for the top three earning non-
director employees is not prudent.
This decision was taken with due
consideration to the highly
competitive operating environment;

MTN Group Limited Integrated Business Report for the year ended 31 December 201164
People and remuneration report continued
Audited directors’ and prescribed officers, emoluments and related payments: The following audited tables appear on pages 64 to 73.
Directors’ emoluments and related payments For the year ended 31 December 2011
Dateappointed
Salaries R000
Post-employment
benefits R000
Otherbenefits**
R000Bonuses
R000 Subtotal
Share option
gains***R000
Total R000
Executive directorsRS Dabengwa 01/10/01 7 133 903 485 14 007 22 528 — 22 528NI Patel 27/11/09 4 719 600 1 945 7 478 14 742 2 435 17 177PF Nhleko* Resigned 2 421 306 35 095 10 000 47 822 997 48 819
Total 14 273 1 809 37 525 31 485 85 092 3 432 88 524
*Resigned on 31 March 2011. Other benefits include the shareholder approved restraint of trade. **Includes medical aid and unemployment insurance fund.***Pre-tax gains and post brokerage cost on share appreciation rights scheme and share rights plan.
Dateappointed
Retainer#
R000Attendance#
R000
Special board
R000
Specialprojects
R000
Ad hoc workR000
TotalR000
Non-executive directors MC Ramaphosa 01/10/01 901 371 533 — — 1 805 DDB Band (resigned 11/03/11) 01/10/01 57 61 61 — 283 462KP Kalyan 13/06/06 249 284 315 54 70 972AT Mikati *† 17/07/06 799 438 585 — — 1 822MJN Njeke 13/06/06 260 286 137 17 52 752JHN Strydom 11/03/04 260 286 297 125 70 1 038AF van Biljon 01/11/02 260 267 280 143 52 1 002J van Rooyen 17/07/06 287 306 262 89 — 944MLD Marole 01/01/10 211 212 256 36 70 785NP Mageza 01/01/10 222 231 280 143 52 928A Harper * 01/01/10 799 438 371 — — 1 608
Total 4 305 3 180 3 377 607 649 12 118
*Fees that have been paid in euro have been converted to rand.†Fees are paid to M1 Limited.#Retainer and attendance fees include fees for board and committees.
Dateappointed
Salaries R000
Post-employment
benefitsR000
Otherbenefits**
R000Bonuses
R000 Subtotal
Share option
gains***R000
Total R000

MTN Group Limited Integrated Business Report for the year ended 31 December 201165
Grou
p ov
ervi
ewPe
rform
ance
revi
ewOp
erat
iona
l and
fin
ancia
l rev
iew
Sust
aina
bilit
yFi
nanc
ial s
tate
men
tsSh
areh
olde
r inf
orm
atio
n
Director’s emoluments and related payments For the year ended 31 December 2010
Dateappointed
Salaries R000
Post-employment
benefits R000
Other**benefits
R000Bonuses
R000Subtotal
R000
Share optiongains***R000
Total R000
Executive directorsPF Nhleko 01/06/01 8 955 1 133 76 20 206 30 370 21 441 51 811NI Patel 27/11/09 3 530 449 328 2 706 7 013 2 890 9 903RS Dabengwa 01/10/01 4 457 562 564 2 480 8 063 3 859 11 922
Total 16 942 2 144 968 25 392 45 446 28 190 73 636
**Includes medical aid and unemployment insurance fund.***Pre-tax gains and post brokerage cost on share appreciation rights scheme and share rights plan.
Date appointed
Retainer#
R000Attendance#
R000
Special boardR000
Special projects
R000
Ad hoc workR000
Total R000
Non-executive directorsMC Ramaphosa 01/10/01 904 738 363 116 — 2 121DDB Band 01/10/01 264 481 189 150 — 1 084KP Kalyan 13/06/06 276 487 195 116 — 1 074AT Mikati*† 17/07/06 736 808 351 — — 1 895MJN Njeke 13/06/06 268 296 195 17 — 776JHN Strydom 11/03/04 287 455 195 116 — 1 053AF van Biljon 01/11/02 287 412 195 133 — 1 027J van Rooyen 17/07/06 315 473 195 132 — 1 115MLD Marole 01/01/10 237 367 195 116 — 915NP Mageza 01/01/10 248 404 195 116 — 963A Harper* 01/01/10 736 808 351 29 — 1 924
Total 4 558 5 729 2 619 1 041 — 13 947
*Fees that have been paid in euro have been converted to rand.† Fees are paid to M1 Limited.#Retainer and attendance fees include fees for board and committees.
Dateappointed
Retainer#
R000Attendance#
R000
SpecialboardR000
Specialprojects
R000
Ad hoc workR000
TotalR000

MTN Group Limited Integrated Business Report for the year ended 31 December 201166
People and remuneration report continued
Prescribed officers’ emoluments and related payments For the year ended 31 December 2011
Salaries R000
Post-employment
benefits R000
Otherbenefits
R000Bonuses
R000Sub-total
R000
Share option
gains*R000
Total R000
Prescribed officersJA Desai 4 746 635 136 6 110 11 627 2 188 13 815I Sehoole 3 720 477 60 4 067 8 324 — 8 324PD Norman 3 647 464 66 4 740 8 917 11 435 20 352C de Faria 4 753 475 — 5 781 11 009 7 266 18 275J Ramadan 4 136 514 155 5 453 10 258 7 266 17 524A Farroukh 4 666 466 1 363 3 732 10 227 5 517 15 744KL Shuenyane 3 505 449 48 396 4 245 56 595 — 56 595S Fakie 2 638 350 305 3 209 6 502 1 446 7 948Total 31 811 3 830 50 481 37 337 123 459 35 118 158 577*Pre-tax gains and post brokerage cost on share appreciation rights scheme and share rights plan.
Equity compensation benefits in respect of share appreciation rights for executive directors, prescribed officers and directors of major subsidiaries
Offer date
Strikeprice
RVesting
date
Number out-standing at
31 December 2010
Exercised2011
Exercisedate
Exerciseprice
R
Number out-standing at
31 December 2011
RS Dabengwa 1 December 2003 27,00 01/12/07 43 770 — — — 43 7701 December 2003 27,00 01/12/08 87 330 — — — 87 330Total 131 100 131 100PD Norman1 December 2004 40,50 01/12/06 6 780 (6 780) 03/05/11 143,50 —1 December 2004 40,50 01/12/07 6 780 (6 780) 03/05/11 143,50 —1 December 2004 40,50 01/12/08 10 170 (10 170) 03/05/11 143,50 —1 December 2004 40,50 01/12/09 10 170 (10 170) 03/05/11 143,50 —Total 33 900 (33 900) —Z Bulbulia2 September 2002 9,31 02/09/07 27 720 — — — 27 720 1 December 2003 27,00 01/12/05 4 940 — — — 4 940 1 December 2003 27,00 01/12/06 4 940 — — — 4 940 1 December 2003 27,00 01/12/07 7 410 — — — 7 410 1 December 2003 27,00 01/12/08 7 410 — — — 7 410
24 700 24 700Total 52 420 52 420

MTN Group Limited Integrated Business Report for the year ended 31 December 201167
Grou
p ov
ervi
ewPe
rform
ance
revi
ewOp
erat
iona
l and
fin
ancia
l rev
iew
Sust
aina
bilit
yFi
nanc
ial s
tate
men
tsSh
areh
olde
r inf
orm
atio
n
Equity compensation benefits in respect of share appreciation rights for executive directors, prescribed officers and directors of major subsidiaries continued
Offer date
Strike price
RVesting
date
Number outstanding
31 Dec 10 Offered ExercisedExercise
date
Exercise price
R
Numberoutstanding
31 Dec 11
RS Dabengwa19 March 2008 126,99 19/03/10 14 440 — — — — 14 440 19 March 2008 126,99 19/03/11 14 440 — — — — 14 440 19 March 2008 126,99 19/03/12 21 660 — — — — 21 660 19 March 2008 126,99 19/03/13 21 660 — — — — 21 660
72 200 72 20031 May 2006 56,83 30/11/08 13 920 — — — — 13 920 31 May 2006 56,83 30/11/09 26 440 — — — — 26 440 31 May 2006 56,83 30/11/10 40 440 — — — — 40 440
80 800 80 80021 November 2006 71,00 21/11/08 8 680 — — — — 8 680 21 November 2006 71,00 21/11/09 8 680 — — — — 8 680 21 November 2006 71,00 21/11/10 13 020 — — — — 13 020 21 November 2006 71,00 21/11/11 13 020 — — — — 13 020
43 400 43 400Total 196 400 196 400NI Patel31 May 2006 56,83 31/05/11 28 590 — (28 590) 31/05/11 144,17 — 22 June 2007 96,00 22/06/09 2 420 — — — — 2 420 22 June 2007 96,00 22/06/10 2 420 — — — — 2 420 22 June 2007 96,00 22/06/11 3 630 — — — — 3 630 22 June 2007 96,00 22/06/12 3 630 — — — — 3 630
12 100 — — 12 100Total 40 690 — (28 590) 12 100PF Nhleko02 April 2007 98,50 02/04/09 4 740 — (4 740) 31/03/11 136,49 — 02 April 2007 98,50 02/04/10 4 740 — (4 740) 31/03/11 136,49 — 02 April 2007 98,50 02/04/11 7 110 — (7 110) 31/03/11 136,49 — 02 April 2007 98,50 02/04/12 7 110 — (7 110) 31/03/11 136,49 — Total 23 700 (23 700) —
These share options were not separately disclosed in the 2010 report

MTN Group Limited Integrated Business Report for the year ended 31 December 201168
People and remuneration report continued
Equity compensation benefits in respect of share appreciation rights for executive directors, prescribed officers and directors of major subsidiaries continued
Offer date
Strike price
RVesting
date
Number outstanding
31 Dec 10 Offered ExercisedExercise
date
Exercise price
R
Numberoutstanding
31 Dec 11
JA Desai21 November 2006 71,00 21/11/10 750 — (750) 21/12/11 140,80 — 21 November 2006 71,00 21/11/11 30 750 — (30 750) 15/12/11 140,80 — Total 31 500 — (31 500) —PD Norman31 May 2006 56,83 30/11/07 9 140 — (9 140) 03/05/11 143,50 — 31 May 2006 56,83 30/11/08 9 140 — (9 140) 03/05/11 143,50 — 31 May 2006 56,83 30/11/09 13 710 — (13 710) 03/05/11 143,50 — 31 May 2006 56,83 30/11/10 13 710 — (13 710) 03/05/11 143,50 —
45 700 (45 700)21 November 2006 71,00 21/11/08 14 420 — (14 420) 03/05/11 143,50 — 21 November 2006 71,00 21/11/09 14 420 — (14 420) 03/05/11 143,50 — 21 November 2006 71,00 21/11/10 21 630 — (21 630) 03/05/11 143,50 — 21 November 2006 71,00 21/11/11 21 630 — — 21 630
72 100 — (50 470) 21 630Total 117 800 (96 170) 21 630C de Faria21 November 2006 71,00 21/11/11 104 580 — (104 580) 15/12/11 140,80 — J Ramadan21 November 2006 71,00 21/11/11 104 580 — (104 580) 15/12/11 140,80 — A Farroukh21 November 2006 71,00 21/11/11 83 370 — (83 370) 19/12/11 136,13 — S Fakie01 January 2007 85,30 01/01/11 31 380 — (31 380) 24/03/11 133,00 — 01 January 2007 85,30 01/01/12 31 380 — — — — 31 380 Total 62 760 (31 380) 31 380A Bing31 May 2006 56,83 30/11/10 4 860 — — — — 4 860 21 November 2006 71,00 21/11/10 960 960 21 November 2006 71,00 21/11/11 960 — — — — 960
1 920 — — — — 1 92022 June 2007 96,00 22/06/11 6 330 — 6 330 22 June 2007 96,00 22/06/12 6 330 — — — — 6 330
12 660 — — — — 12 660Total 14 580 — — — — 14 580

MTN Group Limited Integrated Business Report for the year ended 31 December 201169
Grou
p ov
ervi
ewPe
rform
ance
revi
ewOp
erat
iona
l and
fin
ancia
l rev
iew
Sust
aina
bilit
yFi
nanc
ial s
tate
men
tsSh
areh
olde
r inf
orm
atio
n
Equity compensation benefits in respect of share rights for executive directors, prescribed officers and directors of major subsidiaries
Offer date
Strike price
RVesting
date
Number outstanding
31 Dec 10 Offered ExercisedExercise
date
Exercise price
R
Numberoutstanding
31 Dec 11
B Goschen19 March 2008 126,99 19/03/10 12 260 — — — 12 260 19 March 2008 126,99 19/03/11 12 260 — — — 12 260 19 March 2008 126,99 19/03/12 18 390 — — — 18 390 19 March 2008 126,99 19/03/13 18 390 — — — 18 390 Total 61 300 61 300 Z Bulbulia31 May 2006 56,83 30/11/07 12 920 — — — 12 920 31 May 2006 56,83 30/11/08 12 920 — — — 12 920 31 May 2006 56,83 30/11/09 19 380 — — — 19 380 31 May 2006 56,83 30/11/10 19 380 — — — 19 380
64 600 64 600 19 March 2008 126,99 19/03/10 4 920 — — — 4 920 19 March 2008 126,99 19/03/11 4 920 — — — 4 920 19 March 2008 126,99 19/03/12 7 380 — — — 7 380 19 March 2008 126,99 19/03/13 7 380 — — — 7 380
24 600 24 600 Total 89 200 89 200

MTN Group Limited Integrated Business Report for the year ended 31 December 201170
People and remuneration report continued
Equity compensation benefits in respect of performance share plan for executive directors, prescribed officers and directors of major subsidiaries
Offer dateVesting
date Offered ExercisedExercise
date
Exercise price
R
Numberoutstanding
31 Dec 11
RS Dabengwa29 June 2011 31/12/13 107 800 — — — 107 800 29 December 2011 30/06/14 111 600 — — — 111 600 Total 219 400 219 400NI Patel29 June 2011 31/12/13 57 700 — — — 57 700 29 December 2011 30/06/14 57 000 — — — 57 000 Total 114 700 114 700JA Desai29 June 2011 31/12/13 45 200 — — — 45 200 29 December 2011 31/12/14 43 600 — — — 43 600 Total 88 800 88 800 I Sehoole29 June 2011 31/12/13 37 300 — — — 37 300 29 December 2011 31/12/14 36 900 — — — 36 900 Total 74 200 74 200 PD Norman29 June 2011 31/12/13 36 500 — — — 36 500 29 December 2011 30/06/14 36 100 — — — 36 100 Total 72 600 72 600C de Faria29 June 2011 31/12/13 45 200 — — — 45 200 J Ramadan29 June 2011 31/12/13 40 500 — — — 40 500 29 December 2011 31/12/14 39 000 — — — 39 000 Total 79 500 79 500 A Farroukh29 June 2011 31/12/13 44 600 — — — 44 600 29 December 2011 30/06/14 42 900 — — — 42 900 Total 87 500 87 500KL Shuenyane29 December 2011 30/06/14 35 300 — — — 35 300
Offer dateVesting
date Offered ExercisedExercise
date
Exerciseprice
R
Numberoutstanding
31 Dec 11

MTN Group Limited Integrated Business Report for the year ended 31 December 201171
Grou
p ov
ervi
ewPe
rform
ance
revi
ewOp
erat
iona
l and
fin
ancia
l rev
iew
Sust
aina
bilit
yFi
nanc
ial s
tate
men
tsSh
areh
olde
r inf
orm
atio
n
Offer dateVesting
date Offered ExercisedExercise
date
Exercise price
R
Numberoutstanding
31 Dec 11
S Fakie29 June 2011 31/12/13 28 200 — — — 28 200 29 December 2011 30/06/14 18 609 — — — 18 609Total 46 809 46 809KW Pienaar 29 June 2011 31/12/13 31 500 — — — 31 500 29 December 2011 31/12/14 24 200 — — — 24 200 Total 55 700 55 700 Z Bulbulia29 June 2011 31/12/13 18 500 — — — 18 500 29 December 2011 31/12/14 15 300 — — — 15 300 Total 33 800 33 800 A Bing29 June 2011 31/12/13 20 600 — — — 20 600 29 December 2011 31/12/14 15 600 — — — 15 600 Total 36 200 36 200 B Goschen 29 December 2011 31/12/14 22 300 — — — 22 300 Total 22 300 22 300 SB Mtshali 29 June 2011 31/12/13 6 500 — — — 6 500 29 December 2011 31/12/14 9 005 — — — 9 005 Total 15 505 15 505 MML Mokoka29 June 2011 31/12/13 5 300 — — — 5 300 29 December 2011 31/12/14 6 400 — — — 6 400 Total 11 700 11 700
Offer dateVesting
date Offered ExercisedExercise
date
Exerciseprice
R
Numberoutstanding
31 Dec 11
Equity compensation benefits in respect of performance share plan for executive directors, prescribed officers and directors of major subsidiaries continued

MTN Group Limited Integrated Business Report for the year ended 31 December 201172
People and remuneration report continued
Executive directors’, prescribed officers’ and directors of major subsidiaries’ shareholdings and dealings in ordinary shares
DirectorDecember
2011December
2010 Beneficial
DDB Band 14 023 14 023 DirectPF Nhleko — 120 413 DirectRS Dabengwa 1 473 552 1 465 559 DirectNP Mageza 400 400 IndirectSB Mtshali** — —NI Patel — —PD Norman#* 306 002 314 996 Direct
10 000 — IndirectJA Desai#* — —KL Shuenyane#* 1 640 — DirectMJN Njeke 10 — DirectA Farroukh* — —C de Faria* — —I Sehoole* — —J Ramadan* — —B Goschen# 40 000 — DirectKW Pienaar# 487 796 — DirectAR Bing# 136 836 — DirectZ Bulbulia# 40 000 — Direct
Total 2 510 259 1 915 391
* Prescribed officer. #Major subsidiary director.
** Company secretary.
DirectorDecember
2011December
2010 Beneficial

MTN Group Limited Integrated Business Report for the year ended 31 December 201173
Grou
p ov
ervi
ewPe
rform
ance
revi
ewOp
erat
iona
l and
fin
ancia
l rev
iew
Sust
aina
bilit
yFi
nanc
ial s
tate
men
tsSh
areh
olde
r inf
orm
atio
n
Executive directors’, prescribed officers’ and directors of major subsidiaries’ interests in MTN Group Limited held through acquisition of shares in MTN Zakhele Limited The following persons, being directors of MTN Group Limited and its major subsidiaries and the MTN company secretary were allocated the following number of MTN Zakhele shares which has a shareholding in MTN Group Limited shares.
Beneficiary Nature of interest Shares
MC Ramaphosa Indirect beneficial 9 367 465KP Kalyan Direct beneficial 27 700MLD Marole Direct beneficial 15 700MJN Njeke Direct beneficial 6 700NP Mageza Indirect beneficial 51 420SB Mtshali Indirect beneficial 6 500F Jakoet Direct beneficial 30 700CWN Molope Direct beneficial 1 000IN Mkhize Direct beneficial 2 000A Farroukh None —C de Faria None —I Sehoole None —JA Desai None —J Ramadan None —KL Shuenyane None —
Total 9 509 185
Beneficiary Nature of interest Shares

MTN Group Limited Integrated Business Report for the year ended 31 December 201181
Grou
p ov
ervi
ewPe
rform
ance
revi
ewOp
erat
iona
l and
fin
ancia
l rev
iew
Sust
aina
bilit
yFi
nanc
ial s
tate
men
tsSh
areh
olde
r inf
orm
atio
n
Statutory certificates and reportsDirectors’ report
Annual financial statements
Annual financial statements
The preparation of the Group and Company financial statements was supervised by the Group chief financial officer, NI Patel, BCom, BCompt (Hons), CA(SA).
These financial statements were authorised on 6 March 2012 by the board of directors.
MTN Group Limited Integrated Business Report for the year ended 31 December 201181

MTN Group Limited Integrated Business Report for the year ended 31 December 201182
Contents Page
Statement of directors’ responsibility 83Certificate by the company secretary 84Independent auditors’ report 85Report of the audit committee 86Directors’ report 88
Group financial statementsGroup income statement 92Group statement of comprehensive income 93Group statement of financial position 94Group statement of changes in equity 95Group statement of cash flows 96
Notes to the Group financial statementsPrincipal accounting policies 97Critical accounting estimates and assumptions 102Operating segments 103Results of operations 106Non-current assets 116Current assets 138Equity structure 141Non-current liabilities 143Current liabilities 154Notes to the statement of cash flows 156Other notes to the Group financial statements 158Financial risk management and financial instruments 171Share-based payments 188
Company financial statementsCompany income statement 194Company statement of comprehensive income 194Company statement of financial position 195Company statement of changes in equity 196Company statement of cash flows 197Notes to the Company financial statements 198
Annexure 1 208

MTN Group Limited Integrated Business Report for the year ended 31 December 201183
Grou
p ov
ervi
ewPe
rform
ance
revi
ewOp
erat
iona
l and
fin
ancia
l rev
iew
Sust
aina
bilit
yFi
nanc
ial s
tate
men
tsSh
areh
olde
r inf
orm
atio
n
Statement of directors’ responsibilityfor the year ended 31 December 2011
The directors are responsible for the preparation, integrity and fair presentation of the consolidated financial statements of MTN Group Limited, its subsidiaries, joint ventures, associates and special purpose entities (the Group) in accordance with International Financial Reporting Standards (IFRS) and the South African Companies Act, No 71 of 2008 (the Companies Act). The Group financial statements and financial statements of MTN Group Limited (the Company) presented on pages 88 to 207 have been prepared in accordance with the requirements of IFRS and the Companies Act and include amounts based on judgements and estimates made by management.
The directors consider that having applied IFRS in preparing the financial statements, they have used the most appropriate accounting policies, consistently applied and supported by reasonable and prudent judgements and estimates, and that all IFRS that they consider to be applicable have been followed. The directors are satisfied that the information contained in the financial statements fairly presents the results of operations for the year and the financial position of the Group and the Company at year end, in accordance with IFRS.
The directors have responsibility for ensuring that accounting records are kept. The accounting records disclose, with reasonable accuracy, the financial position and results of the Group and the Company and enable the directors to ensure that the financial statements comply with relevant legislation.
The Group operates in an established controlled environment, which is documented and regularly reviewed. This incorporates risk management and internal control procedures, which are designed to provide reasonable, but not absolute, assurance that assets are safeguarded and the risks facing the business are controlled. Any new acquisitions which do not apply the same standards and procedures will be integrated into the Group and, during such integration, uniformity of standards will be achieved. Nothing has come to the attention of the directors to indicate that any material breakdown in the functioning of these controls, procedures and systems has occurred during the year under review.
The going concern basis has been adopted in preparing the financial statements. The directors have no reason to believe that the Group or any company within the Group will not be a going concern in the year ahead, based on forecasts and available cash resources. These financial statements support the viability of the Group and the Company.
The Group’s external auditors, PricewaterhouseCoopers Inc. and SizweNtsalubaGobodo Inc., jointly audited the financial statements and their unqualified audit report is presented on page 85.
The Group financial statements and Company financial statements which appear on pages 88 to 207 were approved for issue by the board of directors on 6 March 2012 and are signed on its behalf by:
MC Ramaphosa RS DabengwaChairman Group president and chief executive officer
Fairland6 March 2012
MTN Group Limited Integrated Business Report for the year ended 31 December 201184
Certificate by the company secretaryfor the year ended 31 December 2011
I certify that MTN Group Limited has filed all MTN Group returns and notices for the year ended 31 December 2011, as are required of a public company in terms of section 88(2)(e) of the Companies Act, No 71 of 2008, and that such returns and notices are, to the best of my knowledge and belief, true, correct and up to date.
SB MtshaliCompany secretary
Fairland6 March 2012

MTN Group Limited Integrated Business Report for the year ended 31 December 201185
Grou
p ov
ervi
ewPe
rform
ance
revi
ewOp
erat
iona
l and
fin
ancia
l rev
iew
Sust
aina
bilit
yFi
nanc
ial s
tate
men
tsSh
areh
olde
r inf
orm
atio
n
We have audited the consolidated annual financial statements and annual financial statements of MTN Group Limited, which comprise the consolidated and separate statements of financial position as at 31 December 2011, and the consolidated and separate income statements and the consolidated and separate statements of comprehensive income, changes in equity and cash flows for the year then ended, and a summary of significant accounting policies and other explanatory information, and the directors’ report, as set out on pages 88 to 207, and the specified sections of the remuneration report contained within pages 64 to 73.
Directors’ responsibility for the financial statementsThe Company’s directors are responsible for the preparation and fair presentation of these financial statements in accordance with International Financial Reporting Standards and the requirements of the Companies Act of South Africa, and for such internal control as the directors determine is necessary to enable the preparation of financial statements that are free from material misstatements, whether due to fraud or error.
Auditor’s responsibilityOur responsibility is to express an opinion on these financial statements based on our audit. We conducted our audit in accordance with International Standards on Auditing. Those standards require that we comply with ethical requirements and plan and perform the audit to obtain reasonable assurance about whether the financial statements are free from material misstatement.
An audit involves performing procedures to obtain audit evidence about the amounts and disclosures in the financial statements. The procedures selected depend on the auditor’s judgement, including the assessment of the risks of material misstatement of the financial statements, whether due to fraud or error. In making those risk assessments, the auditor considers internal control relevant to the entity’s preparation and fair presentation of the financial statements in order to design audit procedures that are appropriate in the circumstances, but not for the purpose of expressing an opinion on the effectiveness of the entity’s internal control. An audit also includes evaluating the appropriateness of accounting policies used and the reasonableness of accounting estimates made by management, as well as evaluating the overall presentation of the financial statements.
We believe that the audit evidence we have obtained is sufficient and appropriate to provide a basis for our audit opinion.
OpinionIn our opinion, the financial statements present fairly, in all material respects, the consolidated and separate financial position of MTN Group Limited as at 31 December 2011, and its consolidated and separate financial performance and its consolidated and separate cash flows for the year then ended in accordance with International Financial Reporting Standards and the requirements of the Companies Act of South Africa.
PricewaterhouseCoopers Inc. SizweNtsalubaGobodo Inc.Director: S Sooklal Director: A MashifaneRegistered auditor Registered auditor
Sunninghill Woodmead6 March 2012 6 March 2012
Independent auditors’ reportfor the year ended 31 December 2011

MTN Group Limited Integrated Business Report for the year ended 31 December 201186
This report is issued in compliance with section 94(7) (f ) of the Companies Act, No 71 of 2008, as amended (the Companies Act) and as recommended by King III.
The MTN Group audit committee (the committee) has adopted comprehensive terms of reference that have been approved by the board, an outline of such is detailed in the corporate governance report. The committee has conducted its work over the year and discharged its responsibilities in accordance with these terms of reference. The committee presents below its report in terms of section 94 (7)(f ) of the Companies Act for the financial year ended 31 December 2011.
MembershipDuring the period under review, the members of the committee were formally nominated by the board for re-election to the committee, subject to the approval of the shareholders. At the annual general meeting scheduled for 29 May 2012, shareholders will be asked to approve the appointments.
The composition of the committee is set out on page 50 and the biographical details of members are set out on page 16. The members’ fees are included in the table of directors’ emoluments and related payments on page 218.
Executive directors attend committee meetings as permanent invitees. Both internal and external auditors attend all committee meetings. A summary of the meetings held during the year under review as well as attendance thereof by committee members is set out on page 54.
Execution of functions of the audit committeeThe committee is satisfied that, in respect of the financial year under review, it has discharged its duties and responsibilities in accordance with its terms of reference as they relate to the MTN Group’s accounting, internal auditing, internal control and financial reporting practices and in terms of section 94(7)(a-i) of the Companies Act.
The committee performed the following activities during the year under review:considered the effectiveness of the internal audit function and monitored adherence to the annual internal audit plan;received and reviewed reports from both internal and external auditors concerning the effectiveness of the internal control environment, systems and processes. Nothing has come to the attention of the committee to indicate that any material breakdown in the functioning of these internal controls, systems and processes has occurred during the year under review; reviewed the reports of both internal and external auditors detailing concerns arising from their audits and requested appropriate responses from management;received and reviewed reports from internal audit concerning the effectiveness of the internal financial controls and concluded that no major control deficiencies have been identified; reviewed the processes in place for the reporting of concerns and complaints relating to accounting practices, internal audit, contents of the Group’s financial statements, internal controls and related matters. The committee can confirm that there were no such complaints of substance during the year under review;reviewed the report prepared by internal audit regarding the risk management processes in operation in the Group and the extent to which such have been embedded within each operating division;reviewed and approved the Group’s policy for non-audit services that may be provided by the external auditors. This policy sets out those services that may be provided by the external auditors and the required authorisation process; approved the non-audit-related services performed by the external auditors in the year in accordance with the policy established and approved by the board;approved the external auditors’ fees for 2011; andconsidered the independence and objectivity of the external auditors and ensured that the scope of additional services provided did not impair their independence.
Report of the audit committee

MTN Group Limited Integrated Business Report for the year ended 31 December 201187
Grou
p ov
ervi
ewPe
rform
ance
revi
ewOp
erat
iona
l and
fin
ancia
l rev
iew
Sust
aina
bilit
yFi
nanc
ial s
tate
men
tsSh
areh
olde
r inf
orm
atio
n
The Group’s external auditors are PricewaterhouseCoopers Inc. (PwC) and SizweNtsalubaGobodo Inc. Fees paid to the auditors for the year under review are disclosed in note 6 to the annual financial statements.
After assessing the requirements set out in section 94(8)(a-c) of the Companies Act, the committee is satisfied with the independence and objectivity of the external auditors, and recommends the reappointment of the joint external auditors at the next annual general meeting.
Following the review by the committee of the annual financial statements of MTN Group for the year ended 31 December 2011 and based on the information provided to it, the committee considers that, in all material respects, the Group complies with the provisions of the Companies Act, as amended, International Financial Reporting Standards and the JSE Listings Requirements, and that the accounting policies applied are appropriate. The committee recommended the Group’s 2011 integrated business report and annual financial statements for approval by the board on 6 March 2012.
The committee is satisfied that the board has performed a solvency and liquidity test on the Company and has concluded that the Company will satisfy the test after payment of the final dividend.
In compliance with paragraph 3.84(h) of the JSE Listings Requirements, the committee reviewed the performance, appropriateness and expertise of the Group chief financial officer, Mr NI Patel, and was satisfied with his expertise and experience. The committee has satisfied itself that Mr NI Patel has the appropriate expertise and experience to fulfill this role and has performed appropriately during the year under review, and that the resources and expertise of the finance function are appropriate and adequate.
AF van BiljonAudit committee chairman
Fairland6 March 2012
MTN Group Limited Integrated Business Report for the year ended 31 December 201188
The directors’ report forms part of the audited financial statements of the Company and the Group for the year ended 31 December 2011.
Nature of business MTN Group Limited, incorporated on 23 November 1994, carries on the business of investing in the telecommunications industry through its subsidiary companies, joint ventures and associated companies. The Group is listed on the JSE Limited.
Details of the Company’s registered address are set out on page 223 of the integrated business report.
Integrated business report The board acknowledges its responsibility for the integrity of this integrated business report. Guidelines as provided by King III have been adopted in preparation of this integrated business report.
International Financial Reporting Standards (IFRS) The Group and Company financial statements were prepared in accordance with IFRS. Financial results The Group recorded a profit after tax for the year ended 31 December 2011 of R23 787 million (2010: R16 827 million).
Full details of the financial results of the Group and Company are set out on pages 92 to 207 of these financial statements and accompanying notes for the year ended 31 December 2011.
Details on the capital expenditure by the business are set out on pages 104 of the integrated business report.
Year under review The detailed reviews and the activities of the Group are contained in the reports of the chairman, the Group president and chief executive officer (CEO), and the Group chief financial officer (CFO) and are set out on pages 24 to 31 of the integrated business report.
Subsidiary companiesDetails of entities in which the Group has a direct or indirect interest are set out in Annexure 1 of the integrated business report on pages 208.
All Group subsidiaries have a year end consistent with that of the Company, with the exception of Irancell Telecommunications Services Company (Private Joint Stock) (MTN Irancell), which has a year end of 21 December, due to statutory requirements in Iran.
Distribution to shareholders Final dividend A final dividend of 476 cents per share (2010: 349 cents per share) amounting to R8 940 million (excluding treasury shares) (2010: R6 577 million) in respect of the financial year ended 31 December 2011 was declared on 6 March 2012, payable to shareholders registered on 23 March 2012.
Before declaring the final dividend, the board:applied the solvency and liquidity test on the Company; andreasonably concluded that the Company will satisfy the solvency and liquidity test immediately after payment of the final dividend.
The final dividend will be paid within 120 days of the board’s performance of the solvency and liquidity test.
Interim dividend An interim dividend of 273 cents per share (2010: 151 cents per share) amounting to R5 145 million (2010: R2 779 million) in respect of the half year period ended 30 June 2011 was declared on Thursday, 18 August 2011, paid to shareholders registered on Monday, 16 September 2011.
Dividend payment policy adjustmentDue to the Group’s strong financial position, the board approved an increase in the dividend payment policy. The dividend payment policy was increased to 70% of annual adjusted headline earnings per share (EPS). The interim dividend was based on 30% of the prior year’s adjusted headline EPS.
The payments of future dividends will depend on the board’s ongoing assessment of the Group’s earnings, financial position, cash needs, future earnings prospects and other factors.
Directors’ reportfor the year ended 31 December 2011

MTN Group Limited Integrated Business Report for the year ended 31 December 201189
Grou
p ov
ervi
ewPe
rform
ance
revi
ewOp
erat
iona
l and
fin
ancia
l rev
iew
Sust
aina
bilit
yFi
nanc
ial s
tate
men
tsSh
areh
olde
r inf
orm
atio
n
Shareholders on the South African register who dematerialised their ordinary shares receive payment of their dividends electronically, as provided for by STRATE. For those shareholders who have not yet dematerialised their shareholding in the Company in certificated form, the Company operates an electronic funds transmission service, whereby dividends may be electronically transferred to shareholders’ bank accounts. These shareholders are encouraged to mandate this method of payment for all future dividends, by approaching our share registrar, Computershare Investor Services Proprietary Limited, whose contact details are set out on page 230 of the notice of the annual general meeting.
Share capitalAuthorised share capitalThere was no change in the authorised share capital of the Company during the year under review. The Company’s authorised ordinary share capital of MTN Group is 2,5 billion shares of 0,01 cent each.
Issued share capitalThe issued share capital of the Company is R188 481 (2010: R188 451) comprising 1 884 811 569 (2010: 1 884 510 117) ordinary shares of 0,01 cent each. The issued share capital of the Company was increased during the year by the allotment and issue of shares to employees who exercised share options in terms of the MTN Group Limited share option scheme. The allotments were as follows:
Options exercised and allotted
2011 2010
Number of shares
Strike priceR13,53 107 734 84 290R9,31 88 330 250 740R27,00 12 240 52 806R40,50 93 148 159 426
Details on the MTN Zakhele Scheme are set out in note 47.
Details of participation in the MTN Zakhele Scheme by MTN directors, directors of major subsidiaries and the company secretary are set out on page 73�of the integrated business report.
Control of unissued share capitalThe unissued ordinary shares are the subject of a general authority granted to the directors in terms of section 38 of the Companies Act. As this general authority remains valid only until the next annual general meeting, which is to be held on 29 May 2012, members will be asked at that meeting to consider an ordinary resolution placing the said unissued ordinary shares, up to a maximum of 10% of the Company’s issued share capital, under the control of the directors until the next annual general meeting.
Acquisition of the Company’s own shares At the last annual general meeting held on 22 June 2011, shareholders gave the Company or any of its subsidiaries a general approval in terms of section 48 of the Companies Act, by way of special resolution, for the acquisition of its own shares. As this general approval remains valid only until the next annual general meeting, which is to be held on 29 May 2012, members will be asked at that meeting to consider a special resolution to renew this general approval until the next annual general meeting, subject to a maximum extension of 15 months.
2011 2010
Number of shares

MTN Group Limited Integrated Business Report for the year ended 31 December 201190
During the year under review a subsidiary of the Group acquired 6 764 412 shares in the Company at an average share price of R137,50, including costs.
Further details of the authorised and issued shares are set out in note 20.
Shareholders’ interestsDetails of shareholders’ interest and a shareholder spread analysis are set out on pages 206 and 207 of the integrated business report.
Share price performanceDetails of the share price performance of the Company is disclosed on page 228 of the integrated business report.
DirectorateThe composition and profiles of the board of directors of the Company are set out on page 64 and the information on the board and board committees, its activities, meetings and attendance is set out in the corporate governance statement appearing on page 54 of the integrated business report.
Details of directors’ remuneration and shareholding are set out in the remuneration report on pages 64 and 73 of the integrated business report.
Company secretaryThe details of the company secretary are set on page 52 of the integrated business report.
DirectorsRetirement by rotation of directorsIn accordance with the Company’s memorandum of incorporation (MOI) AF van Biljon, A Harper, NP Mageza and MLD Marole retire by rotation at the forthcoming annual general meeting. The retiring directors, being eligible, offer themselves for re-election.
The profiles of the directors retiring by rotation and seeking re-election are set out on page 216 of the integrated business report.
Resignations and appointmentsDuring the year under review the following resignations were received:
DDB Band tendered his resignation effective 11 March 2011, in order to reduce his directorship; andPF Nhleko tendered his resignation effective 31 March 2011, following the expiry of the term of contract.
PF Nhleko’s resignation as a director coincided with the termination of his contract of employment as Group president and CEO. RS Dabengwa succeeded PF Nhleko as Group president and CEO, with effect from 1 April 2011.
Interests of directors and officers Details of the interests of directors and officers are provided in the remuneration report on page 72 of the integrated business report.
Directors’ and prescribed officers’ shareholdings and dealings Details of the directors’ and prescribed officers’ shareholdings and dealings are provided in the remuneration report on page 73 of the integrated business report.
Employee share schemes Details of the Group’s share schemes are provided in note 47.
Material resolutions During the year there were no material resolutions in the Company or its subsidiary companies.
Mergers and acquisitions Details of the MTN Group’s acquisitions and disposals are disclosed in note 44.
Directors’ report continuedfor the year ended 31 December 2011

MTN Group Limited Integrated Business Report for the year ended 31 December 201191
Grou
p ov
ervi
ewPe
rform
ance
revi
ewOp
erat
iona
l and
fin
ancia
l rev
iew
Sust
aina
bilit
yFi
nanc
ial s
tate
men
tsSh
areh
olde
r inf
orm
atio
n
Property, plant and equipment Ghana Tower InterCo BV (TowerCo Ghana)As part of the Group strategy to embark on infrastructure sharing, the Group, in 2010, entered into an agreement with American Tower Corporation (ATC) for the establishment of a joint initiative in Ghana (TowerCo Ghana). ATC is a leading owner, operator and developer of wireless and broadcast communications sites. TowerCo Ghana is managed by ATC, ATC holds a 51% share and the Group owns a 49% share. The transaction involved the sale of 1 856 of MTN Ghana’s existing sites to TowerCo Ghana for an agreed purchase price of USD498 million. The transaction required ATC to pay up to approximately USD219 million for its 51% stake in the holding company.
Uganda Tower InterCo BV (TowerCo Uganda)On 9 December 2011, the Group announced that it had entered into an agreement for the establishment of a joint initiative in Uganda (TowerCo Uganda). TowerCo Uganda is managed by ATC, ATC holds a 51% share and the Group owns a 49% share. The transaction involves the sale of approximately 997 of MTN Uganda’s existing sites to TowerCo Uganda for an agreed purchase price of USD175 million. This requires ATC to pay up to approximately USD89 million for its 51% stake in the holding company. ATC and MTN Uganda expect to close the transaction during the first half of 2012, subject to customary closing conditions.
Events after the reporting period Potential litigation by Turkcell Iletism Hizmetlera AS (Turkcell)On 2 February 2012, Turkcell, the largest mobile phone operator in Turkey, indicated its intention to bring a legal claim against the Group and its Iranian joint venture, Irancell Telecommunications Services Company Proprietary Limited, of which the Group holds 49%. The claim, which Turkcell intends to bring before a United States (US) court, is based on allegations that the Group violated certain US laws in its effort to obtain Iran’s second GSM licence.
The Group’s board, on legal advice, believes that the Turkcell claim lacks legal merit and that a US court would not have jurisdiction to hear the claim.
American depository receipt facility A sponsored American depository receipt facility has been established. This facility is sponsored by the Bank of New York and details of the administrators are reflected on page 230�of the integrated business report.
Borrowing powers In terms of the articles of association of the Company, the borrowing powers of the Company are unlimited, however, all borrowings by the Group are subject to limitations expressed in the treasury policy of the Group. The details of borrowings are disclosed in note 22.
Going concernThe directors have reviewed the Group’s budget and cash flow forecast for the year to 31 December 2012. On the basis of this review, and in the light of the current financial position and existing borrowing facilities, the directors are satisfied that the Group has access to adequate resources to continue in operational existence for the foreseeable future and is a going concern and has continued to adopt the going concern basis in preparing the financial statements.
Audit committee The report of the audit committee appears on page 86 of the integrated business report.
Auditors PricewaterhouseCoopers Inc. and SizweNtsalubaGobodo Inc. will continue in office as joint auditors in accordance with section 90 of the Companies Act. The audit committee reviewed the independence of the auditors during the period under review and satisfied itself that the auditors were independent of the Group.

MTN Group Limited Integrated Business Report for the year ended 31 December 201192
Note2011
Rm2010
Rm
Revenue 4 121 884 114 684Other income 5 1 458 —Direct network operating costs (18 782) (16 818)Costs of handsets and other accessories (8 160) (6 819)Interconnect and roaming (13 395) (12 593)Employee benefits 6 (6 754) (5 961)Selling, distribution and marketing expenses (14 805) (14 741)Other operating expenses (6 793) (10 446)Reversal of impairment of property, plant and equipment 11 97 231Depreciation of property, plant and equipment 11 (13 296) (13 248)Amortisation of intangible assets 12 (2 163) (2 120)Impairment of goodwill 12 (31) (32)
Operating profit 6 39 260 32 137Finance income 7 5 028 2 077Finance costs 7 (6 610) (6 171)Share of results of associates 13 (38) 52
Profit before tax 37 640 28 095Income tax expense 8 (13 853) (11 268)
Profit after tax 23 787 16 827
Attributable toEquity holders of the Company 20 754 14 300Non-controlling interests 3 033 2 527
23 787 16 827
Basic earnings per share (cents) 9 1 119,5 776,2Diluted earnings per share (cents) 9 1 110,8 764,5
The notes on pages 97 to 193 are an integral part of these Group financial statements.
Note2011
Rm2010
Rm
Group income statementfor the year ended 31 December 2011

MTN Group Limited Integrated Business Report for the year ended 31 December 201193
Grou
p ov
ervi
ewPe
rform
ance
revi
ewOp
erat
iona
l and
fin
ancia
l rev
iew
Sust
aina
bilit
yFi
nanc
ial s
tate
men
tsSh
areh
olde
r inf
orm
atio
n
Group statement of comprehensive incomefor the year ended 31 December 2011
2011Rm
2010Rm
Profit after tax 23 787 16 827Other comprehensive income:Exchange differences on translating foreign operations* 10 796 (9 811)
Equity holders of the Company 10 415 (9 318)Non-controlling interests 381 (493)
Cash flow hedges attributable to equity holders of the Company — 77
Total comprehensive income for the year 34 583 7 093
Attributable toEquity holders of the Company 31 169 5 059Non-controlling interests 3 414 2 034
34 583 7 093
* This component of other comprehensive income does not attract any tax.The notes on pages 97 to 193 are an integral part of these Group financial statements.
2011Rm
2010Rm

MTN Group Limited Integrated Business Report for the year ended 31 December 201194
Group statement of financial positionat 31 December 2011
Note2011
Rm2010
Rm
ASSETSNon-current assets 113 787 99 727Property, plant and equipment 11 71 610 63 361Intangible assets and goodwill 12 34 540 30 266Investment in associates 13 2 681 1 302Loans and other non-current receivables 14 3 672 3 391Deferred tax assets 15 1 284 1 407
Current assets 67 621 55 059
Non-current assets held for sale 19 820 82566 801 54 234
Inventories 16 2 629 1 589Trade and other receivables 17 17 916 13 234Taxation prepaid 28 415 721Current portion of loans and other non-current receivables 14 — 2 458Current investments 18 9 480 —Derivative assets 41 9 —Restricted cash 30 546 285Cash and cash equivalents 29 35 806 35 947
Total assets 181 408 154 786EQUITYOrdinary shares and share premium 20 44 678 45 602Retained earnings 56 567 48 977Other reserves 21 (12 348) (22 724)
Attributable to equity holders of the Company 88 897 71 855Non-controlling interests 3 802 2 219
Total equity 92 699 74 074LIABILITIESNon-current liabilities 33 392 33 995Borrowings 22 23 554 24 857Deferred tax liabilities 15 8 036 7 040Other non-current liabilities 23 1 802 1 927Put option liabilities 24 — 171
Current liabilities 55 317 46 717Trade and other payables 25 25 054 20 055Unearned income 7 330 5 750Provisions 26 3 252 3 102Taxation liabilities 28 9 037 4 459Borrowings 22 9 869 10 431Derivative liabilities 41 4 255Put option liabilities 24 178 2 625Bank overdrafts 29 593 40
Total liabilities 88 709 80 712Total equity and liabilities 181 408 154 786
The notes on pages 97 to 193 are an integral part of these Group financial statements.
Note2011
Rm2010
Rm

MTN Group Limited Integrated Business Report for the year ended 31 December 201195
Grou
p ov
ervi
ewPe
rform
ance
revi
ewOp
erat
iona
l and
fin
ancia
l rev
iew
Sust
aina
bilit
yFi
nanc
ial s
tate
men
tsSh
areh
olde
r inf
orm
atio
n
Group statement of changes in equityfor the year ended 31 December 2011
Sharecapital
Rm
Sharepremium
Rm
Retained earnings
Rm
Otherreserves
Rm
Attri-butable
to equityholders
of the Company
Rm
Non-controlling
interests Rm
Total equity
Rm
Balance at 1 January 2010 * 44 297 40 990 (15 276) 70 011 2 855 72 866Transactions with non-controlling interests — — — 60 60 — 60Shares issued during the year * 11 — — 11 — 11MTN Zakhele transactions * 1 294 — 1 382 2 676 — 2 676Employee share option plan — — — 171 171 — 171Share-based payments reserve — — — 87 87 — 87Total comprehensive income — — 14 300 (9 241) 5 059 2 034 7 093
Profit after tax — — 14 300 — 14 300 2 527 16 827 Other comprehensive income — — — (9 241) (9 241) (493) (9 734)
Dividends paid — — (6 313) — (6 313) (2 770) (9 083)Other movements — — — 93 93 100 193
Balance at 31 December 2010 * 45 602 48 977 (22 724) 71 855 2 219 74 074
Balance at 1 January 2011 * 45 602 48 977 (22 724) 71 855 2 219 74 074Share buy-back * (930) — — (930) — (930)Shares issued during the year * 6 — — 6 — 6Transfer between reserves — — 37 (37) — — —Settlement of put option — — (1 603) (59) (1 662) 1 662 —Transactions with non-controlling interests — — — (30) (30) (224) (254)Share-based payment reserve — — — 74 74 — 74Total comprehensive income — — 20 754 10 415 31 169 3 414 34 583
Profit after tax — — 20 754 — 20 754 3 033 23 787 Other comprehensive income — — — 10 415 10 415 381 10 796
Dividends paid — — (11 722) — (11 722) (2 954) (14 676)Other movements — — 124 13 137 (315) (178)
Balance at 31 December 2011 * 44 678 56 567 (12 348) 88 897 3 802 92 699
Note 20 20 21
The notes on pages 97 to 193 are an integral part of these Group financial statements.
*Amounts less than R1 million.
Sharecapital
Rm
Sharepremium
Rm
Retained earnings
Rm
Otherreserves
Rm
Attri-butable
to equityholders
of theCompany
Rm
Non-controlling
interests Rm
Totalequity
Rm

MTN Group Limited Integrated Business Report for the year ended 31 December 201196
Note2011
Rm2010
Rm
CASH FLOWS FROM OPERATING ACTIVITIESCash generated from operations 27 50 277 50 536Finance income received 1 982 1 207Finance costs paid (3 341) (2 674)Dividends paid to equity holders of the Company (11 722) (6 313)Income taxes paid 28 (9 414) (8 028)Dividends received from associate 13 92 —
Net cash generated from operating activities 27 874 34 728
CASH FLOWS FROM INVESTING ACTIVITIESAcquisition of property, plant and equipment (14 103) (15 343)
– to maintain operations (1 024) (1 338)– to expand operations (13 079) (14 005)
Proceeds from sale of property, plant and equipment and intangible assets 36 162Acquisition of intangible assets (1 488) (1 235)Loans repaid 2 271 758Loans granted (126) —Increase in investment in associates (1 915) —Investment in bonds, treasury bills and foreign deposits (8 508) — Proceeds on disposal of non-current assets held for sale 5 3 217 — Increase in prepayments — (43)
Net cash used in investing activities (20 616) (15 701)
CASH FLOWS FROM FINANCING ACTIVITIESDividends paid to non-controlling interests (2 647) (2 196)Proceeds from the issuance of ordinary shares and share options 6 1 306Cash (outflow)/inflow from changes in shareholding 45.1 (254) 124Acquisition of treasury shares (930) —Proceeds from borrowings 4 848 6 724Repayments of borrowings (10 007) (8 263)(Increase)/decrease in restricted cash (182) 369Settlement of Nigeria put option (2 817) —Other financing activities (50) (119)
Net cash used in financing activities (12 033) (2 055)
Net (decrease)/increase in cash and cash equivalents (4 775) 16 972Cash and cash equivalents at beginning of year 35 907 22 646Exchange gains/(losses) on cash and cash equivalents 4 081 (3 711)
Cash and cash equivalents at end of the year 29 35 213 35 907
The notes on pages 97 to 193 are an integral part of these Group financial statements.The cash flows shown above are presented net of VAT.
Note2011
Rm2010
Rm
Group statement of cash flowsfor the year ended 31 December 2011

MTN Group Limited Integrated Business Report for the year ended 31 December 201197
Grou
p ov
ervi
ewPe
rform
ance
revi
ewOp
erat
iona
l and
fin
ancia
l rev
iew
Sust
aina
bilit
yFi
nanc
ial s
tate
men
tsSh
areh
olde
r inf
orm
atio
n
Notes to the Group financial statementsfor the year ended 31 December 2011
1. PRINCIPAL ACCOUNTING POLICIES1.1 Basis of preparation
The principal accounting policies applied in the preparation of these consolidated financial statements are set out below and in the related notes to the Group financial statements and are consistent with those adopted in the prior year, unless otherwise stated.
The consolidated financial statements have been prepared in accordance with International Financial Reporting Standards (IFRS) as issued by the International Accounting Standards Board (IASB) and comply with the AC 500 standards as issued by the Accounting Practices Board, the JSE Listing Requirements and the requirements of the South African Companies Act No 71 of 2008. The Group has adopted all new standards issued in terms of IFRS that became effective in the current reporting period. These standards did not have any material impact on the Group.
The financial statements have been prepared on the historical cost basis, except for certain financial and equity instruments that have been measured at fair value. The methods used to measure fair value are discussed further in the accounting policies in the respective notes.
Amounts are rounded to the nearest million with the exception of earnings per share and the related shares (note 9), ordinary share capital (note 20) and share-based payments (note 47).
The preparation of financial statements in conformity with IFRS requires management to make judgements, estimates and assumptions that affect the application of accounting policies and the reported amounts of assets, liabilities, income and expenses. Actual results may differ from these estimates. Estimates and underlying assumptions are reviewed on an ongoing basis. Revisions to accounting estimates are recognised in the period in which the estimates are revised and in any future periods affected. Information about significant areas of estimation uncertainty and critical judgements in applying accounting policies that have the most significant effect on the amounts recognised in the consolidated financial statements are included in note 2.
The significant accounting policies adopted by the Group and Company are included within the notes to which they relate and are shaded in blue.
1.2 Going concernThe Group’s and Company’s forecasts and projections, taking account of reasonably possible changes in trading performance, show that the Group and Company should be able to operate within its current funding levels.
After making enquiries, the directors have a reasonable expectation that the Group and Company have adequate resources to continue in operational existence for the foreseeable future. The Group and Company therefore continue to adopt the going-concern basis in preparing the financial statements.

MTN Group Limited Integrated Business Report for the year ended 31 December 201198
1. PRINCIPAL ACCOUNTING POLICIES (continued)1.3 Consolidation of subsidiaries
The Group financial statements incorporate the financial statements of MTN Group Limited and all its subsidiaries, joint ventures, associates and special purpose entities (SPEs) for the reporting date 31 December 2011 on the basis outlined below.
Subsidiaries are all entities (including SPEs) controlled by the Group. Control exists when the Group has the power to govern the financial and operating policies of an entity so as to obtain benefits from its activities, generally accompanying shareholding of more than one-half of the voting rights. The existence and effect of potential voting rights that are currently exercisable or currently convertible are considered when assessing whether the Group has the power to control another entity. The Group also assesses existence of control where it does not have more than 50% of the voting power but is able to govern the financial and operating policies by virtue of de facto control. De facto control may arise in circumstances where the size of the Group’s voting rights relative to the size and dispersion of holdings of other shareholders give the Group the power to govern the financial and operating policies. Subsidiaries are fully consolidated from the date on which control is transferred to the Group and are deconsolidated from the date that control ceases.
SPEs (including insurance cell captives and the various MTN Group share schemes) are consolidated when the substance of the relationship indicates that the SPE is controlled by the Group. The following indicators are considered:
in substance, the activities of the SPE are being conducted on behalf of the entity according to its specific business needs so that the entity obtains benefits from the SPE’s operation;in substance, the entity has the decision-making powers to obtain the majority of the benefits of the activities of the SPE or, by setting up an “autopilot” mechanism, the entity has delegated these decision-making powers;in substance, the entity has rights to obtain the majority of the benefits of the SPE and therefore may be exposed to risks incidental to the activities of the SPE; orin substance, the entity retains the majority of the residual or ownership risks related to the SPE or its assets in order to obtain benefits from its activities.
All intercompany transactions, balances and unrealised gains on transactions between Group companies are eliminated on consolidation. Unrealised losses are also eliminated and are considered an impairment indicator of the asset transferred.
Non-controlling interests in the net assets of consolidated subsidiaries are identified separately from the Group’s equity. Non-controlling interests consist of the amount of those interests at the date of the business combination and the non-controlling interests’ share of changes in equity since the acquisition date. Total comprehensive income is attributed to non-controlling interests even if this results in the non-controlling interests having a deficit balance.
The acquisition method of accounting is used to account for the acquisition of subsidiaries by the Group. The consideration transferred is measured at the fair value of the assets given, equity instruments issued and liabilities incurred or assumed at the date of acquisition. The consideration transferred includes the fair value of any asset or liability resulting from a contingent consideration arrangement. Acquisition-related costs are recognised in profit or loss. Identifiable assets acquired and liabilities and contingent liabilities assumed in a business combination are measured initially at their fair values at the acquisition date, irrespective of the extent of any non-controlling interests.
Goodwill is measured as the excess of the sum of the consideration transferred, the amount of any non-controlling interests in the acquiree, and the fair value of the acquirer’s previously held equity interest in the acquiree (if any) over the net of the acquisition date amounts of the identifiable assets acquired and the liabilities assumed. If, after reassessment, the net of the acquisition date amounts of the identifiable assets acquired and liabilities assumed exceeds the sum of the consideration transferred, the amount of any non-controlling interests in the acquiree and the fair value of the acquirer’s previously held interest in the acquiree (if any), such excess is recognised immediately in profit or loss as a bargain purchase gain.
Notes to the Group financial statements continuedfor the year ended 31 December 2011

MTN Group Limited Integrated Business Report for the year ended 31 December 201199
Grou
p ov
ervi
ewPe
rform
ance
revi
ewOp
erat
iona
l and
fin
ancia
l rev
iew
Sust
aina
bilit
yFi
nanc
ial s
tate
men
tsSh
areh
olde
r inf
orm
atio
n
1. PRINCIPAL ACCOUNTING POLICIES (continued)1.3 Consolidation of subsidiaries (continued)
When the consideration transferred by the Group in a business combination includes assets or liabilities resulting from a contingent consideration arrangement, the contingent consideration is measured at its acquisition date fair value and included as part of the consideration transferred. Changes in the fair value of the contingent consideration that qualify as measurement period adjustments are adjusted retrospectively, with corresponding adjustments against goodwill. Measurement period adjustments are adjustments that arise from additional information obtained during the “measurement period” (which cannot exceed one year from the acquisition date) about facts and circumstances that existed at the acquisition date.
The subsequent accounting for changes in the fair value of the contingent consideration that do not qualify as measurement period adjustments depends on how the contingent consideration is classified. Contingent consideration that is classified as equity is not remeasured at subsequent reporting dates and its subsequent settlement is accounted for within equity. Contingent consideration that is classified as an asset or a liability is remeasured at subsequent reporting dates in accordance with IAS 39 Financial Instruments: Recognition and Measurement, or IAS 37 Provisions, Contingent Liabilities and Contingent Assets, as appropriate, with the corresponding gain or loss being recognised in profit or loss.
When a business combination is achieved in stages, the Group’s previously held equity interest in the acquiree is remeasured to fair value at the acquisition date (ie the date when the Group obtains control) and the resulting gain or loss, if any, is recognised in profit or loss. Amounts arising from an interest in the acquiree prior to the acquisition date that have previously been recognised in other comprehensive income, are reclassified to profit or loss where such treatment would be appropriate if that interest were disposed of.
Non-controlling interests in the acquiree may initially be measured either at fair value or at the non-controlling shareholders’ proportion of the net fair value of the identifiable assets acquired and liabilities and contingent liabilities assumed. The choice of measurement basis is made on an acquisition-by-acquisition basis.
Non-controlling shareholders are treated as equity participants and, therefore, all acquisitions of non-controlling interests or disposals by the Group of its non-controlling interests in subsidiary companies where control is maintained subsequent to the disposal are accounted for as equity transactions with non-controlling shareholders. Consequently, the difference between the purchase price and the book value of a non-controlling interest purchased is recorded in equity. All profits or losses arising as a result of the disposal of interests in subsidiaries to non-controlling shareholders, where control is maintained subsequent to the disposal, are also recorded in equity.
When the Group ceases to have control, any retained interest in the entity is remeasured to its fair value, with the change in carrying amount recognised in profit or loss. The fair value is the initial carrying amount for the purposes of subsequently accounting for the retained interest as an associate, joint venture or financial asset. In addition, any amounts previously recognised in other comprehensive income in respect of that entity are accounted for as if the Group had directly disposed of the related assets or liabilities. This may mean that amounts previously recognised in other comprehensive income are reclassified to profit or loss.
Accounting policies of subsidiaries have been changed where necessary to align them with the policies adopted by the Group.
The Group accounts for investments in subsidiaries at cost, less accumulated impairment losses.

MTN Group Limited Integrated Business Report for the year ended 31 December 2011100
1. PRINCIPAL ACCOUNTING POLICIES (continued)1.4 Foreign currency1.4.1 Functional and presentation currency
Items included in the financial statements of each entity in the Group are measured using the currency that best reflects the primary economic environment in which the entity operates (the functional currency). The Group financial statements are presented in South African rand, which is the functional and presentation currency of the parent company and the presentation currency of the Group.
1.4.2 Translation of foreign operationsThe financial statements of all Group entities (none of which have the currency of a hyperinflationary economy) that have a functional currency different from the presentation currency of the Group are translated into the presentation currency as follows:
assets and liabilities are translated at rates of exchange ruling at the reporting date;specific transactions in equity are translated at rates of exchange ruling at the transaction dates;income and expenditure and cash flow items are translated at weighted average exchange rates for the period; andforeign exchange translation differences are recognised as other comprehensive income.
An entity may have a monetary item that is receivable from or payable to a foreign operation. An item for which settlement is neither planned nor likely to occur in the foreseeable future is, in substance, a part of the entity’s net investment in that foreign operation. On consolidation, exchange differences arising from the translation of the net investment in foreign operations are taken to other comprehensive income. When a foreign operation is partially disposed of or sold, exchange differences that were recorded in equity are recognised in profit or loss as part of the gain or loss on sale.
Goodwill and fair value adjustments arising on the acquisition of a foreign entity are treated as assets and liabilities of the foreign entity and translated at the exchange rate ruling at the reporting date. Exchange differences arising are recognised in other comprehensive income.
1.4.3 Disposal of foreign operationsOn the disposal of a foreign operation, all of the exchange differences accumulated in equity in respect of that operation attributable to the equity holders of the Group are reclassified to profit or loss.
In the case of a partial disposal that does not result in the Group losing control over a subsidiary that includes a foreign operation, the proportionate share of accumulated exchange differences are re-attributed to non-controlling interests and are not recognised in profit or loss. For all other partial disposals, the proportionate share of the accumulated exchange differences are reclassified to profit or loss.
1.5 New accounting pronouncementsThe Group has adopted all the new, revised or amended accounting pronouncements as issued by the IASB which were effective for the Group from 1 January 2011. None of the adopted pronouncements had a material impact on the Group’s results for the year ended 31 December 2011.
Notes to the Group financial statements continuedfor the year ended 31 December 2011

MTN Group Limited Integrated Business Report for the year ended 31 December 2011101
Grou
p ov
ervi
ewPe
rform
ance
revi
ewOp
erat
iona
l and
fin
ancia
l rev
iew
Sust
aina
bilit
yFi
nanc
ial s
tate
men
tsSh
areh
olde
r inf
orm
atio
n
1. PRINCIPAL ACCOUNTING POLICIES (continued)1.5 New accounting pronouncements (continued)
The Group will adopt the following accounting pronouncements which are significant to the Group and will be effective in future reporting periods. The Group has elected not to early adopt the new standards. It is expected that the Group will adopt the new standards on their effective dates on a retrospective basis, unless otherwise stated.
Topic Key requirement Effective date
IFRS 9 Financial instruments
IFRS 9 is the first standard issued as part of a wider project to replace IAS 39. IFRS 9 retains but simplifies the mixed measurement model and establishes two primary measurement categories for financial assets: amortised cost and fair value. The basis of classification depends on the entity’s business model and the contractual cash flow characteristics of the financial asset. The guidance in IAS 39 on impairment of financial assets and hedge accounting continues to apply.
The adoption of IFRS 9 is not expected to change the measurement of the Group’s financial assets and liabilities significantly, but will result in a review of the classification of financial assets and liabilities.
1 January 2015
IFRS 10 Consolidated financial statements
The objective of IFRS 10 is to establish principles for the presentation and preparation of consolidated financial statements when an entity controls one or more other entities. IFRS 10 defines the principle of control and establishes it as the basis for consolidation. IFRS 10 sets out how to apply the principle of control to identify whether an investor controls an investee and therefore must consolidate the investee. It further sets out the accounting requirements for the preparation of consolidated financial statements.
IFRS 10 is not expected to result in a significant change in the financial results of the Group but will require a detailed analysis of existing control relationships.
1 January 2013
IFRS 11 Joint arrangements
IFRS 11 places a focus on rights and obligations of joint arrangements rather than its legal form. There are two types of joint arrangements: joint operations and joint ventures. Joint operations arise where a joint operator has rights to the assets and obligations relating to the arrangement and hence accounts for its interest in assets, liabilities, revenue and expenses. Joint ventures arise where the joint operator has rights to the net assets of the arrangement and hence equity accounts for its interest.
IFRS 11 introduces new requirements for the accounting of joint ventures as it requires equity accounting and eliminates the proportional consolidation option of accounting. The Group currently proportionally consolidates all joint ventures. This method of accounting entails that the Group includes its share of the assets, liabilities, income and expenses of the jointly controlled entity on a line-by-line basis in its financial statements. Under the equity method, the investment in the joint venture is initially recognised at cost and the carrying amount is increased or decreased to recognise the Group’s share of the profit or loss of the joint venture after the date of acquisition. The Group’s share of the profit or loss of the joint venture is recognised in a single line item in profit or loss under the equity method.
The change from proportional consolidation to equity accounting will result in a reduction in individual asset, liability, income and expense line items with no impact on equity or profit attributable to equity holders.
For more information of the joint arrangements that the Group is involved in, refer to note 38.
1 January 2013
IFRS 12 Disclosures of interests in other entities
IFRS 12 includes the disclosure requirements for all forms of interests in other entities, including joint arrangements, associates, special purpose vehicles and other off balance sheet vehicles.
IFRS 12 will only result in additional disclosures where required.
1 January 2013
IFRS 13 Fair value measurement
IFRS 13 aims to improve consistency and reduce complexity by providing a precise definition of fair value and a single source of fair value measurement and disclosure requirements for use across IFRS. The requirements do not extend the use of fair value accounting but provide guidance on how it should be applied where its use is already required or permitted by other standards within IFRS.
IFRS 13 will be applied prospectively and is not expected to have a significant impact on the financial results of the Group.
1 January 2013
TopicTT Key requirement Effective date

MTN Group Limited Integrated Business Report for the year ended 31 December 2011102
2. CRITICAL ACCOUNTING ESTIMATES AND ASSUMPTIONSThe Group makes estimates and assumptions concerning the future. Actual results may differ from these estimates. The estimates and assumptions that have a significant risk of causing a material adjustment to the carrying amounts of assets and liabilities within the next financial year are discussed below:
2.1 Impairment of goodwillThe Group tests goodwill for impairment on an annual basis, in accordance with the accounting policy disclosed in note 12. The recoverable amounts of cash-generating units have been determined based on value-in-use calculations. These calculations require the use of estimates and the input factors most sensitive to change have been disclosed in note 12.
The Group has performed a sensitivity analysis by varying these input factors by a reasonably possible margin and assessing whether the changes in input factors result in any of the goodwill allocated to appropriate cash-generating units being impaired. Goodwill was impaired by R31 million (2010: R32 million), refer note 12.
2.2 Impairment of trade receivablesThe Group determines impairment of trade receivables when objective evidence indicates that one or more events have had a negative effect on the estimated future cash flows of the trade receivables. Management exercises significant judgement in assessing the impact of adverse indicators and events on the recoverability of trade receivables using the indicators disclosed in the accounting policy in note 46.
The impairment loss is determined as the difference between the trade receivables carrying amounts and their estimated future cash flows. In the current year, an impairment loss of R455 million (2010: R224 million) was recognised, refer to note 46.
2.3 Residual values and useful lives of property, plant and equipment and intangible assetsResidual values and useful lives of property, plant and equipment and intangible assets are based on management estimates and take into account the expected usage of the asset, physical wear and tear, technical or commercial obsolescence and legal restrictions on the use of the assets. Residual values and useful lives are regularly reviewed and adjusted if appropriate.
2.4 Connection incentives and subscriber acquisition costsConnection incentives paid to service providers are expensed by the Group in the period incurred. Service providers utilise the incentives received from the Group to fund a variety of administrative costs and/or to provide incentives to maintain/sign up customers on behalf of the Group, at their own discretion. The portion of the incentive used by the respective service providers as an incentive to retain/obtain existing/new subscribers on behalf of the Group is capitalised only to the extent that it is reliably measurable (prepaid discount). In accordance with the framework under IFRS, the Group has resolved not to capitalise these fees due to the portion of incentives utilised to acquire/retain subscribers on behalf of the Group by the respective independent service providers not being reliably measurable.
In accordance with the recognition criteria in terms of IAS 38 Intangible Assets, the Group has also resolved not to capitalise commissions paid to dealers, utilised to acquire new subscribers, as intangible assets (subscriber acquisition cost), due to the portion utilised to acquire subscribers on behalf of the Group not being reliably measurable.
2.5 Interconnect revenue recognitionDue to the receipt of interconnect revenue in certain operations not being certain at transaction date, the Group has resolved only to recognise interconnect revenue relating to these operations as the cash is received.
Notes to the Group financial statements continuedfor the year ended 31 December 2011

MTN Group Limited Integrated Business Report for the year ended 31 December 2011103
Grou
p ov
ervi
ewPe
rform
ance
revi
ewOp
erat
iona
l and
fin
ancia
l rev
iew
Sust
aina
bilit
yFi
nanc
ial s
tate
men
tsSh
areh
olde
r inf
orm
atio
n
2. CRITICAL ACCOUNTING ESTIMATES AND ASSUMPTIONS (continued)2.6 Income taxes
The Group is subject to income taxes in numerous jurisdictions. Significant judgement is required in determining the worldwide provision for income taxes. There are many calculations and transactions for which the ultimate tax determination is uncertain during the ordinary course of business. The Group recognises liabilities for anticipated tax issues based on estimates of whether additional taxes will be due. Where the final outcome of these matters is different from the amounts that were initially recorded, such differences will impact the income tax and deferred tax provisions in the period in which such determination is made.
3. OPERATING SEGMENTS
The Group has three reportable segments, that are used by the Group executive committee (chief operating decision maker) to make key operating decisions, allocate resources and assess performance. The reportable segments are geographically differentiated regions, namely South and East Africa (SEA), West and Central Africa (WECA) and the Middle East and North Africa (MENA) regions.
The Group’s principal activities include the provision of network IT services, local, national and international telecommunications services; broadband and internet products and services; and converged fixed/mobile products and services.
Operating results are reported and reviewed regularly by the Group executive committee and include items directly attributable to a segment as well as those that can be attributed on a reasonable basis, whether from external transactions or from transactions with other Group segments.
Unallocated items mainly comprise corporate expenses which do not directly relate to the operating activities of the segments or which cannot be re-allocated on a reasonable basis. Segment results are determined before any adjustment for non-controlling interests.
Segment assets and liabilities comprise those operating assets and liabilities that are directly attributable to the segment or can be allocated to the segment on a reasonable basis.
EBITDA is used as a measure of reporting.

MTN Group Limited Integrated Business Report for the year ended 31 December 2011104
3. OPERATING SEGMENTS (continued)
South and East Africa
Rm
West and Central Africa
Rm
Middle East and
North AfricaRm
Head office companies
and eliminations**
RmConsolidated
Rm
2011RevenueExternal sales 45 106 52 579 24 009 190 121 884
Total revenue 45 106 52 579 24 009 190 121 884
EBITDA 15 637 29 716 8 220 1 177 54 750Depreciation of property, plant and equipment (3 855) (6 840) (2 547) (54) (13 296)Amortisation of intangible assets (574) (1 066) (510) (13) (2 163)Finance income (605) 832 213 4 588 5 028Finance costs (551) (2 106) (631) (3 322) (6 610)Impairment of goodwill (31) — — — (31)Share of results of associates 1 (107) 68 — (38)
Profit before tax 10 022 20 429 4 813 2 376 37 640Income tax expense (2 814) (6 784) (1 204) (3 051) (13 853)
Profit after tax 7 208 13 645 3 609 (675) 23 787
Segment assetsNon-current assets 23 784 35 848 13 437 40 718*** 113 787Current assets 16 379 22 396 13 142 15 704 67 621
Total assets 40 163 58 244 26 579 56 422 181 408
Segment liabilitiesNon-current liabilities 19 964 17 373 6 833 (10 778) 33 392Current liabilities 12 350 27 032 17 194 (1 259) 55 317
Total liabilities 32 314 44 405 24 027 (12 037) 88 709
Capital expenditure* 5 705 8 704 3 149 159 17 717
Average number of employees 6 945 6 451 4 882 262 18 540
*Capital expenditure comprises additions to property, plant and equipment and software. ** Head office and eliminations consist mainly of the Group’s central financing activities, management fees and dividends received from segments as well as intersegment
eliminations.***Goodwill is included in head office companies.
The Group is domiciled in South Africa. The result of its revenue from external customers in South Africa is R39 billion (2010: R37 billion) and the total of revenue from external customers from other countries is R83 billion (2010: R78 billion). The breakdown of the major components of the total of revenue from external customers from other countries is disclosed above. Total non-current assets in South Africa are R20 billion (2010: R19 billion).
South andEast Africa
Rm
West and Central Africa
Rm
Middle Eastand
North AfricaRm
Head office companies
and eliminations**
RmConsolidated
Rm
Notes to the Group financial statements continuedfor the year ended 31 December 2011

MTN Group Limited Integrated Business Report for the year ended 31 December 2011105
Grou
p ov
ervi
ewPe
rform
ance
revi
ewOp
erat
iona
l and
fin
ancia
l rev
iew
Sust
aina
bilit
yFi
nanc
ial s
tate
men
tsSh
areh
olde
r inf
orm
atio
n
3. OPERATING SEGMENTS (continued)
South and East Africa
Rm
West and Central Africa
Rm
Middle East and
North AfricaRm
Head office companies
and eliminations**
RmConsolidated
Rm
2010RevenueExternal sales 42 502 49 887 22 008 287 114 684
Total revenue 42 502 49 887 22 008 287 114 684
EBITDA 14 556 27 683 7 393 (2 095) 47 537Depreciation of property, plant and equipment (3 700) (7 226) (2 305) (17) (13 248)Amortisation of intangible assets (534) (859) (704) (23) (2 120)Finance income 236 500 770 571 2 077Finance costs (359) (1 948) (333) (3 531) (6 171)Impairment of goodwill — (32) — — (32)Share of results of associates (1) — 53 — 52
Profit before tax 10 198 18 118 4 874 (5 095) 28 095Income tax expense (2 687) (6 115) (1 134) (1 332) (11 268)
Profit after tax 7 511 12 003 3 740 (6 427) 16 827
Segment assetsNon-current assets 21 654 30 100 6 837 41 136 99 727Current assets 11 850 14 174 13 280 15 755 55 059
Total assets 33 504 44 274 20 117 56 891 154 786
Segment liabilitiesNon-current liabilities 12 027 16 850 3 586 1 532 33 995Current liabilities 12 282 15 363 14 739 4 333 46 717
Total liabilities 24 309 32 213 18 325 5 865 80 712
Capital expenditure* 5 421 9 919 3 402 724 19 466
Average number of employees 6 579 6 341 4 673 227 17 820
*Capital expenditure comprises additions to property, plant and equipment and software.** Head office and eliminations consist mainly of the Group’s central financing activities, management fees and dividends received from segments, as well as intersegment
eliminations.
South and East Africa
Rm
West andCentral Africa
Rm
Middle East and
North AfricaRm
Head office companies
and eliminations**
RmConsolidated
Rm

MTN Group Limited Integrated Business Report for the year ended 31 December 2011106
4. REVENUE
Revenue comprises the fair value of the consideration received or receivable from the sale of goods and services in the ordinary course of the Group’s activities. Revenue is shown, net of indirect taxes, estimated returns and trade discounts and after eliminating sales within the Group.
Revenue from the sale of goods and the rendering of services is recognised when it is probable that the economic benefits associated with a transaction will flow to the Group and the amount of revenue, and associated costs incurred or to be incurred, can be measured reliably. The amount of revenue is not considered to be reliably measurable until all contingencies relating to the sale have been resolved.
Postpaid and prepaid products with multiple deliverables are defined as multiple element arrangements. Postpaid products typically include the sale of a handset, activation fee and a service contract; and prepaid contracts include a subscriber identification module (SIM) card and airtime. These arrangements are divided into separate units of accounting, and revenue is recognised through application of the residual value method.
The Group operates loyalty programmes in certain subsidiaries where customers accumulate points for purchases made, which entitle them to discounts on future purchases. The reward points are recognised as a separately identifiable component of the initial sale transaction by allocating the fair value of the consideration received between the reward points and the other components of the sale such that the reward points are initially recognised as deferred income at their fair value. Revenue from the reward points is recognised when the points are redeemed. Breakage (forfeiture of points) is recognised when redemption becomes remote.
The main categories of revenue and the bases of recognition are as follows:
Postpaid/contract products:connection fees: revenue is recognised on the date of activation of a new SIM card;access charges: revenue is recognised in the period to which it relates; andairtime or data: revenue is recognised on the usage basis commencing on the date of activation.
The terms and conditions of bundled airtime products may allow for the carry over of unused value or minutes. The revenue related to the unused value or minutes is deferred and recognised when utilised by the customer or on termination of the contract.
Prepaid products:SIM kits: revenue is recognised on the date of sale;connection fees: revenue is recognised on the date of activation; andairtime or data: revenue is recognised on the usage basis commencing on the date of activation.
Unused amounts received are deferred and recognised when utilised by the customer or on termination of the customer relationship.
Dividend incomeDividend income is recognised when the right to receive payment is established.
Other revenue:equipment sales: all equipment sales to third parties are recognised only when risks and rewards of ownership are transferred to the buyer; andinterconnect/roaming: revenue is recognised on a usage basis, unless it is not probable on transaction date that the interconnect revenue will be received, in which case interconnect revenue is recognised only when the cash is received.
Notes to the Group financial statements continuedfor the year ended 31 December 2011

MTN Group Limited Integrated Business Report for the year ended 31 December 2011107
Grou
p ov
ervi
ewPe
rform
ance
revi
ewOp
erat
iona
l and
fin
ancia
l rev
iew
Sust
aina
bilit
yFi
nanc
ial s
tate
men
tsSh
areh
olde
r inf
orm
atio
n
4. REVENUE (continued)
2011Rm
2010Rm
Airtime and subscription 79 854 78 400Data 8 096 6 206SMS 7 501 6 570Interconnect 18 530 17 012Mobile telephones and accessories 5 030 3 678Other 2 873 2 818
121 884 114 684
5. OTHER INCOME
Other income is recognised when the risks and rewards of ownership of the assets are transferred to the buyer.
2011Rm
2010Rm
Profit on Ghana tower sale*Sale proceeds 3 217 —Carrying amount of assets disposed (1 133) —Effects of exchange rate differences 48 —Warranty provision (141) —Consultancy cost (34) —
Profit on disposal 1 957 —Elimination (772) —
Gain recognised on Ghana tower sale 1 185 —Other 273 —
1 458 —
* Scancom Limited (Ghana) concluded a transaction with American Tower Company (ATC) which involved the sale of 1 856 of Ghana’s existing base transceiver stations (BTS) sites to TowerCo Ghana for an amount of USD498 million. ATC holds a 51% stake in TowerCo Ghana’s holding company, with the remaining 49% stake held by the Group. This resulted in a sale and lease back transaction.
2011Rm
2010Rm
2011Rm
2010Rm

MTN Group Limited Integrated Business Report for the year ended 31 December 2011108
6. OPERATING PROFITThe following items have been included in arriving at operating profit:
2011Rm
2010Rm
Auditors’ remuneration (109) (96)
– Audit fees (82) (72)– Fees for other services (19) (18)– Expenses (8) (6)
Emoluments to directors and prescribed officers (note 43) (220) (60)
Operating lease rentals (1 676) (1 264)
– Property (1 454) (1 044)– Equipment and vehicles (222) (220)
Profit/(loss) on disposal of property, plant and equipment (note 27) 6 (146)Loss on disposal of non-current assets (note 27) (29) —Write-down of inventories (note 16) (67) (145)Impairment of trade receivables (note 17) (455) (224)
Short-term employee benefitsRemuneration to employees in respect of services rendered during a reporting period is expensed in that reporting period. A liability is recognised for accumulated leave and for non-vested short-term benefits when there is no realistic alternative other than to settle the liability, and at least one of the following conditions is met:
there is a formal plan and the amounts to be paid are determined before the time of issuing the financial statements; orachievement of previously agreed bonus criteria has created a valid expectation by employees that they will receive a bonus and the amount can be determined before the time of issuing the financial statements.
Share-based payment transactionsThe Group operates a number of share incentive schemes. For further details refer to note 47.
2011Rm
2010Rm
Notes to the Group financial statements continuedfor the year ended 31 December 2011

MTN Group Limited Integrated Business Report for the year ended 31 December 2011109
Grou
p ov
ervi
ewPe
rform
ance
revi
ewOp
erat
iona
l and
fin
ancia
l rev
iew
Sust
aina
bilit
yFi
nanc
ial s
tate
men
tsSh
areh
olde
r inf
orm
atio
n
6. OPERATING PROFIT (continued)
Defined contribution plansGroup companies operate various defined contribution plans. A defined contribution plan is a post-employment benefit plan (such as a pension plan) under which the Group pays a fixed percentage of employees’ remuneration as contributions into a separate entity (a fund), and will have no further legal or constructive obligations to pay additional contributions if the fund does not hold sufficient assets to pay all employee benefits relating to employee service in the current and prior periods. Contributions to defined contribution plans in respect of services rendered during a period are recognised as an employee benefit expense when they are due.
Termination benefitsTermination benefits may be payable when an employee’s employment is terminated before the normal retirement date due to death or retrenchment or whenever an employee accepts voluntary redundancy in exchange for these benefits. Termination benefits are recognised when the Group is demonstrably committed to any such plan without the possibility of withdrawal or to provide termination benefits as a result of an offer made to encourage voluntary redundancy and it is probable the offer will be accepted and the number of acceptances can be estimated reliably. Benefits falling due more than 12 months after reporting date are discounted to their present value. In the case of an offer made to encourage voluntary redundancy, the termination benefits are measured based on the number of employees expected to accept the offer.
2011 Rm
2010 Rm
Employee benefits (6 754) (5 961)
– Wages and salaries (5 441) (4 683)– Post-employment benefits (256) (241)– Share options granted to directors and employees (74) (87)– Training (261) (246)– Employee share option scheme — (171)– Other (722) (533)
Average number of employees 18 540 17 820
2011 Rm
2010Rm

MTN Group Limited Integrated Business Report for the year ended 31 December 2011110
7 . FINANCE INCOME AND FINANCE COSTS
Finance income comprises interest income on funds invested, dividend income, changes in the fair value of financial assets at fair value through profit or loss, foreign currency gains and gains on hedging instruments that are recognised in profit or loss. Interest income is recognised as it accrues in profit or loss, using the effective interest method.
Finance costs comprise interest expenses on borrowings, unwinding of the discount on provisions, changes in the fair value of financial assets at fair value through profit or loss, impairment losses recognised on financial assets, foreign exchange losses and any losses on hedging instruments that are recognised in profit or loss. All borrowing costs are recognised in profit or loss using the effective interest method, unless the borrowing costs are directly attributable to the acquisition, construction or production of qualifying assets, in which case the directly attributable borrowing costs are capitalised.
Foreign transactions and balancesForeign currency transactions are translated into the functional currency using the exchange rates at the dates of the transactions. Foreign exchange gains or losses resulting from the settlement of such transactions and from the translation at reporting date exchange rates of monetary assets and liabilities denominated in foreign currencies are recognised in profit or loss except when deferred in other comprehensive income as qualifying cash flow hedges. Foreign exchange gains or losses that relate to borrowings and cash and cash equivalents are presented in the income statement within finance income or costs.
2011 Rm
2010 Rm
Interest income on loans and receivables 79 244Interest income on bank deposits 2 233 916Foreign exchange gains 1 641 468Functional currency gains* 778 — Put options 297 449
Finance income 5 028 2 077
Interest expense on financial liabilities measured at amortised cost (3 766) (3 085)Foreign exchange losses (2 385) (1 392)Functional currency losses* — (1 223)Put options (459) (471)
Finance costs (6 610) (6 171)
Net finance costs recognised in profit or loss (1 582) (4 094)
* The functional currency of the Group’s operations in Mauritius is considered to be South African Rand for accounting purposes and the foreign exchange gains and losses for this entity are disclosed separately as functional currency gains or losses.
2011 Rm
2010 Rm
Notes to the Group financial statements continuedfor the year ended 31 December 2011

MTN Group Limited Integrated Business Report for the year ended 31 December 2011111
Grou
p ov
ervi
ewPe
rform
ance
revi
ewOp
erat
iona
l and
fin
ancia
l rev
iew
Sust
aina
bilit
yFi
nanc
ial s
tate
men
tsSh
areh
olde
r inf
orm
atio
n
8. INCOME TAX EXPENSE
The tax expense for the period comprises current and deferred tax. Tax is recognised in profit or loss, except to the extent it relates to items recognised in other comprehensive income or directly in equity. In this case the tax is also recognised in other comprehensive income or directly in equity, respectively.
Current income taxCurrent tax is the expected tax payable on taxable income for the year, using tax rates enacted or substantively enacted at the reporting date in the countries where the Company and its subsidiaries, joint ventures and associates operate and generate taxable income, and any adjustment to tax payable in respect of previous years. Management periodically evaluates positions taken in tax returns with respect to situations in which applicable tax regulations are subject to interpretation and establishes provisions where appropriate on the basis of amounts expected to be paid to the tax authorities.
Deferred taxDeferred tax is recognised using the liability method, providing for temporary differences arising between the tax bases of assets and liabilities and their carrying amounts in the consolidated financial statements for financial reporting purposes. Deferred tax is not recognised for the following temporary differences: the initial recognition of an asset or liability in a transaction (other than a business combination) that at the time of the transaction affects neither accounting nor taxable profit or loss, and differences relating to investments in subsidiaries and jointly controlled entities to the extent that it is probable that they will not reverse in the foreseeable future. In addition, deferred tax is not recognised for taxable temporary differences arising on the initial recognition of goodwill. Deferred tax is measured at tax rates (and laws) that have been enacted or substantively enacted at the reporting date and are expected to apply to temporary differences when they reverse.
Deferred tax assets and liabilities are offset if there is a legally enforceable right to offset current income tax liabilities and assets, and they relate to income taxes levied by the same tax authority on the same taxable entity.
Deferred tax is provided on temporary differences arising on investments in subsidiaries, associates and joint ventures except for deferred tax liabilities where the timing of the reversal of the temporary differences is controlled by the Group and it is probable that the temporary difference will not reverse in the foreseeable future.
A deferred tax asset is recognised for unused tax losses or deductible temporary differences only to the extent that it is probable that future taxable profit will be available against which the temporary differences can be utilised. Deferred tax assets are reviewed at each reporting date and are reduced to the extent that it is no longer probable that the related tax benefit will be realised.
Secondary taxation on companies (STC)STC is provided for at a rate of 10% on the amount by which dividends declared by the Group exceeds dividends received. Deferred tax on unutilised STC credits is recognised to the extent that STC payable on future dividend payments is likely to be available for set-off.

MTN Group Limited Integrated Business Report for the year ended 31 December 2011112
8. INCOME TAX EXPENSE (continued)
2011 Rm
2010 Rm
Analysis of tax expense for the yearNormal tax (10 184) (7 834)
– Current year (10 255) (7 766)– Adjustments in respect of the prior year 71 (68)
Deferred tax (note 15) (1 089) (1 984)
– Current year (1 123) (2 045)– Adjustments in respect of the prior year 34 61
Capital gains tax (73) (28)Foreign income and withholding taxes* (1 335) (786)Secondary tax on companies (1 172) (636)
(13 853) (11 268)
Secondary tax on companies**STC relating to post year end dividends 894 (658)
*Taxation for foreign jurisdictions is calculated at the rates that have been enacted or substantively enacted in the respective jurisdictions.** Effective 1 April 2012, STC will be replaced by dividends tax. This is tax on dividends in the hands of the shareholder, levied at a rate of 15% in terms of the Income Tax Act.
The table below explains the differences between the expected tax expense on continuing operations, at the South African statutory rate of 28% and the Group’s total tax expense for each year.
The Group’s effective tax rate is reconciled to the South African statutory tax rate as follows:
2011 %
2010 %
Tax rate reconciliationTax at statutory tax rate 28,00 28,00Expenses not allowed 1,61 2,60MTN Zakhele share costs – disallowed — 2,96Effect of different tax rates in other countries (0,20) (0,61)Income not subject to tax (0,24) (0,47)Nigeria put option revaluation 0,12 (0,01)Withholding taxes 3,55 2,80Effect of STC 3,11 2,26Capital gains tax 0,21 0,10Other 0,64 2,47
Effective tax rate 36,80 40,10
The Group holds investments in Afghanistan, Belgium, Benin, Botswana, Cameroon, Congo-Brazzaville, Côte d’Ivoire, Cyprus, Ghana, Guinea-Bissau, Guinea-Conakry, Iran, Kenya, Liberia, Mauritius, Monaco, Namibia, Netherlands, Nigeria, Rwanda, Sudan, Swaziland, Syria, Uganda, Yemen and Zambia. Taxation for these foreign jurisdictions is calculated at the rates that have been enacted or substantively enacted in the respective jurisdictions.
2011 Rm
2010Rm
2011 %
2010%
Notes to the Group financial statements continuedfor the year ended 31 December 2011

MTN Group Limited Integrated Business Report for the year ended 31 December 2011113
Grou
p ov
ervi
ewPe
rform
ance
revi
ewOp
erat
iona
l and
fin
ancia
l rev
iew
Sust
aina
bilit
yFi
nanc
ial s
tate
men
tsSh
areh
olde
r inf
orm
atio
n
9. EARNINGS PER SHARE
Basic earnings per shareEarnings per share is calculated using the weighted average number of ordinary shares in issue during the period and is based on the net profit attributable to ordinary shareholders. For the purpose of calculating earnings per ordinary share, treasury shares are deducted from the number of ordinary shares in issue.
Diluted earnings per share is calculated by adjusting the weighted average number of ordinary shares outstanding to assume conversion of all dilutive potential ordinary shares. The Company has dilutive potential ordinary shares which comprise share options and share rights issued in terms of the Group’s share schemes, performance share plan and the MTN Zakhele transaction outlined below.
For the share options and share rights, a calculation is done to determine the number of the Company’s shares that would be required at fair value to settle the monetary value of the rights, after deducting the unamortised share-based payment value. For the purposes of this calculation the average annual market share price of the Company is used.
Headline earnings per shareHeadline earnings per ordinary share are calculated using the weighted average number of ordinary shares in issue during the period and are based on the earnings attributable to ordinary shareholders, after excluding those items as required by Circular 3/2009 issued by the South African Institute of Chartered Accountants (SAICA).
In terms of the MTN Zakhele BBBEE transaction, the Group issued notional vendor financing shares to MTN Zakhele at par value. The Group has a call option over these shares. As these shares are potentially dilutive shares, these are included in the diluted earnings per share calculation. A calculation is done at each reporting period to determine the number of shares that could have been acquired at fair value.
2011’000
2010’000
Weighted average number of shares (excluding treasury shares) 1 853 922 1 842 210Adjusted for:– Share options – MTN Zakhele 12 328 2 111– Share options 377 820– Share appreciation rights 897 6 822– Performance share plan 799 —
Weighted average number of shares for diluted earnings per share calculation 1 868 323 1 851 963
Refer to note 20 for reconciliation of total shares in issue.
2011’000
2010’000

MTN Group Limited Integrated Business Report for the year ended 31 December 2011114
9. EARNINGS PER SHARE (continued)Reconciliation between net profit attributable to the equity holders of the Company and headline earnings
2011 2010
Rm Gross
Rm Net*
Rm Gross
RmNet*
Profit after tax 20 754 14 300
Adjusted for:Loss on disposal of property, plant and equipment and non-current assets* 23 21 146 126Reversal of impairment of property, plant and equipment* (97) (74) (231) (189)Amortisation of deferred gain (273) (273) (258) (258)Impairment of goodwill 31 31 32 32Profit on disposal of non-current assets held for sale (1 185) (648) — —
Headline earnings 19 811 14 011
Adjusted for:Reversal of put options in respect of subsidiaries– Fair value adjustment (266) (266) (208) (172)– Finance costs 254 254 471 471– Forex exchange loss/(gain) 174 174 (241) (277)– Non-controlling interests’ share of profits (137) (137) (272) (272)
Adjusted headline earnings 19 836 13 761
Earnings per share (cents)– Basic 1 119,5 776,2– Headline 1 068,6 760,6– Adjusted headline 1 070,0 747,0
Diluted earnings per share (cents)– Basic 1 110,8 764,5– Headline 1 060,4 748,9– Adjusted headline 1 061,7 735,4
*Amounts are measured after taking into account non-controlling interests and tax.
2011 2010
Rm Gross
RmNet*
RmGross
RmNet*
Notes to the Group financial statements continuedfor the year ended 31 December 2011

MTN Group Limited Integrated Business Report for the year ended 31 December 2011115
Grou
p ov
ervi
ewPe
rform
ance
revi
ewOp
erat
iona
l and
fin
ancia
l rev
iew
Sust
aina
bilit
yFi
nanc
ial s
tate
men
tsSh
areh
olde
r inf
orm
atio
n
9. EARNINGS PER SHARE (continued)Explanation of adjusted headline earningsImpact of put optionsIFRS requires the Group to account for a written put option held by non-controlling shareholders of the Group’s subsidiaries, which provides them with the right to require the subsidiary to acquire their shareholding at fair value. Prior to the implementation of IFRS, the shareholding was treated as a non-controlling shareholder in the subsidiary as all risks and rewards associated with these shares, including dividends, accrued to the non-controlling shareholder. IAS 32 requires that in the circumstances described above:
the present value of the future redemption amount be reclassified from equity to financial liabilities and that the financial liability so reclassified subsequently be measured in accordance with IAS 39; in accordance with IAS 39, all subsequent changes in the fair value of the liability together with the related interest charges arising from present valuing the future liability, be recognised in profit or loss; and the non-controlling shareholder holding the put option no longer be regarded as a non-controlling shareholder, but rather as a creditor from the date of receiving the put option.
Although the Group has complied with the requirements of IAS 32 and IAS 39 as outlined above, the board of directors has reservations about the appropriateness of this treatment in view of the fact that:
the recording of a liability for the present value of the future strike price of the written put option results in the recording of a liability that is inconsistent with the framework, as there is no present obligation for the future strike price; and the shares considered to be subject to the contracts that are outstanding, have the same rights as any other shares and should therefore be accounted for as a derivative rather than creating an exception to the accounting required under IAS 39.
10. DIVIDENDS PER SHARE
Dividend distribution to the Company’s shareholders is recognised as a liability in the Group’s financial statements in the period in which the dividends are approved by the Company’s directors.
2011 2010
Cents per share Rm
Cents per share Rm
Dividends paidFinal dividend paid in respect of the prior year 349 6 577 192 3 534Interim dividend paid in respect of the current year 273 5 145 151 2 779
11 722 6 313Dividends declaredApproved after the reporting date and not recognised as a liability 476** 8 940* 349 6 577
* Excluding treasury shares (note 20).**Declared at the board meeting on 6 March 2012.
2011 2010
Cents per share Rm
Cents per share Rm

MTN Group Limited Integrated Business Report for the year ended 31 December 2011116
11. PROPERTY, PLANT AND EQUIPMENT
Property, plant and equipment are measured at historical cost less accumulated depreciation and accumulated impairment losses. Property, plant and equipment acquired through business combinations are initially shown at fair value and are subsequently carried at the initially determined fair value less accumulated depreciation and impairment losses.
Historical cost includes expenditure that is directly attributable to the acquisition of the asset. The cost of self-constructed assets includes the cost of materials and direct labour, any other costs directly attributable to bringing the assets to a working condition for their intended use, and the present value of future decommissioning costs. Purchased software that is integral to the functionality of the related equipment is capitalised as part of the equipment.
Property, plant and equipment under construction are measured at initial cost and depreciated from the date the asset is available for use in the manner intended by management over its useful life. Assets are transferred from capital work-in-progress to an appropriate category of property, plant and equipment when commissioned and ready for their intended use.
The Group capitalises general and specific borrowing costs directly attributable to the acquisition, construction or production of a qualifying asset as part of the cost of that asset. A qualifying asset is deemed to be an asset which takes more than 12 months to acquire, construct or produce. Borrowing costs include general and specific borrowings directly attributable to the acquisition, construction or production of qualifying assets. Other borrowing costs are expensed in the income statement.
Asset exchange transactions are transactions where one or more items of property, plant and equipment are acquired in exchange for non-monetary assets or monetary assets, or a combination of monetary and non-monetary assets. In circumstances whereby the Group enters into asset exchange transaction for its property, plant and equipment, the Group determines whether such an exchange has commercial substance. Commercial substance depends on the extent to which the Group’s future cash flows are expected to change as a result of the transaction. A transaction has commercial substance if the difference in either of the points below is significant relative to the fair value of the assets exchanged:
the configuration of the cash flows of the asset received differs from the configuration of the cash flows of the asset given up; orthe entity-specific value of the part of the operations affected by the transaction changes as a result of the exchange.
If the transaction lacks commercial substance, the cost of the asset acquired in the exchange transaction is measured at the carrying value of the asset given up including any other consideration paid or payable. If the transaction has commercial substance, the fair value of the asset given up is used to measure the cost of the asset acquired.
In instances whereby the Group receives assets for no consideration, the Group accounts for these at cost in accordance with IAS 16 Property, Plant and Equipment, being zero value.
When parts of an item of property, plant and equipment have different useful lives, they are accounted for as separate items (major components) of property, plant and equipment.
Depreciation of property, plant and equipment is recognised to write off the cost of the asset to its residual value, on the straight-line basis, over its expected useful life as follows:Buildings – owned 3 – 60 years Buildings – leased 3 – 25 years* Network infrastructure 2 – 20 years Information systems equipment 2 – 10 years
Furniture and fittings 3 – 10 years Leasehold improvements 2 – 11 years* Office equipment 2 – 10 years Motor vehicles 3 – 10 years
*Shorter of lease term or useful life.
Notes to the Group financial statements continuedfor the year ended 31 December 2011

MTN Group Limited Integrated Business Report for the year ended 31 December 2011117
Grou
p ov
ervi
ewPe
rform
ance
revi
ewOp
erat
iona
l and
fin
ancia
l rev
iew
Sust
aina
bilit
yFi
nanc
ial s
tate
men
tsSh
areh
olde
r inf
orm
atio
n
11. PROPERTY, PLANT AND EQUIPMENT (continued)
The depreciation method and the assets’ residual values and useful lives are reviewed at least at each reporting date and adjusted if appropriate.
Land is not depreciated.
Assets held under finance leases are depreciated over their expected useful lives on the same basis as owned assets or, where shorter, the expected term of the relevant lease.
Subsequent costs are included in the asset’s carrying amount or recognised as a separate asset, only when it is probable that future economic benefits associated with the item will flow to the Group and the cost of the item can be measured reliably. The carrying amount of the replaced part is derecognised. Repairs and maintenance are charged to profit or loss during the financial period in which they are incurred.
The gain or loss arising on the disposal or retirement of an asset is determined as the difference between the proceeds from the disposal and the carrying amount of the asset, and is included in profit or loss.
LeasesLeases over property, plant and equipment are classified as finance leases whenever the terms of the lease transfer substantially all the risks and rewards of ownership to the lessee. Assets held under finance leases are capitalised at the lower of the fair value of the leased asset and the estimated present value of the minimum lease payments at the inception of the lease. The corresponding liability to the lessor, net of finance charges, is included in the statement of financial position under other non-current/current liabilities. Each lease payment is allocated between the liability and finance charges. Finance charges, which represent the difference between the total lease commitments and fair value of the assets acquired, are charged to profit or loss over the term of the relevant lease so as to produce a constant periodic rate of interest on the remaining balance of the obligation for each accounting period.
In all significant leasing arrangements in place during the period, the Group acted as the lessee.
Determination of fair valuesThe fair value of property, plant and equipment recognised as a result of a business combination is based on depreciated replacement cost.
ImpairmentThe carrying amounts of the Group’s non-financial assets, other than inventories and deferred tax assets, are reviewed at each reporting date to determine whether there is any indication of impairment. If any such indication exists, the asset’s recoverable amount is estimated. An impairment loss is recognised if the carrying amount of an asset or its cash-generating unit exceeds its estimated recoverable amount. The recoverable amount of an asset or cash-generating unit is the greater of its value in use and its fair value less costs to sell. In assessing value in use, the estimated future cash flows are discounted to their present value using a pre-tax discount rate that reflects current market assessments of the time value of money and the risks specific to the asset. For the purpose of impairment testing, assets are grouped together into the smallest group of assets that generate cash inflows from continuing use that are largely independent of the cash inflows of other assets or groups of assets (the “cash-generating unit”).
Impairment losses are recognised in profit or loss. Impairment losses recognised in respect of cash-generating units are allocated first to reduce the carrying amount of any goodwill allocated to the units and then to reduce the carrying amounts of the other assets in the unit (group of units) on a pro rata basis.
In respect of other tangible assets, impairment losses recognised in prior periods are assessed at each reporting date for any indications that the loss has decreased or no longer exists. An impairment loss is reversed if there has been a change in the estimates used to determine the recoverable amount. An impairment loss is reversed only to the extent that the asset’s carrying amount does not exceed the carrying amount that would have been determined net of depreciation, if no impairment loss had been recognised.
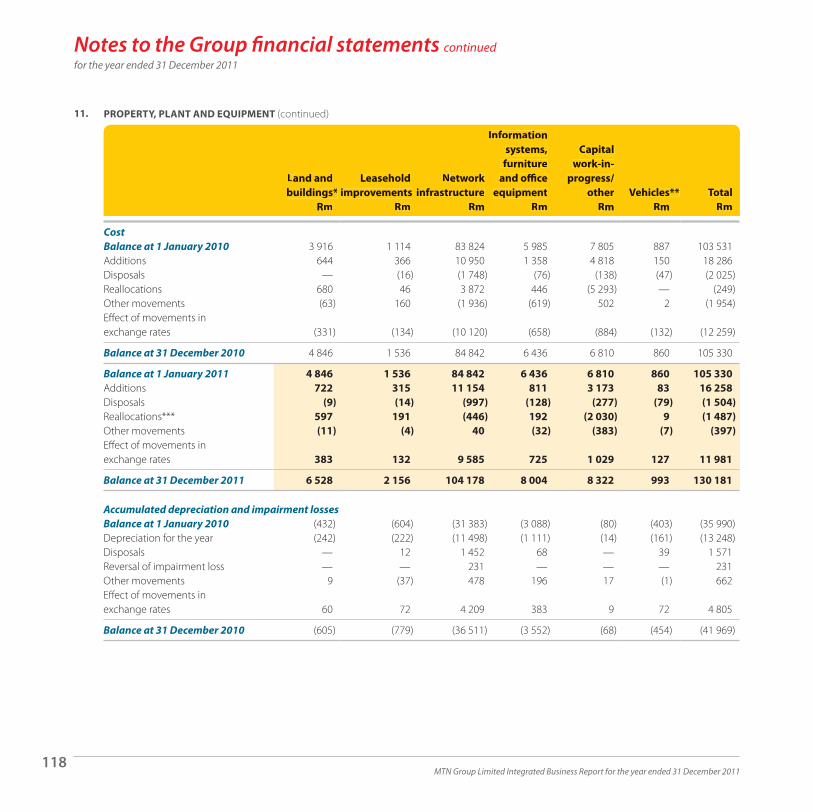
MTN Group Limited Integrated Business Report for the year ended 31 December 2011118
11. PROPERTY, PLANT AND EQUIPMENT (continued)
Land andbuildings*
Rm
Leaseholdimprovements
Rm
Networkinfrastructure
Rm
Informationsystems,
furnitureand office
equipmentRm
Capital work-in-
progress/other
RmVehicles**
RmTotal
Rm
CostBalance at 1 January 2010 3 916 1 114 83 824 5 985 7 805 887 103 531Additions 644 366 10 950 1 358 4 818 150 18 286Disposals — (16) (1 748) (76) (138) (47) (2 025)Reallocations 680 46 3 872 446 (5 293) — (249)Other movements (63) 160 (1 936) (619) 502 2 (1 954)Effect of movements in exchange rates (331) (134) (10 120) (658) (884) (132) (12 259)
Balance at 31 December 2010 4 846 1 536 84 842 6 436 6 810 860 105 330
Balance at 1 January 2011 4 846 1 536 84 842 6 436 6 810 860 105 330Additions 722 315 11 154 811 3 173 83 16 258Disposals (9) (14) (997) (128) (277) (79) (1 504)Reallocations*** 597 191 (446) 192 (2 030) 9 (1 487)Other movements (11) (4) 40 (32) (383) (7) (397)Effect of movements in exchange rates 383 132 9 585 725 1 029 127 11 981
Balance at 31 December 2011 6 528 2 156 104 178 8 004 8 322 993 130 181
Accumulated depreciation and impairment lossesBalance at 1 January 2010 (432) (604) (31 383) (3 088) (80) (403) (35 990)Depreciation for the year (242) (222) (11 498) (1 111) (14) (161) (13 248)Disposals — 12 1 452 68 — 39 1 571Reversal of impairment loss — — 231 — — — 231Other movements 9 (37) 478 196 17 (1) 662Effect of movements in exchange rates 60 72 4 209 383 9 72 4 805
Balance at 31 December 2010 (605) (779) (36 511) (3 552) (68) (454) (41 969)
Land andbuildings*
Rm
Leaseholdimprovements
Rm
Networkinfrastructure
Rm
Informationsystems,
furnitureand office
equipmentRm
Capitalwork-in-
progress/other
RmVehicles**VV
RmTotalTT
Rm
Notes to the Group financial statements continuedfor the year ended 31 December 2011
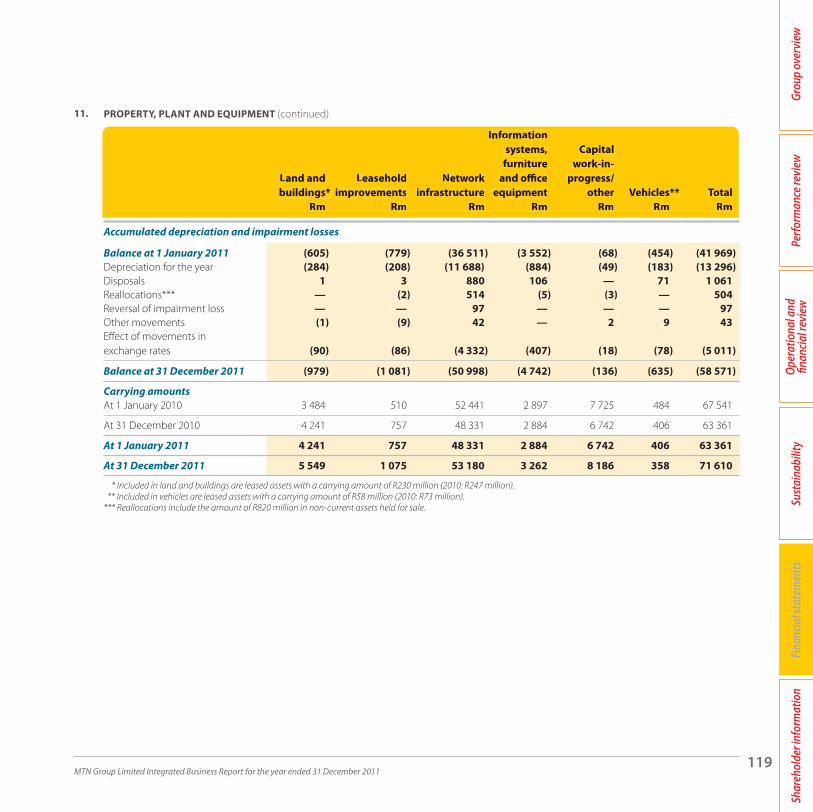
MTN Group Limited Integrated Business Report for the year ended 31 December 2011119
Grou
p ov
ervi
ewPe
rform
ance
revi
ewOp
erat
iona
l and
fin
ancia
l rev
iew
Sust
aina
bilit
yFi
nanc
ial s
tate
men
tsSh
areh
olde
r inf
orm
atio
n
11. PROPERTY, PLANT AND EQUIPMENT (continued)
Land andbuildings*
Rm
Leaseholdimprovements
Rm
Networkinfrastructure
Rm
Informationsystems,
furnitureand office
equipmentRm
Capital work-in-
progress/other
RmVehicles**
RmTotal
Rm
Accumulated depreciation and impairment losses
Balance at 1 January 2011 (605) (779) (36 511) (3 552) (68) (454) (41 969)Depreciation for the year (284) (208) (11 688) (884) (49) (183) (13 296)Disposals 1 3 880 106 — 71 1 061Reallocations*** — (2) 514 (5) (3) — 504Reversal of impairment loss — — 97 — — — 97Other movements (1) (9) 42 — 2 9 43Effect of movements in exchange rates (90) (86) (4 332) (407) (18) (78) (5 011)
Balance at 31 December 2011 (979) (1 081) (50 998) (4 742) (136) (635) (58 571)
Carrying amountsAt 1 January 2010 3 484 510 52 441 2 897 7 725 484 67 541
At 31 December 2010 4 241 757 48 331 2 884 6 742 406 63 361
At 1 January 2011 4 241 757 48 331 2 884 6 742 406 63 361
At 31 December 2011 5 549 1 075 53 180 3 262 8 186 358 71 610
* Included in land and buildings are leased assets with a carrying amount of R230 million (2010: R247 million). ** Included in vehicles are leased assets with a carrying amount of R58 million (2010: R73 million).*** Reallocations include the amount of R820 million in non-current assets held for sale.
Land andbuildings*
Rm
Leaseholdimprovements
Rm
Networkinfrastructure
Rm
Informationsystems,
furnitureand office
equipmentRm
Capitalwork-in-
progress/other
RmVehicles**VV
RmTotalTT
Rm

MTN Group Limited Integrated Business Report for the year ended 31 December 2011120
11. PROPERTY, PLANT AND EQUIPMENT (continued) 11.1 Register of land and buildings
Registers with details of land and buildings are available for inspection by shareholders or their duly authorised representatives at the registered office of the Company and its respective subsidiaries.
11.2 Impairment lossMTN Nigeria and Côte d’Ivoire reversed a portion of the previously recognised impairment losses amounting to R85 million (2010: R231 million) and R12 million (2010: nil), respectively.
11.3 Leased property, plant and equipmentThe Group leases various premises and sites which have varying terms, escalation clauses and renewal rights.
11.4 Capital work-in-progressThere are various capital work-in-progress projects underway within the Group, a summary thereof can be found below:
2011Rm
2010Rm
MTN RSA 1 865 1 757Scancom Limited (Ghana) 769 1 091MTN Sudan Company Limited 819 527MTN Nigeria Communications Limited 480 369MTN Afghanistan Limited 160 369Mascom Wireless Botswana Proprietary Limited 57 253Areeba Guinea SA 212 227MTN Côte d’ Ivoire SA 136 149Irancell Telecommunications Services Company 216 119MTN Uganda Limited 446 169MTN (Dubai) Limited 470 595Others 571 294
6 201 5 919
11.5 Changes in estimatesThere were no significant changes in the depreciation method, useful life or residual values of any items of property, plant and equipment during the current year.
2011Rm
2010Rm
Notes to the Group financial statements continuedfor the year ended 31 December 2011
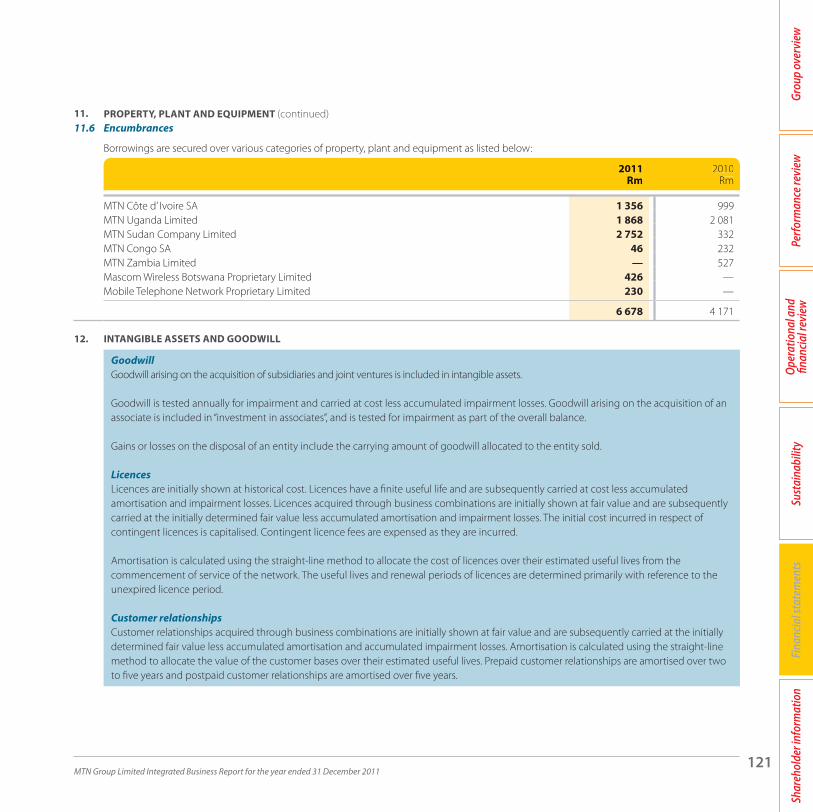
MTN Group Limited Integrated Business Report for the year ended 31 December 2011121
Grou
p ov
ervi
ewPe
rform
ance
revi
ewOp
erat
iona
l and
fin
ancia
l rev
iew
Sust
aina
bilit
yFi
nanc
ial s
tate
men
tsSh
areh
olde
r inf
orm
atio
n
11. PROPERTY, PLANT AND EQUIPMENT (continued) 11.6 Encumbrances
Borrowings are secured over various categories of property, plant and equipment as listed below:
2011Rm
2010Rm
MTN Côte d’ Ivoire SA 1 356 999 MTN Uganda Limited 1 868 2 081 MTN Sudan Company Limited 2 752 332 MTN Congo SA 46 232 MTN Zambia Limited — 527 Mascom Wireless Botswana Proprietary Limited 426 — Mobile Telephone Network Proprietary Limited 230 —
6 678 4 171
12. INTANGIBLE ASSETS AND GOODWILL
GoodwillGoodwill arising on the acquisition of subsidiaries and joint ventures is included in intangible assets.
Goodwill is tested annually for impairment and carried at cost less accumulated impairment losses. Goodwill arising on the acquisition of an associate is included in “investment in associates”, and is tested for impairment as part of the overall balance.
Gains or losses on the disposal of an entity include the carrying amount of goodwill allocated to the entity sold.
LicencesLicences are initially shown at historical cost. Licences have a finite useful life and are subsequently carried at cost less accumulated amortisation and impairment losses. Licences acquired through business combinations are initially shown at fair value and are subsequently carried at the initially determined fair value less accumulated amortisation and impairment losses. The initial cost incurred in respect of contingent licences is capitalised. Contingent licence fees are expensed as they are incurred.
Amortisation is calculated using the straight-line method to allocate the cost of licences over their estimated useful lives from the commencement of service of the network. The useful lives and renewal periods of licences are determined primarily with reference to the unexpired licence period.
Customer relationshipsCustomer relationships acquired through business combinations are initially shown at fair value and are subsequently carried at the initially determined fair value less accumulated amortisation and accumulated impairment losses. Amortisation is calculated using the straight-line method to allocate the value of the customer bases over their estimated useful lives. Prepaid customer relationships are amortised over two to five years and postpaid customer relationships are amortised over five years.
2011Rm
2010Rm

MTN Group Limited Integrated Business Report for the year ended 31 December 2011122
12. INTANGIBLE ASSETS AND GOODWILL (continued)
Computer softwareAcquired computer software licences are capitalised on the basis of the costs incurred to acquire and bring the specific software into use. These costs are amortised over their estimated useful lives (three to five years).
Costs associated with maintaining computer software programmes are recognised as an expense as incurred. Costs that are directly associated with the production of identifiable and unique software products controlled by the Group, and that will probably generate economic benefits, are recognised as intangible assets when the following criteria are met:
it is technically feasible to complete the software product so that it will be available for use;management intends to complete the software product and use or sell it;there is an ability to use or sell the software product;it can be demonstrated how the software product will generate probable future economic benefits;adequate technical, financial and other resources to complete the development and to use or sell the software product are available; andthe expenditure attributable to the software products during its development can be reliably measured.
Direct costs include the software development employee costs and an appropriate portion of relevant overheads. Expenditure that enhances or extends the performance of the computer software programmes beyond their original specifications is recognised as a capital improvement and added to the original cost of the software.
Other development expenditures that do not meet these criteria are recognised as an expense as incurred. Development costs previously recognised as an expense are not recognised as an asset in a subsequent period.
Computer software is amortised using the straight-line method over its estimated useful life (not exceeding three years) and carried at cost less accumulated amortisation and impairment losses.
Other intangible assetsOther intangible assets that are acquired by the Group and have finite useful lives are measured at cost less accumulated amortisation and impairment losses. Other intangible assets acquired through business combinations are initially shown at fair value and are subsequently carried at the initially determined fair value less accumulated amortisation and impairment losses. Amortisation is recognised in profit or loss on a straight-line basis over the estimated useful lives of intangible assets from the date they are available for use.
Notes to the Group financial statements continuedfor the year ended 31 December 2011

MTN Group Limited Integrated Business Report for the year ended 31 December 2011123
Grou
p ov
ervi
ewPe
rform
ance
revi
ewOp
erat
iona
l and
fin
ancia
l rev
iew
Sust
aina
bilit
yFi
nanc
ial s
tate
men
tsSh
areh
olde
r inf
orm
atio
n
12. INTANGIBLE ASSETS AND GOODWILL (continued)
Determination of fair valuesThe fair value of customer relationships acquired in a business combination is determined using the multi-period excess earnings method, whereby the subject asset is valued after deducting a fair return on all other assets that are part of creating the related cash flows.
The fair value of patents and trademarks acquired in a business combination is based on the discounted estimated royalty payments that have been avoided as a result of the patent or trademark being owned.
The fair value of other intangible assets is based on the discounted cash flows expected to be derived from the use and eventual sale of the assets.
ImpairmentFor the purpose of impairment testing of non-financial assets disclosed in note 11, goodwill acquired in a business combination is allocated to cash-generating units that are expected to benefit from the synergies of the combination. Impairment losses are recognised in profit or loss. Impairment losses recognised in respect of cash-generating units are allocated first to reduce the carrying amount of any goodwill allocated to the units and then to reduce the carrying amounts of the other assets in the unit (group of units) on a pro rata basis.
For goodwill and other intangible assets that have indefinite useful lives or that are not yet available for use, the recoverable amount is estimated each year at the same time. Intangible assets with finite useful lives are reviewed at each reporting date to determine whether there is any indication of impairment.
An impairment loss in respect of goodwill is not reversed. In respect of other intangible assets, impairment losses recognised in prior periods are assessed at each reporting date for any indications that the loss has decreased or no longer exists. An impairment loss is reversed if there has been a change in the estimates used to determine the recoverable amount. An impairment loss is reversed only to the extent that the asset’s carrying amount does not exceed the carrying amount that would have been determined, net of amortisation, if no impairment loss had been recognised.

MTN Group Limited Integrated Business Report for the year ended 31 December 2011124
12. INTANGIBLE ASSETS AND GOODWILL (continued)
Goodwill Rm
Licences Rm
Customer relation-
shipsRm
Software Rm
Other intangible
assets Rm
Total Rm
CostBalance at 1 January 2010 24 756 11 635 4 717 4 824 426 46 358Additions — 105 60 1 170 8 1 343Disposals — — — (142) (1) (143)Reallocations — — — 245 4 249Impairment loss (32) — — — — (32) Other movements (50) — 32 8 10 —Effect of movements in exchange rates (3 877) (1 445) (181) (481) (16) (6 000)
Balance at 31 December 2010 20 797 10 295 4 628 5 624 431 41 775
Balance at 1 January 2011 20 797 10 295 4 628 5 624 431 41 775Additions — 294 — 1 459 10 1 763Disposals — (39) — (58) (1) (98)Reallocations — — — 169 (6) 163Impairment loss (31) — — — — (31)Other movements — 92 (247) (52) 565 358Effect of movements in exchange rates 3 264 1 249 120 503 19 5 155
Balance at 31 December 2011 24 030 11 891 4 501 7 645 1 018 49 085
Amortisation and impairment lossesBalance at 1 January 2010 — (4 278) (3 894) (1 814) (308) (10 294)Amortisation for the year — (830) (337) (798) (155) (2 120)Disposals — — — 71 — 71Other movements — — (63) 6 57 —Effect of movements in exchange rates — 449 135 243 7 834
Balance at 31 December 2010 — (4 659) (4 159) (2 292) (399) (11 509)
Balance at 1 January 2011 — (4 659) (4 159) (2 292) (399) (11 509)Amortisation for the year — (788) (97) (1 140) (138) (2 163)Disposals — 11 — 55 (1) 65Effect of movements in exchange rates — (522) (96) (309) (11) (938)
Balance at 31 December 2011 — (5 958) (4 352) (3 686) (549) (14 545)
Carrying amountsAt 1 January 2010 24 756 7 357 823 3 010 118 36 064
At 31 December 2010 20 797 5 636 469 3 332 32 30 266
At 1 January 2011 20 797 5 636 469 3 332 32 30 266
At 31 December 2011 24 030 5 933 149 3 959 469 34 540
Goodwill Rm
LicencesRm
Customer relation-
shipsRm
SoftwareRm
Other intangible
assets Rm
TotalTTRm
132
Notes to the Group financial statements continuedfor the year ended 31 December 2011

MTN Group Limited Integrated Business Report for the year ended 31 December 2011125
Grou
p ov
ervi
ewPe
rform
ance
revi
ewOp
erat
iona
l and
fin
ancia
l rev
iew
Sust
aina
bilit
yFi
nanc
ial s
tate
men
tsSh
areh
olde
r inf
orm
atio
n
12. INTANGIBLE ASSETS AND GOODWILL (continued)
A summary of the goodwill allocation is presented below
2011 2010Growth
rate%
Discountrate
%2011
Rm
Growthrate
%
Discountrate
%2010
Rm
MTN Côte d’Ivoire SA 2,0 16,2 1 945 2,0 14,7 1 313Scancom Limited (Ghana) 3,0 11,9 8 295 3,0 11,7 7 353MTN Sudan Company Limited 3,0 14,3 3 398 3,0 15,9 2 759MTN Yemen 3,0 19,9 2 012 3,0 18,5 1 647MTN Afghanistan Limited 3,0 13,7 1 189 3,0 15,9 1 040MTN Uganda Limited 3,0 13,1 527 3,0 13,0 465MTN Congo SA 3,0 12,4 644 3,0 12,2 546MTN Syria (JSC) 2,0 14,6 326 2,0 11,8 300MTN Cyprus Limited 3,0 8,7 551 3,0 10,1 456Spacetel Benin SA 2,0 13,4 871 2,0 13,7 721Areeba Guinea SA 1,0 15,8 566 1,0 17,2 446MTN Business Solutions Limited 4,5 12,3 1 472 4,5 14,9 1 472 Mascom Wireless Botswana Proprietary Limited 3,0 9,3 687 3,0 10,4 653 Other 1 547 1 626
24 030 20 797
Goodwill is tested annually for impairment. There was no impairment of any of the cash-generating units (CGUs) above to which goodwill had been allocated, apart from an impairment charge in respect of MTN RSA CGU in 2011 and of the Cameroon CGU in 2010. The 2011 impairment charge in MTN RSA amounted to R31 million and related to an investment in Cell Place Proprietary Limited. The impairment charge in 2010 in the Cameroon CGU amounted to R32 million and related to the ISP business included in one of its subsidiaries, where forecasts were revised downwards in light of the difficult economic trading conditions.
The recoverable amounts of CGUs were determined based on value-in-use calculations. The calculations mainly used cash flow projections based on financial budgets approved by management covering a three to ten year period. Management is confident that projections covering periods longer than five years are appropriate based on the long-term nature of the Group’s infrastructure and operating model. Cash flows beyond the above period were extrapolated using the estimated growth rates measured below. The following key assumptions were used for the value-in-use calculations:
growth rate: the Group used a steady growth rate to extrapolate revenue beyond the budget period cash flows. The growth rate was consistent with publicly available information relating to long-term average growth rates for each of the markets in which the respective CGU operated. The average growth rates used ranged from 1% to 4,5% (2010: 1% to 4,5%); anddiscount rate: discount rates range from 7,8% to 19,9% (2010: 9,2% to 15,9%). Discount rates used reflect specific risks relating to the relevant CGU.
Goodwill impairment sensitivityFor MTN Business Solutions Limited, the discount rate has a significant influence on the sensitivity of the impairment test. For the detailed five year forecast period, a discount rate of 11,2% was projected, growth rate of 4,5%, capex to revenue ratio in terminal year of 5% and EBITDA margin in terminal year of 14,99%. If the discount rate decreased by 0,25% the recoverable amount will equal its carrying amount.
2011 2010Growth
rate%
Discountrate
%2011
Rm
Growthrate
%
Discountrate
%2010
Rm

MTN Group Limited Integrated Business Report for the year ended 31 December 2011126
12. INTANGIBLE ASSETS AND GOODWILL (continued)
Licence agreements TypeGranted/renewed Term Renewable term Fee currency
South and East AfricaMobile Telephone Networks Proprietary Limited
ECS Licence 15/01/2009 15 years Renewable on application ZAR
ECNS Licence 15/01/2009 20 years Renewable on application ZAR
900MHz 01/01/2010 1 year Annually ZAR
1800MHz 01/01/2010 1 year Annually ZAR
3G 01/01/2010 1 year Annually ZAR
MTN Uganda Limited 900MHz 15/04/1998 20 years 5 Years USD1800MHz
MTN Rwandacell S.A.R.L 900MHz 17/03/2000 13 years 5 years USD1800MHz1900MHzFixed line 30/06/2006 5 years 5 years USD
Mascom Wireless Botswana Proprietary Limited
900MHz1800MHz
13/06/2007 15 years Determined in renewal process BWP
2100MHz
MTN Zambia Limited 1800MHz 23/09/2010 15 years 5 years ZMK
Swazi MTN Limited 900MHz 28/11/2008 10 years 10 years SZL
1800MHz 28/11/2008 10 years 10 years SZL
2100MHz 26/09/2011 7 years 10 years SZL
MTN Business Solutions Limited ISP 16/06/2006 5 years 5 years ZMK
Licence agreements TypeTTGranted/renewed TermTT Renewable term Fee currency
Notes to the Group financial statements continuedfor the year ended 31 December 2011

MTN Group Limited Integrated Business Report for the year ended 31 December 2011127
Grou
p ov
ervi
ewPe
rform
ance
revi
ewOp
erat
iona
l and
fin
ancia
l rev
iew
Sust
aina
bilit
yFi
nanc
ial s
tate
men
tsSh
areh
olde
r inf
orm
atio
n
Initial licence/renewal fee Annual fees Further fees/obligations where applicable
— Not applicable 1,5% of gross profit as defined by the Electronic Communications Act 36 of 2005
100 million Not applicable 1,5% of gross profit as defined by the Electronic Communications Act 36 of 2005
100 million Fixed spectrum of 7,3 million, radio frequency spectrum of 5 million
1% of gross profit as defined by the Electronic Communications Act 36 of 2005
— Fixed spectrum of 7,3 million, radio frequency spectrum of 5 million
Service obligations include the provision of 2,5 million SIM-card packages and 125,000 mobile phones over 5 years
— Fixed spectrum of 1,2 million, radio frequency spectrum of 5 million
Internet access to 5 000 public schools over an 8 year period. Internet and terminal equipment to 140 institutions (10 per institution) for people with disabilities over 3 years
5,8 million Spectrum fee of 1% of gross network revenue Not applicable
200 000 3% of network revenue as defined in the licence RWF 1,2 million per MHz annuallySpectrum fee of 50 000 Renewal fee of 500 000
350 000 Not applicable Not applicable
— 1,1 million 3% of annual net turnover
100 million 2,7 billion Monthly licence fees – 3% of airtime revenues
3,6 million Licence fee of 5% of net operating income with a minimum of 6 million plus spectrum fee of 20 000 per channel with a minimum of 600 000.
Universal service obligation fund of 0,5% of net operating income
35 million Licence fee of 5% of net operating income with a minimum of 6 million plus spectrum fee of 20 000 per channel with a minimum of 600 000.
Universal service obligation fund of 0,5% of net operating income
35 million Licence fee of 5% of net operating income with a minimum of 10 million plus spectrum fee of 20 000 per channel with a minimum of 1 million.
Universal service obligation fund of 0,5% of net operating income
95 400 19 080 Not applicable
Initial licence/renewal fee Annual fees Further fees/obligations where applicable

MTN Group Limited Integrated Business Report for the year ended 31 December 2011128
12. INTANGIBLE ASSETS AND GOODWILL (continued)
Licence agreements TypeGranted/renewed Term Renewable term Fee currency
West and Central Africa (continued)MTN Nigeria Communications Limited 900MHz 09/02/2001 15 years 5 years USD
1800MHz3G spectrum
licence01/05/2007 15 years Dependent on the Nigerian
Communications CommissionUSD
Unified access licence (including
international gateway)
01/09/2006 15 years 5 years NGN
WACS 01/01/2010 20 years 20 years USD
Scancom Limited (Ghana) 900MHz 02/12/2004 15 years 10 years USD1800MHz
3G 23/01/2009 15 years Not applicable USDWACS Licence 17/02/2010 20 years Not applicable USD
Mobile Telephone Network Cameroon Limited
900MHz 15/02/2000 15 years 10 years CFA
1st category network for
Internet access and VPN
31/03/2006 10 years 10 years XAF
MTN Cote d'Ivoire SA 900MHz 02/04/1996 20 years Determined in renewal process XOFWiMax 2.5 – 3.5
Ghz 31/07/2002 20 years Determined in renewal process XOF
Spacetel Benin SA 900MHz 19/10/2007 10 years 5 years CFA
1800MHz
Areeba Guinea SA 900MHz 31/08/2005 18 years Determined in renewal process EUR1800MHz
WiMax 04/06/2009 5 years Determined in renewal process GNF
Licence agreements TypeTTGranted/renewed TermTT Renewable term Fee currency
Notes to the Group financial statements continuedfor the year ended 31 December 2011

MTN Group Limited Integrated Business Report for the year ended 31 December 2011129
Grou
p ov
ervi
ewPe
rform
ance
revi
ewOp
erat
iona
l and
fin
ancia
l rev
iew
Sust
aina
bilit
yFi
nanc
ial s
tate
men
tsSh
areh
olde
r inf
orm
atio
n
Initial licence/renewal fee Annual fees Further fees/obligations where applicable
285 million Annual operating levy of 2,5% of gross revenue Not applicable
150 million Annual operating levy of 2,5% of net revenue Not applicable
114,6 million Annual operating levy of 2,5% of net revenue Not applicable
220,5 million Annual operating levy of 2,5% of net revenue Not applicable
22,5 million Annual fee of 1% of revenue Not applicable
28 million Annual fee of 1% of revenue Not applicable1 million Annual fee of 1% of revenue Not applicable
44 billion Regulatory management fee of 1,06% of network revenue
Spectrum fee – 200 000 accrued annually based on a temporary agreement with the regulator
Telecoms development fund of 2% of network revenueRegulatory management fees of 1% of network revenue and Telecommunications fund of 2% of network revenue
40 billion No annual fees specified in the licence agreement. Not applicable
10 million No annual fees specified in the licence agreement. Not applicable
30 billion 15 on all international incoming minutes Regulations Authority operations fee of 1% of revenueUniversal access fee of 1% of revenue
2 on all national out-going minutes including on-net Regional development fee of 0,5% of revenueTraining and research fee of 0,5% of revenue
30 million Not applicable GNF 13,150 billion
3 billion Not applicable GNF 500 million
Initial licence/renewal fee Annual fees Further fees/obligations where applicable

MTN Group Limited Integrated Business Report for the year ended 31 December 2011130
12. INTANGIBLE ASSETS AND GOODWILL (continued)
Licence agreements TypeGranted/renewed Term Renewable term Fee currency
West and Central AfricaMTN Congo SA 900MHz 15/10/1999 15 years 15 years XAF
1800MHz 21/08/2002 15 years 15 years XAFInternational
gateway05/02/2002 15 years 15 years XAF
Optical fibre licence
02/04/2010 15 years 15 years XAF
3G Licence 25/11/2011 17 years Determined in renewal process XAF2G Licence 25/11/2011 15 years Determined in renewal process XAF
Lonestar Communications Corporation LLC (Liberia)
900MHz1800MHz
24/03/2009 15 years Determined in renewal process USD
WiMax 24/03/2009 15 years USD
Spacetel Guinea-Bissau SA 1800MHz 01/03/2004 10 years Determined in renewal process EUR900MHz 01/03/2004 10 years Determined in renewal process EUR
Middle East and North AfricaIrancell Telecommunication Services Company Proprietary Limited
GSM 09/07/2000 15 years Two periods of 5 years each EUR
WiMax 28/02/2009 6 years 5 years IRR
MTN Syria SA 900MHz 29/06/2002 15 years 3 years at discretion of Syrian licensing authority
USD
1800MHz 22/03/2007 10 years USD3G 29/04/2009 8 years SYPISP 31/05/2009 3 years SYP
Licence agreements TypeTTGranted/renewed TermTT Renewable term Fee currency
Notes to the Group financial statements continuedfor the year ended 31 December 2011
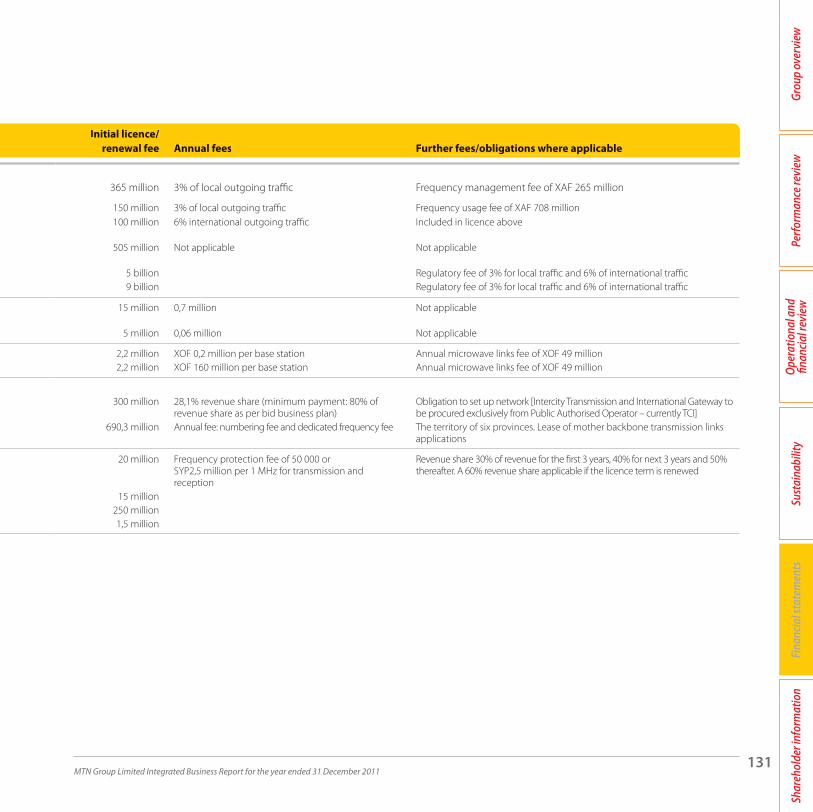
MTN Group Limited Integrated Business Report for the year ended 31 December 2011131
Grou
p ov
ervi
ewPe
rform
ance
revi
ewOp
erat
iona
l and
fin
ancia
l rev
iew
Sust
aina
bilit
yFi
nanc
ial s
tate
men
tsSh
areh
olde
r inf
orm
atio
n
Initial licence/renewal fee Annual fees Further fees/obligations where applicable
365 million 3% of local outgoing traffic Frequency management fee of XAF 265 million
150 million 3% of local outgoing traffic Frequency usage fee of XAF 708 million100 million 6% international outgoing traffic Included in licence above
505 million Not applicable Not applicable
5 billion Regulatory fee of 3% for local traffic and 6% of international traffic9 billion Regulatory fee of 3% for local traffic and 6% of international traffic
15 million 0,7 million Not applicable
5 million 0,06 million Not applicable
2,2 million XOF 0,2 million per base station Annual microwave links fee of XOF 49 million2,2 million XOF 160 million per base station Annual microwave links fee of XOF 49 million
300 million 28,1% revenue share (minimum payment: 80% of revenue share as per bid business plan)
Obligation to set up network [Intercity Transmission and International Gateway to be procured exclusively from Public Authorised Operator – currently TCI]
690,3 million Annual fee: numbering fee and dedicated frequency fee The territory of six provinces. Lease of mother backbone transmission links applications
20 million Frequency protection fee of 50 000 or SYP2,5 million per 1 MHz for transmission and reception
Revenue share 30% of revenue for the first 3 years, 40% for next 3 years and 50% thereafter. A 60% revenue share applicable if the licence term is renewed
15 million250 million1,5 million
Initial licence/renewal fee Annual fees Further fees/obligations where applicable

MTN Group Limited Integrated Business Report for the year ended 31 December 2011132
12. INTANGIBLE ASSETS AND GOODWILL (continued)
Licence agreements TypeGranted/renewed Term Renewable term Fee currency
Middle East and North Africa (continued)
MTN Sudan Company Limited Frequency 2G + 3G 25/10/2003 20 years Determined in renewal process EUR
Transmission 25/10/2003 20 years Determined in renewal process EURVSAT Gateway 25/10/2003 20 years Determined in renewal process EUR
VSAT Hub 25/10/2003 20 years Determined in renewal process EURVSAT Terminal 25/10/2003 20 years Determined in renewal process EUR
MTN Afghanistan Limited 900MHz 15/10/2005 15 years 10 years USD1800MHz
MTN Yemen 900MHz 31/07/2000 15 years Determined in renewal process USD1800MHz 17/02/2008
MTN Cyprus (JSC) 900MHz 01/12/2003 20 years Determined in renewal process EUR1800MHz
3G
13. INVESTMENT IN ASSOCIATES
Associates are all entities over which the Group has significant influence, but not control, over the financial and operating policies. Significant influence is presumed to exist when the Group holds between 20% and 50% of the voting power of another entity.
Associates are accounted for using the equity method and are recognised initially at cost. The Group’s investment in associates includes goodwill identified on acquisition net of any accumulated impairment losses. The consolidated financial statements include the Group’s share of post-acquisition accumulated profits or losses of associated companies in the carrying value of the investments, which are generally determined from their latest audited financial statements and the annual profit attributable to the Group is recognised in profit or loss. The Group’s share of post-acquisition movement in reserves is recognised in other comprehensive income. The cumulative post-acquisition movements are adjusted against the carrying amount of the investment.
The carrying amount of such interests is reduced to recognise any potential impairment in the value of individual investments. When the Group’s share of losses in an associate equals or exceeds its interest in the associate, the Group does not recognise further losses, unless the Group has an obligation, issued guarantees or made payments on behalf of the associate.
Licence agreements TypeTTGranted/renewed TermTT Renewable term Fee currency
Notes to the Group financial statements continuedfor the year ended 31 December 2011

MTN Group Limited Integrated Business Report for the year ended 31 December 2011133
Grou
p ov
ervi
ewPe
rform
ance
revi
ewOp
erat
iona
l and
fin
ancia
l rev
iew
Sust
aina
bilit
yFi
nanc
ial s
tate
men
tsSh
areh
olde
r inf
orm
atio
n
Initial licence/renewal fee Annual fees Further fees/obligations where applicable
150 million 0,5% of revenue SDG 5,5 millionRange of (SDG 1 000 to 8 000) per linkSDG 2 million per gateway Not applicableSDG 500 000 per hubSDG 5 000 per terminal
40 million 4,5% of revenueAfghani 200 000 per duplex 200KHz
10 million 0,5 million Not applicable1 million 1,2 million Not applicable
21,8 million No annual fees specified in the licence agreement Not applicable
Initial licence/renewal fee Annual fees Further fees/obligations where applicable

MTN Group Limited Integrated Business Report for the year ended 31 December 2011134
13. INVESTMENT IN ASSOCIATES (continued)
Dilution gains or losses arising on investments on associates are recognised in profit or loss.
If the ownership interest in an associate is reduced but significant influence is retained, only a proportionate share of the amounts previously recognised in other comprehensive income are classified to profit or loss.
Profits or losses resulting from upstream and downstream transactions between the Group and its associates are recognised in the Group’s financial statements only to the extent of unrelated investor’s interests in the associates. Unrealised losses are eliminated unless the transaction provides evidence of an impairment of the asset transferred. Accounting policies of associates have been changed where necessary to align them with the policies of the Group.
The Group had the following effective interests in associates.
Unless otherwise stated, the Group’s associates’ countries of incorporation are also their principal place of operation.
2011 2010
Associate Principal activityCountry of
incorporationEffective % interest in
issued ordinary share capital
Number Portability Proprietary Limited Porting South Africa 20 20Leaf Wireless Proprietary Limited Cellular dealership South Africa 44 44Belgacom International Carrier Services SA (BICS)
Telecommunications Belgium 20 20
Ghana Tower InterCo BV Managing of telecommunication infrastructure
Netherlands 49 **
Uganda Tower InterCo BV Managing of telecommunication infrastructure
Netherlands 49 **
** The Group acquired a 49% stake in both Ghana Tower InterCo BV and Uganda Tower InterCo BV in 2011.
The Group has elected under IFRS 3 to finalise the fair values of assets and liabilities allocated to each cash-generating unit and the calculation of goodwill and acquired intangible assets within 12 months subsequent to acquisition date.
2011Rm
2010Rm
Balance at beginning of year 1 302 1 462Additions 1 109 — Share of results after tax (38) 52Effect of movements in exchange rates 400 (212) Dividend income (92) —
Balance at end of year 2 681 1 302
Share of results after tax comprisesShare of results of associates after tax 38 133Amortisation of customer relationships – BICS (115) (123)Unwind of deferred tax on customer relationships – BICS 39 42
(38) 52
2011 2010
Associate Principal activityCountry of
incorporationEffective % interest in
issued ordinary share capital
2011Rm
2010Rm
Notes to the Group financial statements continuedfor the year ended 31 December 2011

MTN Group Limited Integrated Business Report for the year ended 31 December 2011135
Grou
p ov
ervi
ewPe
rform
ance
revi
ewOp
erat
iona
l and
fin
ancia
l rev
iew
Sust
aina
bilit
yFi
nanc
ial s
tate
men
tsSh
areh
olde
r inf
orm
atio
n
13. INVESTMENT IN ASSOCIATES (continued)The Group’s share of the results of its associates, which are unlisted, and its aggregated assets (including goodwill) and liabilities, are as follows:
Summary financial information**
Effective interest
Rm
Number Portability
ProprietaryLimited
Rm
Leaf WirelessProprietary
LimitedRm
Belgacom International
CarrierServices SA
Rm
GhanaTower
InterCo BV
UgandaTower
InterCo BV
2011Revenue 3 534 18 111 16 259 468 *Share of results after tax (38) 2 3 287 (198) *
Total assets 7 209 51 46 8 597 11 141 *Total liabilities (4 216) (2) (12) (5 993) (6 146) *
2010Revenue 3 229 19 240 15 591 — —Share of results after tax 52 (2) (4) 670 — —
Total assets 1 386 48 41 6 790 — —Total liabilities (947) (1) (44) (4 635) — —
There are no significant contingent liabilities relating to the Group’s interests in these associates.
*Amounts less than R1 million.**The information presented is before any eliminations.
Effectiveinterest
Rm
NumberPortability
ProprietaryLimited
Rm
Leaf WirelessProprietary
LimitedRm
BelgacomInternational
CarrierServices SA
Rm
GhanaTowerTT
InterCo BV
UgandaTowerTT
InterCo BV

MTN Group Limited Integrated Business Report for the year ended 31 December 2011136
14. LOANS AND OTHER NON-CURRENT RECEIVABLES
Loans and other receivables are accounted for as loans and receivables in accordance with the accounting policy disclosed in note 46.
2011 Rm
2010 Rm
Loan to Iran Electronic Development Company* — 422Loan to Irancell Telecommunication Services Company* 1 596 3 316Non-current prepayments and advances 2 076 2 111
3 672 5 849Less: Amounts included in current assets — (2 458)
– Loan to Iran Electronic Development Company* — (422) – Loan to Irancell Telecommunication Services Company* — (2 036)
Amounts included in non-current assets 3 672 3 391
*The loans to Iran Electronic Development Company and to Irancell Telecommunication Services Company comprises the following four loans:Loan 1: 2010: This loan attracted interest at LIBOR +4% per annum (effective rate of 6%) which was capitalised against the loan. The loan has been advanced from Irancell
Telecommunication Services Company to Iran Electronic Development Company. Loan repaid during 2011.Loan 2: This loan attracts interest at LIBOR +4% per annum (effective rate of 5%) (2010: effective rate of 7%) which is capitalised against the loan. The loan and capitalised
interest is payable in 2014.Loan 3: 2010: This loan attracted interest at EURIBOR +4% which was capitalised against the loan (effective rate of 7%). Loan repaid during 2011.Loan 4: 2010: This loan attracted interest at EURIBOR +4% which was capitalised against the loan (effective rate of 10%). Loan repaid during 2011.
The recoverability of the loan was assessed at the reporting date and was not found to be impaired.
The loans are registered with the Organisation for Investments Economic and Technical Assistance of Iran (OIETAI) under the foreign investment licence obtained by the company and which is covered by the Foreign Investment Promotion and Protection Act (FIPPA).
2011 Rm
2010 Rm
Notes to the Group financial statements continuedfor the year ended 31 December 2011

MTN Group Limited Integrated Business Report for the year ended 31 December 2011137
Grou
p ov
ervi
ewPe
rform
ance
revi
ewOp
erat
iona
l and
fin
ancia
l rev
iew
Sust
aina
bilit
yFi
nanc
ial s
tate
men
tsSh
areh
olde
r inf
orm
atio
n
15. DEFERRED TAXES
Deferred tax is accounted for in accordance with of the accounting policy disclosed in note 8.
1 January 2010
Rm
Recognised in profit or loss
Rm
Exchange differences
Rm
31 December 2010
Rm
Recognised in profit
or loss Rm
Exchange differences
Rm
31 December 2011
Rm
Deferred tax assetsProvisions and other temporary differences 850 113 103 1 066 (9) (124) 933Depreciation in excess of tax allowances 305 7 (63) 249 — 34 283Tax loss carried forward 168 55 (134) 89 (361) 322 50Arising due to fair value adjustments on business combinations (6) (9) 18 3 16 (1) 18
1 317 166 (76) 1 407 (354) 231 1 284
Deferred tax liabilitiesAssessed losses (47) — — (47) (27) 41 (33)Tax allowances in excess of depreciation (4 928) (2 563) 564 (6 927) (964) (732) (8 623)Other temporary differences (872) 132 149 (591) (21) 464 (148)Revaluations (400) 48 63 (289) 43 (33) (279)Working capital allowances 581 233 — 814 234 (1) 1 047
(5 666) (2 150) 776 (7 040) (735) (261) (8 036)
Net deferred tax liability (4 349) (1 984) 700 (5 633) (1 089) (30) (6 752)
Deferred tax assets are recognised for tax losses carried forward to the extent that the realisation of the related tax benefit through future taxable profits is probable.
1 January2010
Rm
Recognised inprofit or loss
Rm
Exchangedifferences
Rm
31 December 2010
Rm
Recognised in profit
or lossRm
Exchangedifferences
Rm
31 December 2011
Rm

MTN Group Limited Integrated Business Report for the year ended 31 December 2011138
16. INVENTORIES
Inventory mainly comprises items of handsets, SIM cards and accessories held for sale and consumable items.
Inventories are measured at the lower of cost and net realisable value. The cost of inventory is determined using the weighted average method. Cost comprises direct materials and, where applicable, overheads that have been incurred in bringing the inventories to their present location and condition, excluding borrowing costs. Net realisable value represents the estimated selling price in the ordinary course of business, less applicable variable selling expenses. Where appropriate, an impairment provision is raised in respect of obsolete and defective inventories.
2011 Rm
2010 Rm
Finished goods (handsets, SIM cards and accessories) – at cost 2 883 1 879Consumable stores and maintenance spares – at cost 141 36Less: Write-down to net realisable value (395) (326)
2 629 1 589
MTN Uganda (2011: R47 million, 2010: R44 million) and Mascom Wireless Botswana Proprietary Limited (2011: R5 million, 2010: nil) have secured facilities through the pledge of their inventories (note 22).
At beginning of year
RmAdditions*
RmUtilised
Rm
Exchange differences
Rm
At end of year
Rm
2011Movement in write-down (326) (67) 9 (11) (395)
2010Movement in write-down (196) (145) 9 6 (326)
*Refer to note 6.
2011 Rm
2010 Rm
At beginningof year
RmAdditions*
RmUtilised
Rm
Exchangedifferences
Rm
At endof year
Rm
Notes to the Group financial statements continuedfor the year ended 31 December 2011
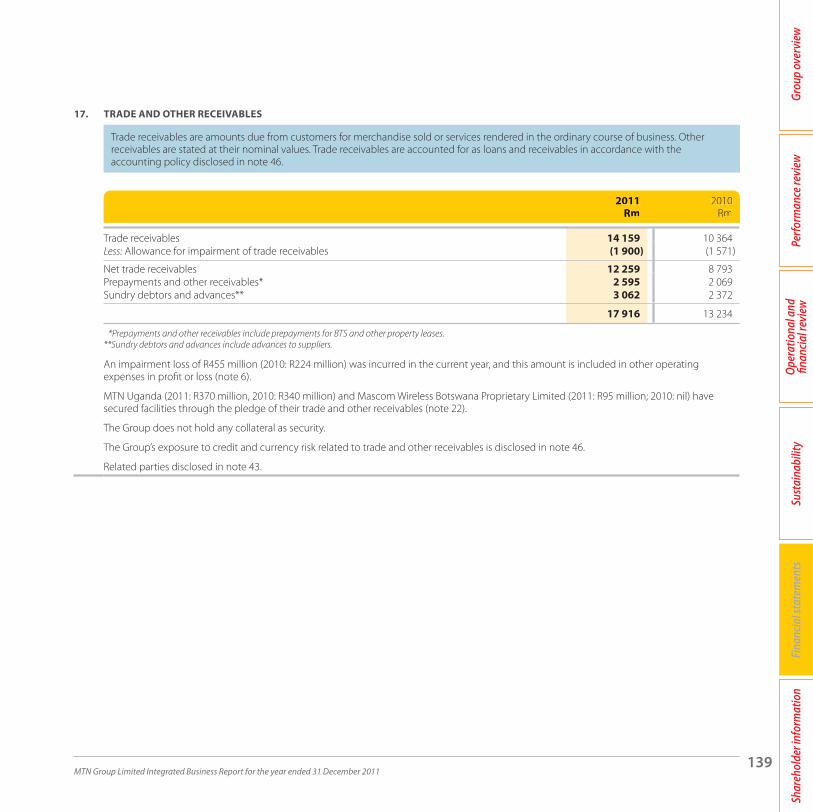
MTN Group Limited Integrated Business Report for the year ended 31 December 2011139
Grou
p ov
ervi
ewPe
rform
ance
revi
ewOp
erat
iona
l and
fin
ancia
l rev
iew
Sust
aina
bilit
yFi
nanc
ial s
tate
men
tsSh
areh
olde
r inf
orm
atio
n
17. TRADE AND OTHER RECEIVABLES
Trade receivables are amounts due from customers for merchandise sold or services rendered in the ordinary course of business. Other receivables are stated at their nominal values. Trade receivables are accounted for as loans and receivables in accordance with the accounting policy disclosed in note 46.
2011 Rm
2010 Rm
Trade receivables 14 159 10 364Less: Allowance for impairment of trade receivables (1 900) (1 571)
Net trade receivables 12 259 8 793Prepayments and other receivables* 2 595 2 069Sundry debtors and advances** 3 062 2 372
17 916 13 234
*Prepayments and other receivables include prepayments for BTS and other property leases.**Sundry debtors and advances include advances to suppliers.
An impairment loss of R455 million (2010: R224 million) was incurred in the current year, and this amount is included in other operating expenses in profit or loss (note 6).
MTN Uganda (2011: R370 million, 2010: R340 million) and Mascom Wireless Botswana Proprietary Limited (2011: R95 million; 2010: nil) have secured facilities through the pledge of their trade and other receivables (note 22).
The Group does not hold any collateral as security.
The Group’s exposure to credit and currency risk related to trade and other receivables is disclosed in note 46.
Related parties disclosed in note 43.
2011 Rm
2010 Rm

MTN Group Limited Integrated Business Report for the year ended 31 December 2011140
18. CURRENT INVESTMENTS
Current investments consist of loans and receivables and held to maturity financial assets that are accounted for in accordance with the accounting policy disclosed in note 46.
2011 Rm
2010 Rm
Loans and receivablesGovernment bonds with a fixed interest rate ranging between 16,5% to 17%* 215 —Foreign currency fixed deposits with fixed interest rates of 0,20% to 2,75%** 1 462 —
1 677 —
Held to maturity financial assets*** Government bonds with interest rates of between 9,5% and 9,92% and maturity dates between January and February 2012. 698 — Treasury bills with interest rates of between 7,7% and 16,8% and maturity dates between January and November 2012. 7 105 —
7 803 —
Total current investments 9 480 —
* Denominated in Iranian rial. ** Denominated in United States dollar.*** Denominated in Nigerian naira. The credit rating for these instruments is BB+.
The Group has not reclassified any financial assets measured at amortised cost from fair value during the current or prior year. There were no gains or losses realised on the disposal of held to maturity financial assets in 2011 or 2010. The carrying amount of the loans and receivables and held to maturity financial assets are deemed to approximate their fair values. No provision for impairment has been raised as at reporting date as the loans and receivables and held to maturity assets are considered to be fully performing.
The maximum exposure to credit risk at the reporting rate is the carrying amount of the loans and receivables and held to maturity assets outlined above.
There were no gains or losses realised on the disposal of held to maturity financial assets in 2011 or 2010.
19. NON-CURRENT ASSETS HELD FOR SALE
Non-current assets (or disposal groups) are classified as assets held for sale and are stated at the lower of their carrying amounts and fair value less costs to sell when their carrying amounts are to be recovered principally through sale rather than continued use and the sale is considered to be highly probable.
2011 Rm
2010 Rm
Property, plant and equipment – network assets 820 825
MTN Uganda Limited entered into a transaction with American Tower Company (ATC) which involves the sale of 997 of MTN Uganda’s existing BTS sites to TowerCo Uganda for an agreed purchase price of USD175 million. ATC holds a 51% stake in TowerCo Uganda’s holding company, with the remaining 49% stake held by the Group. MTN Uganda will be the anchor tenant on commercial terms on each of the towers being sold. The transaction is expected to close in 2012, subject to customary closing conditions.
In 2011, Scancom Limited (Ghana) concluded a transaction with American Tower Company (ATC) which involved the sale of Ghana’s existing BTS sites to TowerCo Ghana.
2011 Rm
2010 Rm
2011 Rm
2010Rm
Notes to the Group financial statements continuedfor the year ended 31 December 2011

MTN Group Limited Integrated Business Report for the year ended 31 December 2011141
Grou
p ov
ervi
ewPe
rform
ance
revi
ewOp
erat
iona
l and
fin
ancia
l rev
iew
Sust
aina
bilit
yFi
nanc
ial s
tate
men
tsSh
areh
olde
r inf
orm
atio
n
20. ORDINARY SHARES AND SHARE PREMIUM
Ordinary shares are classified as equity. Incremental external costs directly attributable to the issue of new ordinary shares or share options are recognised in equity as a deduction, net of tax from the proceeds.
Where any Group company purchases the Company’s equity share capital (treasury shares), the consideration paid, including any directly attributable incremental external costs (net of income taxes), is deducted from equity attributable to the Company’s equity holders until the shares are cancelled or reissued. Where such ordinary shares are subsequently reissued, any consideration received, net of any directly attributable incremental transaction costs and the related income tax effects, is included in equity attributable to the Company’s equity holders.
2011 2010Number of shares
Ordinary share capital (par value of 0,01 cents)Authorised 2 500 000 000 2 500 000 000Issued (fully paid up) 1 884 811 569 1 884 529 317
In issue at 1 January 1 884 510 117 1 840 536 491Options exercised 301 452 528 062MTN Zakhele transaction — 43 445 564
In issue at end of year 1 884 811 569 1 884 510 117Options – MTN Zakhele transaction* (29 994 952) (29 994 952)Treasury shares** (6 764 412)
In issue at end of year – excluding MTN Zakhele transaction and treasury shares*** 1 848 052 205 1 854 515 165
* Due to the call option over the notional vendor finance shares, these shares, although legally issued to MTN Zakhele, are not deemed to be issued in terms of IFRS and are shown as such in the share capital reconciliation.
** Treasury shares held by MTN Holdings Proprietary Limited.***There are no restrictions, rights and preferences including restrictions on dividend distributions attached to these shares.
2011 2010Number of shares

MTN Group Limited Integrated Business Report for the year ended 31 December 2011142
20. ORDINARY SHARES AND SHARE PREMIUM (continued)
2011 Rm
2010 Rm
Share capitalBalance at beginning of year * *Additions * *
Balance at end of year * *
Share premiumBalance at beginning of year 45 602 44 297Options – MTN Zakhele transaction — 1 294Options exercised 6 11Share buy-back (930) —
Balance at end of year 44 678 45 602
*Amounts less than R1 million.
MTN Zakhele transactionMTN concluded its broad-based black economic empowerment (BBBEE) transaction “MTN Zakhele” during October 2010. The transaction is designed to provide long-term, sustainable benefits to all BBBEE participants and will run for a period of six years. Over 122 552 applicants subscribed for shares and were successful.
The total cost of this transaction was R2 973 million which was recognised as a once-off charge in profit or loss in 2010. This charge included the once-off share-based payment transaction charges for notional vendor finance of R1 382 million, the employee share option plan of R171 million and a donation of R1 294 million. Transaction costs amounted to R126 million.
The donation was used to subscribe for 12 045 412 shares at a price of R107,46 per share. Through the notional vendor finance, the Company issued 29 994 952 shares (NVF shares) to MTN Zakhele at par value. The Group has a call option over these shares. The value of the call option is R1 772 million (2010: R1 382 million) and was determined using a Monte Carlo valuation model. The significant inputs into the model were the market share price of the Company’s shares of R143,73 at year end (R128,85 at the grant date, being 14 October 2010), volatility of 39,9% (2010: 40,2%), dividend yield of 7,6% (2010: 4,1%), expected option life of six years and an annual risk free rate of 6,8% (2010: 7,1%).
Share buy-backDuring 2011, MTN Holding Proprietary Limited bought 6 764 412 shares for R930 million.
MTN Holdings Proprietary Limited acquired 6 764 412 shares in MTN Group Limited on the JSE Limited during the period of 17 – 30 November 2011. The total amount paid to acquire the shares, inclusive of transaction costs, was R930 million. The shares acquired are fully paid shares and are held as treasury shares.
The Group’s objective in terms of the buy-back is to create shareholder value over time and improve the structure of the statement of financial position.
2011 Rm
2010Rm
Notes to the Group financial statements continuedfor the year ended 31 December 2011

MTN Group Limited Integrated Business Report for the year ended 31 December 2011143
Grou
p ov
ervi
ewPe
rform
ance
revi
ewOp
erat
iona
l and
fin
ancia
l rev
iew
Sust
aina
bilit
yFi
nanc
ial s
tate
men
tsSh
areh
olde
r inf
orm
atio
n
21. OTHER RESERVES
2011 Rm
2010 Rm
Balance at beginning of year (22 724) (15 276) Transactions with non-controlling interests (89) 60Transfer to retained earnings (37) —Share-based payment reserve 74 1 640Cash flow hedging reserve — 77Other reserves 13 93Exchange differences on translating foreign operations 10 415 (9 318)
Balance at end of year (12 348) (22 724)
Consisting of:Contingency reserve (as required by insurance regulations)* 28 39Statutory reserve (as required by Rwanda and Congo-Brazzaville legislation)** 209 235Transactions with non-controlling interests (10 779) (10 690)Shareholders’ loan revaluation reserve (248) (244)Share-based payment reserve 2 042 1 968Other reserves 2 (15)Foreign currency translation reserve (3 602) (14 017)
(12 348) (22 724)
* A contingency reserve has been created in terms of the Short-term Insurance Act, 1988. Transfers to the contingency reserve are treated as an appropriation of income, and the balance of the reserve is disclosed in the statement of financial position as a non-distributable reserve, forming part of shareholders’ funds. On dissolution of the special purpose entities to which these reserves relate, they will become available for distribution.
** A statutory reserve has been created in terms of local legislation. Transfers to the statutory reserve are treated as an appropriation of income, and the balance of the reserve is disclosed in the statement of financial position as a non-distributable reserve, forming part of the shareholders’ funds.
22. BORROWINGS
Borrowings are recognised initially at fair value, net of transaction costs incurred.
Borrowings are subsequently carried at amortised cost; any difference between the proceeds (net of transaction costs) and the redemption value is recognised in profit or loss over the period of the borrowings using the effective interest method.
Fees paid on the establishment of loan facilities are recognised as transaction costs and capitalised to the extent that it is probable that some or all of the facility will be drawn down. When the draw down is made, the transaction costs are amortised to profit or loss using the effective interest method. To the extent there is no evidence that it is probable that some or all of the facility will be drawn down, the fee is capitalised as a prepayment for liquidity services and amortised over the period of the facility to which it relates.
Borrowings are classified as current liabilities unless the Group has an unconditional right to defer settlement of the liability for at least 12 months after the reporting date.
Financial liabilities are derecognised when the obligation specified in the contract is discharged, cancelled or expires.
2011 Rm
2010 Rm

MTN Group Limited Integrated Business Report for the year ended 31 December 2011144
22. BORROWINGS (continued)
2011 Rm
2010 Rm
Denominated currency Description of borrowing
UnsecuredSouth and East Africa 1 466 670 Oltio Proprietary Limited (MTN Mobile Money 258 258 Proprietary Limited) 258 258 ZAR Term loan from JV partner
MTN Zambia Limited 951 155
— 155 ZMK Syndicated term loan facility 951 — ZMK Syndicated term loan facility
MTN Rwandacell S.A.R.L 203 221
148 158 USD Export credit guarantee backed term loan facilities
55 63 RWF Syndicated term loan facility
Swazi MTN Limited 48 28
9 8 SZL Bilateral term loan facility 15 13 SZL Bilateral term loan facility
6 7 SZL Bilateral term loan facility 18 — SZL Bilateral term loan facility
Satellite Data Networks Mauritius Proprietary Limited 6 8
6 8 USD Long-term loan
* Nominal interest rates are the interest rates on the loans (whether NACM, NACQ, NACS, NACA) as at 31 December 2011.** Effective interest rates are calculated as follows: interest paid in 2011/weighted average capital balance x number of days/365.
2011Rm
2010Rm
Denominated currency Description of borrowing
Notes to the Group financial statements continuedfor the year ended 31 December 2011

MTN Group Limited Integrated Business Report for the year ended 31 December 2011145
Grou
p ov
ervi
ewPe
rform
ance
revi
ewOp
erat
iona
l and
fin
ancia
l rev
iew
Sust
aina
bilit
yFi
nanc
ial s
tate
men
tsSh
areh
olde
r inf
orm
atio
n
Type of interest chargedNominal interest*
Effective interest ** Repayment details
No interest — — Repayable on demand
Variable interest rate 7,0 9,0 Loans repaid during the yearVariable interest rate 12,0 11,0 Interest semi-annual. Bullet capital repayment – December 2014
Variable and fixed interest rate 2,5 2,5 Semi-annual. Final repayment – September 2014
Variable interest rate 13,0 14,0 Monthly. Final repayment – September 2014
Variable interest rate 8,0 13,0 Monthly. Final repayment – September 2012Variable interest rate 9,0 13,0 Monthly. Final repayment – June 2013Variable interest rate 9,0 12,0 Monthly. Final repayment – October 2014Variable interest rate 8,0 8,0 Quarterly. Final repayment – September 2020
Fixed interest rate 4,0 4,0 Capital – bullet payment
Type of interest chargedTTNominal interest*
Effectiveinterest ** Repayment details

MTN Group Limited Integrated Business Report for the year ended 31 December 2011146
Notes to the Group financial statements continuedfor the year ended 31 December 2011
22. BORROWINGS (continued)
2011 Rm
2010 Rm
Denominated currency Description of borrowing
West and Central Africa region 15 099 11 868MTN Cote d'Ivoire SA 261 297
101 111 XOF Various long-term loan facilities
— 173 XOFVarious bilateral short-term loan facilities
— 13 XOF Bilateral short-term loan facility
160 — XOFVarious bilateral short-term loan facilities
MTN Nigeria Communications Limited 13 065 10 331
10 222 8 920 NGN Syndicated term loan facility 795 1 242 USD Syndicated term loan facility 786 85 USD Vendor finance facility 107 — USD Vendor finance facility 782 84 USD Vendor finance facility 373 — USD Vendor finance facility
MTN Congo SA 510 190
— 190 XAF Syndicated term loan facility 510 — XAF Syndicated term loan facility
Mobile Telephone Networks Cameroon Limited 704 404
704 404 XAF Syndicated term loan facility
Spacetel Benin SA 478 539
478 539 XOF Syndicated term loan facility
Lonestar Communications Corporation LLC (Liberia) 81 107
20 66 USD Bilateral term loan facility 61 41 USD Bilateral term loan facility
2011 Rm
2010 Rm
Denominatedcurrency Description of borrowing

MTN Group Limited Integrated Business Report for the year ended 31 December 2011147
Grou
p ov
ervi
ewPe
rform
ance
revi
ewOp
erat
iona
l and
fin
ancia
l rev
iew
Sust
aina
bilit
yFi
nanc
ial s
tate
men
tsSh
areh
olde
r inf
orm
atio
n
Type of interest chargedNominal interest*
Effective interest ** Repayment details
Fixed interest rate 8,0 8,0 Monthly. Final repayment – December 2014
Fixed interest rate 7,0 7,0 Loans repaid during the yearFixed interest rate 7,5 7,5 Loans repaid during the year
Fixed interest rate 7,0 7,0 Quarterly. Final repayment – March 2012
Variable interest rate 17,0 17,0 Annual. Final repayment – December 2015Variable interest rate 2,0 3,0 Semi-annual. Final repayment – October 2012Variable interest rate 3,0 4,0 Semi-annual. Final repayment – June 2015Variable interest rate 3,0 3,0 Semi-annual. Final repayment – June 2015Variable interest rate 2,0 2,0 Semi-annual. Final repayment – June 2015Variable interest rate 2,0 2,0 Semi-annual. Final repayment – December 2015
Fixed interest rate 8,3 8,8 Loan refinanced during the yearFixed interest rate 7,0 7,0 Monthly. Final repayment – November 2016
Fixed interest rate 6,0 6,0 Semi-annual. Final repayment – May 2015
Fixed interest rate 8,0 9,0 Semi-annual. Final repayment – August 2014
Fixed interest rate 11,0 11,0 Tri-annual. Final repayment – June 2012Variable interest rate 11,0 11,0 Quarterly. Final repayment – October 2014
Type of interest chargedTTNominal interest*
Effectiveinterest ** Repayment details

MTN Group Limited Integrated Business Report for the year ended 31 December 2011148
Notes to the Group financial statements continuedfor the year ended 31 December 2011
22. BORROWINGS (continued)
2011 Rm
2010 Rm
Denominated currency Description of borrowing
Middle East and North Africa 731 840 Irancell Telecommunication Services Company Proprietary Limited 463 573
89 301 EUR Vendor finance facility 374 272 EUR Vendor finance facility
MTN Sudan Company Limited — 23
— 23 EUR Bilateral term loan facility
MTN Cyprus Limited 259 244
— 2 EUR Bilateral term loan facility 5 5 EUR Bilateral term loan facility 5 5 EUR Bilateral term loan facility
249 232 EUR Bilateral term loan facility
MTN Yemen 9 —
9 — YER Bilateral term loan facility
Head office companies 13 042 19 560 MTN Holdings Proprietary Limited 13 042 18 799
— 2 980 USD and ZAR Syndicated term loan facilities 6 000 6 000 ZAR Syndicated term loan facility 5 300 5 300 ZAR Domestic medium term notes
742 1 991 ZAR Commercial papers — 1 016 ZAR Revolving credit facility — 1 512 ZAR General banking facilities
1 000 — ZAR Bilateral term loan facility
MTN International (Mauritius) Limited — 761
— 761 USD Bilateral short-term loan facility
Total unsecured borrowings 30 338 32 938
2011 Rm
2010 Rm
Denominatedcurrency Description of borrowing

MTN Group Limited Integrated Business Report for the year ended 31 December 2011149
Grou
p ov
ervi
ewPe
rform
ance
revi
ewOp
erat
iona
l and
fin
ancia
l rev
iew
Sust
aina
bilit
yFi
nanc
ial s
tate
men
tsSh
areh
olde
r inf
orm
atio
n
Type of interest chargedNominal interest*
Effective interest ** Repayment details
Variable interest rate 6,7 7,1 Final repayment – March 2012Variable interest rate 5,7 5,4 Semi-annual. Final repayment – December 2012
Variable interest rate 4,0 4,0 Loan repaid during the year
Variable interest rate 6,0 6,0 Loan repaid during the yearVariable interest rate 6,0 6,0 Quarterly. Final repayment – March 2014Variable interest rate 7,0 7,0 Monthly. Final repayment – May 2015Variable interest rate 4,0 4,0 Semi-annual. Final repayment – December 2020
Variable interest rate 24,5 24,6 Semi-annual. Final repayment – April 2016
Variable interest rate — 1,0 – 7,0 Loan repaid during the yearVariable interest rate 8,0 8 ,0 Final repayment – June 2013Fixed interest rate 7,8 – 10,2 7,8 – 10,2 Maturity: October 2013 – July 2017 Variable interest rate — 5,6 – 7,0 2011: Maturity – March 2012, 2010: Loan repaid during the year Variable interest rate — 7,0 Loan repaid during the yearFixed interest rate — 5,9 – 7,0 Loan repaid during the yearVariable interest rate 7,0 7,0 Interest paid quarterly. Bullet capital repayment – March 2014
Variable interest rate 1,8 1,9 Loan repaid during the year
Type of interest chargedTTNominal interest*
Effectiveinterest ** Repayment details

MTN Group Limited Integrated Business Report for the year ended 31 December 2011150
Notes to the Group financial statements continuedfor the year ended 31 December 2011
22. BORROWINGS (continued)
2011 Rm
2010 Rm
Denominated currency Description of borrowing
SecuredSouth and East Africa region 671 991 MTN Uganda Limited 557 464
300 332 UGX Syndicated term loan facility 122 132 USD Syndicated term loan facility 135 — UGX Revolving credit facility
Mascom Wireless Botswana Proprietary Limited 114 —
114 — BWP Loan facility
MTN Zambia Limited — 527
— 527 USD Vendor finance facility
West and Central Africa region 914 1 046MTN Cote d'Ivoire SA 868 999
758 876 XOF Syndicated term loan facility
110 123 XOF Bilateral term loan facility
MTN Congo SA 46 47
46 47 XAF Term loan facility
Middle East and North Africa region 1 500 313MTN Sudan Company Limited 1 016 313
— 19 SDG Bank borrowings
446 41 EUR Vendor finance facility
504 253 USD Vendor finance facility
66 — EUR Vendor finance facility
MTN Afghanistan Limited 484 —
114 — USD Bilateral loan with a Development Finance Institution
370 — USD Bilateral loan with a Development Finance Institution
Total secured borrowings 3 085 2 350
Total unsecured borrowings 30 338 32 938
Total borrowings 33 423 35 288

MTN Group Limited Integrated Business Report for the year ended 31 December 2011151
Grou
p ov
ervi
ewPe
rform
ance
revi
ewOp
erat
iona
l and
fin
ancia
l rev
iew
Sust
aina
bilit
yFi
nanc
ial s
tate
men
tsSh
areh
olde
r inf
orm
atio
n
Type of interest chargedNominal interest*
Effective interest** Repayment details Security/collateral
Variable interest rate 13,0 20,0 Quarterly. Final repayment – October 2014 Floating charge over current and future assetsVariable interest rate 3,5 4,1 Quarterly. Final repayment – October 2014 Floating charge over current and future assetsVariable interest rate 13,2 16,3 Bullet repayment with option to roll over.
Final repayment – 2014Floating charge over current and future assets
Variable interest rate 8,3 8,3 Monthly. Final repayment – June 2016 Pledge of current and future movable assets
Variable interest rate 3,0 4,0 Loan repaid during the year Pledge of specific network assets under a supply contract
Fixed interest rate 8,0 9,0 Semi-annual. Final repayment – March 2014
Pledge of certain property, plant and equipment
Fixed interest rate 8,0 8,0 Quarterly. Final repayment – July 2014 Pledge of certain property, plant and equipment
Fixed interest rate 7,3 7,3 Monthly. Final repayment – January 2014 Pledge of property, plant and equipment
Fixed interest rate 12,0 13,7 Loan repaid during the year Pledge of network and capital work-in-progress assets
Variable interest rate 7,8 10,0 Quarterly. Final repayment – June 2020 Pledge of network and capital work-in- progress assets
Fixed interest rate 10,0 10,0 Quarterly. Final repayment – December 2016
Pledge of network and capital work-in- progress assets
Variable interest rate 5,3 2,0 Semi-annual. Final repayment – December 2019
Pledge of network and capital work-in-progress assets
Variable interest rate 6,0 6,8 Quarterly. Final repayment – September 2015
Pledge of shares
Variable interest rate 6,0 6,6 Quarterly. Final repayment – September 2015
Pledge of shares

MTN Group Limited Integrated Business Report for the year ended 31 December 2011152
Notes to the Group financial statements continuedfor the year ended 31 December 2011
22. BORROWINGS (continued)
2011 Rm
2010Rm
The maturity of the above loans is as follows:Payable within one year or on demand 9 869 10 431More than one year but not exceeding two years 8 790 4 019More than two years but not exceeding five years 12 855 19 178More than five years 1 909 1 660
33 423 35 288Less: amounts included within current liabilities (9 869) (10 431)
Amounts included in non-current liabilities 23 554 24 857
The carrying amounts of the Group’s borrowings are denominated in the following currencies:South African rand 13 300 17 826US dollar 4 188 4 418Nigerian naira 10 222 9 089Uganda shilling 435 332Euro 1 234 881Congo-Brazzaville Communaute Financière Africaine franc 556 237Sudanese pound — 20Botswana pula 114 —Yemen rial 9 —Benin Communaute Financière Africaine franc 478 539Cameroon Communaute Financière Africaine franc 704 404Côte d’Ivoire Communaute Financière Africaine franc 1 129 1 296Rwanda franc 55 63Zambian kwacha 951 155Swazi lilangeni 48 28
33 423 35 288
Undrawn facilitiesFloating rate 14 806 7 473Fixed rate 17 593 —
32 399 7 473
Details of the Group’s finance lease commitments are provided in note 36.The Group’s exposure to liquidity risk related to borrowings is disclosed in note 46.
2011 Rm
2010Rm

MTN Group Limited Integrated Business Report for the year ended 31 December 2011153
Grou
p ov
ervi
ewPe
rform
ance
revi
ewOp
erat
iona
l and
fin
ancia
l rev
iew
Sust
aina
bilit
yFi
nanc
ial s
tate
men
tsSh
areh
olde
r inf
orm
atio
n
23. OTHER NON-CURRENT LIABILITIES
Finance leases are accounted for in accordance with the accounting policy disclosed in note 11 and other liabilities are accounted for in accordance with the accounting policy disclosed in note 46.
2011 Rm
2010 Rm
Finance lease obligations (note 36) 189 248Other non-current provisions 457 591Deferred gain on asset swap 870 994Other 585 342
2 101 2 175Less: current portion of deferred gain on asset swap (note 25) (299) (248)
1 802 1 927
* The deferred gain arose on the contribution of various assets from MTN (Dubai) Limited, MTN International Carrier Services and Uniglobe in exchange for a 20% investment in Belgacom International Carrier Services (note 13). This gain was deferred and is amortised over a five-year period, which is the period of the commitment to use the international gateway of Belgacom SA.
24. PUT OPTION LIABILITIES
The put option liabilities are accounted for as a financial liability in accordance with the accounting policy disclosed in note 46.
2011 Rm
2010 Rm
Put options in respect of subsidiaries 178 2 796
Non-current portion — 171Current portion 178 2 625
The put option in respect of a subsidiary arises from an arrangement whereby certain of the non-controlling shareholders of MTN Afghanistan Limited have the right to put their shareholding to MTN (Dubai) Limited.
The fair value of the MTN Afghanistan put option, in terms of which the IFC has the right to put 9,1% of their shareholding to MTN (Dubai) Limited, is determined based on an EBITDA multiple, as determined in accordance with the terms and conditions of the contractual arrangement. This put option is not exercisable.
The previously disclosed option in terms of MTN Nigeria Communications Limited was exercised during the year for an amount of USD390 million.
2011 Rm
2010 Rm
2011 Rm
2010 Rm

MTN Group Limited Integrated Business Report for the year ended 31 December 2011154
Notes to the Group financial statements continuedfor the year ended 31 December 2011
25. TRADE AND OTHER PAYABLES
Trade payables are obligations to pay for goods or services that have been acquired in the ordinary course of business from suppliers. Trade payables are classified as current liabilities if payment is due within one year or less (or in the normal operating cycle of the business if longer). If not, they are presented as non-current liabilities.
Trade payables are recognised initially at fair value and are subsequently measured at amortised cost using the effective interest method.
Other payables are stated at their nominal values.
Financial liabilities are derecognised when the obligation specified in the contract is discharged, cancelled or expires.
Trade payables are accounted for as financial liabilities in accordance with the accounting policy disclosed in note 46.
2011Rm
2010Rm
Trade payables 7 615 3 342Sundry creditors 858 1 823Accrued expenses 12 203 13 188Current portion of deferred gain (note 23) 299 248Other payables 4 079 1 454
25 054 20 055
Related parties disclosed in note 43.
26. PROVISIONS
A provision is recognised when there is a present legal or constructive obligation as a result of a past event for which it is more likely than not that an outflow of resources will be required to settle the obligation and a reliable estimate can be made of the amount of the obligation. Provisions are not recognised for future operating losses.
Where there are a number of similar obligations, the likelihood that an outflow will be required in settlement is determined by considering the class of obligations as a whole. A provision is recognised even if the likelihood of an outflow with respect to any one item included in the same class of obligations may be small.
Provisions are measured at the present value of the expected outflow of resources required to settle the obligation using a pre-tax rate that reflects current market assessments of the time value of money and the risks specific to the obligation. The increase in the provision due to the passage of time is recognised as a finance cost.
Decommissioning provisionThis provision relates to the estimated cost of dismantling and removing an item of property, plant and equipment and restoring the site on which the item was located to its original condition. The Group provides for the anticipated costs associated with the restoration of leasehold property to its original condition at inception of the lease, including removal of items included in plant and equipment that are erected on leased land.
The Group only recognises these decommissioning costs for the proportion of its overall number of sites for which it expects decommissioning to take place. The expected percentage has been based on actual experience in the respective operations.
A provision is made for the present value of the estimated future decommissioning costs at the end of the life of the site. When this provision gives rise to future economic benefits, an asset is recognised, otherwise the costs are charged to profit or loss. The estimated cost is discounted at a pre-tax rate that reflects current market assessments of the time value of money. The increase in the decommissioning provision due to the passage of time is recognised as a finance cost.
Onerous contractsA provision for onerous contracts is recognised when the expected benefits to be derived by the Group from a contract are lower than the unavoidable cost of meeting its obligations under the contract. The provision is measured at the present value of the lower of the expected cost of terminating the contract or the expected net cost of continuing with the contract. Before a provision is established, the Group recognises any impairment loss on the assets associated with the contract.
2011Rm
2010Rm

MTN Group Limited Integrated Business Report for the year ended 31 December 2011155
Grou
p ov
ervi
ewPe
rform
ance
revi
ewOp
erat
iona
l and
fin
ancia
l rev
iew
Sust
aina
bilit
yFi
nanc
ial s
tate
men
tsSh
areh
olde
r inf
orm
atio
n
26. PROVISIONS (continued)
At beginning of year
RmAdditions
Rm
ReversedRm
UtilisedRm
Exchange differences
Rm
At end of year
Rm
2011Bonus provision 453 933 (74) (769) 35 578Decommissioning provision 94 7 — (6) 4 99Licence obligations 52 286 — — — 338Other provisions 2 503 768 (179) (1 022) 167 2 237
3 102 1 994 (253) (1 797) 206 3 252
2010Bonus provision 477 377 (17) (355) (29) 453Decommissioning provision 194 31 (2) (121) (8) 94Onerous lease provision 532 — (532) — — —Licence obligations 77 — — (25) — 52Other provisions 1 468 1 417 (82) (170) (130) 2 503
2 748 1 825 (633) (671) (167) 3 102
Bonus provision The bonus provision consists of a performance-based bonus, which is determined by reference to the overall company performance with regard to a set of predetermined key performance measures. Bonuses are payable annually after the Group annual results have been approved.
Decommissioning provisionThis provision relates to the estimate of the cost of dismantling and removing an item of property, plant and equipment and restoring the item and site on which the item was located to its original condition.
Onerous lease provisionThe Group recognises a provision for onerous contracts when the expected benefits from the contract are less than the unavoidable costs of meeting the obligations under that contract.
Licence obligationsThe licence obligation provision represents the estimated costs to be incurred in fulfilling the Universal Services Obligation (USO). USOs are governed by the Electronic Communications Act.
Other provisionsThe Group is involved in various regulatory and tax matters specific to the respective jurisdictions in which the Group operates. These matters may not necessarily be resolved in a manner that is favourable to the Group. The Group has therefore recognised provisions in respect of these matters based on estimates and the probability of an outflow of economic benefits.
At beginningof year
RmAdditions
RmReversed
RmUtilised
Rm
Exchange differences
Rm
At endof year
Rm

MTN Group Limited Integrated Business Report for the year ended 31 December 2011156
Notes to the Group financial statements continuedfor the year ended 31 December 2011
2011Rm
2010Rm
27. CASH GENERATED FROM OPERATIONSProfit before tax 37 640 28 095Adjustments for:Finance costs (note 7) 6 610 6 171Finance income (note 7) (5 028) (2 077)Depreciation of property, plant and equipment (note 11) 13 296 13 248Amortisation of intangible assets (note 12) 2 163 2 120(Profit)/loss on disposal of property, plant and equipment (note 6) (6) 146Loss on disposal of non-current asset (note 6) 29 —Share of results of associates after tax (note 13) 38 (52)Increase in provisions 773 760Impairment on goodwill (note 12) 31 32Reversal of impairment on property, plant and equipment (note 11) (97) (231)Impairment of trade receivables (note 17) 455 224MTN Zakhele notional vendor finance — 1 382Profit on disposal of non-current assets held for sale (note 5) (1 185) —Other 393 52
55 112 49 870Changes in working capital (4 835) 666
Increase in inventories (1 025) (279) (Increase)/decrease in trade and other receivables (2 586) 2 130Decrease in trade and other payables (2 387) (2 518)Increase in unearned income 1 163 1 333
Cash generated from operations 50 277 50 536
28. INCOME TAX PAIDAt beginning of year (3 738) (3 562) Amounts recognised in profit or loss (note 8) (13 853) (11 268) Deferred tax charge (note 15) 1 089 1 984Effect of movements in exchange rates (1 634) 1 080Other 100 — At end of year 8 622 3 738
– Taxation prepaid (415) (721)– Taxation liabilities 9 037 4 459
Total tax paid (9 414) (8 028)
2011Rm
2010Rm

MTN Group Limited Integrated Business Report for the year ended 31 December 2011157
Grou
p ov
ervi
ewPe
rform
ance
revi
ewOp
erat
iona
l and
fin
ancia
l rev
iew
Sust
aina
bilit
yFi
nanc
ial s
tate
men
tsSh
areh
olde
r inf
orm
atio
n
29. CASH AND CASH EQUIVALENTS
Cash and cash equivalents comprise cash on hand, deposits held on call and investments in money market instruments, net of bank overdrafts, all of which are available for use by the Group. Bank overdrafts are included within current liabilities on the statement of financial position, unless the Group has a legally enforceable right to set off the amounts and intends to settle on a net basis, or realise the asset and settle the liability simultaneously.
Cash and cash equivalents are accounted for as loans and receivables in accordance with the accounting policy disclosed in note 46.
Bank overdrafts are accounted for as a financial liability in accordance with the accounting policy disclosed in note 46.
For purposes of the statement of cash flows, cash and cash equivalents comprise of the following:
2011Rm
2010Rm
Cash at bank and on hand 35 806 35 947Bank overdrafts (593) (40)
35 213 35 907
MTN Uganda (2011: R195 million, 2010: R161 million) and Mascom Wireless Botswana Proprietary Limited (2011: R126 million; 2010: nil) have secured facilities through the pledge of their cash and cash equivalents (note 22).
Included in cash and cash equivalents are amounts relating to the Syrian operations. The Syrian markets have started liberating foreign exchange legislation to allow for the purchase of foreign currency, however increased sanctions and local unrest has slowed progress. It is envisaged that the majority of these funds will be used for the licence conversion from a Build Operate Transfer (BOT) to For Hold Licence (FHL).
30. RESTRICTED CASH
Restricted cash comprises short-term deposits that are not highly liquid and are accounted for as loans and receivables in accordance with the accounting policy disclosed in note 46.
2011Rm
2010Rm
Restricted cash deposits 546 285
Restricted cash consists of monies placed on deposit with banks mainly in Nigeria, Iran, Cameroon and Syria to secure letters of credit, which were undrawn and not freely available at the reporting date.
2011Rm
2010Rm
2011Rm
2010Rm
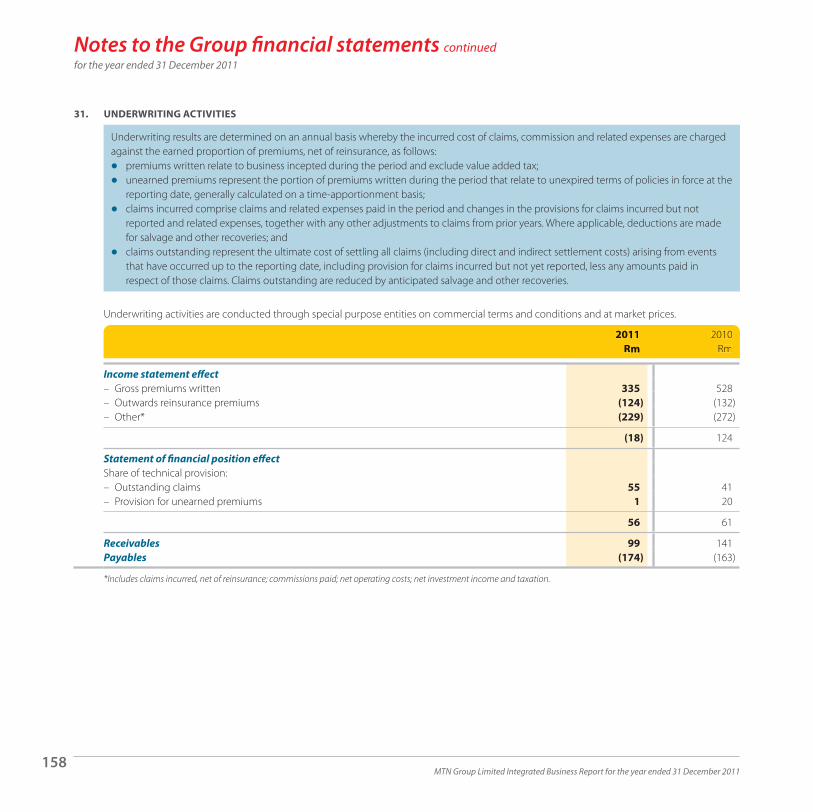
MTN Group Limited Integrated Business Report for the year ended 31 December 2011158
Notes to the Group financial statements continuedfor the year ended 31 December 2011
31. UNDERWRITING ACTIVITIES
Underwriting results are determined on an annual basis whereby the incurred cost of claims, commission and related expenses are charged against the earned proportion of premiums, net of reinsurance, as follows:
premiums written relate to business incepted during the period and exclude value added tax;unearned premiums represent the portion of premiums written during the period that relate to unexpired terms of policies in force at the reporting date, generally calculated on a time-apportionment basis;claims incurred comprise claims and related expenses paid in the period and changes in the provisions for claims incurred but not reported and related expenses, together with any other adjustments to claims from prior years. Where applicable, deductions are made for salvage and other recoveries; andclaims outstanding represent the ultimate cost of settling all claims (including direct and indirect settlement costs) arising from events that have occurred up to the reporting date, including provision for claims incurred but not yet reported, less any amounts paid in respect of those claims. Claims outstanding are reduced by anticipated salvage and other recoveries.
Underwriting activities are conducted through special purpose entities on commercial terms and conditions and at market prices.
2011Rm
2010Rm
Income statement effect– Gross premiums written 335 528– Outwards reinsurance premiums (124) (132)– Other* (229) (272)
(18) 124
Statement of financial position effectShare of technical provision:– Outstanding claims 55 41– Provision for unearned premiums 1 20
56 61
Receivables 99 141Payables (174) (163)
* Includes claims incurred, net of reinsurance; commissions paid; net operating costs; net investment income and taxation.
2011Rm
2010Rm

MTN Group Limited Integrated Business Report for the year ended 31 December 2011159
Grou
p ov
ervi
ewPe
rform
ance
revi
ewOp
erat
iona
l and
fin
ancia
l rev
iew
Sust
aina
bilit
yFi
nanc
ial s
tate
men
tsSh
areh
olde
r inf
orm
atio
n
32. CONTINGENT LIABILITIES
Contingent liabilities represent possible obligations that arise from past events and whose existence will be confirmed only by the occurrence or non-occurrence of uncertain future events not wholly within the control of the Group. Contingent liabilities also represent present obligations that arise from past events but are not recognised because an outflow of resources is not probable or a reliable estimate cannot be made. The Group does not recognise contingent liabilities in the statement of financial position until future events indicate that it is probable that an outflow of resources will take place and a reliable estimate can be made, at which time a provision is raised.
2011Rm
2010Rm
Contingent liabilities* 838 941
* The Group’s present policy is to pay incentives to service providers (SP) for handset upgrades. These upgrades are only payable once the subscribers have completed a 21-month period with the SP since the initial commencement of their contract or previous upgrade and the eligible subscriber has exercised the right to receive an upgrade for a new post-paid contract with minimum terms. The value of the obligation may vary depending on the prevailing business rules at the time of the upgrade. The total number of eligible subscribers who had not yet exercised their right to upgrade at 31 December 2011: 892 328 (2010: 845 413). The Group has, however, provided for those upgrades which have been made but which have not been presented for payment.
33. COMMERCIAL COMMITMENTSIrancell Telecommunication Service Company Proprietary LimitedThe investment in Irancell is subject to a number of sovereign, regulatory and commercial risks, which could result in the Group failing to realise full market value for its investment should it be required to dispose of any portion thereof. In this regard, 21% of Irancell is required to be offered to members of the Iranian public within approximately three years from the date of the licence. Such offering could have a proportional dilutory effect on the Company’s 49% shareholding, effectively reducing its shareholding by 10,3% to 38,7%. The substantial terms and conditions of this commitment are yet to be finalised.
Cable systems and gatewaysThe Group, together with various other parties, has entered into a construction and maintenance agreement for the Eastern Africa Submarine Cable system (EASSy), Europe India Gateway (EIG), West Africa Cable (WACS) and The East African Marine System (TEAMS) to address the growing demand for international bandwidth in Africa.
Eastern African Submarine Cable System (EASSy)The Group’s operational and maintenance commitments in respect of the contract amount to USD27,5 million as at 31 December 2011 (2010: USD28,9 million).
Europe – India Gateway (EIG)The Group’s commitment in respect of the contract amounts to USD50,4 million, of which USD49,8 million has been paid at 31 December 2011 (2010: USD40,9 million).
The Group’s operational and maintenance commitments in respect of the contract amount to USD35,7 million as at 31 December 2011 (2010: USD36,7 million).
Western Africa Cable System (WACS)The Group’s commitment in respect of the contract amounts to USD90 million, of which USD54,5 million has been paid at 31 December 2011 (2010: USD48,5 million).
The Group’s operational and maintenance commitments in respect of the contract amount to USD67,5 million as at 31 December 2011 (2010: USD67,5 million).
The East African Marine System (TEAMS)The Group’s commitment in respect of the contract amounts to USD4,8 million, of which USD1,9 million has been paid at 31 December 2011 (2010: USD1,9 million).
The Group’s operational and maintenance commitments in respect of the contract amount to USD3,1 million as at 31 December 2011 (2010: USD3,2 million).
2011Rm
2010Rm

MTN Group Limited Integrated Business Report for the year ended 31 December 2011160
Notes to the Group financial statements continuedfor the year ended 31 December 2011
34. CAPITAL COMMITMENTSCommitments for the acquisition of property, plant and equipment and software:
2011Rm
2010Rm
Capital expenditure not yet incurred at the reporting date is as follows– Contracted 8 626 2 557– Authorised but not contracted for 13 913 16 780
Share of capital commitments of joint ventures– Contracted 691 1 610– Authorised but not contracted for 1 170 1 184
Total commitments for property, plant and equipment and software 24 400 22 131
Capital expenditure will be funded from operating cash flows, existing borrowing facilities and where necessary by raising additional facilities.
35. OPERATING LEASE COMMITMENTS
Leases, where a significant portion of the risks and rewards of ownership are retained by the lessor, are classified as operating leases. Rentals payable under operating leases are charged to profit or loss on a straight-line basis over the term of the relevant lease.
Sub-lease income is recognised in profit or loss on a straight-line basis over the term of the lease.
In all significant leasing arrangements in place during the year, the Group acted as the lessee.
Sale and leasebackIn sale and leaseback transactions that result in operating leases, and it is clear that the transaction is established at fair value, any profit or loss is recognised immediately. If the sale price is below fair value, any profit or loss is recognised immediately except that, if a loss is compensated for by future lease payments at below market price, it is deferred and amortised in proportion to the lease payments over the period for which the asset is expected to be used. If the sale price is above fair value, the excess over fair value is deferred and amortised over the period for which the asset is expected to be used.
For operating leases, if the fair value at the time of a sale and leaseback transaction is less than the carrying amount of the asset, a loss equal to the amount of the difference between the carrying amount and fair value is recognised immediately.
2011Rm
2010Rm

MTN Group Limited Integrated Business Report for the year ended 31 December 2011161
Grou
p ov
ervi
ewPe
rform
ance
revi
ewOp
erat
iona
l and
fin
ancia
l rev
iew
Sust
aina
bilit
yFi
nanc
ial s
tate
men
tsSh
areh
olde
r inf
orm
atio
n
35. OPERATING LEASE COMMITMENTS (continued)The Group leases various premises and sites under non-cancellable/cancellable operating lease agreements. The leases have varying terms, escalation clauses and renewal rights. Penalties are chargeable on certain leases should they be cancelled before the end of the agreement.
2011Rm
2010Rm
The future aggregate minimum lease payments under non-cancellable operating leases are as follows:Not later than one year 190 164Later than one year and not later than five years 478 184Later than five years — 1
668 349
The future aggregate minimum lease payments under cancellable operating leases are as follows:Not later than one year 1 161 479Later than one year and not later than five years 4 614 1 435Later than five years 7 599 959
13 374 2 873
Significant operating lease agreements with related parties are disclosed in note 43.
36. FINANCE LEASE COMMITMENTS
Finance leases are accounted for in accordance with the accounting policy disclosed in note 11.
At the reporting date, the Group had outstanding commitments under non-cancellable finance leases which fall due as follows:
2011Rm
2010Rm
Minimum lease payments:Not later than one year 123 93Later than one year and not later than five years 212 317
335 410Less: future finance charges on finance leases (56) (107)
Present value of finance lease obligations 279 303
Present value of finance lease obligations are as follows:Not later than one year 90 56Later than one year and not later than five years (note 23) 189 247
279 303
2011Rm
2010Rm
2011Rm
2010Rm

MTN Group Limited Integrated Business Report for the year ended 31 December 2011162
Notes to the Group financial statements continuedfor the year ended 31 December 2011
37. OTHER COMMITMENTS
2011Rm
2010Rm
Sport sponsorships 238 83Other commitments — 370Installation of an indefeasible right of use (IRU) — 38Shared services 514 —
752 491
38. INVESTMENT IN JOINT VENTURES
A joint venture is a contractual arrangement whereby the Group and other parties undertake an economic activity which is subject to joint control.
Jointly controlled entitiesJoint venture arrangements which involve the establishment of a separate entity in which each venturer has an interest, are referred to as jointly controlled entities. The Group reports its interests in jointly controlled entities using the proportionate consolidation method of accounting. The Group’s share of the assets, liabilities, income and expenses and cash flows of jointly controlled entities are combined with the equivalent items in the Group financial statements on a line-by-line basis.
Where the Group transacts with its jointly controlled entities, unrealised profits or losses are eliminated to the extent of the Group’s interest in the joint venture, except where unrealised losses provide evidence of an impairment of the asset transferred.
Accounting policies of joint ventures have been changed where necessary to align them with the policies adopted by the Group.
The Group accounts for investments in joint ventures at cost, which includes transaction costs, less accumulated impairment losses.
Jointly controlled assetsJoint assets are joint ventures where the venturers jointly control one or more assets constructed or acquired for the purpose of the joint venture and dedicated to the purposes. The assets are used to obtain benefits for the venturers. Each venturer takes a share of the output from the assets and each bears an agreed share of the expenses incurred. The Group’s jointly controlled assets are high capacity fibre optic submarine cable systems, which have been recorded in property, plant and equipment.
In respect of its interest in jointly controlled assets the Group recognises in its financial statements its share of the jointly controlled assets, classified according to the nature of the assets, any liabilities that it has incurred, its share of any liabilities incurred jointly with the other venturers in relation to the joint venture, any income from the sale or use of its share of the output of the joint venture, together with its share of any expenses incurred by the joint venture and any expenses that it has incurred in respect of its interest in the joint venture.
Goodwill arising on the acquisition of joint ventures is included in intangible assets. Goodwill represents the excess of the cost of the acquisition over the Group’s interest in the fair value of the net identifiable assets and liabilities of the acquiree at the date of acquisition.
The Group’s effective percentage interests in joint ventures are disclosed on the following page.
2011Rm
2010Rm

MTN Group Limited Integrated Business Report for the year ended 31 December 2011163
Grou
p ov
ervi
ewPe
rform
ance
revi
ewOp
erat
iona
l and
fin
ancia
l rev
iew
Sust
aina
bilit
yFi
nanc
ial s
tate
men
tsSh
areh
olde
r inf
orm
atio
n
38. INVESTMENT IN JOINT VENTURES (continued)Unless otherwise mentioned, the Group’s joint ventures’ country of incorporation is also their principal place of operation.
2011 2010
Joint venture Principal activityCountry of incorporation
Effective % interest in issued ordinary share capital
Swazi MTN Limited Network operator Swaziland 30 30
Oltio Proprietary Limited (MTN Mobile Money Holdings Proprietary Limited)
Wireless banking services
South Africa 50 50
Deci Investments Investment holding company
Botswana 33 33
Mascom Wireless Botswana Proprietary Limited Network operator Botswana 53 53
Irancell Telecommunication Services Company Proprietary Limited
Network operator Iran 49 49
Satellite Data Networks Mauritius Proprietary Limited Internet service provider Mauritius 60 60
Summary financial informationThe following table presents, on a condensed basis the Group’s share of assets and liabilities, revenue and expenses of the joint ventures which are included in the consolidated statement of financial position and income statement.
2011Rm
2010Rm
Revenue 12 019 10 206Expenses (6 859) (5 915)
Total assets 12 176 12 266Total liabilities (9 382) (11 053)
There are no significant contingent liabilities relating to the Group’s interests in these joint ventures.
Jointly controlled assetsThe following table presents, on a condensed basis the Group’s share of assets and liabilities, revenue and expenses of the jointly controlled assets which are included in the consolidated income statement and statement of financial position.Revenue 167 142Expenses (203) (165)
Total assets 1 237 851Total liabilities (213) (60)
2011 2010
Joint venture Principal activityCountry of incorporation
Effective % interest in issued ordinary share capital
2011Rm
2010Rm

MTN Group Limited Integrated Business Report for the year ended 31 December 2011164
Notes to the Group financial statements continuedfor the year ended 31 December 2011
39. EXCHANGE RATES TO SOUTH AFRICAN RAND USED FOR THE PURPOSES OF FOREIGN CURRENCY TRANSLATIONS
Closing rates Average rates
2011 2010 2011 2010
United States dollar USD 0,12 0,15 0,14 0,14Uganda shilling UGX 306,73 348,03 347,60 295,99Rwanda franc RWF 74,76 89,27 81,97 79,33Cameroon Communaute Financière Africaine franc XAF 62,73 74,20 65,67 67,26Nigerian naira NGN 20,10 23,00 21,76 20,67Iranian rials IRR 1 378,10 1 565,67 1 474,34 1 401,06Botswana pula BWP 0,93 0,98 0,95 0,93Cote d’Ivoire Communaute Financière Africaine franc CFA 62,73 76,07 64,81 67,43Congo-Brazzaville Communaute Financière Africaine franc CFACB 62,73 74,20 66,09 67,78Zambian kwacha ZMK 633,91 722,67 665,22 673,78Swaziland lilangeni E 1,00 1,00 1,00 1,00Lebanese pound LBP 186,14 226,48 203,88 204,85Afghanistan afghani AFN 6,11 6,84 6,24 6,29Euro EUR 0,10 0,11 0,10 0,10Ghana cedi GHS 0,20 0,22 0,21 0,20Benin Communaute Financière Africaine franc XOF 62,73 74,20 63,67 67,62Guinean franc GNF 869,14 1 080,97 956,91 863,84Sudanese pound SDG 0,33 0,40 0,36 0,34Syrian pound SYP 6,71 7,13 6,54 6,39Guinea-Bissau Communaute Financière Africaine franc XOF 62,73 75,46 63,10 67,45Yemen rials YER 27,02 32,32 30,73 30,22
Closing rates Average rates
2011 2010 2011 2010

MTN Group Limited Integrated Business Report for the year ended 31 December 2011165
Grou
p ov
ervi
ewPe
rform
ance
revi
ewOp
erat
iona
l and
fin
ancia
l rev
iew
Sust
aina
bilit
yFi
nanc
ial s
tate
men
tsSh
areh
olde
r inf
orm
atio
n
40. FOREIGN EXCHANGE EXPOSUREIncluded in the Group statement of financial position are the following amounts denominated in currencies other than the functional currency of the reporting entity:
2011 Rm
2010Rm
AssetsNon-current assets– United States dollar 11 194– Euro — 1 380
11 1 574Current assets– United States dollar 3 695 9 868– Euro 2 304 2 957– British pound sterling 5 13– Congo-Brazzaville Communaute Financière Africaine franc — 154– Benin Communaute Financière Africaine franc — 57– Ghana cedi — 87– Yemen rial — 254
6 004 13 390
Total assets 6 015 14 964
LiabilitiesNon-current liabilities– United States dollar 2 416 880– Euro 511 433– Nigerian naira — 2 795– Congo-Brazzaville Communaute Financière Africaine franc — 169
2 927 4 277Current liabilities– United States dollar 4 913 8 278– British pound sterling 10 8– Euro 728 2 358– Congo-Brazzaville Communaute Financière Africaine franc — 250– South African rand 65 231
5 716 11 125
Total liabilities 8 643 15 402
2011 Rm
2010Rm

MTN Group Limited Integrated Business Report for the year ended 31 December 2011166
Notes to the Group financial statements continuedfor the year ended 31 December 2011
41. DERIVATIVES
Derivatives are accounted for in accordance with the accounting policy disclosed in note 46.
2011 Rm
2010Rm
Assets 9 —Liabilities (4) (255)
5 (255)
Fair value through profit or loss– gains/losses accounted for directly in profit or loss (12) (234)– reclassified from cash flow hedge reserves to profit or loss — 77
Notional principal amount (USD forward exchange contracts) 470 1 908
Notional principal amount (EUR forward exchange contracts) 9 —
42. EVENTS AFTER THE REPORTING PERIODDisclosed in the directors’ report on page 91.
2011 Rm
2010Rm

MTN Group Limited Integrated Business Report for the year ended 31 December 2011167
Grou
p ov
ervi
ewPe
rform
ance
revi
ewOp
erat
iona
l and
fin
ancia
l rev
iew
Sust
aina
bilit
yFi
nanc
ial s
tate
men
tsSh
areh
olde
r inf
orm
atio
n
43. RELATED PARTIES
Related party transactions constitute the transfer of resources, services or obligations between the Group and a party related to the Group, regardless of whether a price is charged. For the purposes of defining related party transactions with key management, key management has been defined as directors and the Group’s executive committee and includes close members of their family and entities controlled or jointly controlled by these individuals.
Various transactions were entered into by the Company and its subsidiaries during the year with related parties. The terms of these transactions are at arm’s length.
Key management compensation*
2011 Rm
2010Rm
Salaries and other short-term employee benefits 58 17Post-employment benefits 6 2Other benefits 53 2Bonuses 70 25Termination benefits 33 —
Total 220 46
Gains on share options exercised 39 —
* Refer to the remuneration report on page 64 for detailed breakdown of compensation.
Loan to shareholdersPreviously, certain legal claims were made against MTN (Dubai) Limited and Scancom Limited (Ghana) by two previous Ghana shareholders; claiming beneficial title to a portion of the shares in Ghana. As a result of this, an agreement was reached between M1 Limited (M1) and MTN (Dubai) Limited that they will share the cost of settlement of these claims. During 2009, a loan was granted to M1 in respect of their share of these costs which was paid by the Group on their behalf.
This loan has fixed repayments and is interest free. The balance of this loan as at year end was as follows:
2011 Rm
2010Rm
Balance at beginning of year 89 150Payments made for the year (46) (52)Effect of movement in exchange rates 10 (9)
Balance at end of year 53 89
MTN (Dubai) Limited also granted a loan to CCM Telecoms Limited on 16 April 2011 in order to enable it to buy 4% of the shares in MTN Zambia. The loan bears interest half-yearly at LIBOR +6% (effective rate of 4,8%). No repayments have been made on the loan at 31 December 2011. Refer to note 44.3.
2011 Rm
2010Rm
Balance at end of year 45 —
2011 Rm
2010Rm
2011 Rm
2010Rm
2011 Rm
2010Rm

MTN Group Limited Integrated Business Report for the year ended 31 December 2011168
Notes to the Group financial statements continuedfor the year ended 31 December 2011
43. RELATED PARTIES (continued)Sale of shares to non-controlling interestDuring the year 0,25% of the shareholding in MTN Nigeria Communication Limited was sold to a non-controlling shareholder for an amount of R228 million (note 44.1).
Subsidiaries and joint venturesDetails of investments in subsidiaries and joint ventures are disclosed in Annexure 1 of the financial statements.
For details on the put option refer to note 24.
Outstanding loans with Irancell Telecommunication Services Company are disclosed in note 14.
Details of transactions and balances for joint ventures:
Transactionvalue for the year
2011Rm
Transactionvalue for the year
2010Rm
Balanceoutstanding
2011Rm
Balanceoutstanding
2010Rm
Swazi MTN Limited 61 12 34 1Mascom Wireless Botswana Proprietary Limited 235 (50) 5 —Irancell Telecommunications Services Company Proprietary Limited 31 244 95 837Satellite Data Networks Mauritius Proprietary Limited 1 1 1 (8)
Included in the transaction value is the following amount relating to finance income 32 244
AssociatesDetails of investments in associates are disclosed in note 13.
Details of transactions and balances for associates:
Transactionvalue for the year
2011Rm
Transactionvalue for the year
2010Rm
Balanceoutstanding
2011Rm
Balanceoutstanding
2010Rm
Belgacom International Carrier Services SA 145 25 26 (7)
Scancom Limited (Ghana) entered into an operating lease agreement with Ghana Tower InterCo BV. The operating lease commitment amounts to R7 906 million at 31 December 2011. The rental amount escalates every year by inflation and the initial term is 10 years, followed by four times five year automatic renewal.
DirectorsDetails of directors’ remuneration are disclosed in note 6, as well as in the remuneration report on page 64 of the integrated business report.
ShareholdersThe principal shareholders of the Company are disclosed on page 207 of the integrated business report.
Transactionvalue for the year
2011Rm
Transactionvalue forthe year
2010Rm
Balanceoutstanding
2011Rm
Balanceoutstanding
2010Rm
Transactionvalue for the year
2011Rm
Transactionvalue forthe year
2010Rm
Balanceoutstanding
2011Rm
Balanceoutstanding
2010Rm

MTN Group Limited Integrated Business Report for the year ended 31 December 2011169
Grou
p ov
ervi
ewPe
rform
ance
revi
ewOp
erat
iona
l and
fin
ancia
l rev
iew
Sust
aina
bilit
yFi
nanc
ial s
tate
men
tsSh
areh
olde
r inf
orm
atio
n
44. CHANGES IN SHAREHOLDING
Change in shareholding of subsidiaries are transactions that result in increases or reductions in the interest held in a subsidiary of the Group and are accounted for as transactions with non-controlling shareholders as disclosed in note 1.3.
None of the transactions outlined below resulted in a change of control.
44.1 MTN Nigeria Communications LimitedDuring the year, the Group sold 0,25% of the shareholding in MTN Nigeria Communications Limited to a non-controlling shareholder of the company for an amount of R228 million.
The assets and liabilities disposed of are as follows:
Carrying amount on disposal
dateRm
Consideration received 228 Net assets disposed of ( 30)
Difference included in equity on consolidation 198
44.2 MTN Rwandacell S.A.R.L.During 2011, the Group increased its shareholding in MTN Rwanda from 55% to 80% for R487 million.
The assets and liabilities arising from the acquisition are as follows:
Carrying amounton acquisition
dateRm
Purchase consideration (487)Net assets value acquired 254
Difference included in equity on consolidation (233)
Carrying amount on disposal
dateRm
Carrying amounton acquisition
dateRm

MTN Group Limited Integrated Business Report for the year ended 31 December 2011170
Notes to the Group financial statements continuedfor the year ended 31 December 2011
44. CHANGES IN SHAREHOLDING (continued)44.3 MTN Zambia Limited
During the year, the Group sold 4% of its shareholding in MTN Zambia for an amount of R50 million. The sale was partly funded through a loan provided by MTN (Dubai) Limited to the value of R45 million to the acquirer and partly from the acquirer’s own financial resources (R5 million).
Due to risks and rewards not being transferred at a Group level, the percentage consolidated (97,8%) remains unchanged.
The assets and liabilities disposed of are as follows:
Carrying amount on disposal
dateRm
Consideration received 5 Net assets disposed of —
Difference included in equity on consolidation 5
44.4 Prior year changes in shareholding44.4.1 The disposal of 1% of MTN Cyprus
In November 2010, the shareholding in MTN Cyprus, a telecommunications company incorporated in Cyprus, was reduced from 51% to 50% for R5,4 million. The transaction did not result in a loss of control.
The assets and liabilities disposed of are as follows:
Carrying amounton disposal
dateRm
Consideration received 5Net liabilities disposed of (1)
Difference included in equity on consolidation 6
44.4.2 MTN Zambia LimitedIn 2010, MTN Zambia issued a further 7,8% of its shares to an SPV resulting in a dilution of the Group’s investment from 97,8% to 90,0%.
44.4.3 MTN Afghanistan LimitedIn 2010, the shareholding in MTN Afghanistan was reduced from 100% to 90,9% however, due to the put option (note 24), 100% is consolidated.
Carrying amounton disposal
dateRm
Carrying amounton disposal
dateRm

MTN Group Limited Integrated Business Report for the year ended 31 December 2011171
Grou
p ov
ervi
ewPe
rform
ance
revi
ewOp
erat
iona
l and
fin
ancia
l rev
iew
Sust
aina
bilit
yFi
nanc
ial s
tate
men
tsSh
areh
olde
r inf
orm
atio
n
2011 Rm
2010Rm
45. CASH FLOWS RELATING TO BUSINESS COMBINATIONS AND CHANGES IN SHAREHOLDINGS45.1 Cash flows relating to changes in shareholding
Disposal of 1% of MTN Cyprus Limited — 5Proceeds from the issue of shares to non-controlling interests– MTN Cyprus Limited — 21– MTN Afghanistan Limited — 98– MTN Nigeria Communications Limited 228 —– MTN Zambia Limited 5 —Consideration for acquisition from non-controlling interests– MTN Rwandacell S.A.R.L (487) —
(254) 124
46. FINANCIAL RISK MANAGEMENT AND FINANCIAL INSTRUMENTS
Accounting for financial instrumentsFinancial assets and financial liabilities are recognised on the Group’s statement of financial position when the Group becomes a party to the contractual provisions of the instrument.
Offsetting financial instrumentsOffsetting of financial assets and liabilities arises when there is a legally enforceable right to offset the recognised amounts and there is an intention to settle on a net basis, or realise the asset and settle the liability simultaneously. The net amount is reported in the statement of financial position.
Financial instrument classificationThe Group classifies its financial instruments into the following categories: financial assets at fair value through profit or loss, loans and receivables, held-to-maturity investments and financial liabilities. The classification is dependent on the purpose for which the financial assets were acquired. Management determines the classification of its financial assets at initial recognition.
Financial instruments comprise investments in equity and debt securities, loans, trade and other receivables, cash and cash equivalents, borrowings, derivatives and trade and other payables.
2011 Rm
2010Rm

MTN Group Limited Integrated Business Report for the year ended 31 December 2011172
Notes to the Group financial statements continuedfor the year ended 31 December 2011
46. FINANCIAL RISK MANAGEMENT AND FINANCIAL INSTRUMENTS (continued)
Financial instruments classification (continued)Financial instruments are recognised initially at fair value plus, for instruments not at fair value through profit or loss, any directly attributable transaction costs. Subsequent to initial recognition, financial instruments are measured as described below.
Financial assets at fair value through profit or lossAn instrument is classified at fair value through profit or loss if it is held for trading, ie acquired principally for the purpose of selling the item in the short term. Upon initial recognition, attributable transaction costs are recognised in profit or loss when incurred. Financial instruments at fair value through profit or loss are measured at fair value and changes therein are recognised in profit or loss. Derivatives are also categorised as held for trading unless they are designated as hedges. Assets in this category are classified as current assets if expected to be settled within 12 months; if not, they are classified as non-current.
Loans and receivables Loans and other receivables are non-derivative financial assets with fixed or determinable payments that are not quoted in an active market. They are included in current assets, except for maturities greater than 12 months after the end of the reporting period. These are classified as non-current assets. The Group’s loans and receivables comprise loans and other non-current receivables, certain of its investments, trade and other receivables (excluding prepayments), restricted cash, and cash and cash equivalents. Loans and receivables are measured at amortised cost using the effective interest method, less any accumulated impairment losses.
Held-to-maturity investmentsHeld-to-maturity investments are non-derivative financial assets with fixed or determinable payments and fixed maturity that the Group has the positive intention and ability to hold to maturity other than those that the Group upon initial recognition designates as at fair value through profit or loss and those that are loans and receivables.
Held-to-maturity investments are initially recognised at fair value plus transaction costs that are directly attributable to the acquisition or issue of the financial asset. After initial recognition, the Group measures held-to-maturity investments at amortised cost using the effective interest method, less any impairment loss.
Financial liabilitiesFinancial liabilities comprise trade and other payables, borrowings and other non-current liabilities (excluding provisions).
Financial liabilities are recognised initially at fair value and are subsequently measured at amortised cost using the effective interest method.
Borrowings are classified as current liabilities unless the Group has an unconditional right to defer settlement of the liability for at least 12 months after the reporting date.

MTN Group Limited Integrated Business Report for the year ended 31 December 2011173
Grou
p ov
ervi
ewPe
rform
ance
revi
ewOp
erat
iona
l and
fin
ancia
l rev
iew
Sust
aina
bilit
yFi
nanc
ial s
tate
men
tsSh
areh
olde
r inf
orm
atio
n
46. FINANCIAL RISK MANAGEMENT AND FINANCIAL INSTRUMENTS (continued)
DerecognitionFinancial assets are derecognised when the rights to receive cash flows from the investments have expired or have been transferred and the Group has transferred substantially all risks and rewards of ownership.
Financial liabilities are derecognised when the obligation specified in the contract is discharged, cancelled or expires.
ImpairmentThe Group assesses at the end of each reporting date whether there is any objective evidence that a financial asset is impaired. A financial asset or group of financial assets is impaired if objective evidence indicates that one or more events have had a negative effect on the estimated future cash flows of that asset.
An impairment loss in respect of a financial asset measured at amortised cost is calculated as the difference between its carrying amount, and the present value of the estimated future cash flows discounted at the original effective interest rate.
When a loan or receivable is impaired, the Group reduces the carrying amount to its recoverable amount, being the estimated future cash flows discounted at the original effective interest rate of the instrument, and continues unwinding the discount as interest income. Interest income on impaired loans and receivables are recognised using the effective interest rate.
Individually significant financial assets are tested for impairment on an individual basis. The remaining financial assets are assessed collectively in groups that share similar credit risk characteristics.
All impairment losses are recognised in profit or loss.
An impairment loss is reversed if the reversal can be related objectively to an event occurring after the impairment loss was recognised.

MTN Group Limited Integrated Business Report for the year ended 31 December 2011174
Notes to the Group financial statements continuedfor the year ended 31 December 2011
46. FINANCIAL RISK MANAGEMENT AND FINANCIAL INSTRUMENTS (continued)
Impairment of trade and other receivablesAn impairment of trade receivables is established when there is objective evidence that the Group will not be able to collect all amounts due according to the original terms of the receivables. Significant financial difficulties of the debtor, probability that the debtor will enter bankruptcy or financial reorganisation and default or delinquency in payments are considered indicators that the trade receivable is impaired.
The carrying amount of the trade receivable is reduced through the use of an allowance account and the amount of the loss is recognised in profit or loss. When a trade receivable is uncollectible, it is written off against the allowance account for trade receivables. Subsequent recoveries of amounts previously written off are credited to profit or loss.
Hedge accountingThe Group designated certain foreign exchange contracts as cash flow hedges to hedge its exposure to variability in cash flows that is attributable to foreign currency fluctuations.
The effective portion of changes in the fair value of the designated foreign exchange contracts is recognised in other comprehensive income. The gain or loss relating to the ineffective portion is recognised immediately in profit or loss.
Amounts previously recognised in other comprehensive income are reclassified to profit or loss in the periods when the hedged item is recognised in profit or loss.
Hedge accounting is discontinued when the Group revokes the hedging relationship, when the hedging instrument expires or is sold, terminated, or exercised, or when it no longer qualifies for hedge accounting.
Risk managementIntroductionThe Group has exposure to the following risks from its use of financial instruments: credit risk, liquidity risk and market risk (foreign exchange and interest rate risk). This note presents information about the Group’s exposure to each of the above risks, the Group’s objectives, policies and processes for measuring and managing risk, and the Group’s management of capital. Further quantitative disclosures are included throughout these consolidated financial statements.
Risk profileThe Group’s overall risk management programme focuses on the unpredictability of financial markets and seeks to minimise potential adverse effects on the financial performance of the Group. The Group occasionally uses derivative financial instruments, such as forward exchange contracts, to hedge certain exposures, but as a matter of principle, the Group does not enter into derivative contracts for speculative purposes.
Risk management is carried out under policies approved by the board of directors of the Group and of relevant subsidiaries. The Group executive committee identifies, evaluates and hedges financial risks in co-operation with the Group’s operating units. The board provides written principles for overall risk management, as well as for specific areas such as foreign exchange risk, interest rate risk, credit risk, use of derivative financial instruments and investing excess liquidity.

MTN Group Limited Integrated Business Report for the year ended 31 December 2011175
Grou
p ov
ervi
ewPe
rform
ance
revi
ewOp
erat
iona
l and
fin
ancia
l rev
iew
Sust
aina
bilit
yFi
nanc
ial s
tate
men
tsSh
areh
olde
r inf
orm
atio
n
46. FINANCIAL RISK MANAGEMENT AND FINANCIAL INSTRUMENTS (continued)46.1 Categories and fair values of financial instruments
Assets Liabilities
Loansand
receivables
Fair value through
profit or loss
Rm
Held-to-maturity
Rm
Amortised costRm
Fair value through
profitor loss
Rm
Total carrying amount
Rm
Fair value
Rm
2011Non-current financial assetsLoans and other non-current receivables 1 596 — — — — 1 596 1 596
Current financial assetsTrade and other receivables 15 321 — — — — 15 321 15 321 Current investments 1 677 — 7 803 — — 9 480 9 480 Derivative assets — 9 — — — 9 9 Restricted cash 546 — — — — 546 546 Cash and cash equivalents 35 806 — — — — 35 806 35 806
54 946 9 7 803 — — 62 758 62 758
Non-current financial liabilitiesBorrowings — — — 23 554 — 23 554 23 775 Other non-current liabilities — — — 439 — 439 439
Current financial liabilitiesTrade and other payables — — — 24 755 — 24 755 24 755 Borrowings — — — 9 869 — 9 869 9 869Put option liability — — — 178 — 178 178 Derivative liabilities — — — — 4 4 4 Bank overdrafts — — — 593 — 593 593
— — — 59 388 4 59 392 59 613
Assets Liabilities
Loansand
receivables
Fair value through
profitor loss
Rm
Held-to-maturity
Rm
Amortised costRm
Fair valuethrough
profitor loss
Rm
Total TTcarrying amount
Rm
Fairvalue
Rm
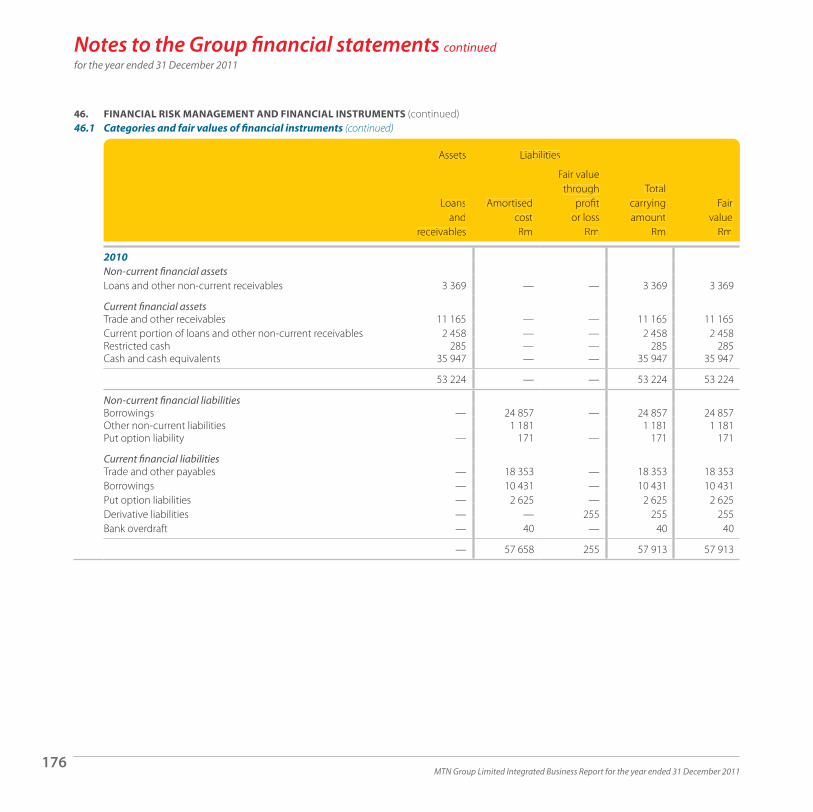
MTN Group Limited Integrated Business Report for the year ended 31 December 2011176
Notes to the Group financial statements continuedfor the year ended 31 December 2011
46. FINANCIAL RISK MANAGEMENT AND FINANCIAL INSTRUMENTS (continued)46.1 Categories and fair values of financial instruments (continued)
Assets Liabilities
Loansand
receivables
Amortised costRm
Fair value through
profit or loss
Rm
Total carrying amount
Rm
Fair value
Rm
2010Non-current financial assetsLoans and other non-current receivables 3 369 — — 3 369 3 369
Current financial assetsTrade and other receivables 11 165 — — 11 165 11 165 Current portion of loans and other non-current receivables 2 458 — — 2 458 2 458 Restricted cash 285 — — 285 285 Cash and cash equivalents 35 947 — — 35 947 35 947
53 224 — — 53 224 53 224
Non-current financial liabilitiesBorrowings — 24 857 — 24 857 24 857 Other non-current liabilities 1 181 1 181 1 181 Put option liability — 171 — 171 171
Current financial liabilitiesTrade and other payables — 18 353 — 18 353 18 353 Borrowings — 10 431 — 10 431 10 431 Put option liabilities — 2 625 — 2 625 2 625 Derivative liabilities — — 255 255 255 Bank overdraft — 40 — 40 40
— 57 658 255 57 913 57 913
Assets Liabilities
Loansand
receivables
Amortised costRm
Fair value through
profitor loss
Rm
Total carrying amount
Rm
Fairvalue
Rm

MTN Group Limited Integrated Business Report for the year ended 31 December 2011177
Grou
p ov
ervi
ewPe
rform
ance
revi
ewOp
erat
iona
l and
fin
ancia
l rev
iew
Sust
aina
bilit
yFi
nanc
ial s
tate
men
tsSh
areh
olde
r inf
orm
atio
n
46. FINANCIAL RISK MANAGEMENT AND FINANCIAL INSTRUMENTS (continued)46.2 Fair value estimation
Fair value measurement hierarchy:level 1: fair value based on quoted prices (unadjusted) in active markets for identical assets or liabilities; level 2: fair value based on inputs other than quoted prices included within level 1 that are observable for the asset or liability, either directly (that is, as prices) or indirectly (that is, derived from prices); orlevel 3: fair value based on inputs for the asset or liability that are not based on observable market data (that is, unobservable inputs).
The following tables present the Group’s assets and liabilities that are measured at fair value:
Level 1 Rm
Level 2 Rm
Level 3Rm
Totalbalance
Rm
2011AssetsDerivative assets — 9 — 9
LiabilitiesDerivative liabilities — 4 — 4
2010LiabilitiesDerivative liabilities — 255 — 255
The fair value of financial instruments traded in active markets is based on quoted market prices at the reporting date. A market is regarded as active if quoted prices are readily and regularly available from an exchange, dealer, broker, industry group, pricing service, or regulatory agency, and those prices represent actual and regularly occurring market transactions on an arms length basis. The quoted market price used for financial assets held by the Group is the current bid price. These instruments are included in level 1.
The fair value of financial instruments that are not traded in an active markets is determined by using valuation techniques. These valuation techniques maximise the use of observable market data where it is available and rely as little as possible on entity specific estimates. If all significant inputs required to fair value an instrument are observable, the instrument is included in level 2.
If one or more of the significant inputs is not based on observable market data, the instrument is included in level 3.
Specific valuation techniques used to value financial instruments include:quoted market prices or dealer quotes for similar instruments;the fair value of interest rate swaps is calculated as the present value of estimated future cash flows based on observable yield curves;the fair value of forward foreign exchange contracts is determined using forward exchange rates at the end of the reporting period, with the resulting value discounted back to present value; andother techniques, such as discounted cash flow analysis, are used to determine fair value for the remaining financial instruments.
Level 1Rm
Level 2 Rm
Level 3Rm
TotalTTbalance
Rm

MTN Group Limited Integrated Business Report for the year ended 31 December 2011178
Notes to the Group financial statements continuedfor the year ended 31 December 2011
46. FINANCIAL RISK MANAGEMENT AND FINANCIAL INSTRUMENTS (continued)46.3 Credit risk
Credit risk, or the risk of financial loss to the Group due to customers or counterparties not meeting their contractual obligations, is managed through the application of credit approvals, limits and monitoring procedures.
The Group’s maximum exposure to credit risk is represented by the carrying amount of the financial assets that are exposed to credit risk, with the exception of financial guarantees granted by the Group for which the maximum exposure to credit risk is the maximum amount the Group would have to pay if the guarantees are called on.
The Group considers its maximum exposure per class, without taking into account any collateral and financial guarantees, to be as follows:
2011 Rm
2010Rm
Loan receivables 1 596 — Trade and other receivables 15 321 11 165 Current investments 9 480 — Derivative assets 9 —Restricted cash 546 285 Cash and cash equivalents 35 806 35 907
62 758 47 357
Cash and cash equivalents and current investmentsThe Group’s exposure and the credit ratings of its counterparties are continuously monitored and the aggregate values of transactions concluded is spread amongst approved financial institutions. The Group actively seeks to limit the amount of credit exposure to any one financial institution and credit exposure is controlled by counterparty limits that are reviewed and approved by the credit risk department.
The Nigerian and South African operations (including head office entities) hold their cash balances in financial institutions with a rating range from BBB- to AA+.
Given these credit ratings, management does not expect any counterparty to fail to meet its obligations.
2011 Rm
2010Rm

MTN Group Limited Integrated Business Report for the year ended 31 December 2011179
Grou
p ov
ervi
ewPe
rform
ance
revi
ewOp
erat
iona
l and
fin
ancia
l rev
iew
Sust
aina
bilit
yFi
nanc
ial s
tate
men
tsSh
areh
olde
r inf
orm
atio
n
46. FINANCIAL RISK MANAGEMENT AND FINANCIAL INSTRUMENTS (continued)46.3 Credit risk (continued)
Trade and other receivablesThe Group has no significant concentrations of credit risk, due to its wide spread of customers across various operations and dispersion across geographical locations. The Group has policies in place to ensure that retail sales of products and services are made to customers with an appropriate credit history. In certain countries, a security will be obtained from new postpaid customers.
The recoverability of interconnect debtors in certain international operations is uncertain; however, this is actively managed within acceptable limits and has been incorporated in the assessment of an appropriate revenue recognition policy and the impairment of trade receivables where applicable. In addition, in certain countries there exists a right of set-off with interconnect parties to assist in settling outstanding amounts.
Ageing and impairment analysis
2011Gross
Rm
2011Impaired
Rm
2011NetRm
2010Gross
Rm
2010Impaired
Rm
2010NetRm
Fully performing trade receivables 8 892 — 8 892 5 588 — 5 588
Interconnect receivables 2 499 — 2 499 1 686 — 1 686 Contract receivables 5 273 — 5 273 3 411 — 3 411 Other receivables 1 120 — 1 120 491 — 491
Past due trade receivables 5 267 (1 900) 3 367 4 776 (1 571) 3 205 Interconnect receivables 2 811 (788) 2 023 2 248 (622) 1 626
0 to 3 months 756 (65) 691 499 (32) 467 3 to 6 months 447 (60) 387 718 (133) 585 6 to 9 months 365 (74) 291 462 (35) 427 9 to 12 months 1 243 (589) 654 569 (422) 147
Contract receivables 1 982 (1 084) 898 2 317 (774) 1 543
0 to 3 months 488 (111) 377 681 (27) 654 3 to 6 months 385 (151) 234 232 (101) 131 6 to 9 months 416 (203) 213 961 (408) 553 9 to 12 months 693 (619) 74 443 (238) 205
Other receivables 474 (28) 446 211 (175) 36
0 to 3 months 302 (28) 274 38 (38) — 3 to 6 months 75 — 75 112 (96) 16 6 to 9 months 20 — 20 16 — 16 9 to 12 months 77 — 77 45 (41) 4
Total 14 159 (1 900) 12 259 10 364 (1 571) 8 793
2011Gross
Rm
2011Impaired
Rm
2011NetRm
2010Gross
Rm
2010Impaired
Rm
2010NetRm

MTN Group Limited Integrated Business Report for the year ended 31 December 2011180
Notes to the Group financial statements continuedfor the year ended 31 December 2011
46. FINANCIAL RISK MANAGEMENT AND FINANCIAL INSTRUMENTS (continued)46.3 Credit risk (continued)
Total past due per significant operation
Interconnectreceivables
Rm
Contractreceivables
Rm
Otherreceivables
RmTotal
Rm
2011MTN RSA 147 733 — 880MTN Nigeria Communications Limited 376 21 51 448 Irancell Telecommunication Services Company Proprietary Limited 1 207 51 45 1 303 Rest of Africa and Middle East 1 081 1 177 378 2 636
2 811 1 982 474 5 267
2010MTN RSA 42 1 342 — 1 384 MTN Nigeria Communications Limited 319 71 81 471 Irancell Telecommunication Services Company Proprietary Limited 1 065 45 4 1 114 Rest of Africa and Middle East 822 859 126 1 807
2 248 2 317 211 4 776
At beginning of year
RmAdditions
RmUnused
RmUtilised
Rm
Exchangedifferences
Rm
At end of year
Rm
2011Movement in provision for impairment of trade receivables (1 571) (500) 45 316 (190) (1 900)
2010Movement in provision for impairment of trade receivables (1 549) (427) 196 7 202 (1 571)
Interconnectreceivables
Rm
Contractreceivables
Rm
Otherreceivables
RmTotalTT
Rm
At beginningof year
RmAdditions
RmUnused
RmUtilised
Rm
Exchangedifferences
Rm
At endof year
Rm

MTN Group Limited Integrated Business Report for the year ended 31 December 2011181
Grou
p ov
ervi
ewPe
rform
ance
revi
ewOp
erat
iona
l and
fin
ancia
l rev
iew
Sust
aina
bilit
yFi
nanc
ial s
tate
men
tsSh
areh
olde
r inf
orm
atio
n
46. FINANCIAL RISK MANAGEMENT AND FINANCIAL INSTRUMENTS (continued)46.4 Liquidity risk
Liquidity risk is the risk that an entity in the Group will be unable to meets its obligations as they become due.
The Group’s approach to managing liquidity risk is to ensure that sufficient liquidity is available to meet its liabilities when due under both normal and stressed conditions, without incurring unacceptable losses or risking damage to the Group’s reputation.
The Group ensures it has sufficient cash on demand (currently the Group is maintaining a positive cash position) or access to facilities to meet expected operational expenses, including the servicing of financial obligations; this excludes the potential impact of extreme circumstances that cannot reasonably be predicted, such as natural disasters.
The following liquid resources are available:
2011Rm
2010Rm
Trade and other receivables 15 321 11 165 Current investments 1 677 —Cash at bank and on hand; net of overdrafts 35 213 35 907
52 211 47 072
The following are the contractual cash flows of financial liabilities:
Carryingamount
RmTotal
Rm
More thanone year but
not exceedingtwo years
Rm
More thantwo years but
not exceedingfive years
Rm
More thanfive years
Rm
Non-current liabilities2011Borrowings 23 554 28 319 8 492 17 249 2 578Other non-current liabilities 439 461 213 248 —
23 993 28 780 8 705 17 497 2 578
2010Borrowings 24 857 24 857 4 019 19 178 1 660Other non-current liabilities 1 352 1 352 1 323 29 —
26 209 26 209 5 342 19 207 1 660
2011Rm
2010Rm
Carryingamount
RmTotalTT
Rm
More thanone year but
not exceedingtwo years
Rm
More thantwo years but
not exceedingfive years
Rm
More thanfive years
Rm

MTN Group Limited Integrated Business Report for the year ended 31 December 2011182
Notes to the Group financial statements continuedfor the year ended 31 December 2011
46. FINANCIAL RISK MANAGEMENT AND FINANCIAL INSTRUMENTS (continued)46.4 Liquidity risk (continued)
Carryingamount
Rm Total
Rm
Payablewithin one
month oron demand
Rm
More than one month but not exceedingthree months
Rm
More than three months
but notexceeding
one yearRm
Current liabilities2011Trade and other payables 24 755 24 823 9 090 9 608 6 125Borrowings 9 869 11 782 3 829 2 972 4 981 Put option liability 178 178 178 — — Bank overdraft 593 593 593 — —
35 395 37 376 13 690 12 580 11 106
2010Trade and other payables 18 353 18 353 9 413 3 461 5 479Borrowings 10 431 10 431 4 694 2 816 2 921Put option liabilities 2 625 2 625 2 625 — — Bank overdraft 40 40 9 — 31Derivative liabilities 255 255 255 — —
31 704 31 704 16 996 6 277 8 431
Carryingamount
RmTotalTT
Rm
Payablewithin one
month oron demand
Rm
More than one month but not exceedingthree months
Rm
More than three months
but notexceeding
one yearRm

MTN Group Limited Integrated Business Report for the year ended 31 December 2011183
Grou
p ov
ervi
ewPe
rform
ance
revi
ewOp
erat
iona
l and
fin
ancia
l rev
iew
Sust
aina
bilit
yFi
nanc
ial s
tate
men
tsSh
areh
olde
r inf
orm
atio
n
46. FINANCIAL RISK MANAGEMENT AND FINANCIAL INSTRUMENTS (continued)46.5 Market risk
Market risk is the risk that changes in market prices (interest rate and currency risk) will affect the Group’s income or the value of its holding of financial instruments. The objective of market risk management is to manage and control market risk exposures within acceptable parameters, while optimising the return.
46.5.1 Interest rate riskInterest rate risk is the risk borne by an interest-bearing asset or liability, due to variability of interest rates.
Financial assets and liabilities that are sensitive to interest rate risk are cash and cash equivalents, bank overdrafts and loans receivable/payable. The interest rates applicable to these financial instruments are on a combination of floating and fixed basis in line with those currently available in the market.
The Group’s interest rate risk arises from the repricing of the Group’s forward cover and floating rate debt, incremental funding or new borrowings, the refinancing of existing borrowings and the magnitude of the significant cash balances which exist.
Debt in the South African entities and all holding companies (including MTN (Dubai) Limited and MTN International (Mauritius) Limited) is managed on an optimal fixed versus floating interest rate basis, in line with the approved Group Treasury Policy. Significant cash balances are also considered in the fixed versus floating interest rate exposure mix.
Debt in the majority of the Group’s non-South African operations is at floating interest rates. This is due to the underdeveloped and expensive nature of derivative products in these financial markets. The Group continues to monitor developments which may create opportunities as these markets evolve in order that each underlying operation can be aligned with the Group Treasury Policy.
The Group makes use of various products including interest rate derivatives and other appropriate hedging tools as a way to manage these risks; however, derivative instruments may only be used to hedge existing exposures.

MTN Group Limited Integrated Business Report for the year ended 31 December 2011184
Notes to the Group financial statements continuedfor the year ended 31 December 2011
46. FINANCIAL RISK MANAGEMENT AND FINANCIAL INSTRUMENTS (continued)46.5 Market risk (continued)46.5.1 Interest rate risk (continued)
ProfileAt the reporting date, the interest rate profile of the Group’s interest-bearing financial instruments was:
2011 2010
Fixed rateinstruments
Rm
Variable rateinstruments
Rm
Fixed rateinstruments
Rm
Variable rateinstruments
Rm
Financial assetsLoans and non-current receivables — 1 596 — 1 280 Cash and cash equivalents 6 295 26 570 10 976 22 727 Restricted cash 114 330 — 285 Trade and other receivables 261 15 171 884 Current Investments 9 480 — — —
16 150 28 511 11 147 25 176
Financial liabilitiesBorrowings 8 545 23 097 9 006 24 383 Bank overdraft — 593 — 40 Trade and other payables 52 155 501 — Other 54 610 628 —
8 651 24 455 10 135 24 423
Sensitivity analysisThe Group has used a sensitivity analysis technique that measures the estimated change to profit or loss of an instantaneous increase or decrease of 1% (100 basis points) in market interest rates, from the rate applicable at 31 December, for each class of financial instrument with all other variables remaining constant. This analysis is for illustrative purposes only, as in practice market rates rarely change in isolation.
The Group is mainly exposed to fluctuations in the following market interest rates: JIBAR, LIBOR, NIBOR and EURIBOR. Changes in market interest rates affect the interest income or expense of floating rate financial instruments. Changes in market interest rates only affect profit or loss in relation to financial instruments with fixed interest rates if these financial instruments are recognised at their fair value.
A change in the above market interest rates at the reporting date would have increased/(decreased) profit before tax by the amounts shown on the next page.
The analysis has been performed on the basis of the change occurring at the start of the reporting period and assumes that all other variables, in particular foreign currency rates, remain constant. The analysis is performed on the same basis as was used for 2010.
2011 2010
Fixed rateinstruments
Rm
Variable rateVVinstruments
Rm
Fixed rateinstruments
Rm
Variable rateinstruments
Rm

MTN Group Limited Integrated Business Report for the year ended 31 December 2011185
Grou
p ov
ervi
ewPe
rform
ance
revi
ewOp
erat
iona
l and
fin
ancia
l rev
iew
Sust
aina
bilit
yFi
nanc
ial s
tate
men
tsSh
areh
olde
r inf
orm
atio
n
46. FINANCIAL RISK MANAGEMENT AND FINANCIAL INSTRUMENTS (continued)46.5 Market risk (continued)46.5.1 Interest rate risk (continued)
Sensitivity analysis
2011 2010
Increase/(decrease) in profit before tax Increase/(decrease) in profit before tax
Change ininterest rate
%
Upward change in
interest rateRm
Downwardchange in
interest rateRm
Change ininterest rate
%
Upward change in
interest rateRm
Downwardchange in
interest rateRm
JIBAR 1 (65,5) 65,5 1 (50,4) 50,4 LIBOR 1 (15,0) 15,0 1 (23,9) 23,9 3 month LIBOR 1 (4,7) 4,7 1 — — NIBOR 1 (44,7) 44,7 1 (89,4) 89,4 EURIBOR 1 (3,3) 3,3 1 (22,7) 22,7 Money market 1 90,2 (90,2) 1 85,9 (85,9)Prime 1 16,9 (16,9) 1 101,7 (101,7)Other 1 66,7 (66,7) 1 (68,3) 68,3
46.5.2 Currency riskCurrency risk is the exposure to exchange rate fluctuations that have an impact on cash flows and financing activities.
The Group operates internationally and is exposed to currency risk arising from various currency exposures. Currency risk arises when future commercial transactions or recognised assets and liabilities are denominated in a currency that is not the entity’s functional currency. The Group is also exposed to translation risk as holding companies do not report in the same currencies as operating entities.
Where possible, entities in the Group use forward contracts to hedge their actual exposure to foreign currency. The Group’s Nigerian subsidiary manages foreign currency risk on major foreign purchases by placing foreign currency on deposit as security against letters of credit when each order is placed.
The Group has foreign subsidiaries whose assets are exposed to foreign currency translation risk, which is managed primarily through borrowings denominated in the relevant foreign currencies to the extent that such funding is available on reasonable terms in the local capital markets.
2011 2010
Increase/(decrease) in profit before tax Increase/(decrease) in profit before tax
Change ininterest rate
%
Upward change in
interest rateRm
Downwardchange in
interest rateRm
Change ininterest rate
%
Upwardchange in
interest rateRm
Downwardchange in
interest rateRm

MTN Group Limited Integrated Business Report for the year ended 31 December 2011186
Notes to the Group financial statements continuedfor the year ended 31 December 2011
46. FINANCIAL RISK MANAGEMENT AND FINANCIAL INSTRUMENTS (continued)46.5 Market risk (continued)46.5.2 Currency risk (continued)
Sensitivity analysisThe Group has used a sensitivity analysis technique that measures the estimated change to profit or loss and equity of an instantaneous 10% strengthening or weakening in the rand against all other currencies, from the rate applicable at 31 December, for each class of financial instrument with all other variables remaining constant. This analysis is for illustrative purposes only, as in practice, market rates rarely change in isolation.
The Group is mainly exposed to fluctuations in foreign exchange rates in respect of South African rand, US dollar, Nigerian naira, Euro, Syrian pound, Iranian rials and Sudanese pound. This analysis considers the impact of changes in foreign exchange rates on profit, excluding foreign exchange translation differences resulting from the translation of Group entities that have functional currencies different from the presentation currency, into the Group’s presentation currency (and recognised in the foreign currency translation reserve).
A change in the foreign exchange rates to which the Group is exposed at the reporting date would have increased/(decreased) profit before tax by the amounts shown below.
The analysis has been performed on the basis of the change occurring at the start of the reporting period and assumes that all other variables, in particular interest rates, remain constant. The analysis is performed on the same basis as applied in 2010.
Increase/(decrease) in profit before tax
Denominated: functional currency
Change inexchange rate
%
Weakening infunctional
currencyRm
Strengthening in functional
currencyRm
December 2011USD:ZAR 10 247,6 (247,6)USD:IRR 10 (163,7) 163,7 USD:SDG 10 (230,0) 230,0 USD:NGN 10 (326,3) 326,3 EUR:SDG 10 (239,1) 239,1 EUR:USD 10 268,8 (268,8)USD:GNF 10 (93,0) 93,0SYP:USD 10 325,1 (325,1)
Increase/(decrease) in profit before tax
Denominated: functional currency
Change inexchange rate
%
Weakening infunctional
currencyRm
Strengtheningin functional
currencyRm

MTN Group Limited Integrated Business Report for the year ended 31 December 2011187
Grou
p ov
ervi
ewPe
rform
ance
revi
ewOp
erat
iona
l and
fin
ancia
l rev
iew
Sust
aina
bilit
yFi
nanc
ial s
tate
men
tsSh
areh
olde
r inf
orm
atio
n
46. FINANCIAL RISK MANAGEMENT AND FINANCIAL INSTRUMENTS (continued)46.5 Market risk (continued)46.5.2 Currency risk (continued)
Sensitivity analysis (continued)
Increase/(decrease) in profit before tax
Denominated: functional currency
Change inexchange rate
%
Weakening infunctional
currencyRm
Strengthening in functional
currencyRm
December 2010USD:ZAR 10 577,1 (577,1)USD:SYP 10 (9,3) 9,3 USD:IRR 10 (179,3) 179,3 USD:SDG 10 (140,4) 140,4 USD:NGN 10 (243,2) 243,2 USD:RWF 10 (23,0) 23,0 EUR:ZAR 10 84,6 (84,6)EUR:SYP 10 4,9 (4,9)EUR:IRR 10 (138,0) 138,0 EUR:SDG 10 (141,5) 141,5
46.6 Price riskThe Group is not exposed to unnecessary commodity price risk or material equity securities price risk.
46.7 Capital risk managementThe Group’s policy is to maximise borrowings at an operating company level, on a non-recourse basis, within an acceptable level of debt for the maturity of the local company.
Equity funding for existing operations or new acquisitions is raised centrally, first from excess cash and then from new borrowings while retaining an acceptable level of debt for the consolidated Group. Where funding is not available to the operation locally or in specific circumstances where it is more efficient to do so, funding is sourced centrally and on-lent. The Group’s policy is to borrow using a mixture of long-term and short-term capital market issues and borrowing facilities from the local and international capital markets as well as multilateral organisations together with cash generated to meet anticipated funding requirements.
The board of directors has approved three key debt protection ratios at a consolidated level being: net debt:ebitda, net debt:equity and net interest to EBITDA. Net debt is defined as cash and cash equivalents less interest-bearing borrowings. Equity approximates share capital and reserves attributable to equity holders of the Company.
These internal ratios establish levels of debt that the Group should not exceed other than for relatively short periods of time and are shared with the Group’s debt rating agencies, being Moody’s Investor Services and Fitch Ratings.
Increase/(decrease) in profit before tax
Denominated: functional currency
Change inexchange rate
%
Weakening infunctional
currencyRm
Strengtheningin functional
currencyRm

MTN Group Limited Integrated Business Report for the year ended 31 December 2011188
Notes to the Group financial statements continuedfor the year ended 31 December 2011
47. SHARE-BASED PAYMENTS
Equity-settled share-based paymentsThe schemes described below are accounted for as equity-settled share-based payments to employees. Equity-settled share-based payments are measured at fair value (excluding the effect of non-market-based vesting conditions) at the grant date. The fair value is measured using a stochastic model. The expected life used in the model has been adjusted, based on management’s best estimate, for the effects of non-transferability, exercise restrictions and behavioural considerations where applicable. Service and non-market performance conditions attached to the transactions are not taken into account in determining fair value. The fair value determined at the grant date of the equity-settled share-based payments is expensed on a straight-line basis over the vesting period, based on the Group’s estimate of the shares that will eventually vest. The expense is adjusted to reflect the actual number of share rights for which the related service and non-market based vesting conditions are met.
Where employees exercise share rights in terms of the rules and regulations of the schemes, treasury shares, if available within the MTN Group Share Trust, are allocated, or alternatively new shares are issued to participants as beneficial owners. The directors procure a listing of these shares on the JSE Limited, the securities exchange on which the Company’s shares are listed. For the share option scheme, in exchange for the share options, the participants entitled to such share options pay a consideration equal to the option price where applicable. The nominal value of shares issued is credited to share capital and the difference between the nominal value and the option price is credited to share premium.
The MTN Group share options, share appreciation rights, share rights schemes and performance share planThe Group operates a number of equity-settled share-based payment schemes for the benefit of eligible employees, including executive directors, in accordance with the schemes’ rules. The schemes are designed to retain and recognise the contributions of executive directors and eligible employees and to provide additional incentives to contribute to the Group’s continued growth.
The share rights scheme and the performance share plan are the two active schemes which superseded the share option scheme and the share appreciation rights scheme. The superseded schemes will be wound up once all unvested and/or unexercised awards previously made have run their remaining courses.
The vesting periods under the share rights scheme, share option scheme and share appreciation rights scheme are as follows: 20%, 20%, 30% and 30% on the anniversary of the second, third, fourth and fifth years respectively, after the grant date. The strike price for these schemes is determined as the closing market price for MTN Group Limited shares on the day prior to the date of allocation. Unexercised options and rights lapse 10 years from the date of grant and are forfeited if the employee leaves the Group before they vest.
The vesting period for the performance share plan is three years and the awards vest in full based on the attainment of set performance targets.
The total number of shares which may be allocated for the purposes of the schemes shall not exceed 5% of the total issued ordinary share capital of the Company, being 92 402 610 shares (excluding Zakhele transaction and treasury shares), as approved by shareholders in 2001.

MTN Group Limited Integrated Business Report for the year ended 31 December 2011189
Grou
p ov
ervi
ewPe
rform
ance
revi
ewOp
erat
iona
l and
fin
ancia
l rev
iew
Sust
aina
bilit
yFi
nanc
ial s
tate
men
tsSh
areh
olde
r inf
orm
atio
n
47. SHARE-BASED PAYMENTS (continued)MTN Group share options Details of the outstanding equity-settled share options are as follows:
Offer date
Strikeprice
R
Number outstanding
at 31 December 2010
Forfeitedduring
2011
Exercisedduring
2011
Number outstanding at
31 December 2011
28 September 2001 13,53 151 114 (43 380) (107 734) —2 September 2002 9,31 255 990 (1 110) (88 330) 166 5501 December 2003 27,00 237 040 (19 100) (12 240) 205 7001 December 2004 40,50 175 448 (1 000) (93 148) 81 300
819 592 (64 590) (301 452) 453 550
The options outstanding at the end of the year under review have a weighted average remaining contractual life of two years (2010: three years). In 2011 and 2010, no options were granted and no expense was recognised as the above options vested in prior periods.
The share option scheme has been superseded by the introduction of the MTN Group share appreciation rights scheme described below.
MTN Group share appreciation rights scheme and share rights scheme (the rights schemes)The share appreciation rights scheme was implemented on 31 May 2006, and superseded the share option scheme.
On 26 August 2008, the board approved the share rights scheme, which superseded the share appreciation rights scheme. Both the rights schemes operate under the same provisions with the exception that the share rights scheme was extended to allow participation by junior managers.
Share rights under the rights schemes are granted to eligible employees by the relevant employer subsidiary company. Exercised rights are equity-settled whereby the relevant subsidiary purchases the required MTN shares on the open market.
Offer date
Strikeprice
R
Numberoutstanding
at 31 December2010
Forfeitedduring
2011
Exercisedduring
2011
Numberoutstanding at
31 December2011

MTN Group Limited Integrated Business Report for the year ended 31 December 2011190
Notes to the Group financial statements continuedfor the year ended 31 December 2011
47. SHARE-BASED PAYMENTS (continued)Details of the outstanding share appreciation rights are as follows:
Offer date
Strikeprice
R
Number outstanding
at 31 December 2010
Forfeitedduring
2011
Exercisedduring
2011
Number outstanding
at 31 December 2011
31 May 2006 56,83 175 790 (12 970) (82 580) 80 24031 May 2006* 56,83 698 561 (42 140) (230 186) 426 23521 November 2006 71,00 1 145 920 (252 420) (498 430) 395 0701 January 2007 85,30 62 760 — (31 380) 31 3802 April 2007 98,50 23 700 — (23 700) —22 June 2007 96,00 364 420 (50 080) (65 920) 248 42019 March 2008 126,99 472 100 (47 540) (15 700) 408 860
Total 2 943 251 (405 150) (947 896) 1 590 205
* The vesting period of a part of the allocation made on 31 May 2006 was accelerated by six months. This was due to the fact that the Company had not issued any share incentive rights to eligible employees in 2005. The remaining contractual life of these rights was reduced by six months.
Details of the outstanding share rights are as follows:
Offer date
Strikeprice
R
Number outstanding
at 31 December 2010
Forfeitedduring
2011
Exercisedduring
2011
Number outstanding
at 31 December 2011
1 September 2008 118,64 1 933 540 (174 180) (211 480) 1 547 88028 June 2010 107,49 3 256 300 (147 260) (192 725) 2 916 315
Total 5 189 840 (321 440) (404 205) 4 464 195
The share rights outstanding at the end of the year under review have a weighted average remaining contractual life of eight years (2010: nine years).
The expense recognised during the year is as follows:
2011Rm
2010Rm
Expense arising from equity-settled share-based payment transactions 74 87
Offer date
Strikeprice
R
Numberoutstanding
at 31 December2010
Forfeitedduring
2011
Exercisedduring
2011
Numberoutstanding
at 31 December 2011
Offer date
Strikeprice
R
Numberoutstanding
at 31 December2010
Forfeitedduring
2011
Exercisedduring
2011
Numberoutstanding
at 31 December 2011
2011Rm
2010Rm

MTN Group Limited Integrated Business Report for the year ended 31 December 2011191
Grou
p ov
ervi
ewPe
rform
ance
revi
ewOp
erat
iona
l and
fin
ancia
l rev
iew
Sust
aina
bilit
yFi
nanc
ial s
tate
men
tsSh
areh
olde
r inf
orm
atio
n
47. SHARE-BASED PAYMENTS (continued)The range of inputs into the stochastic model for the grant during 2010 were as follows:
2011 2010
Share price R143,73 R134,42Expected life 1 – 5 years 1 – 5 years Risk-free rate 5,64% – 7,23% 5,80% – 7,80%Expected volatility 23,28% – 32,77% 25,45% – 34,20%Dividend yield 2,93% 1,80%
The risk-free rate was estimated using the implied yield on SA zero-coupon government bonds. Volatility was estimated using the weekly closing share price and the dividend yield was estimated by using a two-year moving average of the dividend yield at valuation date.
There were no new grants during the 2011 year.
MTN Performance share plan (PSP)During the 2011 financial year, the Group granted eligible employees share options under the PSP, established in 2010. The options were granted to employees on level 3, 4, 5 and 6. The PSP was established in order to attract, retain and reward selected employees who are able to contribute to the business of the employer companies and to stimulate their personal involvement, thereby encouraging their continued service and encouraging them to advance the interests of the relevant employer company and the Group generally.
The share rights vest on 31 December 2013 for employees employed prior to 1 January 2011 and on 29 June 2014 for employees employed on or after 1 January 2011. Defined performance conditions must be fulfilled to qualify for the percentage of the shares granted as stated in the table below.
Proportion of grant
Vesting conditions for shares granted
Employeelevel 3 – 4
%
Employeelevel 5 – 6
%
Total shareholder return 37,5 50,0Adjusted free cash flow 37,5 50,0Individual retention (guaranteed, subject to remaining on the PSP for the duration of the award fulfilment period) 25 —
For the total shareholder return vesting condition, vesting is based on a sliding scale that ranges from 25% vesting at the median to 100% vesting at the 75th percentile of the performance of a comparable group of companies listed on the JSE. For the adjusted free cash flow vesting condition, vesting is based on a sliding scale between 11% – 19% growth in adjusted free cash flow. The individual return vesting condition is guaranteed subject to the employee remaining employed by the Group for the duration of the vesting period.
2011 2010
Proportion of grant
Vesting conditions for shares grantedVV
Employeelevel 3 – 4
%
Employeelevel 5 – 6
%

MTN Group Limited Integrated Business Report for the year ended 31 December 2011192
Notes to the Group financial statements continuedfor the year ended 31 December 2011
47. SHARE-BASED PAYMENTS (continued)MTN Performance share plan (PSP) (continued)
The expense recognised during the year is shown as follows:
2011Rm
2010Rm
Expense arising from equity-settled share-based payment transactions (Level 3 – 4) 14 —Expense arising from equity-settled share-based payment transactions (Level 5 – 6) 22 —
Details of the outstanding equity-settled performance share plan rights are as follows:
Offer date
Offered during
2011
Forfeitedduring
2011
Number outstanding
at 31 December 2011
29 June 2011 1 611 200 (26 400) 1 584 80029 December 2011 1 491 714 — 1 491 714
Total 3 102 914 (26 400) 3 076 514
A valuation has been prepared using a stochastic model to determine the fair value of the performance share plan rights and the expense to be recognised for share rights issued during the year.
The range for the June 2011 and the December 2011 inputs into the stochastic model were as follows:
2011
Share price R142,8 – R143,00Expected life 3 yearsRisk-free rate 6,84% – 6,18%Expected volatility 32,19% – 26,49%Dividend yield 2,22% – 2,92%Weighted average fair value R107,97
The risk-free rate was estimated using the implied yield on SA zero-coupon Government bonds.
Volatility was estimated using the weekly closing share price and the dividend yield was estimated by using a two-year moving average of the dividend yield at valuation date.
2011Rm
2010Rm
Offer date
Offered during
2011
Forfeitedduring
2011
Numberoutstanding
at 31 December 2011
2011

MTN Group Limited Integrated Business Report for the year ended 31 December 2011193
Grou
p ov
ervi
ewPe
rform
ance
revi
ewOp
erat
iona
l and
fin
ancia
l rev
iew
Sust
aina
bilit
yFi
nanc
ial s
tate
men
tsSh
areh
olde
r inf
orm
atio
n
47. SHARE-BASED PAYMENTS (continued)MTN Broad-Based Black Economic Empowerment (BBBEE) transactionDuring the 2010 financial year, the Company launched an empowerment vehicle (MTN Zakhele) in terms of which members of the black public were invited to subscribe for ordinary shares in MTN Zakhele Limited (MTN Zakhele) in terms of the prospectus issued by MTN Zakhele on 30 August 2010. All black staff and black directors of MTN and its major subsidiaries and their associates were entitled to participate in the MTN Zakhele offer on the same terms as members of the black public.
Number of shares Issue price
Shares issued to MTN Zakhele Limited in terms of the MTN BBBEE transaction 42 040 364 R107,46
A total of 80 900 000 MTN Zakhele shares were offered to the members of the black public at R20 per share.
MTN Zakhele shares cannot be traded during the minimum investment period (ie the first three years). Restricted trading is allowed during the fourth to sixth years, where MTN Zakhele shares could be sold to eligible black, indian and coloured ordinary shareholders. All sales during the fourth to sixth years are subject to approval and verification by MTN or a designated committee. There are no special restrictions on the sale or encumbrance of MTN Zakhele shares after the empowerment period.
The Group recognised an expense of R2 973 million in 2010 with regards to the empowerment vehicle.
Employee share ownership plan (ESOP)MTN established the ESOP for the benefit of employees who are South African citizens or permanent residents and at job level 1 and 2 who do not participate in any other existing share scheme within the Group, excluding management and directors. The ESOP was effective from 1 December 2010. Eligible MTN ESOP employees were not required to contribute any equity to participate and will be entitled to full voting and dividend rights. Eligible MTN ESOP employees were granted an allocation of 400 MTN shares each not exceeding R50 000. With limited exceptions (eg death), participants in the ESOP are required to hold the MTN shares awarded to them under the ESOP for a period of at least five years.
During the 2010 financial review, there was a net increase in the issued share capital due to the acquisition of shares by MTN Zakhele Limited in respect of the MTN BBBEE Transaction and the subsequent issuing of shares under the ESOP.
The number of shares issued by the Company in respect of the ESOP in 2010 was 1 405 200.
The Group recognised an expense of R171 million in 2010 with regards to the ESOP.
Number of shares Issue price

MTN Group Limited Integrated Business Report for the year ended 31 December 2011194
Note2011
Rm2010
Rm
Other operating expenses (68) (3 019)
Operating loss 1 (68) (3 019)Finance income 2 17 688 7 001Finance costs 2 (4) (3)
Profit before tax 17 616 3 979Income tax expense 3 (1 177) (632)
Profit after tax 16 439 3 347
The notes on pages 198 to 207 and the accounting policies set out in the Group financial statements are an integral part of these Company financial statements.
Note2011
Rm2010
Rm
Company income statementfor the year ended 31 December 2011
Company statement of comprehensive incomefor the year ended 31 December 2011
2011Rm
2010Rm
Profit after tax 16 439 3 347
Total comprehensive income for the year 16 439 3 347
Attributable toEquity holders of the Company 16 439 3 347
The notes on pages 198 to 207 and the accounting policies set out in the Group financial statements are an integral part of these Company financial statements.
2011Rm
2010Rm
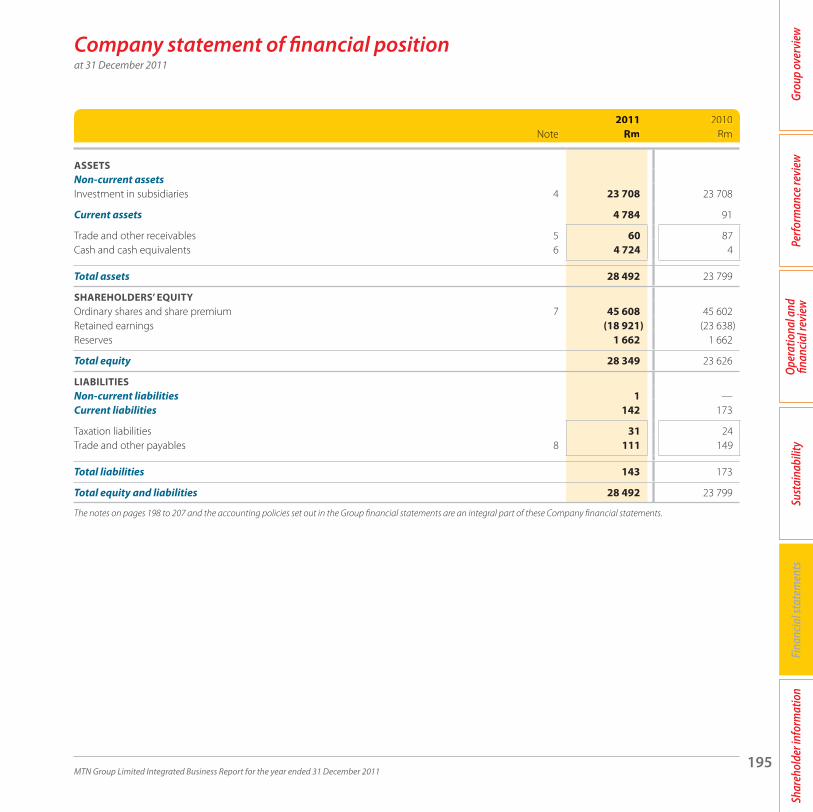
MTN Group Limited Integrated Business Report for the year ended 31 December 2011195
Grou
p ov
ervi
ewPe
rform
ance
revi
ewOp
erat
iona
l and
fin
ancia
l rev
iew
Sust
aina
bilit
yFi
nanc
ial s
tate
men
tsSh
areh
olde
r inf
orm
atio
n
Company statement of financial positionat 31 December 2011
Note2011
Rm2010
Rm
ASSETSNon-current assetsInvestment in subsidiaries 4 23 708 23 708
Current assets 4 784 91
Trade and other receivables 5 60 87Cash and cash equivalents 6 4 724 4
Total assets 28 492 23 799
SHAREHOLDERS’ EQUITYOrdinary shares and share premium 7 45 608 45 602Retained earnings (18 921) (23 638)Reserves 1 662 1 662
Total equity 28 349 23 626
LIABILITIESNon-current liabilities 1 —Current liabilities 142 173
Taxation liabilities 31 24Trade and other payables 8 111 149
Total liabilities 143 173
Total equity and liabilities 28 492 23 799
The notes on pages 198 to 207 and the accounting policies set out in the Group financial statements are an integral part of these Company financial statements.
Note2011
Rm2010
Rm

MTN Group Limited Integrated Business Report for the year ended 31 December 2011196
Share capital
Rm
Sharepremium
Rm
Retainedearnings
RmReserves**
RmTotal
Rm
Balance at 1 January 2010 * 44 297 (20 672) 108 23 733Shares issued during the year * 11 — — 11MTN Zakhele transaction — 1 294 — 1 382 2 676Employee share option plan — — — 171 171Share-based payments reserve — — — 1 1Total comprehensive income — — 3 347 — 3 347Dividends paid — — (6 313) — (6 313)
Balance at 31 December 2010 * 45 602 (23 638) 1 662 23 626
Balance at 1 January 2011 * 45 602 (23 638) 1 662 23 626Shares issued during the year * 6 — — 6Total comprehensive income — — 16 439 — 16 439Dividends paid — — (11 722) — (11 722)
Balance at 31 December 2011 * 45 608 (18 921) 1 662 28 349
Note 7 7
The notes on pages 198 to 207 and the accounting policies set out in the Group financial statements are an integral part of these Company financial statements.
*Amounts less than R1 million.**Share-based payment reserve.
Share capital
Rm
Sharepremium
Rm
Retainedearnings
RmReserves**
RmTotalTT
Rm
Company statement of changes in equityfor the year ended 31 December 2011

MTN Group Limited Integrated Business Report for the year ended 31 December 2011197
Grou
p ov
ervi
ewPe
rform
ance
revi
ewOp
erat
iona
l and
fin
ancia
l rev
iew
Sust
aina
bilit
yFi
nanc
ial s
tate
men
tsSh
areh
olde
r inf
orm
atio
n
Company statement of cash flowsfor the year ended 31 December 2011
Note2011
Rm2010
Rm
CASH FLOW FROM OPERATING ACTIVITIESCash utilised in operations 9 (72) (1 348)Finance costs paid (1) *Finance income received 24 6Income tax paid 10 (1 175) (635)Dividends paid to equity shareholders (11 722) (6 313)Dividends received 17 660 6 987
Net cash generated/ (utilised) in operating activities 4 714 (1 303)
CASH FLOWS FROM FINANCING ACTIVITIESProceeds from the issuance of ordinary shares 6 1 305
Net cash generated from financing activities 6 1 305
Net increase in cash and cash equivalents 4 720 2Cash and cash equivalents at beginning of year 4 2
Cash and cash equivalents at end of year 6 4 724 4
The notes on pages 198 to 207 and the accounting policies set out in the Group financial statements are an integral part of these Company financial statements.
*Amounts less than R1 million.
Note2011
Rm2010
Rm
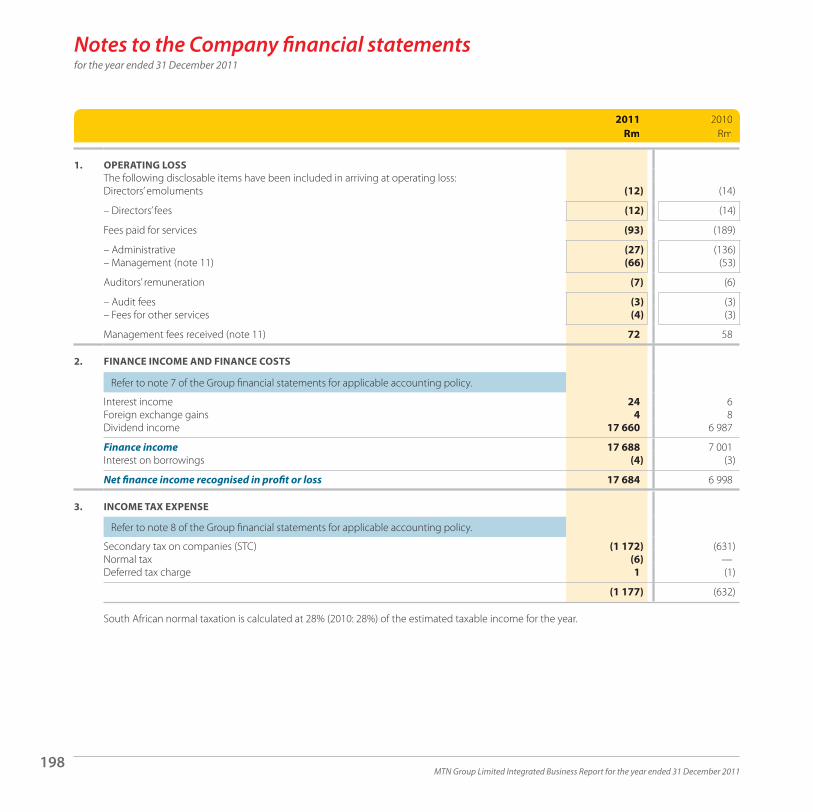
MTN Group Limited Integrated Business Report for the year ended 31 December 2011198
2011Rm
2010Rm
1. OPERATING LOSSThe following disclosable items have been included in arriving at operating loss:Directors’ emoluments (12) (14)
– Directors’ fees (12) (14)
Fees paid for services (93) (189)
– Administrative (27) (136)– Management (note 11) (66) (53)
Auditors’ remuneration (7) (6)
– Audit fees (3) (3)– Fees for other services (4) (3)
Management fees received (note 11) 72 58
2. FINANCE INCOME AND FINANCE COSTS
Refer to note 7 of the Group financial statements for applicable accounting policy.
Interest income 24 6Foreign exchange gains 4 8Dividend income 17 660 6 987
Finance income 17 688 7 001Interest on borrowings (4) (3)
Net finance income recognised in profit or loss 17 684 6 998
3. INCOME TAX EXPENSE
Refer to note 8 of the Group financial statements for applicable accounting policy.
Secondary tax on companies (STC) (1 172) (631)Normal tax (6) —Deferred tax charge 1 (1)
(1 177) (632)
South African normal taxation is calculated at 28% (2010: 28%) of the estimated taxable income for the year.
2011Rm
2010Rm
Notes to the Company financial statementsfor the year ended 31 December 2011

MTN Group Limited Integrated Business Report for the year ended 31 December 2011199
Grou
p ov
ervi
ewPe
rform
ance
revi
ewOp
erat
iona
l and
fin
ancia
l rev
iew
Sust
aina
bilit
yFi
nanc
ial s
tate
men
tsSh
areh
olde
r inf
orm
atio
n
2011 %
2010 %
3. INCOME TAX EXPENSE (continued)Tax rate reconciliationThe charge for the year can be reconciled to the effective rate of taxation in South Africa as follows:Tax at statutory tax rate 28,0 28,0Income not subject to tax (28,1) (49,2)Effect of STC 6,7 15,9Expenses not allowed 0,1 21,2
6,7 15,9
2011Rm
2010Rm
4. INVESTMENT IN SUBSIDIARIES
Refer to note 1.3 of the Group financial statements for applicable accounting policy.
Mobile Telephone Networks Holdings Proprietary Limited 22 173 22 173Loan owing by subsidiary** 1 478 1 478
Net interest in subsidiary Mobile Telephone Networks Holdings Proprietary Limited 23 651 23 651
MTN Group Management Services Proprietary Limited * *Loan owing by subsidiary 57 57
Net interest in MTN Group Management Services Proprietary Limited 57 57
Total interest in subsidiary companies 23 708 23 708
*Amounts less than R1 million** This loan account has been subordinated in favour of certain of the Group’s lenders. This loan bears no interest and
there are no fixed terms of repayment.
5. TRADE AND OTHER RECEIVABLES
Refer to note 17 of the Group financial statements for applicable accounting policy.
Trade receivables due from related parties 57 85Sundry debtors and advances 3 2
60 87
6. CASH AND CASH EQUIVALENTS
Refer to note 29 of the Group financial statements for applicable accounting policy.
Cash at bank and on hand 4 724 4
2011 %
2010%
2011Rm
2010Rm

MTN Group Limited Integrated Business Report for the year ended 31 December 2011200
2011 2010
Number of shares
7. ORDINARY SHARE CAPITAL AND SHARE PREMIUM
Refer to note 20 of the Group financial statements for applicable accounting policy.
Authorised 2 500 000 000 2 500 000 000Issued 1 884 811 569 1 884 529 317
In issue at 1 January 1 884 510 117 1 840 536 491Options exercised 301 452 528 062MTN Zakhele transaction — 43 445 564
In issue at 31 December 1 884 811 569 1 884 510 117Option shares – MTN Zakhele transaction* (29 994 952) (29 994 952)
In issue at 31 December – excluding MTN Zakhele transaction** 1 854 816 617 1 854 515 165
* Due to the call option over the national vendor finance shares, these shares, although legally issued to MTN Zakhele, are not deemed to be issued in terms of IFRS and are shown as such in the share capital reconciliation.
**Treasury shares are held by MTN Holdings Proprietary Limited and therefore are not excluded in this reconciliation.
2011 2010
Rm Rm
Share capitalBalance at beginning of year * *Additions * *
Balance at end of year * *
Share premiumBalance at beginning of year 45 602 44 297Options - MTN Zakhele transaction — 1 294Options exercised 6 11
Balance at end of year 45 608 45 602
*Amounts less than R1 million.
2011 2010
Number of shares
2011 2010
Rm Rm
Notes to the Company financial statements continued for the year ended 31 December 2011

MTN Group Limited Integrated Business Report for the year ended 31 December 2011201
Grou
p ov
ervi
ewPe
rform
ance
revi
ewOp
erat
iona
l and
fin
ancia
l rev
iew
Sust
aina
bilit
yFi
nanc
ial s
tate
men
tsSh
areh
olde
r inf
orm
atio
n
2011Rm
2010Rm
8. TRADE AND OTHER PAYABLES
Refer to note 25 of the Group financial statements for applicable accounting policy.
Sundry creditors 15 101Accrued expenses and other payables 96 48
111 149
9. CASH UTILISED BY OPERATIONSProfit before tax 17 616 3 979Adjustments for:Finance income (note 2) (17 688) (7 001)Finance costs (note 2) 4 3Other (29) 1 559
(97) (1 460)Changes in working capital 25 112
Decrease in trade and other receivables 75 102(Decrease)/increase in trade and other payables (50) 10
(72) (1 348)
10. INCOME TAX PAIDBalance at beginning of year (24) (26)Amounts recognised in profit or loss (note 3) (1 177) (632)Other (5) (1)Balance at end of year 31 24
Total tax paid (1 175) (635)
2011Rm
2010Rm

MTN Group Limited Integrated Business Report for the year ended 31 December 2011202
2011Rm
2010Rm
11. RELATED PARTY TRANSACTIONS
Refer to note 43 of the Group financial statements for applicable accounting policy.
Various transactions were entered into by the Company during the period with related parties. The terms of these transactions are documented below.
The following is a summary of transactions with related parties during the period and balances due at reporting date:
Dividends received– Mobile Telephone Networks Holdings Proprietary Limited 17 660 6 987Donation– MTN Zakhele Limited — (1 294)Management fees paid– MTN Group Management Services Proprietary Limited (66) (53)Management fees received– MTN International Proprietary Limited 72 58
DirectorsDetails of directors’ remuneration are disclosed in note 1 of the Company financial statements and are disclosed on page 64 of the integrated business report.
ShareholdersThe principal shareholders of the Company are disclosed in the integrated business report on page 207.
12. CONTINGENT LIABILITIES AND COMMITMENTS
Refer to note 32 of the Group financial statements for applicable accounting policy.
The Company does not have any contingent liabilities or commitments at year end.
2011Rm
2010Rm
Notes to the Company financial statements continuedfor the year ended 31 December 2011

MTN Group Limited Integrated Business Report for the year ended 31 December 2011203
Grou
p ov
ervi
ewPe
rform
ance
revi
ewOp
erat
iona
l and
fin
ancia
l rev
iew
Sust
aina
bilit
yFi
nanc
ial s
tate
men
tsSh
areh
olde
r inf
orm
atio
n
2011Rm
2010Rm
13. GUARANTEES
Financial guarantee contractsA financial guarantee contract is a contract that requires the issuer to make specified payments to reimburse the holder for a loss it incurs because a specified debtor fails to make payments when due in accordance with the terms of a debt instrument.
Financial guarantee contracts issued by the Company are initially measured at their fair values and, if not designated as at fair value through profit or loss, are subsequently measured at the higher of:
the amount of the obligation under the contract, as determined in accordance with IAS 37 Provisions, Contingent Liabilities and Contingent Assets; andthe amount initially recognised less, where appropriate, cumulative amortisation. The cost of the guarantee is amortised using the effective interest rate method.
It should, however, be noted that intergroup financial guarantee contracts where subsidiaries guarantee the debt of their direct or indirect parent companies are deemed to be liquidity instruments as opposed to financial guarantee contracts as defined.
The Company together with other subsidiaries has guaranteed the bonds, revolving credit facilities and general banking facilities of Mobile Telephone Networks Holdings Proprietary Limited under the terms of the guarantee. The Company will make payments to reimburse the lenders upon failure of the guaranteed entity to make payments when due.
Terms and face values of the guarantees are as follows:The bond guarantees are as follows:Bonds and commercial paper 6 050 7 291These bonds are listed on the Bond Exchange of South Africa
Syndicated loan facilitiesUSD revolving-credit-facility — 1 230ZAR long-term loan 7 096 1 750ZAR short-term loan — 6 000USD short-term bridge facility — 761
General banking facilityZAR facility — 1 519
2011Rm
2010Rm

MTN Group Limited Integrated Business Report for the year ended 31 December 2011204
14. FINANCIAL INSTRUMENTS
Refer to note 46 of the Group financial statements for applicable accounting policy.
Loans and receivables
Rm
Amortised costRm
Totalcarryingamount
RmFair value
Rm
14.1 Accounting classifications and fair values2011Trade and other receivables 60 — 60 60Cash and cash equivalents 4 724 — 4 724 4 724
4 784 — 4 784 4 784
Trade and other payables — 111 111 111
— 111 111 111
2010Trade and other receivables 87 — 87 87Cash and cash equivalents 4 — 4 4
91 — 91 91
Trade and other payables — 147 147 147
— 147 147 147
2011Rm
2010Rm
14.2 Credit risk*The following instruments give rise to credit risk:Cash and cash equivalents 4 724 4Trade and other receivables 60 87
4 784 91
*Before considering collateral and credit enhancements.
Loans and receivables
Rm
Amortised costRm
TotalTTcarryingamount
RmFair value
Rm
2011Rm
2010Rm
Notes to the Company financial statements continuedfor the year ended 31 December 2011

MTN Group Limited Integrated Business Report for the year ended 31 December 2011205
Grou
p ov
ervi
ewPe
rform
ance
revi
ewOp
erat
iona
l and
fin
ancia
l rev
iew
Sust
aina
bilit
yFi
nanc
ial s
tate
men
tsSh
areh
olde
r inf
orm
atio
n
2011Rm
2010Rm
14. FINANCIAL INSTRUMENTS (continued)14.3 Liquidity risk (continued)
The following liquid resources are available:
Cash and cash equivalents 4 724 4Trade and other receivables 60 87
4 784 91
The following are the contractual cash flows of financial liabilities:
Carryingamount
RmTotal
Rm
Payable within one month or
on demandRm
More thanone month butnot exceedingthree months
Rm
2011Trade and other payables– Accrued expense and other payables 96 96 51 45– Trade payables from related parties 15 15 15 —
111 111 66 45
2010Trade and other payables– Trade payables from related parties 101 101 101 —– Accrued expenses and other payables 48 48 48 —
149 149 149 —
14.4 Interest rate riskAt the reporting date the interest rate profile of the Company’s interest-bearing financial instruments were:
Variable rateinstruments
Rm
2011Cash and cash equivalents 4 724
2010Cash and cash equivalents 4
2011Rm
2010Rm
Carryingamount
RmTotalTT
Rm
Payable within one month or
on demandRm
More thanone month butnot exceedingthree months
Rm
Variable rateVVinstruments
Rm

MTN Group Limited Integrated Business Report for the year ended 31 December 2011206
15. SHAREHOLDERS’ INFORMATION
Shareholder spread
Number of shareholders %
Numbers of shares %
1 – 1 000 shares 126 437 88,80 27 480 753 1,46 1 001 – 10 000 shares 13 251 9,31 36 465 309 1,93 10 001 – 100 000 shares 1 826 1,28 59 302 597 3,15 100 001 – 1 000 000 shares 704 0,49 225 320 973 11,95 1 000 001 shares and over 175 0,12 1 536 241 937 81,51
Total 142 393 100,00 1 884 811 569 100,00
Nominees holding shares in excess of 5% of the issued ordinary capital of the Company
2011 2010Number of
shares% of issued
share capitalNumber of
shares% of issued
share capital
Nedcor Bank Nominees Limited 454 420 485 24,11 592 362 611 31,43Standard Bank Nominees (Tvl) Proprietary Limited 582 963 175 30,93 591 663 890 31,40First National Nominees Proprietary Limited 302 536 665 16,05 277 262 580 14,71Absa Nominees Proprietary Limited 158 215 872 8,39 165 390 793 8,78
Number of shareholders %
Numbersof shares %
2011 2010Number of
shares% of issued
share capitalNumber of
shares% of issued
share capital
Notes to the Company financial statements continuedfor the year ended 31 December 2011

MTN Group Limited Integrated Business Report for the year ended 31 December 2011207
Grou
p ov
ervi
ewPe
rform
ance
revi
ewOp
erat
iona
l and
fin
ancia
l rev
iew
Sust
aina
bilit
yFi
nanc
ial s
tate
men
tsSh
areh
olde
r inf
orm
atio
n
Spread of ordinary shareholders
2011 2010Number of
shareholdingsNumber
of shares% of issued
share capitalNumber of shares
% of issued share capital
15. SHAREHOLDERS’ INFORMATION (continued)Public 142 367 1 282 083 602 68,02 1 279 613 654 67,90 Non-public 26 602 727 967 31,98 604 896 433 32,10
Directors and Associates of the Company Holdings 12 2 456 067 0,13 2 880 023 0,15 Empowerment 4 85 509 785 4,54 85 509 785 4,54 Lombard Odier Darier Hentsch & Cie (M1 Limited) 8 183 152 564 9,72 184 271 933 9,78 Government Employees Pension Fund 1 324 845 139 17,23 332 234 692 17,63 Mobile Telephone Networks Holdings 1 6 764 412 0,36 — —
Total 142 393 1 884 811 569 100 1 884 510 117 100
Beneficial shareholders holding 5% or more
2011 2010Number of
shares% of issued
share capitalNumber of
shares% of issued
share capital
Government Employees Pension Fund 324 845 139 17,23 332 234 692 17,63 Lombard Odier Darier Hentsch & Cie (M1 Limited) 183 152 564 9,72 184 271 933 9,78
2011 2010Number of
shares% of issued
share capitalNumber of
shares% of issued
share capital
2011 2010Number of
shareholdingsNumber
of shares% of issued
share capitalNumberof shares
% of issued share capital

MTN Group Limited Integrated Business Report for the year ended 31 December 2011208
Annexure 1at 31 December 2011
INTERESTS IN SUBSIDIARY COMPANIES AND JOINT VENTURES
2011 2010 Subsidiaries and joint ventures
in which MTN Group Limited has a direct and indirect interest Principal activity
Place of incorporation
% interest in issued ordinary share capital
MTN Afghanistan Limited Telecommunications Afghanistan 90,9 90,9Spacetel Benin SA Telecommunications Benin 75 75Deci Investments Proprietary Limited** Investment holding company Botswana 33 33Econet Wireless Citizens Limited Investment holding company Botswana 82,8 82,8Mascom Wireless Botswana Proprietary Limited** Network operator Botswana 53 53MTN Business Solutions Botswana Proprietary Limited Internet service provider Botswana 80 80Easy Dial International Limited Holding company British Virgin Islands 99 99Interserve Overseas Limited International business British Virgin Islands 99 99Investcom Consortium Holding S.A. Holding company British Virgin Islands 99 99Investcom Global Limited Managing and holding company British Virgin Islands 99 99Investcom International Limited Dormant company British Virgin Islands 99 99Investcom Mobile Benin Limited Holding company British Virgin Islands 99 99Investcom Mobile Communications Limited Holding company British Virgin Islands 100 100Investcom Telecommunications Afghanistan Limited Holding company British Virgin Islands 100 100Investcom Telecommunications Guinea (Conakry) Limited Holding company British Virgin Islands 99 99Investcom Telecommunications Yemen Limited Telecommunications British Virgin Islands 100 100MTN Yemen Telecommunications British Virgin Islands 82,8 82,8Prime Call Limited Telecommunications British Virgin Islands 100 100Spacetel Africa Limited Telecommunications British Virgin Islands 100 100Starcom Global Limited Holding company British Virgin Islands 100 100Mobile Telephone Networks Cameroon Limited Network operator Cameroon 70 70MTN Network Solutions Limited Internet service provider Cameroon 100 100Afnet Internet service provider Côte d’ Ivoire 100 100Arobase Fixed line operator Côte d’ Ivoire 100 100MTN Côte d’Ivoire S.A. Network operator Côte d’ Ivoire 64,7 64,7Infotel Limited Telecommunications Cyprus 100 100MTN Cyprus Limited Telecommunications Cyprus 50 50OTEnet Cyprus Limited Telecommunications Cyprus 100 100Uniglobe SA Management company France 99,8 99,8Scancom Limited Telecommunications Ghana 97,7 97,7Areeba Guinea S.A. Telecommunications Guinea 75 75Spacetel Guinea-Bissau S.A. Telecommunications Guinea-Bissau 100 100Irancell Telecommunications Services Company Proprietary Limited** Network operator Iran 49 49Uunet Communications Proprietary Limited Internet service provider Kenya 95 95Uunet Kenya Proprietary Limited Internet service provider Kenya 95 95Inteltec Offshore SAL Maintenance and engineering services Lebanon 99,8 99,8Inteltec SAL Maintenance and engineering services Lebanon — 99,99MTN (Dubai) Limited Holding company Lebanon 100 100Servico SAL Services and transportation of goods Lebanon 99,97 99,97Lonestar Communications Corporation LLC Telecommunications Liberia 60 60Guardrisk International Limited PCC Insurance company Mauritius 100 100
2011 2010 Subsidiaries and joint ventures
in which MTN Group Limited has a direct and indirect interest Principal activity
Place of incorporation
% interest in issued ordinaryshare capital

MTN Group Limited Integrated Business Report for the year ended 31 December 2011209
Grou
p ov
ervi
ewPe
rform
ance
revi
ewOp
erat
iona
l and
fin
ancia
l rev
iew
Sust
aina
bilit
yFi
nanc
ial s
tate
men
tsSh
areh
olde
r inf
orm
atio
n
2011 2010 Subsidiaries and joint ventures
in which MTN Group Limited has a direct and indirect interest Principal activity
Place of incorporation
% interest in issued ordinary share capital
Mobile Botswana Limited Investment holding company Mauritius 100 100MTN International (Mauritius) Limited Investment holding company Mauritius 100 100Satellite Data Networks Mauritius Proprietary Limited** Internet service provider Mauritius 60 60MTN Business Solutions Namibia Proprietary Limited Internet service provider Namibia 100 100Electronic Funds Transfer Operations Nigeria Limited Virtual airtime Nigeria 50 50MTN Nigeria Communications Limited Network operator Nigeria 78,83 76,08XS Broadband Limited Telecommunications Nigeria 100 100Galactic Engineering Projects SA Holding company Panama 78 78Vernis Associates SA Holding company Panama 100 100MTN Congo S.A. Network operator Republic of the Congo 100 100Supercell Network operator Republic of the Congo — 70MTN Rwandacell S.A.R.L. Network operator Rwanda 80 55Village Phone Rwanda Airtime sales Rwanda 100 100Aconcagua 11 Proprietary Limited Property holding South Africa 100 100Cell Place Proprietary Limited Cellular dealership South Africa 100 100iTalk Cellular Proprietary Limited Service provider South Africa 100 100Mobile Telephone Networks Proprietary Limited Network operator South Africa 100 100Mobile Telephone Networks Holdings Proprietary Limited Investment holding company South Africa 100 100MTN Business Solutions Proprietary Limited Internet service provider South Africa 100 100MTN Group Management Services Proprietary Limited Management services South Africa 100 100MTN International Proprietary Limited Investment holding company South Africa 100 100Oltio Proprietary Limited(MTN Mobile Money Holdings Proprietary Limited)** Wireless banking services South Africa 50 50MTN Network Solutions Proprietary Limited Internet service provider South Africa 100 100MTN Propco Proprietary Limited Property holding South Africa 100 100MTN Service Provider Proprietary Limited Service provider South Africa 100 100Satellite Data Networks Proprietary Limited Dormant company South Africa 100 100Inteltec Maroc SA Maintenance and engineering services Monaco 99,83 99,83MTN Sudan Company Limited Network operator Sudan 85 85Swazi MTN Limited** Network operator Swaziland 30 30MTN Syria (JSC) Telecommunications Syria 75 75MTN Publicom Limited Payphone services Uganda 100 100MTN Uganda Limited Network operator Uganda 96 96Spacetel International Limited Dormant company United Kingdom 100 100Cotel Holdings Limited Investment holding company Zambia 100 100MTN (Zambia) Limited Network operator Zambia 86 90Uunet Zambia Proprietary Limited Internet service provider Zambia 95 95MTN (Netherlands) Co-Op UA Holding company Netherlands 100 —MTN (Netherlands) BV Holding company Netherlands 100 —MTN NIC BV Holding company Netherlands 100 —Easynet Search Limited Internet service provider Ghana 100 —Fourteen Avenue Holding Limited Holding company Dubai 100 —
**Joint ventures
2011 2010 Subsidiaries and joint venturesin which MTN Group Limited has a direct and indirect interest Principal activity
Place of incorporation
% interest in issued ordinary share capital

MTN Group Limited Integrated Business Report for the year ended 31 December 2011210
Glossary – terms and acronyms
2G Second generation
3G Third generation
ADR American depository receipt
ARPU Average revenue per user per month. Revenue (including interconnect fees but excluding connection fees and visitor roaming revenue) is divided by the weighted average subscriber base over the period.
ATM Automatic teller machine
BEE Black economic empowerment in South Africa
BOT Build operate and transfer arrangement in Syria
BRM Business risk management
BTS Base transceiver station
Capex Capital expenditure
CDMA Code division multiple access
CSR Corporate social responsibility
CST Communication service tax
Dongle A device connected to a computer to allow access to wireless broadband
EASSY Eastern Africa Submarine Cable System
EBITDA Earnings before interest, tax, depreciation and amortisation
EDGE Enhanced data rates for GSM evolution
EMF Electromagnetic field
EPS Earnings per share
EXCO Executive committee
GHC Ghanaian cedi
GPRS General packet radio service
GRI The Global Reporting Initiative, which promotes economic sustainability
GSM Global System for Mobile Communications
HEPS Headline earnings per share
HSDPA High-speed downlink packet access
HSPA High-speed packet access
ICASA Independent Communications Authority of South Africa
ICT Information and communication technologies
IFC International Finance Corporation
IFRS International Financial Reporting Standards
IP Internet protocol

MTN Group Limited Integrated Business Report for the year ended 31 December 2011211
Grou
p ov
ervi
ewPe
rform
ance
revi
ewOp
erat
iona
l and
fin
ancia
l rev
iew
Sust
aina
bilit
yFi
nanc
ial s
tate
men
tsSh
areh
olde
r inf
orm
atio
n
IRR Iranian rials
IS Information systems
King II King Committee report on corporate governance 2002
King III King Committee report on corporate governance 2009
LTE Long-term evolution
MMS Multimedia messaging service, allowing mobiles to send and receive pictures and sound clips as well as long text messages
MPLS Multiprotocol Label Switching
NCA Ghana’s National Communications Authority
NCC Nigeria Communications Commission
NGN Nigerian naira
Off-net Calls originating and terminating on different networks
On-net Calls originating and terminating on the same network
Postpaid Services for which the subscriber has a contract and pays monthly
Prepaid Services for which the user pays in advance
QOS Quality of service standards
RICA South Africa’s Regulation of Interception of Communications Related Information Act
SIM Subscriber identity module
Smartphones A mobile that has greater connectivity and computing ability than a regular feature mobile
SME Small and medium enterprise
SMS Short message service
STC Secondary tax on companies
Subscriber A customer who has participated in a revenue-generating activity within the last 90 days
SYP Syrian pound
Tablet A mobile computer with a touchscreen
USD/US$ United States dollar
VOIP Voice over internet protocol
VP Vice-president
WCDMA Wideband code division multiple access
WiMax Worldwide interoperability for microwave access
USSD Unstructured supplementary service data is a technology to send information between a mobile and an application on the network
ZAR South African rand

The internet café project
Background
The Ugandan Communications Commission aims to increase internet access and use in rural areas.
Solution
MTN Uganda has established 22 internet cafes to date, managing and operating internet access for a period of five years. The UCC advised MTN on where the cafes should be located. Each internet café has at least five computers, with an on-site server and solar power for equipment, printers and lighting.
MTN Group Limited Integrated Business Report for the year ended 31 December 2011212

Grou
p ov
ervi
ewPe
rform
ance
revi
ewOp
erat
iona
l and
fin
ancia
l rev
iew
Sust
aina
bilit
yFi
nanc
ial s
tate
men
tsSh
areh
olde
r inf
orm
atio
n
Notice of the seventeenth annual general meeting
Shareholders’ information
Shareholder information
MTN Group Limited Integrated Business Report for the year ended 31 December 2011213

MTN Group Limited Integrated Business Report for the year ended 31 December 2011214
MTN Group LimitedIncorporated in the Republic of South Africa(Registration number 1994/009584/06)(MTN Group or the Company)JSE code: MTNISIN: ZAE000042164
This document is important and requires your immediate attentionIf you are in any doubt about what action you should take, consult your broker, Central Securities Depository Participant (CSDP), legal adviser, banker, financial adviser, accountant or other professional adviser immediately.
If you have disposed of all your shares in MTN Group, please forward this document, together with the enclosed form of proxy, to the purchaser of such shares or the broker, banker or other agent through whom you disposed of such shares.
Included in this document are:The notice of meeting, setting out the resolutions to be proposed thereat, together with explanatory notes. There are also guidance notes if you wish to attend the meeting (for which purpose the meeting location map is included) or to vote by proxy.A proxy form for use by shareholders holding MTN Group ordinary shares in certificated form or recorded in sub-registered electronic form in “own name”.
Shareholders on the MTN Group share register who have dematerialised their ordinary shares through STRATE, other than those whose shareholding is recorded in their “own name” in the sub-register maintained by their CSDP, and who wish to attend the meeting in person, will need to request their CSDP or broker to provide them with the necessary authority to do so in terms of the custody agreement entered into between the dematerialised shareholders and their CSDP or broker.
A shareholder (including certificated shareholders and dematerialised shareholders who hold their shares with “own name” registration) who is entitled to attend and vote at the meeting is entitled to appoint a proxy to attend, participate in and vote at the meeting in the place of the shareholder. A proxy does not have to be a shareholder of the Company but must be an individual.
The appointment of a proxy will not preclude the shareholder who appointed that proxy from attending the annual general meeting and participating and voting in person thereat to the exclusion of any such proxy. A form of proxy for use at the meeting is attached.
Notice of the seventeenth annual general meeting

MTN Group Limited Integrated Business Report for the year ended 31 December 2011215
Grou
p ov
ervi
ewPe
rform
ance
revi
ewOp
erat
iona
l and
fin
ancia
l rev
iew
Sust
aina
bilit
yFi
nanc
ial s
tate
men
tsSh
areh
olde
r inf
orm
atio
n
Notice to ShareholderS: aNNual GeNeral MeetiNG (aGM)Notice is hereby given to shareholders as at the record date of 13 April 2012, that the seventeenth annual general meeting of shareholders of the MTN Group will be held in the Auditorium, Phase II, Level 0, 216 – 14th Avenue, Fairland, Gauteng, on Tuesday, 29 May 2012 at 14:30 (South African time), to (i) deal with such other business as may lawfully be dealt with at the meeting and (ii) consider and, if deemed fit, to pass, with or without modification, the following ordinary and special resolutions, in the manner required by the Companies Act, 71 of 2008, as amended (“Companies Act”), as read with the JSE Limited Listings Requirements (“JSE Listings Requirements”), which meeting is to be participated in and voted at by shareholders as at the record date of 18 May 2012 (as contemplated in section 62(3)(a), read with section 59 of the Companies Act); and (ii) deal with such other business as may be lawfully dealt with at the meeting:
NB: Section 63(1) of the Companies Act – Identification of meeting participants
Kindly note that meeting participants (including proxies) are required to provide reasonably satisfactory identification and evidence of authority (where applicable) before being entitled to attend or participate in a shareholders’ meeting. Forms of identification include valid identity documents, driver’s licences and passports.
When reading the resolutions below, please refer to the explanatory notes for AGM resolutions on pages 224 to 226.
For the purposes hereof “Group” shall bear the meaning assigned to it by the JSE Listings Requirements, which defines “Group” as a holding company, not itself being a wholly owned subsidiary, together with all companies which are its subsidiaries.
Presentation of annual financial statementsThe consolidated audited annual financial statements of the Company and its subsidiaries (as approved by the board of directors of the Company), including the directors’ report, the audit committee report and the external auditors’ report for the year ended 31 December 2011, have been distributed as required and will be presented to shareholders.
The complete annual financial statements are set out on pages 88 to 207 of the integrated business report.
1. ordiNarY reSolutioN NuMBer 1.1 to 1.4: Re-election of directors
To elect by separate resolutions directors of the Company in accordance with the Companies Act and the Company’s memorandum of incorporation which provides that at least one-third of the directors, being those longest in office at the date of the annual general meeting, should retire, but that such directors may offer themselves for re-election.

MTN Group Limited Integrated Business Report for the year ended 31 December 2011216
1.1 Ordinary resolution number 1.1 “Resolved that AP Harper, who retires by rotation in terms of the memorandum of incorporation of the Company and who is eligible and available
for re-election, is re-elected as a director of the Company”; and
1.2 Ordinary resolution number 1.2 “Resolved that MLD Marole, who retires by rotation in terms of the memorandum of incorporation of the Company and who is eligible and
available for re-election, is re-elected as a director of the Company”; and
1.3 Ordinary resolution number 1.3 “Resolved that NP Mageza, who retires by rotation in terms of the memorandum of incorporation of the Company and who is eligible and
available for re-election, is re-elected as a director of the Company”; and
1.4 Ordinary resolution number 1.4 “Resolved that AF van Biljon, who retires by rotation in terms of the memorandum of incorporation of the Company and who is eligible and
available for re-election, is re-elected as a director of the Company.”
A brief CV in respect of each director standing for re-election appears on pages 16 and 19 of the integrated business report.
Appointment of audit committee
2.1 Ordinary resolution number 2.1 “Resolved that AF van Biljon be elected a member and chairperson of the audit committee, with effect from the end of this meeting in terms of
section 94(2) of the Companies Act, subject to his re-election as a director pursuant to ordinary resolution number 1.4”; and
2.2 Ordinary resolution number 2.2 “Resolved that J van Rooyen be elected a member of the audit committee, with effect from the end of this meeting in terms of section 94(2) of
the Companies Act”; and
2.3 Ordinary resolution number 2.3 “Resolved that NP Mageza be elected a member of the audit committee, with effect from the end of this meeting in terms of section 94(2) of the
Companies Act, subject to his re-election as a director pursuant to ordinary resolution number 1.3”; and
2.4 Ordinary resolution number 2.4 “Resolved that MJN Njeke be elected a member of the audit committee, with effect from the end of this meeting in terms of section 94(2) of the
Companies Act.”
Notice of the seventeenth annual general meeting continued

MTN Group Limited Integrated Business Report for the year ended 31 December 2011217
Grou
p ov
ervi
ewPe
rform
ance
revi
ewOp
erat
iona
l and
fin
ancia
l rev
iew
Sust
aina
bilit
yFi
nanc
ial s
tate
men
tsSh
areh
olde
r inf
orm
atio
n
3. ORDINARY RESOLUTION NUMBER 3: Reappointment of joint independent auditors
“Resolved that PricewaterhouseCoopers Inc. and SizweNtsalubaGobodo INC are reappointed as joint auditors of the Company (for the financial year ending 31 December 2012) until the conclusion of the next annual general meeting.”
4. ORDINARY RESOLUTION NUMBER 4: General authority to directors to allot and issue ordinary shares
“Resolved that, as required by and subject to the Company’s memorandum of incorporation, and subject to the provisions of the Companies Act and the JSE Listings Requirements, each as presently constituted and as amended from time to time, the directors are authorised, as they in their discretion think fit, to allot, issue and grant options over shares and to undertake to allot, issue and grant options over shares
representing not more than 10% of the number of ordinary shares in issue as at 31 December 2011 (i.e. 188 481 157 ordinary shares); separately, such shares as have been reserved to be allotted and issued by the Company in terms of its share and other employee incentive
schemes (i.e. 5% of the unissued ordinary shares),
from the authorised but unissued ordinary shares of 0,01 cent each in the share capital of the Company, such authority to endure until the forthcoming annual general meeting of the Company (whereupon this authority shall lapse, unless it is renewed at the aforementioned annual general meeting), provided that it shall not extend beyond 15 months of the date of this meeting.”
Endorsement of the remuneration philosophy (policy)
To endorse, through a non-binding advisory vote, the Company’s remuneration policy (excluding the remuneration of the non-executive directors and the members of board and statutory committees for their services as directors and members of committees), as set out in the Remuneration Report contained in the integrated business report on pages 58 and 73.

MTN Group Limited Integrated Business Report for the year ended 31 December 2011218
1. SPECIAL RESOLUTION NUMBER 1: Proposed increase of remuneration payable to non-executive directors
“Resolved, in terms of article 73(b) of the memorandum of incorporation of the Company and subject to the terms thereof, that the non-executive directors’ remuneration, payable quarterly in arrears, be increased with immediate effect as set out below:
MTN Group boardChairperson R900 000 R954 900 R78 007 R82 765Member R180 015 R190 996 R40 912 R43 408International member €75 420 No change €7 542 No changeLocal non-executive director on special assignments or projects per day N/A N/A R18 207 R19 318International non-executive director on special assignment or projects per day N/A N/A €3 307 No changeAd hoc work performed by non-executive directors for special projects (hourly rate) R3 310 R3 400Audit committeeChairperson R90 800 R96 339 R28 011 R29 719Member R51 100 R52 633 R19 300 R20 477International member N/A N/A N/A N/A* Risk management, compliance and corporate governanceChairman N/A R71 936 N/A R27 098Member N/A R42 154 N/A R19 873International member N/A N/A N/A N/A** Nomination committee Chairman N/A — N/A —Member N/A — N/A —International member N/A — N/A —*** Remuneration and human resources committeeChairman N/A R71 936 R27 098International chairman N/A €5 515 N/A €3 520Member N/A R42 154 R19 873International member N/A €3 232 N/A €3 232**** Social and ethics committeeChairman N/A R71 936 N/A R27 098Member N/A R42 154 N/A R19 873International member N/A N/A N/A N/ATender committeeChairman N/A R63 937 R22 700 R24 085Member N/A R37 360 R16 600 R17 613MTN Group Share Trust (trustees)Chairman N/A R63 937 R22 700 R24 085Other trustees N/A R28 110 R12 490 R13 252
* The mandate of the former risk management and compliance committee has been broadened to include corporate governance. The latter function previously resided with the former nomination, remuneration, human resources and corporate governance committee.
** The nomination function previously resided with the former nomination, remuneration, human resources and corporate governance committee. This function now resides with a stand-alone committee and membership thereof mirrors that of the remuneration and human resources committee. Having regard to the overlap as well as the frequency of meetings of the nominations committee, the board does not propose any retainer or attendance fees for the nominations committee.
*** The remuneration and human resources committee became a stand-alone committee following the restructuring of the former nomination, remuneration, human resources and corporate governance committee.
**** This is a new committee established pursuant to the requirements of the Companies Act and Regulations published thereunder.
Notice of the seventeenth annual general meeting continued

MTN Group Limited Integrated Business Report for the year ended 31 December 2011219
Grou
p ov
ervi
ewPe
rform
ance
revi
ewOp
erat
iona
l and
fin
ancia
l rev
iew
Sust
aina
bilit
yFi
nanc
ial s
tate
men
tsSh
areh
olde
r inf
orm
atio
n
Special resolution number 1 is proposed in order to comply with the requirements of the Companies Act and the Company’s memorandum of incorporation. The above rates have been determined to ensure that the remuneration of non-executive directors remains competitive in order to enable the Company to retain and attract persons of the calibre, appropriate capabilities, skills and experience required in order to make meaningful contributions to the Company, given its global footprint and growth rate.
In arriving at the proposal set out in special resolution number 1, the Group president and CEO, in consultation with the Group chief human resources and corporate affairs officer, conducted a review of the remuneration paid to non-executive directors and other non-executive office bearers, based on data provided by independent remuneration specialists and benchmarked against comparable South African companies with international operations. The remuneration and human resources committee considered the revised remuneration proposal in detail and, after consensus, recommended the remuneration proposal to the board, which sanctioned the proposal for recommendation to shareholders.
The proposed remuneration is considered to be fair and reasonable and in the best interests of the Company.
2. SPECIAL RESOLUTION NUMBER 2: Repurchase of the Company’s shares Preamble The board of directors of the Company has considered the impact of a repurchase or purchase, as the case may be, of up to 10% of the
Company’s shares, which falls within the amount permissible under a general authority in terms of the JSE Listings Requirements and, in respect of acquisitions by subsidiaries of the Company, the Companies Act.
Should the opportunity arise and should the directors deem it to be advantageous to the Company, or any of its subsidiaries, to repurchase or purchase, as the case may be, such shares, it is considered appropriate that the directors (and relevant subsidiaries) be authorised to repurchase or purchase, as the case may be, the Company’s shares.
“Resolved that the Company and/or a subsidiary of the Company is authorised to repurchase or purchase, as the case may be, shares issued by the Company, from any person, upon such terms and conditions and in such number as the directors of the Company or the subsidiary may from time to time determine, including that such securities be repurchased or purchased from capital redemption reserve fund, but subject to the applicable requirements of the Company’s memorandum of incorporation, the Companies Act and the JSE Listings Requirements, each as presently constituted and as amended from time to time; and subject further to the restriction that the repurchase or purchase, as the case may be, by the Company and/or any of its subsidiaries, of shares in the Company of any class under this authority shall not, in aggregate in any one financial year, exceed 10% of the shares in issue in such class as at the commencement of such financial year.”
It is recorded that, as at the last practicable date, the JSE Listings Requirements provide, inter alia, that the Company or any subsidiary of the Company may only make a general repurchase of the ordinary shares in the Company if:
1. any such repurchase of shares is implemented through the order book operated by the JSE’s trading system and done without any prior understanding or arrangement between the Company and the counter-party (reported trades are prohibited);
2. authorisation thereto is given by the Company’s memorandum of incorporation;
3. at any point in time, the Company may only appoint one agent to effect any repurchase(s) on its behalf;
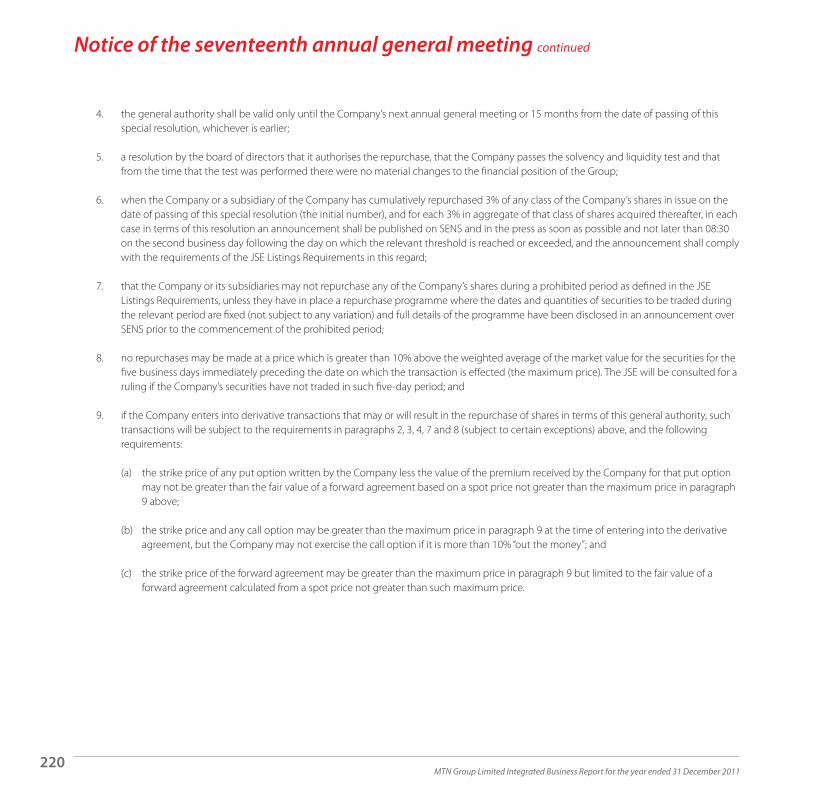
MTN Group Limited Integrated Business Report for the year ended 31 December 2011220
4. the general authority shall be valid only until the Company’s next annual general meeting or 15 months from the date of passing of this special resolution, whichever is earlier;
5. a resolution by the board of directors that it authorises the repurchase, that the Company passes the solvency and liquidity test and that from the time that the test was performed there were no material changes to the financial position of the Group;
6. when the Company or a subsidiary of the Company has cumulatively repurchased 3% of any class of the Company’s shares in issue on the date of passing of this special resolution (the initial number), and for each 3% in aggregate of that class of shares acquired thereafter, in each case in terms of this resolution an announcement shall be published on SENS and in the press as soon as possible and not later than 08:30 on the second business day following the day on which the relevant threshold is reached or exceeded, and the announcement shall comply with the requirements of the JSE Listings Requirements in this regard;
7. that the Company or its subsidiaries may not repurchase any of the Company’s shares during a prohibited period as defined in the JSE Listings Requirements, unless they have in place a repurchase programme where the dates and quantities of securities to be traded during the relevant period are fixed (not subject to any variation) and full details of the programme have been disclosed in an announcement over SENS prior to the commencement of the prohibited period;
8. no repurchases may be made at a price which is greater than 10% above the weighted average of the market value for the securities for the five business days immediately preceding the date on which the transaction is effected (the maximum price). The JSE will be consulted for a ruling if the Company’s securities have not traded in such five-day period; and
9. if the Company enters into derivative transactions that may or will result in the repurchase of shares in terms of this general authority, such transactions will be subject to the requirements in paragraphs 2, 3, 4, 7 and 8 (subject to certain exceptions) above, and the following requirements:
(a) the strike price of any put option written by the Company less the value of the premium received by the Company for that put option may not be greater than the fair value of a forward agreement based on a spot price not greater than the maximum price in paragraph 9 above;
(b) the strike price and any call option may be greater than the maximum price in paragraph 9 at the time of entering into the derivative agreement, but the Company may not exercise the call option if it is more than 10% “out the money”; and
(c) the strike price of the forward agreement may be greater than the maximum price in paragraph 9 but limited to the fair value of a forward agreement calculated from a spot price not greater than such maximum price.
Notice of the seventeenth annual general meeting continued

MTN Group Limited Integrated Business Report for the year ended 31 December 2011221
Grou
p ov
ervi
ewPe
rform
ance
revi
ewOp
erat
iona
l and
fin
ancia
l rev
iew
Sust
aina
bilit
yFi
nanc
ial s
tate
men
tsSh
areh
olde
r inf
orm
atio
n
After considering the effects of such maximum repurchase: the Company and the Group will be able in the ordinary course of business to pay its debts for a period of 12 months after the date of the notice of the annual general meeting; the assets of the Company and the Group will be in excess of the liabilities of the Company and the Group for a period of 12 months after the date of the notice of the annual general meeting. For this purpose, the assets and liabilities should be recognised and measured in accordance with the accounting policies used in the latest audited group annual financial statements; the share capital and reserves of the Company and the Group will be adequate for ordinary business purposes for a period of 12 months after the date of the notice of the annual general meeting; and the working capital of the Company and the Group will be adequate for ordinary business purposes for a period of 12 months after the date of the notice of the annual general meeting.
For the purpose of considering the special resolution number 2 and in compliance with paragraph 11.26 of the JSE Listings Requirements, the information listed below has been included in the integrated business report, in which this notice of annual general meeting is included, at the places indicated:
directors and management – refer to pages 16 to 19 and pages 20 and 21 of this report;major shareholders – refer to page 207 of this report;directors’ interests in securities – refer to page 72 of this report;share capital of the Company – refer to page 141 of this report.
The directors, whose names are set out on pages 16 to 19 of this report, collectively and individually accept full responsibility for the accuracy of the information contained in this special resolution and certify that to the best of their knowledge and belief, there are no other facts, the omission of which would make any statement false or misleading, and that they have made all reasonable enquiries in this regard.
There are no legal or arbitration proceedings (including any such proceedings that are pending or threatened of which the Company is aware), which may have or have had a material effect on the Company’s financial position over the last 12 months.
At the date of completing this notice, being March 2012, there have been no material changes in the financial or trading position of the Company and its subsidiaries that have occurred since December 2011.
At the present time, the directors have no specific intention with regard to the utilisation of this authority, which will be used only if the circumstances are appropriate.
A general repurchase or purchase, as the case may be, of the Company’s shares shall only take place after the JSE has received written confirmation from the Company’s sponsor in respect of the directors’ working capital statement.
This authority includes an authority, by special resolution, to repurchase shares from a director or prescribed officer of the Company through the JSE’s order book, as required under section 48(8)(a) of the Companies Act.
MTN Group Limited Integrated Business Report for the year ended 31 December 2011222
3. SPECIAL RESOLUTION NUMBER 3: Financial assistance to subsidiaries and other related and inter-related entities and to directors, prescribed officers and other persons
participating in share or other employee incentive schemes
“Resolved that, to the extent required by the Companies Act, the board of directors of the Company may, subject to compliance with the requirements of the Company’s memorandum of incorporation, the Companies Act and the JSE Listings Requirements, each as presently constituted and as amended from time to time, authorise the Company to provide direct or indirect financial assistance by way of loan, guarantee, the provision of security or otherwise, to –
1. any of its present or future subsidiaries and/or any other company or entity that is or becomes related or inter-related to the Company or any of its subsidiaries, and/or to any member of such subsidiary or related or inter-related company or entity, for any purpose or in connection with any matter, including, but not limited to, the subscription of any option, or any securities issued or to be issued by the Company or a related or inter-related company or entity, or for the purchase of any securities of the Company or a related or inter-related company or entity; and/or
2. any of its present or future directors or prescribed officers (or any person related to any of them or to any company or entity related or inter-related to any of them), or to any other person who is a participant in any of the Company’s or Group’s share or other employee incentive schemes, for the purpose of, or in connection with, the subscription of any option, or any securities, issued or to be issued by the Company or a related or inter-related company, or for the purchase of any securities of the Company or a related or inter-related company or entity, where such financial assistance is provided in terms of any such scheme that does not satisfy the requirements of section 97 of the Act, such authority to endure until the forthcoming annual general meeting of the Company.”
VotingAll ordinary resolutions will, in terms of the Companies Act, require the support of more than 50% of the voting rights of shareholders exercised thereon to be approved.
In order for special resolution number 2 to be approved, the support of at least 75% of the votes cast by all equity securities holders present or represented by proxy at the annual general meeting convened to approve such resolution, is required in terms of the JSE Listings Requirements. The remaining special resolutions will, in terms of the Companies Act, require the support of at least 75% of the total voting rights exercised thereon at the meeting to be approved.
The directors of the Company decided in 2006 that in order to reflect more accurately the views of all shareholders and best practice, all resolutions and substantive decisions at the annual general meeting were to be put to a vote on a poll, rather than being determined simply on a show of hands. MTN Group has a large number of shareholders and it is not possible for them all to attend the meeting. In view of this and because voting on resolutions at annual general meetings of MTN Group is regarded as of high importance, putting all resolutions to a vote on a poll takes account of the wishes of those shareholders who are unable to attend the meeting in person, but who have completed a form of proxy. A vote on a poll also takes into account the number of shares held by each shareholder, which the board believes is a more democratic procedure. This year, all resolutions will again be proposed to be put to vote on a poll.
Voting at this year’s AGM will be undertaken electronically. An electronic voting handset will be distributed before the start of the meeting to all shareholders who attend in person and are eligible to vote. The registrars will identify each shareholder’s individual shareholding so that the number of votes that each shareholder has at the meeting will be linked to the number of votes which each shareholder will be able to exercise via the electronic handset. Shareholders who have completed and returned forms of proxy will not need to vote using a handset at the meeting unless they wish to change their vote.
ProxiesA shareholder entitled to attend and vote at the meeting is entitled to appoint a proxy to attend, participate in and vote at the meeting in the place of the shareholder. A proxy need not also be a shareholder of the Company.
Notice of the seventeenth annual general meeting continued

MTN Group Limited Integrated Business Report for the year ended 31 December 2011223
Grou
p ov
ervi
ewPe
rform
ance
revi
ewOp
erat
iona
l and
fin
ancia
l rev
iew
Sust
aina
bilit
yFi
nanc
ial s
tate
men
tsSh
areh
olde
r inf
orm
atio
n
A form of proxy, in which are set out the relevant instructions for its completion, is attached for use by certificated shareholders and dematerialised shareholders with “own name” registration of the Company who wish to appoint a proxy. The instrument appointing a proxy and the authority, if any, under which it is signed must be received by the Company or its South African transfer secretaries at the addresses given below by not later than 14:30 (South African time) on Friday, 25 May 2012.
All beneficial owners of shares who have dematerialised their shares through a CSDP or broker, other than those shareholders who have dematerialised their shares in “own name” registration, and all beneficial owners of shares who hold certificated shares through a nominee, must provide their CSDP, broker or nominee with their voting instructions. Voting instructions must reach the CSDP, broker or nominee in sufficient time and in accordance with the agreement between the beneficial owner and the CSDP, broker or nominee, as the case may be, to allow the CSDP, broker or nominee to carry out the instructions and lodge the requisite authority by 14:30 (South African time) on Friday, 25 May 2012.
Should such beneficial owners, however, wish to attend the meeting in person, they may do so by requesting their CSDP, broker or nominee to issue them with appropriate authority in terms of the agreement entered into between the beneficial owner and the CSDP, broker or nominee, as the case may be.
Shareholders who hold certificated shares in their own name and shareholders who have dematerialised their shares in “own name” registration must lodge their completed proxy forms at the registered office of the Company or with the Company’s South African transfer secretaries at the address below not later than 14:30 (South African time) on Friday, 25 May 2012.
By order of the board
SB MtshaliCompany secretaryMarch 2012
Business address and registered office216 – 14th AvenueFairland, 2195Private Bag X9955, Cresta, 2118
South African transfer secretariesComputershare Investor Services (Proprietary) LimitedRegistration number 2004/003647/0770 Marshall Street, Johannesburg, 2001PO Box 61051, Marshalltown, 2107Fax number: +27 11 688 5238
Shareholder communicationComputershare Investor Services (Proprietary) LimitedRegistration number 2004/003647/0770 Marshall Street, Johannesburg, 2001PO Box 61051, Marshalltown, 2107Toll-free: 0800 202 360Tel: +27 11 870 8206 (International)Fax number: +27 11 688 5238
MTN Group Limited Integrated Business Report for the year ended 31 December 2011224
For any assistance or information, please phone the MTN Group ShareCare Line on 0800 202 360 or on +27 11 870 8206 if you are phoning from outside South Africa.
Re-election of directors retiring by rotation at the annual general meeting – ordinary resolutions numbers 1.1 to 1.4The reason for the proposed ordinary resolutions numbers 1.1 to 1.4 is to elect, in accordance with article 84 of the memorandum of incorporation of the Company and by way of a series of votes, each of which is on the candidacy of a single individual to fill a single vacancy, as required under section 68(2) of the Companies Act, AP Harper, MLD Marole, NP Mageza and AF van Biljon as directors of the Company, them having retired by rotation in terms of the Company’s memorandum of incorporation and being eligible for re-election.
Biographical details of the retiring directors offering themselves for re-election are set out on pages 16 to 19.
Election of the audit committee – ordinary resolutions numbers 2.1 to 2.4In terms of the Companies Act, the audit committee is no longer a committee of the board but a committee elected by the shareholders at each annual general meeting.
In terms of the Regulations under the Companies Act, at least one-third of the members of the Company’s audit committee at any particular time must have academic qualifications, or experience, in economics, law, corporate governance, finance, accounting, commerce, industry, public affairs or human resource management.
Mindful of the foregoing, the nominations committee recommended to the board that the current members of the audit committee continue in such role to fulfil the duties prescribed in section 94(7) of the Companies Act and the board has approved such recommendations, subject to the elections being made by the shareholders, as proposed in ordinary resolutions numbers 2.1 to 2.4.
Approval of reappointment of joint external auditors – ordinary resolution number 3In compliance with section 90 of the Companies Act, PricewaterhouseCoopers Inc. and SizweNtsalubaGobodo Inc. are proposed to be reappointed as joint auditors for the financial year ending 31 December 2012 and until the conclusion of the next annual general meeting.
Authorising the directors to deal, as they in their discretion think fit, with the unissued ordinary shares, limited to 10% of shares in issue as at 31 December 2011, and the shares reserved for the Company’s share or other employee incentive schemes – ordinary resolution number 4 In terms of article 7 of the Company’s memorandum of incorporation, read with the JSE Listings Requirements, the members of the Company may authorise the directors to, inter alia, issue any unissued ordinary shares and/or grant options over them, as the directors in their discretion think fit.
The existing authority granted by the shareholders at the previous annual general meeting on 22 June 2011 is proposed to be renewed at this annual general meeting. The authority will be subject to the Companies Act and the JSE Listings Requirements, respectively. The aggregate number of ordinary shares able to be allotted and issued in terms of this resolution, other than in terms of the Company’s share or other employee incentive schemes, shall be limited to 10% of the number of ordinary shares in issue as at 31 December 2011.
The directors have decided to seek annual renewal of this authority in accordance with best practice. The directors have no current plans to make use of this authority, but wish to ensure, by having it in place, that the Company has the necessary flexibility in managing the Group’s capital resources and to enable the Company to take advantage of any business opportunity that may arise in the future.
Endorsement of remuneration philosophy (policy) – advisory voteIn terms of King III recommendations, every year, the Company’s remuneration policy should be tabled for a non-binding advisory vote at the annual general meeting. The essence of this endorsement is to enable the shareholders to express their views on the remuneration policies adopted in the remuneration of executive directors and on their implementation.
Accordingly, the shareholders are requested to endorse the Company’s remuneration policy as recommended by King III on page 60.
Explanatory notes to resolutions proposed at the seventeenth annual general meeting of the Company

MTN Group Limited Integrated Business Report for the year ended 31 December 2011225
Grou
p ov
ervi
ewPe
rform
ance
revi
ewOp
erat
iona
l and
fin
ancia
l rev
iew
Sust
aina
bilit
yFi
nanc
ial s
tate
men
tsSh
areh
olde
r inf
orm
atio
n
Remuneration payable to non-executive directors – special resolution number 1 In terms of paragraphs 15.1 and 15.2, read with paragraph 15.5, of the Board Charter, the board will determine the level of remuneration paid to members within any limitations imposed by shareholders. Levels and make-up of remuneration should be sufficient to attract and retain the right calibre of members needed to run the Company successfully, but the Company should avoid paying more than is necessary for this purpose. The board will review remuneration annually after taking independent advice and no director will be involved in deciding his own remuneration.
In terms of sections 66(8) and (9) of the Companies Act, which took effect on 1 May 2011, remuneration may only be paid to directors for their service as directors in accordance with a special resolution approved by the shareholders within the previous two years and if not prohibited in terms of a company’s memorandum of incorporation. In terms of article 73(b) of the Company’s memorandum of incorporation, directors shall be entitled to such remuneration as directors as may be determined by the Company in a general meeting by an ordinary resolution, save that any director holding office for less than a year shall only be entitled to such remuneration in proportion to the period during which he has held office during such year. Although the Company has been advised that, in terms of the transitional provisions of the Companies Act, article 73(b) of the memorandum of incorporation could possibly prevail in the interim in respect of this apparent conflict between such article and the Companies Act, the board of directors nonetheless wishes to comply with the provisions of the Companies Act and as such the resolution is proposed as a special resolution.
The last increase was approved on 22 June 2011. Full particulars of remuneration paid to non-executive directors for the financial year ended 31 December 2011 are set out on page 64 and the proposed revised fees to be effective from 29 May 2012 being tabled for approval are set out in special resolution number 1. General authority for the Company and/or a subsidiary of the Company to repurchase or purchase, as the case may be, shares in the Company – special resolution number 2The existing general authority for the Company and/or a subsidiary thereof to repurchase or purchase, as the case may be, shares in the Company, granted by shareholders at the previous annual general meeting on 22 June 2011, is due to expire at this annual general meeting, unless renewed.
The directors are of the opinion that it would be in the best interests of the Company to extend such general authority and thereby allow the Company or any subsidiary of the Company to be in a position to repurchase or purchase, as the case may be, the shares issued by the Company through the order book of the JSE, should the market conditions and price justify such action.
Repurchases or purchases, as the case may be, will be made only after careful consideration, where the directors believe that an increase in earnings per share will result and where repurchases or purchases, as the case may be, are, in the opinion of the directors, in the best interests of the Company and its shareholders.
This general approval shall be valid until the earlier of the next annual general meeting of the Company, or the variation or revocation of such general authority by a special resolution passed at any subsequent general meeting of the Company, provided that the general authority shall not be extended beyond 15 months from the date of passing the special resolution.
General authority for the Company to provide financial assistance to its subsidiaries and other related and inter-related companies and entities and to directors, prescribed officers and other persons participating in share or other employee incentive schemes – special resolution number 3Notwithstanding the title of section 45 of the Companies Act, being “Loans or other financial assistance to directors”, on a proper interpretation, the body of the section may also apply to financial assistance provided by a company to related or inter-related companies and entities, and members thereof, including, inter alia, its subsidiaries, for any purpose.
Furthermore, section 44 of the Companies Act may also apply to the financial assistance so provided by a company to related or inter-related companies, in the event that the financial assistance is provided for the purpose of, or in connection with, the subscription of any option, or any securities, issued or to be issued by the Company or a related or inter-related company, or for the purchase of any securities of the Company or a related or inter-related company.

MTN Group Limited Integrated Business Report for the year ended 31 December 2011226
Both sections 44 and 45 of the Companies Act provide, inter alia, that the particular financial assistance must be provided only pursuant to a special resolution of the shareholders, adopted within the previous two years, which approved such assistance either for the specific recipient, or generally for a category of potential recipients, and the specific recipient falls within that category and the board of directors must be satisfied that –
(a) immediately after providing the financial assistance, the Company would satisfy the solvency and liquidity test; and
(b) the terms under which the financial assistance is proposed to be given are fair and reasonable to the Company.
MTN Group, when the need previously arose, had to provide loans to and guarantee loans or other obligations of subsidiaries and was not precluded from doing so in terms of its articles of association or in terms of the Companies Act, 61 of 1973, as amended. MTN Group would like the ability to provide financial assistance, if necessary, also in other circumstances, in accordance with section 45 of the Companies Act. Furthermore, it may be necessary or desirous for MTN Group to provide financial assistance to related or inter-related companies and entities to subscribe for options or securities or purchase securities of MTN Group or another entity related or inter-related to it. Under the Companies Act, MTN Group will, however, require the special resolution referred to above to be adopted. In the circumstances and in order to, inter alia, ensure that MTN Group’s subsidiaries and other related and inter-related companies and entities have access to financing and/or financial backing from MTN Group (as opposed to banks), it is necessary to obtain the approval of shareholders, as set out in special resolution number 3.
Sections 44 and 45 contain exemptions in respect of employee share schemes that satisfy the requirements of section 97 of the Companies Act. To the extent that any of the Company’s or the Group’s share or other employee incentive schemes do not satisfy such requirements, financial assistance (as contemplated in sections 44 and 45) to be provided under such schemes will, inter alia, also require approval by special resolution. Accordingly, special resolution number 3 authorises financial assistance to any of MTN Group’s directors or prescribed officers (or any person related to any of them or to any company or corporation related or inter-related to them), or to any other person who is a participant in any of the Company’s or the Group’s share or other employee incentive schemes, in order to facilitate their participation in any such schemes that do not satisfy the requirements of section 97 of the Companies Act.
Voting and proxies1. Every holder of shares present in person or by proxy at the meeting, or, in the case of a body corporate represented at the meeting, shall be entitled
to one vote on a show of hands and on a poll shall be entitled to one vote for every share held.
2. A shareholder (including certificated shareholders and dematerialised shareholders who hold their shares with “own name” registration) entitled to attend and vote at the meeting may appoint one or more proxies to attend, participate and vote in his/her/its stead. A proxy does not have to be a shareholder of the Company. The appointment of a proxy will not preclude the shareholder who appointed that proxy from attending the annual general meeting and participating and voting in person thereat to the exclusion of any such proxy. A form of proxy for use at the meeting is attached.
3. The attached form of proxy is provided to shareholders for their convenience. Shareholders are not obliged to use the attached form, and may appoint a proxy in writing under Section 58 of the Companies Act. A summary of the provisions of this section is included in the appendix to the notice of the AGM.
4. It is requested that completed proxy forms or powers of attorney must be lodged at the registered offices of the Company or with the Company’s South African transfer secretaries, Computershare, at 70 Marshall Street, Johannesburg, 2001 (PO Box 61051, Marshalltown, 2107), not less than 48 hours before the time appointed for holding the meeting. As the meeting is to be held at 14:30 (South African time) on Tuesday, 29 May 2012, proxy forms or powers of attorney must be lodged on or before 14:30 (South African time) on Friday, 25 May 2012. The name and address of the South African transfer secretaries are given on the back of the proxy form.
5. The attention of shareholders is directed to the additional notes relating to the form of proxy attached, which notes are set out in the proxy form.
6. Dematerialised shareholders, other than dematerialised shareholders who hold their shares with “own name” registration, who wish to attend the annual general meeting must contact their CSDP or broker who will furnish them with the necessary authority to attend the annual general meeting, or they must instruct their CSDP or broker as to how they wish to vote in this regard. This must be done in terms of the agreement entered into between such shareholder and its CSDP or broker.
Explanatory notes to resolutions proposed at the seventeenth annual general meeting of the Company continued

MTN Group Limited Integrated Business Report for the year ended 31 December 2011227
Grou
p ov
ervi
ewPe
rform
ance
revi
ewOp
erat
iona
l and
fin
ancia
l rev
iew
Sust
aina
bilit
yFi
nanc
ial s
tate
men
tsSh
areh
olde
r inf
orm
atio
n
Important notes about the annual general meeting (AGM)
Tuesday, 29 May 2012, at 14:30 (South African time)
The Auditorium, Phase II, Level, 0 216 – 14th Avenue, Fairland, Gauteng
The AGM will start promptly at 14:30 (South African time)
Shareholders wishing to attend are advised to be in the auditorium by not later than 14:00. The meeting will commence with a short information session, informing shareholders of the electronic voting process to be utilised at the meeting. Staff will direct shareholders to the AGM. Refreshments will be served after the meeting.
: Shareholders attending the AGM are asked to register at the registration desk in the auditorium reception area at the venue. Meeting participants (including proxies) are required to provide reasonably satisfactory identification before being entitled to attend or participate in the meeting.
Secured parking is provided at the venue at owner’s own risk. Mobile telephones should be switched off for the duration of the proceedings.
Please note
Shareholders wishing to attend the AGM have to ensure beforehand with the transfer secretaries of the Company that their shares are in fact registered in their names. Should this not be the case and the shares be registered in any other name or in the name of a nominee company, it is incumbent on shareholders attending the meeting to make the necessary arrangements with that party to be able to attend and vote in their personal capacity. The proxy form contains detailed instructions in this regard.
Any shareholders having difficulties or queries in regard to the AGM or the above are invited to contact the Group Secretary, SB Mtshali, on +27 (0) 11 912 4067 or the ShareCare Line on 0800 202 360 or +27 (0) 11 870 8206 if phoning from outside South Africa. Calls will be monitored for quality control purposes and customer safety.
The results of the annual general meeting will be posted on SENS as soon as practically possible after the AGM.
Appendix to the notice of annual general meeting

MTN Group Limited Integrated Business Report for the year ended 31 December 2011228
2011 2010
Closing price (cents per share) as 31 December 13 342Highest price (cents per share) 13 245Lowest price (cents per share) 9 822Total number of shares traded (million) 1 786Total value of shares traded (Rm) 174 683Number of issued shares 1 885Number of shares traded as a percentage of issued shares (%) 94,8Number of transactions 1 113 502Average weighted trading price (cents per share) 9 778Average telecommunication index 56 472Average industrial index 26 527Average mobile index 223 188Dividend yield (%) 2,6Earnings yield (%) (headline earnings) 6,9Price-earnings multiple (adjusted headline earnings) 15As at 31 DecemberMarket capitalisation as at 31 December (Rb) 253
Stock exchange performance

MTN Group Limited Integrated Business Report for the year ended 31 December 2011229
Grou
p ov
ervi
ewPe
rform
ance
revi
ewOp
erat
iona
l and
fin
ancia
l rev
iew
Sust
aina
bilit
yFi
nanc
ial s
tate
men
tsSh
areh
olde
r inf
orm
atio
n
Annual general meeting 29 May 2012
ReportsDividend declaration 6 March 2012Summarised annual financial results published 7 March 2012Annual financial statements posted 23 April�2012Interim financial statements 7 August 2012Financial year-end 31 December 2012
Please note that these dates are subject to alteration.
Shareholders’ diary

MTN Group Limited Integrated Business Report for the year ended 31 December 2011230
Company registration number1994/009584/06ISIN code: ZAE 000042164Share code: MTNMTN Group ShareCare lineToll-free: 0800 202 360 or +27 11 870 8206if phoning from outside South Africa
Board of directorsMC Ramaphosa *** JHN Strydom**RS Dabengwa* AF van Biljon***KP Kalyan*** J van Rooyen***AT Mikati†** MLD Marole***NI Patel * NP Mageza***MJN Njeke*** A Harper#*** † Lebanese # British * Executive ** Non-executive*** Independent non-executive director
Group secretarySB MtshaliPrivate Bag X9955, Cresta, 2118Registered office 216 14th Avenue Fairland Gauteng, 2195
American Depository Receipt (ADR)ProgrammeCusip No. 62474M108 ADR to ordinaryShare 1:1
Depository: The Bank of New York101 Barclay Street, New York NY. 10286,USA
Administration
Office of the transfer secretariesComputershare Investor Services (Proprietary) LimitedRegistration number 2004/003647/0770 Marshall Street, MarshalltownJohannesburg, 2001PO Box 61051, Marshalltown, 2107
Joint auditorsPricewaterhouseCoopers Inc.2 Eglin Road, Sunninghill, 2157Private Bag X36, Sunninghill, 2157SizweNtsalubaGobodo Inc. 1 Woodmead Drive, Woodmead EstateWoodmead, 2157PO Box 2939, Saxonwold, 2132
SponsorDeutsche Securities (SA) (Proprietary) Limited3 Exchange Square, 87 Maude Street, Sandton, 2196
AttorneysWebber Wentzel Bowens10 Fricker Road, Illovo Boulevard, Sandton, 2107PO Box 61771, Marshalltown, 2107
Contact detailsTelephone: National 011 912 3000International +27 11 912 3000Facsimile: National 011 912 4093International +27 11 912 4093Email: [email protected]: http:/www.mtn.com

MTN Group Limited Integrated Business Report for the year ended 31 December 2011231
Grou
p ov
ervi
ewPe
rform
ance
revi
ewOp
erat
iona
l and
fin
ancia
l rev
iew
Sust
aina
bilit
yFi
nanc
ial s
tate
men
tsSh
areh
olde
r inf
orm
atio
n
Form of proxyTo be completed by certificated shareholders and dematerialised shareholders with “own name” registration onlyMTN Group limited(Incorporated in the Republic of South Africa)(Registration number: 1994/009584/06)(MTN Group or the Company)JSE code: MTNISIN: ZAE 000042164
For use at the annual general meeting to be held at 14:30 (South African time) on Tuesday, 29 May 2012, in the Auditorium, Phase II, Level 0, 216 – 14th Avenue, Fairland, Gauteng. For assistance in completing the proxy form, please phone the MTN Group ShareCare Line on 0800 202 360 or on +27 11 870 8206 if you are phoning from outside South Africa. A shareholder entitled to attend and vote at the annual general meeting may appoint one or more proxies to attend, vote and speak in his/her/its stead at the annual general meeting. A proxy need not be a shareholder of the Company.
I/We ………………………………………………………………………………………………………………………………………………………………(names in block letter)
of (address)………………………………………………………………………………………………………………………………………………………………………………
being a shareholder(s) of the Company, and entitled to vote, do hereby appoint………………………………………………………………………………………………………of
………………………………………………………………………………………………………………………………………………………………………… . . or failing him/her,
………………………………………………………………………………………of………………………………………………………………………………… or failing him/her, the chairperson of the annual general meeting, as my/our proxy to represent me/us at the annual general meeting to be held at 14:30 (South African time) on Tuesday, 29 May 2012, in the Auditorium, Phase II, level 0, 216 – 14th Avenue, Fairland, Gauteng, for the purposes of considering and, if deemed fit, passing, with or without modification, the resolutions to be proposed thereat and at each adjournment or postponement thereof, and to vote for and/or against the resolutions and/or abstain from voting in respect of the shares in the issued share capital of the Company registered in my/our name (see note 2 overleaf ) as follows:
ORDINARY RESOLUTIONS For Against Abstain1 Ordinary resolution number 1.1: Re-election of AP Harper as a director2 Ordinary resolution number 1.2: Re-election of MLD Marole as a director3 Ordinary resolution number 1.3: Re-election of NP Mageza as a director4 Ordinary resolution number 1.4: Re-election of AF van Biljon as a director5 Ordinary resolution number 2.1: To elect AF van Biljon as a member and chairperson of the audit committee6 Ordinary resolution number 2.2: To elect J van Rooyen as a member of the audit committee7 Ordinary resolution number 2.3: To elect NP Mageza as a member of the audit committee8 Ordinary resolution number 2.4: To elect MJN Njeke as a member of the audit committee 9 Ordinary resolution number 3: Reappointment of joint independent auditors
10 Ordinary resolution number 4: To authorise the directors to allot and issue all unissued ordinary shares of 0,01 cent in the share capital of the Company (subject to a maximum of 10% of the issued shares and the further limits in the resolution)
11 Advisory endorsement: Endorsement of the remuneration philosophy (policy)SPECIAL RESOLUTIONS12 Special resolution number 1: To approve the remuneration payable to non-executive directors13 Special resolution number 2:
To approve an authority for the Company and/or any of its subsidiaries to repurchase or purchase, as the case may be, shares in the Company14 Special resolution number 3: To approve the granting of financial assistance by the Company to its subsidiaries and other related
and inter-related companies and corporations and to directors, prescribed officers and other persons participating in share or other employee incentive schemes. Please indicate with an ‘X’ in the appropriate spaces provided above how you wish your vote to be cast. If no indication is given, the proxy will be entitled to vote or abstain as he/she deems fit.
Please read the notes on the reverse side hereof.
Signed at …………………………………………………………………………………………………….on …………………………………………………………………2012
Full name(s)………………………………………………………………………………………………………………………………………………………………(in block letters)
Signature(s)……………………………………………………..……………………………..……………………………………………………..……………………………………
Assisted by (guardian) )……………………………………………………..……………………………………………………………date………..…………………………………
If signing in a representative capacity, see note below.

MTN Group Limited Integrated Business Report for the year ended 31 December 2011232
Notes to proxy
1. Only shareholders who are registered in the register or sub-register of the Company under their own name may complete a proxy or alternatively attend the meeting. Beneficial owners who are not the registered holder and who wish to attend the meeting in person may do so by requesting the registered holder, being their Central Security Depository Participant (CSDP), broker or nominee, to issue them with a letter of representation in terms of the custody agreements entered into with the registered holder. Letters of representation must be lodged with the Company’s registrars by no later than 14:30 on Friday, 25 May 2012.
2. Beneficial owners who are not the registered holder and who do not wish to attend the meeting in person must provide the registered holder, being the CSDP, broker or nominee, with their voting instructions. The voting instructions must reach the registered holder in sufficient time to allow the registered holder to advise the Company or the Company’s registrar of their instructions by no later than 14:30 on Friday, 25 May 2012.
3. A shareholder may insert the name of a proxy or the names of two alternative proxies of his/her/its choice in the space/s provided, with or without deleting “the chairperson of the general meeting”, but any such deletion or insertion must be initialled by the shareholder. Any insertion or deletion not complying with the foregoing will be declared not to have been validly effected. The person whose name stands first on the proxy form and who is present at the general meeting will be entitled to act as proxy to the exclusion of those whose names follow. In the event that no names are indicated, the proxy shall be exercised by the chairperson of the general meeting.
4. A shareholder’s instructions to the proxy must be indicated by the insertion of an “X” or the relevant number of votes exercisable by that shareholder in the appropriate box provided. An “X” in the appropriate box indicates the maximum number of votes exercisable by that shareholder. Failure to comply with the above will be deemed to authorise the proxy to vote or to abstain from voting at the annual general meeting as he/she/it deems fit in respect of the entire shareholder’s votes exercisable thereat. A shareholder or his/her proxy is not obliged to use all the votes exercisable by the shareholder or by his/her/its proxy, but the total of the votes cast and in respect of which abstention is recorded, may not exceed the maximum number of votes exercisable by the shareholder or by his/her proxy.
5. The proxy shall (unless this sentence is struck out and countersigned) have the authority to vote, as he/she deems fit, on any other resolution which may validly be proposed at the meeting, including in respect of any proposed amendment to the above resolutions. If the aforegoing sentence is struck out, the proxy shall be deemed to be instructed to vote against any such proposed additional resolution and/or proposed amendment to an existing resolution as proposed in the notice to which this form is attached.
6. To be effective, completed proxy forms must be lodged with the Company at its registered address or at the Company’s South African transfer secretaries at the address stipulated below, not less than 48 hours before the time appointed for the holding of the meeting, in accordance with article 70 of the Company’s memorandum of incorporation. As the meeting is to be held at 14:30 on Tuesday, 29 May 2012, proxy forms must be lodged on or before 14:30 on Friday, 25 May 2012.
7. The completion and lodging of this proxy form will not preclude the relevant shareholder from attending the annual general meeting and speaking and voting in person thereat instead of any proxy appointed in terms hereof.
8. The chairperson of the general meeting may reject or accept any proxy form which is completed and/or received other than in compliance with these notes.
9. Any alteration to this proxy form, other than a deletion of alternatives, must be initialled by the signatory.10. Documentary evidence establishing the authority of a person signing this proxy form in a representative or other legal capacity must be attached
to this proxy form, unless previously recorded by the Company or the registrars or waived by the chairperson of the annual general meeting.11. Where there are joint holders of shares: 11.1 any one holder may sign the proxy form; and 11.2 the vote of the senior shareholder (for which purpose seniority will be determined by the order in which the names of the shareholders
appear in the Company’s register) who tenders a vote (whether in person or by proxy) will be accepted to the exclusion of the vote(s) of the other joint shareholders.
12. A minor must be assisted by his/her parent or legal guardian, unless the relevant documents establishing his/her legal capacity are produced or have been registered by the transfer secretaries.
13. A proxy may not delegate his/her authority to act on behalf of the shareholder to another person.
Office of the South African transfer secretariesComputershare Investor Services (Proprietary) LimitedRegistration number 2004/003647/0770 Marshall Street, Johannesburg, 2001, PO Box 61051, Marshalltown, 2107, Fax number: +27 11 668 5238
Shareholders are encouraged to make use of the toll-free ShareCare line for assistance in completing the proxy form and any other queries.If you have any questions regarding the contents of this report,
please call the MTN Group toll-free ShareCare line on 0800 202 360(or +27 11 870 8206 if phoning from outside South Africa)
Please note that your call will be recorded for customer safety.

Map
MTN Innovation Centre
BASTION GRAPHICS


![INDEX [] Company Profile-2019_v2.pdf · 2015–MTN Wi-Fi 2015–MTN Network Upgrade 2015–MTN Managed Services 2016-VDC Site Maintenance 2017–Huawei MTN ... - Battery Rundown Tests](https://img.dokumen.tips/doc/110x75/5e2c34df1f19803daa225a55/index-company-profile-2019v2pdf-2015amtn-wi-fi-2015amtn-network-upgrade.jpg)