Embed Size (px)
Citation preview
Automated Spatial Data Analysis and
Information Modeling for Construction and
Infrastructure Management
Pingbo Tang, Ph. D.
Assistant Professor
Del E. Webb School of Construction
Adaptive Intelligent Materials & Systems Center
Ira A. Fulton Schools of Engineering
Arizona State University
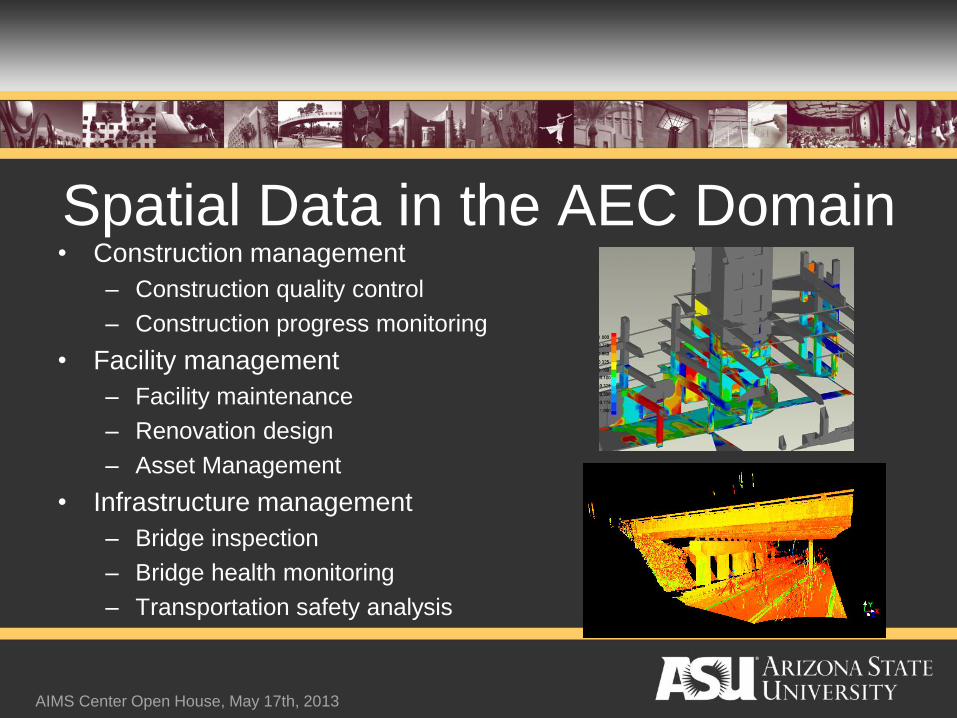
• Construction management
– Construction quality control
– Construction progress monitoring
• Facility management
– Facility maintenance
– Renovation design
– Asset Management
• Infrastructure management
– Bridge inspection
– Bridge health monitoring
– Transportation safety analysis
Spatial Data in the AEC Domain
AIMS Center Open House, May 17th, 2013
• Manual spatial data collection, processing and interpretation– Data collection: Manually decide when and where to collect
data, use what kind of instruments (camera? Total station? Laser scanner?), and how to configure them (resolution? data collection rate?)
– Data processing: Manually extract geometric primitives and texture information from the data, obtain geometric attributes of geometric primitives
– Data interpretation: Recognize objects, calculate particular attributes related to the status of objects, and derive information for decision makers (spatial-temporal clashes, etc.)
Bottlenecks and Motivations
AIMS Center Open House, May 17th, 2013
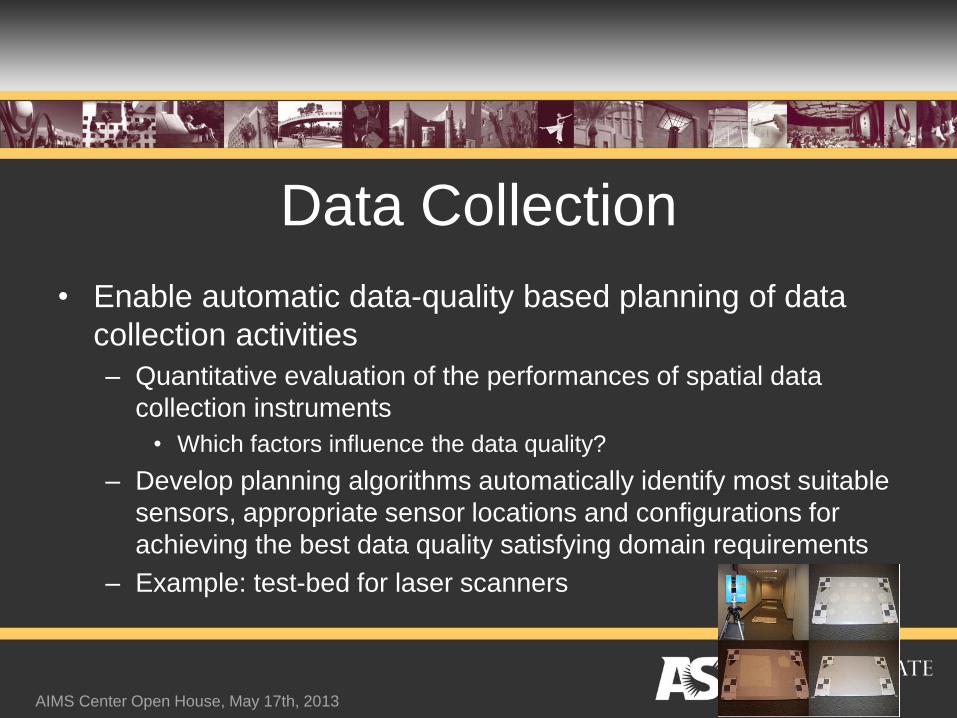
• Enable automatic data-quality based planning of data
collection activities
– Quantitative evaluation of the performances of spatial data
collection instruments
• Which factors influence the data quality?
– Develop planning algorithms automatically identify most suitable
sensors, appropriate sensor locations and configurations for
achieving the best data quality satisfying domain requirements
– Example: test-bed for laser scanners
Data Collection
AIMS Center Open House, May 17th, 2013

Data Processing: Automatic Measurements
Define and Execute Workflows on Point Clouds for
Extracting Surveying Goals
Define a work flow using a template (or based on predefined workflows)
Execute the workflow and report results
User-defined work flows
Point cloud
A user-defined workflow
AIMS Center Open House, May 17th, 2013
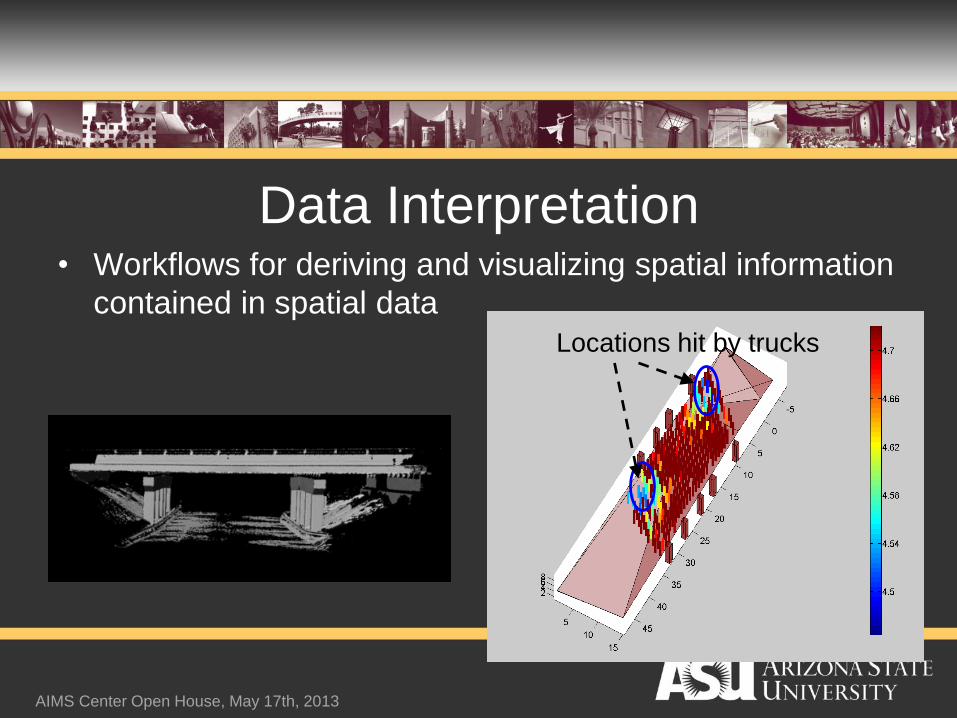
• Workflows for deriving and visualizing spatial information
contained in spatial data
Data Interpretation
Locations hit by trucks
AIMS Center Open House, May 17th, 2013
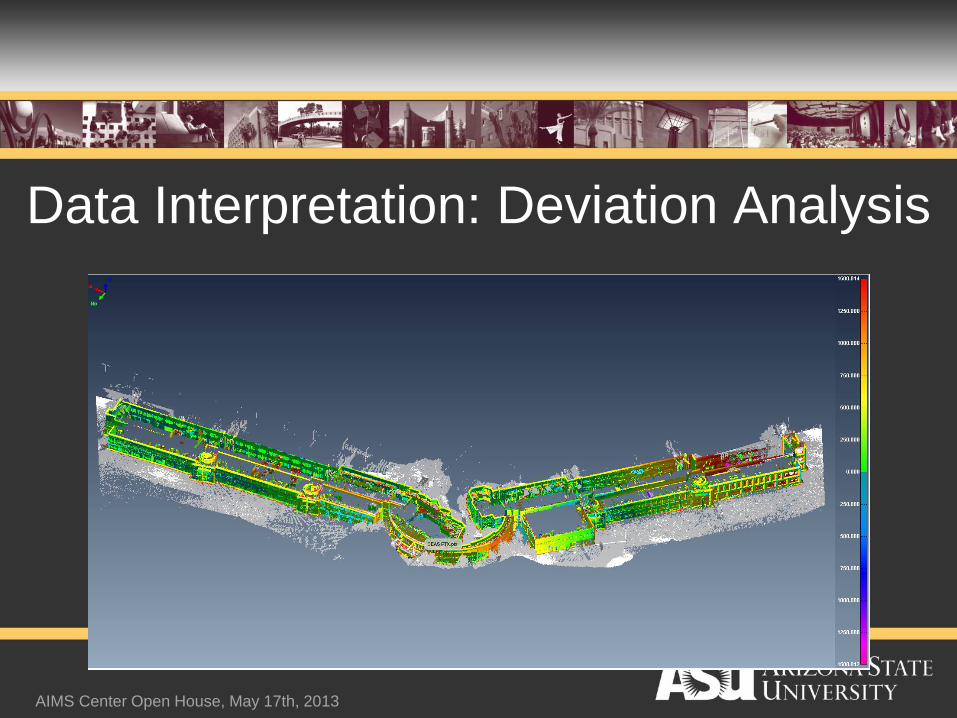
Data Interpretation: Deviation Analysis
AIMS Center Open House, May 17th, 2013
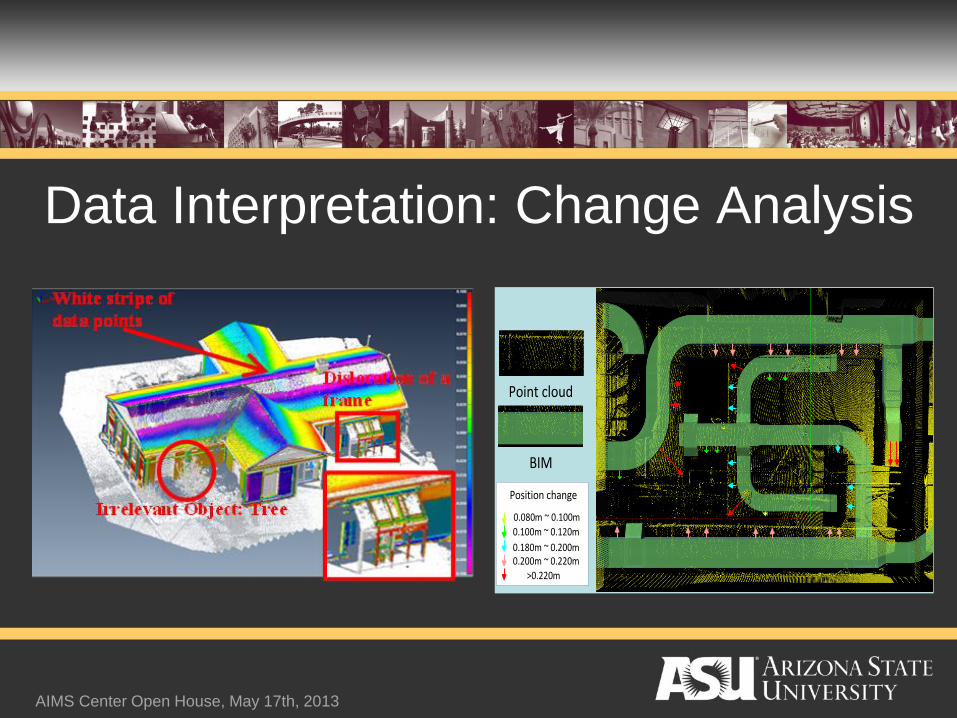
0.100m ~ 0.120m
0.080m ~ 0.100m
0.200m ~ 0.220m
>0.220m
0.180m ~ 0.200m
Position change
BIM
Point cloud
Data Interpretation: Change Analysis
AIMS Center Open House, May 17th, 2013
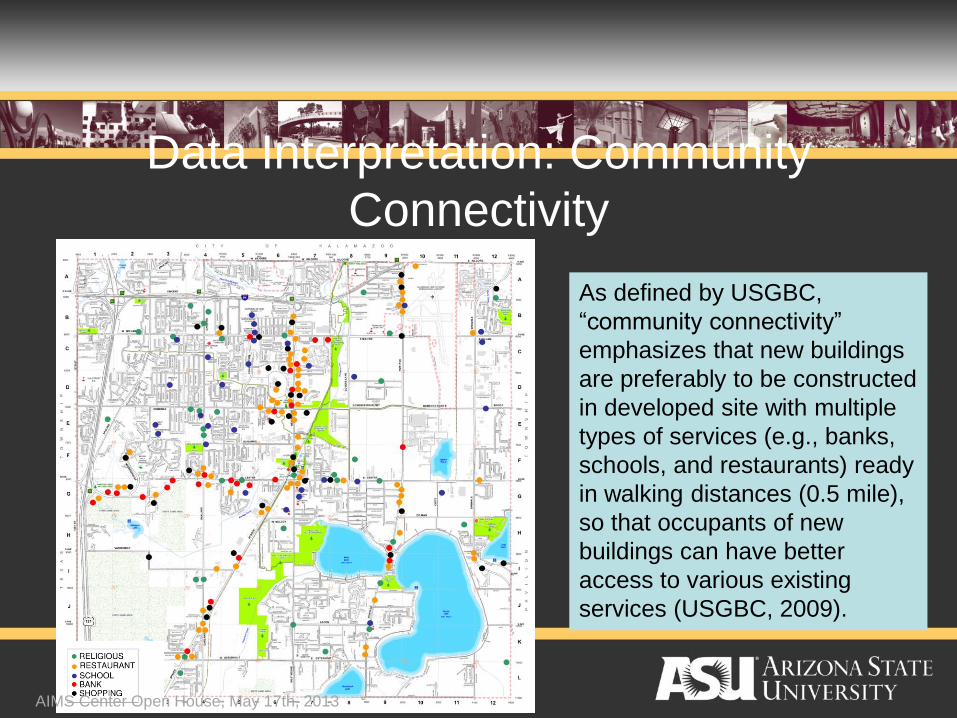
Data Interpretation: Community
Connectivity
As defined by USGBC,
“community connectivity”
emphasizes that new buildings
are preferably to be constructed
in developed site with multiple
types of services (e.g., banks,
schools, and restaurants) ready
in walking distances (0.5 mile),
so that occupants of new
buildings can have better
access to various existing
services (USGBC, 2009).
AIMS Center Open House, May 17th, 2013
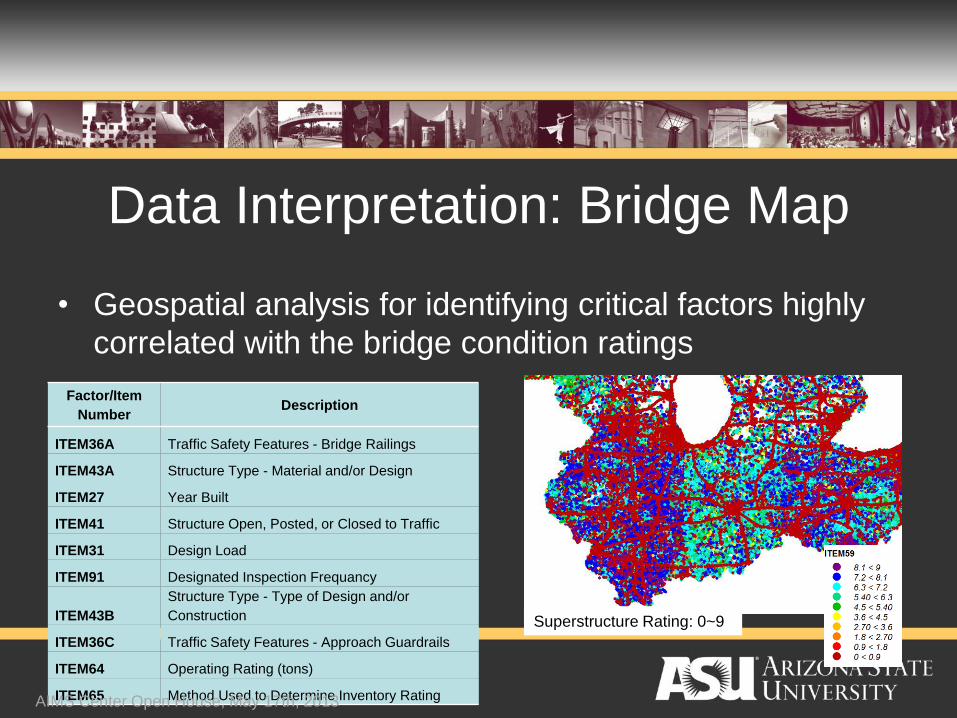
• Geospatial analysis for identifying critical factors highly
correlated with the bridge condition ratings
Data Interpretation: Bridge Map
Superstructure Rating: 0~9
Factor/Item
NumberDescription
ITEM36A Traffic Safety Features - Bridge Railings
ITEM43A Structure Type - Material and/or Design
ITEM27 Year Built
ITEM41 Structure Open, Posted, or Closed to Traffic
ITEM31 Design Load
ITEM91 Designated Inspection Frequancy
ITEM43B
Structure Type - Type of Design and/or
Construction
ITEM36C Traffic Safety Features - Approach Guardrails
ITEM64 Operating Rating (tons)
ITEM65 Method Used to Determine Inventory RatingAIMS Center Open House, May 17th, 2013
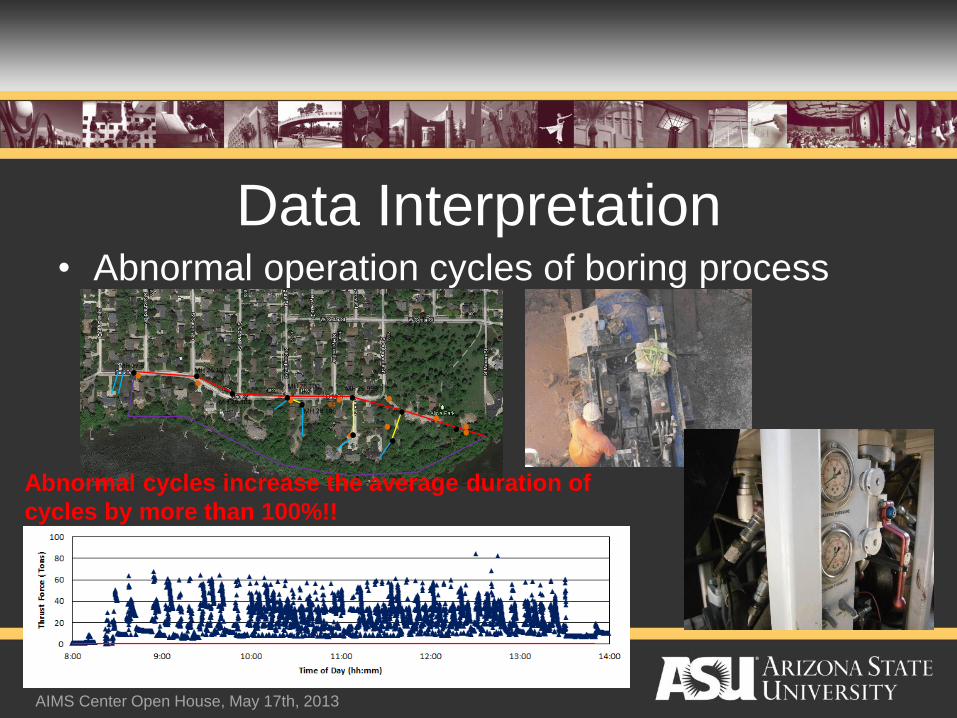
Data Interpretation• Abnormal operation cycles of boring process
AIMS Center Open House, May 17th, 2013
B1 B2
B3
MH 27.3 MH 26.102
MH 26.101
MH 26.100 MH 26.99B
MH 26.106 B4
Abnormal cycles increase the average duration of
cycles by more than 100%!!
• Spatial change analysis for construction productivity analysis, safety
management, and quality control
• Quality assessment and quality control (QA/QC) of Building Information
Model (BIM) and spatial data
• Geospatial correlation analysis of National Bridge Inventory (NBI) database
• Remote sensing for bridge health monitoring and scour evaluation
• Sustainability analysis of transportation systems
• VANET for real-time spatial information distribution to avoid potential
transportation risks and jams
Other Current Efforts
AIMS Center Open House, May 17th, 2013