Embed Size (px)
Citation preview
8/12/2019 Auto and Auto Ancillaries December20091
http://slidepdf.com/reader/full/auto-and-auto-ancillaries-december20091 1/66
CII SR Quarterly Update
Auto Auto Components
1
CII Southern Region
Industry and Economic Update
Auto & Auto Components
October-December 2009
8/12/2019 Auto and Auto Ancillaries December20091
http://slidepdf.com/reader/full/auto-and-auto-ancillaries-december20091 2/66
CII SR Quarterly Update
Auto Auto Components
2
TABLE OF CONTENTS
INDUSTRY UPDATE....................................................................................................................... 3 AUTO AND AUTO COMPONENTS INDUSTRY IN INDIA ...................................................................................... 3 PRODUCT CATEGORIES OF THE AUTO COMPONENTS SEGMENT ........................................................................ 4 AUTO AND AUTO COMPONENTS MARKET IN SOUTH INDIA .............................................................................. 5
RECENT DEVELOPMENTS .............................................................................................................. 8 AUTOMOTIVES ........................................................................................................................................ 8 AUTO COMPONENTS ................................................................................................................................ 9
PRODUCTION AND CONSUMPTION ............................................................................................ 10 PRODUCTION ........................................................................................................................................ 10 DOMESTIC SALES ................................................................................................................................... 12 4W—RECENT TRENDS ........................................................................................................................... 14 TWO WHEELERS—RECENT TRENDS .......................................................................................................... 20 COMMERCIAL VEHICLES—RECENT TRENDS ................................................................................................ 26 DOMESTIC SALES TRENDS FOLLOW A CYCLICAL PATTERN .............................................................................. 37 EXPORTS .............................................................................................................................................. 43
INVESTMENTS............................................................................................................................ 47
KEY INVESTMENTS IN SOUTHERN INDIA ...................................................................................................... 47 NATIONAL PLANNED PROJECTS ................................................................................................................ 52
POLICY AND REGULATIONS ........................................................................................................ 53 POLICY INITIATIVES ................................................................................................................................. 53
REVIEW OF FINANCIAL PERFORMANCE ....................................................................................... 53 AUTOMOTIVE SECTOR ............................................................................................................................ 53 AUTO ANCILLARIES/COMPONENTS SECTOR ................................................................................................ 59
PRIMARY SURVEY CONCLUSIONS ............................................................................................... 64
INDUSTRY OUTLOOK .................................................................................................................. 64
8/12/2019 Auto and Auto Ancillaries December20091
http://slidepdf.com/reader/full/auto-and-auto-ancillaries-december20091 3/66
CII SR Quarterly Update
Auto Auto Components
3
INDUSTRY UPDATE
Auto and Auto Components Indus t ry in Ind ia
Auto and its ancillary industry is one of the key sectors in the Indian economy. The auto industry canbe broadly divided in four sub sectors: (a) Four Wheelers (4W) (b) Two wheelers or 2Ws (c)
Commercial vehicles and (d) Three wheelers (3W). The two wheeler (2W) segment analysed for the
purpose of this report includes scooters, motorcycles, and mopeds. Commercial Vehicles (CVs) are an
important source of transportation of both goods and passengers. CV comprises medium and heavy
commercial vehicles (MHCVs), mainly buses and trucks; and light commercial vehicles (LCVs), mainly
tempos and light transport vehicles.
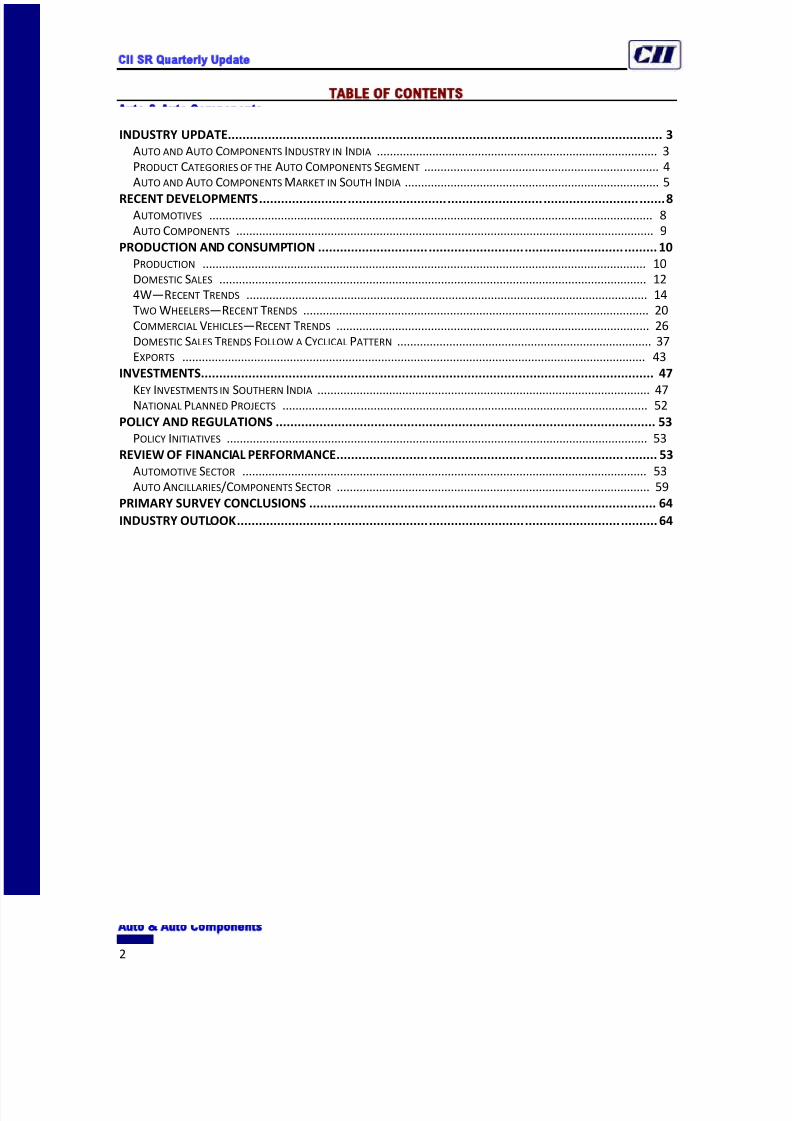
Domestic Market Share in 9MFY2010 (April-December)
Source: SIAM, IMaCS Analysis
2Ws, being the most popular means of personal transport, alone account for about 77% of the total
automobile production in India, while passenger vehicles (PVs) account for over 15% of the sales.
However, owing to their lower sales realisations, two wheelers account for only around 32% of the
sales in terms of value while PVs account for around 62% of the same.
Four
Wheelers
15%
CVs
4%
2Ws
77%
Three Wheelers
4%
8/12/2019 Auto and Auto Ancillaries December20091
http://slidepdf.com/reader/full/auto-and-auto-ancillaries-december20091 4/66
CII SR Quarterly Update
Auto Auto Components
4
Automobile Segment Product Categories
Source: SIAM, IMaCS analysis
In terms of actual production, a total of around 11.2 million automobiles were produced in FY2009,
leading to sales of over Rs. 1,200 billion1 in FY2009
2. The production and sales trends for each
category in detail are discussed later in the report.
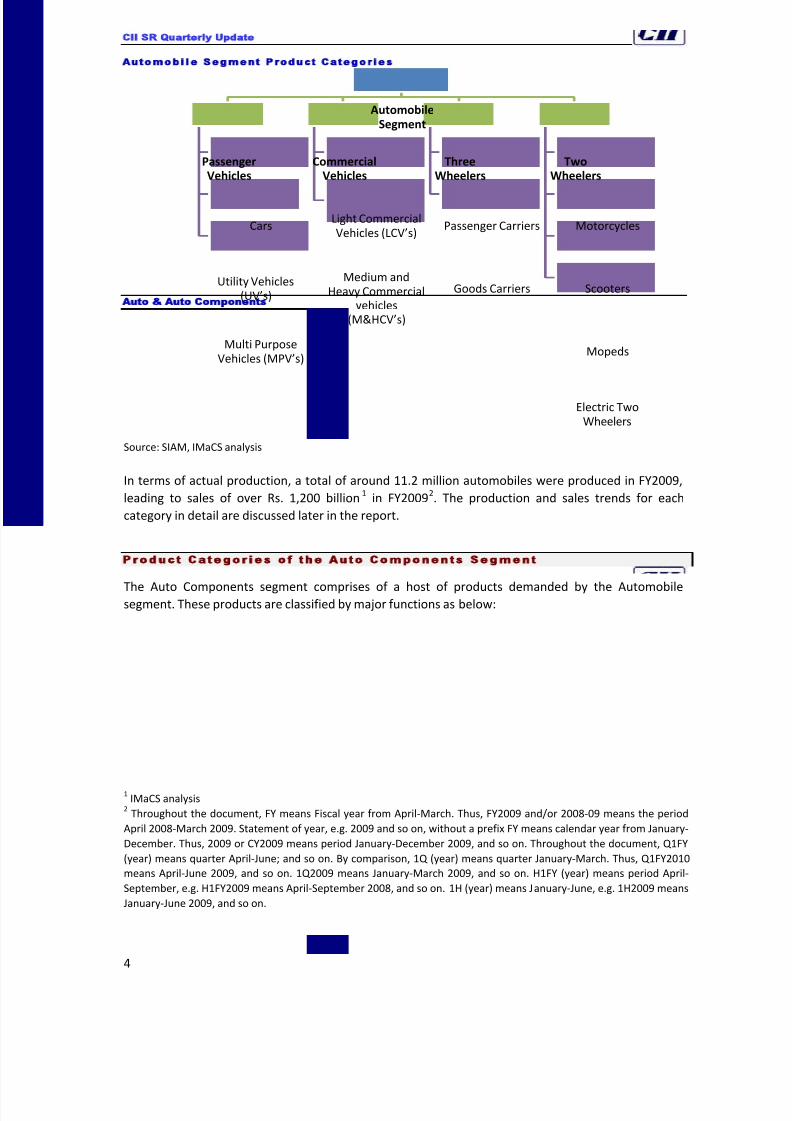
Produc t Categor ies o f the Auto Components Segment The Auto Components segment comprises of a host of products demanded by the Automobilesegment. These products are classified by major functions as below:
1 IMaCS analysis
2 Throughout the document, FY means Fiscal year from April-March. Thus, FY2009 and/or 2008-09 means the period
April 2008-March 2009. Statement of year, e.g. 2009 and so on, without a prefix FY means calendar year from January-
December. Thus, 2009 or CY2009 means period January-December 2009, and so on. Throughout the document, Q1FY
(year) means quarter April-June; and so on. By comparison, 1Q (year) means quarter January-March. Thus, Q1FY2010
means April-June 2009, and so on. 1Q2009 means January-March 2009, and so on. H1FY (year) means period April-
September, e.g. H1FY2009 means April-September 2008, and so on. 1H (year) means January-June, e.g. 1H2009 means
January-June 2009, and so on.
AutomobileSegment
PassengerVehicles
Cars
Utility Vehicles(UV’s)
Multi PurposeVehicles (MPV’s)
CommercialVehicles
Light CommercialVehicles (LCV’s)
Medium andHeavy Commercial
vehicles(M&HCV’s)
ThreeWheelers
Passenger Carriers
Goods Carriers
TwoWheelers
Motorcycles
Scooters
Mopeds
Electric TwoWheelers
8/12/2019 Auto and Auto Ancillaries December20091
http://slidepdf.com/reader/full/auto-and-auto-ancillaries-december20091 5/66
CII SR Quarterly Update
Auto Auto Components
5
Source: ACMA, IMaCS analysis
In terms of production of auto components, Engine & engine parts alone account for 31% of the
production value of auto components, while Engine & engine parts and Transmission & steering parts
together account for about 50% of the same. The total production value is estimated at about Rs. 763
billion in 2008-09, of which the organized sector accounted for Rs. 590-600 billion and the SSI
(expand) sector accounted for Rs. 160-170 billion3.
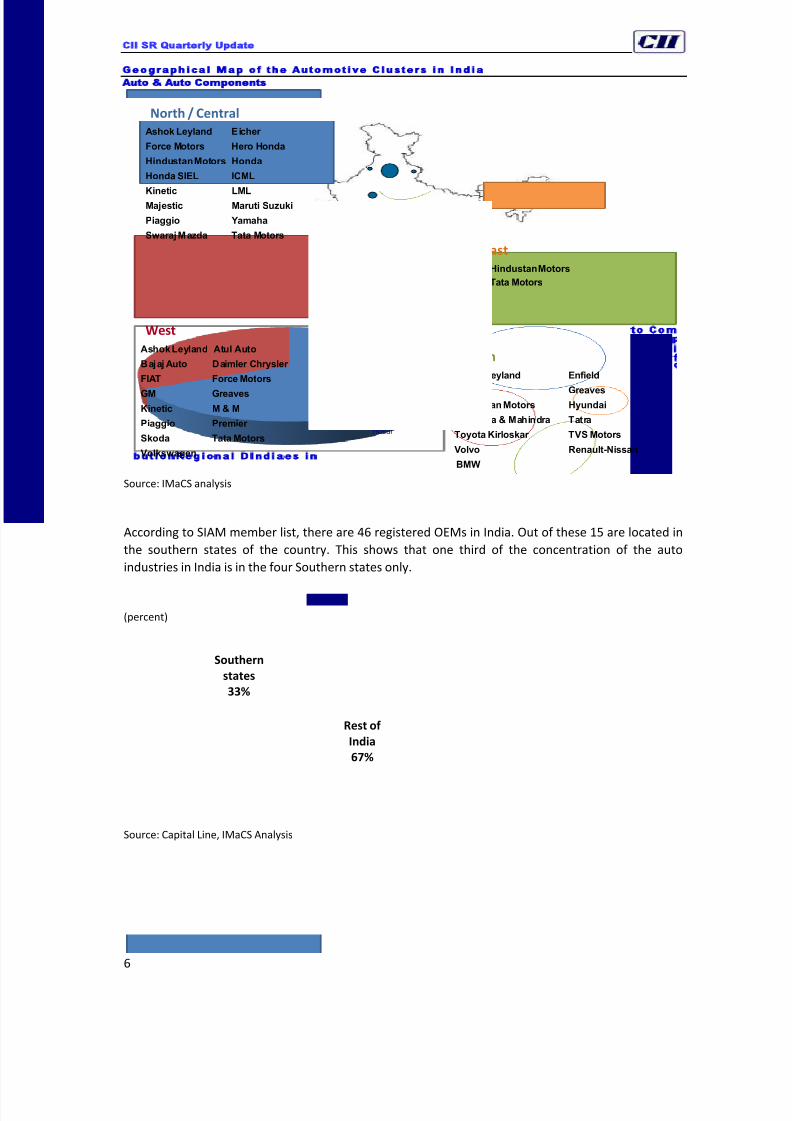
Auto and Auto Components Market in South Ind iaThe Automobile Industry, due to its very nature, has grown in clusters. The clusters have OEMs as
hubs or centres of growth while the suppliers have formed their bases around the OEMs. There are 3
major automobile and auto component production clusters across the country, namely, Western
Region (Mumbai – Pune – Nasik – Aurangabad), Southern Region (Chennai – Bangalore – Hosur) and
Northern Region (Delhi – Gurgaon – Faridabad). In the Eastern region, activity in the automotive
sector is seen in Jamshedpur and Kolkata, but the development in this region has been to a lesser
extent than in the others.
The following map shows the automotive clusters in India:
3 Approximation, using the same breakup of organized and unorganized sector as in 2004-05 and applying it to the total
production of Rs. 760 billion of Auto Components in 2008-09.
AutoComponent
Segment
Engine and
engine parts
Transmission
and steeringparts
Suspension
and brakingparts
Equipment Electricals Others
8/12/2019 Auto and Auto Ancillaries December20091
http://slidepdf.com/reader/full/auto-and-auto-ancillaries-december20091 6/66
CII SR Quarterly Update
Auto Auto Components
6
Geographical Map of the Automotive Clusters in India
Source: IMaCS analysis
According to SIAM member list, there are 46 registered OEMs in India. Out of these 15 are located in
the southern states of the country. This shows that one third of the concentration of the auto
industries in India is in the four Southern states only.
Regional Distribution of Auto Companies in India(percent)
Source: Capital Line, IMaCS Analysis
Delhi-Gurgaon-Noida-
Ghaziabad
Kolkata
Mumbai-Pune-Nasik
Aurangabad
Ashok Leyland Enfield
Ford GreavesHindustan Motors Hyundai
Mahindra & Mahindra Tatra
Toyota Kirloskar TVS Motors
Volvo Renault-Nissan
BMW
Hindustan Motors
Tata Motors
Ashok Leyland Atul Auto
Bajaj Auto Daimler Chrysler
FIAT Force Motors
GM Greaves
Kinetic M & M
Piaggio Premier
Skoda Tata Motors
Volkswagen
Ashok Leyland Eicher
Force Motors Hero Honda
Hindustan Motors Honda
Honda SIEL ICML
Kinetic LML
Majestic Maruti Suzuki
Piaggio Yamaha
SwarajMazda Tata Motors
North / Central
West
East
South
Jamshedpur
Chennai-Bangalore-
Hosur
Rajkot-Halol
Hyderabad
Ludhiana Haridwar-Pantnagar
Pitampur
Rest of
India
67%
Southern
states
33%
8/12/2019 Auto and Auto Ancillaries December20091
http://slidepdf.com/reader/full/auto-and-auto-ancillaries-december20091 7/66
CII SR Quarterly Update
Auto Auto Components
7
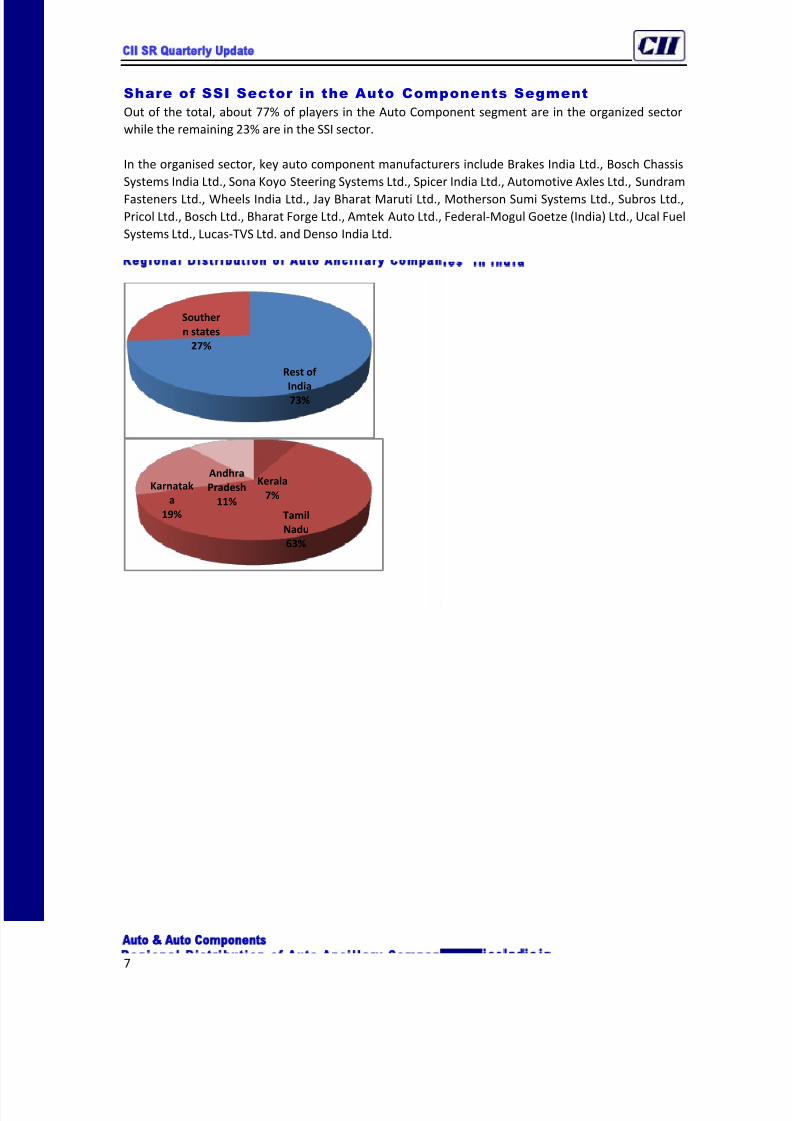
Share of SSI Sector in the Auto Components Segment
Out of the total, about 77% of players in the Auto Component segment are in the organized sector
while the remaining 23% are in the SSI sector.
In the organised sector, key auto component manufacturers include Brakes India Ltd., Bosch Chassis
Systems India Ltd., Sona Koyo Steering Systems Ltd., Spicer India Ltd., Automotive Axles Ltd., Sundram
Fasteners Ltd., Wheels India Ltd., Jay Bharat Maruti Ltd., Motherson Sumi Systems Ltd., Subros Ltd.,Pricol Ltd., Bosch Ltd., Bharat Forge Ltd., Amtek Auto Ltd., Federal-Mogul Goetze (India) Ltd., Ucal Fuel
Systems Ltd., Lucas-TVS Ltd. and Denso India Ltd.
Regional Distribution of Auto Ancillary Companies in India
Rest of
India
73%
Souther
n states
27%
Kerala
7%
Tamil
Nadu
63%
Karnatak
a
19%
Andhra
Pradesh
11%
8/12/2019 Auto and Auto Ancillaries December20091
http://slidepdf.com/reader/full/auto-and-auto-ancillaries-december20091 8/66
CII SR Quarterly Update
Auto Auto Components
8
In the organised sector, 27% of the companies are located in the Southern region of the country,
amongst which the maximum are situated in Tamil Nadu, due to the concentration of the auto
companies in that region.
RECENT DEVELOPMENTS
Automot ives
VW to Acquire Stake in Suzuki
Volkswagen (VW) has confirmed that it is negotiating with Suzuki to acquire a 19.9% stake to Suzuki.
VW has agreed to pay Suzuki ¥225.5 billion (US$2.5 billion) for the stake. Suzuki will sell the 19.9%
stake to VW and will then use half the proceeds to buy shares in VW. VW has outlined the rationale
behind the acquisition as satisfying increasing demand for smaller cars and for powertrains with
higher fuel efficiency and lower CO2 output. VW is also looking to build a larger footprint in India,
South-East Asia, Japan and India, where Suzuki has a strong presence. The alliance will potentially give
VW access to production facilities in the region and will allow access to significant additional R&D
resources to expand its model range in these markets. There could also be some form of collaborationin the Indian market, where VW has established its own manufacturing presence. Suzuki could benefit
from VW's advanced low-emission powertrain technology represented by its BlueMotion range of
vehicles, while it will also gain access to the huge development resources the VW Group has been
dedicating to alternative powertrain technology, such as hybrids, clean diesel and hydrogen fuel cell
vehicles, as well as VW's recently established electric passenger car division. It is also likely that VW
and Suzuki could collaborate on a new kei car/A –segment platform that could form the basis of the
next generation Up! and a new Suzuki city car, or indeed a new budget global A-segment car, which
could serve the Asian and South American markets. The acquisition of the Suzuki stake takes VW a
step closer to realising its `Strategy 2018’ goal of overtaking Toyota as the world's biggest carmaker by
sales volume. If the VW Group's and Suzuki's global sales volumes forecast for 2009 are combined,
they are estimated at 8.1-8.2 million units, which is in excess of the 7.04 million units forecast forToyota in 2009.
Turnaround at Tata Motors’ Jaguar Land Rover Unit (JLR) Unit
TML has revealed that its UK-based Jaguar Land Rover (JLR) unit booked an operating profit during
Q2FY2010. JLR achieved a profit of £41.3 million (US$68.2 million) in the period, compared with a £34-
million loss in the previous quarter. It also managed to narrow its net losses to £60 million. The rise in
profitability coincided with a (qoq) increase in global wholesales of around 23% to 44,300 units,
although retail volumes remained flat at around 47,100 units against 46,800 units, with Land Rover
proving to be the stronger of the two. Overall, its sales revenues for the quarter stood at £1.42 billion.
The improvement is partly attributable to the continued improvement in the global economy, which
has seen demand for both passenger cars and trucks (at least in developing markets) recording gains.
Further, the cost-cutting strategy for the JLR side of the business already seems to have had a positive
effect. TML has been working with consultants from both KPMG and Roland Berger to reduce its
expenditure. TML also plans to cut the number of plants it has in the UK, with JLR expected to shut
one plant by 2014.
8/12/2019 Auto and Auto Ancillaries December20091
http://slidepdf.com/reader/full/auto-and-auto-ancillaries-december20091 9/66
CII SR Quarterly Update
Auto Auto Components
9
Maruti Suzuki Launches New Car in January 2010
Maruti Suzuki has launched a new car named Eeco in January 2010. The Eeco is a five-door, C segment
vehicle, which has been specifically designed for India. Eeco has a 1200 cc engine delivering 73 bhp
and torque of 101 Nm. The engine will meet BS IV Emission norms. The vehicle has been priced at Rs.
0.258 million (for the non-air-conditioned or AC version), ex-showroom Delhi. The vehicle comes withan option of 7-seater (Rs 0.271 million, non-AC) or 5-seater (Rs. 0.289 million, with AC). The company
also showcased an electric version of the Eeco, called `Eeco Charge’, at the recently held Auto Expo in
Delhi. The car however, will not go into commercial production.
GM Launches Chevrolet Beat, Planning a 800 cc Version of
Chevrolet Spark
GM has launched the 1200 cc Chevrolet Beat in January 2010. The Beat comes in three trim levels of
1.2, 1.2LS and 1.2 LT and prices start at Rs. 0.334 million. GM is also working on a stripped down
version of the Spark to take on the Alto, the largest selling car from the Maruti Suzuki stable. The new
variant of the Spark would come with a 800cc engine, the same as Alto’s. The Spark now comes with
an 1100 cc engine.
Toyota Launches the Prius
Toyota Kirloskar launched the Prius in India at the Auto Expo 2010. The newly launched Toyota Prius is
powered with company’s latest technology named Toyota Hybrid System II, which also known as
Hybrid Synergy Drive (HSD). The main features of the Prius includes a 1.8 litre petrol engine, 2ZR FXE
engine and 136PS of bhp, HSD, electrically controlled CVT (Continuously Variable Transmission),
Electronically Controlled Shift Lever, Regenerative braking, etc. The Prius will be available in India in
three modes, which includes Power, Eco and Electric vehicle mode (battery). However at present, only
two models will be available on sale. These two models of Toyota Prius are priced at Rs. 2.655 million
and Rs. 2.786 million, ex-showroom, New Delhi.
Auto Components
Bharat Forge To Expand Non-Automotive Business
Bharat Forge plans to raise up to US$150 million during 2010 to expand its non-automotive business.
The company will use a mix of instruments such as non-convertible debentures with warrants, rights
issue and share sale to institutions. Bharat Forge expects to increase contribution from the non-
automotive business to 60% by 2015.
JK Tyre looks to set up radial unit in TN
JK Tyre could soon set up shops near Chennai. The New Delhi-based corporate group has held
preliminary discussions with the Tamil Nadu government as part of evaluating possible locations to
establish a car radial facility. The company is considering TN and Karnataka to house its greenfield
unit. JK Tyre has been scouting for land in the Sriperumbadur belt so that it could be located close to
the OEs in the bustling auto corridor. The project would entail an investment of Rs 1,600 crore in
phases.
8/12/2019 Auto and Auto Ancillaries December20091
http://slidepdf.com/reader/full/auto-and-auto-ancillaries-december20091 10/66
CII SR Quarterly Update
Auto Auto Components
10
TN Emerging as Tyre Manufacturing Hub
According to official estimates, a copious investment of nearly US$1 billion has already been pumped
into the State by leading tyre companies. Apollo Tyres, ATC Tires, MRF, Dunlop and TVS Srichakra are
some of those who have made huge investments in the state. Already, investments of Rs. 44 billion
are either in the partial completion or under implementation stage this year, the official said.
Recently, the state government gave approval to Michelin to set up a Rs. 40 billion greenfield project
near Chennai. It also cleared the proposal of Apollo Tyres to scale up investment at its upcoming radial
tyre project at Oragadam from Rs. 5 billion to Rs. 21 billion. With the vehicle manufacturers keen on
having more than one supplier, the tyre projects would mainly cater to the OEM demand. Later, the
well developed port facilities in the State would encourage them to tap the export markets. The key
raw material—rubber—can be sourced from Kerala and Kanyakumari or imported.
Bridgestone is also in advanced stages of negotiation to formalise its pact with TN. Recently, J K Tyre
also noted that TN figured among the prospective locations for its expansion. Apollo Tyres is building a
radial tyre unit on 120 acres at Oragadam. MRF has planned to invest Rs. 14 billion at Tiruvottiyur,
Arakkonam besides the new project at Perambalur. Dunlop has also re-started its Ambattur plant in
the city with plans to invest Rs. 2.5-3 billion. TVS Srichakra has also has lined up Rs. 1.5-2 billion for
expansion.
PRODUCTION AND CONSUMPTION
Produc t ion
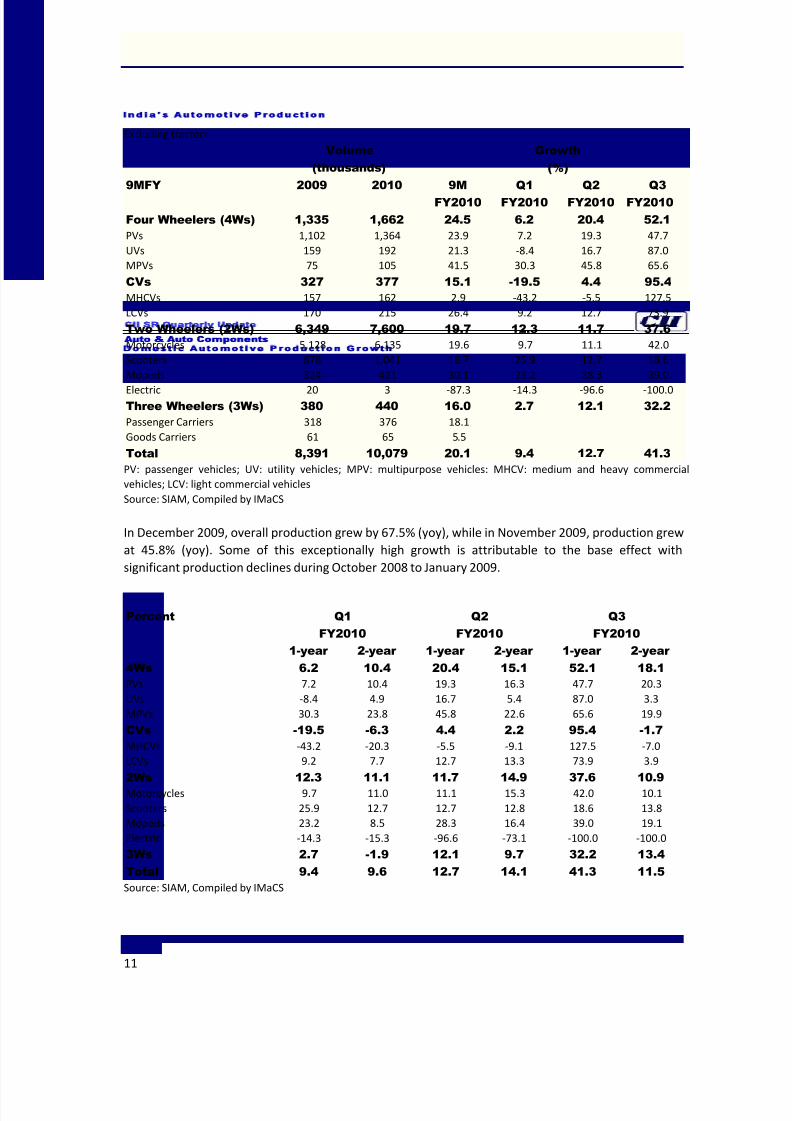
The cumulative automotive production data for April-December 2009 shows production growth of
20.1% over April –December 2009. The high growth was partly attributable to the base effect, and also
because of an accelerating recovery. Following two quarters of decline during Q3FY2009 and
Q4FY2009, production growth has increased from 9.5% (yoy) in Q1FY2010 to 12.6% (yoy) in
Q2FY2010, and to 41.3% (yoy) in Q3FY2010.
8/12/2019 Auto and Auto Ancillaries December20091
http://slidepdf.com/reader/full/auto-and-auto-ancillaries-december20091 11/66
CII SR Quarterly Update
Auto Auto Components
11
India’s Automotive ProductionExcluding tractors
Volume
(thousands)
Growth
(%)
9MFY 2009 2010 9M
FY2010
Q1
FY2010
Q2
FY2010
Q3
FY2010
Four Wheelers (4Ws) 1,335 1,662 24.5 6.2 20.4 52.1
PVs 1,102 1,364 23.9 7.2 19.3 47.7
UVs 159 192 21.3 -8.4 16.7 87.0
MPVs 75 105 41.5 30.3 45.8 65.6
CVs 327 377 15.1 -19.5 4.4 95.4
MHCVs 157 162 2.9 -43.2 -5.5 127.5
LCVs 170 215 26.4 9.2 12.7 73.9
Two Wheelers (2Ws) 6,349 7,600 19.7 12.3 11.7 37.6
Motorcycles 5,128 6,135 19.6 9.7 11.1 42.0
Scooters 878 1,041 18.7 25.9 12.7 18.6
Mopeds 324 421 30.1 23.2 28.3 39.0
Electric 20 3 -87.3 -14.3 -96.6 -100.0Three Wheelers (3Ws) 380 440 16.0 2.7 12.1 32.2
Passenger Carriers 318 376 18.1
Goods Carriers 61 65 5.5
Total 8,391 10,079 20.1 9.4 12.7 41.3
PV: passenger vehicles; UV: utility vehicles; MPV: multipurpose vehicles: MHCV: medium and heavy commercial
vehicles; LCV: light commercial vehicles
Source: SIAM, Compiled by IMaCS
In December 2009, overall production grew by 67.5% (yoy), while in November 2009, production grew
at 45.8% (yoy). Some of this exceptionally high growth is attributable to the base effect with
significant production declines during October 2008 to January 2009.
Domestic Automotive Production Growth
Percent Q1
FY2010
Q2
FY2010
Q3
FY2010
1-year 2-year 1-year 2-year 1-year 2-year
4Ws 6.2 10.4 20.4 15.1 52.1 18.1
PVs 7.2 10.4 19.3 16.3 47.7 20.3
UVs -8.4 4.9 16.7 5.4 87.0 3.3
MPVs 30.3 23.8 45.8 22.6 65.6 19.9
CVs -19.5 -6.3 4.4 2.2 95.4 -1.7
MHCVs -43.2 -20.3 -5.5 -9.1 127.5 -7.0
LCVs 9.2 7.7 12.7 13.3 73.9 3.9
2Ws 12.3 11.1 11.7 14.9 37.6 10.9
Motorcycles 9.7 11.0 11.1 15.3 42.0 10.1
Scooters 25.9 12.7 12.7 12.8 18.6 13.8
Mopeds 23.2 8.5 28.3 16.4 39.0 19.1
Electric -14.3 -15.3 -96.6 -73.1 -100.0 -100.0
3Ws 2.7 -1.9 12.1 9.7 32.2 13.4
Total 9.4 9.6 12.7 14.1 41.3 11.5
Source: SIAM, Compiled by IMaCS
8/12/2019 Auto and Auto Ancillaries December20091
http://slidepdf.com/reader/full/auto-and-auto-ancillaries-december20091 12/66
CII SR Quarterly Update
Auto Auto Components
12
Monthly Automotive Production GrowthYoy
Source: SIAM, Compiled by IMaCS
Domest ic Sales
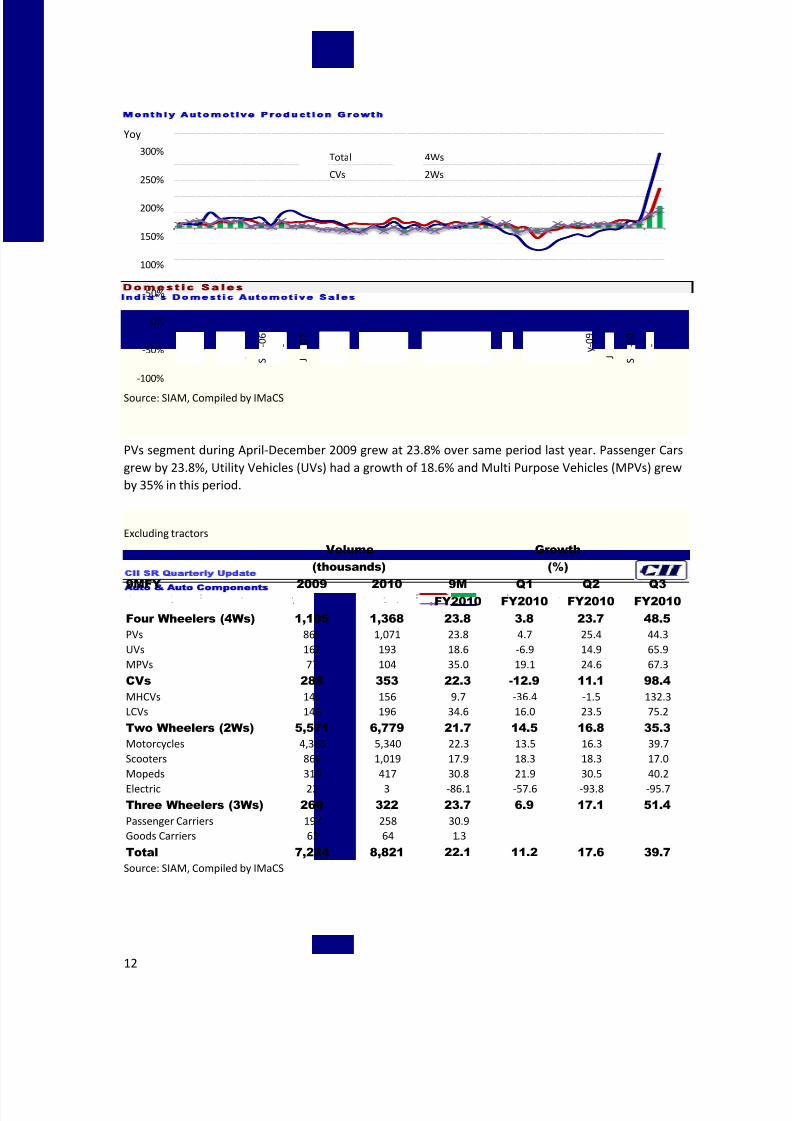
PVs segment during April-December 2009 grew at 23.8% over same period last year. Passenger Cars
grew by 23.8%, Utility Vehicles (UVs) had a growth of 18.6% and Multi Purpose Vehicles (MPVs) grew
by 35% in this period.
India’s Domestic Automotive SalesExcluding tractors
Volume
(thousands)
Growth
(%)
9MFY 2009 2010 9MFY2010
Q1FY2010
Q2FY2010
Q3FY2010
Four Wheelers (4Ws) 1,105 1,368 23.8 3.8 23.7 48.5
PVs 865 1,071 23.8 4.7 25.4 44.3
UVs 163 193 18.6 -6.9 14.9 65.9
MPVs 77 104 35.0 19.1 24.6 67.3
CVs 288 353 22.3 -12.9 11.1 98.4
MHCVs 143 156 9.7 -36.4 -1.5 132.3
LCVs 146 196 34.6 16.0 23.5 75.2
Two Wheelers (2Ws) 5,571 6,779 21.7 14.5 16.8 35.3
Motorcycles 4,366 5,340 22.3 13.5 16.3 39.7
Scooters 864 1,019 17.9 18.3 18.3 17.0
Mopeds 319 417 30.8 21.9 30.5 40.2
Electric 22 3 -86.1 -57.6 -93.8 -95.7
Three Wheelers (3Ws) 260 322 23.7 6.9 17.1 51.4
Passenger Carriers 197 258 30.9
Goods Carriers 63 64 1.3
Total 7,224 8,821 22.1 11.2 17.6 39.7
Source: SIAM, Compiled by IMaCS
-100%
-50%
0%
50%
100%
150%
200%
250%
300%
J
- r - -
J l -
S
- 0 6
-
J
- 0 7
r - -
J l - - -
J
- r - 0 8
-
J l - 0 8
- -
J
- r - y
- 0 9
J l -
S
- 0 9
-
Total 4Ws
CVs 2Ws
8/12/2019 Auto and Auto Ancillaries December20091
http://slidepdf.com/reader/full/auto-and-auto-ancillaries-december20091 13/66
CII SR Quarterly Update
Auto Auto Components
13
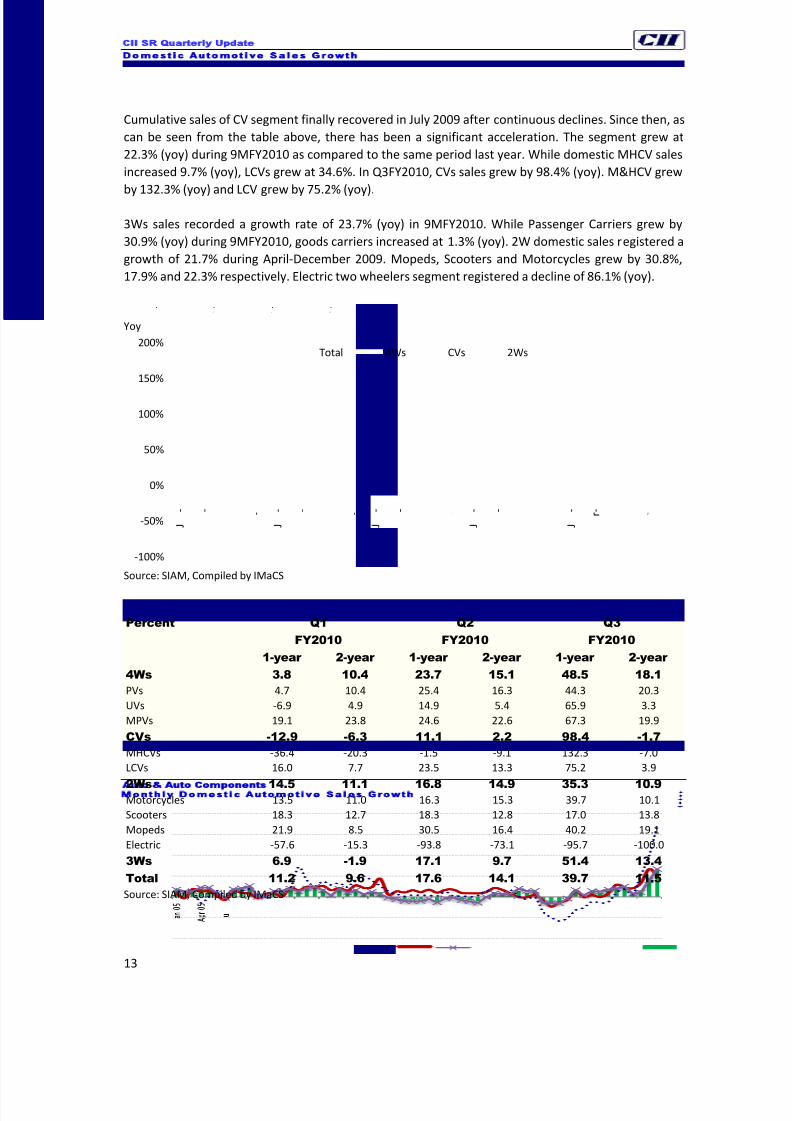
Cumulative sales of CV segment finally recovered in July 2009 after continuous declines. Since then, as
can be seen from the table above, there has been a significant acceleration. The segment grew at
22.3% (yoy) during 9MFY2010 as compared to the same period last year. While domestic MHCV sales
increased 9.7% (yoy), LCVs grew at 34.6%. In Q3FY2010, CVs sales grew by 98.4% (yoy). M&HCV grew
by 132.3% (yoy) and LCV grew by 75.2% (yoy).
3Ws sales recorded a growth rate of 23.7% (yoy) in 9MFY2010. While Passenger Carriers grew by
30.9% (yoy) during 9MFY2010, goods carriers increased at 1.3% (yoy). 2W domestic sales registered a
growth of 21.7% during April-December 2009. Mopeds, Scooters and Motorcycles grew by 30.8%,
17.9% and 22.3% respectively. Electric two wheelers segment registered a decline of 86.1% (yoy).
Monthly Domestic Automotive Sales GrowthYoy
Source: SIAM, Compiled by IMaCS
Domestic Automotive Sales Growth
Percent Q1
FY2010
Q2
FY2010
Q3
FY2010
1-year 2-year 1-year 2-year 1-year 2-year
4Ws 3.8 10.4 23.7 15.1 48.5 18.1
PVs 4.7 10.4 25.4 16.3 44.3 20.3
UVs -6.9 4.9 14.9 5.4 65.9 3.3
MPVs 19.1 23.8 24.6 22.6 67.3 19.9
CVs -12.9 -6.3 11.1 2.2 98.4 -1.7
MHCVs -36.4 -20.3 -1.5 -9.1 132.3 -7.0
LCVs 16.0 7.7 23.5 13.3 75.2 3.9
2Ws 14.5 11.1 16.8 14.9 35.3 10.9Motorcycles 13.5 11.0 16.3 15.3 39.7 10.1
Scooters 18.3 12.7 18.3 12.8 17.0 13.8
Mopeds 21.9 8.5 30.5 16.4 40.2 19.1
Electric -57.6 -15.3 -93.8 -73.1 -95.7 -100.0
3Ws 6.9 -1.9 17.1 9.7 51.4 13.4
Total 11.2 9.6 17.6 14.1 39.7 11.5
Source: SIAM, Compiled by IMaCS
-100%
-50%
0%
50%
100%
150%
200%
J
- -
J l - t -
J
- -
J l - t -
J
- -
J l - t -
J
- -
J l - t -
J
- r -
J l - t -
Total 4Ws CVs 2Ws
8/12/2019 Auto and Auto Ancillaries December20091
http://slidepdf.com/reader/full/auto-and-auto-ancillaries-december20091 14/66
CII SR Quarterly Update
Auto Auto Components
14
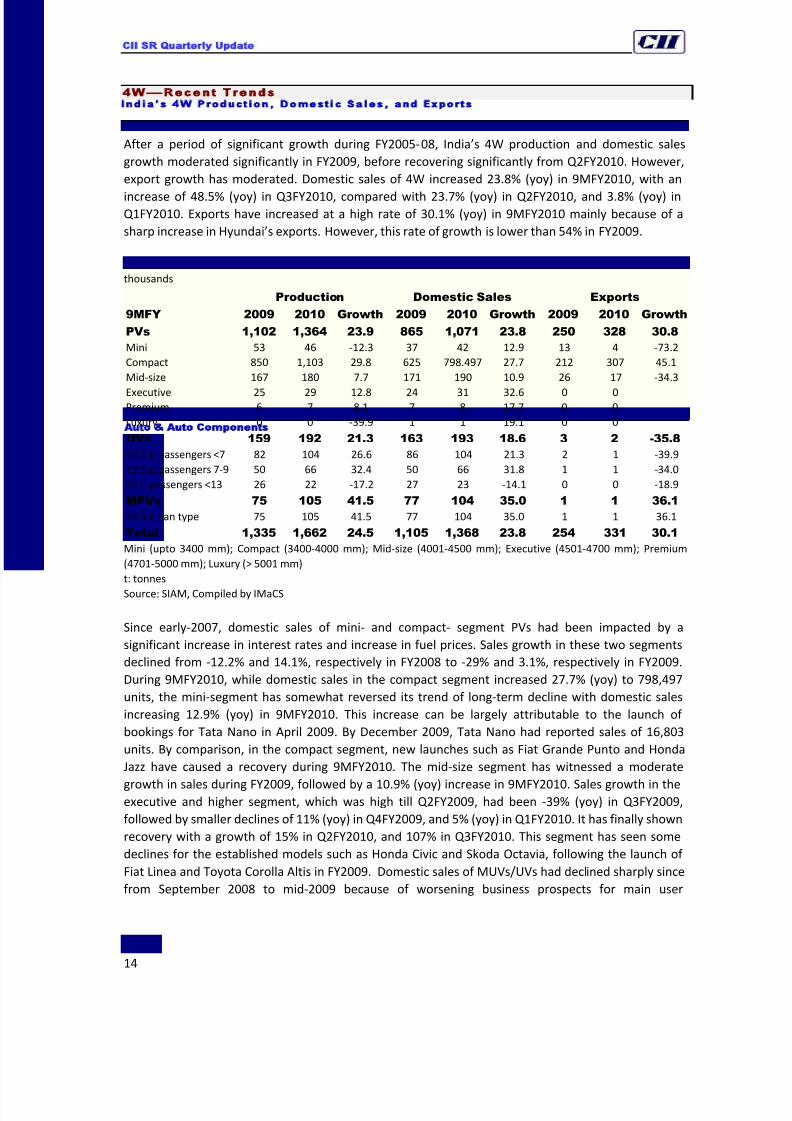
4W—Recent Trends
After a period of significant growth during FY2005-08, India’s 4W production and domestic sales
growth moderated significantly in FY2009, before recovering significantly from Q2FY2010. However,
export growth has moderated. Domestic sales of 4W increased 23.8% (yoy) in 9MFY2010, with an
increase of 48.5% (yoy) in Q3FY2010, compared with 23.7% (yoy) in Q2FY2010, and 3.8% (yoy) inQ1FY2010. Exports have increased at a high rate of 30.1% (yoy) in 9MFY2010 mainly because of a
sharp increase in Hyundai’s exports. However, this rate of growth is lower than 54% in FY2009.
India’s 4W Production Domestic Sales and Exports thousands
Production Domestic Sales Exports
9MFY 2009 2010 Growth 2009 2010 Growth 2009 2010 Growth
PVs 1,102 1,364 23.9 865 1,071 23.8 250 328 30.8
Mini 53 46 -12.3 37 42 12.9 13 4 -73.2
Compact 850 1,103 29.8 625 798.497 27.7 212 307 45.1
Mid-size 167 180 7.7 171 190 10.9 26 17 -34.3
Executive 25 29 12.8 24 31 32.6 0 0Premium 6 7 8.1 7 8 17.7 0 0
Luxury 0 0 -39.9 1 1 19.1 0 0
UVs 159 192 21.3 163 193 18.6 3 2 -35.8
<3.5 t, passengers <7 82 104 26.6 86 104 21.3 2 1 -39.9
<3.5 t, passengers 7-9 50 66 32.4 50 66 31.8 1 1 -34.0
<5 t, passengers <13 26 22 -17.2 27 23 -14.1 0 0 -18.9
MPVs 75 105 41.5 77 104 35.0 1 1 36.1
<3.5 t, van type 75 105 41.5 77 104 35.0 1 1 36.1
Total 1,335 1,662 24.5 1,105 1,368 23.8 254 331 30.1
Mini (upto 3400 mm); Compact (3400-4000 mm); Mid-size (4001-4500 mm); Executive (4501-4700 mm); Premium
(4701-5000 mm); Luxury (> 5001 mm)
t: tonnes
Source: SIAM, Compiled by IMaCS
Since early-2007, domestic sales of mini- and compact- segment PVs had been impacted by a
significant increase in interest rates and increase in fuel prices. Sales growth in these two segments
declined from -12.2% and 14.1%, respectively in FY2008 to -29% and 3.1%, respectively in FY2009.
During 9MFY2010, while domestic sales in the compact segment increased 27.7% (yoy) to 798,497
units, the mini-segment has somewhat reversed its trend of long-term decline with domestic sales
increasing 12.9% (yoy) in 9MFY2010. This increase can be largely attributable to the launch of
bookings for Tata Nano in April 2009. By December 2009, Tata Nano had reported sales of 16,803
units. By comparison, in the compact segment, new launches such as Fiat Grande Punto and Honda
Jazz have caused a recovery during 9MFY2010. The mid-size segment has witnessed a moderate
growth in sales during FY2009, followed by a 10.9% (yoy) increase in 9MFY2010. Sales growth in theexecutive and higher segment, which was high till Q2FY2009, had been -39% (yoy) in Q3FY2009,
followed by smaller declines of 11% (yoy) in Q4FY2009, and 5% (yoy) in Q1FY2010. It has finally shown
recovery with a growth of 15% in Q2FY2010, and 107% in Q3FY2010. This segment has seen some
declines for the established models such as Honda Civic and Skoda Octavia, following the launch of
Fiat Linea and Toyota Corolla Altis in FY2009. Domestic sales of MUVs/UVs had declined sharply since
from September 2008 to mid-2009 because of worsening business prospects for main user
8/12/2019 Auto and Auto Ancillaries December20091
http://slidepdf.com/reader/full/auto-and-auto-ancillaries-december20091 15/66
CII SR Quarterly Update
Auto Auto Components
15
segments—primarily transportation of employees in the Information Technology (IT)/IT-enabled
services (ITES) industry but has shown a growth from Q2FY2010.
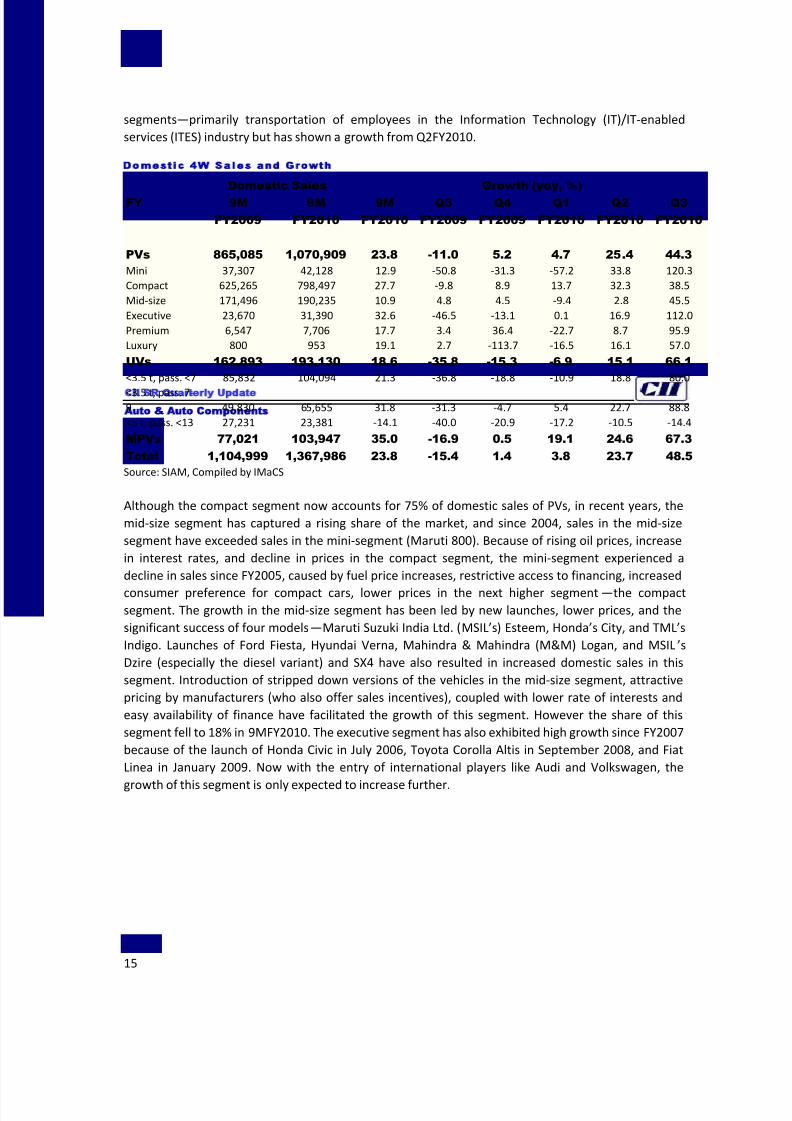
Domestic 4W Sales and Growth
Domestic Sales Growth (yoy, %)
FY 9M
FY2009
9M
FY2010
9M
FY2010
Q3
FY2009
Q4
FY2009
Q1
FY2010
Q2
FY2010
Q3
FY2010
PVs 865,085 1,070,909 23.8 -11.0 5.2 4.7 25.4 44.3
Mini 37,307 42,128 12.9 -50.8 -31.3 -57.2 33.8 120.3
Compact 625,265 798,497 27.7 -9.8 8.9 13.7 32.3 38.5
Mid-size 171,496 190,235 10.9 4.8 4.5 -9.4 2.8 45.5
Executive 23,670 31,390 32.6 -46.5 -13.1 0.1 16.9 112.0
Premium 6,547 7,706 17.7 3.4 36.4 -22.7 8.7 95.9
Luxury 800 953 19.1 2.7 -113.7 -16.5 16.1 57.0
UVs 162,893 193,130 18.6 -35.8 -15.3 -6.9 15.1 66.1
<3.5 t, pass. <7 85,832 104,094 21.3 -36.8 -18.8 -10.9 18.8 80.0
<3.5 t, pass. 7-9 49,830 65,655 31.8 -31.3 -4.7 5.4 22.7 88.8
<5 t, pass. <13 27,231 23,381 -14.1 -40.0 -20.9 -17.2 -10.5 -14.4
MPVs 77,021 103,947 35.0 -16.9 0.5 19.1 24.6 67.3
Total 1,104,999 1,367,986 23.8 -15.4 1.4 3.8 23.7 48.5
Source: SIAM, Compiled by IMaCS
Although the compact segment now accounts for 75% of domestic sales of PVs, in recent years, the
mid-size segment has captured a rising share of the market, and since 2004, sales in the mid-size
segment have exceeded sales in the mini-segment (Maruti 800). Because of rising oil prices, increase
in interest rates, and decline in prices in the compact segment, the mini-segment experienced a
decline in sales since FY2005, caused by fuel price increases, restrictive access to financing, increased
consumer preference for compact cars, lower prices in the next higher segment —the compactsegment. The growth in the mid-size segment has been led by new launches, lower prices, and the
significant success of four models—Maruti Suzuki India Ltd. (MSIL’s) Esteem, Honda’s City, and TML’s
Indigo. Launches of Ford Fiesta, Hyundai Verna, Mahindra & Mahindra (M&M) Logan, and MSIL ’s
Dzire (especially the diesel variant) and SX4 have also resulted in increased domestic sales in this
segment. Introduction of stripped down versions of the vehicles in the mid-size segment, attractive
pricing by manufacturers (who also offer sales incentives), coupled with lower rate of interests and
easy availability of finance have facilitated the growth of this segment. However the share of this
segment fell to 18% in 9MFY2010. The executive segment has also exhibited high growth since FY2007
because of the launch of Honda Civic in July 2006, Toyota Corolla Altis in September 2008, and Fiat
Linea in January 2009. Now with the entry of international players like Audi and Volkswagen, the
growth of this segment is only expected to increase further.
8/12/2019 Auto and Auto Ancillaries December20091
http://slidepdf.com/reader/full/auto-and-auto-ancillaries-december20091 16/66
CII SR Quarterly Update
Auto Auto Components
16
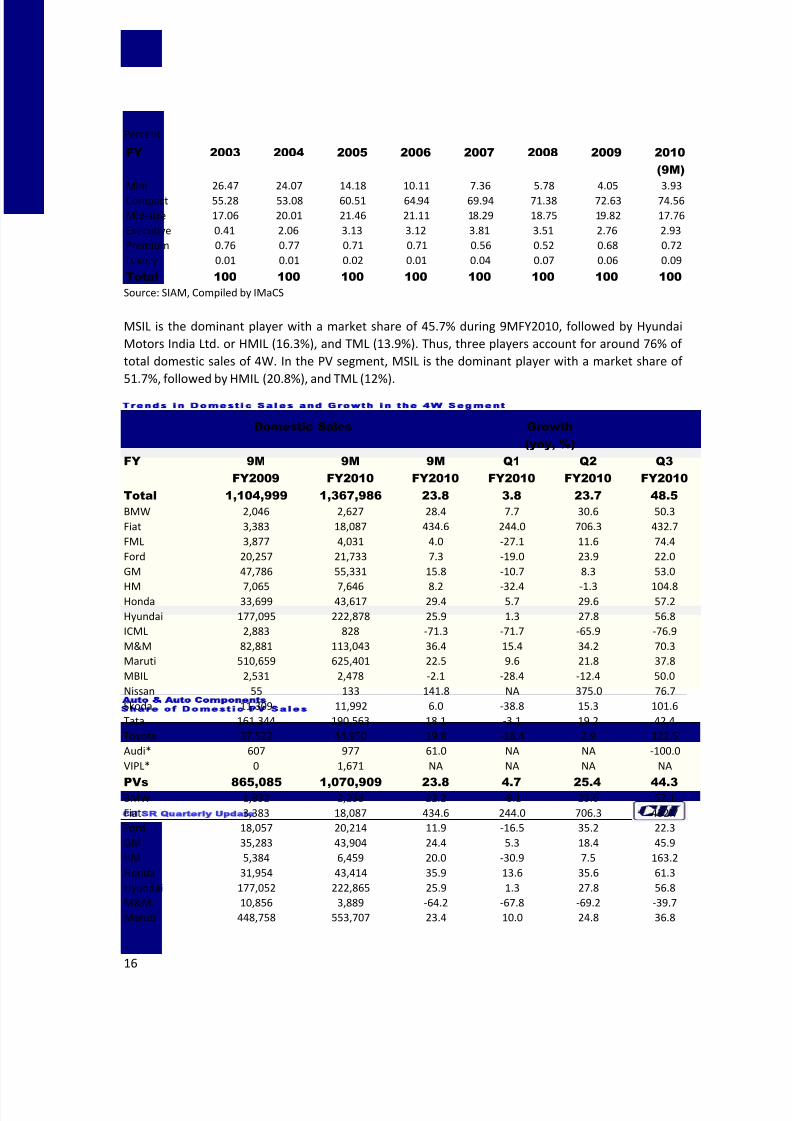
Share of Domestic PV SalesPercent
FY 2003 2004 2005 2006 2007 2008 2009 2010
(9M)
Mini 26.47 24.07 14.18 10.11 7.36 5.78 4.05 3.93
Compact 55.28 53.08 60.51 64.94 69.94 71.38 72.63 74.56
Mid-size 17.06 20.01 21.46 21.11 18.29 18.75 19.82 17.76
Executive 0.41 2.06 3.13 3.12 3.81 3.51 2.76 2.93
Premium 0.76 0.77 0.71 0.71 0.56 0.52 0.68 0.72
Luxury 0.01 0.01 0.02 0.01 0.04 0.07 0.06 0.09
Total 100 100 100 100 100 100 100 100
Source: SIAM, Compiled by IMaCS
MSIL is the dominant player with a market share of 45.7% during 9MFY2010, followed by Hyundai
Motors India Ltd. or HMIL (16.3%), and TML (13.9%). Thus, three players account for around 76% of
total domestic sales of 4W. In the PV segment, MSIL is the dominant player with a market share of
51.7%, followed by HMIL (20.8%), and TML (12%).
Trends in Domestic Sales and Growth in the 4W Segment
Domestic Sales Growth
(yoy, %)
FY 9M
FY2009
9M
FY2010
9M
FY2010
Q1
FY2010
Q2
FY2010
Q3
FY2010
Total 1,104,999 1,367,986 23.8 3.8 23.7 48.5
BMW 2,046 2,627 28.4 7.7 30.6 50.3
Fiat 3,383 18,087 434.6 244.0 706.3 432.7
FML 3,877 4,031 4.0 -27.1 11.6 74.4
Ford 20,257 21,733 7.3 -19.0 23.9 22.0
GM 47,786 55,331 15.8 -10.7 8.3 53.0
HM 7,065 7,646 8.2 -32.4 -1.3 104.8Honda 33,699 43,617 29.4 5.7 29.6 57.2
Hyundai 177,095 222,878 25.9 1.3 27.8 56.8
ICML 2,883 828 -71.3 -71.7 -65.9 -76.9
M&M 82,881 113,043 36.4 15.4 34.2 70.3
Maruti 510,659 625,401 22.5 9.6 21.8 37.8
MBIL 2,531 2,478 -2.1 -28.4 -12.4 50.0
Nissan 55 133 141.8 NA 375.0 76.7
Skoda 11,309 11,992 6.0 -38.8 15.3 101.6
Tata 161,344 190,563 18.1 -3.1 19.2 42.4
Toyota 37,522 44,950 19.8 -18.4 2.9 122.5
Audi* 607 977 61.0 NA NA -100.0
VIPL* 0 1,671 NA NA NA NA
PVs 865,085 1,070,909 23.8 4.7 25.4 44.3BMW 1,832 2,238 22.2 -8.1 23.6 57.1
Fiat 3,383 18,087 434.6 244.0 706.3 432.7
Ford 18,057 20,214 11.9 -16.5 35.2 22.3
GM 35,283 43,904 24.4 5.3 18.4 45.9
HM 5,384 6,459 20.0 -30.9 7.5 163.2
Honda 31,954 43,414 35.9 13.6 35.6 61.3
Hyundai 177,052 222,865 25.9 1.3 27.8 56.8
M&M 10,856 3,889 -64.2 -67.8 -69.2 -39.7
Maruti 448,758 553,707 23.4 10.0 24.8 36.8
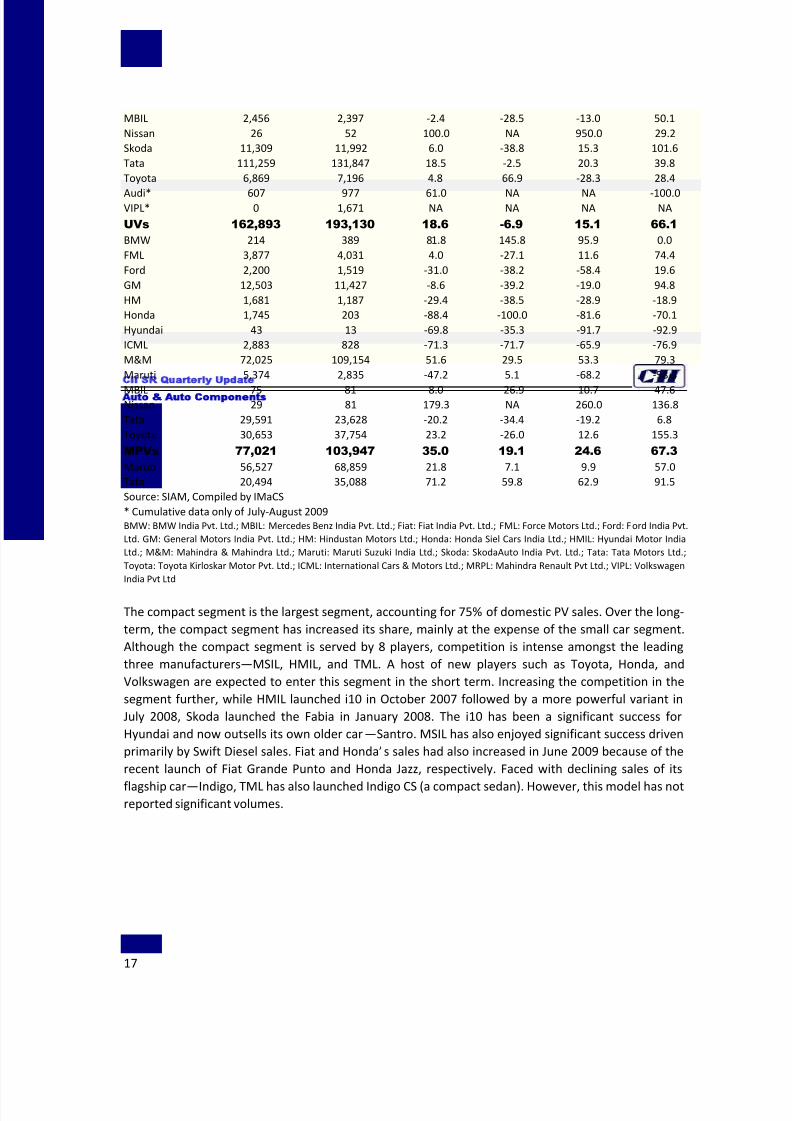
8/12/2019 Auto and Auto Ancillaries December20091
http://slidepdf.com/reader/full/auto-and-auto-ancillaries-december20091 17/66
CII SR Quarterly Update
Auto Auto Components
17
MBIL 2,456 2,397 -2.4 -28.5 -13.0 50.1
Nissan 26 52 100.0 NA 950.0 29.2
Skoda 11,309 11,992 6.0 -38.8 15.3 101.6
Tata 111,259 131,847 18.5 -2.5 20.3 39.8
Toyota 6,869 7,196 4.8 66.9 -28.3 28.4
Audi* 607 977 61.0 NA NA -100.0VIPL* 0 1,671 NA NA NA NA
UVs 162,893 193,130 18.6 -6.9 15.1 66.1
BMW 214 389 81.8 145.8 95.9 0.0
FML 3,877 4,031 4.0 -27.1 11.6 74.4
Ford 2,200 1,519 -31.0 -38.2 -58.4 19.6
GM 12,503 11,427 -8.6 -39.2 -19.0 94.8
HM 1,681 1,187 -29.4 -38.5 -28.9 -18.9
Honda 1,745 203 -88.4 -100.0 -81.6 -70.1
Hyundai 43 13 -69.8 -35.3 -91.7 -92.9
ICML 2,883 828 -71.3 -71.7 -65.9 -76.9
M&M 72,025 109,154 51.6 29.5 53.3 79.3
Maruti 5,374 2,835 -47.2 5.1 -68.2 -58.3
MBIL 75 81 8.0 -26.9 10.7 47.6Nissan 29 81 179.3 NA 260.0 136.8
Tata 29,591 23,628 -20.2 -34.4 -19.2 6.8
Toyota 30,653 37,754 23.2 -26.0 12.6 155.3
MPVs 77,021 103,947 35.0 19.1 24.6 67.3
Maruti 56,527 68,859 21.8 7.1 9.9 57.0
Tata 20,494 35,088 71.2 59.8 62.9 91.5
Source: SIAM, Compiled by IMaCS
* Cumulative data only of July-August 2009
BMW: BMW India Pvt. Ltd.; MBIL: Mercedes Benz India Pvt. Ltd.; Fiat: Fiat India Pvt. Ltd.; FML: Force Motors Ltd.; Ford: Ford India Pvt.
Ltd. GM: General Motors India Pvt. Ltd.; HM: Hindustan Motors Ltd.; Honda: Honda Siel Cars India Ltd.; HMIL: Hyundai Motor India
Ltd.; M&M: Mahindra & Mahindra Ltd.; Maruti: Maruti Suzuki India Ltd.; Skoda: SkodaAuto India Pvt. Ltd.; Tata: Tata Motors Ltd.;
Toyota: Toyota Kirloskar Motor Pvt. Ltd.; ICML: International Cars & Motors Ltd.; MRPL: Mahindra Renault Pvt Ltd.; VIPL: Volkswagen
India Pvt Ltd
The compact segment is the largest segment, accounting for 75% of domestic PV sales. Over the long-
term, the compact segment has increased its share, mainly at the expense of the small car segment.
Although the compact segment is served by 8 players, competition is intense amongst the leading
three manufacturers—MSIL, HMIL, and TML. A host of new players such as Toyota, Honda, and
Volkswagen are expected to enter this segment in the short term. Increasing the competition in the
segment further, while HMIL launched i10 in October 2007 followed by a more powerful variant in
July 2008, Skoda launched the Fabia in January 2008. The i10 has been a significant success for
Hyundai and now outsells its own older car—Santro. MSIL has also enjoyed significant success driven
primarily by Swift Diesel sales. Fiat and Honda’s sales had also increased in June 2009 because of the
recent launch of Fiat Grande Punto and Honda Jazz, respectively. Faced with declining sales of its
flagship car—Indigo, TML has also launched Indigo CS (a compact sedan). However, this model has notreported significant volumes.

8/12/2019 Auto and Auto Ancillaries December20091
http://slidepdf.com/reader/full/auto-and-auto-ancillaries-december20091 18/66
CII SR Quarterly Update
Auto Auto Components
18
Domestic Sales and Growth in the Compact Segment
Domestic Sales Growth
(yoy, %)
FY 9M
FY2009
9M
FY2010
9M
FY2010
Q1
FY2010
Q2
FY2010
Q3
FY2010
FIPL 3,252 10,036 208.6 37.6 420.0 244.9
Ford 1,690 507 -70.0 -66.7 -65.3 -82.4
GM 30,011 37,882 26.2 25.3 24.1 28.8
Honda 0 6,247
HMIL 152,006 200,213 31.7 5.5 36.7 60.3
MSIL 358,751 459,500 28.1 17.0 29.7 38.6
Skoda 4,728 4,265 -9.8 -64.8 10.0 100.2
TML 74,827 79,847 6.7 12.4 17.3 -9.1
Total 625,265 798,497 27.7 13.7 32.3 38.5
Source: SIAM, Compiled by IMaCS
The Mid-size segment is the one facing the stiffest competition, with MSIL being the leader with a
market share of 36.6% in 9MFY2010. Honda City was the market leader during FY2005-07. However, ithas lost market share in recent because of the success MSIL’s SX4 and the recently launched Swift
DZire. Swift DZire is reported to be the market leader in this segment primarily because of the success
of its diesel-engine variant. The segment comprises of car models in the price range of Rs. 0.4-0.9
million, and is characterised by aggressive marketing and discounting.
Domestic Sales and Growth in the Mid-Size Segment
Domestic Sales Growth
(yoy, %)
FY 9M
FY2009
9M
FY2010
9M
FY2010
Q1
FY2010
Q2
FY2010
Q3
FY2010
BMW 0 25
Ford 16,367 19,707 20.4 -11.0 47.5 30.5GM 2,428 2,612 7.6 -56.2 29.5 96.9
HM 5,384 6,459 20.0 -30.9 7.5 163.2
Honda 22,534 31,129 38.1 28.4 31.9 52.4
HMIL 24,795 22,335 -9.9 -23.8 -17.6 27.3
MRPL 10,856 3,889 -64.2 -67.8 -69.2 -39.7
MSIL 52,700 69,613 32.1 25.1 28.8 41.7
TML 36,432 34,466 -5.4 -31.6 -29.7 63.5
Total 171,496 190,235 10.9 -9.4 2.8 45.5
Source: SIAM, Compiled by IMaCS
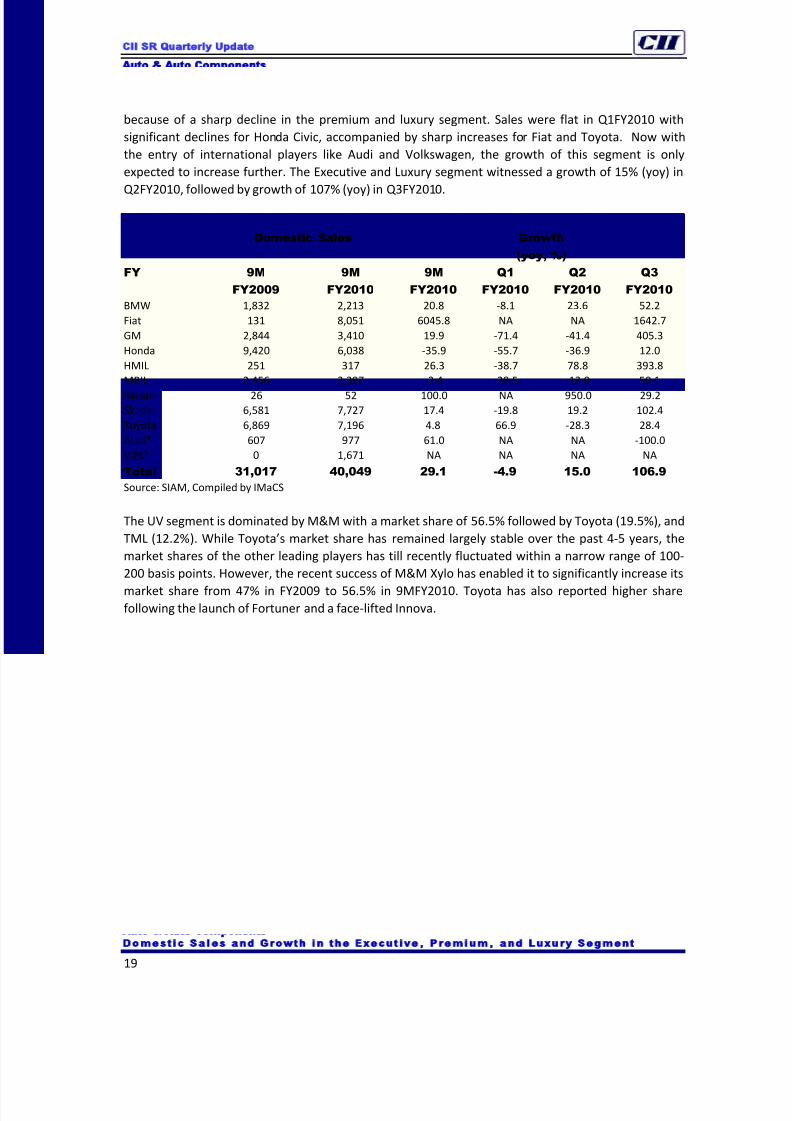
The Executive, the Premium, and the Luxury segments together account for a small (3.7%) but rising
share of sales in the Indian automobile market. The major players in these segments include BMW,Honda, Toyota, Skoda, and Daimler Chrysler. Sales in this segment have increased significantly with
the launch of Honda Civic and BMW’s 3/5/7 series. The launch of Civic has resulted in a significant
decline in market share for Toyota Corolla and Skoda. However, Civic sales have declined over the last
year. Sales in this segment declined in FY2009 primarily because of phasing out of the older
generation of Honda Accord. The new generation Accord was launched in May 2008. This was
followed by launches of Toyota Corolla Altis, Fiat Linea, and new generation Skoda Superb. Domestic
sales in this segment had grown at a high rate till around mid-2008 but have declined subsequently
8/12/2019 Auto and Auto Ancillaries December20091
http://slidepdf.com/reader/full/auto-and-auto-ancillaries-december20091 19/66
CII SR Quarterly Update
Auto Auto Components
19
because of a sharp decline in the premium and luxury segment. Sales were flat in Q1FY2010 with
significant declines for Honda Civic, accompanied by sharp increases for Fiat and Toyota. Now with
the entry of international players like Audi and Volkswagen, the growth of this segment is only
expected to increase further. The Executive and Luxury segment witnessed a growth of 15% (yoy) in
Q2FY2010, followed by growth of 107% (yoy) in Q3FY2010.
Domestic Sales and Growth in the Executive, Premium, and Luxury Segment
Domestic Sales Growth
(yoy, %)
FY 9M
FY2009
9M
FY2010
9M
FY2010
Q1
FY2010
Q2
FY2010
Q3
FY2010
BMW 1,832 2,213 20.8 -8.1 23.6 52.2
Fiat 131 8,051 6045.8 NA NA 1642.7
GM 2,844 3,410 19.9 -71.4 -41.4 405.3
Honda 9,420 6,038 -35.9 -55.7 -36.9 12.0
HMIL 251 317 26.3 -38.7 78.8 393.8
MBIL 2,456 2,397 -2.4 -28.5 -13.0 50.1
Nissan 26 52 100.0 NA 950.0 29.2Skoda 6,581 7,727 17.4 -19.8 19.2 102.4
Toyota 6,869 7,196 4.8 66.9 -28.3 28.4
Audi* 607 977 61.0 NA NA -100.0
VIPL* 0 1,671 NA NA NA NA
Total 31,017 40,049 29.1 -4.9 15.0 106.9
Source: SIAM, Compiled by IMaCS
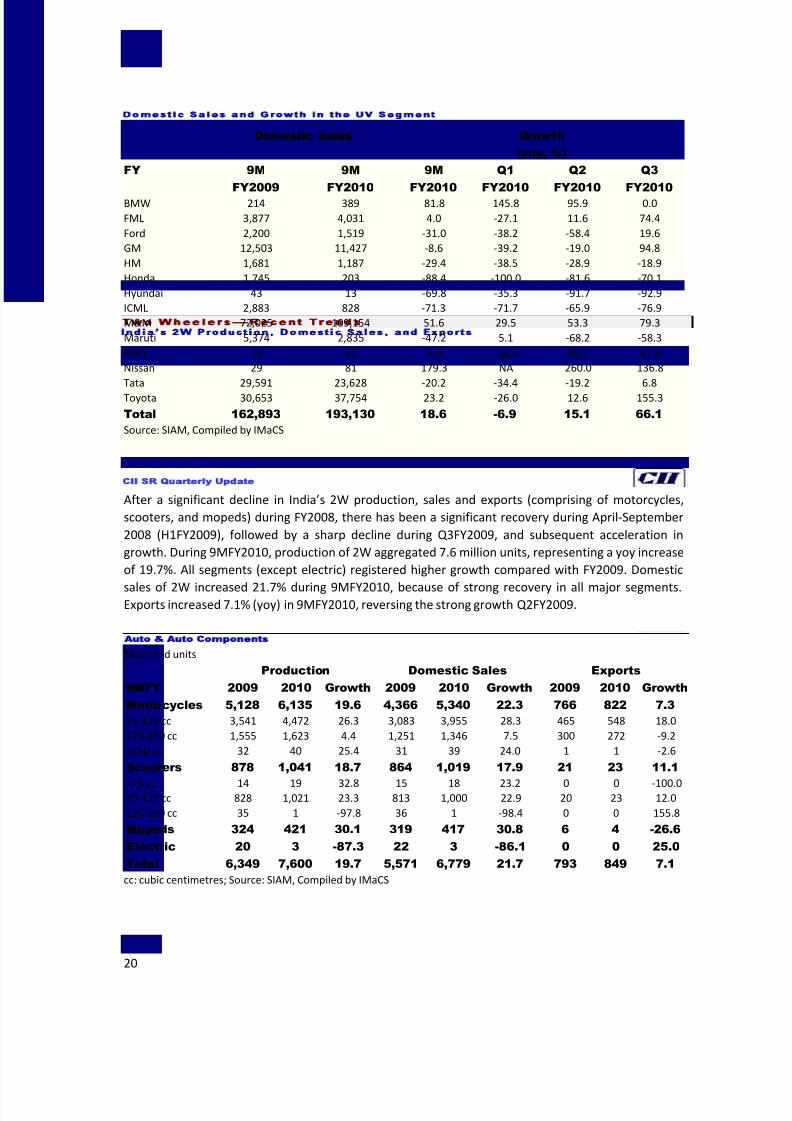
The UV segment is dominated by M&M with a market share of 56.5% followed by Toyota (19.5%), and
TML (12.2%). While Toyota’s market share has remained largely stable over the past 4-5 years, the
market shares of the other leading players has till recently fluctuated within a narrow range of 100-
200 basis points. However, the recent success of M&M Xylo has enabled it to significantly increase its
market share from 47% in FY2009 to 56.5% in 9MFY2010. Toyota has also reported higher sharefollowing the launch of Fortuner and a face-lifted Innova.
8/12/2019 Auto and Auto Ancillaries December20091
http://slidepdf.com/reader/full/auto-and-auto-ancillaries-december20091 20/66
CII SR Quarterly Update
Auto Auto Components
20
Domestic Sales and Growth in the UV Segment
Domestic Sales Growth
(yoy, %)
FY 9M
FY2009
9M
FY2010
9M
FY2010
Q1
FY2010
Q2
FY2010
Q3
FY2010
BMW 214 389 81.8 145.8 95.9 0.0
FML 3,877 4,031 4.0 -27.1 11.6 74.4
Ford 2,200 1,519 -31.0 -38.2 -58.4 19.6
GM 12,503 11,427 -8.6 -39.2 -19.0 94.8
HM 1,681 1,187 -29.4 -38.5 -28.9 -18.9
Honda 1,745 203 -88.4 -100.0 -81.6 -70.1
Hyundai 43 13 -69.8 -35.3 -91.7 -92.9
ICML 2,883 828 -71.3 -71.7 -65.9 -76.9
M&M 72,025 109,154 51.6 29.5 53.3 79.3
Maruti 5,374 2,835 -47.2 5.1 -68.2 -58.3
MBIL 75 81 8.0 -26.9 10.7 47.6
Nissan 29 81 179.3 NA 260.0 136.8
Tata 29,591 23,628 -20.2 -34.4 -19.2 6.8
Toyota 30,653 37,754 23.2 -26.0 12.6 155.3
Total 162,893 193,130 18.6 -6.9 15.1 66.1
Source: SIAM, Compiled by IMaCS
Two Wheelers—Recent Trends
After a significant decline in India’s 2W production, sales and exports (comprising of motorcycles,
scooters, and mopeds) during FY2008, there has been a significant recovery during April-September
2008 (H1FY2009), followed by a sharp decline during Q3FY2009, and subsequent acceleration in
growth. During 9MFY2010, production of 2W aggregated 7.6 million units, representing a yoy increase
of 19.7%. All segments (except electric) registered higher growth compared with FY2009. Domestic
sales of 2W increased 21.7% during 9MFY2010, because of strong recovery in all major segments.Exports increased 7.1% (yoy) in 9MFY2010, reversing the strong growth Q2FY2009.
India’s 2W Production Domestic Sales and Exports Thousand units
Production Domestic Sales Exports
9MFY 2009 2010 Growth 2009 2010 Growth 2009 2010 Growth
Motorcycles 5,128 6,135 19.6 4,366 5,340 22.3 766 822 7.3
75-125 cc 3,541 4,472 26.3 3,083 3,955 28.3 465 548 18.0
125-250 cc 1,555 1,623 4.4 1,251 1,346 7.5 300 272 -9.2
>250 cc 32 40 25.4 31 39 24.0 1 1 -2.6
Scooters 878 1,041 18.7 864 1,019 17.9 21 23 11.1
<75 cc 14 19 32.8 15 18 23.2 0 0 -100.075-125 cc 828 1,021 23.3 813 1,000 22.9 20 23 12.0
125-250 cc 35 1 -97.8 36 1 -98.4 0 0 155.8
Mopeds 324 421 30.1 319 417 30.8 6 4 -26.6
Electric 20 3 -87.3 22 3 -86.1 0 0 25.0
Total 6,349 7,600 19.7 5,571 6,779 21.7 793 849 7.1
cc: cubic centimetres; Source: SIAM, Compiled by IMaCS
8/12/2019 Auto and Auto Ancillaries December20091
http://slidepdf.com/reader/full/auto-and-auto-ancillaries-december20091 21/66
CII SR Quarterly Update
Auto Auto Components
21
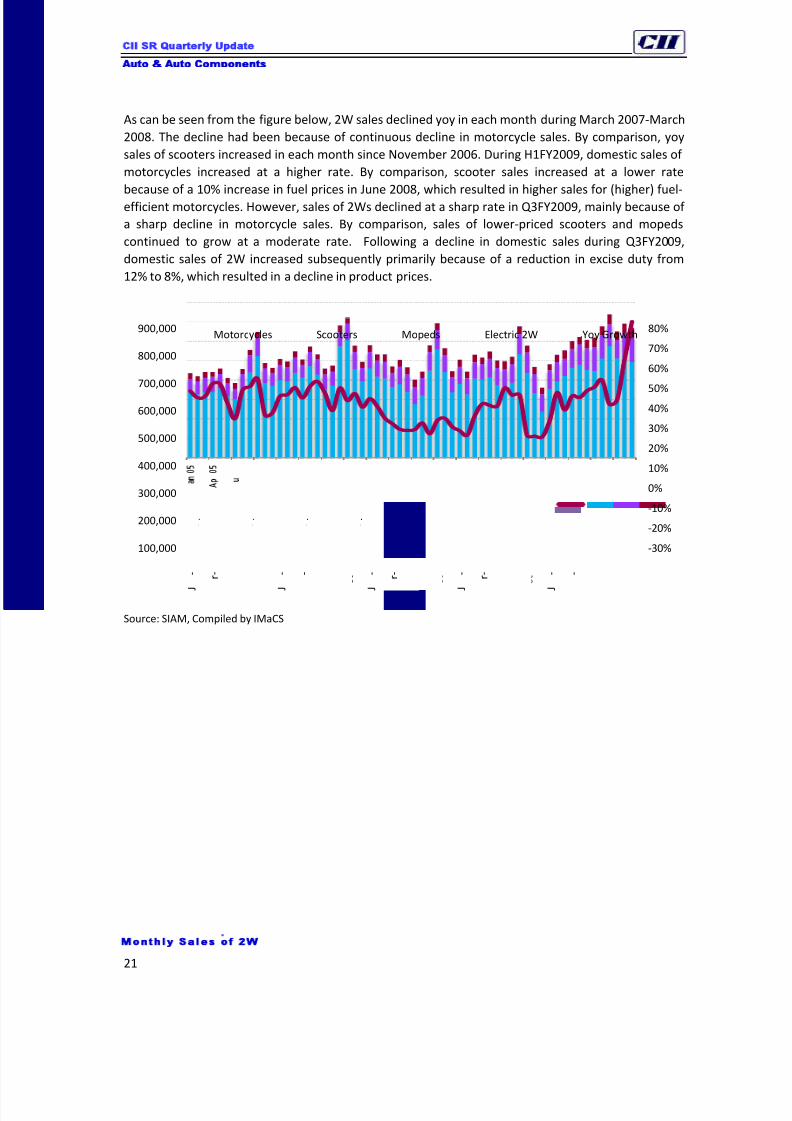
As can be seen from the figure below, 2W sales declined yoy in each month during March 2007-March
2008. The decline had been because of continuous decline in motorcycle sales. By comparison, yoy
sales of scooters increased in each month since November 2006. During H1FY2009, domestic sales of
motorcycles increased at a higher rate. By comparison, scooter sales increased at a lower rate
because of a 10% increase in fuel prices in June 2008, which resulted in higher sales for (higher) fuel-
efficient motorcycles. However, sales of 2Ws declined at a sharp rate in Q3FY2009, mainly because of
a sharp decline in motorcycle sales. By comparison, sales of lower-priced scooters and mopeds
continued to grow at a moderate rate. Following a decline in domestic sales during Q3FY2009,
domestic sales of 2W increased subsequently primarily because of a reduction in excise duty from
12% to 8%, which resulted in a decline in product prices.
Monthly Sales of 2W
Source: SIAM, Compiled by IMaCS
-30%
-20%
-10%
0%
10%
20%
30%
40%50%
60%
70%
80%
100,000
200,000
300,000
400,000
500,000
600,000
700,000
800,000
900,000
J
- r -
J l -
c t -
J
- -
J l -
c t -
J
- r -
J l -
c t -
J
- r -
J l -
c t -
J
- -
J l -
c t -
Motorcycles Scooters Mopeds Electric 2W Yoy Growth
8/12/2019 Auto and Auto Ancillaries December20091
http://slidepdf.com/reader/full/auto-and-auto-ancillaries-december20091 22/66
CII SR Quarterly Update
Auto Auto Components
22
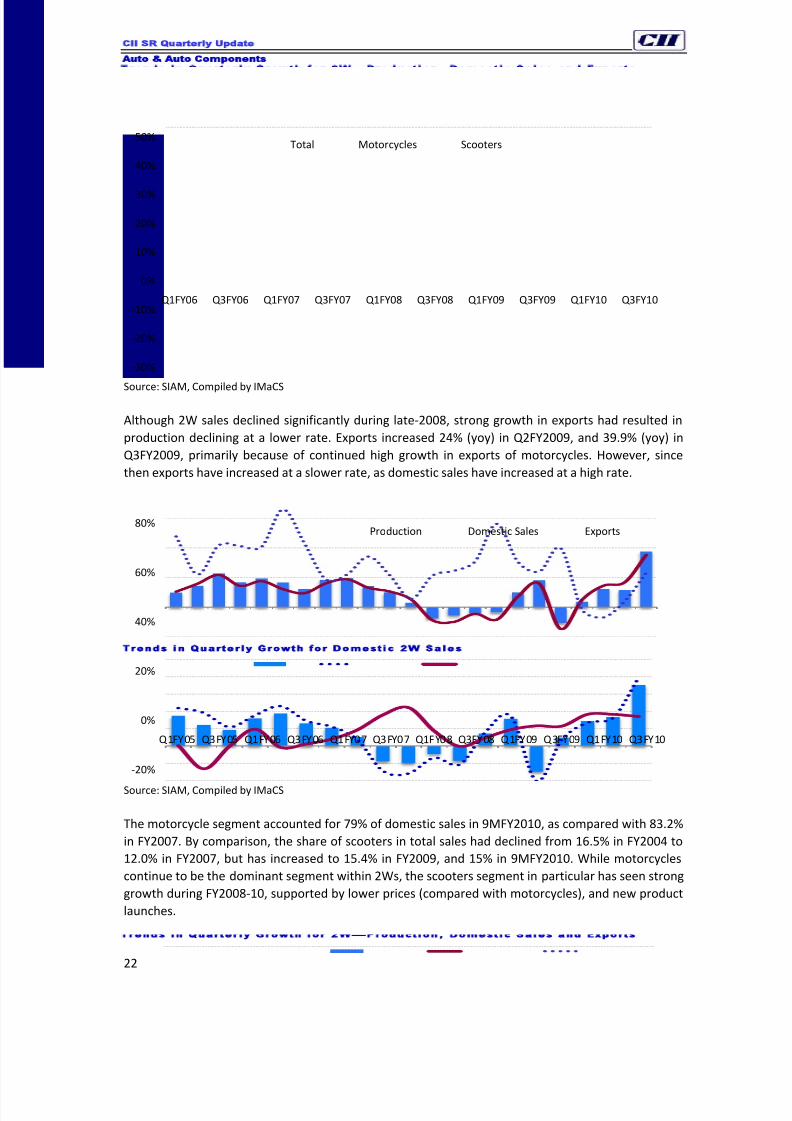
Trends in Quarterly Growth for Domestic 2W Sales
Source: SIAM, Compiled by IMaCS
Although 2W sales declined significantly during late-2008, strong growth in exports had resulted in
production declining at a lower rate. Exports increased 24% (yoy) in Q2FY2009, and 39.9% (yoy) in
Q3FY2009, primarily because of continued high growth in exports of motorcycles. However, since
then exports have increased at a slower rate, as domestic sales have increased at a high rate.
Trends in Quarterly Growth for 2W—Production, Domestic Sales and Exports
Source: SIAM, Compiled by IMaCS
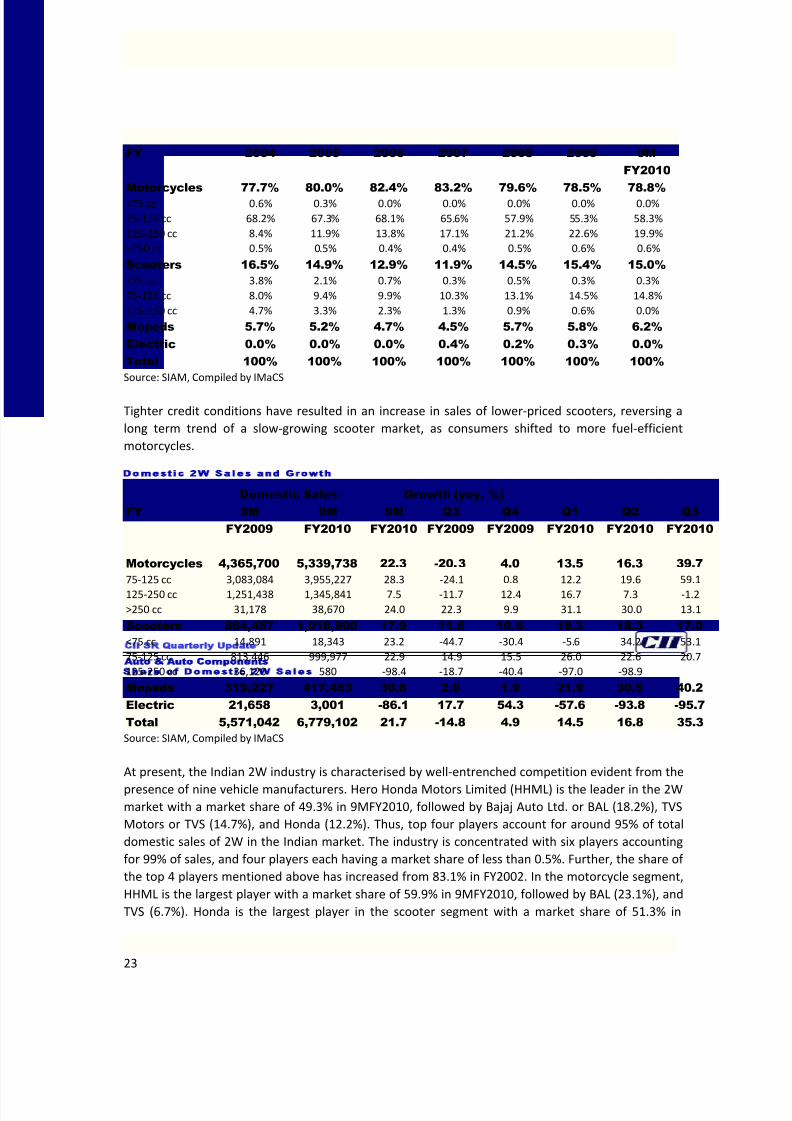
The motorcycle segment accounted for 79% of domestic sales in 9MFY2010, as compared with 83.2%
in FY2007. By comparison, the share of scooters in total sales had declined from 16.5% in FY2004 to
12.0% in FY2007, but has increased to 15.4% in FY2009, and 15% in 9MFY2010. While motorcycles
continue to be the dominant segment within 2Ws, the scooters segment in particular has seen strong
growth during FY2008-10, supported by lower prices (compared with motorcycles), and new product
launches.
-30%
-20%
-10%
0%
10%
20%
30%
40%
50%
Q1FY06 Q3FY06 Q1FY07 Q3FY07 Q1FY08 Q3FY08 Q1FY09 Q3FY09 Q1FY10 Q3FY10
Total Motorcycles Scooters
-20%
0%
20%
40%
60%
80%
Q1FY05 Q3FY05 Q1FY06 Q3FY06 Q1FY07 Q3FY07 Q1FY08 Q3FY08 Q1FY09 Q3FY09 Q1FY10 Q3FY10
Production Domestic Sales Exports
8/12/2019 Auto and Auto Ancillaries December20091
http://slidepdf.com/reader/full/auto-and-auto-ancillaries-december20091 23/66
CII SR Quarterly Update
Auto Auto Components
23
Share of Domestic 2W Sales
FY 2004 2005 2006 2007 2008 2009 9M
FY2010
Motorcycles 77.7% 80.0% 82.4% 83.2% 79.6% 78.5% 78.8%
<75 cc 0.6% 0.3% 0.0% 0.0% 0.0% 0.0% 0.0%
75-125 cc 68.2% 67.3% 68.1% 65.6% 57.9% 55.3% 58.3%
125-250 cc 8.4% 11.9% 13.8% 17.1% 21.2% 22.6% 19.9%
>250 cc 0.5% 0.5% 0.4% 0.4% 0.5% 0.6% 0.6%
Scooters 16.5% 14.9% 12.9% 11.9% 14.5% 15.4% 15.0%
<75 cc 3.8% 2.1% 0.7% 0.3% 0.5% 0.3% 0.3%
75-125 cc 8.0% 9.4% 9.9% 10.3% 13.1% 14.5% 14.8%
125-250 cc 4.7% 3.3% 2.3% 1.3% 0.9% 0.6% 0.0%
Mopeds 5.7% 5.2% 4.7% 4.5% 5.7% 5.8% 6.2%
Electric 0.0% 0.0% 0.0% 0.4% 0.2% 0.3% 0.0%
Total 100% 100% 100% 100% 100% 100% 100%
Source: SIAM, Compiled by IMaCS
Tighter credit conditions have resulted in an increase in sales of lower-priced scooters, reversing a
long term trend of a slow-growing scooter market, as consumers shifted to more fuel-efficient
motorcycles.
Domestic 2W Sales and Growth
Domestic Sales Growth (yoy, %)
FY 9M
FY2009
9M
FY2010
9M
FY2010
Q3
FY2009
Q4
FY2009
Q1
FY2010
Q2
FY2010
Q3
FY2010
Motorcycles 4,365,700 5,339,738 22.3 -20.3 4.0 13.5 16.3 39.7
75-125 cc 3,083,084 3,955,227 28.3 -24.1 0.8 12.2 19.6 59.1
125-250 cc 1,251,438 1,345,841 7.5 -11.7 12.4 16.7 7.3 -1.2
>250 cc 31,178 38,670 24.0 22.3 9.9 31.1 30.0 13.1
Scooters 864,457 1,018,900 17.9 11.6 10.6 18.3 18.3 17.0
<75 cc 14,891 18,343 23.2 -44.7 -30.4 -5.6 34.2 53.1
75-125 cc 813,446 999,977 22.9 14.9 15.5 26.0 22.6 20.7
125-250 cc 36,120 580 -98.4 -18.7 -40.4 -97.0 -98.9
Mopeds 319,227 417,463 30.8 2.9 1.9 21.9 30.5 40.2
Electric 21,658 3,001 -86.1 17.7 54.3 -57.6 -93.8 -95.7
Total 5,571,042 6,779,102 21.7 -14.8 4.9 14.5 16.8 35.3
Source: SIAM, Compiled by IMaCS
At present, the Indian 2W industry is characterised by well-entrenched competition evident from the
presence of nine vehicle manufacturers. Hero Honda Motors Limited (HHML) is the leader in the 2Wmarket with a market share of 49.3% in 9MFY2010, followed by Bajaj Auto Ltd. or BAL (18.2%), TVS
Motors or TVS (14.7%), and Honda (12.2%). Thus, top four players account for around 95% of total
domestic sales of 2W in the Indian market. The industry is concentrated with six players accounting
for 99% of sales, and four players each having a market share of less than 0.5%. Further, the share of
the top 4 players mentioned above has increased from 83.1% in FY2002. In the motorcycle segment,
HHML is the largest player with a market share of 59.9% in 9MFY2010, followed by BAL (23.1%), and
TVS (6.7%). Honda is the largest player in the scooter segment with a market share of 51.3% in
8/12/2019 Auto and Auto Ancillaries December20091
http://slidepdf.com/reader/full/auto-and-auto-ancillaries-december20091 24/66
CII SR Quarterly Update
Auto Auto Components
24
9MFY2010, followed by TVS (21.7%), and HHML (14.1%). During the last few years, while both HHML
and Honda have witnessed an increase in market share in domestic 2W sales, BAL’s share has declined
from 27.8% in FY2002 to 18.2% in 9MFY2010, primarily because of loss of market share in the
motorcycle segment, and negligible presence in the scooter segment.
Trends in Domestic Sales and Growth in the 2W Segment
Domestic Sales Growth
(yoy, %)
FY 9M
FY2009
9M
FY2010
9M
FY2010
Q1
FY2010
Q2
FY2010
Q3
FY2010
Total 5,571,042 6,779,102 21.7 14.5 16.8 35.3
BAL 1,035,173 1,235,548 19.4 -15.2 5.0 96.6
HHML 2,659,773 3,340,287 25.6 24.8 22.5 29.9
Honda 754,692 830,039 10.0 26.0 9.0 -2.3
KMCL 7,277 0 -100.0 -100.0 NA NA
Mahindra 0 37,977 NA NA NA NA
REL 31,148 38,612 24.0 30.8 29.9 13.3Suzuki 94,431 124,190 31.5 27.0 20.2 48.8
TVS 860,679 999,255 16.1 7.8 11.9 31.2
Yamaha 114,435 170,712 49.2 71.2 86.4 12.0
Electrotherm 13,434 2,482 -81.5 -26.9 -92.3 -100.0
Motorcycles 4,365,700 5,339,738 22.3 13.5 16.3 39.7
BAL 1,026,800 1,232,047 20.0 -15.0 5.4 98.4
HHML 2,555,453 3,196,505 25.1 23.2 21.4 31.3
Honda 251,329 307,350 22.3 62.6 17.2 -2.1
KMCL 238 0 -100.0 -100.0 NA NA
REL 31,148 38,612 24.0 30.8 29.9 13.3
Suzuki 32,513 34,138 5.0 -4.0 -4.8 31.8
TVS 353,784 360,374 1.9 -3.5 -4.9 18.4
Yamaha 114,435 170,712 49.2 71.2 86.4 12.0
Scooters 864,457 1,018,900 17.9 18.3 18.3 17.0
BAL 8,373 3,501 -58.2 -44.6 -55.0 -76.8
HHML 104,320 143,782 37.8 80.6 49.1 3.0
Honda 503,363 522,689 3.8 9.8 4.9 -2.5
KMCL 5,552 0 -100.0 -100.0 NA NA
Mahindra 0 37,977 NA NA NA NA
Suzuki 61,918 90,052 45.4 48.7 33.2 55.5
TVS 180,931 220,899 22.1 8.7 18.9 42.3
Mopeds 319,227 417,463 30.8 21.9 30.5 40.2
KMCL 1,487 0 -100.0 -100.0 NA NA
TVS 317,740 417,463 31.4 23.6 30.5 40.2
Electric 21,658 3,001 -86.1 -57.6 -93.8 -95.7
TVS 8,224 519 -93.7 -94.6 -96.4 -88.2
Electrotherm 13,434 2,482 -81.5 -26.9 -92.3 -100.0
Source: SIAM, Compiled by IMaCS
Honda Motorcycle & Scooter India (Pvt) Ltd. (Honda); Kinetic Engineering Ltd. (KEL); Kinetic Motor Company Ltd.
(KMCL); LML Limited (LML); Majestic Auto Ltd. (MAL); Royal Enfield Ltd. (REL)-unit of Eicher; Suzuki Motorcycle India
Pvt Ltd. (Suzuki); TVS Motor Company Ltd. (TVS); Yamaha Motor India Pvt Ltd. (Yamaha); Mahindra: Mahindra Two
Wheelers Ltd.
8/12/2019 Auto and Auto Ancillaries December20091
http://slidepdf.com/reader/full/auto-and-auto-ancillaries-december20091 25/66
CII SR Quarterly Update
Auto Auto Components
25
In the motorcycle segment, the 75-125 cc segment is the largest segment, accounting for 74.1% of
domestic motorcycle sales. Although this segment is served by only five players, competition is
intense amongst the leading three manufacturers—HHML, BAL, and TVS. As can be seen from the
table below, HHML has significantly increased its market share in the segment because of product
improvements in Pleasure and Splendor NXG brands. BAL has reported exceptionally high growth
during Q2FY2010 and Q3FY2010 because of the success of the new Bajaj Discover.
Domestic Sales and Growth in the 75 -125 cc Motorcycle Segment
Domestic Sales Growth
(yoy, %)
FY 9M
FY2009
9M
FY2010
9M
FY2010
Q1
FY2010
Q2
FY2010
Q3
FY2010
BAL 364,483 618,826 69.8 -38.3 38.6 504.2
HHML 2,428,193 3,026,454 24.6 22.4 20.1 32.3
KMCL 238 0 -100.0 -100.0
TVS 245,862 261,686 6.4 14.5 -12.9 25.1
Yamaha 44,308 48,261 8.9 -0.2 13.4 13.8
Total 3,083,084 3,955,227 28.3 12.2 19.6 59.1
Source: SIAM, Compiled by IMaCS
There has been a steep increase in sales of 125-250 cc motorcycles since FY2006. This is also most
competitive sub segment in motorcycles, with BAL being the leader with a market share of 45.6% in
5MFY2010. Bajaj leads the segment with its offerings, Pulsar, Discover, Avenger and XCD. However,
BAL’s market share has declined from 60% in FY2008 because of entry of new players such as Suzuki,
and launch of new products by competitors.
Domestic Sales and Growth in the 125 -250 cc Motorcycle Segment
Domestic Sales Growth
(yoy, %)FY 9M
FY2009
9M
FY2010
9M
FY2010
Q1
FY2010
Q2
FY2010
Q3
FY2010
BAL 662,317 613,221 -7.4 2.0 -15.0 -8.9
HHML 127,260 170,051 33.6 38.9 47.4 13.7
Honda 251,329 307,344 22.3 62.6 17.2 -2.1
Suzuki 32,513 34,095 4.9 -4.1 -5.0 31.8
TVS 107,922 98,688 -8.6 -39.3 18.1 4.9
Yamaha 70,097 122,442 74.7 146.9 149.1 11.5
Total 1,251,438 1,345,841 7.5 16.7 7.3 -1.2
Source: SIAM, Compiled by IMaCS
The >250 cc motorcycle segment accounts for only 0.7% of motorcycle sales and is served by twoplayers—REL and Yamaha. Honda and Suzuki Motorcycles have also entered this segment. REL
accounted for 99.9% of domestic sales in this segment during 9MFY2010.
After an 11.6% increase in domestic sales during FY2008, the scooter segment has reported lower
growth of 9.1% during FY2009, mainly because of a decline in the <75 cc and 125-250 cc segment.
Sales in the higher 125-250 cc have continued their long-term decline, because of continued shift
towards motorcycles. Although domestic sales of scooters increased 17.9% (yoy) in 9MFY2010, this
8/12/2019 Auto and Auto Ancillaries December20091
http://slidepdf.com/reader/full/auto-and-auto-ancillaries-december20091 26/66
CII SR Quarterly Update
Auto Auto Components
26
growth may not be sustained in the long-term, especially with an expectation of future fuel price
increases. While the share of <75 cc segment in total scooter sales has declined from 28.4% in FY2003
to 1.8% in 9MFY2010, the share of >125 cc segment has declined from 34.7% to 0.1%. By comparison,
the share of 75-125 cc segment has increased from 36.9% in FY2003 to 98% in 9MFY2010. In the
scooter segment, the <75 cc segment is now served only by TVS. The 75-125 cc segment accounts for
98% of domestic scooter sales. This sub-segment is served by six players, with Honda being the
market leader with a share of 52.2%, followed by TVS (20.3%). BAL has witnessed a significant decline
in market share, with its market share declining from 5.9% in FY2004 to 0.4% in 9MFY2010. By
comparison, Suzuki’s market share has increased from 2.6% in FY2008 to 9% in 9MFY2010 because of
significant success of its ̀ Access125 cc’.
Domestic Sales and Growth in the 75 -125 cc Scooter Segment
Domestic Sales Growth
(yoy, %)
FY 9M
FY2009
9M
FY2010
9M
FY2010
Q1
FY2010
Q2
FY2010
Q3
FY2010
BAL 8,373 3,501 -58.2 -44.6 -55.0 -76.8HHML 104,320 143,782 37.8 80.6 49.1 3.0
Honda 471,457 522,399 10.8 17.8 12.3 3.3
KMCL 959 0 -100.0 -100.0 NA NA
Mahindra 0 37,687 NA NA NA NA
Suzuki 61,918 90,052 45.4 48.7 33.2 55.5
TVS 166,419 202,556 21.7 9.6 17.9 41.3
Total 813,446 999,977 22.9 26.0 22.6 20.7
Source: SIAM, Compiled by IMaCS
The moped segment comprises of only <75 cc segment, and is presently served by only one player TVS
after Kinetic Motor Company was sold.
Commerc ia l Vehic les —Recent Trends
During FY2004-07, CV sales volumes growth in the domestic market had been healthy led by buoyant
economic activity, easy access to finance, entry of new truck financing companies, increased
momentum in highway construction, better operating economics of new trucks, and a Supreme Court
(SC) order prohibiting overloading of trucks. However, continued hardening of interest rates and a
slowdown in economic activity has impacted CV sales volumes since FY2008. Since mid-2008,
domestic CV sales volumes have declined significantly because of an economic slowdown, slowdown
in index of industrial production (IIP), tighter credit conditions and constraints in the availability of
vehicle finance from banks and non-banking finance companies (NBFCs). Though in-house vehicle
financing of major manufacturers has increased, the additional credit flow was unable to fully offset
the decrease in credit availability from outside sources. As compared with a year on year (yoy) growth
of 9.2% in Q1FY2009, domestic CV sales declined 1.8% (yoy) during Q2FY2009, and by a sharp rate of
47.8% (yoy) in Q3FY2009, and 35.7% (yoy) in Q4FY2009. The rate of decline was lower at 12.1% (yoy)
in Q1FY2010 primarily because of 16% (yoy) growth in LCV segment. A significant proportion of trucks
are purchased by small truck operators in the unorganised sector, who may have to pay a relatively
higher rate of interest as compared with large-fleet operators, and are more vulnerable to interest
rate fluctuations and slowdown in economic activity.
8/12/2019 Auto and Auto Ancillaries December20091
http://slidepdf.com/reader/full/auto-and-auto-ancillaries-december20091 27/66
CII SR Quarterly Update
Auto Auto Components
27
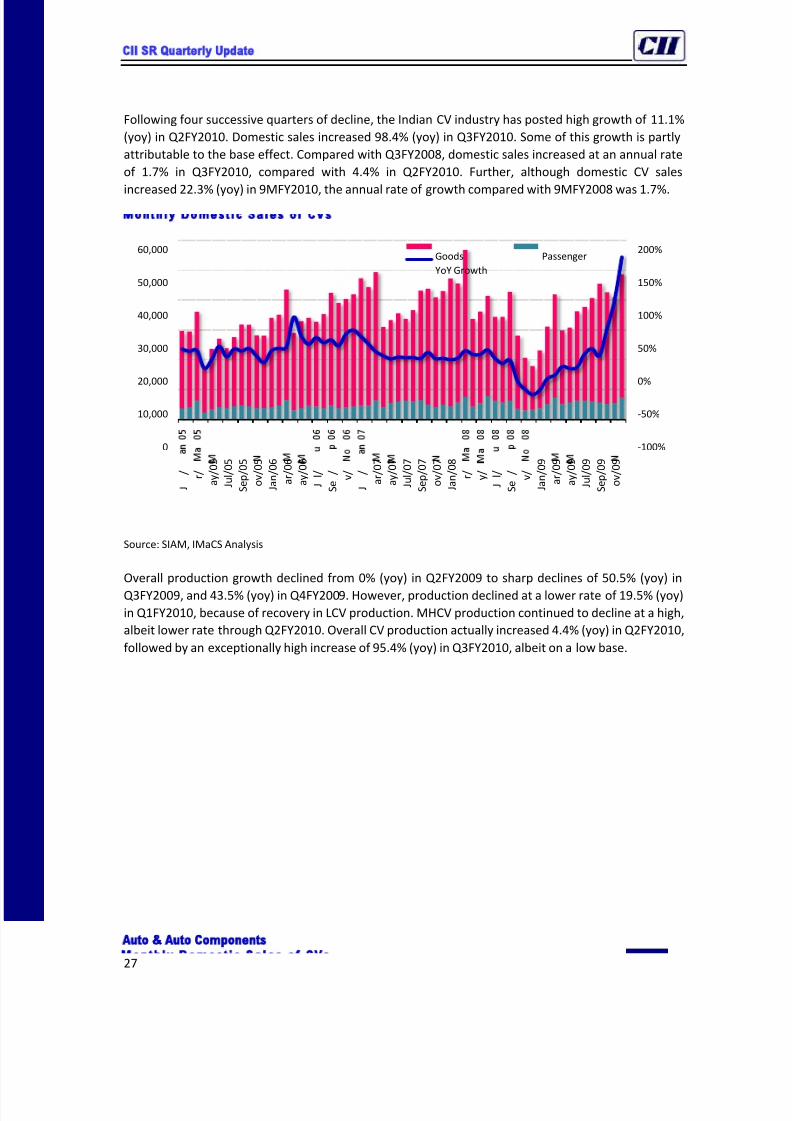
Following four successive quarters of decline, the Indian CV industry has posted high growth of 11.1%
(yoy) in Q2FY2010. Domestic sales increased 98.4% (yoy) in Q3FY2010. Some of this growth is partly
attributable to the base effect. Compared with Q3FY2008, domestic sales increased at an annual rate
of 1.7% in Q3FY2010, compared with 4.4% in Q2FY2010. Further, although domestic CV sales
increased 22.3% (yoy) in 9MFY2010, the annual rate of growth compared with 9MFY2008 was 1.7%.
Monthly Domestic Sales of CVs
Source: SIAM, IMaCS Analysis
Overall production growth declined from 0% (yoy) in Q2FY2009 to sharp declines of 50.5% (yoy) in
Q3FY2009, and 43.5% (yoy) in Q4FY2009. However, production declined at a lower rate of 19.5% (yoy)
in Q1FY2010, because of recovery in LCV production. MHCV production continued to decline at a high,
albeit lower rate through Q2FY2010. Overall CV production actually increased 4.4% (yoy) in Q2FY2010,
followed by an exceptionally high increase of 95.4% (yoy) in Q3FY2010, albeit on a low base.
-100%
-50%
0%
50%
100%
150%
200%
0
10,000
20,000
30,000
40,000
50,000
60,000
J
/ r / a y / 0 5
J u l / 0 5
S e p / 0 5
o v / 0 5
J a n / 0 6
a r / 0 6
a y / 0 6
J l /
S e
/ v /
J
/ a r / 0 7
a y / 0 7
J u l / 0 7
S e p / 0 7
o v / 0 7
J a n / 0 8
r / y /
J l /
S e
/ v /
J a n / 0 9
a r / 0 9
a y / 0 9
J u l / 0 9
S e p / 0 9
o v / 0 9
Goods Passenger
YoY Growth
8/12/2019 Auto and Auto Ancillaries December20091
http://slidepdf.com/reader/full/auto-and-auto-ancillaries-december20091 28/66
CII SR Quarterly Update
Auto Auto Components
28
India’s CV Production Domestic Sales and Exports thousands
Production Domestic Sales Exports
9MFY 2009 2010 Growth 2009 2010 Growth 2009 2010 Growth
MHCV 157.37 161.99 2.9 142.53 156.39 9.7 13.43 14.74 9.8
Passenger 31.99 33.01 3.2 25.61 28.59 11.7 6.01 4.08 -32.0
7.5-12 t, seats > 13 5.99 7.25 21.1 5.19 6.96 34.0 0.27 0.43 61.4
12-16.5 t, seats <13 0.00 0.15 NA 0.00 0.15 NA 0.00 0.00 NA
12-16.5 t, seats > 13 25.98 25.55 -1.6 20.39 21.43 5.1 5.74 3.65 -36.4
>16.2 t, seats > 13 0.03 0.06 134.6 0.02 0.06 166.7 0.00 0.00 NA
Goods 125.38 128.98 2.9 116.92 127.80 9.3 7.42 10.66 43.7
7.5-12 t 21.55 29.85 38.6 20.65 28.31 37.1 1.27 2.27 78.7
12-16.2 t 37.01 35.39 -4.4 33.23 31.36 -5.6 4.56 5.38 18.0
RV, 16.2-25 t 53.19 51.68 -2.8 49.78 48.66 -2.2 1.39 2.29 64.3
RV, > 25 t 4.82 8.85 83.5 4.54 8.76 92.9 0.05 0.34 660.0
HT, 16.2-26.4 t 0.00 0.00 NA 0.00 0.00 NA 0.00 0.28 NA
HT, 26.4-35.2 t 3.39 1.68 -50.4 3.87 4.66 20.7 0.02 0.04 95.2
HT, >35.2 t 5.43 1.53 -71.8 4.86 6.05 24.5 0.14 0.07 -48.9
LCVs 169.86 214.66 26.4 145.70 196.18 34.6 22.56 16.00 -29.1
Passenger 22.39 25.13 12.3 19.82 24.49 23.6 4.30 2.12 -50.8
<5 t, seats >13 7.47 9.34 24.9 7.81 9.69 24.2 0.24 0.27 10.8
5-7.5 t, seats >13 14.91 15.80 5.9 12.01 14.80 23.2 4.06 1.85 -54.4
Goods 147.48 189.53 28.5 125.88 171.69 36.4 18.26 13.88 -24.0
<3.5 t 122.71 159.53 30.0 106.37 145.22 36.5 11.86 10.41 -12.3
3.5-5 t 2.50 5.39 115.5 2.25 2.20 -2.2 0.10 0.11 10.8
5-7.5 t 22.26 24.61 10.5 17.26 24.27 40.6 6.30 3.36 -46.7
Total 327.24 376.66 15.1 288.23 352.58 22.3 35.99 30.74 -14.6
t: tonnes; RV: Rigid Vehicles; HT: Haulage tractors
Source: SIAM, Compiled by IMaCS
Domestic CV sales increased 22.3% (yoy) during 9MFY2010. The sales growth has been caused by a
sharp increase of 34.6% (yoy) in LCV sales. Domestic sales of LCV goods carriers, which had declined
during Q3FY2009 and Q4FY2009, increased 36.4% (yoy) in 9MFY2010, primarily because of strong
growth in low and medium tonnage (<3.5 and 3.5-5 tonnes) segment. Domestic sales of MHCV goods
carriers have also recovered since Q2FY2010, compared with a decline of 58.8% (yoy) in Q4FY2009,
and 65.2% (yoy) in Q3FY2009.
8/12/2019 Auto and Auto Ancillaries December20091
http://slidepdf.com/reader/full/auto-and-auto-ancillaries-december20091 29/66
CII SR Quarterly Update
Auto Auto Components
29
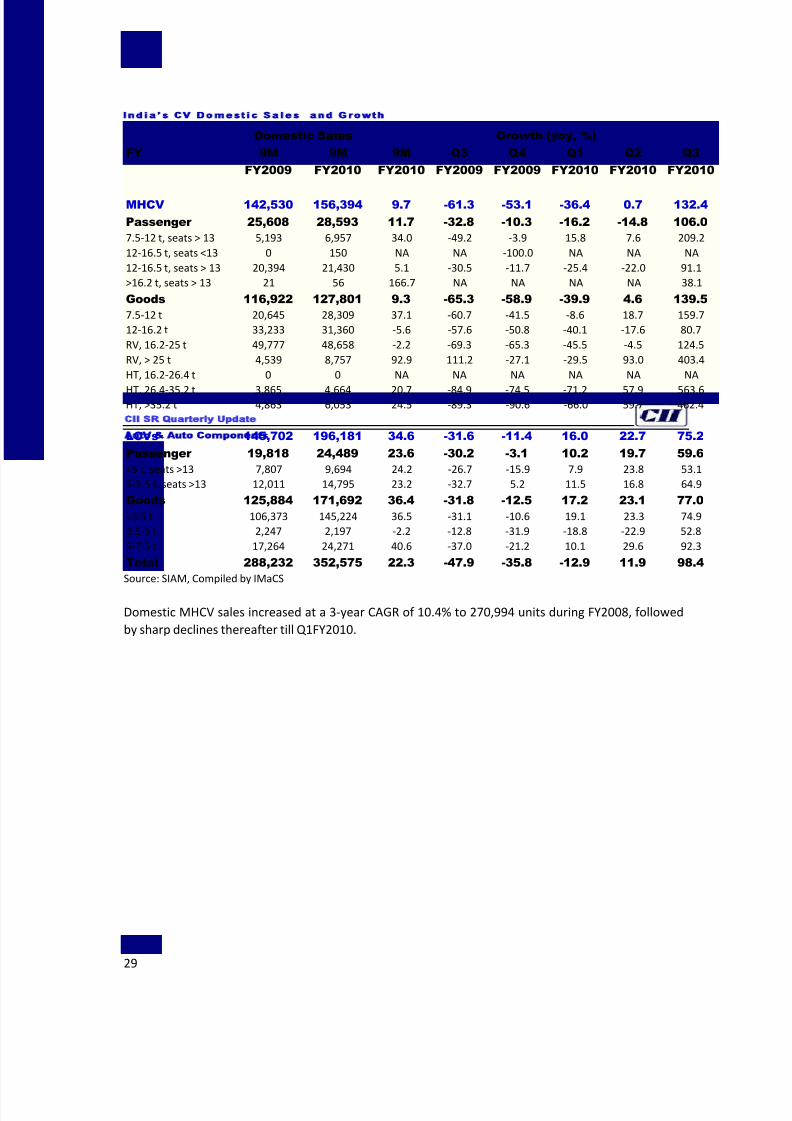
India’s CV Domestic Sales and Growth
Domestic Sales Growth (yoy, %)
FY 9M
FY2009
9M
FY2010
9M
FY2010
Q3
FY2009
Q4
FY2009
Q1
FY2010
Q2
FY2010
Q3
FY2010
MHCV 142,530 156,394 9.7 -61.3 -53.1 -36.4 0.7 132.4
Passenger 25,608 28,593 11.7 -32.8 -10.3 -16.2 -14.8 106.0
7.5-12 t, seats > 13 5,193 6,957 34.0 -49.2 -3.9 15.8 7.6 209.2
12-16.5 t, seats <13 0 150 NA NA -100.0 NA NA NA
12-16.5 t, seats > 13 20,394 21,430 5.1 -30.5 -11.7 -25.4 -22.0 91.1
>16.2 t, seats > 13 21 56 166.7 NA NA NA NA 38.1
Goods 116,922 127,801 9.3 -65.3 -58.9 -39.9 4.6 139.5
7.5-12 t 20,645 28,309 37.1 -60.7 -41.5 -8.6 18.7 159.7
12-16.2 t 33,233 31,360 -5.6 -57.6 -50.8 -40.1 -17.6 80.7
RV, 16.2-25 t 49,777 48,658 -2.2 -69.3 -65.3 -45.5 -4.5 124.5
RV, > 25 t 4,539 8,757 92.9 111.2 -27.1 -29.5 93.0 403.4
HT, 16.2-26.4 t 0 0 NA NA NA NA NA NA
HT, 26.4-35.2 t 3,865 4,664 20.7 -84.9 -74.5 -71.2 57.9 563.6HT, >35.2 t 4,863 6,053 24.5 -89.3 -90.6 -66.0 59.7 462.4
LCVs 145,702 196,181 34.6 -31.6 -11.4 16.0 22.7 75.2
Passenger 19,818 24,489 23.6 -30.2 -3.1 10.2 19.7 59.6
<5 t, seats >13 7,807 9,694 24.2 -26.7 -15.9 7.9 23.8 53.1
5-7.5 t, seats >13 12,011 14,795 23.2 -32.7 5.2 11.5 16.8 64.9
Goods 125,884 171,692 36.4 -31.8 -12.5 17.2 23.1 77.0
<3.5 t 106,373 145,224 36.5 -31.1 -10.6 19.1 23.3 74.9
3.5-5 t 2,247 2,197 -2.2 -12.8 -31.9 -18.8 -22.9 52.8
5-7.5 t 17,264 24,271 40.6 -37.0 -21.2 10.1 29.6 92.3
Total 288,232 352,575 22.3 -47.9 -35.8 -12.9 11.9 98.4
Source: SIAM, Compiled by IMaCS
Domestic MHCV sales increased at a 3-year CAGR of 10.4% to 270,994 units during FY2008, followed
by sharp declines thereafter till Q1FY2010.
8/12/2019 Auto and Auto Ancillaries December20091
http://slidepdf.com/reader/full/auto-and-auto-ancillaries-december20091 30/66
CII SR Quarterly Update
Auto Auto Components
30
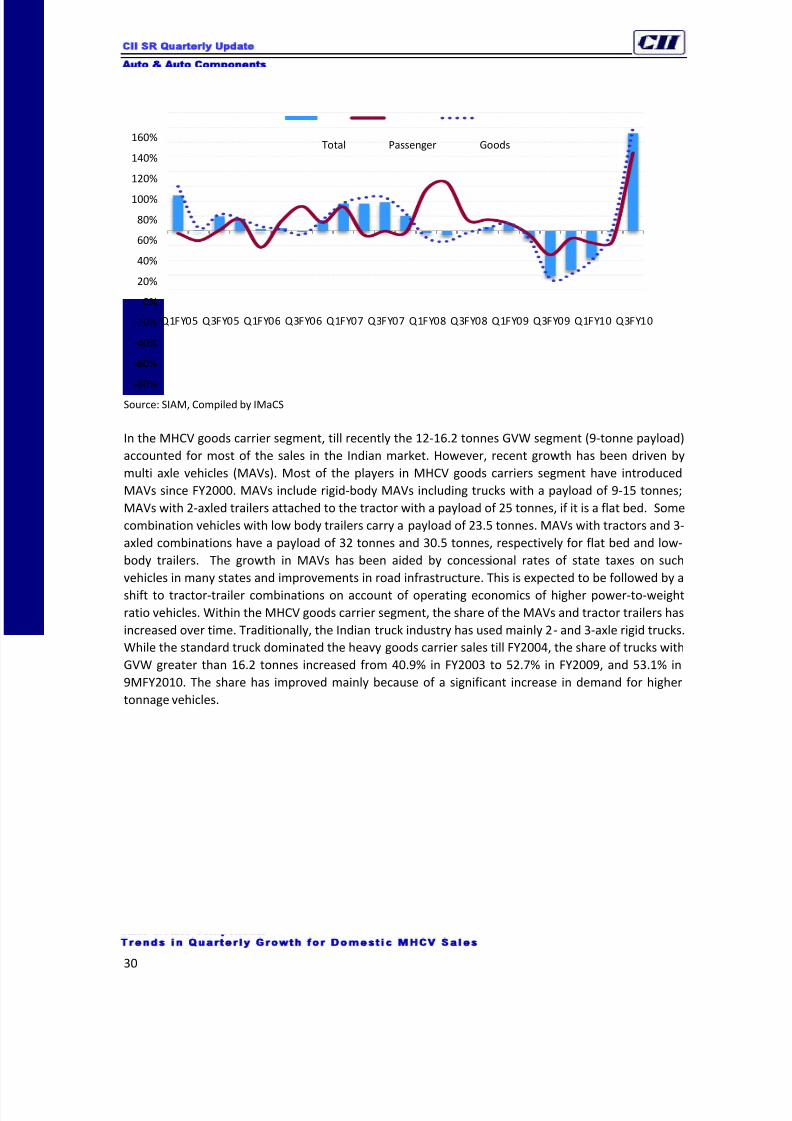
Trends in Quarterly Growth for Domestic MHCV Sales
Source: SIAM, Compiled by IMaCS
In the MHCV goods carrier segment, till recently the 12-16.2 tonnes GVW segment (9-tonne payload)
accounted for most of the sales in the Indian market. However, recent growth has been driven by
multi axle vehicles (MAVs). Most of the players in MHCV goods carriers segment have introduced
MAVs since FY2000. MAVs include rigid-body MAVs including trucks with a payload of 9-15 tonnes;
MAVs with 2-axled trailers attached to the tractor with a payload of 25 tonnes, if it is a flat bed. Some
combination vehicles with low body trailers carry a payload of 23.5 tonnes. MAVs with tractors and 3-
axled combinations have a payload of 32 tonnes and 30.5 tonnes, respectively for flat bed and low-
body trailers. The growth in MAVs has been aided by concessional rates of state taxes on such
vehicles in many states and improvements in road infrastructure. This is expected to be followed by a
shift to tractor-trailer combinations on account of operating economics of higher power-to-weight
ratio vehicles. Within the MHCV goods carrier segment, the share of the MAVs and tractor trailers has
increased over time. Traditionally, the Indian truck industry has used mainly 2- and 3-axle rigid trucks.
While the standard truck dominated the heavy goods carrier sales till FY2004, the share of trucks with
GVW greater than 16.2 tonnes increased from 40.9% in FY2003 to 52.7% in FY2009, and 53.1% in
9MFY2010. The share has improved mainly because of a significant increase in demand for higher
tonnage vehicles.
-80%
-60%
-40%
-20%
0%
20%
40%
60%
80%
100%
120%
140%
160%
Q1FY05 Q3FY05 Q1FY06 Q3FY06 Q1FY07 Q3FY07 Q1FY08 Q3FY08 Q1FY09 Q3FY09 Q1FY10 Q3FY10
Total Passenger Goods
8/12/2019 Auto and Auto Ancillaries December20091
http://slidepdf.com/reader/full/auto-and-auto-ancillaries-december20091 31/66
CII SR Quarterly Update
Auto Auto Components
31
Share of Domestic MHCV Sales
FY 2003 2004 2005 2006 2007 2008 2009 2010
(9M)
Passenger 100 100 100 100 100 100 100 100
7.5-12 t, seats > 13 2.4 6.8 9.0 15.5 14.2 14.5 19.4 24.3
12-16.5 t, seats <13 0.0 0.0 0.0 0.0 0.0 0.0 0.0 0.5
12-16.5 t, seats > 13 97.6 93.2 90.7 84.5 85.8 85.5 80.5 74.9
>16.2 t, seats > 13 0.0 0.0 0.3 0.0 0.0 0.0 0.1 0.2
Goods 100 100 100 100 100 100 100 100
7.5-12 t 12.4 11.6 15.0 18.0 14.7 17.3 18.6 22.2
12-16.2 t 46.7 45.1 40.1 34.0 26.0 25.6 28.7 24.5
RV, 16.2-25 t 12.9 14.2 12.7 22.0 48.9 45.3 41.9 38.1
RV, > 25 t 24.1 23.3 25.2 19.3 0.2 1.1 4.0 6.9
HT, 16.2-26.4 t 0.3 0.0 0.0 0.0 0.0 0.0 0.0 0.0
HT, 26.4-35.2 t 3.4 5.6 6.6 4.5 3.5 3.8 3.2 3.6
HT, >35.2 t 0.2 0.2 0.3 2.3 6.7 6.8 3.6 4.7
Source: SIAM, Compiled by IMaCS
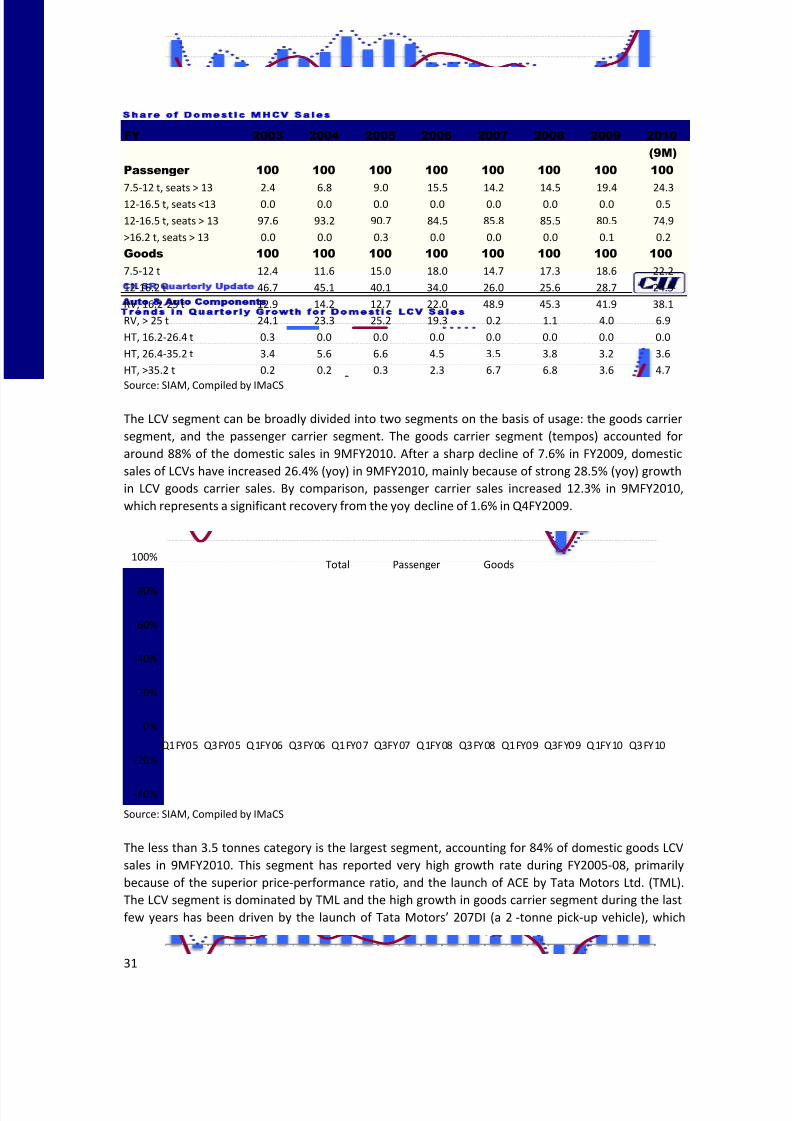
The LCV segment can be broadly divided into two segments on the basis of usage: the goods carrier
segment, and the passenger carrier segment. The goods carrier segment (tempos) accounted for
around 88% of the domestic sales in 9MFY2010. After a sharp decline of 7.6% in FY2009, domestic
sales of LCVs have increased 26.4% (yoy) in 9MFY2010, mainly because of strong 28.5% (yoy) growth
in LCV goods carrier sales. By comparison, passenger carrier sales increased 12.3% in 9MFY2010,
which represents a significant recovery from the yoy decline of 1.6% in Q4FY2009.
Trends in Quarterly Growth for Domestic LCV Sales
Source: SIAM, Compiled by IMaCS
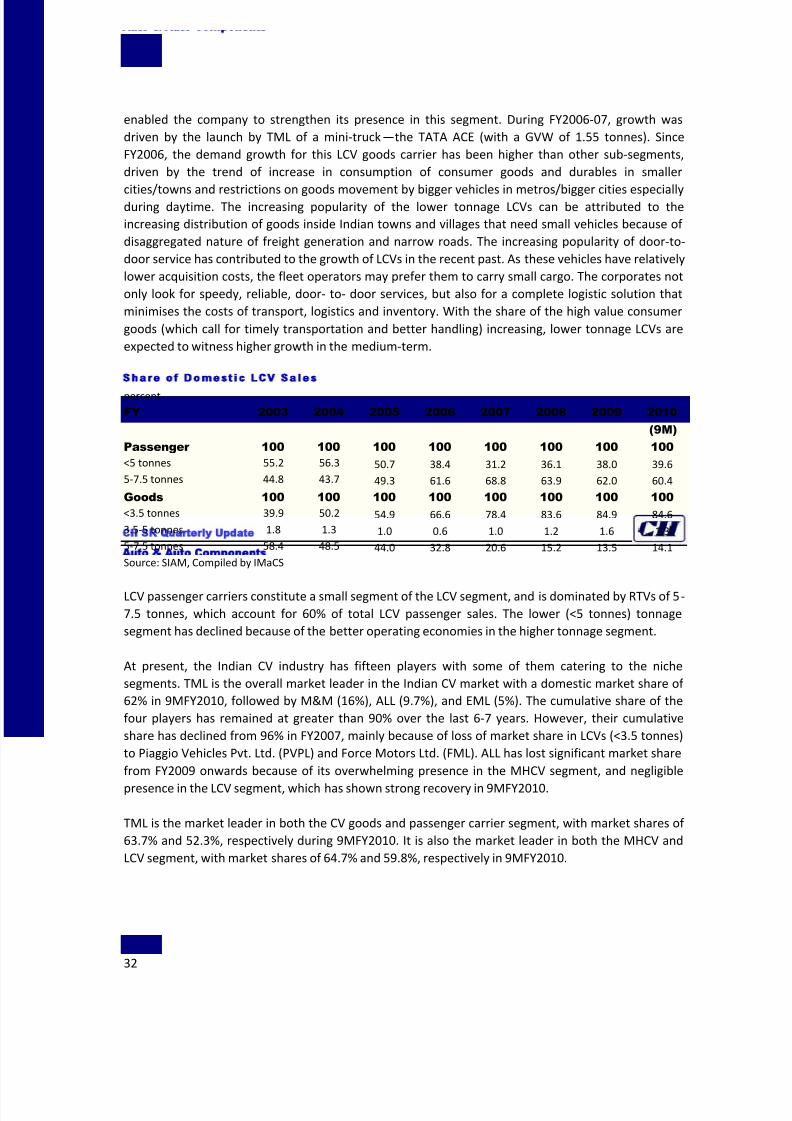
The less than 3.5 tonnes category is the largest segment, accounting for 84% of domestic goods LCV
sales in 9MFY2010. This segment has reported very high growth rate during FY2005-08, primarily
because of the superior price-performance ratio, and the launch of ACE by Tata Motors Ltd. (TML).
The LCV segment is dominated by TML and the high growth in goods carrier segment during the last
few years has been driven by the launch of Tata Motors’ 207DI (a 2 -tonne pick-up vehicle), which
-40%
-20%
0%
20%
40%
60%
80%
100%
Q1FY05 Q3FY05 Q1FY06 Q3FY06 Q1FY07 Q3FY07 Q1FY08 Q3FY08 Q1FY09 Q3FY09 Q1FY10 Q3FY10
Total Passenger Goods
8/12/2019 Auto and Auto Ancillaries December20091
http://slidepdf.com/reader/full/auto-and-auto-ancillaries-december20091 32/66
CII SR Quarterly Update
Auto Auto Components
32
enabled the company to strengthen its presence in this segment. During FY2006-07, growth was
driven by the launch by TML of a mini-truck—the TATA ACE (with a GVW of 1.55 tonnes). Since
FY2006, the demand growth for this LCV goods carrier has been higher than other sub-segments,
driven by the trend of increase in consumption of consumer goods and durables in smaller
cities/towns and restrictions on goods movement by bigger vehicles in metros/bigger cities especially
during daytime. The increasing popularity of the lower tonnage LCVs can be attributed to the
increasing distribution of goods inside Indian towns and villages that need small vehicles because of
disaggregated nature of freight generation and narrow roads. The increasing popularity of door-to-
door service has contributed to the growth of LCVs in the recent past. As these vehicles have relatively
lower acquisition costs, the fleet operators may prefer them to carry small cargo. The corporates not
only look for speedy, reliable, door- to- door services, but also for a complete logistic solution that
minimises the costs of transport, logistics and inventory. With the share of the high value consumer
goods (which call for timely transportation and better handling) increasing, lower tonnage LCVs are
expected to witness higher growth in the medium-term.
Share of Domestic LCV Sales
percent
FY 2003 2004 2005 2006 2007 2008 2009 2010
(9M)
Passenger 100 100 100 100 100 100 100 100
<5 tonnes 55.2 56.3 50.7 38.4 31.2 36.1 38.0 39.6
5-7.5 tonnes 44.8 43.7 49.3 61.6 68.8 63.9 62.0 60.4
Goods 100 100 100 100 100 100 100 100 <3.5 tonnes 39.9 50.2 54.9 66.6 78.4 83.6 84.9 84.6
3.5-5 tonnes 1.8 1.3 1.0 0.6 1.0 1.2 1.6 1.3
5-7.5 tonnes 58.4 48.5 44.0 32.8 20.6 15.2 13.5 14.1
Source: SIAM, Compiled by IMaCS
LCV passenger carriers constitute a small segment of the LCV segment, and is dominated by RTVs of 5-
7.5 tonnes, which account for 60% of total LCV passenger sales. The lower (<5 tonnes) tonnage
segment has declined because of the better operating economies in the higher tonnage segment.
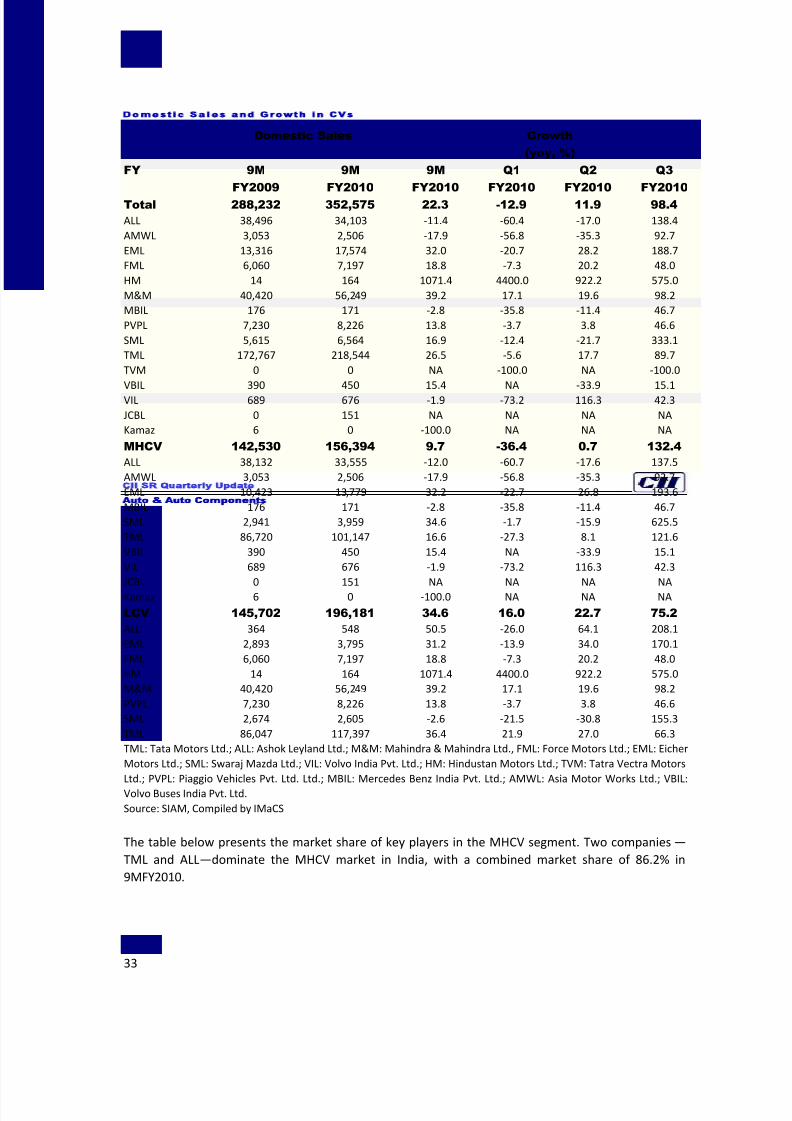
At present, the Indian CV industry has fifteen players with some of them catering to the niche
segments. TML is the overall market leader in the Indian CV market with a domestic market share of
62% in 9MFY2010, followed by M&M (16%), ALL (9.7%), and EML (5%). The cumulative share of the
four players has remained at greater than 90% over the last 6-7 years. However, their cumulative
share has declined from 96% in FY2007, mainly because of loss of market share in LCVs (<3.5 tonnes)
to Piaggio Vehicles Pvt. Ltd. (PVPL) and Force Motors Ltd. (FML). ALL has lost significant market share
from FY2009 onwards because of its overwhelming presence in the MHCV segment, and negligible
presence in the LCV segment, which has shown strong recovery in 9MFY2010.
TML is the market leader in both the CV goods and passenger carrier segment, with market shares of
63.7% and 52.3%, respectively during 9MFY2010. It is also the market leader in both the MHCV and
LCV segment, with market shares of 64.7% and 59.8%, respectively in 9MFY2010.
8/12/2019 Auto and Auto Ancillaries December20091
http://slidepdf.com/reader/full/auto-and-auto-ancillaries-december20091 33/66
CII SR Quarterly Update
Auto Auto Components
33
Domestic Sales and Growth in CVs
Domestic Sales Growth
(yoy, %)
FY 9M
FY2009
9M
FY2010
9M
FY2010
Q1
FY2010
Q2
FY2010
Q3
FY2010
Total 288,232 352,575 22.3 -12.9 11.9 98.4
ALL 38,496 34,103 -11.4 -60.4 -17.0 138.4
AMWL 3,053 2,506 -17.9 -56.8 -35.3 92.7
EML 13,316 17,574 32.0 -20.7 28.2 188.7
FML 6,060 7,197 18.8 -7.3 20.2 48.0
HM 14 164 1071.4 4400.0 922.2 575.0
M&M 40,420 56,249 39.2 17.1 19.6 98.2
MBIL 176 171 -2.8 -35.8 -11.4 46.7
PVPL 7,230 8,226 13.8 -3.7 3.8 46.6
SML 5,615 6,564 16.9 -12.4 -21.7 333.1
TML 172,767 218,544 26.5 -5.6 17.7 89.7
TVM 0 0 NA -100.0 NA -100.0
VBIL 390 450 15.4 NA -33.9 15.1
VIL 689 676 -1.9 -73.2 116.3 42.3
JCBL 0 151 NA NA NA NA
Kamaz 6 0 -100.0 NA NA NA
MHCV 142,530 156,394 9.7 -36.4 0.7 132.4
ALL 38,132 33,555 -12.0 -60.7 -17.6 137.5
AMWL 3,053 2,506 -17.9 -56.8 -35.3 92.7
EML 10,423 13,779 32.2 -22.7 26.8 193.6
MBIL 176 171 -2.8 -35.8 -11.4 46.7
SML 2,941 3,959 34.6 -1.7 -15.9 625.5
TML 86,720 101,147 16.6 -27.3 8.1 121.6
VBIL 390 450 15.4 NA -33.9 15.1
VIL 689 676 -1.9 -73.2 116.3 42.3
JCBL 0 151 NA NA NA NA
Kamaz 6 0 -100.0 NA NA NA
LCV 145,702 196,181 34.6 16.0 22.7 75.2
ALL 364 548 50.5 -26.0 64.1 208.1
EML 2,893 3,795 31.2 -13.9 34.0 170.1
FML 6,060 7,197 18.8 -7.3 20.2 48.0
HM 14 164 1071.4 4400.0 922.2 575.0
M&M 40,420 56,249 39.2 17.1 19.6 98.2
PVPL 7,230 8,226 13.8 -3.7 3.8 46.6
SML 2,674 2,605 -2.6 -21.5 -30.8 155.3
TML 86,047 117,397 36.4 21.9 27.0 66.3
TML: Tata Motors Ltd.; ALL: Ashok Leyland Ltd.; M&M: Mahindra & Mahindra Ltd., FML: Force Motors Ltd.; EML: Eicher
Motors Ltd.; SML: Swaraj Mazda Ltd.; VIL: Volvo India Pvt. Ltd.; HM: Hindustan Motors Ltd.; TVM: Tatra Vectra Motors
Ltd.; PVPL: Piaggio Vehicles Pvt. Ltd. Ltd.; MBIL: Mercedes Benz India Pvt. Ltd.; AMWL: Asia Motor Works Ltd.; VBIL:
Volvo Buses India Pvt. Ltd.
Source: SIAM, Compiled by IMaCS
The table below presents the market share of key players in the MHCV segment. Two companies —
TML and ALL—dominate the MHCV market in India, with a combined market share of 86.2% in
9MFY2010.
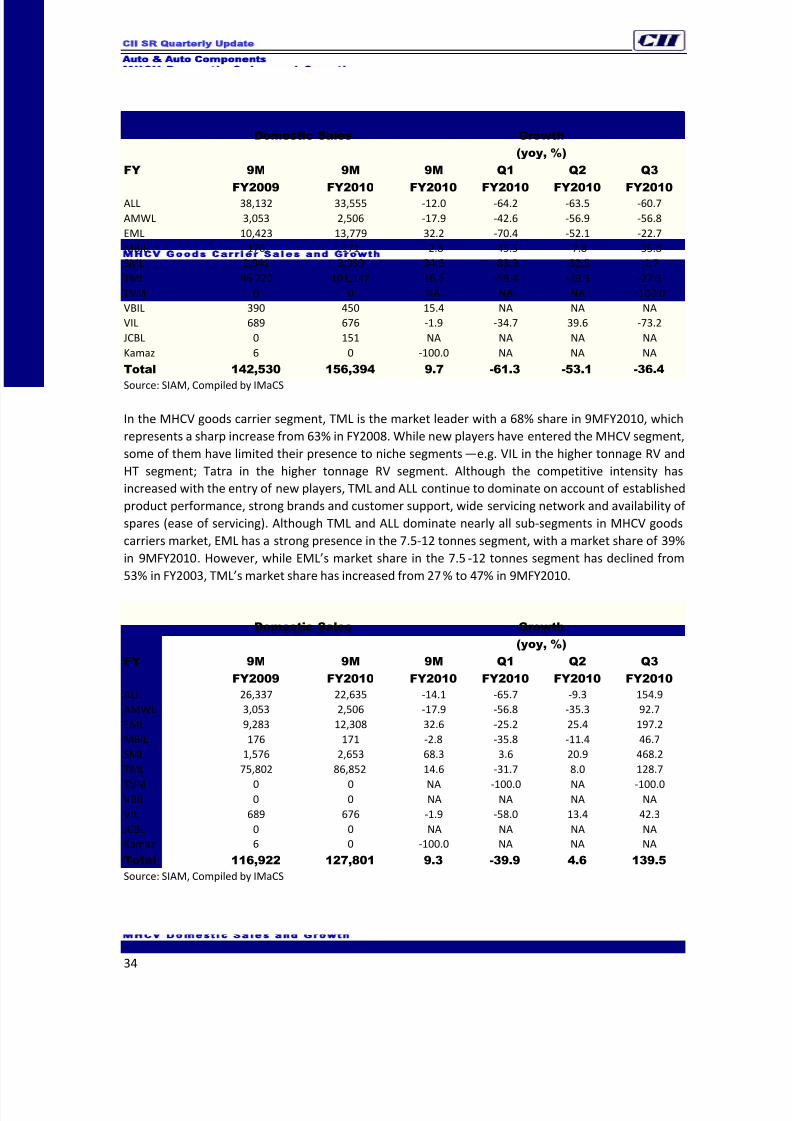
8/12/2019 Auto and Auto Ancillaries December20091
http://slidepdf.com/reader/full/auto-and-auto-ancillaries-december20091 34/66
CII SR Quarterly Update
Auto Auto Components
34
MHCV Domestic Sales and Growth
Domestic Sales Growth
(yoy, %)
FY 9M
FY2009
9M
FY2010
9M
FY2010
Q1
FY2010
Q2
FY2010
Q3
FY2010
ALL 38,132 33,555 -12.0 -64.2 -63.5 -60.7
AMWL 3,053 2,506 -17.9 -42.6 -56.9 -56.8
EML 10,423 13,779 32.2 -70.4 -52.1 -22.7
MBIL 176 171 -2.8 -45.5 -7.8 -35.8
SML 2,941 3,959 34.6 -83.3 -32.5 -1.7
TML 86,720 101,147 16.6 -59.4 -49.3 -27.3
TVM 0 0 NA NA NA -100.0
VBIL 390 450 15.4 NA NA NA
VIL 689 676 -1.9 -34.7 39.6 -73.2
JCBL 0 151 NA NA NA NA
Kamaz 6 0 -100.0 NA NA NA
Total 142,530 156,394 9.7 -61.3 -53.1 -36.4
Source: SIAM, Compiled by IMaCS
In the MHCV goods carrier segment, TML is the market leader with a 68% share in 9MFY2010, which
represents a sharp increase from 63% in FY2008. While new players have entered the MHCV segment,
some of them have limited their presence to niche segments—e.g. VIL in the higher tonnage RV and
HT segment; Tatra in the higher tonnage RV segment. Although the competitive intensity has
increased with the entry of new players, TML and ALL continue to dominate on account of established
product performance, strong brands and customer support, wide servicing network and availability of
spares (ease of servicing). Although TML and ALL dominate nearly all sub-segments in MHCV goods
carriers market, EML has a strong presence in the 7.5-12 tonnes segment, with a market share of 39%
in 9MFY2010. However, while EML’s market share in the 7.5 -12 tonnes segment has declined from
53% in FY2003, TML’s market share has increased from 27% to 47% in 9MFY2010.
MHCV Goods Carrier Sales and Growth
Domestic Sales Growth
(yoy, %)
FY 9M
FY2009
9M
FY2010
9M
FY2010
Q1
FY2010
Q2
FY2010
Q3
FY2010
ALL 26,337 22,635 -14.1 -65.7 -9.3 154.9
AMWL 3,053 2,506 -17.9 -56.8 -35.3 92.7
EML 9,283 12,308 32.6 -25.2 25.4 197.2
MBIL 176 171 -2.8 -35.8 -11.4 46.7
SML 1,576 2,653 68.3 3.6 20.9 468.2
TML 75,802 86,852 14.6 -31.7 8.0 128.7
TVM 0 0 NA -100.0 NA -100.0VBIL 0 0 NA NA NA NA
VIL 689 676 -1.9 -58.0 13.4 42.3
JCBL 0 0 NA NA NA NA
Kamaz 6 0 -100.0 NA NA NA
Total 116,922 127,801 9.3 -39.9 4.6 139.5
Source: SIAM, Compiled by IMaCS
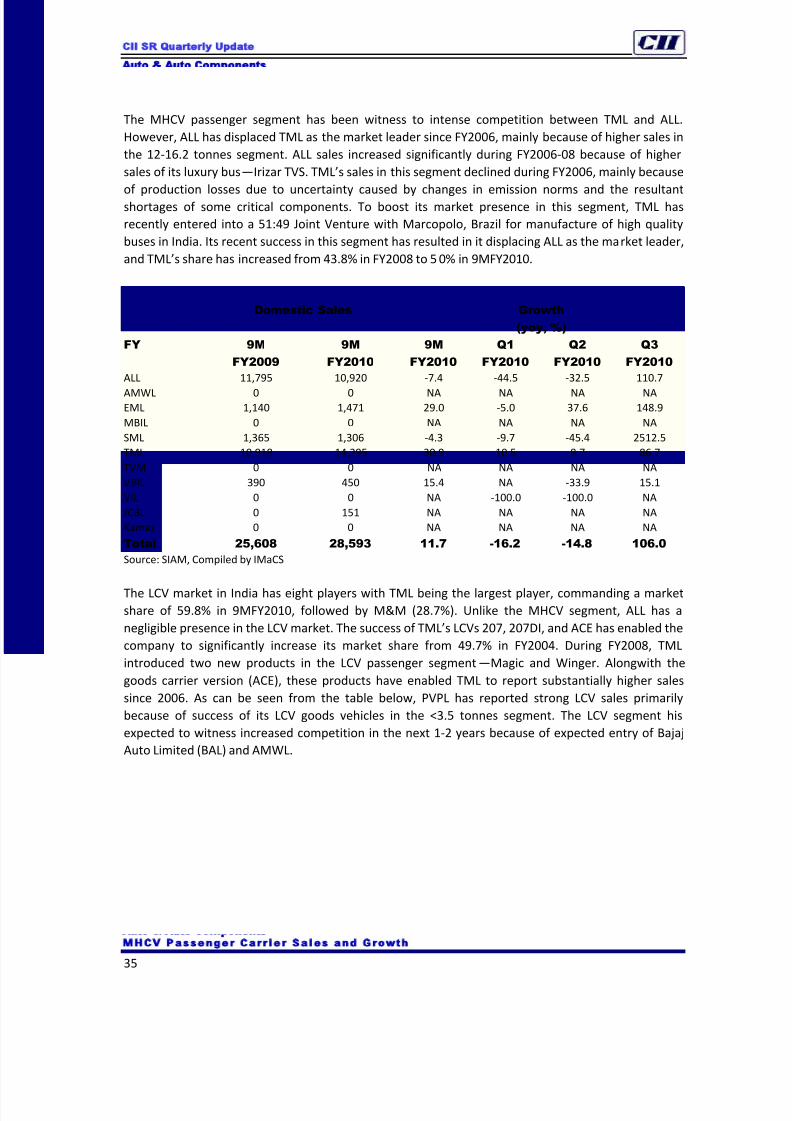
8/12/2019 Auto and Auto Ancillaries December20091
http://slidepdf.com/reader/full/auto-and-auto-ancillaries-december20091 35/66
CII SR Quarterly Update
Auto Auto Components
35
The MHCV passenger segment has been witness to intense competition between TML and ALL.
However, ALL has displaced TML as the market leader since FY2006, mainly because of higher sales in
the 12-16.2 tonnes segment. ALL sales increased significantly during FY2006-08 because of higher
sales of its luxury bus—Irizar TVS. TML’s sales in this segment declined during FY2006, mainly because
of production losses due to uncertainty caused by changes in emission norms and the resultant
shortages of some critical components. To boost its market presence in this segment, TML has
recently entered into a 51:49 Joint Venture with Marcopolo, Brazil for manufacture of high quality
buses in India. Its recent success in this segment has resulted in it displacing ALL as the market leader,
and TML’s share has increased from 43.8% in FY2008 to 50% in 9MFY2010.
MHCV Passenger Carrier Sales and Growth
Domestic Sales Growth
(yoy, %)
FY 9M
FY2009
9M
FY2010
9M
FY2010
Q1
FY2010
Q2
FY2010
Q3
FY2010
ALL 11,795 10,920 -7.4 -44.5 -32.5 110.7
AMWL 0 0 NA NA NA NAEML 1,140 1,471 29.0 -5.0 37.6 148.9
MBIL 0 0 NA NA NA NA
SML 1,365 1,306 -4.3 -9.7 -45.4 2512.5
TML 10,918 14,295 30.9 10.5 8.7 86.7
TVM 0 0 NA NA NA NA
VBIL 390 450 15.4 NA -33.9 15.1
VIL 0 0 NA -100.0 -100.0 NA
JCBL 0 151 NA NA NA NA
Kamaz 0 0 NA NA NA NA
Total 25,608 28,593 11.7 -16.2 -14.8 106.0
Source: SIAM, Compiled by IMaCS
The LCV market in India has eight players with TML being the largest player, commanding a marketshare of 59.8% in 9MFY2010, followed by M&M (28.7%). Unlike the MHCV segment, ALL has a
negligible presence in the LCV market. The success of TML’s LCVs 207, 207DI, and ACE has enabled the
company to significantly increase its market share from 49.7% in FY2004. During FY2008, TML
introduced two new products in the LCV passenger segment—Magic and Winger. Alongwith the
goods carrier version (ACE), these products have enabled TML to report substantially higher sales
since 2006. As can be seen from the table below, PVPL has reported strong LCV sales primarily
because of success of its LCV goods vehicles in the <3.5 tonnes segment. The LCV segment his
expected to witness increased competition in the next 1-2 years because of expected entry of Bajaj
Auto Limited (BAL) and AMWL.
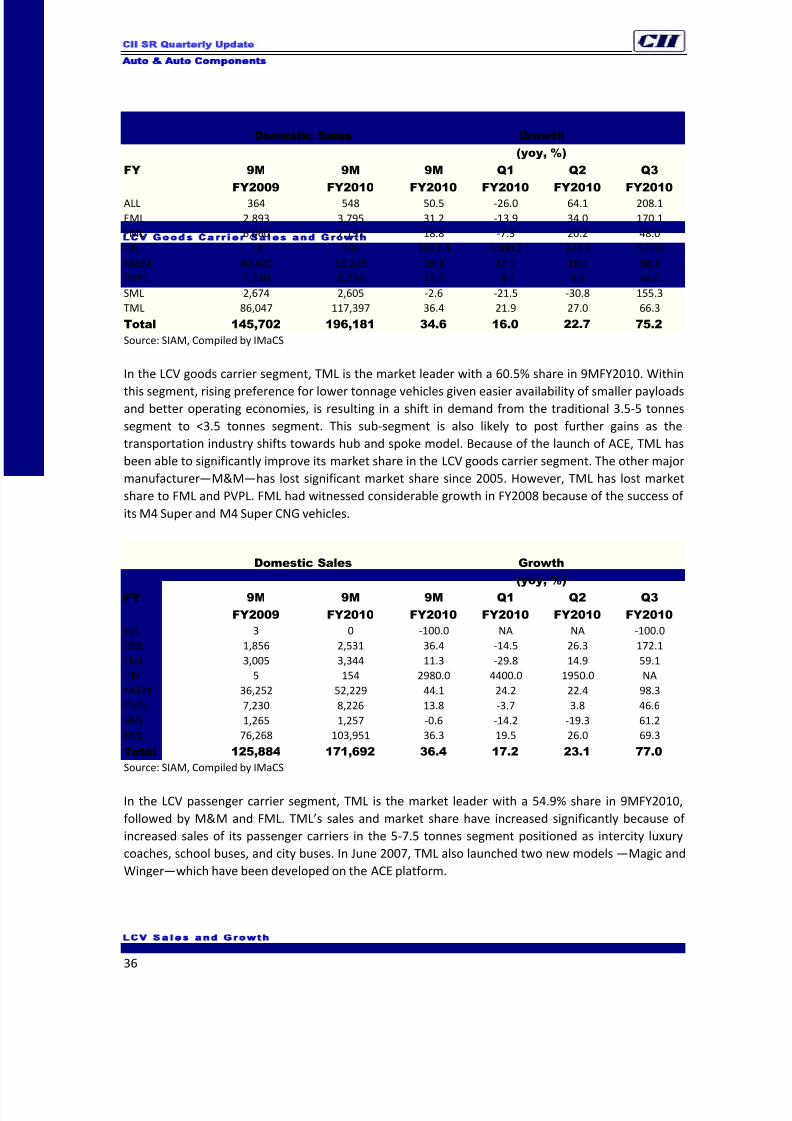
8/12/2019 Auto and Auto Ancillaries December20091
http://slidepdf.com/reader/full/auto-and-auto-ancillaries-december20091 36/66
CII SR Quarterly Update
Auto Auto Components
36
LCV Sales and Growth
Domestic Sales Growth
(yoy, %)
FY 9M
FY2009
9M
FY2010
9M
FY2010
Q1
FY2010
Q2
FY2010
Q3
FY2010
ALL 364 548 50.5 -26.0 64.1 208.1
EML 2,893 3,795 31.2 -13.9 34.0 170.1
FML 6,060 7,197 18.8 -7.3 20.2 48.0
HM 14 164 1071.4 4400.0 922.2 575.0
M&M 40,420 56,249 39.2 17.1 19.6 98.2
PVPL 7,230 8,226 13.8 -3.7 3.8 46.6
SML 2,674 2,605 -2.6 -21.5 -30.8 155.3
TML 86,047 117,397 36.4 21.9 27.0 66.3
Total 145,702 196,181 34.6 16.0 22.7 75.2
Source: SIAM, Compiled by IMaCS
In the LCV goods carrier segment, TML is the market leader with a 60.5% share in 9MFY2010. Within
this segment, rising preference for lower tonnage vehicles given easier availability of smaller payloadsand better operating economies, is resulting in a shift in demand from the traditional 3.5-5 tonnes
segment to <3.5 tonnes segment. This sub-segment is also likely to post further gains as the
transportation industry shifts towards hub and spoke model. Because of the launch of ACE, TML has
been able to significantly improve its market share in the LCV goods carrier segment. The other major
manufacturer—M&M—has lost significant market share since 2005. However, TML has lost market
share to FML and PVPL. FML had witnessed considerable growth in FY2008 because of the success of
its M4 Super and M4 Super CNG vehicles.
LCV Goods Carrier Sales and Growth
Domestic Sales Growth
(yoy, %)
FY 9M
FY2009
9M
FY2010
9M
FY2010
Q1
FY2010
Q2
FY2010
Q3
FY2010
ALL 3 0 -100.0 NA NA -100.0
EML 1,856 2,531 36.4 -14.5 26.3 172.1
FML 3,005 3,344 11.3 -29.8 14.9 59.1
HM 5 154 2980.0 4400.0 1950.0 NA
M&M 36,252 52,229 44.1 24.2 22.4 98.3
PVPL 7,230 8,226 13.8 -3.7 3.8 46.6
SML 1,265 1,257 -0.6 -14.2 -19.3 61.2
TML 76,268 103,951 36.3 19.5 26.0 69.3
Total 125,884 171,692 36.4 17.2 23.1 77.0
Source: SIAM, Compiled by IMaCS
In the LCV passenger carrier segment, TML is the market leader with a 54.9% share in 9MFY2010,
followed by M&M and FML. TML’s sales and market share have increased significantly because of
increased sales of its passenger carriers in the 5-7.5 tonnes segment positioned as intercity luxury
coaches, school buses, and city buses. In June 2007, TML also launched two new models—Magic and
Winger—which have been developed on the ACE platform.
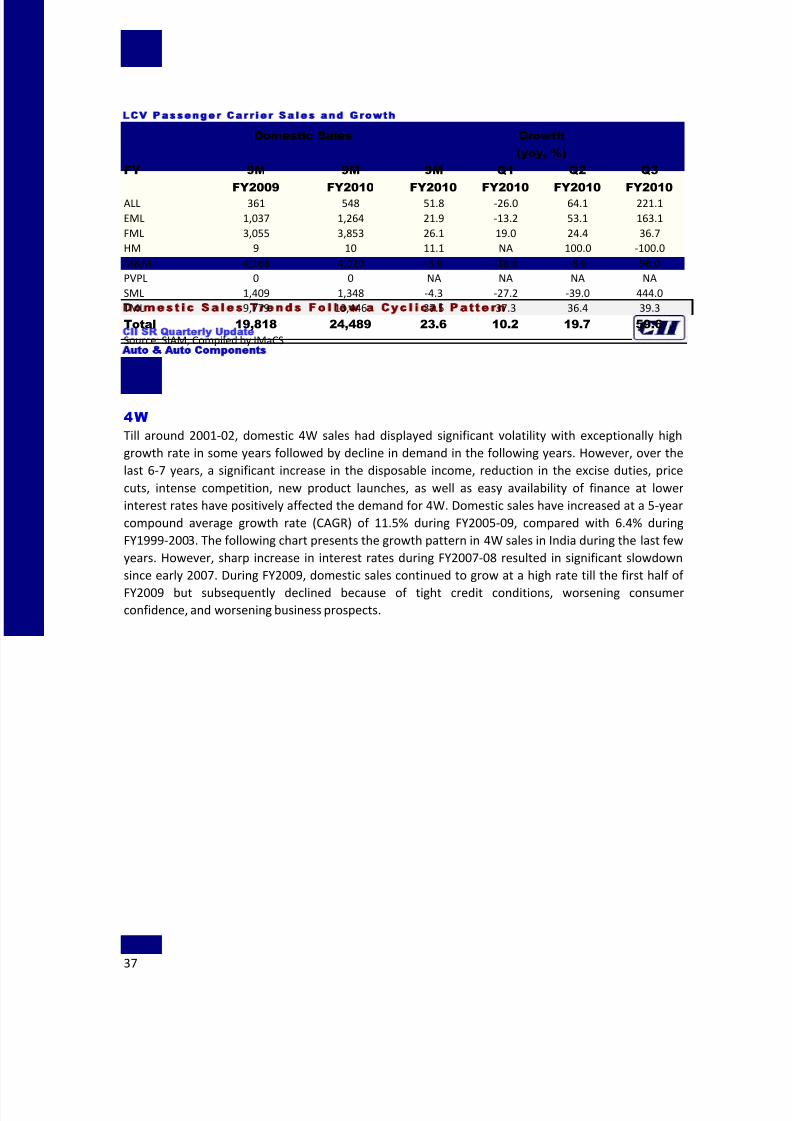
8/12/2019 Auto and Auto Ancillaries December20091
http://slidepdf.com/reader/full/auto-and-auto-ancillaries-december20091 37/66
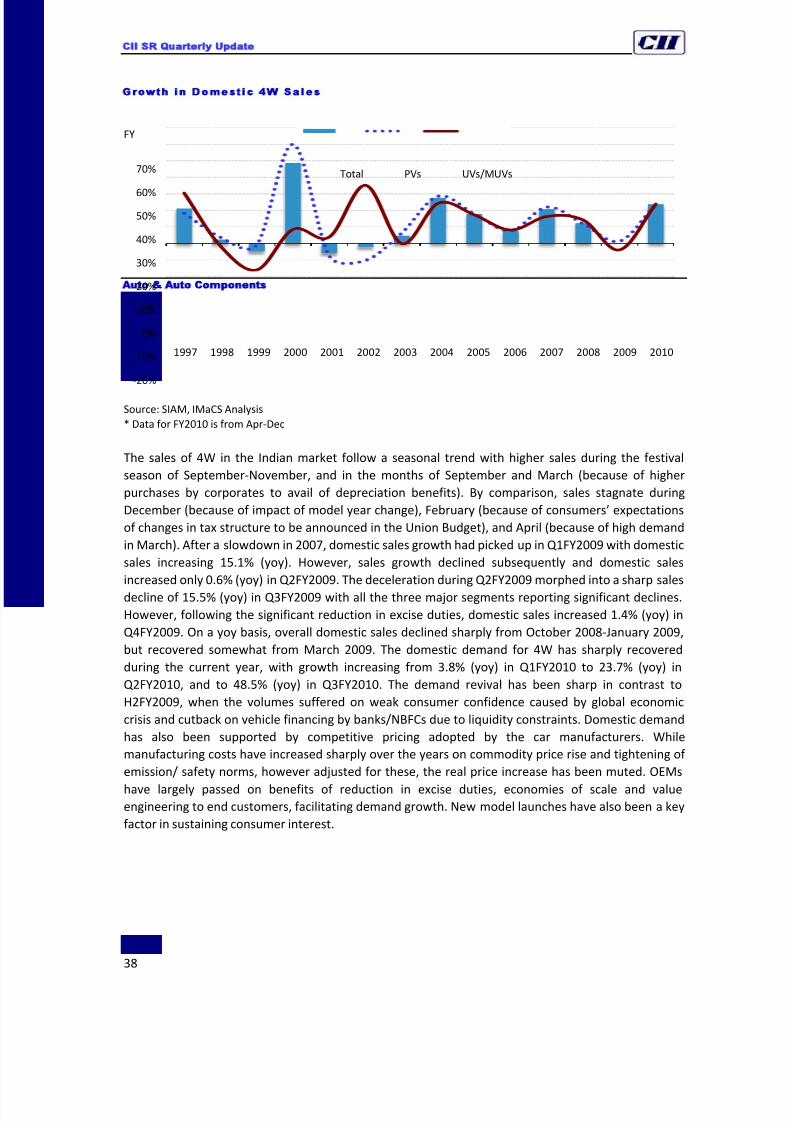
8/12/2019 Auto and Auto Ancillaries December20091
http://slidepdf.com/reader/full/auto-and-auto-ancillaries-december20091 38/66
CII SR Quarterly Update
Auto Auto Components
38
Growth in Domestic 4W SalesFY
Source: SIAM, IMaCS Analysis
* Data for FY2010 is from Apr-Dec
The sales of 4W in the Indian market follow a seasonal trend with higher sales during the festival
season of September-November, and in the months of September and March (because of higher
purchases by corporates to avail of depreciation benefits). By comparison, sales stagnate during
December (because of impact of model year change), February (because of consumers’ expectations
of changes in tax structure to be announced in the Union Budget), and April (because of high demand
in March). After a slowdown in 2007, domestic sales growth had picked up in Q1FY2009 with domestic
sales increasing 15.1% (yoy). However, sales growth declined subsequently and domestic sales
increased only 0.6% (yoy) in Q2FY2009. The deceleration during Q2FY2009 morphed into a sharp sales
decline of 15.5% (yoy) in Q3FY2009 with all the three major segments reporting significant declines.
However, following the significant reduction in excise duties, domestic sales increased 1.4% (yoy) in
Q4FY2009. On a yoy basis, overall domestic sales declined sharply from October 2008-January 2009,
but recovered somewhat from March 2009. The domestic demand for 4W has sharply recovered
during the current year, with growth increasing from 3.8% (yoy) in Q1FY2010 to 23.7% (yoy) in
Q2FY2010, and to 48.5% (yoy) in Q3FY2010. The demand revival has been sharp in contrast to
H2FY2009, when the volumes suffered on weak consumer confidence caused by global economic
crisis and cutback on vehicle financing by banks/NBFCs due to liquidity constraints. Domestic demand
has also been supported by competitive pricing adopted by the car manufacturers. While
manufacturing costs have increased sharply over the years on commodity price rise and tightening of
emission/ safety norms, however adjusted for these, the real price increase has been muted. OEMs
have largely passed on benefits of reduction in excise duties, economies of scale and valueengineering to end customers, facilitating demand growth. New model launches have also been a key
factor in sustaining consumer interest.
-20%
-10%
0%
10%
20%
30%
40%
50%
60%
70%
1997 1998 1999 2000 2001 2002 2003 2004 2005 2006 2007 2008 2009 2010
Total PVs UVs/MUVs
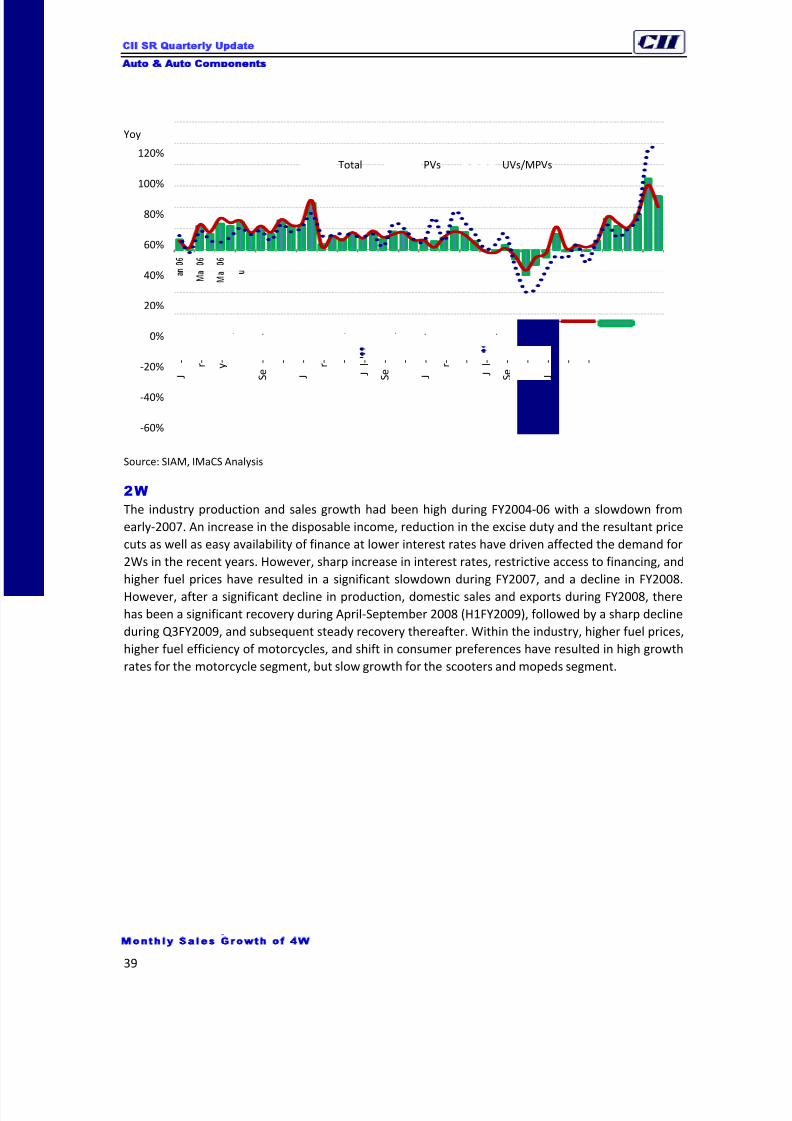
8/12/2019 Auto and Auto Ancillaries December20091
http://slidepdf.com/reader/full/auto-and-auto-ancillaries-december20091 39/66
CII SR Quarterly Update
Auto Auto Components
39
Monthly Sales Growth of 4WYoy
Source: SIAM, IMaCS Analysis
2W
The industry production and sales growth had been high during FY2004-06 with a slowdown from
early-2007. An increase in the disposable income, reduction in the excise duty and the resultant price
cuts as well as easy availability of finance at lower interest rates have driven affected the demand for
2Ws in the recent years. However, sharp increase in interest rates, restrictive access to financing, and
higher fuel prices have resulted in a significant slowdown during FY2007, and a decline in FY2008.
However, after a significant decline in production, domestic sales and exports during FY2008, there
has been a significant recovery during April-September 2008 (H1FY2009), followed by a sharp decline
during Q3FY2009, and subsequent steady recovery thereafter. Within the industry, higher fuel prices,
higher fuel efficiency of motorcycles, and shift in consumer preferences have resulted in high growth
rates for the motorcycle segment, but slow growth for the scooters and mopeds segment.
-60%
-40%
-20%
0%
20%
40%
60%
80%
100%
120%
J
- r - y -
J l -
S e
- -
J
- r - -
J l -
S e
- -
J
- r - -
J l -
S e
- -
J
- - -
J l - - -
Total PVs UVs/MPVs
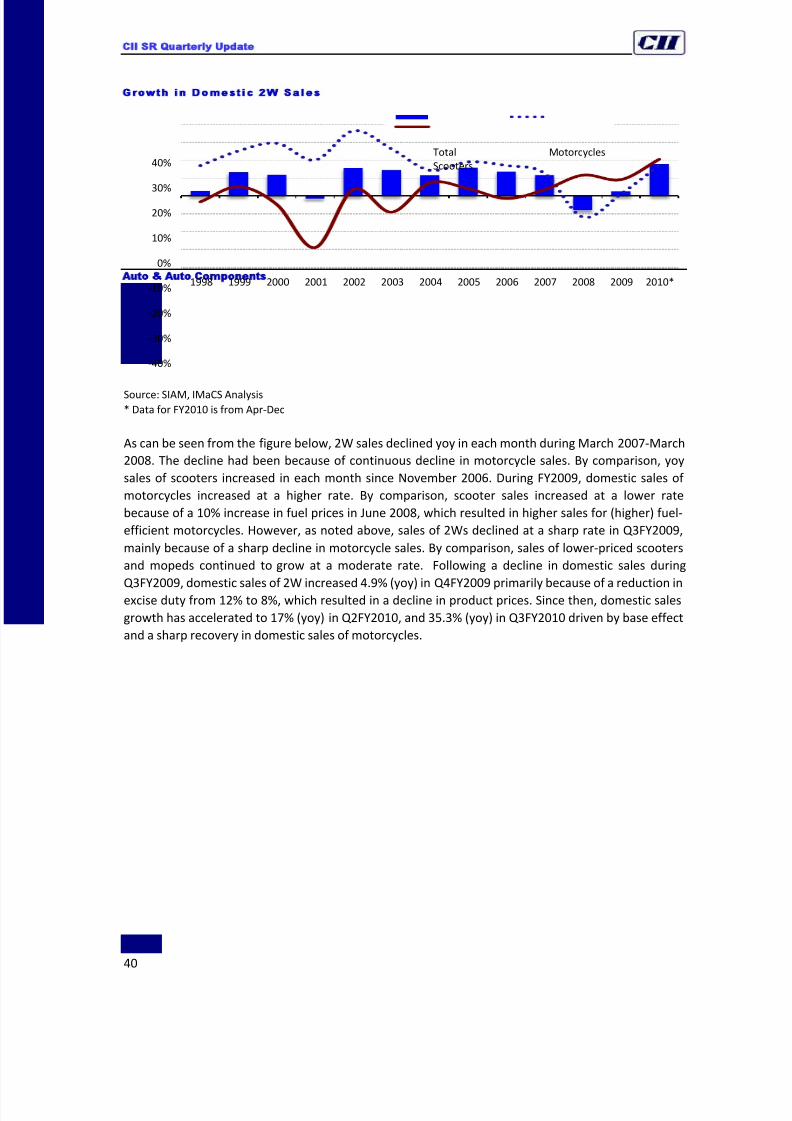
8/12/2019 Auto and Auto Ancillaries December20091
http://slidepdf.com/reader/full/auto-and-auto-ancillaries-december20091 40/66
CII SR Quarterly Update
Auto Auto Components
40
Growth in Domestic 2W Sales
Source: SIAM, IMaCS Analysis* Data for FY2010 is from Apr-Dec
As can be seen from the figure below, 2W sales declined yoy in each month during March 2007-March
2008. The decline had been because of continuous decline in motorcycle sales. By comparison, yoy
sales of scooters increased in each month since November 2006. During FY2009, domestic sales of
motorcycles increased at a higher rate. By comparison, scooter sales increased at a lower rate
because of a 10% increase in fuel prices in June 2008, which resulted in higher sales for (higher) fuel-
efficient motorcycles. However, as noted above, sales of 2Ws declined at a sharp rate in Q3FY2009,
mainly because of a sharp decline in motorcycle sales. By comparison, sales of lower-priced scooters
and mopeds continued to grow at a moderate rate. Following a decline in domestic sales during
Q3FY2009, domestic sales of 2W increased 4.9% (yoy) in Q4FY2009 primarily because of a reduction inexcise duty from 12% to 8%, which resulted in a decline in product prices. Since then, domestic sales
growth has accelerated to 17% (yoy) in Q2FY2010, and 35.3% (yoy) in Q3FY2010 driven by base effect
and a sharp recovery in domestic sales of motorcycles.
-40%
-30%
-20%
-10%
0%
10%
20%
30%
40%
1998 1999 2000 2001 2002 2003 2004 2005 2006 2007 2008 2009 2010*
Total Motorcycles
Scooters
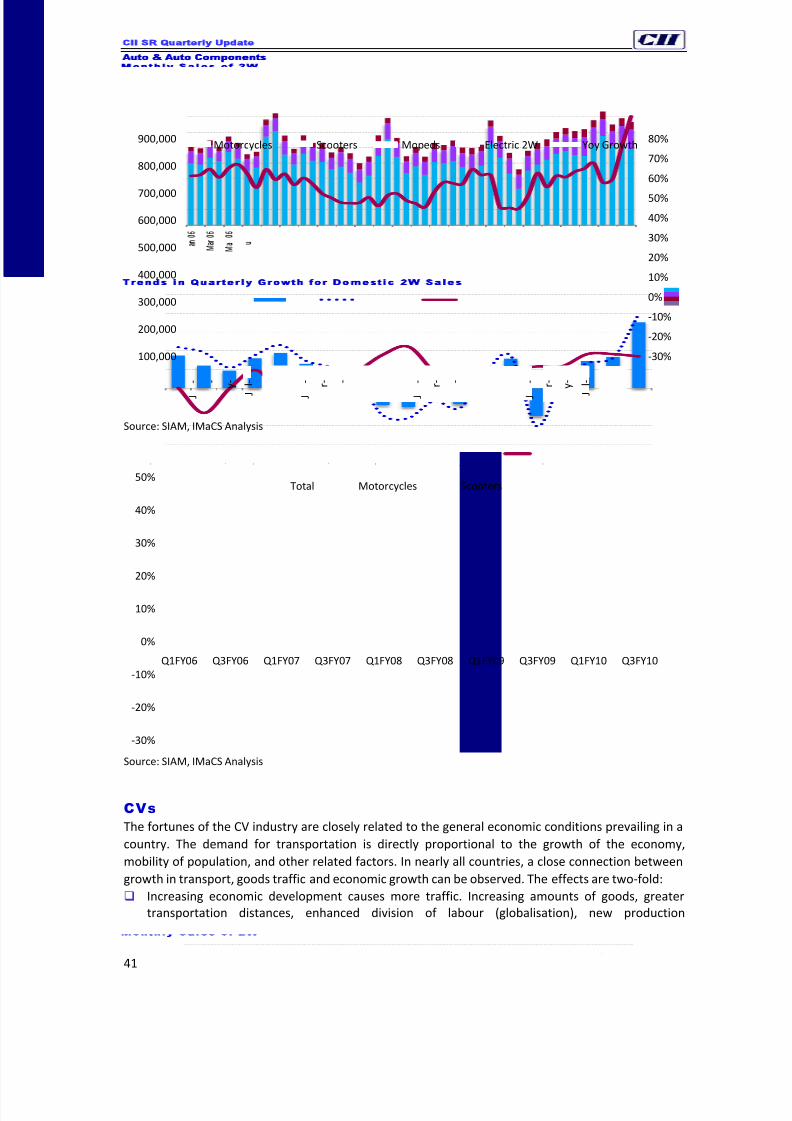
8/12/2019 Auto and Auto Ancillaries December20091
http://slidepdf.com/reader/full/auto-and-auto-ancillaries-december20091 41/66
8/12/2019 Auto and Auto Ancillaries December20091
http://slidepdf.com/reader/full/auto-and-auto-ancillaries-december20091 42/66
CII SR Quarterly Update
Auto Auto Components
42
technologies (e.g. just-in-time production), higher levels of commuter traffic, and an increase in
business travel are producing a growth in goods transport and production-related passenger
transport. The increase in the prosperity of private households, together with the reduction in the
working week and the working life, produce an increase in holiday and leisure transport.
The mobility of people and goods is a precondition for greater productivity and economic growth.
The latter result from enhanced division of labour, faster structural change, the exploitation of
new raw and other materials and greater competitiveness in international trade.
The demand for freight transportation depends upon the economic cycles especially on the level of
agricultural production and industrial activity. Thus, the road transportation and CV industry has
strong linkages with the economic growth.
The financial performance of the CV players has been volatile and is affected by the economic cycles
to a large extent. During periods of strong GDP growth rate, buoyant industrial activity, and the
increase in the demand for transport, CV sales have increased significantly. Conversely, CV sales
slowdown in advance of a slowdown in industrial activity. Besides economic expansion, cost and
availability of finance, government policies on emission, overloading and scrapping of vehicles alsoinfluence CV demand. During FY2004-08, CV sales volumes growth in the domestic market had been
healthy (with a sharp slowdown in FY2008) led by buoyant economic activity, easy access to finance
and entry of new truck financing companies, increased momentum in highway construction, better
operating economics of new trucks, and Supreme Court order prohibiting overloading of trucks.
Hardening of interest rates because of tight monetary policy can impact CV sales. Inspite of a
hardening of interest rates since mid-2004, CV sales had till recently increased at a healthy rate
because of increased replacement demand, increased growth in IIP, and increased demand for road
transportation. However, continued hardening of interest rates and a slowdown in economic activity
has impacted CV sales volumes in FY2008 and FY2009. During 2008-09, domestic CV sales volumes
have declined significantly because of early indications of an economic slowdown, slowdown in IIP,
tighter credit conditions and constraints in the availability of vehicle finance from banks and non-
banking finance companies (NBFCs). Though in-house vehicle financing of major manufacturers has
increased, the additional credit flow was unable to fully offset the decrease in credit availability from
outside sources. As compared with growth of 11.5% (yoy) in Q1FY2009, domestic CV sales declined
from Q2FY2009 to Q1FY2010. A significant proportion of trucks are purchased by small truck
operators in the unorganised sector, who may have to pay a relatively higher rate of interest as
compared with large-fleet operators, and are more vulnerable to interest rate fluctuations and
slowdown in economic activity. However, signs of recovery and base effect have resulted in a recovery
in domestic CV sales since mid-2009.
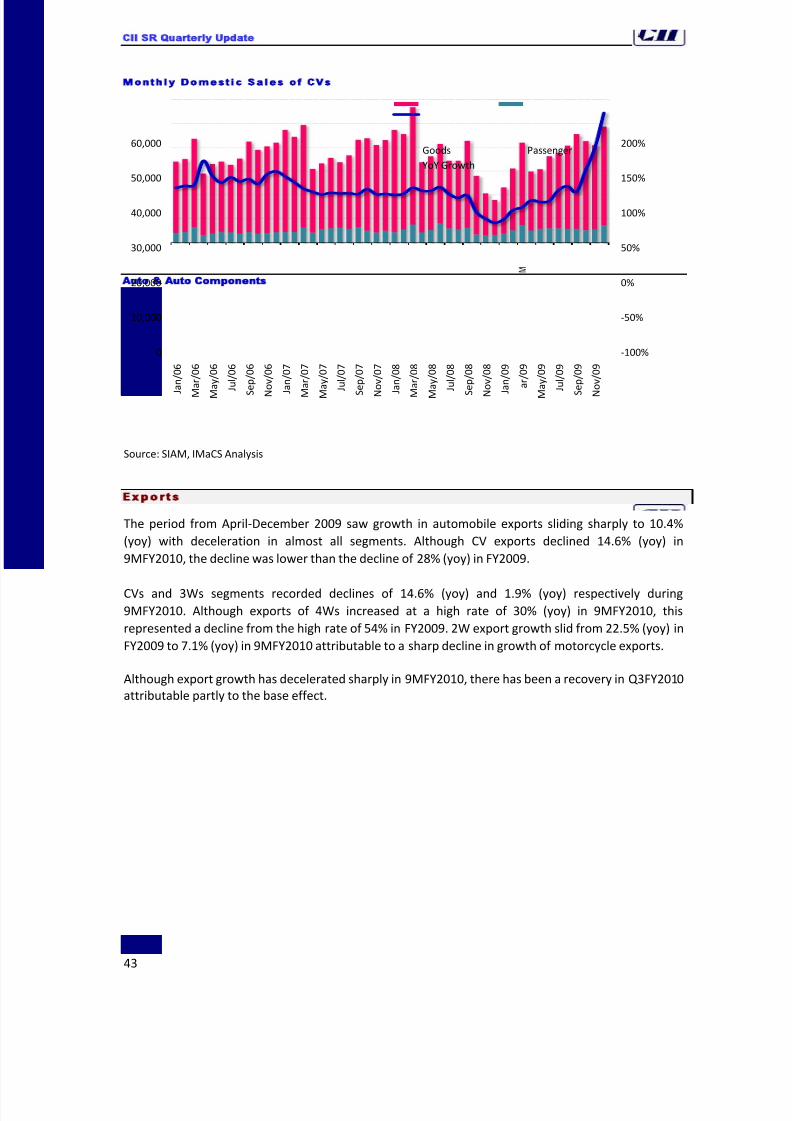
8/12/2019 Auto and Auto Ancillaries December20091
http://slidepdf.com/reader/full/auto-and-auto-ancillaries-december20091 43/66
CII SR Quarterly Update
Auto Auto Components
43
Monthly Domestic Sales of CVs
Source: SIAM, IMaCS Analysis
Expor ts
The period from April-December 2009 saw growth in automobile exports sliding sharply to 10.4%
(yoy) with deceleration in almost all segments. Although CV exports declined 14.6% (yoy) in
9MFY2010, the decline was lower than the decline of 28% (yoy) in FY2009.
CVs and 3Ws segments recorded declines of 14.6% (yoy) and 1.9% (yoy) respectively during
9MFY2010. Although exports of 4Ws increased at a high rate of 30% (yoy) in 9MFY2010, this
represented a decline from the high rate of 54% in FY2009. 2W export growth slid from 22.5% (yoy) in
FY2009 to 7.1% (yoy) in 9MFY2010 attributable to a sharp decline in growth of motorcycle exports.
Although export growth has decelerated sharply in 9MFY2010, there has been a recovery in Q3FY2010
attributable partly to the base effect.
-100%
-50%
0%
50%
100%
150%
200%
0
10,000
20,000
30,000
40,000
50,000
60,000
J
a n
/ 0 6
M
a r / 0
6
M
a y
/ 0 6
J u l / 0 6
S
e p
/ 0 6
N
o v
/ 0 6
J
a n
/ 0 7
M
a r / 0
7
M
a y
/ 0 7
J u l / 0 7
S
e p
/ 0 7
N
o v
/ 0 7
J
a n
/ 0 8
M
a r / 0
8
M
a y
/ 0 8
J u l / 0 8
S
e p
/ 0 8
N
o v
/ 0 8
J
a n
/ 0 9
a r / 0
9
M
a y
/ 0 9
J u l / 0 9
S
e p
/ 0 9
N
o v
/ 0 9
Goods Passenger
YoY Growth
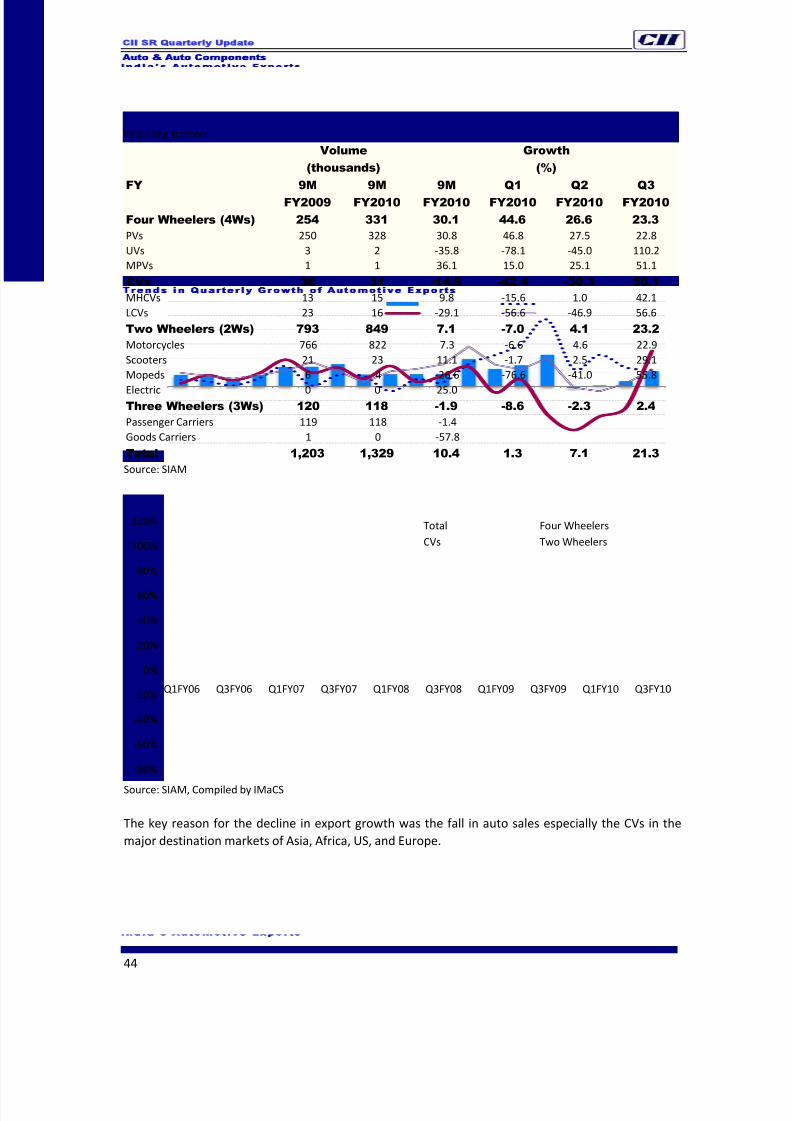
8/12/2019 Auto and Auto Ancillaries December20091
http://slidepdf.com/reader/full/auto-and-auto-ancillaries-december20091 44/66
CII SR Quarterly Update
Auto Auto Components
44
India’s Automotive ExportsExcluding tractors
Volume
(thousands)
Growth
(%)
FY 9M
FY2009
9M
FY2010
9M
FY2010
Q1
FY2010
Q2
FY2010
Q3
FY2010
Four Wheelers (4Ws) 254 331 30.1 44.6 26.6 23.3
PVs 250 328 30.8 46.8 27.5 22.8
UVs 3 2 -35.8 -78.1 -45.0 110.2
MPVs 1 1 36.1 15.0 25.1 51.1
CVs 36 31 -14.6 -42.4 -30.3 50.1
MHCVs 13 15 9.8 -15.6 1.0 42.1
LCVs 23 16 -29.1 -56.6 -46.9 56.6
Two Wheelers (2Ws) 793 849 7.1 -7.0 4.1 23.2
Motorcycles 766 822 7.3 -6.6 4.6 22.9
Scooters 21 23 11.1 -1.7 2.5 29.1
Mopeds 6 4 -26.6 -76.6 -41.0 55.8
Electric 0 0 25.0Three Wheelers (3Ws) 120 118 -1.9 -8.6 -2.3 2.4
Passenger Carriers 119 118 -1.4
Goods Carriers 1 0 -57.8
Total 1,203 1,329 10.4 1.3 7.1 21.3
Source: SIAM
Trends in Quarterly Growth of Automotive Exports
Source: SIAM, Compiled by IMaCS
The key reason for the decline in export growth was the fall in auto sales especially the CVs in the
major destination markets of Asia, Africa, US, and Europe.
-80%
-60%
-40%
-20%
0%
20%
40%
60%
80%
100%
120%
Q1FY06 Q3FY06 Q1FY07 Q3FY07 Q1FY08 Q3FY08 Q1FY09 Q3FY09 Q1FY10 Q3FY10
Total Four Wheelers
CVs Two Wheelers
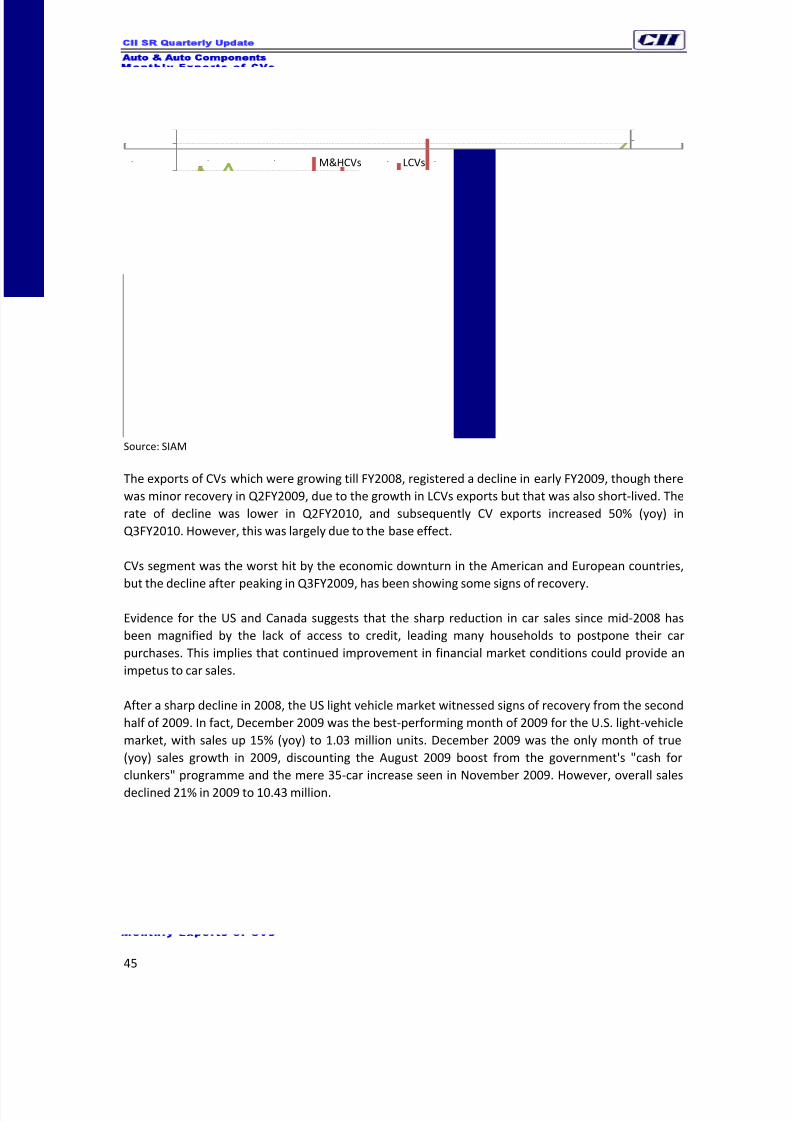
8/12/2019 Auto and Auto Ancillaries December20091
http://slidepdf.com/reader/full/auto-and-auto-ancillaries-december20091 45/66
CII SR Quarterly Update
Auto Auto Components
45
Monthly Exports of CVs
Source: SIAM
The exports of CVs which were growing till FY2008, registered a decline in early FY2009, though there
was minor recovery in Q2FY2009, due to the growth in LCVs exports but that was also short-lived. The
rate of decline was lower in Q2FY2010, and subsequently CV exports increased 50% (yoy) in
Q3FY2010. However, this was largely due to the base effect.
CVs segment was the worst hit by the economic downturn in the American and European countries,
but the decline after peaking in Q3FY2009, has been showing some signs of recovery.
Evidence for the US and Canada suggests that the sharp reduction in car sales since mid-2008 has
been magnified by the lack of access to credit, leading many households to postpone their car
purchases. This implies that continued improvement in financial market conditions could provide an
impetus to car sales.
After a sharp decline in 2008, the US light vehicle market witnessed signs of recovery from the second
half of 2009. In fact, December 2009 was the best-performing month of 2009 for the U.S. light-vehicle
market, with sales up 15% (yoy) to 1.03 million units. December 2009 was the only month of true
(yoy) sales growth in 2009, discounting the August 2009 boost from the government's "cash for
clunkers" programme and the mere 35-car increase seen in November 2009. However, overall sales
declined 21% in 2009 to 10.43 million.
-80%
-60%
-40%
-20%
0%
20%
40%
60%
80%
100%
120%
0
1,000
2,000
3,000
4,000
5,000
6,000
7,000
8,000
J
- - y -
J l - -
v -
J
- r - -
J l - - -
J
- r - -
J l -
S e
- -
J
- r - -
J l -
S e
- -
M&HCVs LCVs Yoy Growth
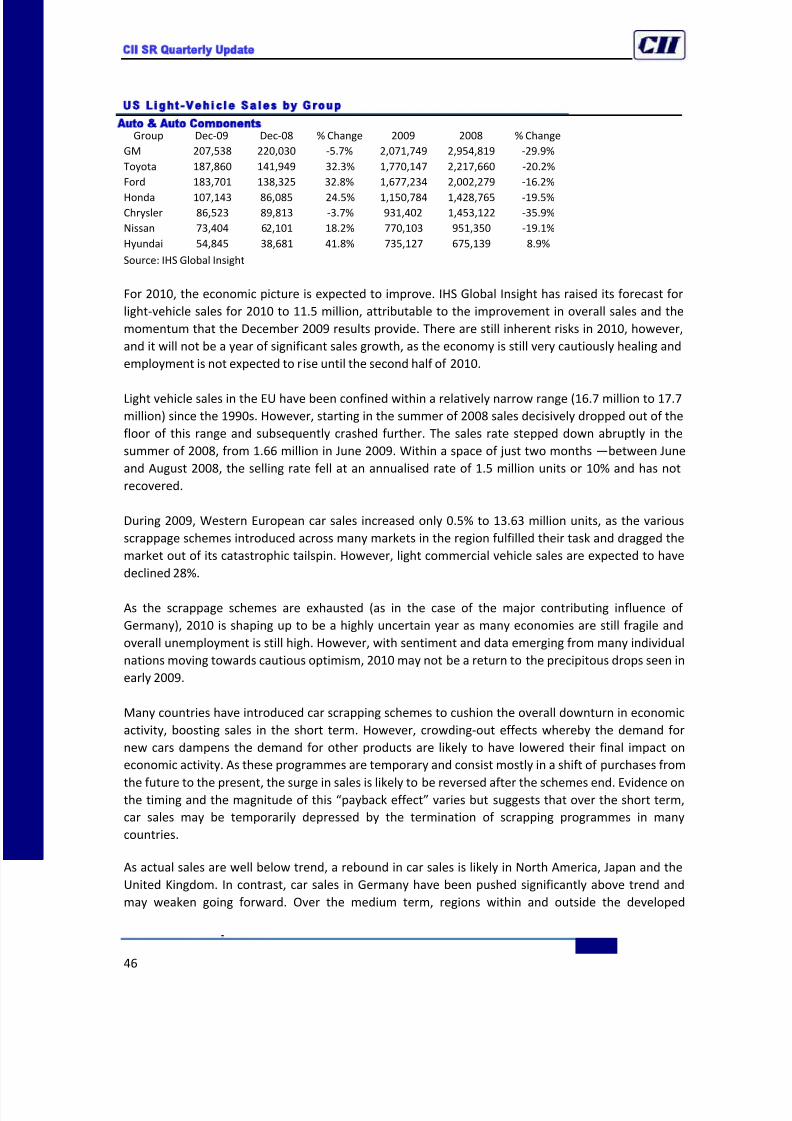
8/12/2019 Auto and Auto Ancillaries December20091
http://slidepdf.com/reader/full/auto-and-auto-ancillaries-december20091 46/66
CII SR Quarterly Update
Auto Auto Components
46
US Light-Vehicle Sales by Group
Group Dec-09 Dec-08 % Change 2009 2008 % Change
GM 207,538 220,030 -5.7% 2,071,749 2,954,819 -29.9%
Toyota 187,860 141,949 32.3% 1,770,147 2,217,660 -20.2%
Ford 183,701 138,325 32.8% 1,677,234 2,002,279 -16.2%
Honda 107,143 86,085 24.5% 1,150,784 1,428,765 -19.5%Chrysler 86,523 89,813 -3.7% 931,402 1,453,122 -35.9%
Nissan 73,404 62,101 18.2% 770,103 951,350 -19.1%
Hyundai 54,845 38,681 41.8% 735,127 675,139 8.9%
Source: IHS Global Insight
For 2010, the economic picture is expected to improve. IHS Global Insight has raised its forecast for
light-vehicle sales for 2010 to 11.5 million, attributable to the improvement in overall sales and the
momentum that the December 2009 results provide. There are still inherent risks in 2010, however,
and it will not be a year of significant sales growth, as the economy is still very cautiously healing and
employment is not expected to rise until the second half of 2010.
Light vehicle sales in the EU have been confined within a relatively narrow range (16.7 million to 17.7
million) since the 1990s. However, starting in the summer of 2008 sales decisively dropped out of the
floor of this range and subsequently crashed further. The sales rate stepped down abruptly in the
summer of 2008, from 1.66 million in June 2009. Within a space of just two months —between June
and August 2008, the selling rate fell at an annualised rate of 1.5 million units or 10% and has not
recovered.
During 2009, Western European car sales increased only 0.5% to 13.63 million units, as the various
scrappage schemes introduced across many markets in the region fulfilled their task and dragged the
market out of its catastrophic tailspin. However, light commercial vehicle sales are expected to have
declined 28%.
As the scrappage schemes are exhausted (as in the case of the major contributing influence of
Germany), 2010 is shaping up to be a highly uncertain year as many economies are still fragile and
overall unemployment is still high. However, with sentiment and data emerging from many individual
nations moving towards cautious optimism, 2010 may not be a return to the precipitous drops seen in
early 2009.
Many countries have introduced car scrapping schemes to cushion the overall downturn in economic
activity, boosting sales in the short term. However, crowding-out effects whereby the demand for
new cars dampens the demand for other products are likely to have lowered their final impact on
economic activity. As these programmes are temporary and consist mostly in a shift of purchases from
the future to the present, the surge in sales is likely to be reversed after the schemes end. Evidence onthe timing and the magnitude of this “payback effect” varies but suggests that over the short term,
car sales may be temporarily depressed by the termination of scrapping programmes in many
countries.
As actual sales are well below trend, a rebound in car sales is likely in North America, Japan and the
United Kingdom. In contrast, car sales in Germany have been pushed significantly above trend and
may weaken going forward. Over the medium term, regions within and outside the developed
8/12/2019 Auto and Auto Ancillaries December20091
http://slidepdf.com/reader/full/auto-and-auto-ancillaries-december20091 47/66
CII SR Quarterly Update
Auto Auto Components
47
economies are likely to experience diverse trends in car sales. In mature markets, such as Europe and
North America, trend sales are likely to remain stagnant. By contrast, rapid increases are foreseen in
China, which is already now the second largest market for cars. A rapid increase is also projected in
India. Medium-term projections suggest that capacity exceeds trend sales by around 20% in the five
largest Western European markets considered as a whole. Without an adjustment in capacity, these
countries would need to ensure an ongoing strong export performance. By contrast, in North America,
capacity is projected to be around 65% of trend sales. Automakers in the NAFTA area would thus need
to halt their decline in domestic market share or to rely increasingly on exports in order to avoid
excess capacity. The fortunes of Korean and Japanese auto firms are heavily tied to world markets as
they export a large part of their production. Maintaining their high levels of capacity utilisation will
require them to keep up their strong export performance.
INVESTMENTS
The market is so large and diverse that a large number of players can be absorbed to accommodate
buyer needs. The sector not only has global players looking to invest and expand but leading domestic
companies are also pumping in huge sums into expanding operation. Some of the investments made
by various companies or organisations are as follows:
Investment Planning Commission has set target of attracting foreign investment worth US$5
billion for the next five years.
Bharat Forge invested US$ 135 million in its Pune plant for increasing capacity to 240,000 tonnes.
Amtek Auto is expanding capacity of its casting unit to 70,000 tonnes per annum.
Rico Auto is investing Rs 350 million to expand its capacity.
Apollo Tyres plans to invest US$469.58m to increase production capacity in India and abroad.
Robert Bosch of Germany will invest U$201.40 million in its subsidiaries over the next two years.
Ceat has inaugurated the Radial tyre greenfield project in Gujarat with an investment of Rs 7,000
million, which will create employment opportunities for 1,000 people.
Exide industry plans to invest Rs 4,500 million over 2-3 years to expand its production facilities
and enter overseas markets to boost exports. It will invest Rs 1,800 million for capacity expansion
in 2008-09.
Key Inves tments in Southern Ind ia
Ford India has formalised its commitment to invest Rs 1,500 crore at its manufacturing facility in
Maraimalainagar, near Chennai, by signing a memorandum of understanding with the Tamil Nadu
Government. According to the press release issued by the Tamil Nadu Government, the
investment will double Ford India’s production capacity to two lakh cars annually. It will also
enable setting up a new facility to make 2.5 lakh engines a year. It will create employment
opportunity for 1,000, in addition to the existing 2,100 people.
Rasandik Motors, a group company of Rasandik Engineering Industries India plans to set up a
three-wheelers unit at Nanjangud in Mysore district of Karnataka. Work on the project was
expected to commence by July 2010.
An Indian automotive site called wheelsunplugged.com suggests that Daimler is planning to invest
US$700 million-$1 billion to increase the capacity of its planned truck assembly plant at the
SIPCOT Industrial Park in Oragadam, near Chennai in Tamil Nadu. An initial capacity of 70,000
8/12/2019 Auto and Auto Ancillaries December20091
http://slidepdf.com/reader/full/auto-and-auto-ancillaries-december20091 48/66
CII SR Quarterly Update
Auto Auto Components
48
units a year is planned from a 1,000-acre site.
Mercedes-Benz plans to invest e700 million to increase the production capacity of its trucks in its
manufacturing plant in Chennai. While the infrastructure is expected to address future expansion
plans of the company, details of the time frame of investment were not disclosed. The German
car maker is also on course to increase its headcount three-fold at its R&D centre in Bangalore by
next year and will invest close to Rs. 450 crore on infrastructure and people-related costs.
Supreme-Treves is setting up an automotive components unit with a capacity of 1.50 lakh
numbers per annum at Bidadi, Ramnagaram in Bangalore district of Karnataka. Work on the
project was underway with completion scheduled for May 2010.
Global slowdown has impacted expansion plans of Leo Fasteners, operating out of Puducherry. As
part of its efforts to streamline, the closely-held family-owned enterprise has lined up expansion
plans to boost its capacity by 25%. Currently, the Rs750m Leo has a capacity to produce 1.2 billion
parts annually.
Robert Bosch Engineering and Business Solutions Ltd (RBEI), the engineering and IT services
subsidiary of Bosch in India, said it would invest an initial Rs 170 crore in a new centre in
Coimbatore, which would be developed in three phases. The company would invest Rs 40 crore in
the new centre in 2010. While Rs 50 crore has already been spent in acquiring land and other
expenses, another Rs 130 crore has been committed to constructing the building for the new
centre.
In the southern states of India there are about 74 projects which are at different stages from planning,
implementation, or deferred. Of these, TN has the maximum number of projects (38), followed by 24
in Karnataka, 10 in Andhra Pradesh, and 2 in Kerala. The state-wise details of key investments are
given below:
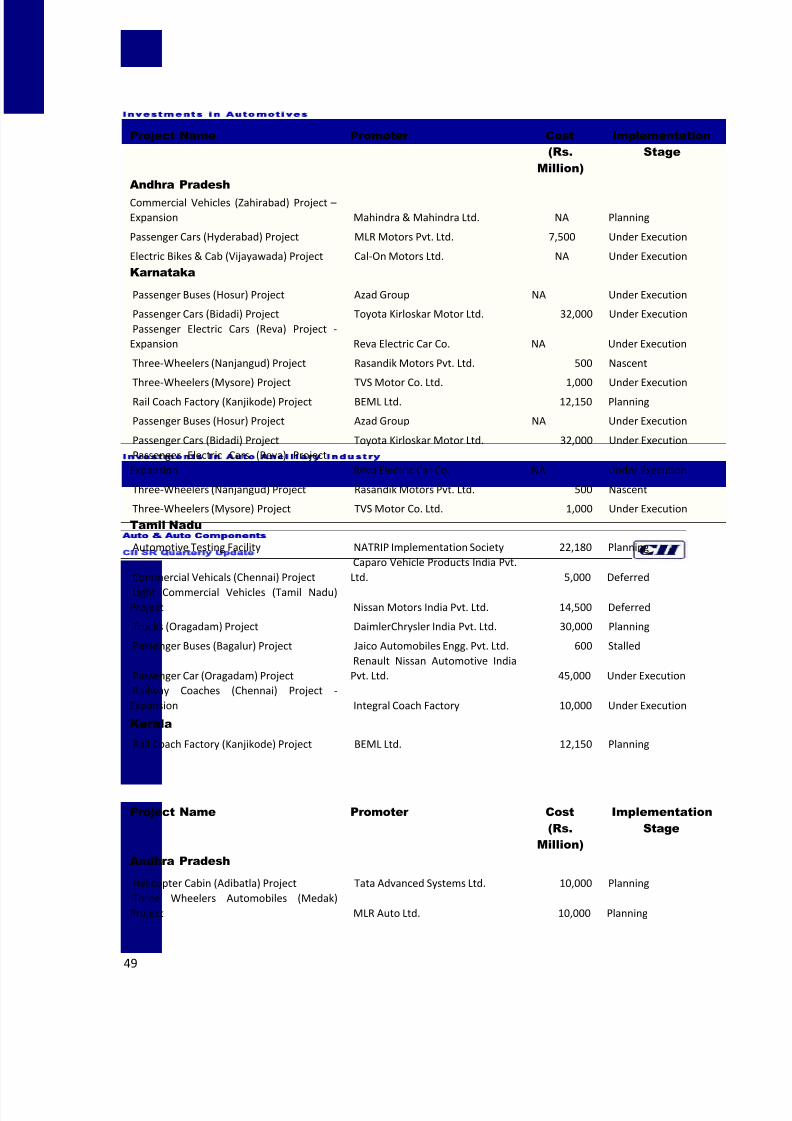
8/12/2019 Auto and Auto Ancillaries December20091
http://slidepdf.com/reader/full/auto-and-auto-ancillaries-december20091 49/66
CII SR Quarterly Update
Auto Auto Components
49
Investments in Automotives
Project Name Promoter Cost
(Rs.
Million)
Implementation
Stage
Andhra Pradesh
Commercial Vehicles (Zahirabad) Project –
Expansion Mahindra & Mahindra Ltd. NA Planning
Passenger Cars (Hyderabad) Project MLR Motors Pvt. Ltd. 7,500 Under Execution
Electric Bikes & Cab (Vijayawada) Project Cal-On Motors Ltd. NA Under Execution
Karnataka
Passenger Buses (Hosur) Project Azad Group NA Under Execution
Passenger Cars (Bidadi) Project Toyota Kirloskar Motor Ltd. 32,000 Under Execution
Passenger Electric Cars (Reva) Project -
Expansion Reva Electric Car Co. NA Under Execution
Three-Wheelers (Nanjangud) Project Rasandik Motors Pvt. Ltd. 500 Nascent
Three-Wheelers (Mysore) Project TVS Motor Co. Ltd. 1,000 Under Execution
Rail Coach Factory (Kanjikode) Project BEML Ltd. 12,150 Planning
Passenger Buses (Hosur) Project Azad Group NA Under Execution
Passenger Cars (Bidadi) Project Toyota Kirloskar Motor Ltd. 32,000 Under Execution
Passenger Electric Cars (Reva) Project -
Expansion Reva Electric Car Co. NA Under Execution
Three-Wheelers (Nanjangud) Project Rasandik Motors Pvt. Ltd. 500 Nascent
Three-Wheelers (Mysore) Project TVS Motor Co. Ltd. 1,000 Under Execution
Tamil Nadu
Automotive Testing Facility NATRIP Implementation Society 22,180 Planning
Commercial Vehicals (Chennai) Project
Caparo Vehicle Products India Pvt.
Ltd. 5,000 Deferred
Light Commercial Vehicles (Tamil Nadu)Project Nissan Motors India Pvt. Ltd. 14,500 Deferred
Trucks (Oragadam) Project DaimlerChrysler India Pvt. Ltd. 30,000 Planning
Passenger Buses (Bagalur) Project Jaico Automobiles Engg. Pvt. Ltd. 600 Stalled
Passenger Car (Oragadam) Project
Renault Nissan Automotive India
Pvt. Ltd. 45,000 Under Execution
Railway Coaches (Chennai) Project -
Expansion Integral Coach Factory 10,000 Under Execution
Kerala
Rail Coach Factory (Kanjikode) Project BEML Ltd. 12,150 Planning
Investments in Auto Ancillary Industry
Project Name Promoter Cost
(Rs.
Million)
Implementation
Stage
Andhra Pradesh
Helicopter Cabin (Adibatla) Project Tata Advanced Systems Ltd. 10,000 Planning
Three Wheelers Automobiles (Medak)
Project MLR Auto Ltd. 10,000 Planning
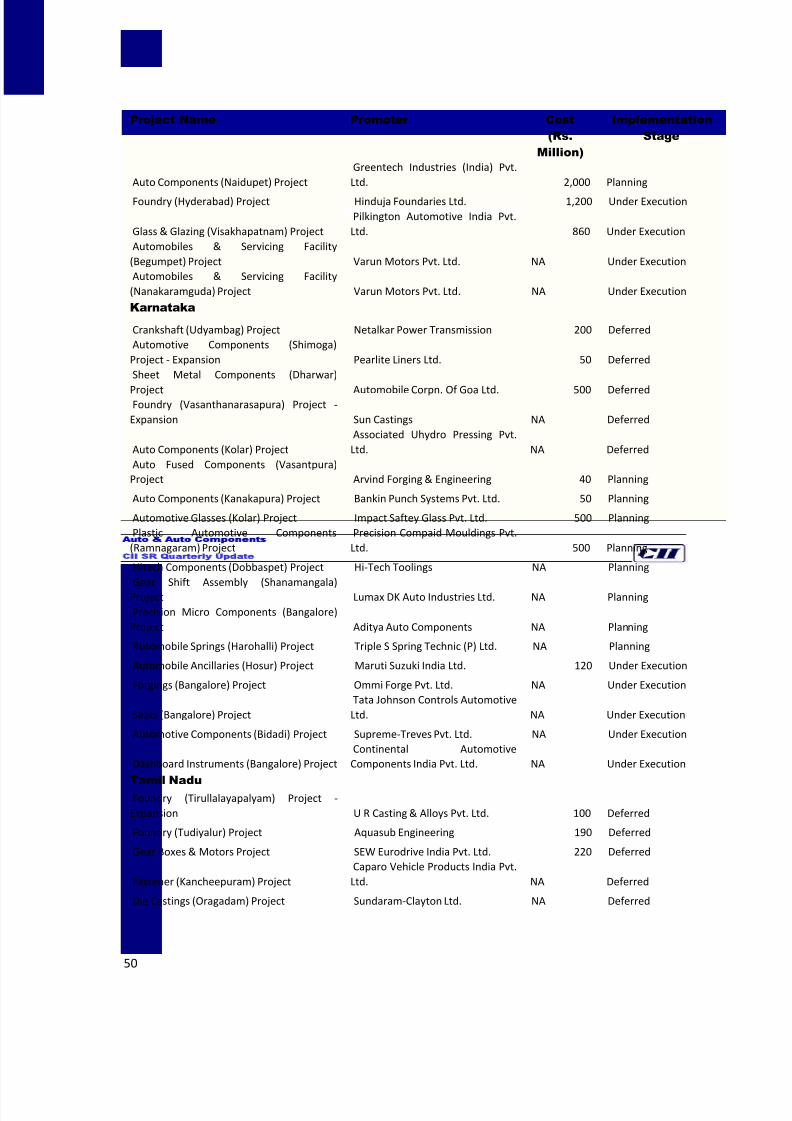
8/12/2019 Auto and Auto Ancillaries December20091
http://slidepdf.com/reader/full/auto-and-auto-ancillaries-december20091 50/66
CII SR Quarterly Update
Auto Auto Components
50
Project Name Promoter Cost
(Rs.
Million)
Implementation
Stage
Auto Components (Naidupet) Project
Greentech Industries (India) Pvt.
Ltd. 2,000 Planning
Foundry (Hyderabad) Project Hinduja Foundaries Ltd. 1,200 Under Execution
Glass & Glazing (Visakhapatnam) Project
Pilkington Automotive India Pvt.
Ltd. 860 Under Execution
Automobiles & Servicing Facility
(Begumpet) Project Varun Motors Pvt. Ltd. NA Under Execution
Automobiles & Servicing Facility
(Nanakaramguda) Project Varun Motors Pvt. Ltd. NA Under Execution
Karnataka
Crankshaft (Udyambag) Project Netalkar Power Transmission 200 Deferred
Automotive Components (Shimoga)
Project - Expansion Pearlite Liners Ltd. 50 Deferred
Sheet Metal Components (Dharwar)
Project Automobile Corpn. Of Goa Ltd. 500 DeferredFoundry (Vasanthanarasapura) Project -
Expansion Sun Castings NA Deferred
Auto Components (Kolar) Project
Associated Uhydro Pressing Pvt.
Ltd. NA Deferred
Auto Fused Components (Vasantpura)
Project Arvind Forging & Engineering 40 Planning
Auto Components (Kanakapura) Project Bankin Punch Systems Pvt. Ltd. 50 Planning
Automotive Glasses (Kolar) Project Impact Saftey Glass Pvt. Ltd. 500 Planning
Plastic Automotive Components
(Ramnagaram) Project
Precision Compaid Mouldings Pvt.
Ltd. 500 Planning
Hitech Components (Dobbaspet) Project Hi-Tech Toolings NA Planning
Gear Shift Assembly (Shanamangala)
Project Lumax DK Auto Industries Ltd. NA Planning
Precision Micro Components (Bangalore)
Project Aditya Auto Components NA Planning
Automobile Springs (Harohalli) Project Triple S Spring Technic (P) Ltd. NA Planning
Automobile Ancillaries (Hosur) Project Maruti Suzuki India Ltd. 120 Under Execution
Forgings (Bangalore) Project Ommi Forge Pvt. Ltd. NA Under Execution
Seats (Bangalore) Project
Tata Johnson Controls Automotive
Ltd. NA Under Execution
Automotive Components (Bidadi) Project Supreme-Treves Pvt. Ltd. NA Under Execution
Dashboard Instruments (Bangalore) Project
Continental Automotive
Components India Pvt. Ltd. NA Under Execution
Tamil NaduFoundry (Tirullalayapalyam) Project -
Expansion U R Casting & Alloys Pvt. Ltd. 100 Deferred
Foundry (Tudiyalur) Project Aquasub Engineering 190 Deferred
Gear Boxes & Motors Project SEW Eurodrive India Pvt. Ltd. 220 Deferred
Fastener (Kancheepuram) Project
Caparo Vehicle Products India Pvt.
Ltd. NA Deferred
Die Castings (Oragadam) Project Sundaram-Clayton Ltd. NA Deferred
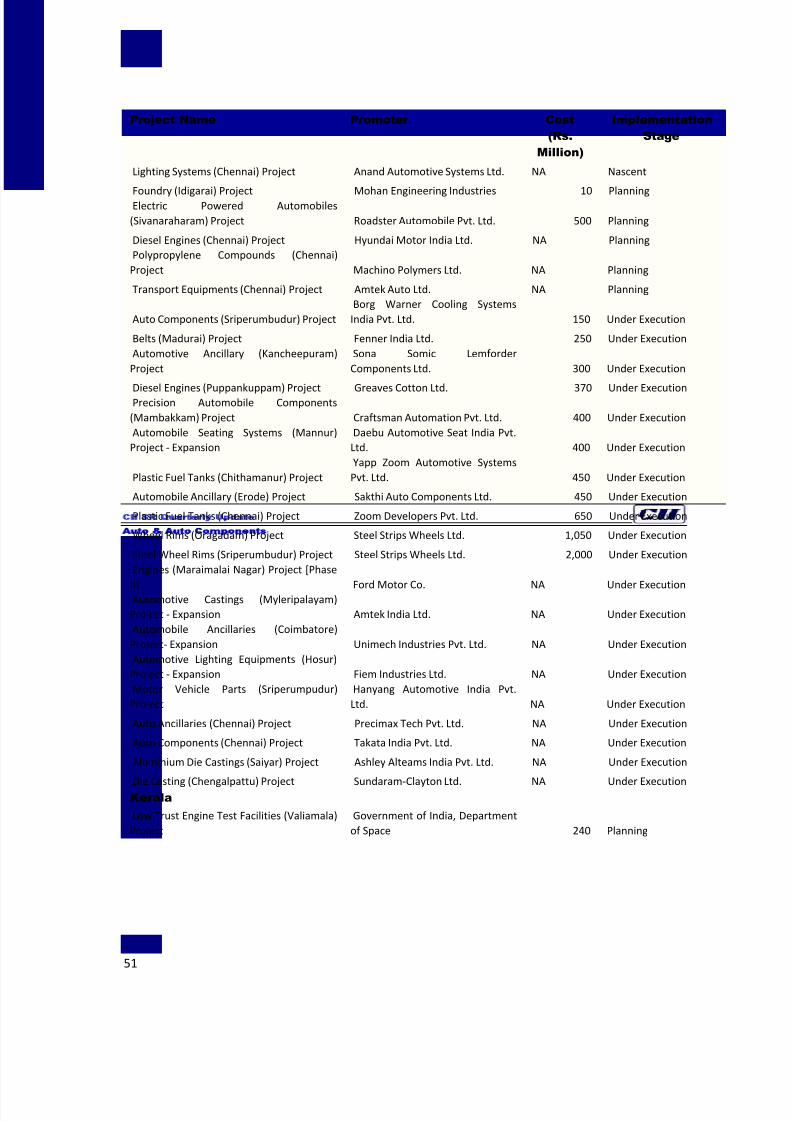
8/12/2019 Auto and Auto Ancillaries December20091
http://slidepdf.com/reader/full/auto-and-auto-ancillaries-december20091 51/66
CII SR Quarterly Update
Auto Auto Components
51
Project Name Promoter Cost
(Rs.
Million)
Implementation
Stage
Lighting Systems (Chennai) Project Anand Automotive Systems Ltd. NA Nascent
Foundry (Idigarai) Project Mohan Engineering Industries 10 PlanningElectric Powered Automobiles
(Sivanaraharam) Project Roadster Automobile Pvt. Ltd. 500 Planning
Diesel Engines (Chennai) Project Hyundai Motor India Ltd. NA Planning
Polypropylene Compounds (Chennai)
Project Machino Polymers Ltd. NA Planning
Transport Equipments (Chennai) Project Amtek Auto Ltd. NA Planning
Auto Components (Sriperumbudur) Project
Borg Warner Cooling Systems
India Pvt. Ltd. 150 Under Execution
Belts (Madurai) Project Fenner India Ltd. 250 Under Execution
Automotive Ancillary (Kancheepuram)
Project
Sona Somic Lemforder
Components Ltd. 300 Under Execution
Diesel Engines (Puppankuppam) Project Greaves Cotton Ltd. 370 Under ExecutionPrecision Automobile Components
(Mambakkam) Project Craftsman Automation Pvt. Ltd. 400 Under Execution
Automobile Seating Systems (Mannur)
Project - Expansion
Daebu Automotive Seat India Pvt.
Ltd. 400 Under Execution
Plastic Fuel Tanks (Chithamanur) Project
Yapp Zoom Automotive Systems
Pvt. Ltd. 450 Under Execution
Automobile Ancillary (Erode) Project Sakthi Auto Components Ltd. 450 Under Execution
Plastic Fuel Tanks (Chennai) Project Zoom Developers Pvt. Ltd. 650 Under Execution
Wheel Rims (Oragadam) Project Steel Strips Wheels Ltd. 1,050 Under Execution
Steel Wheel Rims (Sriperumbudur) Project Steel Strips Wheels Ltd. 2,000 Under Execution
Engines (Maraimalai Nagar) Project [Phase
II] Ford Motor Co. NA Under ExecutionAutomotive Castings (Myleripalayam)
Project - Expansion Amtek India Ltd. NA Under Execution
Automobile Ancillaries (Coimbatore)
Project- Expansion Unimech Industries Pvt. Ltd. NA Under Execution
Automotive Lighting Equipments (Hosur)
Project - Expansion Fiem Industries Ltd. NA Under Execution
Motor Vehicle Parts (Sriperumpudur)
Project
Hanyang Automotive India Pvt.
Ltd. NA Under Execution
Auto Ancillaries (Chennai) Project Precimax Tech Pvt. Ltd. NA Under Execution
Auto Components (Chennai) Project Takata India Pvt. Ltd. NA Under Execution
Aluminium Die Castings (Saiyar) Project Ashley Alteams India Pvt. Ltd. NA Under Execution
Die Casting (Chengalpattu) Project Sundaram-Clayton Ltd. NA Under ExecutionKerala
Low Trust Engine Test Facilities (Valiamala)
Project
Government of India, Department
of Space 240 Planning
8/12/2019 Auto and Auto Ancillaries December20091
http://slidepdf.com/reader/full/auto-and-auto-ancillaries-december20091 52/66
8/12/2019 Auto and Auto Ancillaries December20091
http://slidepdf.com/reader/full/auto-and-auto-ancillaries-december20091 53/66
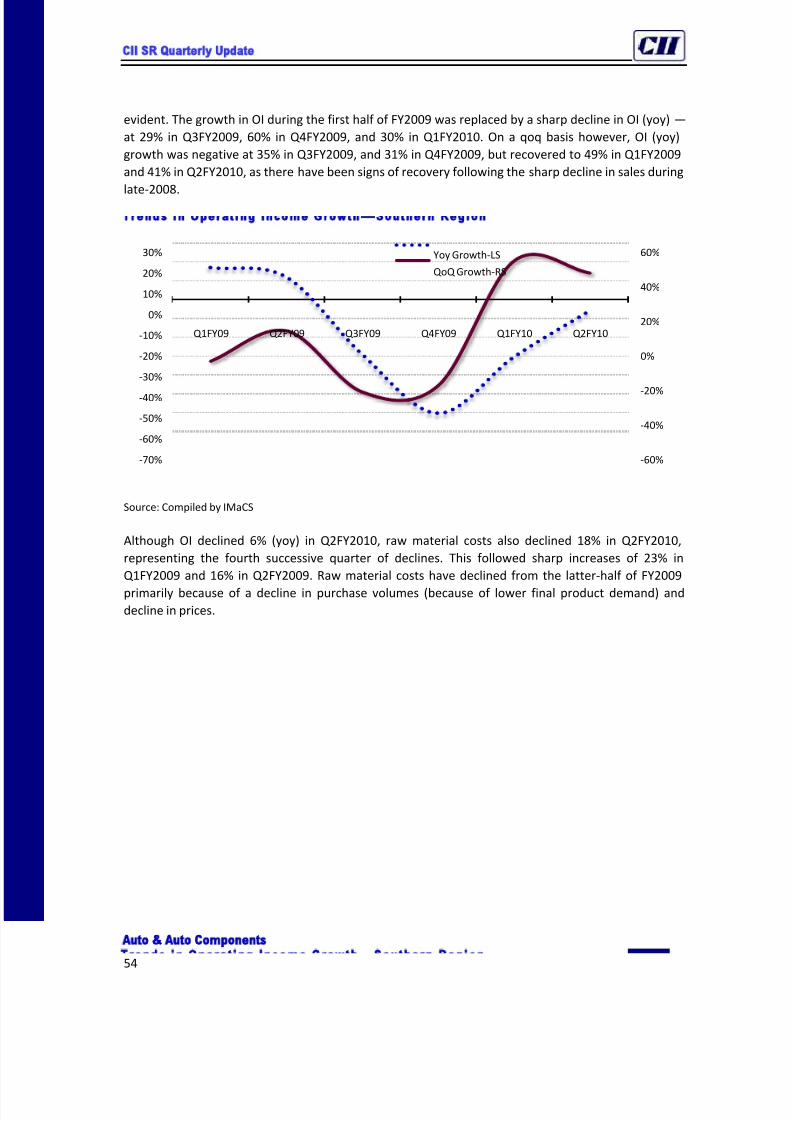
8/12/2019 Auto and Auto Ancillaries December20091
http://slidepdf.com/reader/full/auto-and-auto-ancillaries-december20091 54/66
CII SR Quarterly Update
Auto Auto Components
54
evident. The growth in OI during the first half of FY2009 was replaced by a sharp decline in OI (yoy) —
at 29% in Q3FY2009, 60% in Q4FY2009, and 30% in Q1FY2010. On a qoq basis however, OI (yoy)
growth was negative at 35% in Q3FY2009, and 31% in Q4FY2009, but recovered to 49% in Q1FY2009
and 41% in Q2FY2010, as there have been signs of recovery following the sharp decline in sales during
late-2008.
Trends in Operating Income Growth —Southern Region
Source: Compiled by IMaCS
Although OI declined 6% (yoy) in Q2FY2010, raw material costs also declined 18% in Q2FY2010,
representing the fourth successive quarter of declines. This followed sharp increases of 23% in
Q1FY2009 and 16% in Q2FY2009. Raw material costs have declined from the latter-half of FY2009
primarily because of a decline in purchase volumes (because of lower final product demand) anddecline in prices.
-60%
-40%
-20%
0%
20%
40%
60%
-70%
-60%
-50%
-40%
-30%
-20%
-10%
0%
10%
20%
30%
Q1FY09 Q2FY09 Q3FY09 Q4FY09 Q1FY10 Q2FY10
Yoy Growth-LS
QoQ Growth-RS
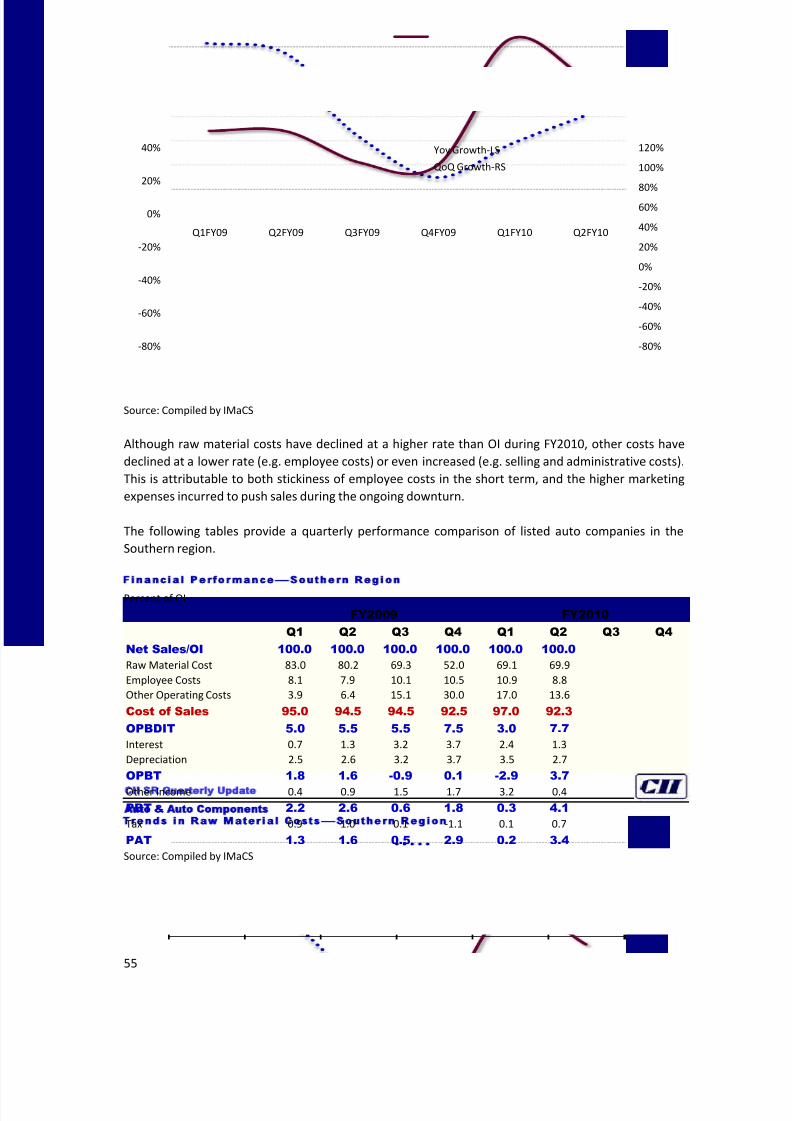
8/12/2019 Auto and Auto Ancillaries December20091
http://slidepdf.com/reader/full/auto-and-auto-ancillaries-december20091 55/66
CII SR Quarterly Update
Auto Auto Components
55
Trends in Raw Material Costs—Southern Region
Source: Compiled by IMaCS
Although raw material costs have declined at a higher rate than OI during FY2010, other costs have
declined at a lower rate (e.g. employee costs) or even increased (e.g. selling and administrative costs).
This is attributable to both stickiness of employee costs in the short term, and the higher marketing
expenses incurred to push sales during the ongoing downturn.
The following tables provide a quarterly performance comparison of listed auto companies in the
Southern region.
Financial Performance—Southern RegionPercent of OI
FY2009 FY2010
Q1 Q2 Q3 Q4 Q1 Q2 Q3 Q4
Net Sales/OI 100.0 100.0 100.0 100.0 100.0 100.0
Raw Material Cost 83.0 80.2 69.3 52.0 69.1 69.9
Employee Costs 8.1 7.9 10.1 10.5 10.9 8.8
Other Operating Costs 3.9 6.4 15.1 30.0 17.0 13.6
Cost of Sales 95.0 94.5 94.5 92.5 97.0 92.3
OPBDIT 5.0 5.5 5.5 7.5 3.0 7.7
Interest 0.7 1.3 3.2 3.7 2.4 1.3
Depreciation 2.5 2.6 3.2 3.7 3.5 2.7
OPBT 1.8 1.6 -0.9 0.1 -2.9 3.7
Other Income 0.4 0.9 1.5 1.7 3.2 0.4
PBT 2.2 2.6 0.6 1.8 0.3 4.1
Tax 0.9 1.0 0.1 -1.1 0.1 0.7
PAT 1.3 1.6 0.5 2.9 0.2 3.4
Source: Compiled by IMaCS
-80%
-60%
-40%
-20%
0%
20%
40%
60%
80%
100%
120%
-80%
-60%
-40%
-20%
0%
20%
40%
Q1FY09 Q2FY09 Q3FY09 Q4FY09 Q1FY10 Q2FY10
Yoy Growth-LS
QoQ Growth-RS

8/12/2019 Auto and Auto Ancillaries December20091
http://slidepdf.com/reader/full/auto-and-auto-ancillaries-december20091 56/66
CII SR Quarterly Update
Auto Auto Components
56
Financial Performance—Southern RegionRs. Million
FY2009 FY2010
Q1 Q2 Q3 Q4 Q1 Q2 Q3 Q4
Net Sales/OI 28,845 30,021 19,529 13,507 20,080 28,286
Raw Material Cost 23,943 24,065 13,533 7,023 13,871 19,765
Employee Costs 2,344 2,364 1,972 1,419 2,181 2,475
Other Operating Costs 1,111 1,930 2,950 4,057 3,423 3,858
Cost of Sales 27,398 28,359 18,454 12,498 19,475 26,098
OPBDIT 1,447 1,661 1,075 1,009 605 2,188
Interest 212 391 623 502 474 370
Depreciation 711 778 627 494 706 775
OPBT 524 493 -175 13 -574 1,043
Other Income 110 277 289 233 643 107
PBT 634 770 114 246 69 1,150
Tax 263 295 26 -142 20 194
PAT 371 475 88 388 48 956
Source: Compiled by IMaCS
As can be seen from the table above, the higher decline in operating costs resulted in a steep
improvement in operating margins during Q2FY2010. Further, net margins have shown some signs of
improvement during Q2FY2010 compared to the previous quarter and previous fiscal.
Financial Performance—Southern RegionRs. Million, except percentages
Rs. Million Change
(%)
% of OI
H1FY 2010 2009 2010 2009
Net Sales/OI 48,366 58,866 -17.8 100.0 100.0
Raw Material Cost 33,635 48,008 -29.9 69.5 81.6Employee Costs 4,656 4,708 -1.1 9.6 8.0
Other Operating Costs 7,281 3,041 139.4 15.1 5.2
Cost of Sales 45,572 55,758 -18.3 94.2 94.7
OPBDIT 2,794 3,108 -10.1 5.8 5.3
Interest 844 602 40.1 1.7 1.0
Depreciation 1,481 1,489 -0.5 3.1 2.5
OPBT 469 1,017 -53.9 1.0 1.7
Other Income 750 386 94.1 1.6 0.7
PBT 1,219 1,403 -13.2 2.5 2.4
Tax 214 557 -61.6 0.4 0.9
PAT 1,004 846 18.7 2.1 1.4
Source: Compiled by IMaCS
On a quarterly basis in southern India, operating margins declined from 8.9% in Q4FY2008 to 5.5% in
Q2FY2009 and Q3FY2009, but recovered to 7.5% in Q4FY2009. After a marginal recovery in Q4FY2009,
the operating margins fell to 3% in Q1FY2010, before increasing to 7.7% in Q2FY2010.
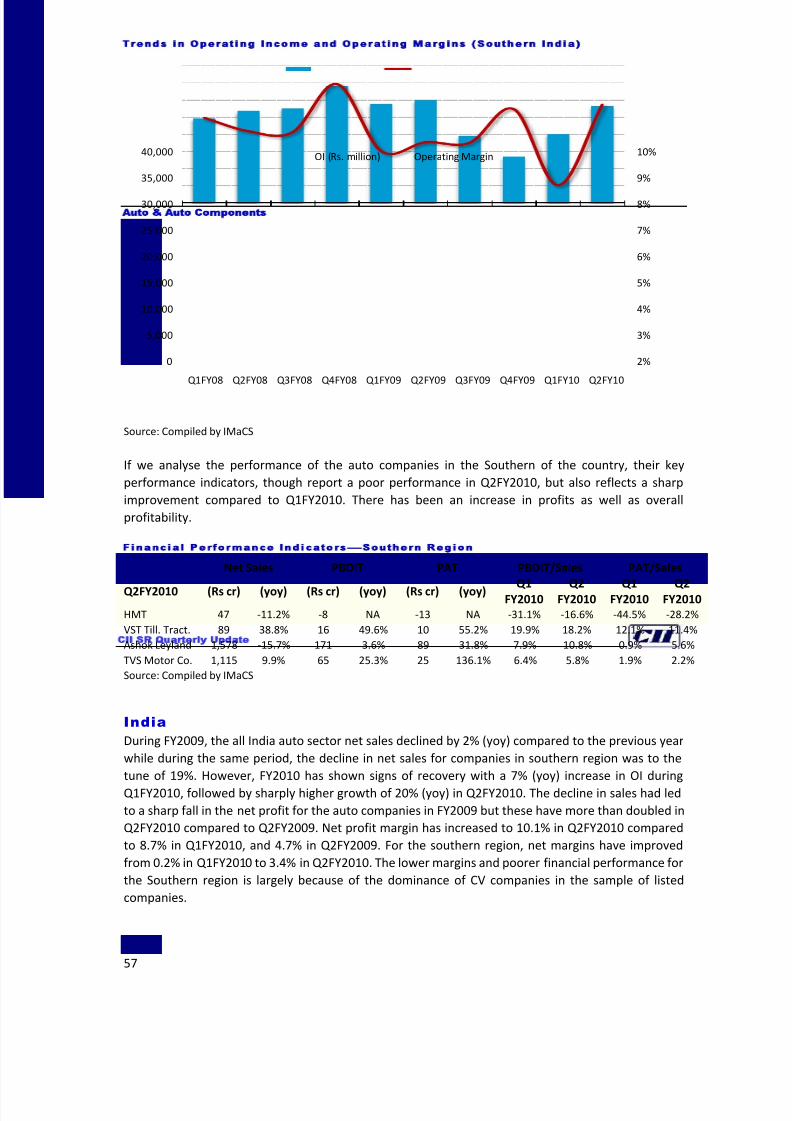
8/12/2019 Auto and Auto Ancillaries December20091
http://slidepdf.com/reader/full/auto-and-auto-ancillaries-december20091 57/66
CII SR Quarterly Update
Auto Auto Components
57
Trends in Operating Income and Operating Margins (Southern India)
Source: Compiled by IMaCS
If we analyse the performance of the auto companies in the Southern of the country, their key
performance indicators, though report a poor performance in Q2FY2010, but also reflects a sharp
improvement compared to Q1FY2010. There has been an increase in profits as well as overall
profitability.
Financial Performance Indicators—Southern RegionNet Sales PBDIT PAT PBDIT/Sales PAT/Sales
Q2FY2010 (Rs cr) (yoy) (Rs cr) (yoy) (Rs cr) (yoy) Q1FY2010 Q2FY2010 Q1FY2010 Q2FY2010
HMT 47 -11.2% -8 NA -13 NA -31.1% -16.6% -44.5% -28.2%
VST Till. Tract. 89 38.8% 16 49.6% 10 55.2% 19.9% 18.2% 12.1% 11.4%
Ashok Leyland 1,578 -15.7% 171 3.6% 89 31.8% 7.9% 10.8% 0.9% 5.6%
TVS Motor Co. 1,115 9.9% 65 25.3% 25 136.1% 6.4% 5.8% 1.9% 2.2%
Source: Compiled by IMaCS
India
During FY2009, the all India auto sector net sales declined by 2% (yoy) compared to the previous year
while during the same period, the decline in net sales for companies in southern region was to the
tune of 19%. However, FY2010 has shown signs of recovery with a 7% (yoy) increase in OI during
Q1FY2010, followed by sharply higher growth of 20% (yoy) in Q2FY2010. The decline in sales had led
to a sharp fall in the net profit for the auto companies in FY2009 but these have more than doubled in
Q2FY2010 compared to Q2FY2009. Net profit margin has increased to 10.1% in Q2FY2010 compared
to 8.7% in Q1FY2010, and 4.7% in Q2FY2009. For the southern region, net margins have improved
from 0.2% in Q1FY2010 to 3.4% in Q2FY2010. The lower margins and poorer financial performance for
the Southern region is largely because of the dominance of CV companies in the sample of listed
companies.
2%
3%
4%
5%
6%
7%
8%
9%
10%
0
5,000
10,000
15,000
20,000
25,000
30,000
35,000
40,000
Q1FY08 Q2FY08 Q3FY08 Q4FY08 Q1FY09 Q2FY09 Q3FY09 Q4FY09 Q1FY10 Q2FY10
OI (Rs. million) Operating Margin
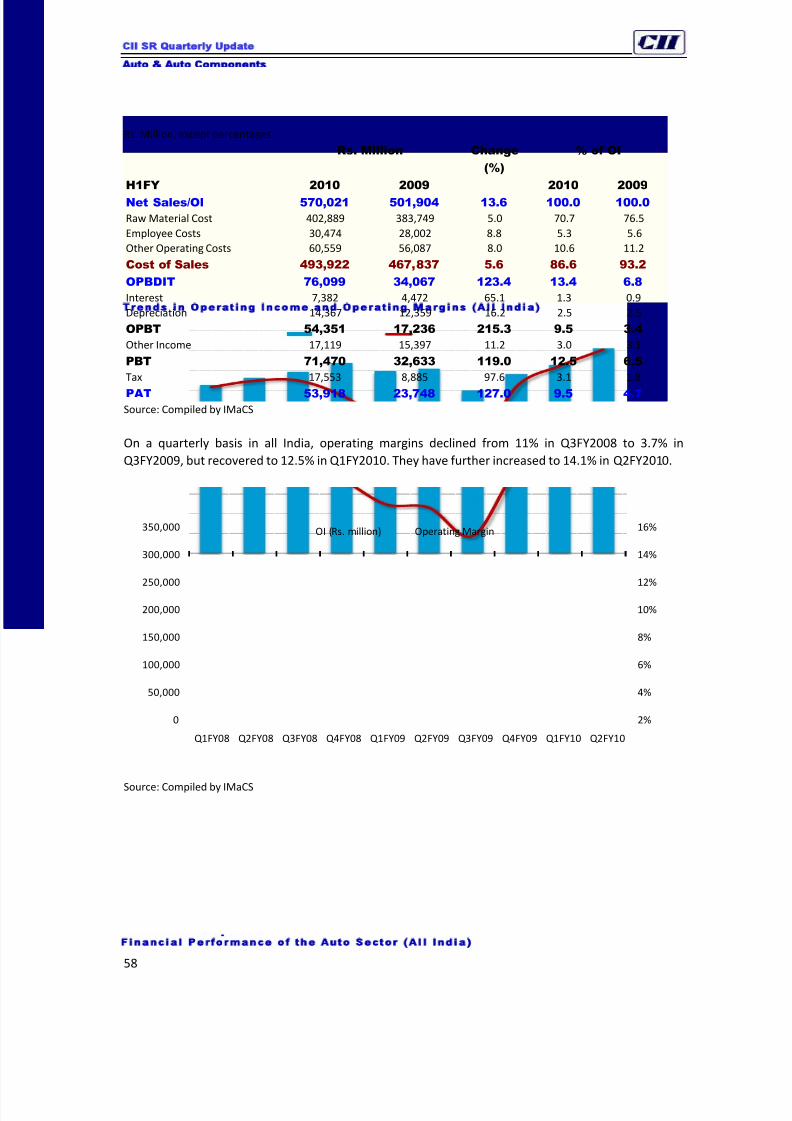
8/12/2019 Auto and Auto Ancillaries December20091
http://slidepdf.com/reader/full/auto-and-auto-ancillaries-december20091 58/66
CII SR Quarterly Update
Auto Auto Components
58
Financial Performance of the Auto Sector (All India)Rs. Million, except percentages
Rs. Million Change
(%)
% of OI
H1FY 2010 2009 2010 2009
Net Sales/OI 570,021 501,904 13.6 100.0 100.0
Raw Material Cost 402,889 383,749 5.0 70.7 76.5
Employee Costs 30,474 28,002 8.8 5.3 5.6
Other Operating Costs 60,559 56,087 8.0 10.6 11.2
Cost of Sales 493,922 467,837 5.6 86.6 93.2
OPBDIT 76,099 34,067 123.4 13.4 6.8
Interest 7,382 4,472 65.1 1.3 0.9
Depreciation 14,367 12,359 16.2 2.5 2.5
OPBT 54,351 17,236 215.3 9.5 3.4
Other Income 17,119 15,397 11.2 3.0 3.1
PBT 71,470 32,633 119.0 12.5 6.5
Tax 17,553 8,885 97.6 3.1 1.8
PAT 53,918 23,748 127.0 9.5 4.7Source: Compiled by IMaCS
On a quarterly basis in all India, operating margins declined from 11% in Q3FY2008 to 3.7% in
Q3FY2009, but recovered to 12.5% in Q1FY2010. They have further increased to 14.1% in Q2FY2010.
Trends in Operating Income and Operating Margins (All India)
Source: Compiled by IMaCS
2%
4%
6%
8%
10%
12%
14%
16%
0
50,000
100,000
150,000
200,000
250,000
300,000
350,000
Q1FY08 Q2FY08 Q3FY08 Q4FY08 Q1FY09 Q2FY09 Q3FY09 Q4FY09 Q1FY10 Q2FY10
OI (Rs. million) Operating Margin
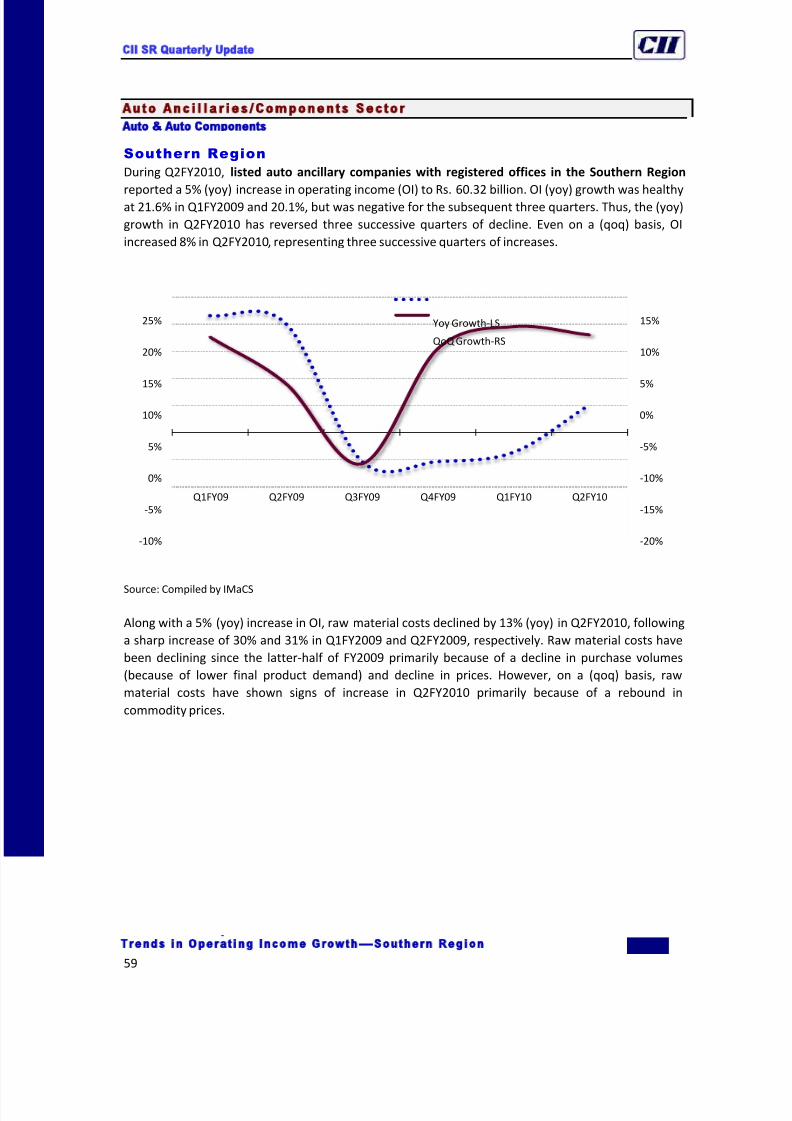
8/12/2019 Auto and Auto Ancillaries December20091
http://slidepdf.com/reader/full/auto-and-auto-ancillaries-december20091 59/66
CII SR Quarterly Update
Auto Auto Components
59
Auto Anc i l la r ies /Components Sec tor
Southern Region
During Q2FY2010, listed auto ancillary companies with registered offices in the Southern Region
reported a 5% (yoy) increase in operating income (OI) to Rs. 60.32 billion. OI (yoy) growth was healthy
at 21.6% in Q1FY2009 and 20.1%, but was negative for the subsequent three quarters. Thus, the (yoy)
growth in Q2FY2010 has reversed three successive quarters of decline. Even on a (qoq) basis, OI
increased 8% in Q2FY2010, representing three successive quarters of increases.
Trends in Operating Income Growth —Southern Region
Source: Compiled by IMaCS
Along with a 5% (yoy) increase in OI, raw material costs declined by 13% (yoy) in Q2FY2010, following
a sharp increase of 30% and 31% in Q1FY2009 and Q2FY2009, respectively. Raw material costs have
been declining since the latter-half of FY2009 primarily because of a decline in purchase volumes
(because of lower final product demand) and decline in prices. However, on a (qoq) basis, raw
material costs have shown signs of increase in Q2FY2010 primarily because of a rebound in
commodity prices.
-20%
-15%
-10%
-5%
0%
5%
10%
15%
-10%
-5%
0%
5%
10%
15%
20%
25%
Q1FY09 Q2FY09 Q3FY09 Q4FY09 Q1FY10 Q2FY10
Yoy Growth-LS
QoQ Growth-RS
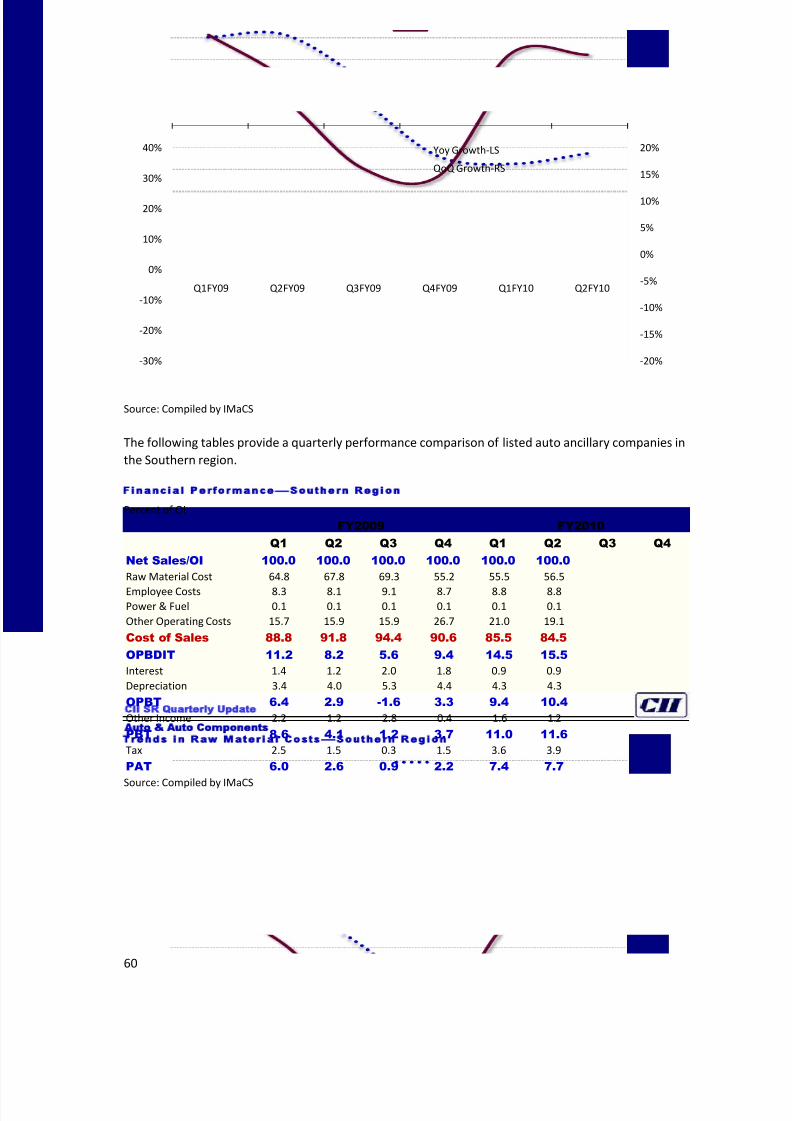
8/12/2019 Auto and Auto Ancillaries December20091
http://slidepdf.com/reader/full/auto-and-auto-ancillaries-december20091 60/66
CII SR Quarterly Update
Auto Auto Components
60
Trends in Raw Material Costs—Southern Region
Source: Compiled by IMaCS
The following tables provide a quarterly performance comparison of listed auto ancillary companies in
the Southern region.
Financial Performance—Southern RegionPercent of OI
FY2009 FY2010
Q1 Q2 Q3 Q4 Q1 Q2 Q3 Q4
Net Sales/OI 100.0 100.0 100.0 100.0 100.0 100.0
Raw Material Cost 64.8 67.8 69.3 55.2 55.5 56.5
Employee Costs 8.3 8.1 9.1 8.7 8.8 8.8Power & Fuel 0.1 0.1 0.1 0.1 0.1 0.1
Other Operating Costs 15.7 15.9 15.9 26.7 21.0 19.1
Cost of Sales 88.8 91.8 94.4 90.6 85.5 84.5
OPBDIT 11.2 8.2 5.6 9.4 14.5 15.5
Interest 1.4 1.2 2.0 1.8 0.9 0.9
Depreciation 3.4 4.0 5.3 4.4 4.3 4.3
OPBT 6.4 2.9 -1.6 3.3 9.4 10.4
Other Income 2.2 1.2 2.8 0.4 1.6 1.2
PBT 8.6 4.1 1.2 3.7 11.0 11.6
Tax 2.5 1.5 0.3 1.5 3.6 3.9
PAT 6.0 2.6 0.9 2.2 7.4 7.7
Source: Compiled by IMaCS
-20%
-15%
-10%
-5%
0%
5%
10%
15%
20%
-30%
-20%
-10%
0%
10%
20%
30%
40%
Q1FY09 Q2FY09 Q3FY09 Q4FY09 Q1FY10 Q2FY10
Yoy Growth-LS
QoQ Growth-RS
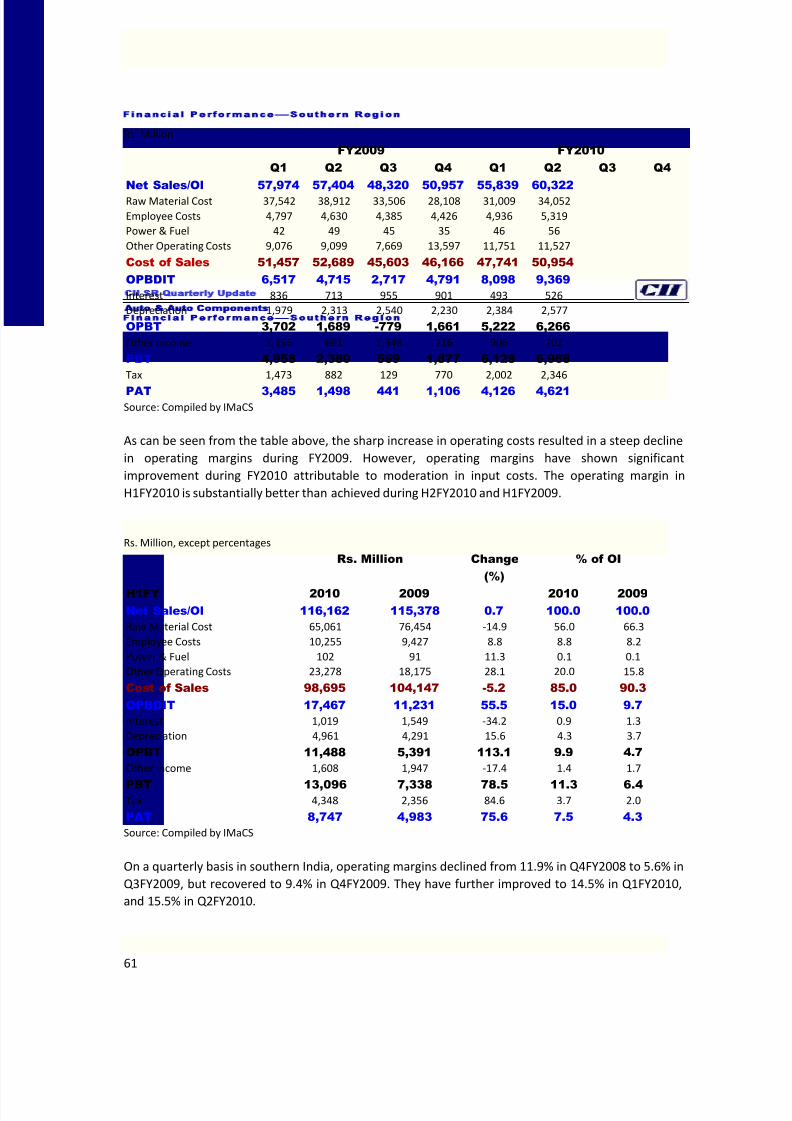
8/12/2019 Auto and Auto Ancillaries December20091
http://slidepdf.com/reader/full/auto-and-auto-ancillaries-december20091 61/66
CII SR Quarterly Update
Auto Auto Components
61
Financial Performance—Southern RegionRs. Million
FY2009 FY2010
Q1 Q2 Q3 Q4 Q1 Q2 Q3 Q4
Net Sales/OI 57,974 57,404 48,320 50,957 55,839 60,322
Raw Material Cost 37,542 38,912 33,506 28,108 31,009 34,052
Employee Costs 4,797 4,630 4,385 4,426 4,936 5,319
Power & Fuel 42 49 45 35 46 56
Other Operating Costs 9,076 9,099 7,669 13,597 11,751 11,527
Cost of Sales 51,457 52,689 45,603 46,166 47,741 50,954
OPBDIT 6,517 4,715 2,717 4,791 8,098 9,369
Interest 836 713 955 901 493 526
Depreciation 1,979 2,313 2,540 2,230 2,384 2,577
OPBT 3,702 1,689 -779 1,661 5,222 6,266
Other Income 1,256 691 1,348 216 906 702
PBT 4,958 2,380 569 1,877 6,128 6,968
Tax 1,473 882 129 770 2,002 2,346
PAT 3,485 1,498 441 1,106 4,126 4,621Source: Compiled by IMaCS
As can be seen from the table above, the sharp increase in operating costs resulted in a steep decline
in operating margins during FY2009. However, operating margins have shown significant
improvement during FY2010 attributable to moderation in input costs. The operating margin in
H1FY2010 is substantially better than achieved during H2FY2010 and H1FY2009.
Financial Performance—Southern RegionRs. Million, except percentages
Rs. Million Change
(%)
% of OI
H1FY 2010 2009 2010 2009
Net Sales/OI 116,162 115,378 0.7 100.0 100.0
Raw Material Cost 65,061 76,454 -14.9 56.0 66.3
Employee Costs 10,255 9,427 8.8 8.8 8.2
Power & Fuel 102 91 11.3 0.1 0.1
Other Operating Costs 23,278 18,175 28.1 20.0 15.8
Cost of Sales 98,695 104,147 -5.2 85.0 90.3
OPBDIT 17,467 11,231 55.5 15.0 9.7
Interest 1,019 1,549 -34.2 0.9 1.3
Depreciation 4,961 4,291 15.6 4.3 3.7
OPBT 11,488 5,391 113.1 9.9 4.7
Other Income 1,608 1,947 -17.4 1.4 1.7
PBT 13,096 7,338 78.5 11.3 6.4Tax 4,348 2,356 84.6 3.7 2.0
PAT 8,747 4,983 75.6 7.5 4.3
Source: Compiled by IMaCS
On a quarterly basis in southern India, operating margins declined from 11.9% in Q4FY2008 to 5.6% in
Q3FY2009, but recovered to 9.4% in Q4FY2009. They have further improved to 14.5% in Q1FY2010,
and 15.5% in Q2FY2010.
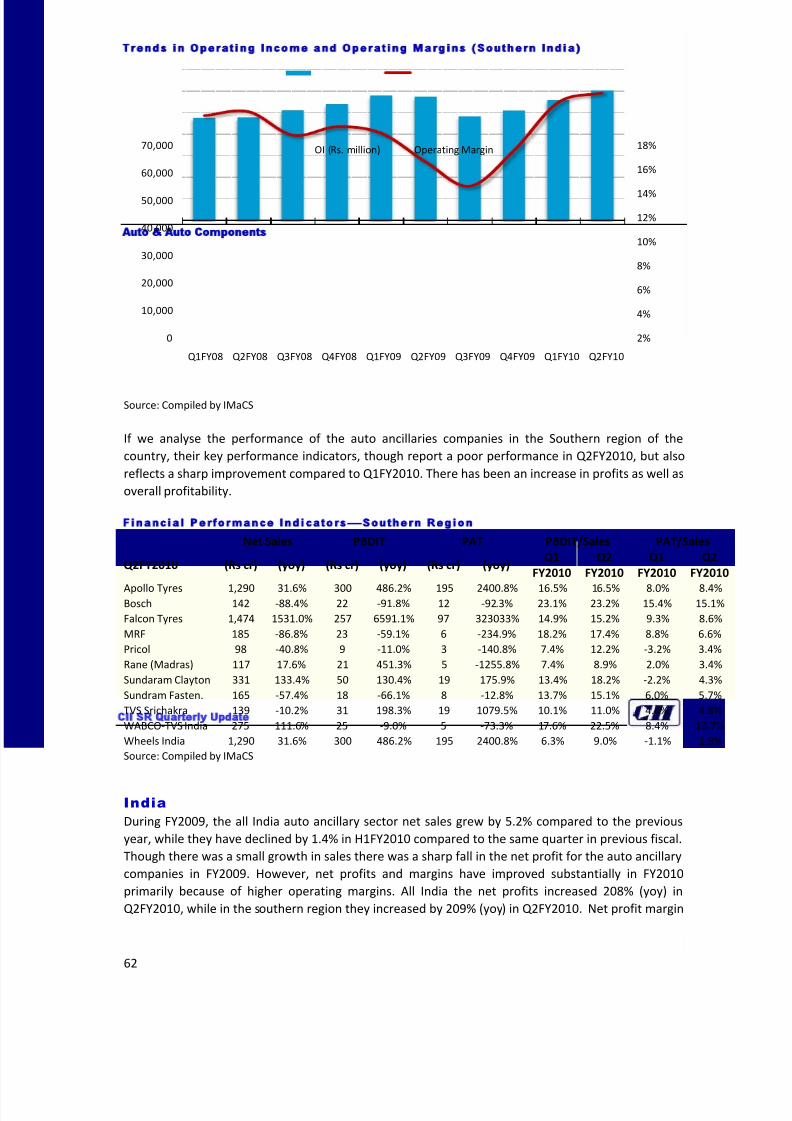
8/12/2019 Auto and Auto Ancillaries December20091
http://slidepdf.com/reader/full/auto-and-auto-ancillaries-december20091 62/66
CII SR Quarterly Update
Auto Auto Components
62
Trends in Operating Income and Operating Margins (Southern India)
Source: Compiled by IMaCS
If we analyse the performance of the auto ancillaries companies in the Southern region of the
country, their key performance indicators, though report a poor performance in Q2FY2010, but also
reflects a sharp improvement compared to Q1FY2010. There has been an increase in profits as well as
overall profitability.
Financial Performance Indicators—Southern Region
Net Sales PBDIT PAT PBDIT/Sales PAT/Sales
Q2FY2010 (Rs cr) (yoy) (Rs cr) (yoy) (Rs cr) (yoy)Q1
FY2010
Q2
FY2010
Q1
FY2010
Q2
FY2010
Apollo Tyres 1,290 31.6% 300 486.2% 195 2400.8% 16.5% 16.5% 8.0% 8.4%Bosch 142 -88.4% 22 -91.8% 12 -92.3% 23.1% 23.2% 15.4% 15.1%
Falcon Tyres 1,474 1531.0% 257 6591.1% 97 323033% 14.9% 15.2% 9.3% 8.6%
MRF 185 -86.8% 23 -59.1% 6 -234.9% 18.2% 17.4% 8.8% 6.6%
Pricol 98 -40.8% 9 -11.0% 3 -140.8% 7.4% 12.2% -3.2% 3.4%
Rane (Madras) 117 17.6% 21 451.3% 5 -1255.8% 7.4% 8.9% 2.0% 3.4%
Sundaram Clayton 331 133.4% 50 130.4% 19 175.9% 13.4% 18.2% -2.2% 4.3%
Sundram Fasten. 165 -57.4% 18 -66.1% 8 -12.8% 13.7% 15.1% 6.0% 5.7%
TVS Srichakra 139 -10.2% 31 198.3% 19 1079.5% 10.1% 11.0% 4.4% 4.8%
WABCO-TVS India 275 111.6% 25 -9.0% 5 -73.3% 17.6% 22.5% 8.4% 13.7%
Wheels India 1,290 31.6% 300 486.2% 195 2400.8% 6.3% 9.0% -1.1% 1.8%
Source: Compiled by IMaCS
India
During FY2009, the all India auto ancillary sector net sales grew by 5.2% compared to the previous
year, while they have declined by 1.4% in H1FY2010 compared to the same quarter in previous fiscal.
Though there was a small growth in sales there was a sharp fall in the net profit for the auto ancillary
companies in FY2009. However, net profits and margins have improved substantially in FY2010
primarily because of higher operating margins. All India the net profits increased 208% (yoy) in
Q2FY2010, while in the southern region they increased by 209% (yoy) in Q2FY2010. Net profit margin
2%
4%
6%
8%
10%
12%
14%
16%
18%
0
10,000
20,000
30,000
40,000
50,000
60,000
70,000
Q1FY08 Q2FY08 Q3FY08 Q4FY08 Q1FY09 Q2FY09 Q3FY09 Q4FY09 Q1FY10 Q2FY10
OI (Rs. million) Operating Margin
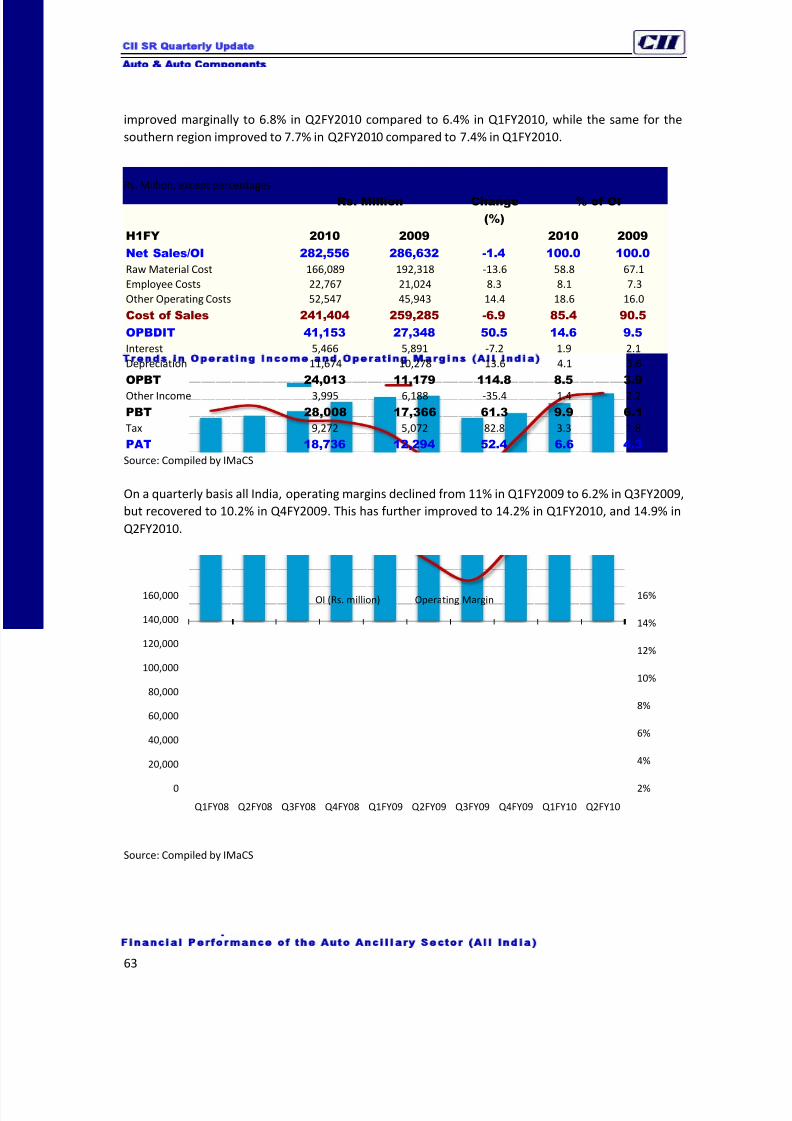
8/12/2019 Auto and Auto Ancillaries December20091
http://slidepdf.com/reader/full/auto-and-auto-ancillaries-december20091 63/66
CII SR Quarterly Update
Auto Auto Components
63
improved marginally to 6.8% in Q2FY2010 compared to 6.4% in Q1FY2010, while the same for the
southern region improved to 7.7% in Q2FY2010 compared to 7.4% in Q1FY2010.
Financial Performance of the Auto Ancillary Sector (All India)Rs. Million, except percentages
Rs. Million Change
(%)
% of OI
H1FY 2010 2009 2010 2009
Net Sales/OI 282,556 286,632 -1.4 100.0 100.0
Raw Material Cost 166,089 192,318 -13.6 58.8 67.1
Employee Costs 22,767 21,024 8.3 8.1 7.3
Other Operating Costs 52,547 45,943 14.4 18.6 16.0
Cost of Sales 241,404 259,285 -6.9 85.4 90.5
OPBDIT 41,153 27,348 50.5 14.6 9.5
Interest 5,466 5,891 -7.2 1.9 2.1
Depreciation 11,674 10,278 13.6 4.1 3.6
OPBT 24,013 11,179 114.8 8.5 3.9
Other Income 3,995 6,188 -35.4 1.4 2.2
PBT 28,008 17,366 61.3 9.9 6.1
Tax 9,272 5,072 82.8 3.3 1.8
PAT 18,736 12,294 52.4 6.6 4.3
Source: Compiled by IMaCS
On a quarterly basis all India, operating margins declined from 11% in Q1FY2009 to 6.2% in Q3FY2009,
but recovered to 10.2% in Q4FY2009. This has further improved to 14.2% in Q1FY2010, and 14.9% in
Q2FY2010.
Trends in Operating Income and Operating Margins (All India)
Source: Compiled by IMaCS
2%
4%
6%
8%
10%
12%
14%
16%
0
20,000
40,000
60,000
80,000
100,000
120,000
140,000
160,000
Q1FY08 Q2FY08 Q3FY08 Q4FY08 Q1FY09 Q2FY09 Q3FY09 Q4FY09 Q1FY10 Q2FY10
OI (Rs. million) Operating Margin
8/12/2019 Auto and Auto Ancillaries December20091
http://slidepdf.com/reader/full/auto-and-auto-ancillaries-december20091 64/66
CII SR Quarterly Update
Auto Auto Components
64
PRIMARY SURVEY CONCLUSIONS
Following are the conclusions from the primary survey of Auto ancillary companies with emphasis on
the situation during Q2FY2010:-
The overall situation with clients is improving. However, the pricing environment continues to be
challenging. The raw material prices remains grim with the same increasing because of risingcrude oil prices.
When compared to the previous quarter, impact on factors such as access to market, insufficient
demand for product and exchange rate has been positive. Impact on factors such as insufficient
capital cost, access to bank credit, shortage of skilled labour and employee costs have been
neutral.
Compared to the preceding three quarters, the overall business situation has marginally improved
during this quarter.
Compared to the preceding three quarters, the inventory level for raw materials as well as
finished goods has been average during this quarter.
The capacity utilisation has increased in this quarter vis-à-vis the last year
The manpower utilisation (number of employees allocated to projects) has somewhat increasedremained the same during Q2FY2010 when compared to the previous quarter.
The input prices show a stable trend while their availability is neutral.
In order to combat the slowdown, the companies tried Improve operational efficiencies and
reduce costs.
In the short term companies expect new orders and improvement in the financial situation
leading to more employment in the industry. The selling prices and the stock levels are expected
to remain the same.
The companies plan to increase production in the next six months. They also expect a rise in the
raw material cost.
The companies have not reported many issues but infrastructure bottlenecks is creating various
problems for them.
INDUSTRY OUTLOOK
The Indian Automotive Industry has recently been significantly affected by the high interest rates and
tight credit, overall slowdown in the economic activity, lower consumer confidence and prevailing
uncertainty in the job market. However this scenario is expected to change as the domestic sales
revive during 2009-10. The roll-out of Goods and Services Tax (GST) is expected in 2010 and is likely to
have a positive impact on the industry, as it is expected to reduce the overall cost to the consumer. At
present, the effective tax rate (including excise duty/CENVAT, VAT and CST) applicable on passenger
vehicles range between 24-38% depending on the size of the car. With the implementation of GST,
the effective tax rate is likely to come down, the benefit of which is expected to be passed on to the
end-consumer, further supporting demand. With large cars (including SUVs) commanding a higher
effective tax rate at present, the impact could be higher on the large car segment assuming no other
additional tax is not implemented on large cars.
But at the same time, the long-term outlook of the industry still remains optimistic due the strong
underlying industry and economy fundamentals. The Indian Economy, even on conservative
estimates, is likely to grow at 7.5-8 percent over the next few years. At the same time, India’s focus on
infrastructure, rising disposable incomes, lowering age of first time car/two wheeler users, shorter
8/12/2019 Auto and Auto Ancillaries December20091
http://slidepdf.com/reader/full/auto-and-auto-ancillaries-december20091 65/66
CII SR Quarterly Update
Auto Auto Components
65
replacement cycles, lower car penetration, all point towards the long-term growth of the industry. It is
also expected that input costs pressures could moderate and there will thus be a downward trend in
commodities’ prices - another boost for the automotive industry.
Moreover, in recent years several global brands have started establishing their base in India. India is
not only being seen as a huge potential market but also as a favourable destination capable of
developing into a global manufacturing hub. Developments of such an order will mandate conscious
monitoring and development in several support areas on the market as well as the industry side.
Using the expected growth rates for passenger vehicles, M&HCV’s, LCV’s, 3Ws and two wheelers and
the average prices of these vehicles, it is estimated that the Indian automotive industry which has
seen significant growth in the past, is expected to grow at the rate of about 13% per annum over the
next decade to reach a size of around US$165-175 billion by 2022. The growth of the auto sector will
tremendously boost the share of manufacturing in GDP, exports and employment since the auto
sector has deep linkages.
The size of global auto component industry is expected to grow at 12% over the next decade to reach
around US$160 billion by 2016. India’s exports of auto components would grow to US$4.5 billion
compared with US$1.8 billion in 2005.
India is estimated to have the potential to become one of the top five auto component manufacturing
economies by 2025. The Indian auto component industry is moving rapidly towards grabbing the
global auto component outsourcing market, which is expected to be worth US$700 billion by 2015.
With the spiralling demand from the domestic and international auto companies, the industry is
emerging as one of the fastest growing manufacturing sectors in India and globally.
8/12/2019 Auto and Auto Ancillaries December20091
http://slidepdf.com/reader/full/auto-and-auto-ancillaries-december20091 66/66
CII SR Quarterly Update
Industry and Economic Update has been prepared by ICRA Management Consulting Services Limited
(IMaCS) for the Confederation of Indian Industry (CII).
The information and opinions contained in this document have been compiled or arrived at from
sources believed to be reliable, but no representation or warranty expressed is made to their
accuracy, completeness or correctness. This document is for information purposes only. The
information contained in this document is published for the assistance of the recipient but is not to
be relied upon as authoritative or taken in substitution for the exercise of judgment by any
recipient. This document is not intended to be a substitute for professional, technical or legal advice.
All opinions expressed in this document are subject to change without notice.
Neither IMaCS nor CII, nor other legal entities in the group to which it belongs, accept any liability
whatsoever for any direct or consequential loss howsoever arising from any use of this document or
its contents or otherwise arising in connection herewith.