Embed Size (px)
Citation preview
National Deceased Organ Donation Potential Study: Overview and Next
Steps
Columbia University Mailman School of Public Health
May 6, 2013
Karl J. McCleary, Ph.D., M.P.H. Principal Investigator, DDPS
Scientific Director, Center for Transplant System
Excellence United Network for Organ Sharing
Affiliate Faculty, School of Medicine, Virginia Commonwealth University
Richmond, VA
Gary Hirsch, S.M. Co-Principal Investigator, DDPS
Independent Consultant and Creator of Learning Environments
Wayland, MA Affiliate Faculty, Massachusetts
Institute of Technology Cambridge, MA
§ Columbia University § Linda P. Fried, MD, MPH, Dean
§ Sandro Galea, MD, DrPH, Chair, Department of Epidemiology
§ Roger Vaughan, DrPH, Chair, Department of Biostatistics
§ Carolyn Herzig, CSAPH Executive Board
§ Jorge Luna, CSAPH Executive Board
§ Angelina Caruso, Project Coordinator: Columbia University Systems Science Program (CUSSP), Substance Abuse Epidemiology Training Program, and Fogarty AITRP
Acknowledgements
§ HRSA, Division of Transplantation § We report on the overall study design and system dynamics
models created as part of the Deceased Donor Potential Study, a commissioned study funded by the Organ Procurement and Transplantation Network (OPTN). The OPTN is supported by Health Resources and Services Administration (HRSA) contract 234-2005-370011C. The study design overview, models and policy analyses described here are the responsibility of the authors alone and do not necessarily reflect the views or policies of the Department of Health and Human Services, the OPTN, or UNOS; nor does mention of trade names, commercial products, or organizations imply endorsement by the US Government.
Acknowledgements
§ Describe Background and Significance of Problem
§ Examine the Population and Context of Deceased Donor Potential
§ Present Study Overview, Design, and Key Project/Analytic Activities
Presentation Overview

§ Introduce System Dynamics Framework and Models
Presentation Overview—II
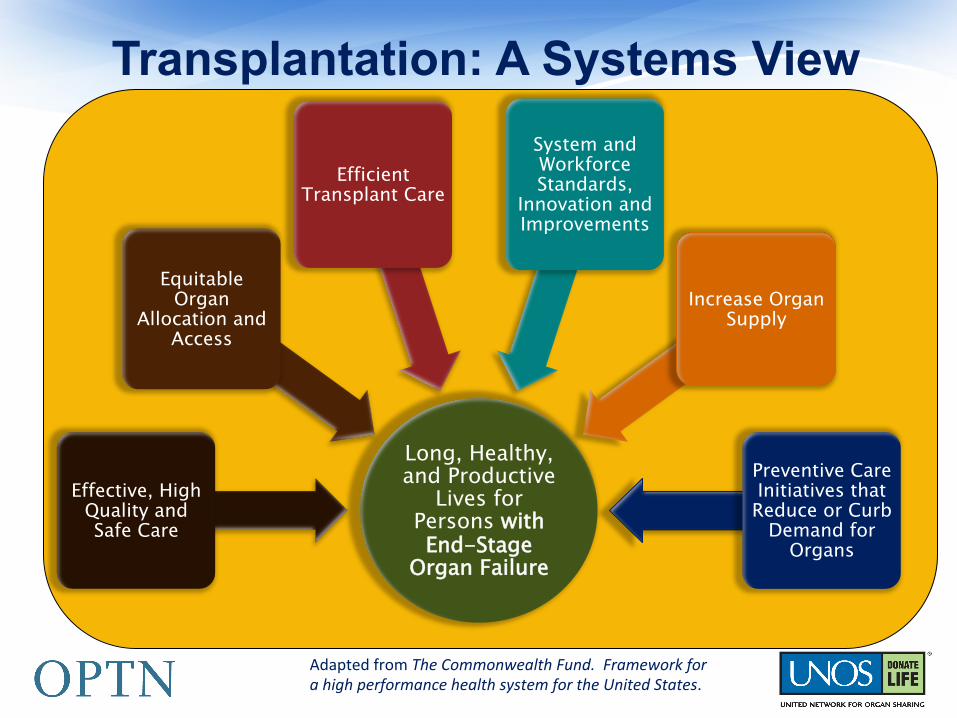
Long, Healthy, and Productive
Lives for Persons with End-Stage
Organ Failure
Effective, High Quality and Safe Care
Equitable Organ
Allocation and Access
Efficient Transplant Care
System and Workforce Standards,
Innovation and Improvements
Increase Organ Supply
Preventive Care Initiatives that Reduce or Curb
Demand for Organs
Adapted from The Commonwealth Fund. Framework for a high performance health system for the United States.
Transplantation: A Systems View
§ Background § Success of transplantation as a viable clinical
intervention for persons with end-stage organ failure is reflected in its impact on modern medicine.
§ Total number of persons transplanted from deceased donors over the past two decades approaches 450,000.
§ Donor families life-saving gifts enable many to live longer, healthier, and productive lives than without it.
Background and Significance of Deceased Donation Potential
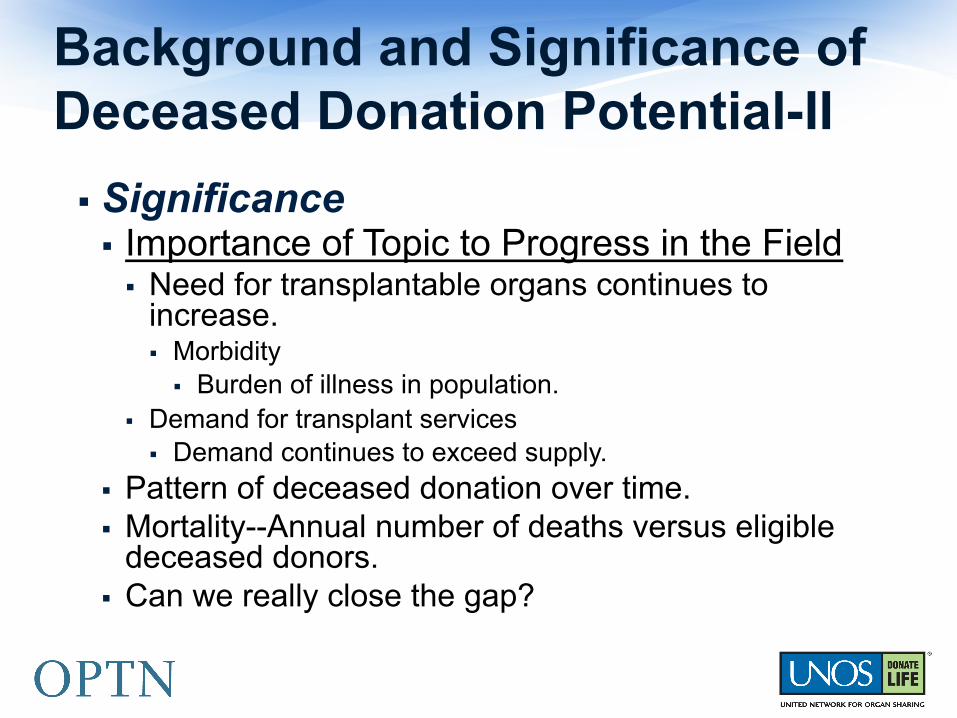
§ Significance § Importance of Topic to Progress in the Field
§ Need for transplantable organs continues to increase. § Morbidity
§ Burden of illness in population. § Demand for transplant services
§ Demand continues to exceed supply.
§ Pattern of deceased donation over time. § Mortality--Annual number of deaths versus eligible
deceased donors. § Can we really close the gap?
Background and Significance of Deceased Donation Potential-II
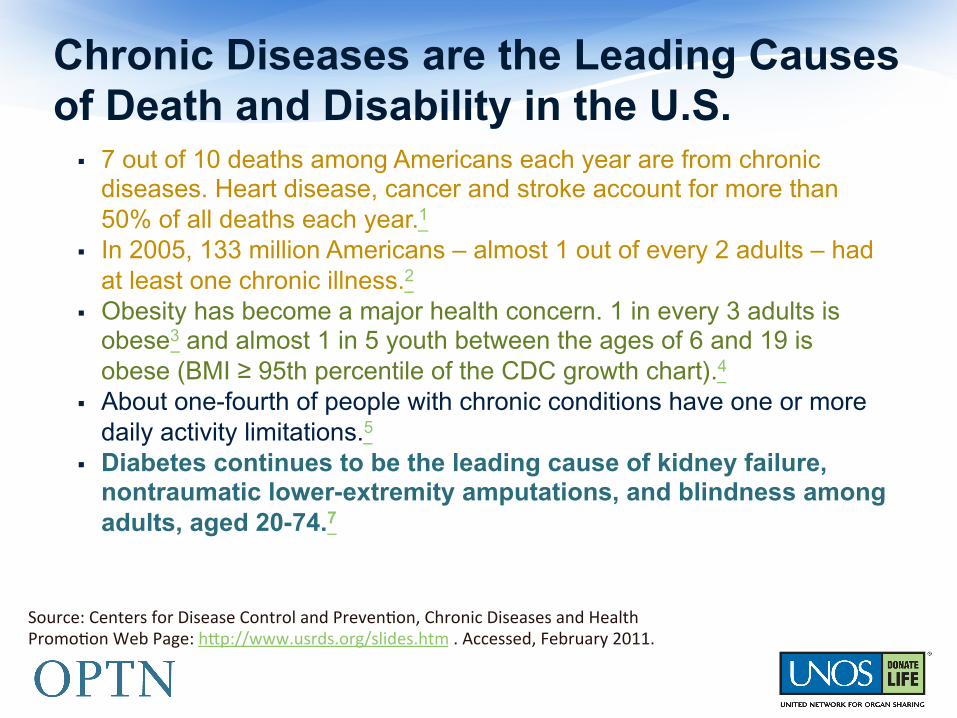
§ 7 out of 10 deaths among Americans each year are from chronic diseases. Heart disease, cancer and stroke account for more than 50% of all deaths each year.1
§ In 2005, 133 million Americans – almost 1 out of every 2 adults – had at least one chronic illness.2
§ Obesity has become a major health concern. 1 in every 3 adults is obese3 and almost 1 in 5 youth between the ages of 6 and 19 is obese (BMI ≥ 95th percentile of the CDC growth chart).4
§ About one-fourth of people with chronic conditions have one or more daily activity limitations.5
§ Diabetes continues to be the leading cause of kidney failure, nontraumatic lower-extremity amputations, and blindness among adults, aged 20-74.7
Chronic Diseases are the Leading Causes of Death and Disability in the U.S.
Source: Centers for Disease Control and Preven9on, Chronic Diseases and Health Promo9on Web Page: h@p://www.usrds.org/slides.htm . Accessed, February 2011.
Chronic Disease as a Driver for Transplantation Demand: A Look at
Chronic Kidney Disease and the Migration to End-Stage Renal Failure
United States Renal Data System (USRDS) 2010 and 2012 Annual Data Reports
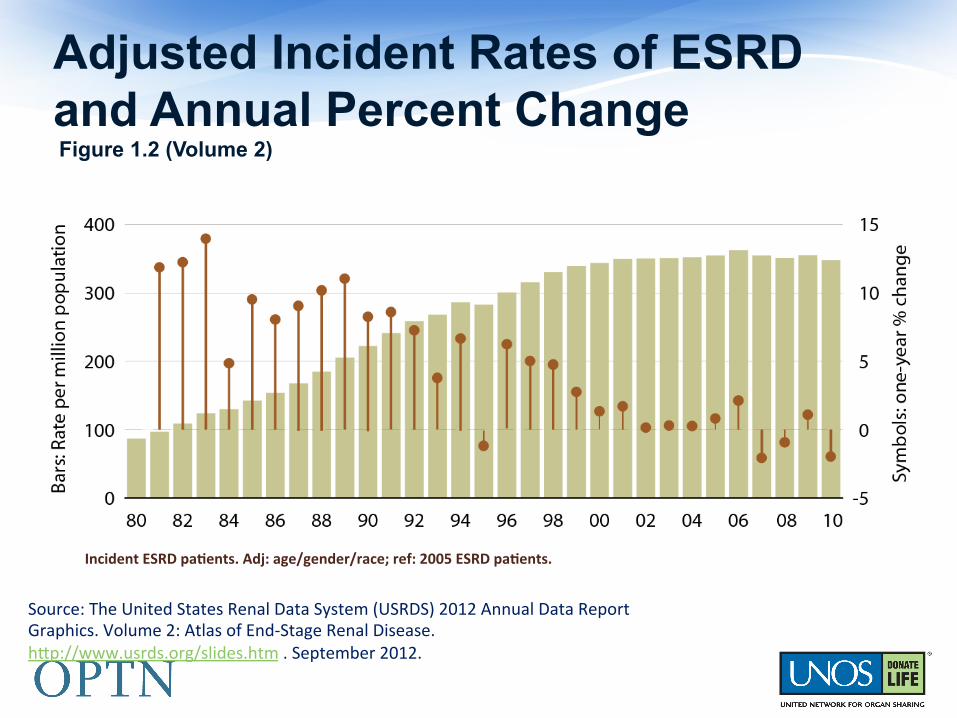
Adjusted Incident Rates of ESRD and Annual Percent Change Figure 1.2 (Volume 2)
Incident ESRD pa/ents; rates adjusted for age, gender, & race.
Source: The United States Renal Data System (USRDS) 2012 Annual Data Report Graphics. Volume 2: Atlas of End-‐Stage Renal Disease. h@p://www.usrds.org/slides.htm . September 2012.
Incident ESRD pa/ents. Adj: age/gender/race; ref: 2005 ESRD pa/ents.
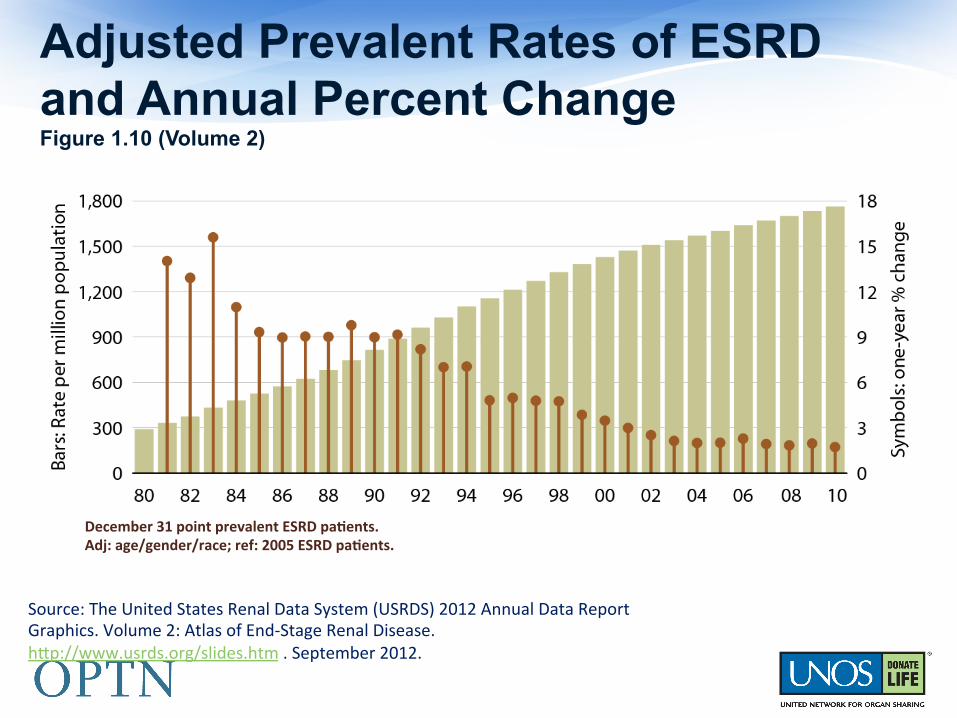
Adjusted Prevalent Rates of ESRD and Annual Percent Change Figure 1.10 (Volume 2)
December 31 point prevalent ESRD pa/ents. Adj: age/gender/race; ref: 2005 ESRD pa/ents.
Source: The United States Renal Data System (USRDS) 2012 Annual Data Report Graphics. Volume 2: Atlas of End-‐Stage Renal Disease. h@p://www.usrds.org/slides.htm . September 2012.
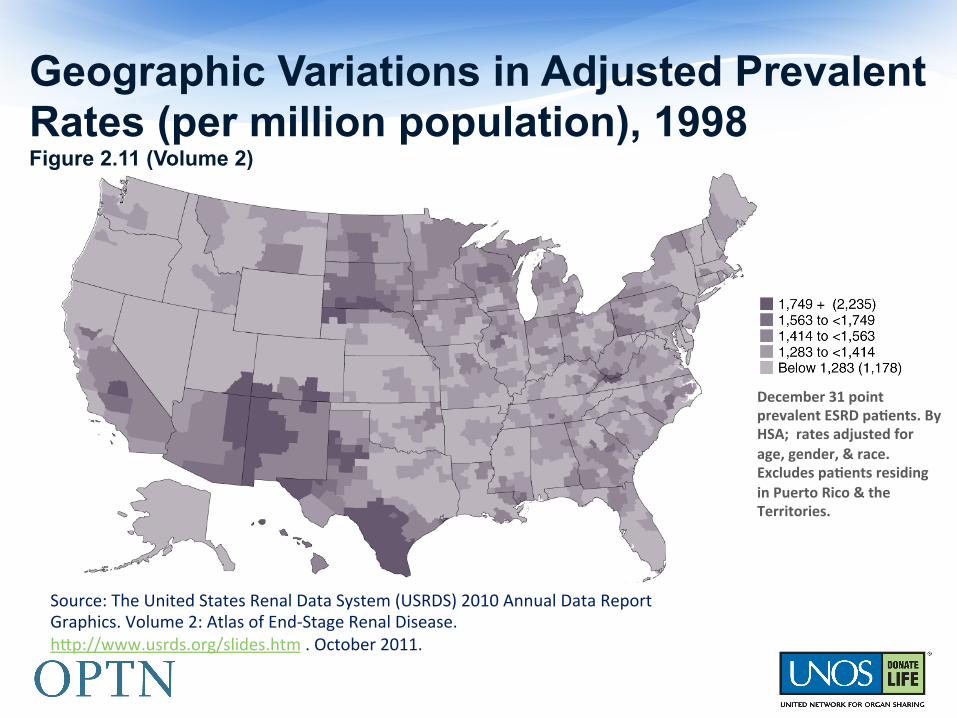
Geographic Variations in Adjusted Prevalent Rates (per million population), 1998 Figure 2.11 (Volume 2)
December 31 point prevalent ESRD pa/ents. By HSA; rates adjusted for age, gender, & race. Excludes pa/ents residing in Puerto Rico & the Territories.
Source: The United States Renal Data System (USRDS) 2010 Annual Data Report Graphics. Volume 2: Atlas of End-‐Stage Renal Disease. h@p://www.usrds.org/slides.htm . October 2011.

Geographic Variations in Adjusted Prevalent rates of ESRD per million population, 2010, by HSA Figure 1.11 (Volume 2)
December 31 point prevalent pa/ents. Adj: age/gender/race; ref: 2005 ESRD pa/ents.
Source: The United States Renal Data System (USRDS) 2012 Annual Data Report Graphics. Volume 2: Atlas of End-‐Stage Renal Disease. h@p://www.usrds.org/slides.htm . September 2012.

Examining the Population of Potential Donors
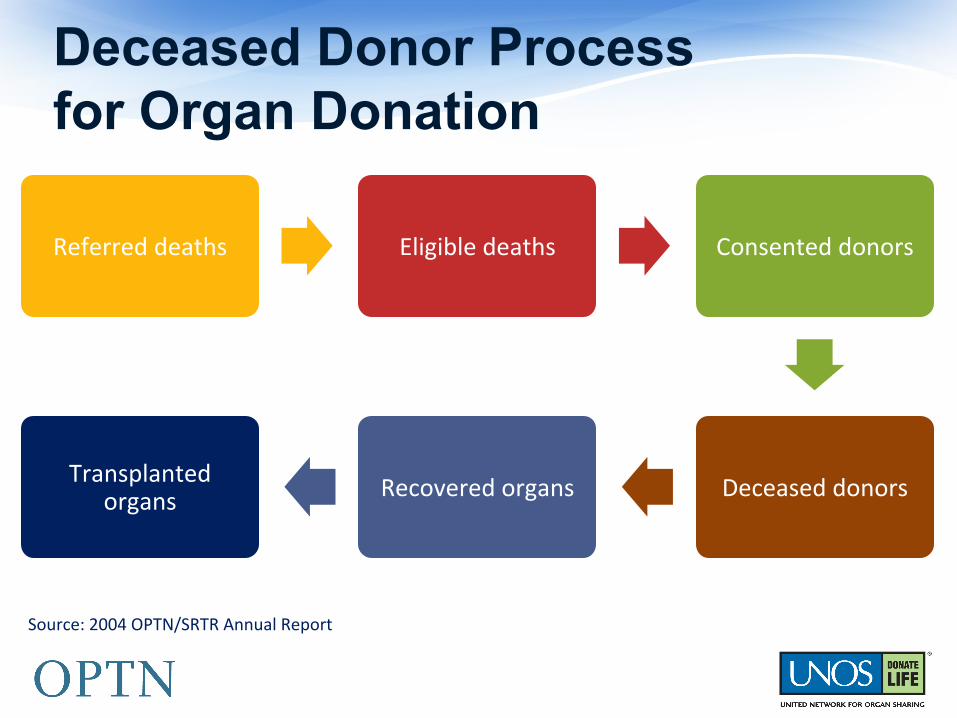
Referred deaths Eligible deaths Consented donors
Deceased donors Recovered organs Transplanted organs
Deceased Donor Process for Organ Donation
Source: 2004 OPTN/SRTR Annual Report.
Iden9fica9on Evalua9on
Confirma9on and legal
declara9on of Brain Death
Consent to organ
dona9on
Organ recovery
Effec9ve (=actual) donor
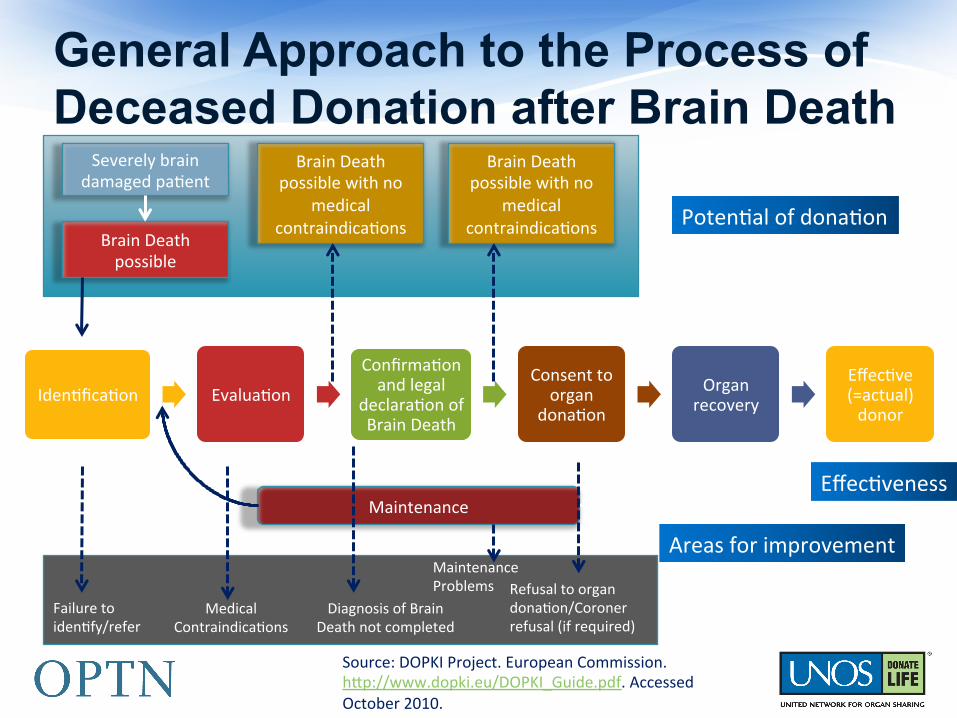
General Approach to the Process of Deceased Donation after Brain Death
Source: DOPKI Project. European Commission. h@p://www.dopki.eu/DOPKI_Guide.pdf. Accessed October 2010.
Severely brain damaged pa9ent
Brain Death possible
Brain Death possible with no
medical contraindica9ons
Brain Death possible with no
medical contraindica9ons Poten9al of dona9on
Effec9veness Maintenance
Failure to iden9fy/refer
Medical Contraindica9ons
Diagnosis of Brain Death not completed
Maintenance Problems Refusal to organ
dona9on/Coroner refusal (if required)
Areas for improvement
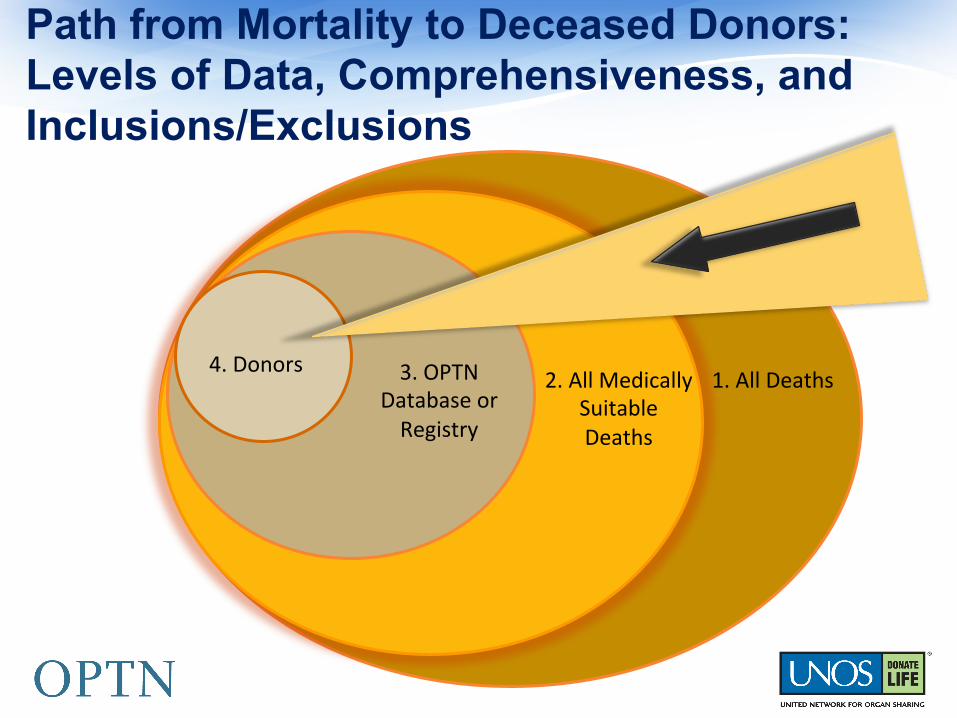
Path from Mortality to Deceased Donors: Levels of Data, Comprehensiveness, and Inclusions/Exclusions
1. All Deaths 2. All Medically Suitable Deaths
3. OPTN Database or Registry
4. Donors
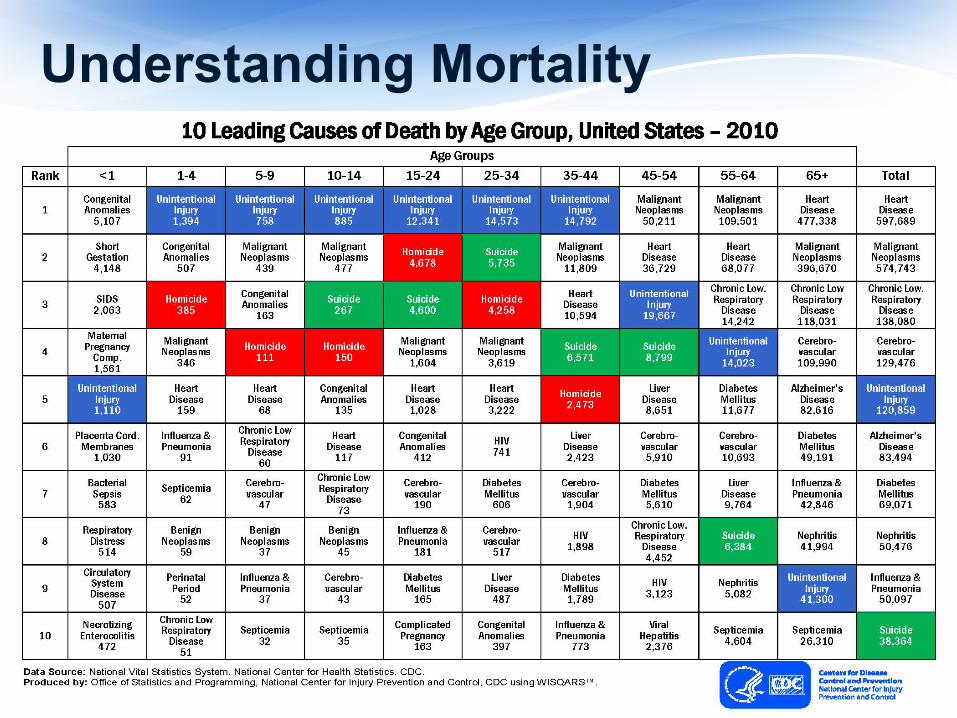
Understanding Mortality
Understanding Deceased Donor Characteristics from
Actual Donors
Source: Organ Procurement and Transplanta9on Network (OPTN) Data Report h@p://optn.transplant.hrsa.gov/data/ and Scien9fic Registry of Transplant Recipients (SRTR) h@p://srtr.org/annual_Reports/2011/ . Accessed April 4, 2013.
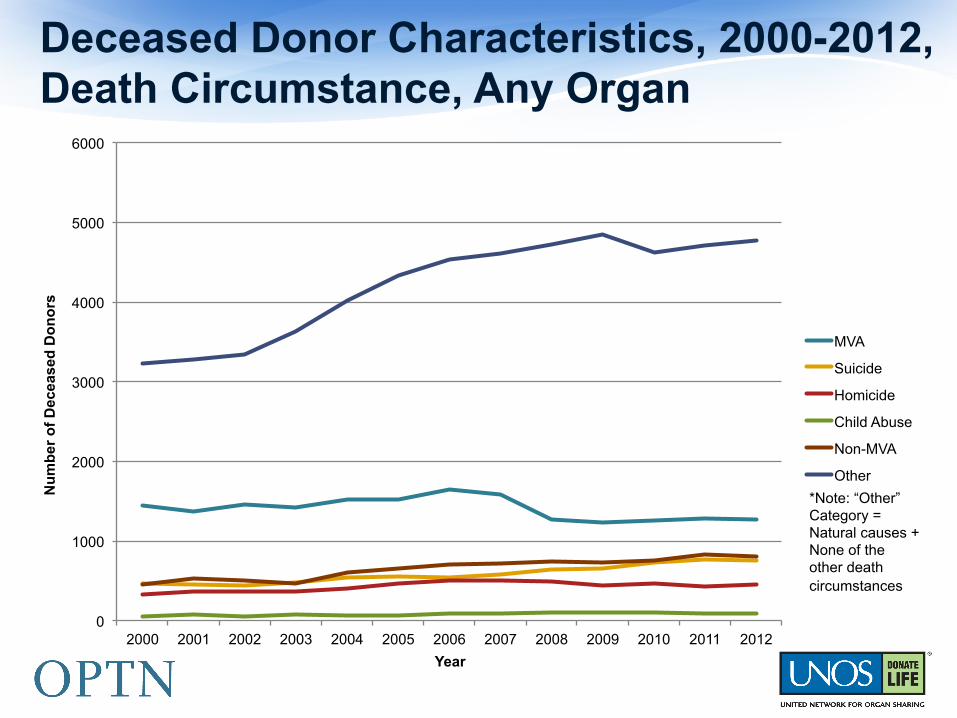
Deceased Donor Characteristics, 2000-2012, Death Circumstance, Any Organ
0
1000
2000
3000
4000
5000
6000
2000 2001 2002 2003 2004 2005 2006 2007 2008 2009 2010 2011 2012
Nu
mb
er o
f D
ecea
sed
Do
no
rs
Year
MVA
Suicide
Homicide
Child Abuse
Non-MVA
Other
*Note: “Other” Category = Natural causes + None of the other death circumstances
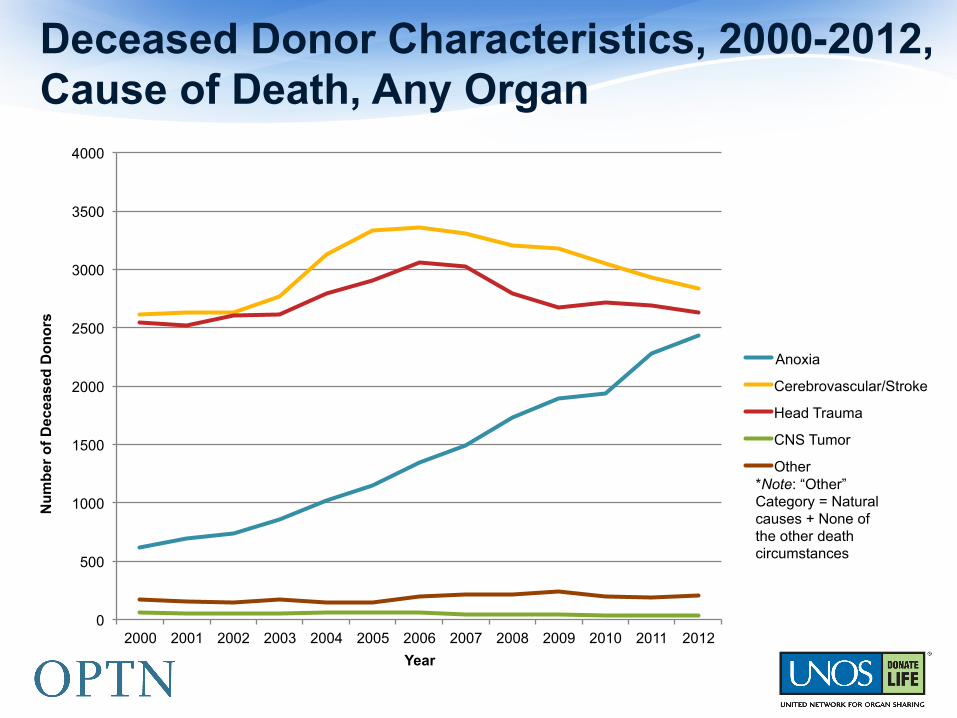
Deceased Donor Characteristics, 2000-2012, Cause of Death, Any Organ
0
500
1000
1500
2000
2500
3000
3500
4000
2000 2001 2002 2003 2004 2005 2006 2007 2008 2009 2010 2011 2012
Nu
mb
er o
f D
ecea
sed
Do
no
rs
Year
Anoxia
Cerebrovascular/Stroke
Head Trauma
CNS Tumor
Other *Note: “Other” Category = Natural causes + None of the other death circumstances
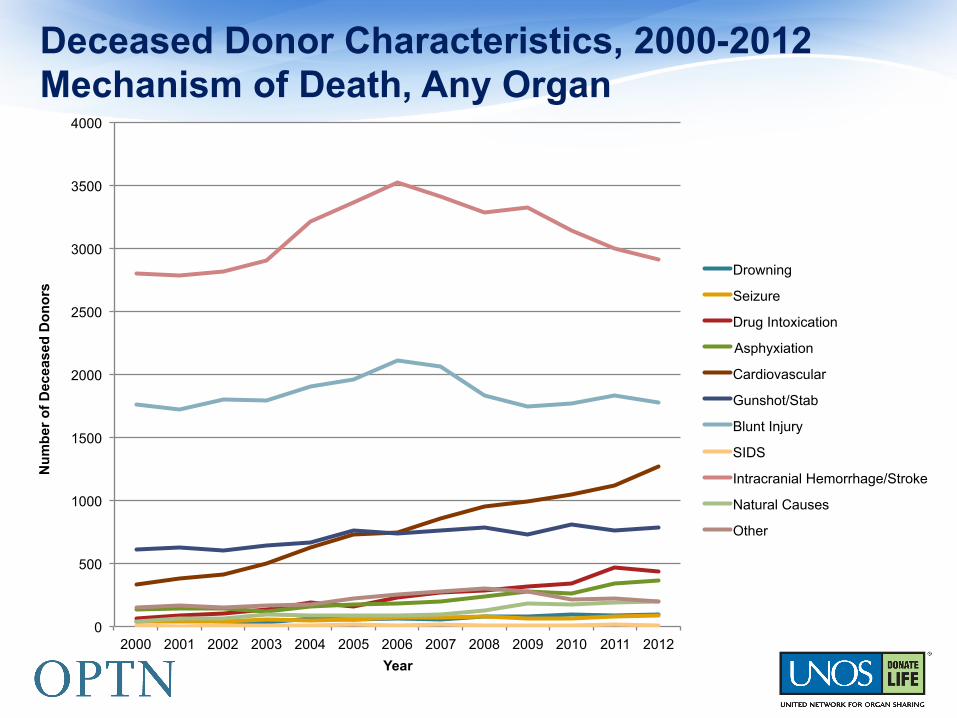
Deceased Donor Characteristics, 2000-2012 Mechanism of Death, Any Organ
0
500
1000
1500
2000
2500
3000
3500
4000
2000 2001 2002 2003 2004 2005 2006 2007 2008 2009 2010 2011 2012
Nu
mb
er o
f D
ecea
sed
Do
no
rs
Year
Drowning
Seizure
Drug Intoxication
Asphyxiation
Cardiovascular
Gunshot/Stab
Blunt Injury
SIDS
Intracranial Hemorrhage/Stroke
Natural Causes
Other
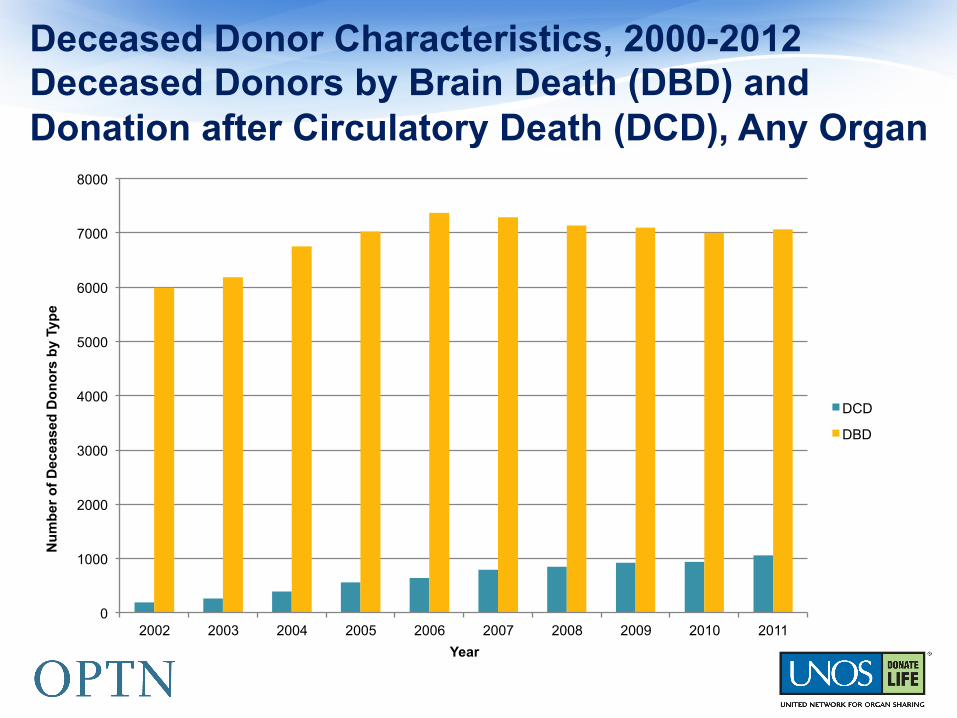
Deceased Donor Characteristics, 2000-2012 Deceased Donors by Brain Death (DBD) and Donation after Circulatory Death (DCD), Any Organ
0
1000
2000
3000
4000
5000
6000
7000
8000
2002 2003 2004 2005 2006 2007 2008 2009 2010 2011
Nu
mb
er o
f D
ecea
sed
Do
no
rs b
y Ty
pe
Year
DCD
DBD
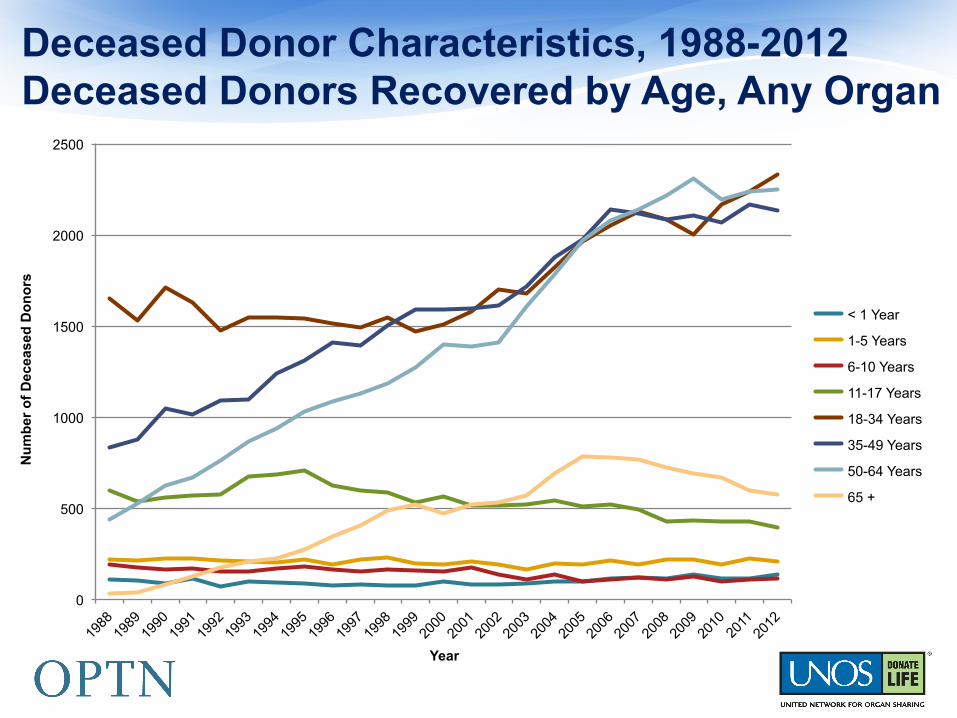
Deceased Donor Characteristics, 1988-2012 Deceased Donors Recovered by Age, Any Organ
0
500
1000
1500
2000
2500
Nu
mb
er o
f D
ecea
sed
Do
no
rs
Year
< 1 Year
1-5 Years
6-10 Years
11-17 Years
18-34 Years
35-49 Years
50-64 Years
65 +
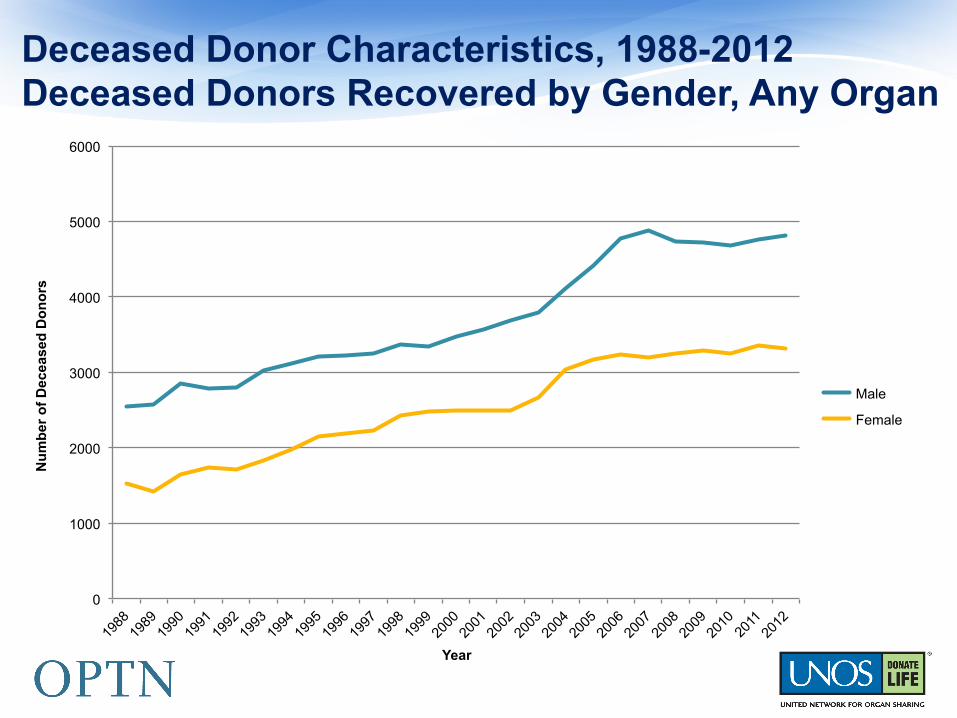
Deceased Donor Characteristics, 1988-2012 Deceased Donors Recovered by Gender, Any Organ
0
1000
2000
3000
4000
5000
6000
Nu
mb
er o
f D
ecea
sed
Do
no
rs
Year
Male
Female

Deceased Donor Characteristics, 1988-2012 Donor Ethnicity/Race, Any Organ
0
1000
2000
3000
4000
5000
6000
Nu
mb
er o
f D
ecea
sed
Do
no
rs
Year
White
Black
Hispanic
Unknown
Asian
American Indian/ Alaska Native Pacific Islander
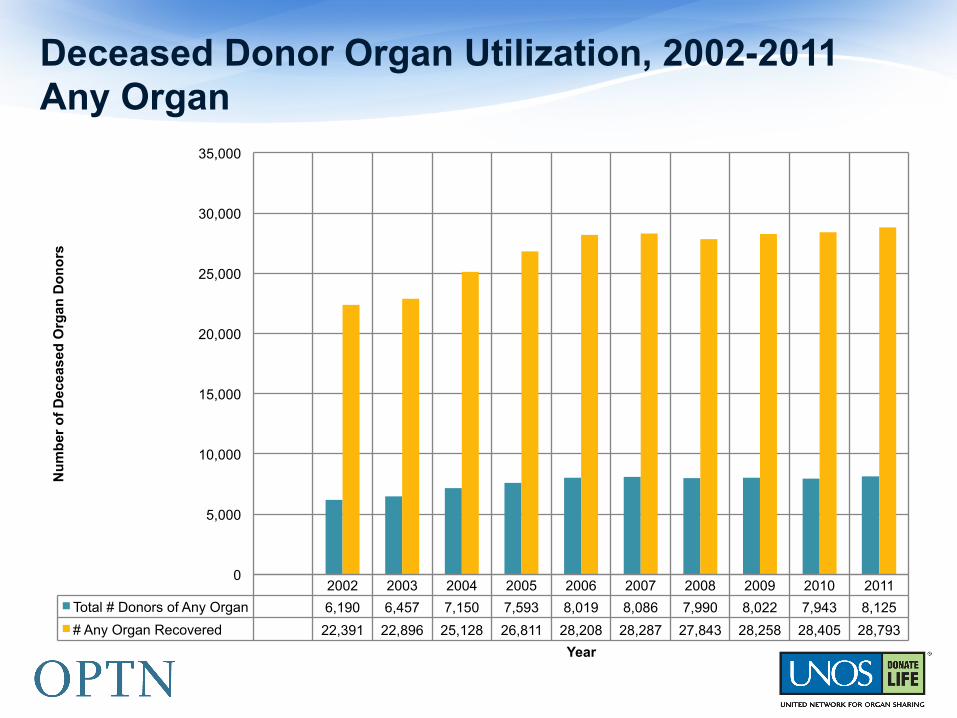
Deceased Donor Organ Utilization, 2002-2011 Any Organ
2002 2003 2004 2005 2006 2007 2008 2009 2010 2011
Total # Donors of Any Organ 6,190 6,457 7,150 7,593 8,019 8,086 7,990 8,022 7,943 8,125
# Any Organ Recovered 22,391 22,896 25,128 26,811 28,208 28,287 27,843 28,258 28,405 28,793
0
5,000
10,000
15,000
20,000
25,000
30,000
35,000
Nu
mb
er o
f D
ecea
sed
Org
an D
on
ors
Year
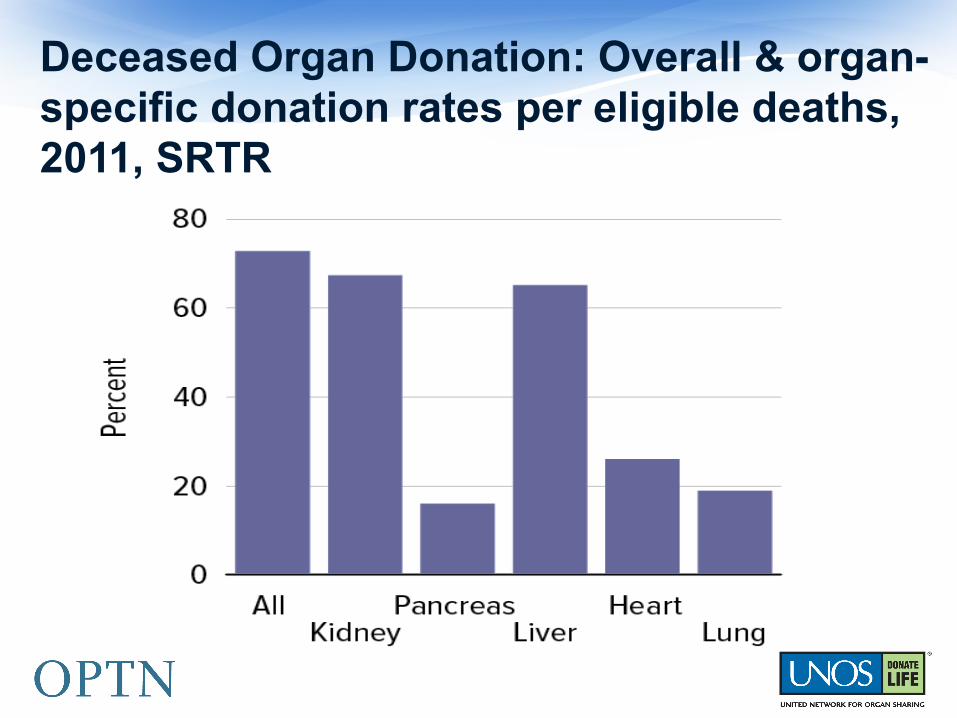
Deceased Organ Donation: Overall & organ-specific donation rates per eligible deaths, 2011, SRTR
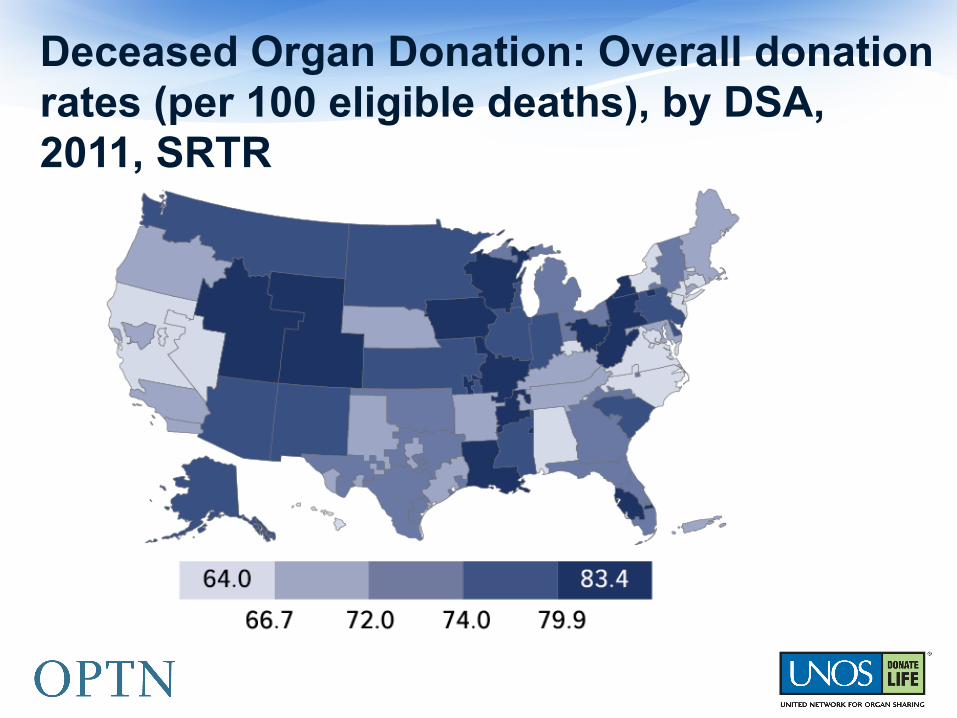
Deceased Organ Donation: Overall donation rates (per 100 eligible deaths), by DSA, 2011, SRTR
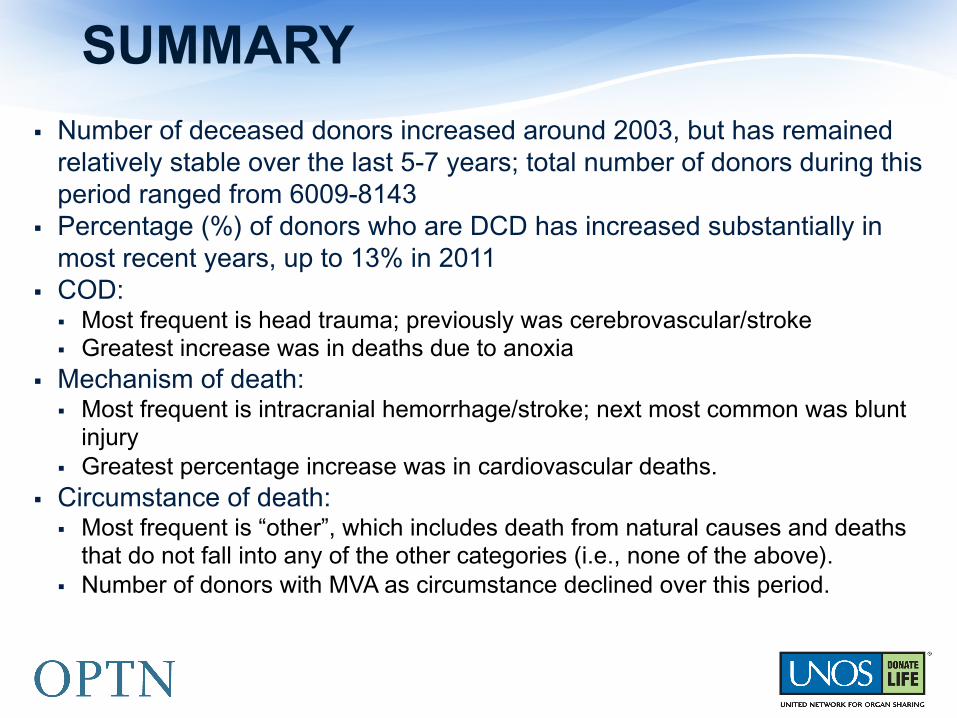
§ Number of deceased donors increased around 2003, but has remained relatively stable over the last 5-7 years; total number of donors during this period ranged from 6009-8143
§ Percentage (%) of donors who are DCD has increased substantially in most recent years, up to 13% in 2011
§ COD: § Most frequent is head trauma; previously was cerebrovascular/stroke § Greatest increase was in deaths due to anoxia
§ Mechanism of death: § Most frequent is intracranial hemorrhage/stroke; next most common was blunt
injury § Greatest percentage increase was in cardiovascular deaths.
§ Circumstance of death: § Most frequent is “other”, which includes death from natural causes and deaths
that do not fall into any of the other categories (i.e., none of the above). § Number of donors with MVA as circumstance declined over this period.
SUMMARY

OPTN Deceased Donor Potential
Study (DDPS)
§ The DDPS aims to generate more current scientific evidence that is based on rigorous epidemiologic and demographic analyses of the deceased donor system for the purposes of determining the potential number of organ donors, and to determine the potential trend in that number over time.
Purpose of Study
§ What is the “true” potential for deceased organ donation in the United States?
The “Question”
Methods
§ Population-based inquiry
§ Demographic methods
§ Epidemiological approaches
§ Trend analysis
§ Systems Science (CTSE recommendation)
Study Design Concepts Requested by HRSA
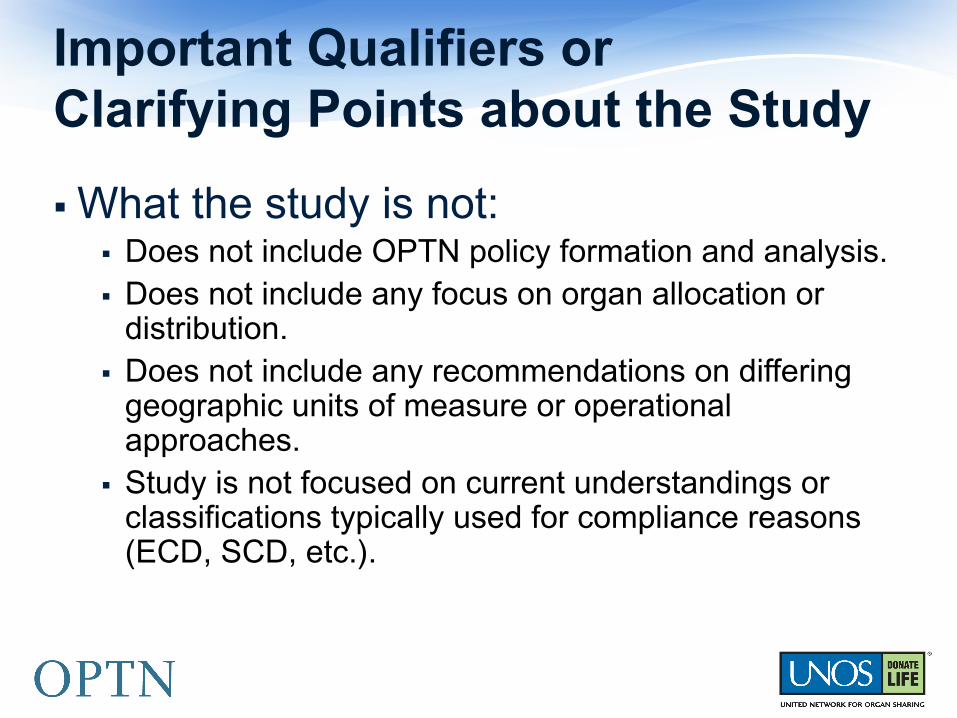
§ What the study is not: § Does not include OPTN policy formation and analysis. § Does not include any focus on organ allocation or
distribution. § Does not include any recommendations on differing
geographic units of measure or operational approaches.
§ Study is not focused on current understandings or classifications typically used for compliance reasons (ECD, SCD, etc.).
Important Qualifiers or Clarifying Points about the Study
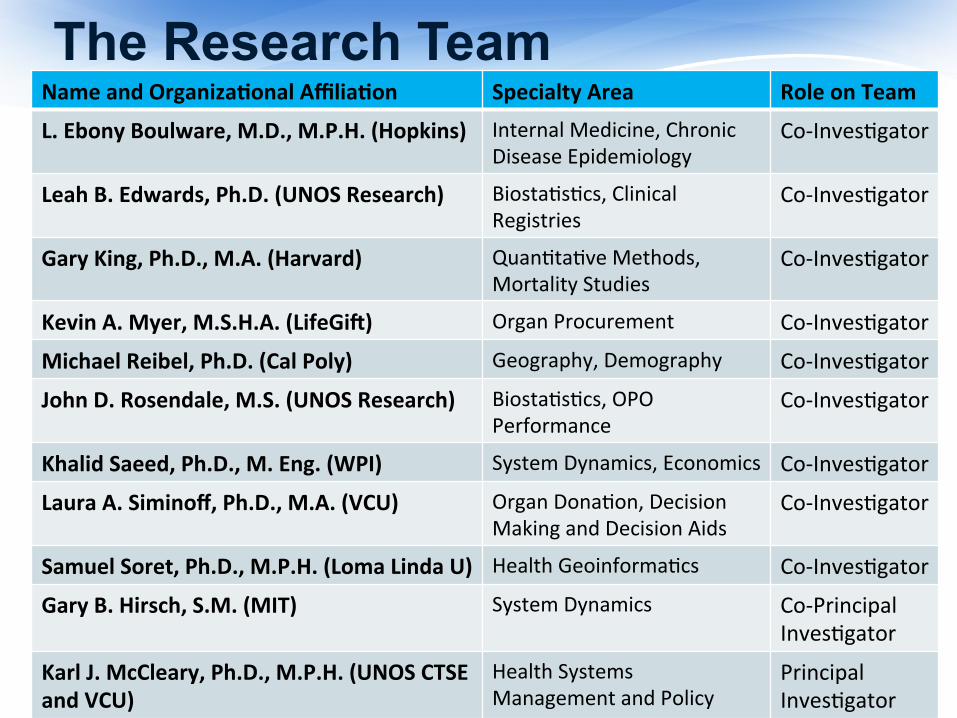
Name and Organiza/onal Affilia/on Specialty Area Role on Team
L. Ebony Boulware, M.D., M.P.H. (Hopkins) Internal Medicine, Chronic Disease Epidemiology
Co-‐Inves9gator
Leah B. Edwards, Ph.D. (UNOS Research) Biosta9s9cs, Clinical Registries
Co-‐Inves9gator
Gary King, Ph.D., M.A. (Harvard) Quan9ta9ve Methods, Mortality Studies
Co-‐Inves9gator
Kevin A. Myer, M.S.H.A. (LifeGi[) Organ Procurement Co-‐Inves9gator
Michael Reibel, Ph.D. (Cal Poly) Geography, Demography Co-‐Inves9gator
John D. Rosendale, M.S. (UNOS Research) Biosta9s9cs, OPO Performance
Co-‐Inves9gator
Khalid Saeed, Ph.D., M. Eng. (WPI) System Dynamics, Economics Co-‐Inves9gator
Laura A. Siminoff, Ph.D., M.A. (VCU) Organ Dona9on, Decision Making and Decision Aids
Co-‐Inves9gator
Samuel Soret, Ph.D., M.P.H. (Loma Linda U) Health Geoinforma9cs Co-‐Inves9gator
Gary B. Hirsch, S.M. (MIT) System Dynamics Co-‐Principal Inves9gator
Karl J. McCleary, Ph.D., M.P.H. (UNOS CTSE and VCU)
Health Systems Management and Policy
Principal Inves9gator
The Research Team
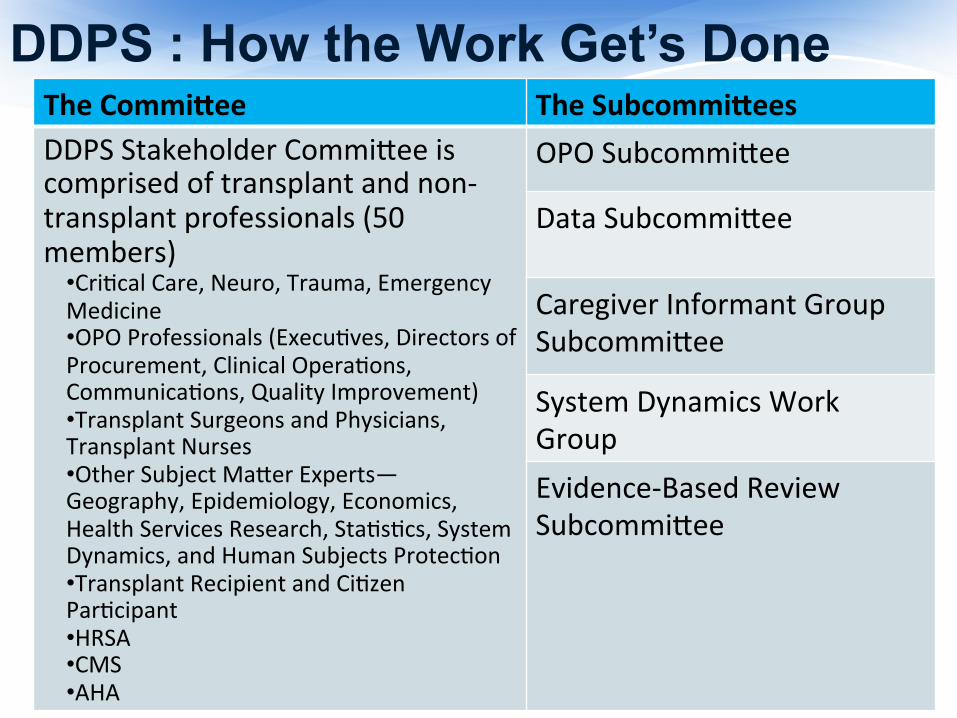
The Commiaee The Subcommiaees DDPS Stakeholder Commi@ee is comprised of transplant and non-‐transplant professionals (50 members)
• Cri9cal Care, Neuro, Trauma, Emergency Medicine • OPO Professionals (Execu9ves, Directors of Procurement, Clinical Opera9ons, Communica9ons, Quality Improvement) • Transplant Surgeons and Physicians, Transplant Nurses • Other Subject Ma@er Experts—Geography, Epidemiology, Economics, Health Services Research, Sta9s9cs, System Dynamics, and Human Subjects Protec9on • Transplant Recipient and Ci9zen Par9cipant • HRSA • CMS • AHA
OPO Subcommi@ee
Data Subcommi@ee Caregiver Informant Group Subcommi@ee
System Dynamics Work Group Evidence-‐Based Review Subcommi@ee
DDPS : How the Work Get’s Done

Specific Aims: Goals and Associated Research Questions
• Research Ques/on: What is the current state of deceased dona9on in the United States?
• Corollary Research Ques/ons: • What are the emergent pa@erns of deceased dona9on over 9me in the United States?
• What pa@erns of deceased dona9on are characterized or reflected in popula9on and demographic factors?
• What pa@erns of deceased dona9on are characterized or reflected na9onally and in regional dona9on service areas (DSAs) or other appropriate designated geographies/geographic areas?
• What pa@erns of deceased dona9on are characterized or reflected in the recovery and u9liza9on of various organs?
Goal 1: To accurately characterize the current size and
composi.on of deceased dona9on in the United States.
Specific Aims: Goals, Objectives, and Research Questions
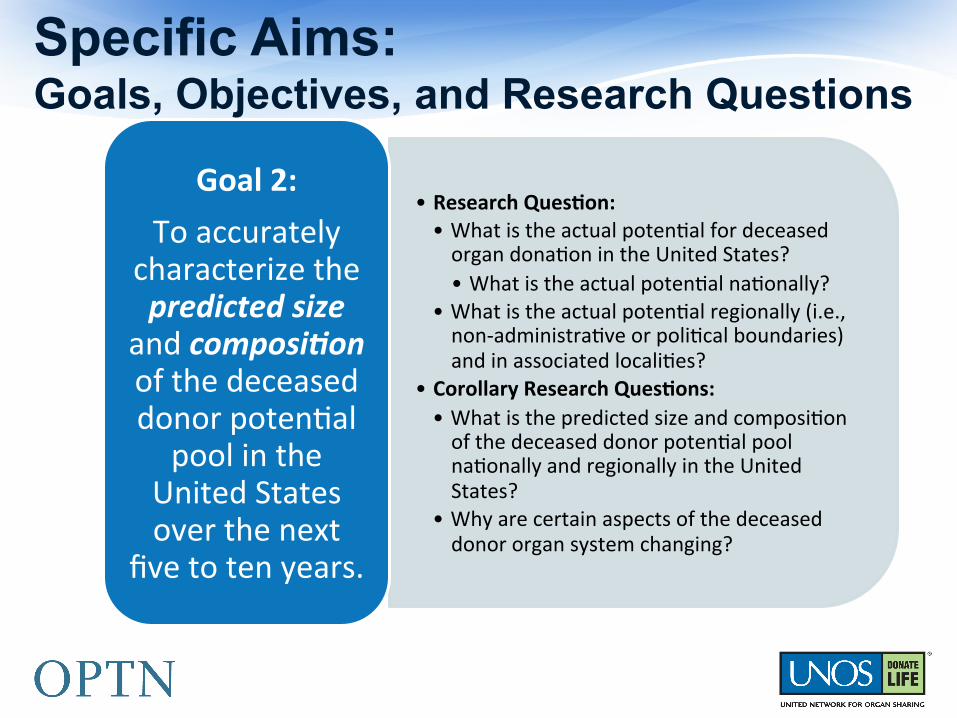
• Research Ques/on: • What is the actual poten9al for deceased organ dona9on in the United States? • What is the actual poten9al na9onally?
• What is the actual poten9al regionally (i.e., non-‐administra9ve or poli9cal boundaries) and in associated locali9es?
• Corollary Research Ques/ons: • What is the predicted size and composi9on of the deceased donor poten9al pool na9onally and regionally in the United States?
• Why are certain aspects of the deceased donor organ system changing?
Goal 2: To accurately
characterize the predicted size
and composi.on of the deceased donor poten9al pool in the
United States over the next
five to ten years.
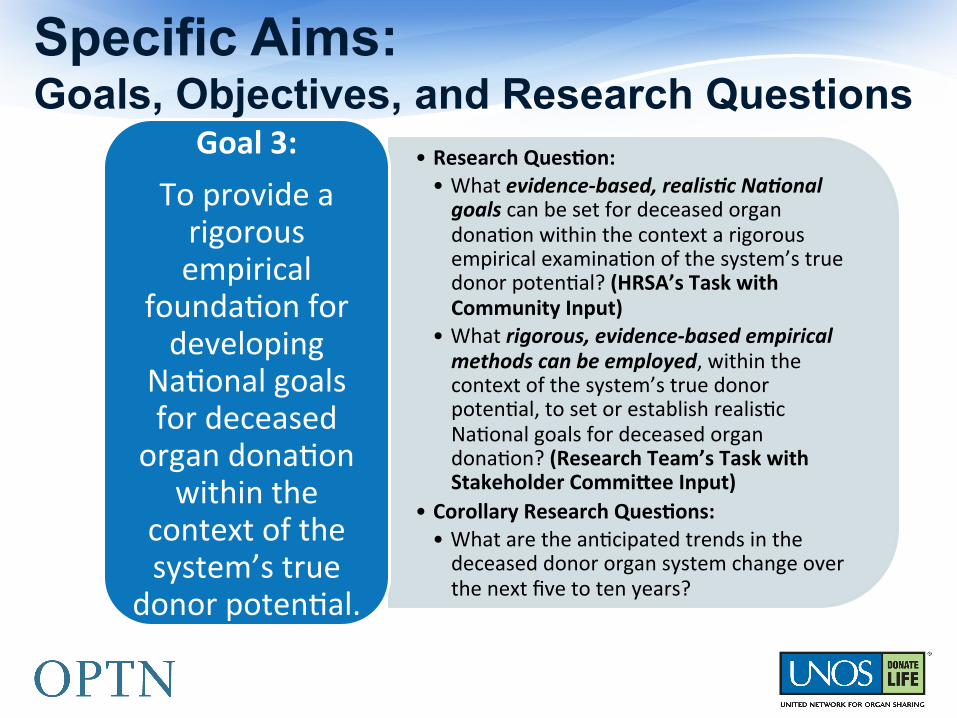
Specific Aims: Goals, Objectives, and Research Questions
• Research Ques/on: • What evidence-‐based, realis.c Na.onal goals can be set for deceased organ dona9on within the context a rigorous empirical examina9on of the system’s true donor poten9al? (HRSA’s Task with Community Input)
• What rigorous, evidence-‐based empirical methods can be employed, within the context of the system’s true donor poten9al, to set or establish realis9c Na9onal goals for deceased organ dona9on? (Research Team’s Task with Stakeholder Commiaee Input)
• Corollary Research Ques/ons: • What are the an9cipated trends in the deceased donor organ system change over the next five to ten years?
Goal 3: To provide a rigorous empirical
founda9on for developing
Na9onal goals for deceased organ dona9on
within the context of the system’s true
donor poten9al.
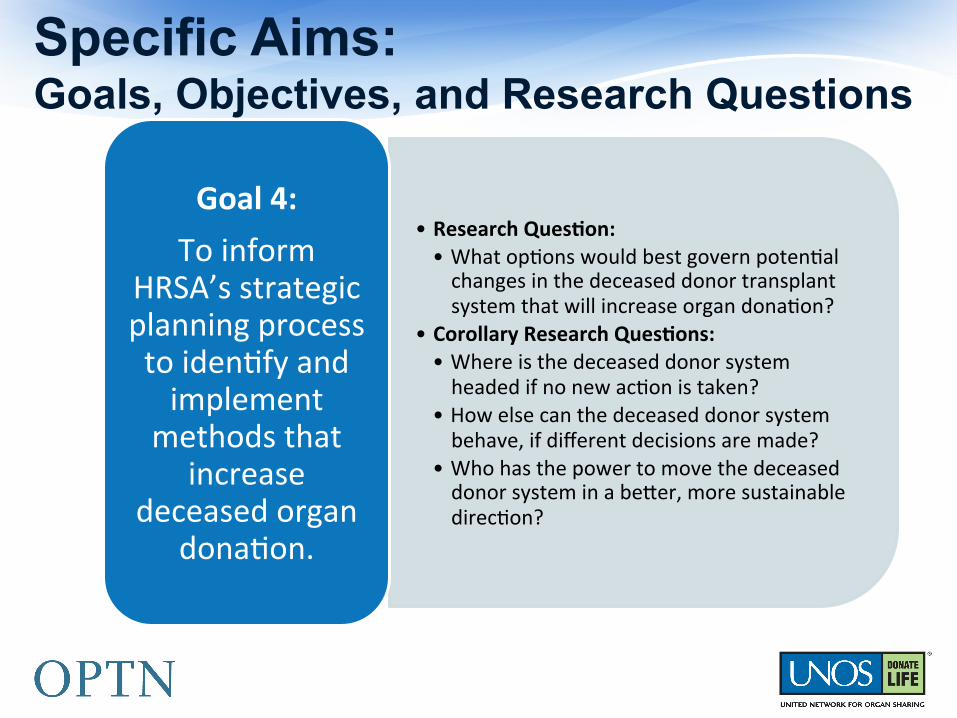
Specific Aims: Goals, Objectives, and Research Questions
• Research Ques/on: • What op9ons would best govern poten9al changes in the deceased donor transplant system that will increase organ dona9on?
• Corollary Research Ques/ons: • Where is the deceased donor system headed if no new ac9on is taken?
• How else can the deceased donor system behave, if different decisions are made?
• Who has the power to move the deceased donor system in a be@er, more sustainable direc9on?
Goal 4: To inform
HRSA’s strategic planning process to iden9fy and implement
methods that increase
deceased organ dona9on.
§ Use system dynamics as an unifying framework for understanding deceased donor potential, linking existing bodies of knowledge and specific research traditions that are relevant to transplantation WITH the power of system science.
§ Examine deceased donor potential from a complex system view.
Research Strategy
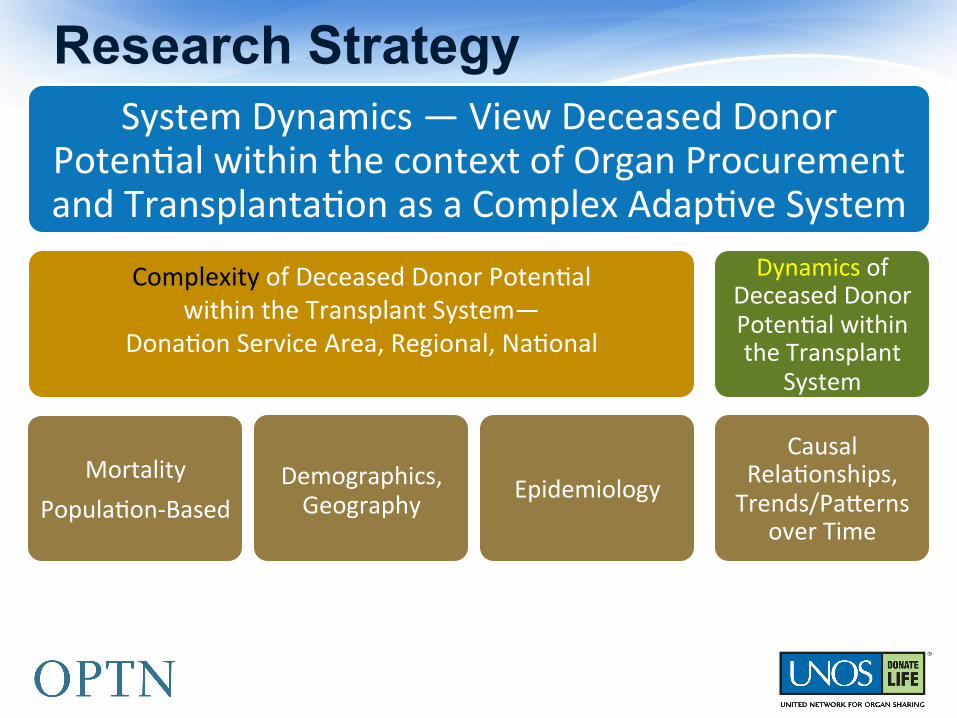
System Dynamics — View Deceased Donor Poten9al within the context of Organ Procurement and Transplanta9on as a Complex Adap9ve System
Complexity of Deceased Donor Poten9al within the Transplant System—
Dona9on Service Area, Regional, Na9onal
Mortality Popula9on-‐Based
Demographics, Geography Epidemiology
Dynamics of Deceased Donor Poten9al within the Transplant
System
Causal Rela9onships, Trends/Pa@erns
over Time
Research Strategy
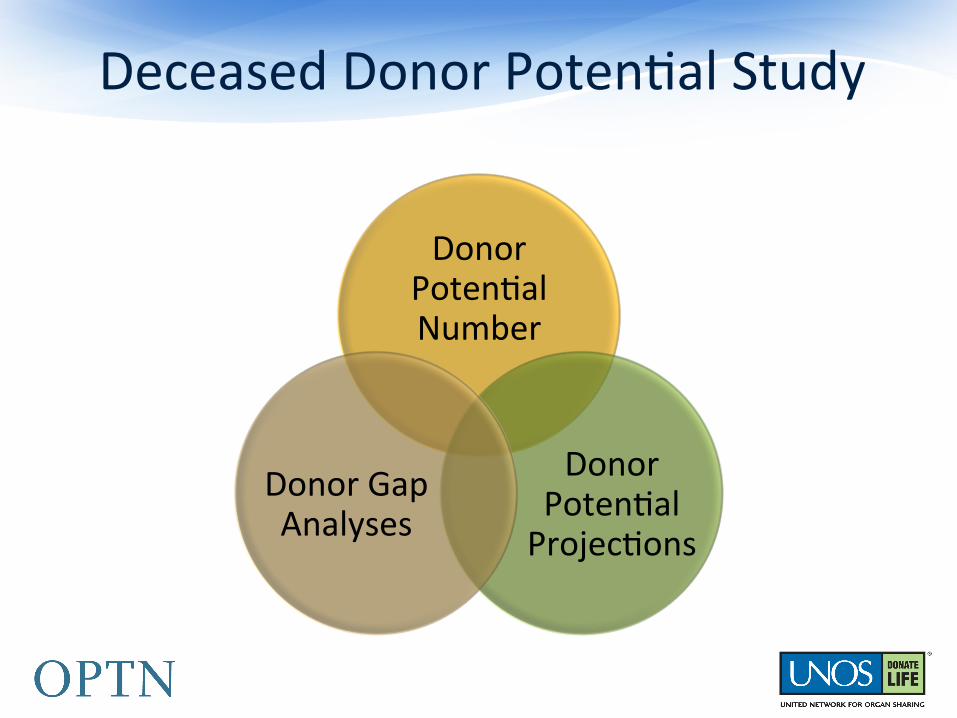
Deceased Donor Poten9al Study
Donor Poten9al Number
Donor Poten9al Projec9ons
Donor Gap Analyses

Donor Poten9al Number
Donor Poten9al Projec9ons
Donor Gap Analyses
Deceased Donor Poten9al Study Subcommi@ee Contribu9ons
Evidence-‐based Review
OPO SubcommiCee
Data Subcom System Dynamics
Team
Open InnovaFon
Caregiver Informant Group
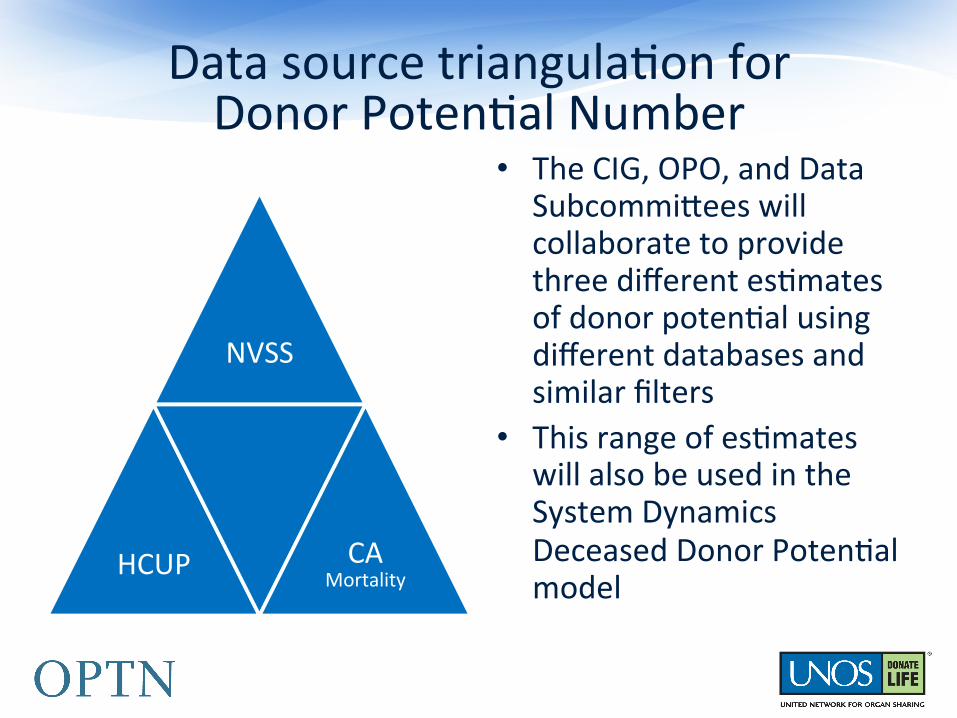
Data source triangula9on for Donor Poten9al Number
NVSS
HCUP CA Mortality
• The CIG, OPO, and Data Subcommi@ees will collaborate to provide three different es9mates of donor poten9al using different databases and similar filters
• This range of es9mates will also be used in the System Dynamics Deceased Donor Poten9al model
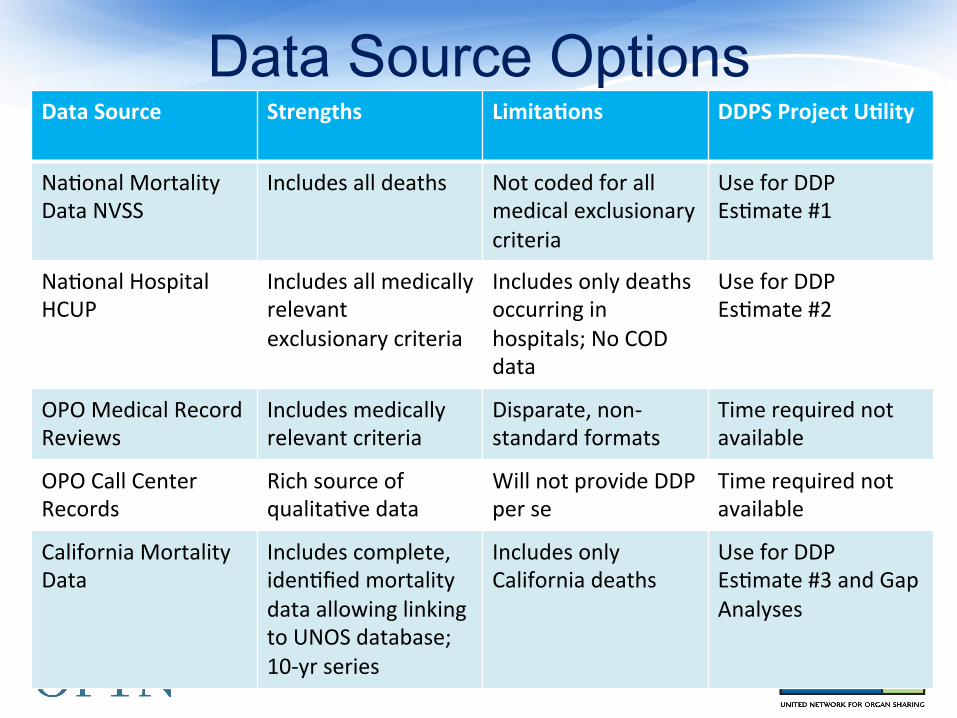
Data Source Options Data Source Strengths Limita/ons DDPS Project U/lity
Na9onal Mortality Data NVSS
Includes all deaths Not coded for all medical exclusionary criteria
Use for DDP Es9mate #1
Na9onal Hospital HCUP
Includes all medically relevant exclusionary criteria
Includes only deaths occurring in hospitals; No COD data
Use for DDP Es9mate #2
OPO Medical Record Reviews
Includes medically relevant criteria
Disparate, non-‐standard formats
Time required not available
OPO Call Center Records
Rich source of qualita9ve data
Will not provide DDP per se
Time required not available
California Mortality Data
Includes complete, iden9fied mortality data allowing linking to UNOS database; 10-‐yr series
Includes only California deaths
Use for DDP Es9mate #3 and Gap Analyses
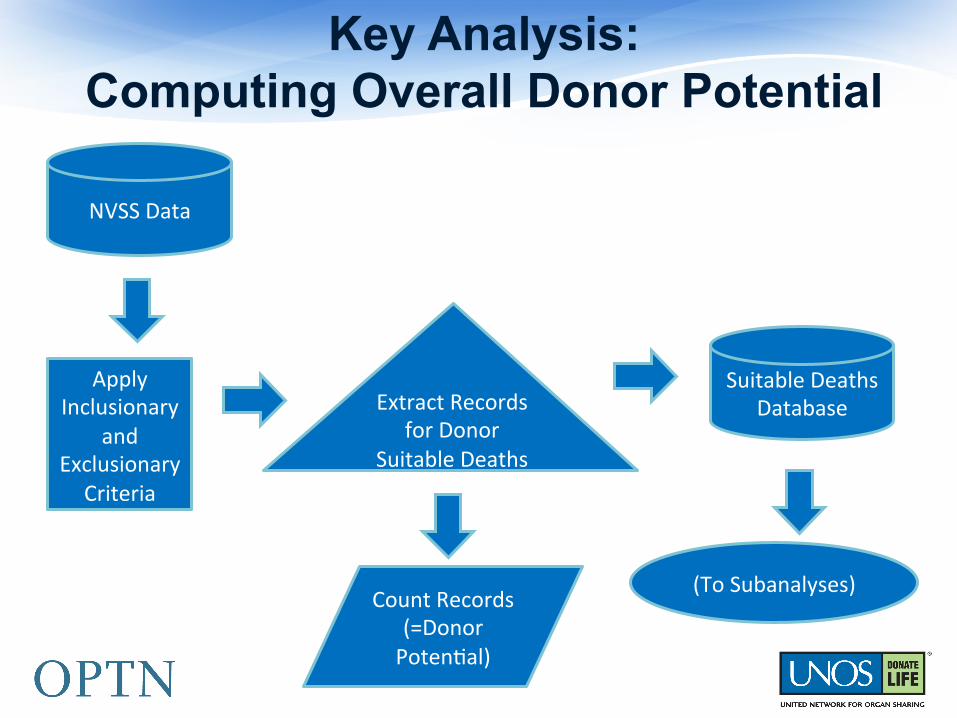
Key Analysis: Computing Overall Donor Potential
NVSS Data
Apply Inclusionary
and Exclusionary
Criteria
Suitable Deaths Database
Count Records (=Donor Poten9al)
Extract Records for Donor
Suitable Deaths
(To Subanalyses)
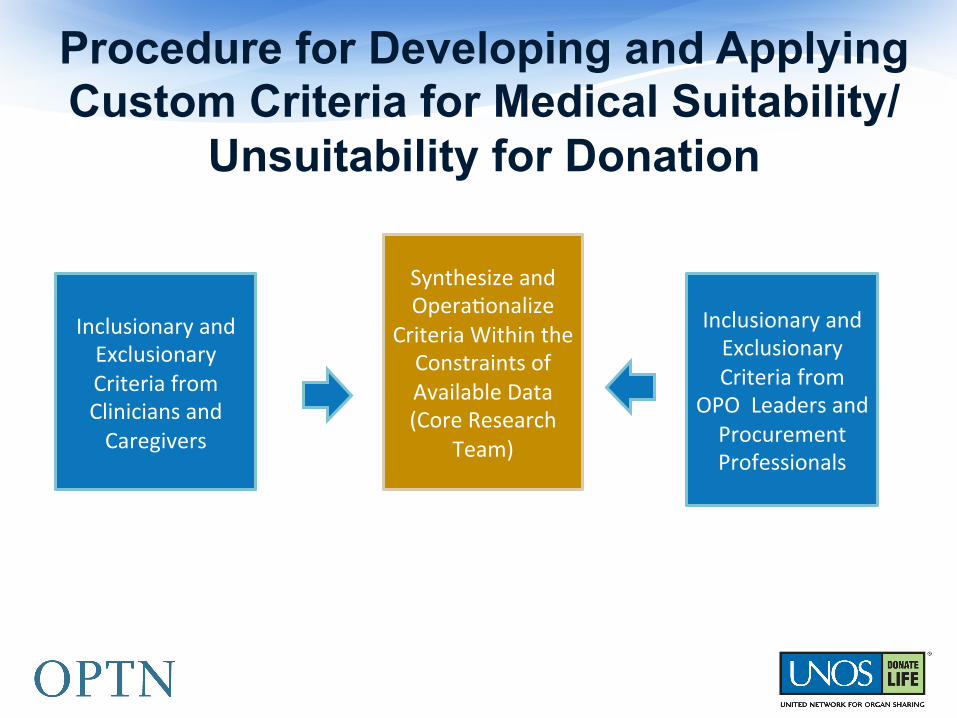
Procedure for Developing and Applying Custom Criteria for Medical Suitability/
Unsuitability for Donation
Synthesize and Opera9onalize
Criteria Within the Constraints of Available Data (Core Research
Team)
Inclusionary and Exclusionary Criteria from
OPO Leaders and Procurement Professionals
Inclusionary and Exclusionary Criteria from Clinicians and Caregivers
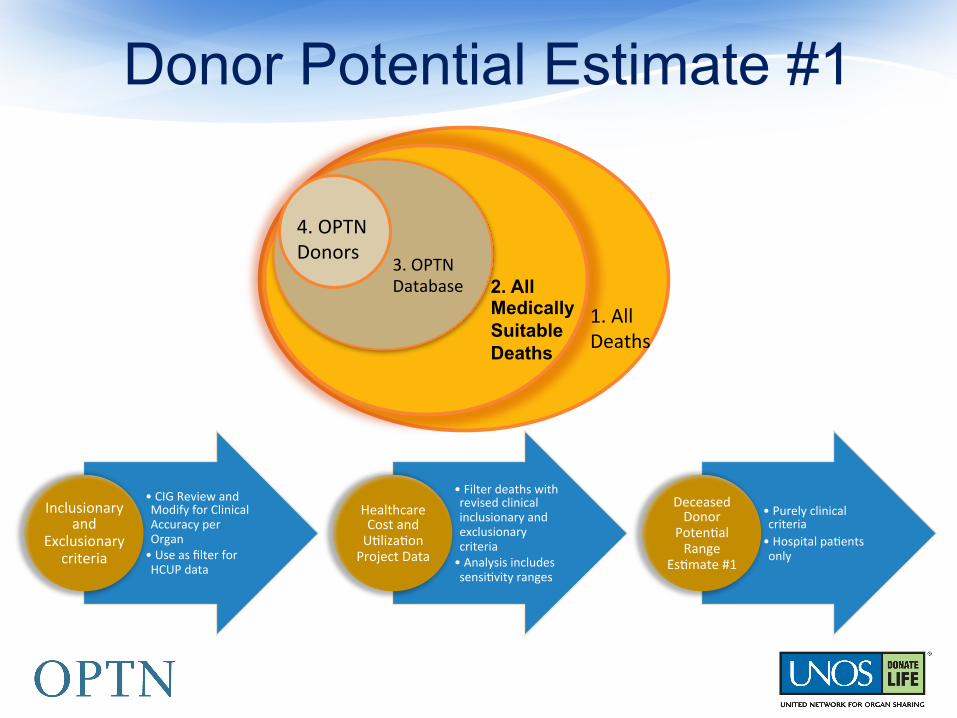
Donor Potential Estimate #1
• CIG Review and Modify for Clinical Accuracy per Organ • Use as filter for HCUP data
Inclusionary and
Exclusionary criteria
• Filter deaths with revised clinical inclusionary and exclusionary criteria • Analysis includes sensi9vity ranges
Healthcare Cost and U9liza9on Project Data
• Purely clinical criteria • Hospital pa9ents only
Deceased Donor
Poten9al Range
Es9mate #1
1. All Deaths
2. All Medically Suitable Deaths
3. OPTN Database
4. OPTN Donors
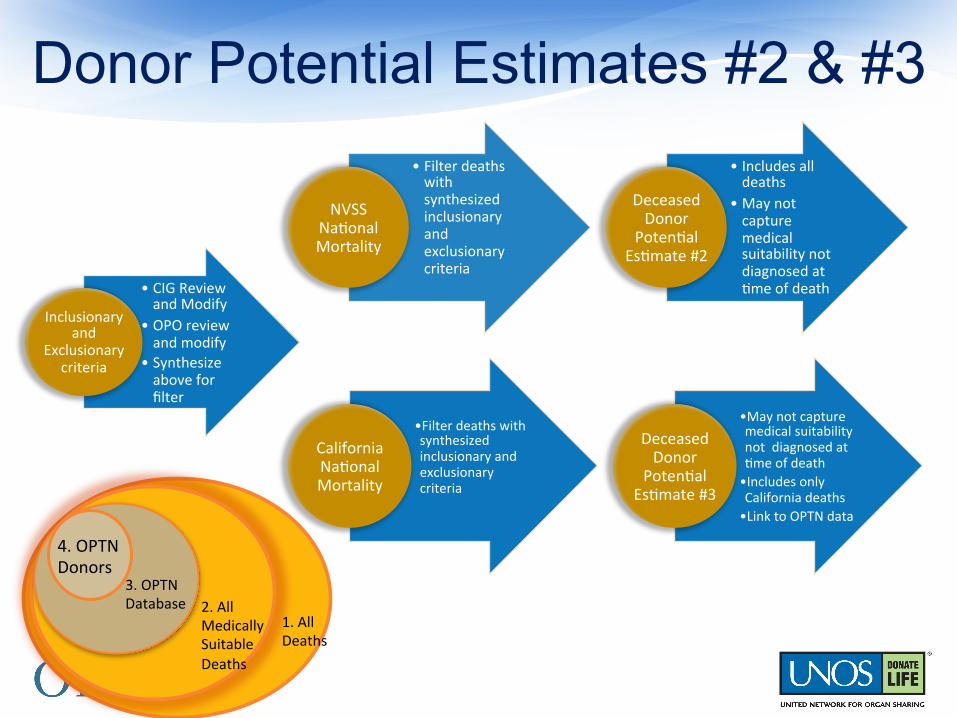
• Filter deaths with synthesized inclusionary and exclusionary criteria
NVSS Na9onal Mortality
• Includes all deaths
• May not capture medical suitability not diagnosed at 9me of death
Deceased Donor
Poten9al Es9mate #2
Donor Potential Estimates #2 & #3
• Filter deaths with synthesized inclusionary and exclusionary criteria
California Na9onal Mortality
• May not capture medical suitability not diagnosed at 9me of death • Includes only California deaths • Link to OPTN data
Deceased Donor
Poten9al Es9mate #3
• CIG Review and Modify
• OPO review and modify
• Synthesize above for filter
Inclusionary and
Exclusionary criteria
1. All Deaths
2. All Medically Suitable Deaths
3. OPTN Database
4. OPTN Donors
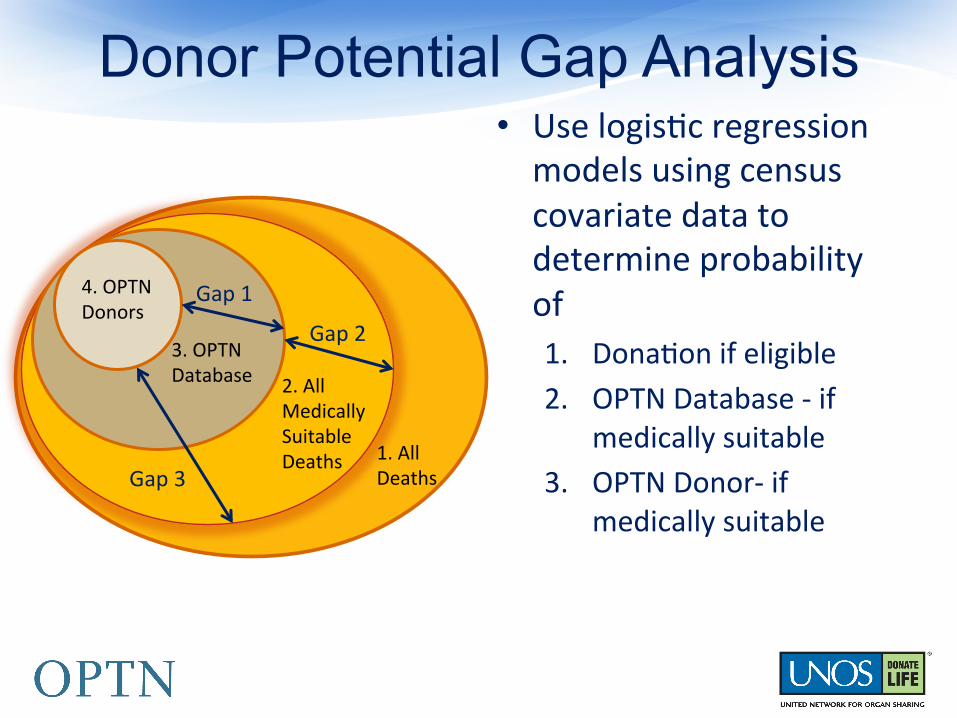
Donor Potential Gap Analysis • Use logis9c regression models using census covariate data to determine probability of 1. Dona9on if eligible 2. OPTN Database -‐ if
medically suitable 3. OPTN Donor-‐ if
medically suitable
1. All Deaths
2. All Medically Suitable Deaths
3. OPTN Database
4. OPTN Donors
Gap 1
Gap 2
Gap 3
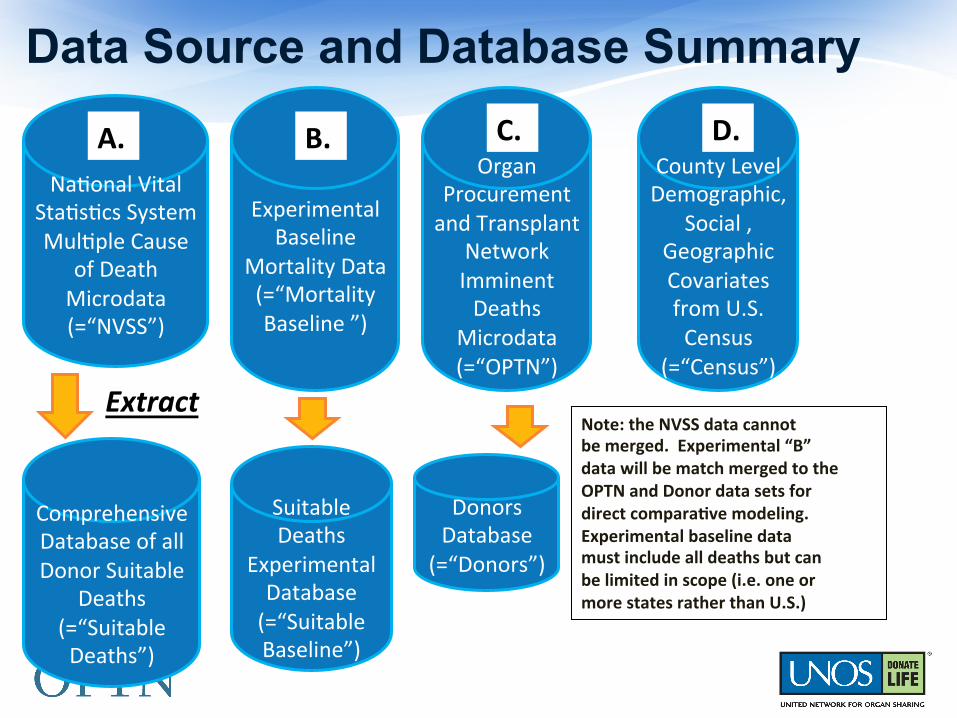
Data Source and Database Summary
Na9onal Vital Sta9s9cs System Mul9ple Cause
of Death Microdata (=“NVSS”)
Comprehensive Database of all Donor Suitable
Deaths (=“Suitable Deaths”)
Organ Procurement and Transplant
Network Imminent Deaths
Microdata (=“OPTN”)
County Level Demographic,
Social , Geographic Covariates from U.S. Census
(=“Census”) Extract
C. D.
Experimental Baseline
Mortality Data (=“Mortality Baseline ”)
B. A.
Suitable Deaths
Experimental Database (=“Suitable Baseline”)
Donors Database
(=“Donors”)
Note: the NVSS data cannot be merged. Experimental “B” data will be match merged to the OPTN and Donor data sets for direct compara/ve modeling. Experimental baseline data must include all deaths but can be limited in scope (i.e. one or more states rather than U.S.)
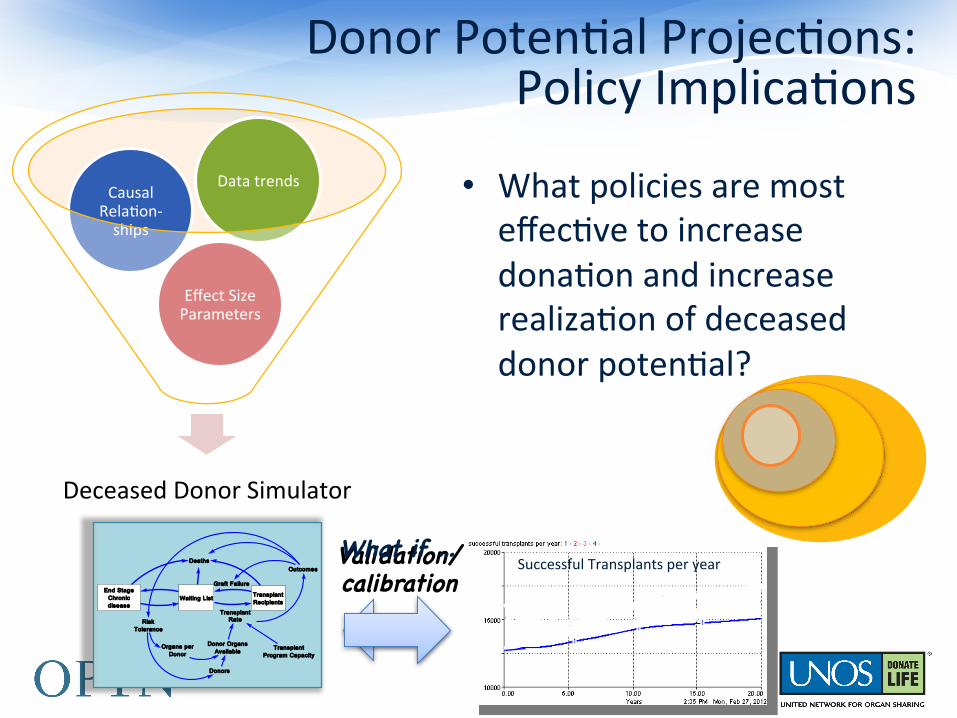
Deceased Donor Simulator
Effect Size Parameters
Causal Rela9on-‐ships
Data trends
Validation/�calibration�
Donor Poten9al Projec9ons: Policy Implica9ons
End StageChronicdisease
Waiting List TransplantRecipients
Deaths
TransplantRate
TransplantProgram Capacity
Donor OrgansAvailable
Donors
Organs perDonor
Outcomes
Graft Failure
RiskTolerance
What if … �
• What policies are most effec9ve to increase dona9on and increase realiza9on of deceased donor poten9al?
Successful Transplants per year
Deceased Donor Potential for Organ Transplantation: A
System Dynamics Framework
.
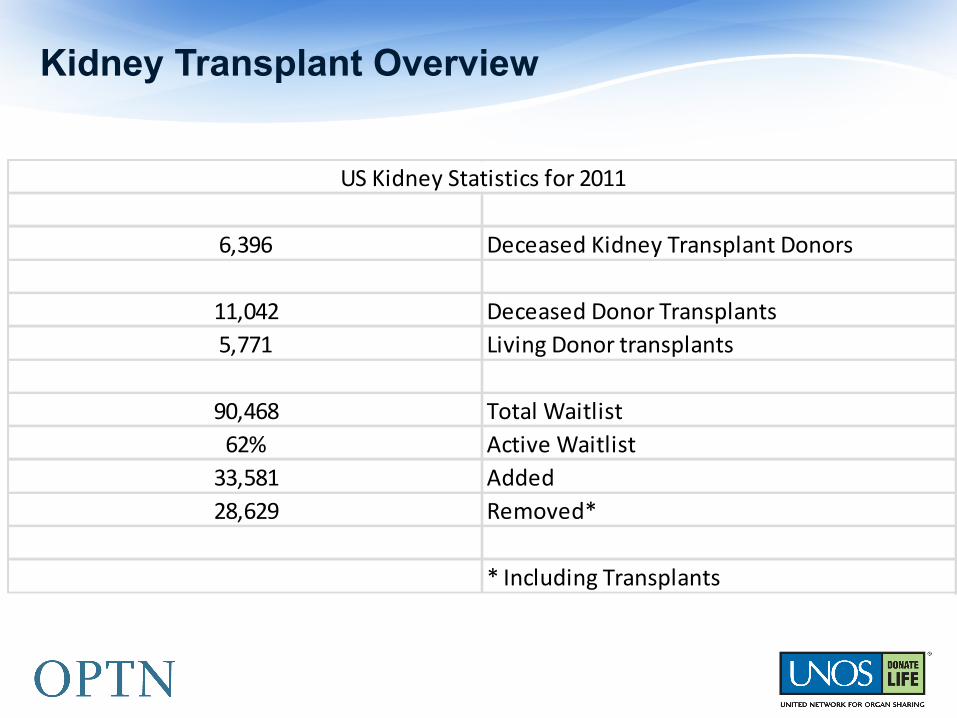
Kidney Transplant Overview
6,396 Deceased Kidney Transplant Donors
11,042 Deceased Donor Transplants5,771 Living Donor transplants
90,468 Total Waitlist62% Active Waitlist33,581 Added28,629 Removed*
* Including Transplants
US Kidney Statistics for 2011
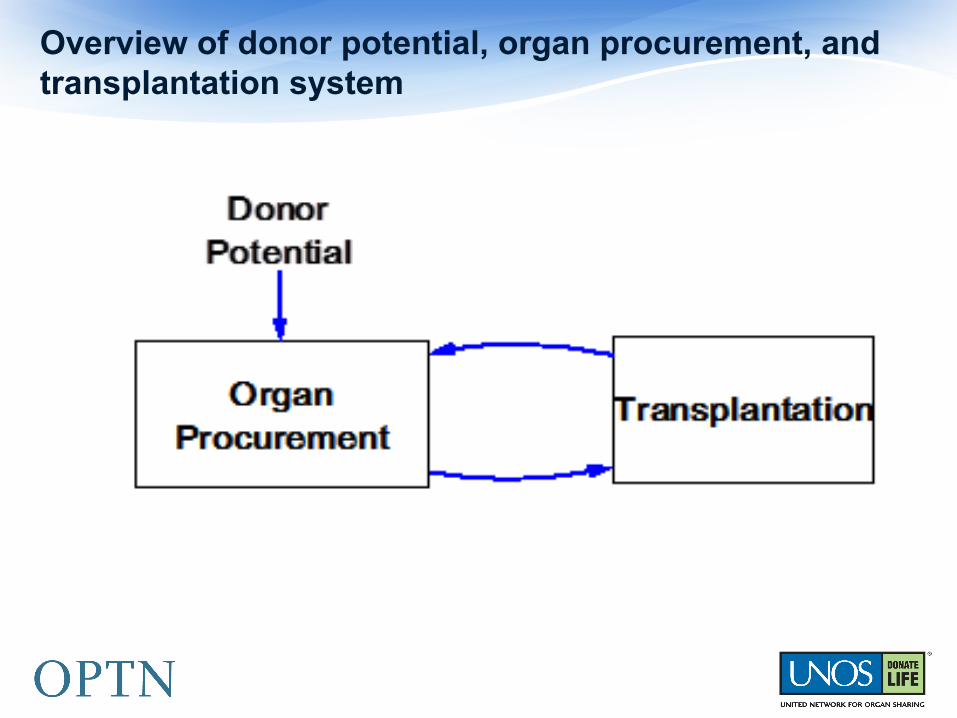
Overview of donor potential, organ procurement, and transplantation system
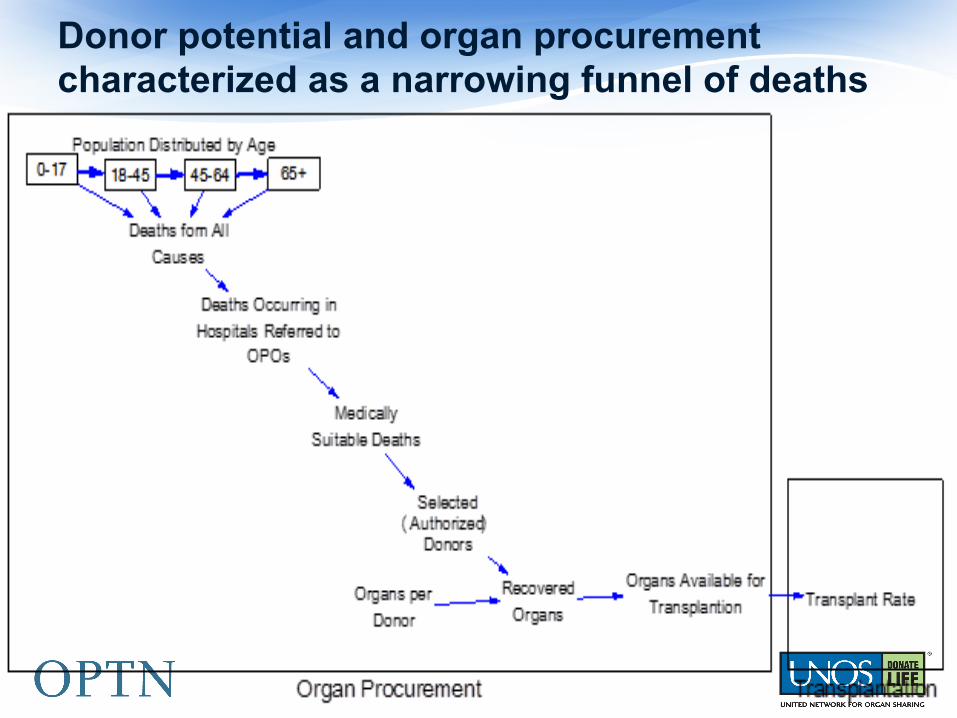
Donor potential and organ procurement characterized as a narrowing funnel of deaths

Flows of People Associated with Transplantation

Deceased Donor Kidney Transplants (US 2001-2009)
5:41 PM Fri, Jul 20, 2012
Historical Transplant Rate
Page 10.00 2.00 4.00 6.00 8.00
Years
1:
1:
1:
14000
16000
18000
1: Historical Kidney Transplant Rate
1
1
1 1
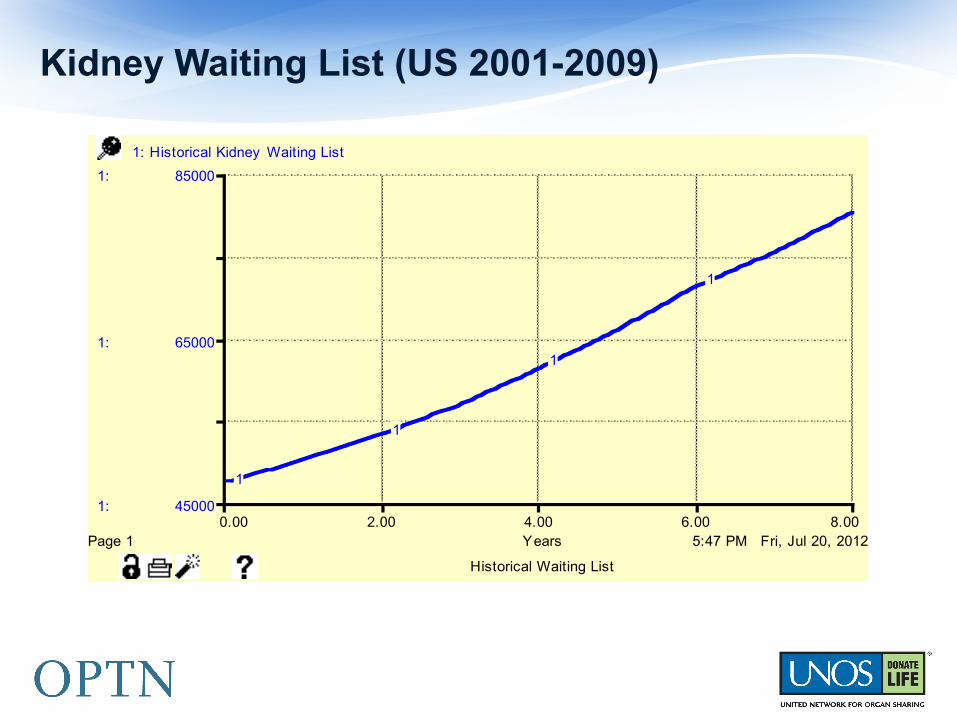
Kidney Waiting List (US 2001-2009)
5:47 PM Fri, Jul 20, 2012
Historical Waiting List
Page 10.00 2.00 4.00 6.00 8.00
Years
1:
1:
1:
45000
65000
85000
1: Historical Kidney Waiting List
1
1
1
1
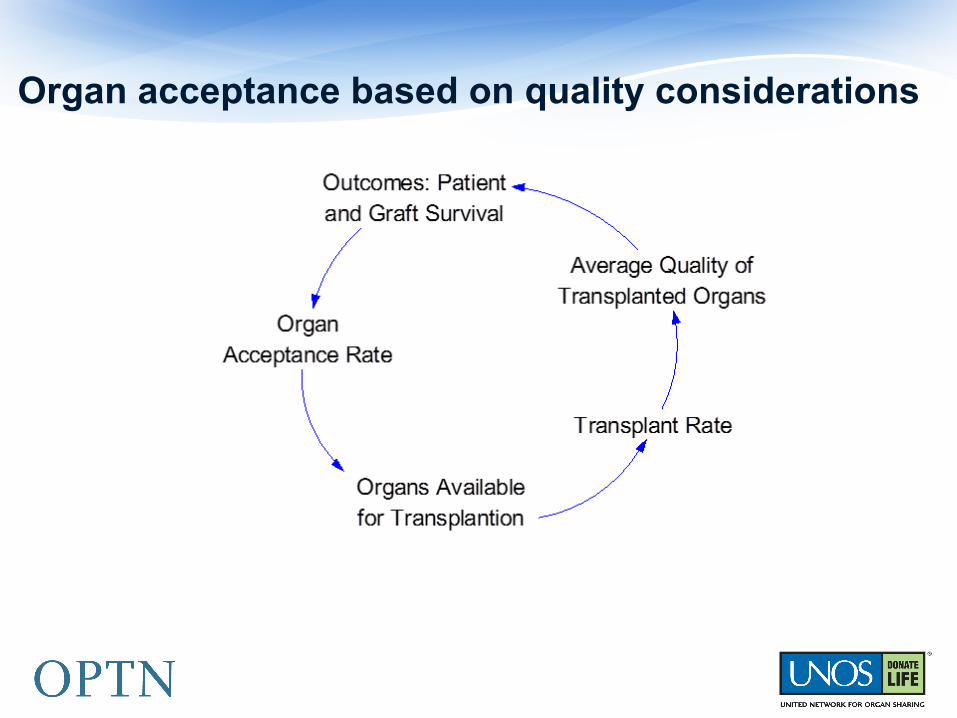
Organ acceptance based on quality considerations
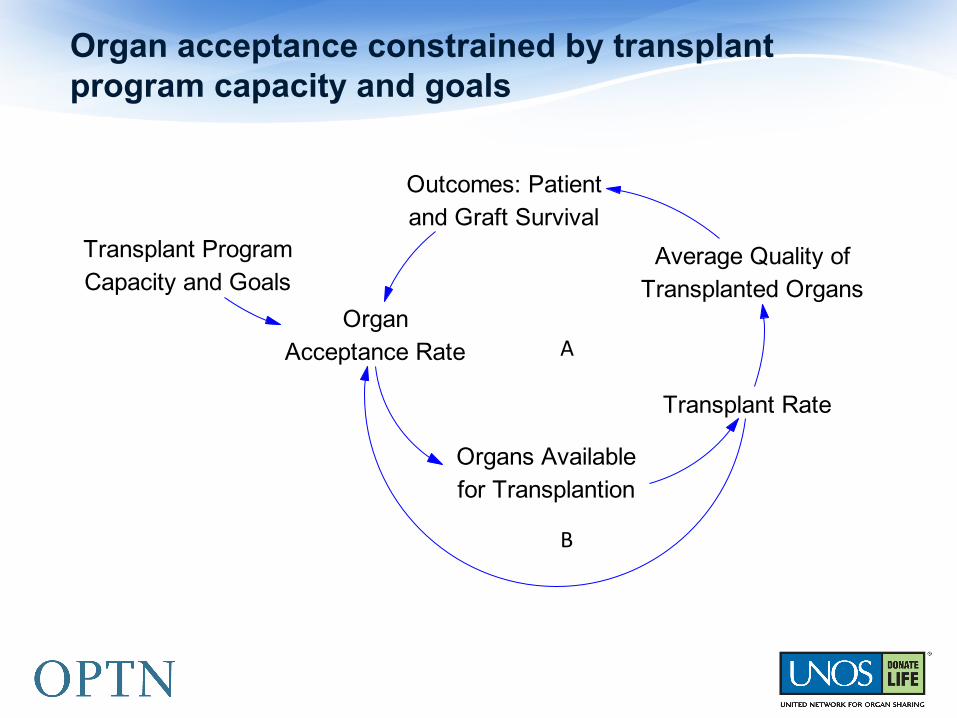
Organ acceptance constrained by transplant program capacity and goals
Transplant Rate
Organs Availablefor Transplantion
Average Quality ofTransplanted Organs
Outcomes: Patientand Graft Survival
OrganAcceptance Rate
Transplant ProgramCapacity and Goals
A
B
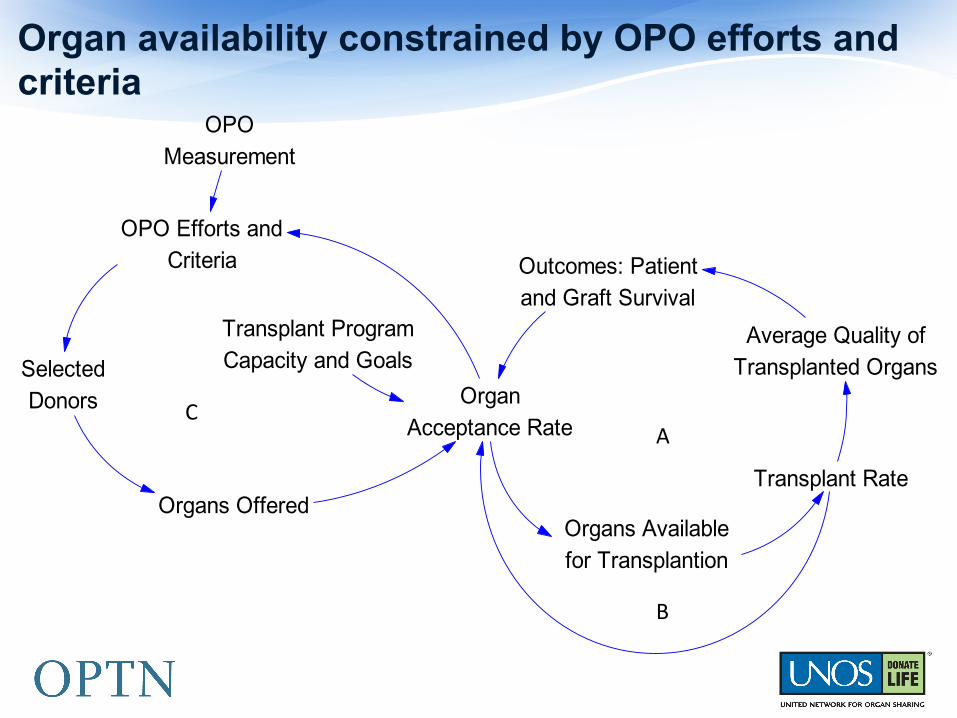
Organ availability constrained by OPO efforts and criteria
Transplant Rate
Organs Availablefor Transplantion
Average Quality ofTransplanted Organs
Outcomes: Patientand Graft Survival
OrganAcceptance Rate
Transplant ProgramCapacity and Goals
OPO Efforts andCriteria
SelectedDonors
Organs Offered
OPOMeasurement
A
B
C
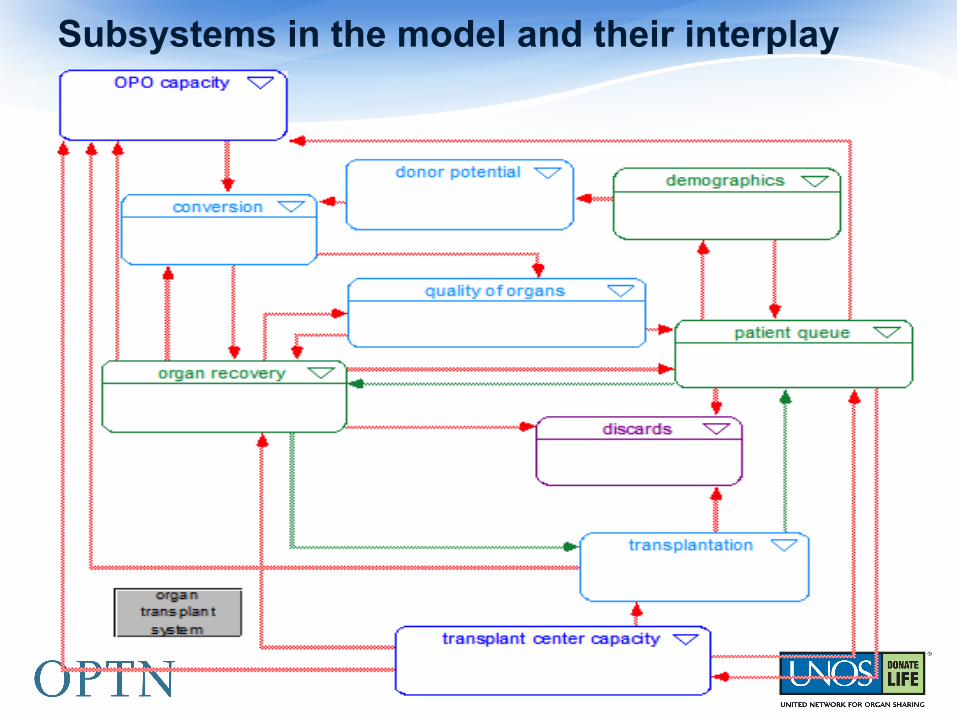
Subsystems in the model and their interplay
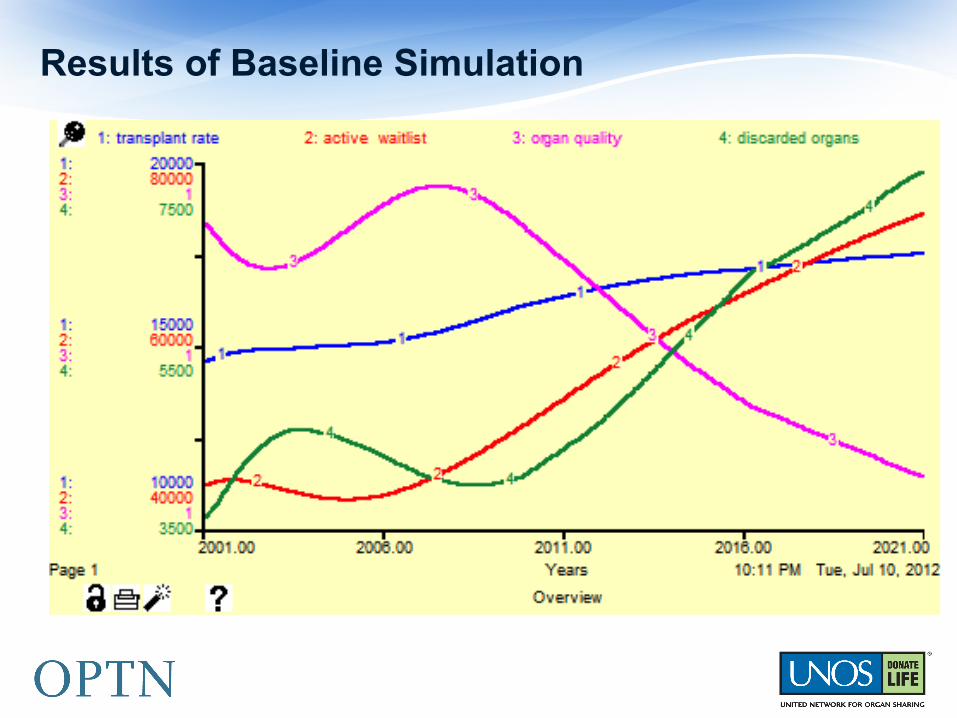
Results of Baseline Simulation
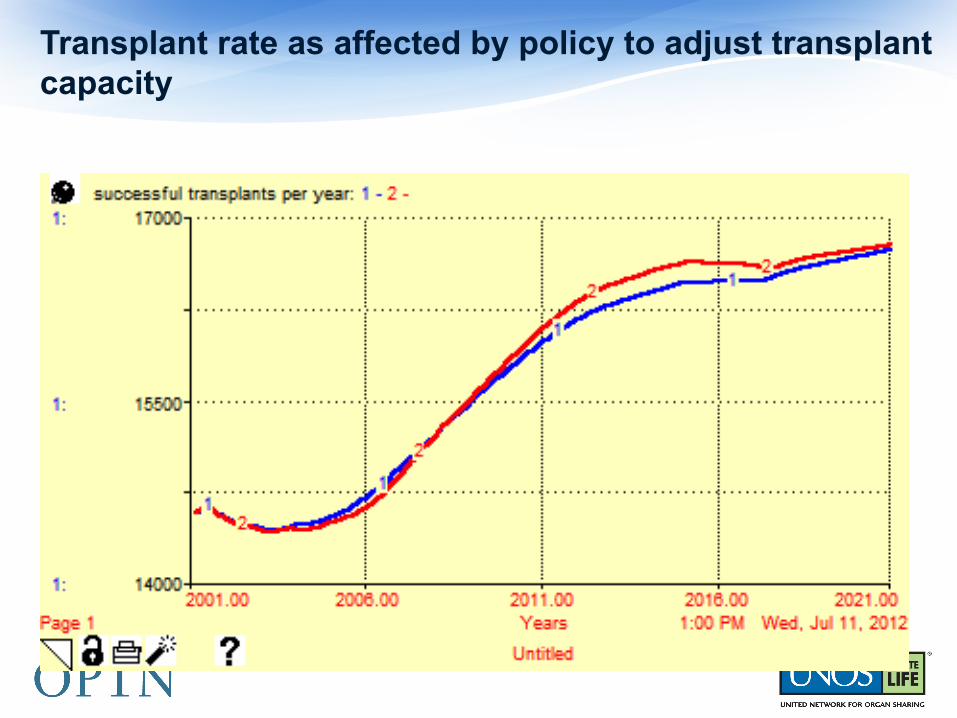
Transplant rate as affected by policy to adjust transplant capacity
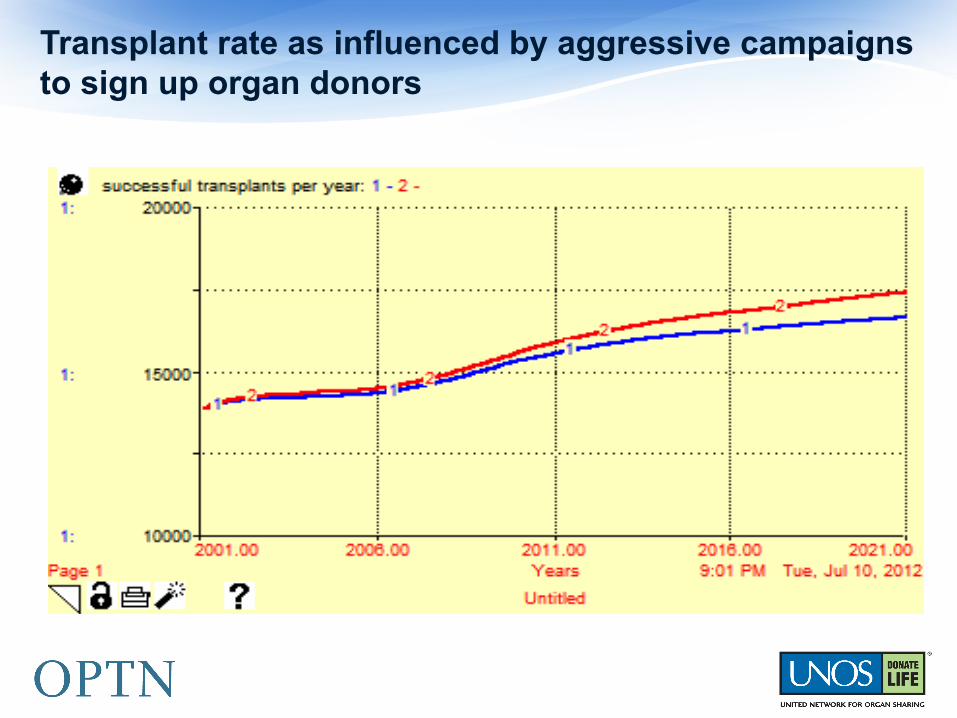
Transplant rate as influenced by aggressive campaigns to sign up organ donors
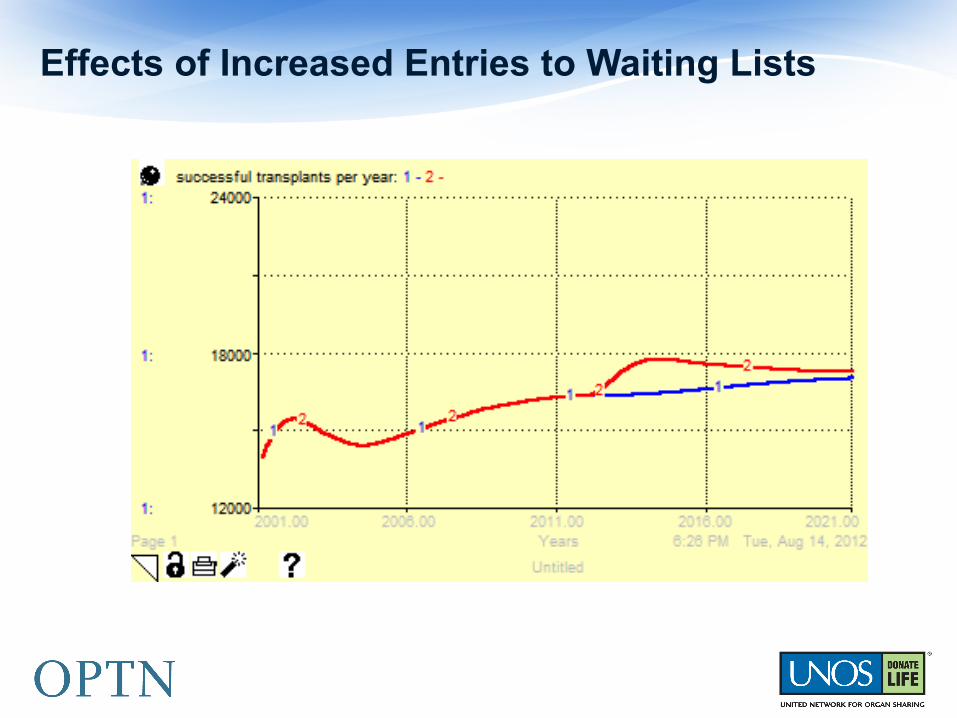
Effects of Increased Entries to Waiting Lists
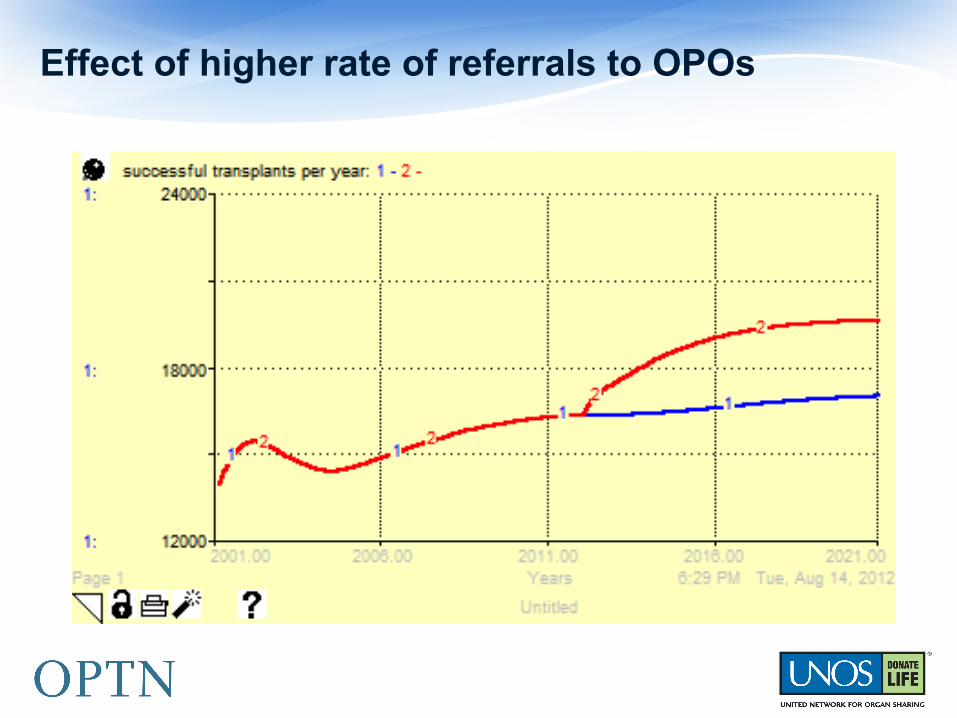
Effect of higher rate of referrals to OPOs
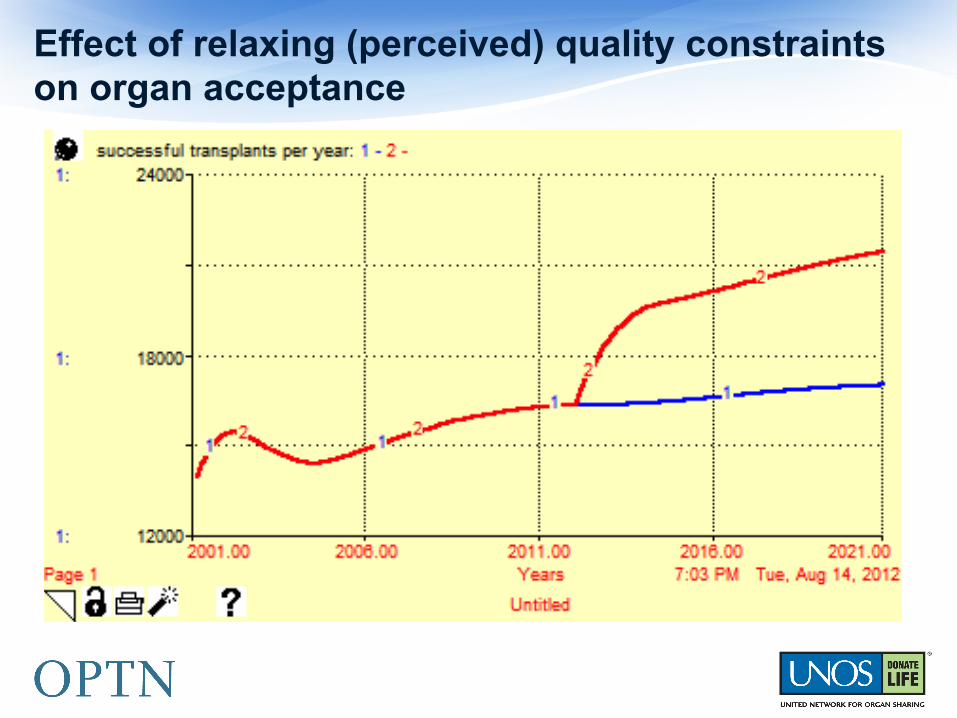
Effect of relaxing (perceived) quality constraints on organ acceptance

Results of combined strategy with increased referral from hospitals and relaxed quality constraints on organ acceptance.
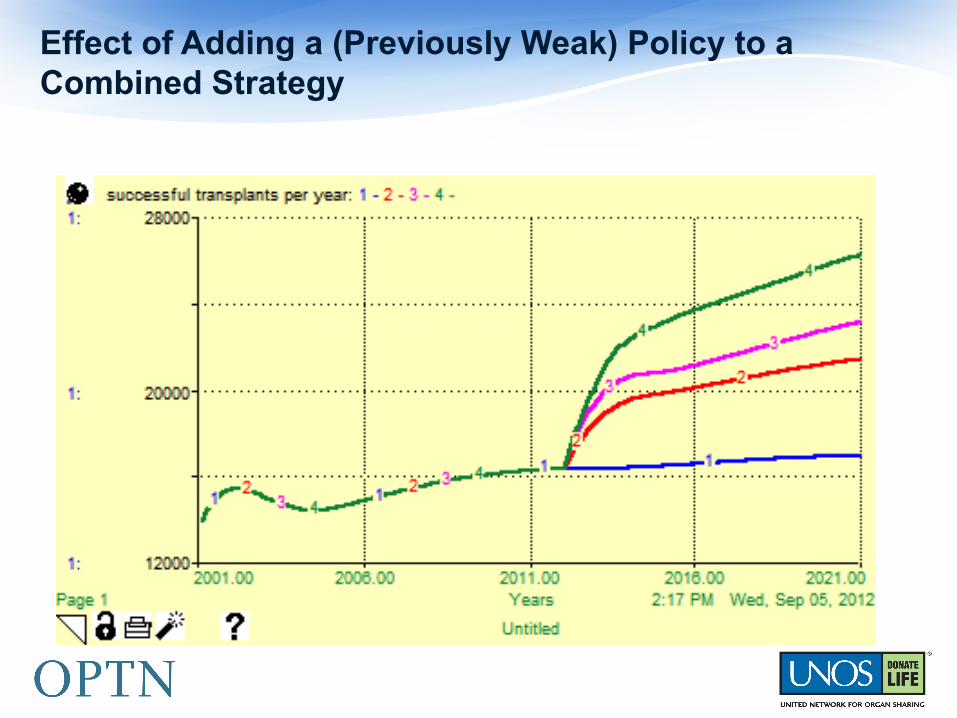
Effect of Adding a (Previously Weak) Policy to a Combined Strategy
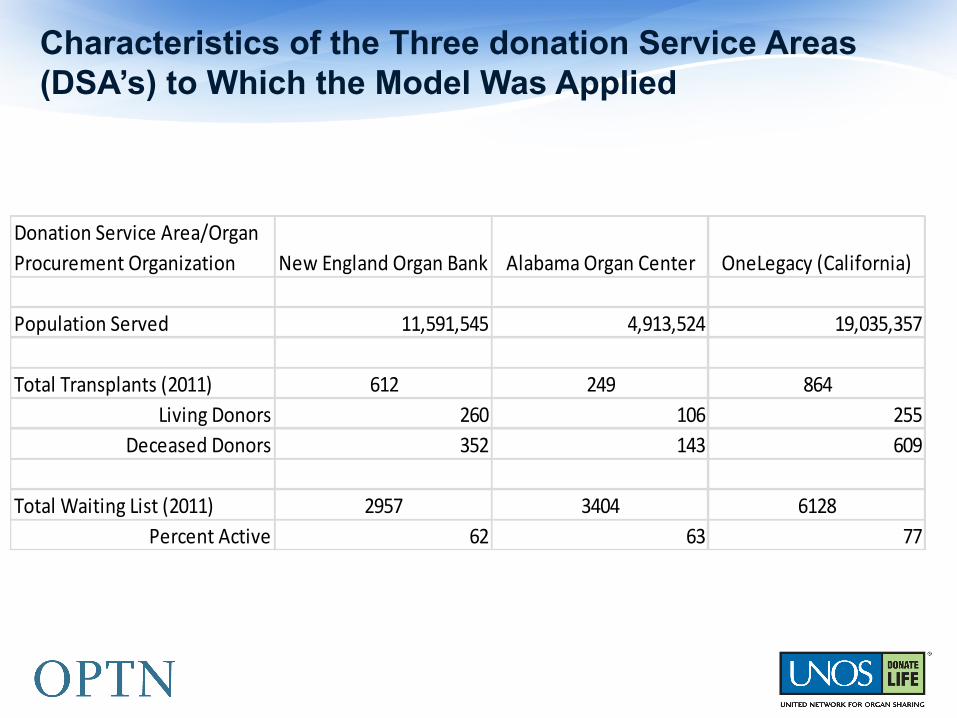
Characteristics of the Three donation Service Areas (DSA’s) to Which the Model Was Applied
Donation Service Area/Organ Procurement Organization New England Organ Bank Alabama Organ Center OneLegacy (California)
Population Served 11,591,545 4,913,524 19,035,357
Total Transplants (2011) 612 249 864Living Donors 260 106 255
Deceased Donors 352 143 609
Total Waiting List (2011) 2957 3404 6128Percent Active 62 63 77

Policy Results for New England Organ Bank (1)

Policy Results for New England Organ Bank (2)
1. Base run
2. Timely deathreferral
3. Wide qualityacceptance
4. policy 2+3
Policy 2+3 +increasedreferral to waitlist
§ Conceptual model that integrates insights from stakeholder discussions and contributions at meetings, stakeholder survey, and interviews with staffs of several OPOs and transplant programs, and UNOS staff.
§ Improved understanding of the constraints on realizing donor potential
§ Quantitative model calibrated for the kidney procurement and transplantation for the US as a whole and for three DSA’s that represent a cross-section of different populations and donor volumes
§ Simulation results at the National and DSA levels that help us understand how the realization of donor potential is sensitive or insensitive to various policies
System Dynamics Model: Results
§ Realization of donor potential is constrained by the manner in which the organ procurement and transplantation system functions. The rules and measurement systems may, in some cases, work against increases in volume and contribute to the plateauing of transplant volumes for the past several years.
§ Changing the system by which transplant programs are measured to create a better balance between outcomes such as graft failure and the number of people who are helped by transplants may help to increase volume by making programs less risk averse and more willing to transplant organs from less-than-ideal donors.
System Dynamics Model: Conclusions from Development and Use of the Model
§ Increasing the rate at which people sign up for donor registries can have a marginal effect on realization of donor potential by helping to improve conversion rates. The volume is still limited by the referral of medically suitable donors to the OPO’s.
§ Increasing the flow of patients to active waiting lists can also have a marginal effect in increasing volume by creating more pressure to accept organs from less-than-ideal donors and making it more likely that a good match will be found for organs offered to transplant programs.
§ Measurement of OPO’s based on conversion rates and organs per donor may limit pursuit of potential donors by making the OPO’s more conservative about the range of potential donors they consider.
System Dynamics Model: Conclusions from Development and Use of the Model (cont’d)

§ Increases in the volume of timely referrals from hospitals and the fraction of referrals OPO’s pursue can increase the volume of organs available for transplantation without reducing the average quality.
§ Strategies utilizing multiple approaches that are mutually reinforcing are likely to have the greatest impact in improving the realization of donor potential.
System Dynamics Model: Conclusions from Development and Use of the Model (cont’d)
§ New technique, not applied in the field before; new way of thinking about how organ procurement and transplantation function as a system
§ Framework for integrating diverse viewpoints about parts of the system into a coherent whole that can be used to assess the impact of policy changes on realization of donor potential and increases in transplant volume
§ Insights about relative leverage of policies for increasing realized donor potential and how this might differ in DSA’s with various characteristics
System Dynamics Model: Additions to the Field of Organ Procurement and Transplantation
§ Shared understanding of the system within which all stakeholders operate
§ Implications for CMS and HRSA regulators and OPTN governance structure regarding potential policy changes
§ Major effects on OPO’s and Transplant Programs depending on extent of implemented policy changes
§ Greater realization of donor potential, larger volume of transplants, and shorter waiting times for patients awaiting transplants
System Dynamics Model: Effect on Stakeholders
§ How will demographic shifts created by changing birth, death, and immigration rates affect patient queues, organ availability, and transplant rates?
§ How will changes in the average life expectancy of general population and growing proportion of elderly affect transplant system performance?
§ How will an increase in chronic disease incidence rates affect system performance, both in terms of requirements for transplantation and availability of organs from deceased donors?
§ How will better care of waitlisted patients, that increases their life expectancy, affect requirements for transplants and outcomes?
Questions for Further Research—I
§ How will better support of end-stage patients (who are not yet on waiting lists) affect system performance if it extends their life expectancy? What would be the effect of longer life expectancy for these patients have in combination with easier access to transplant waiting lists
§ How will improvements in scheduling and other decision mechanisms regarding patients waitlisted for transplant affect system performance?
§ How will expansions of OPO and transplant program capacity affect system performance, when done in combination with other interventions?
§ The work so far has focused on kidney transplantation. How will model results be affected if other organs are included in the model?
Questions for Further Research--II
§ Question to Consider: How will the results of this study help transplant professionals to better understand what is happening in their donation service area (DSA)? How will assist with moving from potential to actual donors?
§ We hope that our study’s trans-disciplinary approaches will yield powerful, easily accessible information for better general understanding of donation potential through variations in demographic and social characteristics, community infrastructure, and health of the population by geography and other relevant criteria of interest.
Toward Future Action and Performance Improvement
Center for Transplant System Excellence
Improving the care continuum
Questions


![[PPT]PowerPoint Presentation - MOHAN Foundation - Organ ... · Web viewOrgan Donation Presentation Organ Donation What is Organ donation Organ donation is the process of removing](https://img.dokumen.tips/doc/110x75/5adac0627f8b9a6d7e8d1ad7/pptpowerpoint-presentation-mohan-foundation-organ-vieworgan-donation-presentation.jpg)