Embed Size (px)
Citation preview

deceased organ donation 167
transplant programs 172organs recovered per donor 173organs transplanted per donor 174organ discards | expanded criteria donors 176donations after cardiac death | waiting time 177organ use 178
Luke wore the “tree of life” symbol proudly on his arm and close to his heart. His awesome commitment of organ donation gave the gift of life to four people. His donation also enhanced the lives of over 40 others. Please consider organ donation.
Jo Anne & Tim, Luke’s mother and father
deceased organ donation
ABSTRACT The status of deceased organ donation is assessed using several met-rics, including donation/conversion rate (how often at least one organ is recovered for transplant from an eligible death), organ yield (ratio of observed/expected numbers of organs transplanted), and rate of organs discarded (number of organs discarded divided by the number of organs recovered for transplant). The 2012 donation/conversion rate was 72.5. eligible donors per 100 eligible deaths, slightly lower than the 2011 rate but higher than in previous years. The 2011-2012 yield ratio varied by donation service area from 0.91 (fewer organs transplanted per donor than expected) to 1.09 (more than expected), and also varied for specific organs. The mean number of organs transplanted per donor in 2012 was 3.02, lower than in 2011 and 2010; this number varied by donation service area from 2.04 to 3.76. The number of organs discarded is calculated by subtracting the number of organs transplanted from the number recovered for transplant; this number is used to calculate the discard rate. The discard rate in 2012 for all organs combined was 0.14 per recovered organ, slightly higher than in 2011 and 2011; it varied by donation service area and organ type.
Key words Deceased organ donation, donation/conversion rate, organ discard rate, organ yield.
OPTN/SRTR 2012 Annual Data Report:

168 OPTN & SRTR Annual Data Report 2012
IntroductionThe status of deceased organ donation is assessed using sev-eral metrics, including donation/conversion rate, organ yield, and rate of organs discarded. These metrics have assumed increasing importance in light of decreasing numbers of eli-gible deaths over the past few years and fewer organs trans-planted in 2012 than in the preceding two years. This chapter describes these metrics and compares them across the 58 donation service areas (DSAs).
Definitions of Terms Related to Deceased Organ Donation
• Eligible death: Death of a person aged 70 years or younger who is legally declared brain dead according to hospital policy and does not exhibit any of the exclu-sions listed in Figure 1.1.
• Donor: A person from whom at least one organ was procured for the purpose of transplant, regardless of whether the organ was transplanted.
• Eligible donor: A donor whose death met the definition of eligible death.
• Donation/conversion rate: Number of eligible donors per 100 eligible deaths.
• Organ-specific donation/conversion rate: Number of donors of each organ type who met eligibility criteria per 100 eligible deaths.
• Organs recovered per donor (ORPD): Total number of organs recovered divided by the number of donors, not limited to eligible deaths.
• Organs transplanted per donor (OTPD): Total number of organs transplanted divided by the number of donors, not limited to eligible deaths.
• Organ yield: Ratio of observed to expected numbers of organs transplanted; expected numbers based on national experience with similar donors.
• Rate of organs discarded: Number of organs discarded is calculated by subtracting the number of organs transplanted from the number of organs recovered for the purpose of transplant; the discard rate is then calculated by dividing the number of organs discarded by the number of organs recovered for the purpose of transplant.
• Expanded criteria donors (ECD): Donors aged 60 years or older, or aged 50-59 years with two of the following: hypertension, terminal creatinine >1.5mg/dL, or death from cerebrovascular accident. This definition was developed for kidney donors. However, we have used this to classify donors in general.
Eligible DeathsOrgan procurement organizations (OPOs) are required to report all eligible deaths to the Organ Procurement and Transplantation Network (OPTN). For reporting purposes, an eligible death is defined as the death of a person aged 70 years or younger who is legally declared brain dead according to hospital policy and does not exhibit any of the exclusions listed in OPTN policy (Figure 1.1). In 2012, 8944 eligible deaths were reported by OPOs, reduced from 9023 reported in 2011 and 9035 in 2010.
Donation/Conversion RateThe donation/conversion rate is a measure of how often an eligible death becomes a donor (at least one organ recovered for the purpose of transplant). It is calculated as the number

deceased organ donation 169
of eligible donors (donors whose deaths met the defini-tion of eligible death) per 100 eligible deaths. In 2012, the donation/conversation rate was 72.5 eligible donors per 100 eligible deaths, a slight decline from 72.9 in 2011 (Figure 1.1), but higher than rates in 2009 (69.4) and 2010 (71.7). Organ-specific donation/conversion rates are calculated as the numbers of eligible donors of each specific organ type per 100 eligible deaths. In 2012, the donation/conversion rate for kidneys was 67.0 (1 or 2 kidneys recovered), higher than the rate of 64.7 for livers; both of these rates were higher than the rates for thoracic organs and pancreata. The heart donation/conversion rate was 27.0, higher than the rate of 18.5 for lung conversion (1 or 2 lungs recovered). Unadjusted donation/conversation rates varied by DSA (Figure 1.2).
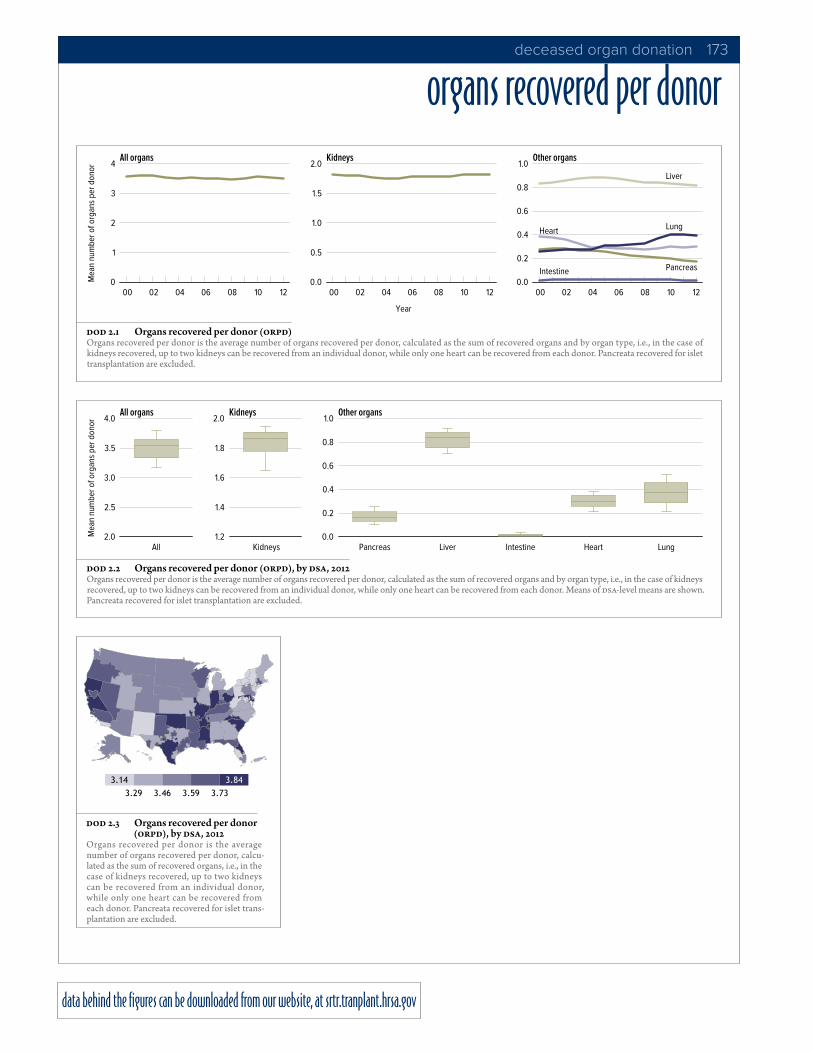
Organs Recovered per DonorThe number of organs recovered per donor (ORPD) is calculated by dividing the total number of organs recovered by the number of donors. The number of ORPD was 3.50 in 2012, slightly lower than 3.54 in 2011 and 3.58 in 2010. Since 2000, this value has ranged from 3.48 to 3.60 (Figure 2.1). In 2012, ORPD var-ied substantially by DSA, ranging from 2.75 to 4.13 (Figures 2.2, 2.3). Numbers of kidneys recovered per donor ranged from 1.54 to 1.97; pancreata, from 0.06 to 0.40 (unlike in 2011, islets are no longer counted as organs); and livers,
data behind the figures can be downloaded from our website, at srtr.tranplant.hrsa.gov
AllKidney
PancreasLiver
HeartLung
Perc
ent
0
20
40
60
80
64.69 83.6268.98 72.29 74.62 79.29
DOD 1.1 Overall & organ-specific donation rates per eligible deaths, 2012
DOD 1.2 Overall donation rates (per 100 eligible deaths), by DSA, 2012
Donation rate is the number of deceased donors meeting eligibility criteria per 100 eligible deaths. Organ-specific rates represent the number of donors of each organ type meeting eligibility criteria per 100 eligible deaths. An eligible death is any hospital-reported death or imminent death that is evaluated and meets organ donor eligibility requirements: age 70 or younger, death by neurological criteria (based on the American Academy of Neurology Practice parameter for determining brain death), and without any of the following indications: tuberculosis, human immunodeficiency virus infection with specified conditions, Creutzfeldt-Jacob Disease, herpetic septicemia, rabies, reactive hepatitis B surface antigen, any retrovirus infection, active malignant neoplasms (except primary CNS tumors and skin cancers), Hodgkin’s disease, multiple myeloma, leukemia, miscellaneous carcinomas, aplastic anemia, agranulocytosis, fungal and viral encepha-litis, gangrene of bowel, extreme immaturity, or positive serological or viral culture findings for HIV.
170 OPTN & SRTR Annual Data Report 2012
from 0.61 to 0.96. Numbers of intestines recovered per donor ranged from 0.0 to 0.08; hearts, from 0.0 to 0.44; and lungs, from 0.07 to 0.78 (Figure 2.2). The number of ORPD represents a mix of donor types such as standard criteria donors (SCD), expanded criteria donors (ECD), or donation after circulatory death (DCD) donors.
Organs Transplanted per Donor and Organ YieldThe mean number of organs transplanted per donor (OTPD) was 3.02 in 2012, slightly lower than 3.07 in 2011 and 3.10 in 2010 (Figure 3.1). Since 2000, this value has ranged from 3.00 to 3.24. In an unadjusted analysis, not accounting for SCD, ECD, and DCD donor types, the number of OTPD varied substantially by DSA, ranging from 2.04 to 3.76 (Figures 3.2, 3.3).
The ratio of observed to expected organs transplanted, or yield, is the metric used by OPTN to identify OPOs that require review for quality improvement purposes. The aggregate and organ-specific yield metrics for each OPO are publically avail-able on the Scientific Registry of Transplant Recipients web-site (http://www.srtr.org/opo/Default.aspx). This adjusted analysis based on a 2-year cohort also suggests opportunities to share best practices from DSAs with higher than expected organ-specific yields to improve the overall yield across the country. The yield metric shown compares the number of organs transplanted (observed) in 2011-2012 with the number of organs that would be expected to be transplanted in 2011-2012 based on the national experience with similar donors (expected). A ratio, expressed as observed/expected organs transplanted, of less than 1 indicates that fewer organs were transplanted than would be expected based on the national models for that organ. A ratio of greater than 1 indicates that more organs were transplanted than would be expected. In
2011-2012, the donor yield observed/expected ratio for total organs varied by DSA from 0.91 to 1.09 (Figure 3.4). The mean observed/expected ratio for kidneys varied from 0.89 to 1.14; for pancreata, from 0.24 to 2.71; for livers, from 0.77 to 1.16; for intestines, from 0 to 5.06; for hearts, from 0 to 1.22; and for lungs, from 0.38 to 1.43 (Figure 3.5).
As expected, the number of OTPD from SCDs was higher than the number from ECDs or DCD donors (Figure 3.6). Donors who are not ECD or DCD are considered SCD. In 2012, 3.65 organs were transplanted per donor from SCDs compared with 1.87 from ECDs and 1.91 from DCD donors. More kidneys were transplanted per donor from SCDs than from DCD donors or ECDs: 1.66, 1.60, and 0.89, respectively (Figure 3.7). As in past years, the numbers of kidneys transplanted per donor from DCD donors and from SCDs are similar. In contrast, for non-renal organs, the number of OTPD from SCDs was higher than the numbers for ECDs and DCD donors (Figure 3.8). The number of livers from ECD donors rose from 847 in 2000 to 1313 in 2012, and lungs from ECD donors rose from 74 in 2000 to 362 in 2012. Numbers of livers and lungs from DCD donors are smaller but increasing: 33 liver donors in 2000 and 253 in 2012; 0 lung donors in 2000 and 32 in 2012.
Discard RateThe number of organs discarded is calculated by subtracting the number of organs transplanted from the number of organs recovered for the purpose of transplant. The discard rate is then calculated by dividing the number of organs discarded by the number of organs recovered for the purpose of trans-plant. The discard rate in 2012 for all organs combined was 0.14 per recovered organ, slightly higher than the rate of 0.13 in 2010 and 2011 (Figure 4.1). The pancreas discard rate remained

deceased organ donation 171
highest, but it declined to 0.25 in 2012 from 0.27 in 2011. The kidney discard rate increased slightly to 0.19 in 2012 from 0.18 in 2011. The liver discard rate was unchanged, at 0.10 for livers in 2012 and 2011 (Figure 4.1). Discard rates varied substantially by DSA (Figure 4.2) and by organ type.
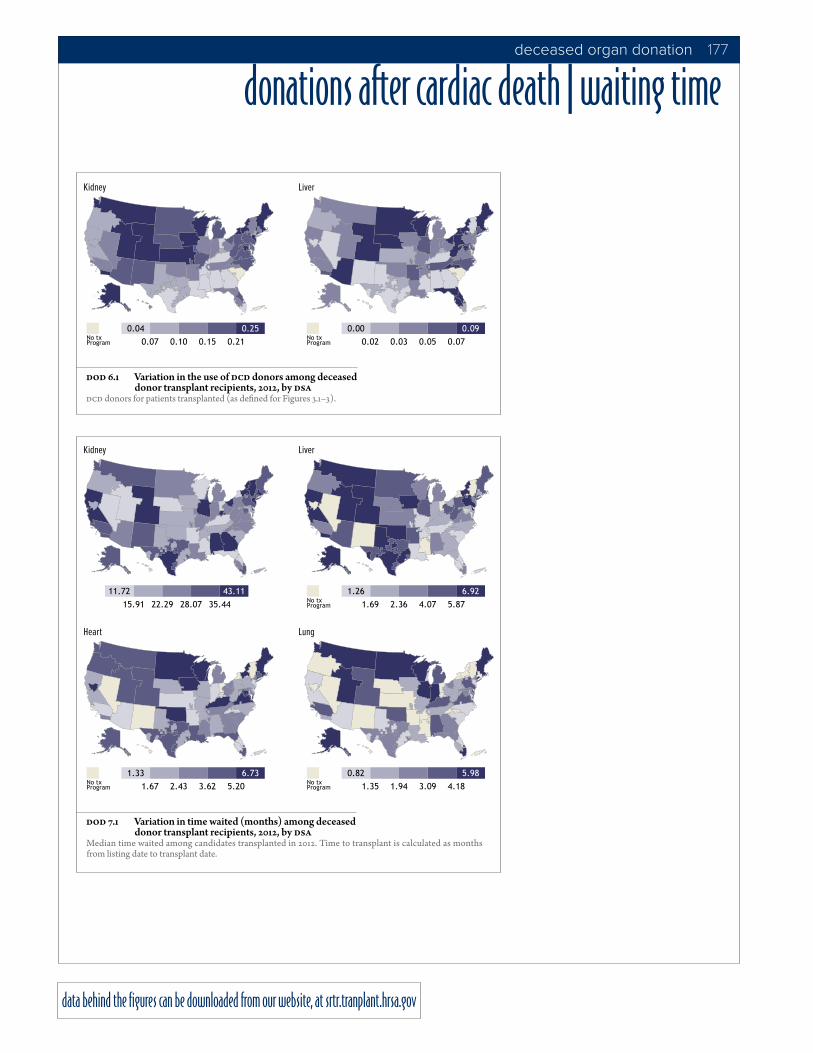
In 2012, use of kidneys, livers, and lungs from ECDs and DCD donors varied by DSA (Figures 5.1 and 6.1). To quantify ECD use, the number of ECD organs transplanted is divided by the number of all organs (SCD+ECD+DCD) transplanted. This calculation was performed for each organ type (kidney, pancreas, liver, and lung). The largest variation occurred for livers; livers from ECD donors represented 2% to 46% of all liv-ers transplanted by DSA (Figure 5.1). Variations for lungs and kidneys were next largest; lungs from ECD donors represented 0% to 38% of all lungs transplanted by DSA, and ECD kidneys 3% to 25% of all kidneys transplanted (Figure 5.1). Similarly, use of kidneys and livers from DCD donors varied by DSA. DCD kidneys represented 1% to 35% of all kidneys transplanted by DSA, and DCD livers represented 0% to 15% of all livers trans-planted (Figure 6.1). Waiting times for deceased donor trans-plants also varied by DSA in 2012 (Figure 7.1). Average waiting times across the 58 DSAs were longest for kidney transplants, on average 26 months compared with 12 for pancreas, 10 for intestines, 4 for livers, 3 for hearts, and 3 for lungs. These aver-age waiting times apply only to candidates who underwent transplant, and do not account for candidates who did not undergo transplant.
In 2012, at least one organ was procured for the purpose of transplant from 8144 donors, slightly more than the 8128 donors in 2011 (Figure 8.1). Of the 16,288 kidneys from these donors, 5720 left, 5617 right, and 328 en bloc kidneys were transplanted. This represents 74% of all kidneys, considering
en bloc transplants as two kidneys. Reasons for not using donor kidneys are listed in Figure 8.1. The most common rea-son for not procuring a kidney was poor organ function. Of kidneys recovered, 1252 left, 1327 right, and 90 en bloc were not transplanted. The most common reason for not transplanting a procured left or right kidney was biopsy findings (Figure 8.1). From the 8144 donors, only 1046 pancreas allografts (12.84%) were transplanted; another 520 were recovered for the pur-pose of transplant but not transplanted (Figure 8.2). From the 8144 donors, only 5942 liver allografts (72.96%) were trans-planted; another 691 were recovered but not transplanted (Figure 8.3). The most common reason for not transplanting recovered livers was biopsy findings. Reasons for not trans-planting recovered livers differ from reasons for not procuring a liver. The most common reason for not procuring a liver was,
“ruled out after evaluation in the operating room” (Figure 8.3). For remaining organs, the numbers procured for transplant and not used were smaller (Figure 8.4-8.6).
data behind the figures can be downloaded from our website, at srtr.tranplant.hrsa.gov

172 OPTN & SRTR Annual Data Report 2012
transplant programs
DOD 1.3 Transplant program summary, 2012Organ specific transplant programs are defined based on one or more transplants of that organ type within 2012.
Number of transplant programs in the country that transplanted at least one organ from the OPO
Number of transplant programs within the OPO service area
DSA/OPO KI PA LI IN HR LU KI PA LI IN HR LUALOB 22 3 6 1 14 6 1 1 1 1 1AROR 25 4 11 15 9 3 1 2 AZOB 27 4 11 12 8 4 3 3 3 2CADN 42 9 17 3 21 12 4 3 4 1 4 3CAGS 18 6 15 15 5 2 1 1 CAOP 49 13 14 1 17 11 10 7 5 1 5 3CASD 19 5 8 7 3 4 3 3 2 1CORS 28 2 12 1 17 4 4 2 3 2 1CTOP 16 4 6 6 5 2 1 1 DCTC 19 6 9 8 9 5 3 1 1 2 1FLFH 25 11 13 15 8 2 1 1 1 1FLMP 21 7 10 1 18 10 1 1 2 1 2 1FLUF 29 4 17 4 18 6 2 1 2 2 2FLWC 33 8 12 2 15 8 2 1 1 2 1GALL 34 8 20 3 29 13 4 3 3 4 1HIOP 27 4 4 1 1 1 IAOP 17 3 10 2 11 2 4 1 1 1 1ILIP 42 10 20 4 20 11 8 6 6 2 6 2
INOP 36 1 9 1 25 8 3 1 1 1 3 1KYDA 19 3 10 2 8 4 3 2 2 2 2LAOP 40 8 17 3 17 12 4 3 3 1 1MAOB 44 8 10 3 9 9 12 6 6 1 5 3MDPC 11 3 7 14 8 2 2 2 2 2MIOP 39 9 16 4 25 13 7 3 3 1 4 2MNOP 46 4 7 2 11 10 9 3 3 1 3 2MOMA 23 4 16 1 19 11 4 2 4 3 2MSOP 31 4 17 1 16 10 1 1 MWOB 38 10 15 1 20 19 6 2 3 1 NCCM 28 4 10 1 7 10 1 1 1 1
Number of transplant programs in the country that transplanted at least one organ from the OPO
Number of transplant programs within the OPO service area
DSA/OPO KI PA LI IN HR LU KI PA LI IN HR LUNCNC 35 7 25 3 16 5 4 3 2 1 3 2NEOR 6 3 6 3 5 1 1 1 1 1 NJTO 28 5 15 9 9 5 3 1 2 1NMOP 7 1 10 5 4 2 NVLV 27 8 17 3 12 8 1 NYAP 15 4 7 1 10 3 2 2 NYFL 14 1 9 6 3 2 1 1 1 NYRT 33 6 14 3 9 4 10 3 6 2 4 1NYWN 5 2 8 1 6 5 1 1 OHLB 15 3 11 1 17 5 2 2 2 1 2 2OHLC 18 5 6 13 5 2 OHLP 20 1 10 15 8 2 1 1 2 1OHOV 24 1 7 13 5 3 2 2 1 1 OKOP 34 3 12 3 17 8 6 2 3 1 1ORUO 14 1 9 5 3 3 1 2 1 PADV 62 11 24 2 27 12 15 9 10 7 3PATF 35 3 18 2 16 6 5 3 4 2 3 2PRLL 20 2 13 6 5 1 1 1 1 SCOP 22 3 18 1 19 11 1 1 1 1 1TNDS 42 13 29 4 27 12 6 1 1 1 1TNMS 27 7 12 4 16 11 2 1 2 1 TXGC 50 8 16 20 12 6 4 6 4 3TXSA 28 4 6 1 10 4 5 1 2 2 1TXSB 39 10 20 3 26 7 11 5 5 6 4UTOP 22 4 12 3 10 5 3 2 3 3 1VATB 34 7 14 2 18 15 5 3 2 4 1WALC 31 8 13 1 13 1 5 3 3 1 3 1WIDN 20 3 8 1 7 3 3 2 3 2 1WIUW 13 2 10 1 15 4 1 1 1 1 1 1
deceased organ donation 173
data behind the figures can be downloaded from our website, at srtr.tranplant.hrsa.gov
Year
00 02 04 06 08 10 12
Mea
n nu
mbe
r of o
rgan
s pe
r don
or
0
1
2
3
4All organs
00 02 04 06 08 10 12 0.0
0.5
1.0
1.5
2.0
00 02 04 06 08 10 12 0.0
0.2
0.4
0.6
0.8
1.0
Pancreas
Liver
Intestine
Heart Lung
Kidneys Other organs
All
Mea
n nu
mbe
r of o
rgan
s pe
r don
or
2.0
2.5
3.0
3.5
4.0All organs Other organs
Kidneys1.2
1.4
1.6
1.8
2.0
Pancreas Liver Intestine Heart Lung0.0
0.2
0.4
0.6
0.8
1.0Kidneys
3.14 3.843.29 3.46 3.59 3.73
organs recovered per donor
DOD 2.1 Organs recovered per donor (ORPD)Organs recovered per donor is the average number of organs recovered per donor, calculated as the sum of recovered organs and by organ type, i.e., in the case of kidneys recovered, up to two kidneys can be recovered from an individual donor, while only one heart can be recovered from each donor. Pancreata recovered for islet transplantation are excluded.
DOD 2.2 Organs recovered per donor (ORPD), by DSA, 2012Organs recovered per donor is the average number of organs recovered per donor, calculated as the sum of recovered organs and by organ type, i.e., in the case of kidneys recovered, up to two kidneys can be recovered from an individual donor, while only one heart can be recovered from each donor. Means of DSA-level means are shown. Pancreata recovered for islet transplantation are excluded.
DOD 2.3 Organs recovered per donor (ORPD), by DSA, 2012
Organs recovered per donor is the average number of organs recovered per donor, calcu-lated as the sum of recovered organs, i.e., in the case of kidneys recovered, up to two kidneys can be recovered from an individual donor, while only one heart can be recovered from each donor. Pancreata recovered for islet trans-plantation are excluded.

174 OPTN & SRTR Annual Data Report 2012
Year
00 02 04 06 08 10 12
Mea
n nu
mbe
r of o
rgan
s pe
r don
or
0
1
2
3
4All organs
00 02 04 06 08 10 12 0.0
0.5
1.0
1.5
2.0
00 02 04 06 08 10 12 0.0
0.2
0.4
0.6
0.8
1.0Kidneys Other organs
Pancreas
Liver
Intestine
Heart Lung
All
Mea
n nu
mbe
r of o
rgan
s pe
r don
or
2.0
2.5
3.0
3.5
4.0
Kidneys1.2
1.4
1.6
1.8
2.0
Pancreas Liver Intestine Heart Lung0.0
0.2
0.4
0.6
0.8
1.0KidneysAll organs Other organs
2.56 3.442.79 3.02 3.13 3.29
1 2 3 4 5 6 7 8 9 10 11 12 13 14 15 16 17 18 19 20 21 22 23 24 25 26 27 28 29 30 31 32 33 34 35 36 37 38 39 40 41 42 43 44 45 46 47 48 49 50 51 52 53 54 55 56 57 58
Obs
erve
d to
exp
ecte
d ra
tio
0.75
1.00
OPO
1.25
organs transplanted per donor
DOD 3.1 Organs transplanted per donor (OTPD)Organs transplanted per donor is the average number of organs transplanted per donor. Organs divided into segments (liver, lung, pancreas, intestine) may account for more than one transplant, so the number transplanted may exceed the number recovered. Based on a count of recovered organs that are transplanted, which differs from the number of transplant operations. Pancreata recovered for islet transplantation are excluded.
DOD 3.2 Organs transplanted per donor (OTPD), by DSA, 2012Organs transplanted per donor is the average number of organs transplanted per donor. Organs divided into segments (liver, lung, pancreas, intestine) may account for more than one transplant, so the number transplanted may exceed the number recovered. Based on a count of recovered organs that are transplanted, which differs from the number of transplant operations. Means of DSA-level means are shown. Pancreata recovered for islet transplantation are excluded.
DOD 3.3 Organs transplanted per donor (OTPD), by DSA, 2012
Organs transplanted per donor is the aver-age number of organs transplanted per donor. Organs divided into segments (liver, lung, pan-creas, intestine) may account for more than one transplant, so the number transplanted may exceed the number recovered. Based on a count of recovered organs that are transplanted, which differs from the number of transplant operations. Pancreata recovered for islet trans-plantation are excluded.
DOD 3.4 Donor yield: observed to expected ratio (O/E), 2011–2012: all organsDonor yield provides a measure of organs transplanted per donor. Expected yield is estimated from statistical models. These models take into account various char-acteristics that are not under the control of the OPOs.

deceased organ donation 175
data behind the figures can be downloaded from our website, at srtr.tranplant.hrsa.gov
All
Obs
erve
d to
exp
ecte
d ra
tio
0.0
0.2
0.4
0.6
0.8
1.0
1.2All organs Other organs
Kidneys0.0
0.2
0.4
0.6
0.8
1.0
1.2
Pancreas Liver Intestine Heart Lung0.0
0.5
1.0
1.5
2.0
2.5Kidneys
Year
00 02 04 06 08 10 12
Mea
n nu
mbe
r of o
rgan
s pe
r don
or
0
1
2
3
4
SCD
ECD
DCD
Year
00 02 04 06 08 10 12
Mea
n nu
mbe
r of k
idne
ys p
er d
onor
0.0
0.5
1.0
1.5
2.0SCD
ECD
DCD
Year
00 02 04 06 08 10 12
Mea
n nu
mbe
r of o
rgan
s pe
r don
or
0.0
0.2
0.4
0.6
0.8
1.0
Pancreas
Liver
Intestine
Heart
Lung
SCD ECD DCD
00 02 04 06 08 10 12 00 02 04 06 08 10 12
organs transplanted per donor
DOD 3.5 Donor yield: observed to expected ratio (O/E), by DSA & organ, 2011–2012*See adjustments, below.
DOD 3.6 Organs transplanted per donor (OTPD), by SCD, DCD, & ECD status
Organs transplanted per donor is the aver-age number of organs transplanted per donor. Organs divided into segments (liver, lung, pan-creas, intestine) may account for more than one transplant, so the number transplanted may exceed the number recovered. Based on a count of recovered organs that are transplanted, which differs from the number of transplant operations. Pancreata recovered for islet trans-plantation are excluded.
DOD 3.7 Kidneys transplanted per donor (OTPD), by SCD, DCD, & ECD status
Organs transplanted per donor is the aver-age number of organs transplanted per donor. Organs divided into segments (liver, lung, pan-creas, intestine) may account for more than one transplant, so the number transplanted may exceed the number recovered. Based on a count of recovered organs that are transplanted, which differs from the number of transplant operations. Pancreata recovered for islet trans-plantation are excluded.
*Models adjust for the following:Kidney: age, gender, blood type, cause of death,
circumstances of death, mechanism of death, clinical infection present, cigarette use, cocaine use, heavy alcohol consumption, cdc high risk donor, history of diabetes, insulin dependence, history of hypertension, history of cancer, DCD, cardiac arrest after brain death, hepatitis B surface antigen, hepatitis B core antibody, hepatitis C antibody, serum creatinine, organ recovered outside the contiguous 48 states?
Pancreas: age, BMI, race/ethnicity, blood type, cause of death, circumstances of death, mechanism of death, cocaine use, heavy alcohol consumption, CDC high risk donor, history of diabetes, insulin dependence, history of hypertension, history of cancer, dcd, lung pO2 terminal value/FiO2, hepatitis B surface antigen, hepatitis B core antibody, hepatitis C antibody, serum creatinine, organ recovered outside the contiguous 48 states?
Liver: age, BMI, race/ethnicity, blood type, cause of death, circumstances of death, clinical infection present, cigarette use, cocaine use, other drug use, heavy alcohol consumption, CDC high risk donor, history of diabetes, insulin dependence, DCD, DCD controlled, cardiac arrest after brain death, lung pO2 terminal value/FiO2, hepatitis B surface antigen, hepatitis B core antibody, hepatitis C antibody, organ recovered outside the con-tiguous 48 states?
Intestine: history of diabetes, insulin dependence, dcd, hepatitis b surface antigen.
Heart: age, bmi, gender, race/ethnicity, blood type, cause of death, mechanism of death, clinical infection present, cigarette use, cocaine use, other drug use, cdc high risk donor, history of diabetes, history of hyper-tension, dcd, cardiac arrest after brain death, lung pO2 terminal value/FiO2, hepatitis b surface antigen, hepa-titis b core antibody, hepatitis c antibody, serum creati-nine, organ recovered outside the contiguous 48 states?
Lung: age, BMI, gender, race/ethnicity, blood type, cause of death, circumstances of death, mechanism of death, clinical infection present, cigarette use, cocaine use, other drug use, cdc high risk donor, insulin depen-dence, history of cancer, dcd, cardiac arrest after brain death, lung pO2 terminal value/FiO2, hepatitis B sur-face antigen, hepatitis B core antibody, hepatitis C anti-body, serum creatinine, organ recovered outside the contiguous 48 states?
DOD 3.8 Other organs transplanted per donor (OTPD), by SCD, DCD, & ECD statusOrgans transplanted per donor is the average number of organs transplanted per donor. Organs divided into segments (liver, lung, pancreas, intestine) may account for more than one transplant, so the number transplanted may exceed the number recovered. Based on a count of recovered organs that are transplanted, which differs from the number of transplant operations. Pancreata recovered for islet transplantation are excluded.

176 OPTN & SRTR Annual Data Report 2012
Year
00 02 04 06 08 10 12
Disc
ard
rate
0.0
0.1
0.2
0.3
Total
Kidney
Pancreas
Liver Intestine
Heart Lung
All
Mea
n nu
mbe
r of o
rgan
s di
scar
ded
per d
onor
0.0
0.1
0.2
0.3All organs Other organs
Kidneys0.0
0.1
0.2
0.3
Pancreas Liver Intestine Heart Lung0.0
0.2
0.4
0.6Kidneys
0.06 0.200.09 0.12 0.14 0.17
0.11 0.320.15 0.19 0.21 0.27
organ discards | expanded criteria donors
DOD 4.1 Organ discard rates for organs recovered for transplantation
Organ discard rate is calculated as the differ-ence between the number of organs recovered and the number of organs transplanted, divided by the number of organs recovered. Pancreata recovered for islet transplantation are excluded.
DOD 4.2 Variation in organ discard rates, by DSA, 2012Organ discard rate is calculated as the difference between the number of organs recovered and the number of organs transplanted, divided by the number of organs recovered. Pancreata recovered for islet transplantation are excluded.
DOD 5.1 Variation in the use of ECD donors among deceased donor transplant recipients, 2012, by DSA
ECD donors for patients transplanted (as defined for Figures 3.1–3).
Kidney Liver
deceased organ donation 177
data behind the figures can be downloaded from our website, at srtr.tranplant.hrsa.gov
No txProgram
0.04 0.250.07 0.10 0.15 0.21
11.72 43.1115.91 22.29 28.07 35.44
No txProgram
1.33 6.731.67 2.43 3.62 5.20
No txProgram
0.00 0.090.02 0.03 0.05 0.07
No txProgram
1.26 6.921.69 2.36 4.07 5.87
No txProgram
0.82 5.981.35 1.94 3.09 4.18
donations after cardiac death | waiting time
DOD 6.1 Variation in the use of DCD donors among deceased donor transplant recipients, 2012, by DSA
DCD donors for patients transplanted (as defined for Figures 3.1–3).
DOD 7.1 Variation in time waited (months) among deceased donor transplant recipients, 2012, by DSA
Median time waited among candidates transplanted in 2012. Time to transplant is calculated as months from listing date to transplant date.
Kidney
Lung
Liver
Heart
Kidney Liver

178 OPTN & SRTR Annual Data Report 2012
Cons
ent
not
requ
este
d 36
(0.5
%)
Cons
ent
not
obta
ined
25
(0.3
%)
Org
an n
ot
reco
vere
d 54
6
(7.2
%)
Reco
vere
d,
not f
or
tran
spla
nt
34 (0
.5%
)
Reco
vere
d
for t
x bu
t no
t tx’
ed
1252
(16.
5%)
Tran
s-pl
ante
d 57
20
(75.
1%)
Left
Kidn
ey
2012
: 814
4 do
nors
(162
88 k
idne
ys)
Don
or
age
(7
)
Acut
e/
chro
nic
rena
l fa
ilure
(1
7)
Don
or
qual
ity
(10)
Oth
er
(2)
Emot
iona
l (1
7)
Fam
ily
conf
lict
(2)
Oth
er
(6)
Poor
org
an fu
nctio
n (2
61)
Posit
ive
hepa
titis
(4)
Dise
ased
org
an (3
5)
Anat
omic
al a
bnor
mal
ities
(not
va
lid fo
r PA
or P
A se
gmen
ts) (
8)
No
reci
pien
t loc
ated
(24)
Do
nor m
edic
al h
istor
y (7
1)
Dono
r soc
ial h
istor
y (7
) Bi
opsy
find
ings
(1)
Org
an re
fuse
d by
all
regi
onal
pr
ogra
ms
(14)
Org
an re
fuse
d by
all
natio
nal
prog
ram
s (4
2)
Org
an re
fuse
d by
all
prog
ram
s
with
urg
ent n
eed
(1)
Rule
d ou
t aft
er e
valu
atio
n in
OR
(21)
Ru
led
out d
ue to
bio
psy
(1)
Hem
odyn
amic
ally
uns
tabl
e do
nor (
2)
Trau
ma
to o
rgan
(8)
Tim
e co
nstr
aint
s (2
) M
edic
al e
xam
iner
rest
ricte
d (3
) O
ther
(41)
Reco
vere
d fo
r re
sear
ch
(34)
Dis
card
ed
loca
lly
(805
)
Shar
ed &
di
scar
ded
(266
)
Subm
itted
fo
r res
earc
h (1
81)
Loca
lly
(466
0)
Shar
ed
(106
0)
Unr
epor
ted
(2)
Too
old
on p
ump
(4)
Too
old
on ic
e (1
7)
Vasc
ular
dam
age
(16)
U
rete
ral d
amag
e (3
) Do
nor m
edic
al h
istor
y (7
) Do
nor s
ocia
l hist
ory
(4)
Posit
ive
hepa
titis
(9)
War
m is
chem
ic ti
me
too
long
(14)
O
rgan
trau
ma
(20)
O
rgan
not
as d
escr
ibed
(3)
Biop
sy fi
ndin
gs (4
45)
Reci
pien
t det
erm
ined
to b
e un
suita
ble
for t
x in
OR
(8)
Poor
org
an fu
nctio
n (1
02)
Infe
ctio
n (3
) Di
seas
ed o
rgan
(41)
An
atom
ical
abn
orm
aliti
es (1
06)
No
reci
pien
t loc
ated
; list
ex
haus
ted
(263
) O
ther
(185
)
Righ
t
Repo
rted
en
bloc
: 531
don
ors (
6.5%
) Re
port
ed b
y le
ft/r
ight
: 761
3 do
nors
(93.
5%)
Cons
ent
not
requ
este
d 36
(0.5
%)
Cons
ent
not
obta
ined
25
(0.3
%)
Org
an n
ot
reco
vere
d 57
0
(7.5
%)
Reco
vere
d,
not f
or
tran
spla
nt
38 (0
.5%
)
Reco
vere
d
for t
x bu
t no
t tx’
ed
1327
(17.
4%)
Tran
s-pl
ante
d 56
17
(73.
8%)
Don
or
age
(7
)
Acut
e/
chro
nic
rena
l fa
ilure
(1
7)
Don
or
qual
ity
(10)
Oth
er
(2)
Emot
iona
l (1
7)
Fam
ily
conf
lict
(2)
Oth
er
(6)
Poor
org
an fu
nctio
n (2
58)
Posit
ive
hepa
titis
(4)
Dise
ased
org
an (3
9)
Anat
omic
al a
bnor
mal
ities
(not
va
lid fo
r PA
or P
A se
gmen
ts) (
14)
No
reci
pien
t loc
ated
(23)
Do
nor m
edic
al h
istor
y (7
5)
Dono
r soc
ial h
istor
y (7
) O
rgan
refu
sed
by a
ll re
gion
al
prog
ram
s (1
4)
Org
an re
fuse
d by
all
natio
nal
prog
ram
s (4
4)
Org
an re
fuse
d by
all
prog
ram
s
with
urg
ent n
eed
(1)
Rule
d ou
t aft
er e
valu
atio
n in
OR
(24)
Ru
led
out d
ue to
bio
psy
(1)
Hem
odyn
amic
ally
uns
tabl
e do
nor (
2)
Trau
ma
to o
rgan
(9)
Tim
e co
nstr
aint
s (3
) M
edic
al e
xam
iner
rest
ricte
d (1
) O
ther
(51)
Reco
vere
d fo
r re
sear
ch
(38)
Dis
card
ed
loca
lly
(835
)
Shar
ed &
di
scar
ded
(281
)
Subm
itted
fo
r res
earc
h (2
11)
Loca
lly
(440
6)
Shar
ed
(121
1)
Unr
epor
ted
(1)
Too
old
on p
ump
(4)
Too
old
on ic
e (2
5)
Vasc
ular
dam
age
(20)
U
rete
ral d
amag
e (1
) Do
nor m
edic
al h
istor
y (8
) Do
nor s
ocia
l hist
ory
(6)
Posit
ive
hepa
titis
(6)
War
m is
chem
ic ti
me
too
long
(15)
O
rgan
trau
ma
(22)
O
rgan
not
as d
escr
ibed
(1)
Biop
sy fi
ndin
gs (4
42)
Reci
pien
t det
erm
ined
to b
e un
suita
ble
for t
x in
OR
(4)
Poor
org
an fu
nctio
n (1
12)
Infe
ctio
n (2
) Di
seas
ed o
rgan
(48)
An
atom
ical
abn
orm
aliti
es (1
02)
No
reci
pien
t loc
ated
; list
ex
haus
ted
(307
) O
ther
(201
)
Cons
ent
not
requ
este
d 7
(1.3
%)
Cons
ent
not
obta
ined
5
(0.9
%)
Org
an n
ot
reco
vere
d 89
(1
6.8%
)
Reco
vere
d,
not f
or
tran
spla
nt
12 (2
.3%
)
Reco
vere
d
for t
x bu
t no
t tx’
ed
90 (1
7%)
Tran
s-pl
ante
d 32
8 (6
1.8%
)
Don
or
age
(1
)
Acut
e/
chro
nic
rena
l fa
ilure
(3
)
Don
or
qual
ity
(2)
Oth
er
(1)
Emot
iona
l (3
)
Oth
er
(2)
Poor
org
an fu
nctio
n (2
9)
Posit
ive
hepa
titis
(1)
Dise
ased
org
an (1
2)
Vasc
ular
dam
age
(1)
No
reci
pien
t loc
ated
(7)
Dono
r med
ical
hist
ory
(10)
Do
nor s
ocia
l hist
ory
(1)
Org
an re
fuse
d by
all
natio
nal p
rogr
ams
(12)
Ru
led
out a
fter
eva
luat
ion
in O
R (1
0)
Oth
er (6
)
Reco
vere
d fo
r re
sear
ch
(12)
Dis
card
ed
loca
lly
(59)
Shar
ed &
di
scar
ded
(21)
Subm
itted
fo
r res
earc
h (1
0)
Loca
lly
(181
)
Shar
ed
(146
)
Too
old
on ic
e (4
) Va
scul
ar d
amag
e (3
) Do
nor s
ocia
l hist
ory
(1)
Org
an tr
aum
a (1
) Bi
opsy
find
ings
(19)
Re
cipi
ent d
eter
min
ed to
be
unsu
itabl
e fo
r tx
in O
R (1
) Po
or o
rgan
func
tion
(11)
Di
seas
ed o
rgan
(5)
Anat
omic
al a
bnor
mal
ities
(9)
No
reci
pien
t loc
ated
; list
ex
haus
ted
(18)
O
ther
(18)
Expo
rted
ou
t of U
S,
tran
s-pl
ante
d (1
)
DOD 8.1 organ use: kidney

deceased organ donation 179
data behind the figures can be downloaded from our website, at srtr.tranplant.hrsa.gov
Pancreas 2012: 8144 donors
Poor organ function (1463) Cardiac arrest (79) Infection (3) Positive hepatitis (116) Diseased organ (151) Vascular damage (2) No recipient located (539) Donor medical history (821) Donor social history (74) Biopsy findings (3) Surgical damage in OR (8) No local recovery team (2)
Organ refused by all regional programs (122)
Organ refused by all national programs (988)
Organ refused by all programs with urgent need (4)
Ruled out after evaluation in OR (408) Ruled out due to biopsy (1) Ejection fraction < 50% (1) Hemodynamically unstable donor (98) Trauma to organ (30) + gram stain (1)
Time constraints (95) Medical examiner restricted (16) Replaced/aberrant RHA or CHA
traversing head of PA (valid only for PA and PA segments) (8)
IPDA-SMA junction identified within 5mm from RHA junction (valid only for PA and PA segments) (1)
Other anatomical abnormality (valid only for PA and PA segments) (18)
Other (750)
Organ not recovered
5802 (71.2%)
Trans-planted
1046 (12.8%)
Locally (792)
Shared (250)
Recovered for tx but not tx’ed
372 (4.6%)
Discarded locally (231)
Shared & discarded
(36)
Submitted for
research (79)
Consent not
obtained 187 (2.3%)
Emotional (127)
Family conflict
(12)
Other (43)
Religious beliefs
(2)
Consent not
requested 217 (2.7%)
Donor age (99)
Hx of diabetes mellitus
(15)
Non- heart
beating donor (59)
Donor quality
(17)
Other (26)
Pancrea-titis (1)
Recovered, not for
transplant 520 (6.4%)
Recovered for
research (474)
Recovered for
pancreas islet cells
(33)
Recovered for
technical reasons
(13)
Whole PA/PI,
processed for islets,
not tx'ed or tx unknown
(25)
Islets trans-
planted (4)
Too old on ice (16) Vascular damage (8) Donor medical history (2) Donor social history (3) Warm ischemic time
too long (14)
Organ trauma (11) Organ not as described (11) Biopsy findings (1) Recipient determined to be
unsuitable for tx in OR (9) Poor organ function (27)
Infection (1) Diseased organ (19) Anatomical abnormalities (78) No recipient located; list
exhausted (52) Other (120)
Pancreas sent for
technical reasons
(1)
Cultural beliefs
(3)
DOD 8.2 organ use: pancreas

180 OPTN & SRTR Annual Data Report 2012
Liver 2012: 8144 donors
Poor organ function (147) Cardiac arrest (29) Positive hepatitis (11) Diseased organ (42) Anatomical abnormalities (not
valid for PA or PA segments) (2) Vascular damage (2) No recipient located (70) Donor medical history (43) Donor social history (3) Biopsy findings (86)
Surgical damage in OR (1) Organ refused by all regional
programs (62) Organ refused by all national
programs (34) Organ refused by all programs
with urgent need (5) Ruled out after evaluation in OR (315) Ruled out due to biopsy (40) Hemodynamically unstable donor (61) Trauma to organ (18)
Time constraints (40) Medical examiner restricted (6) Other (124)
Organ not recovered
1141 (14%)
Trans-planted
5942 (73%)
Locally (4470)
Shared (1470)
Exported out of US,
trans-planted
(2)
Recovered for tx but not tx'ed
691 (8.5%)
Discarded locally (461)
Shared & discarded
(45)
Submitted for research
(179)
Consent not
obtained 49 (0.6%)
Emotional (33)
Family conflict
(2)
Other (12)
Cultural beliefs
(2)
Consent not
requested 47 (0.6%)
Donor age (6)
Non- heart
beating donor (13)
Donor quality
(5)
Other (23)
Recovered, not for
transplant 274 (3.4%)
Recovered for
research (269)
Recovered for hepato-
cytes (5)
Sent for hepato-cytes (6)
Too old on ice (9) Vascular damage (6) Donor medical history (6) Warm ischemic time
too long (49) Organ trauma (12)
Organ not as described (2) Biopsy findings (309) Recipient determined to be
unsuitable for tx in OR (23) Poor organ function (22) Infection (1)
Diseased organ (50) Anatomical abnormalities (64) No recipient located; list
exhausted (21) Other (117)
DOD 8.3 organ use: liver

deceased organ donation 181
data behind the figures can be downloaded from our website, at srtr.tranplant.hrsa.gov
Intestine 2012: 8144 donors
Poor organ function (1672) Cardiac arrest (110) Infection (6) Positive hepatitis (121) Positive HIV (1) Diseased organ (33) Anatomical abnormalities (not
valid for PA or PA segments) (3) No recipient located (1054)
Donor medical history (801) Donor social history (66) Biopsy findings (1) Organ refused by all regional
programs (26) Organ refused by all national
programs (2021) Organ refused by all programs
with urgent need (20)
Ruled out after evaluation in OR (27) Ejection fraction < 50% (1) Hemodynamically unstable donor (91) Trauma to organ (28) Time constraints (46) Medical examiner restricted (17) Other (1041)
Organ not recovered
7186 (88.2%)
Trans-planted
106 (1.3%)
Locally (27)
Shared (79)
Recipient deemed unsuitable for transplant in OR (4)
Anatomical abnormalities (1) No recipient located; list
exhausted (2) Other (1)
Recovered for tx but not tx'ed 8 (0.1%)
Discarded locally
(4)
Shared & discarded
(4)
Consent not
obtained 338 (4.2%)
Emotional (234)
Family conflict
(24)
Other (76)
Cultural beliefs
(2)
Religious beliefs
(2)
Consent not
requested 364 (4.5%)
Donor age
(171)
Hx of GI disease
(3)
Non- heart
beating donor (142)
Donor quality
(24)
Other (24)
Recovered, not for
transplant 142 (1.7%)
Recovered for
research (142)
DOD 8.4 organ use: intestine

182 OPTN & SRTR Annual Data Report 2012
Heart 2012: 8144 donors
Poor organ function (1555) Cardiac arrest (165) Infection (6) Positive hepatitis (116) Diseased organ (216) Anatomical abnormalities (not
valid for PA or PA segments) (15) Vascular damage (1) No recipient located (150) Donor medical history (541) Donor social history (42) Biopsy findings (1)
Surgical damage in OR (1) Organ refused by all regional
programs (58) Organ refused by all national
programs (173) Organ refused by all programs
with urgent need (24) Ruled out after evaluation in OR (101) Ejection fraction < 50% (234) Hemodynamically unstable donor (88) Trauma to organ (10) Time constraints (60)
Medical examiner restricted (58) Other (582)
Organ not recovered
4197 (51.5%)
Trans-planted
2421 (29.7%)
Locally (1339)
Shared (1064)
Exported out of US,
trans-planted
(18)
Organ trauma (1) Biopsy findings (1) Recipient determined to be
unsuitable for tx in OR (3) Poor organ function (7)
Infection (3) Diseased organ (3) Anatomical abnormalities (4) Other (6)
Recovered for tx but not tx'ed 28 (0.3%)
Discarded locally
(10)
Shared & discarded
(1)
Submitted for research
(10)
Consent not
obtained 237 (2.9%)
Emotional (168)
Family conflict
(17)
Other (46)
Cultural beliefs
(3)
Religious beliefs
(3)
Consent not
requested 282 (3.5%)
Donor age (58)
Hx of previous cardiac surgery
(9)
Non- heart
beating donor (141)
Donor quality
(31)
Other (29)
Hx of severe cardiac disease
(14)
Recovered, not for
transplant 979 (12%)
Recovered for
research (470)
Recovered for
heart valves (509)
Sent for heart valves
(7)
DOD 8.5 organ use: heart

deceased organ donation 183
data behind the figures can be downloaded from our website, at srtr.tranplant.hrsa.gov
Lung 2012: 8144 donors
Poor organ function (2305) Cardiac arrest (60) Infection (59) Positive hepatitis (114) Diseased organ (183) Anatomical abnormalities (not
valid for PA or PA segments) (3) Vascular damage (2) No recipient located (242) Donor medical history (374) Donor social history (64)
Biopsy findings (4) No local recovery team (1) Organ refused by all regional
programs (88) Organ refused by all national
programs (219) Organ refused by all programs
with urgent need (7) Ruled out after evaluation in OR (259) pO2 < 200 on O2 challenge (453) Hemodynamically unstable donor (80)
Trauma to organ (82) + gram stain (13) Time constraints (109) Medical examiner restricted (51) Other (457)
Organ not recovered
5229 (64.2%)
Trans-planted
1634 (20.1%)
Locally (854)
Shared (767)
Exported out of US,
trans-planted
(13)
Too old on ice (1) Warm ischemic time
too long (1) Organ trauma (3)
Biopsy findings (3) Recipient determined to be
unsuitable for tx in OR (3) Poor organ function (21)
Infection (4) Diseased organ (8) Anatomical abnormalities (14) Other (16)
Recovered for tx but not tx'ed 74 (0.9%)
Discarded locally
(28)
Shared & discarded
(9)
Submitted for research
(37)
Consent not
obtained 232 (2.9%)
Emotional (158)
Family conflict
(15)
Other (57)
Cultural beliefs
(2)
Consent not
requested 213 (2.6%)
Donor age (52)
Hx of previous
lung disease
(14)
Non- heart
beating donor (71)
Donor quality
(41)
Other (35)
Recovered, not for
transplant 762 (9.4%)
Recovered for
research (762)
DOD 8.6 organ use: lung
184 OPTN & SRTR Annual Data Report 2012


![Pancreas chapter, 2012 SRTR & OPTN Annual Data ReportThe pancreas donor risk index [2] steadily decreased over the past decade. The donor-specific components of the pancreas donor](https://img.dokumen.tips/doc/110x75/5f4033f781c9014957733d76/pancreas-chapter-2012-srtr-optn-annual-data-report-the-pancreas-donor-risk.jpg)