Embed Size (px)
Citation preview

Association Rule Mining
ARM
http://www.cs.ndsu.nodak.edu/~rahal/765/lectures/

Lecture Outline Data Mining and Knowledge Discovery Market Basket Research Models Association Rule Mining
Apriori Rule Generation
Methods To Improve Apriori’s Efficiency Vertical Data Representation

What is Data Mining Data mining is the exploration and analysis
of large quantities of data in order to discover valid, novel, potentially useful, and ultimately understandable patterns and knowledge in data. Valid: The patterns hold in general.
Fargo is in Minnesota ! Novel: We did not know the pattern
beforehand. (live in Fargo) (live in ND)
Useful: We can devise actions from the patterns (actionable)
Understandable: We can interpret and comprehend the patterns.
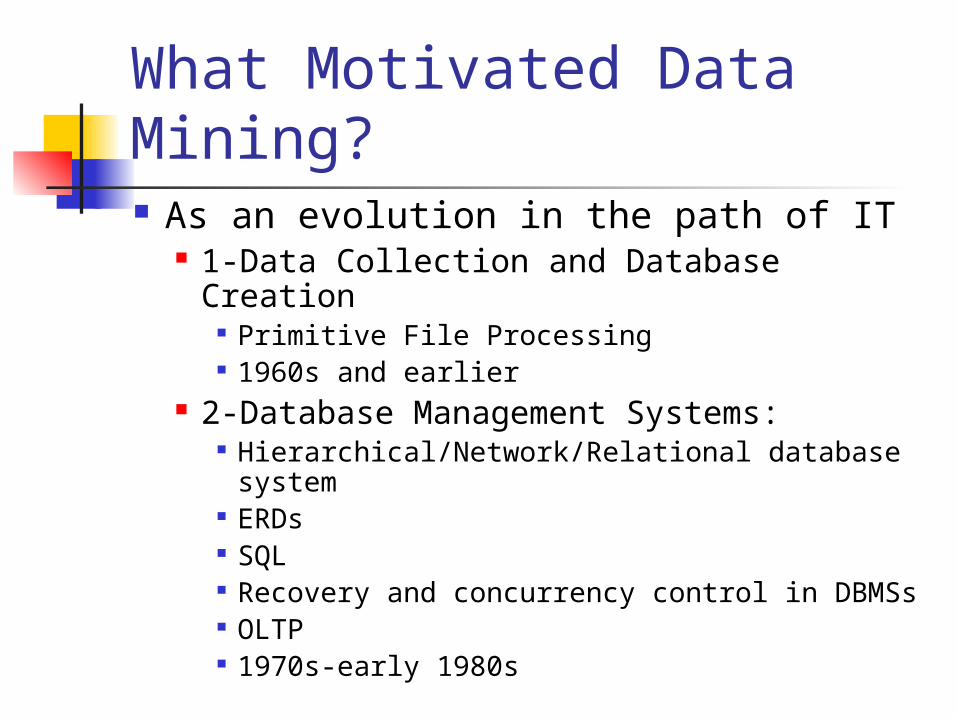
What Motivated Data Mining? As an evolution in the path of IT
1-Data Collection and Database Creation
Primitive File Processing 1960s and earlier
2-Database Management Systems: Hierarchical/Network/Relational database
system ERDs SQL Recovery and concurrency control in DBMSs OLTP 1970s-early 1980s

3.1-Advanced Database Systems Object-oriented/object-relational
databases Application-oriented databases
Spatial, multimedia, scientific, etc … Mid-1980s-present
3.2-Web-based Database Systems XML-based databases systems Web analysis and mining Semantic Web (the whole web as a single
XML database) Mid-1990s-present

3.3-Data Warehousing and Data Mining Multi-dimensional Data warehouse
and OLAP technology Data Mining and Knowledge
Discovery tools to assist people in their decision-
making processes Late 1980s-present

Why Use Data Mining Today?
Market Competition Pressure! “The secret of success is to know something
that nobody else knows.” Aristotle Wal-Mart VS K-Mart
Right products, right place, right time, and right quantities
Personalization, CRM Security, homeland defense Analysis of important application data
Bioinformatics Stock market data

Human analysis skills are inadequate: Volume and dimensionality of the data High data growth rate
Storage Computational power Off-the-shelf software Other factors

Where Could All Of This Data Be Coming From? Supermarket scanners Preferred customer cards
Sunmart’s MoreCards Credit card transactions Call center records ATM machines Demographic data Sensor networks Cameras Web server logs Customer web site trails Biological data (e.g. MicroArray Experiments
for expression levels) Image data

Types Of Data/Information Repositories For Data Mining By definition, data mining should be
applicable to any kind of information repository
Flat files Relational databases data warehouses transactional databases Advanced database systems
object-oriented Object-relational

Application-oriented databases Multimedia
Text Image Video Audio
Heterogeneous databases Appear as centralized Independent components managing
different parts of the data

How Could We Describe Data
Numerical : Domain is ordered and can be represented on the continuous real line (e.g. age, income) Continuous?
Nominal or categorical : Domain is a finite set without any natural ordering (e.g. occupation, marital status, race)
Ordinal : Domain is finite and ordered, (e.g.: grade scale, months in a year)

The Knowledge Discovery Process Broader than Data Mining Steps:
Identify the problem Data mining Action Evaluation and measurement Deployment and integration into
real-life processes and/or applications

The Data Mining Step in More Detail Cleaning and integration of various data sources
Remove noise and outliers Missing Values (e.g. null values) Noisy data (errors) Inconsistent Data (integration)
FirstName and F_Name Selection and transformation of relevant data into
appropriate forms Focus on fields of interest
Education on salary Create common units
Height in cm and inches Generate new fields
Discovery of interesting patterns from the data Pattern evaluation to identify the interesting patterns
based on some predefined measures Knowledge presentation to communicate the mined
knowledge and information to the user mostly through visualization techniques to provide a better view

This process can be repeated as needed Data mining systems are expected to
handle large amounts of data Analysis of small datasets is sometimes
called machine learning SDA – Statistical data analysis.
In other words, data mining must be scalable to large data sets Scalability and efficiency

Data Mining
Original Data
TargetData
PreprocessedData
PatternsKnowledge
Cleaning and integration
Selection and transformation
Discovery
Pattern evaluation
Knowledge
presentation

Data Mining Tasks Characterization
the process of summarizing the general characteristics and features of a specific class of data (usually referred to as the target class)
Characterizing the items in a store whose sales have decreased by 50% over a certain period of time.
There maybe some common characteristics to all those items which we would like to uncover.
Produced by a no-longer trusted producer

Discrimination Discrimination is very similar to
characterization in that it reveals the characteristics of a target class in comparison to those characteristics pertaining to one or more other classes.
The target and contrasting classes are specified by user and their data is retrieved from the database before the discrimination process starts.
As an example, a user might want to discriminate between the characteristics of the items in a store whose
sales have increased by 10% over a certain period of time this year
sales have increased by 10% over the same period of time last year.

Association Rule Mining The process of discovering association rules
among attribute values that exist in a given set of data.
Market basket research (MBR) where users are usually interested in mining associations between items in a store by using daily transactions.
An example of a rule might be diapersbeer meaning that customers buying diapers are very likely to buy beer.
This will give us a good pointer to place diapers next to beer so as to increase sales
sometimes people wonder about the strange placement of products in large stores
Maternity to infant

Classification The process of using a set of training data with known
class labels to come up with a model (or function) that predicts the unknown class label of new samples.
An example of classification can be found in the banking industry
customer characteristics like age, annual income, marital status, etc are used to predict the possibility of approving loan applications (the loan status is the class label).
In an initial step, a dataset containing a certain number of customers with known class labels is used to create a classifier which can then be used to predict the class label of a new application
ANN Classification is very similar to regression except that
the later is applicable to numerical data while the former is applicable to categorical and numerical data.

Clustering The is process of grouping data objects into
clusters such that intra-cluster similarity is maximized inter-cluster similarity is minimized.
In other words, objects within the same clusters are very similar and objects in different clusters are not.
E.g. studying collective properties of people at different income levels
Cluster people based on incomes Study common properties within clusters
Lower income related to lower education


Outlier detection Through clustering, we can find groups of
objects that behave similarly sometimes, we are only interested in those
objects that lie scattered around without behaving similarly to any pattern existing in the data.
Those objects are known as outliers as they do not adhere to the patterns defined by the rest of the objects in the dataset.
Outlier detection is usually desired in applications where abnormal behavior is
of interest such as intrusion detection in networks or terrorist detection in ports of entry
not of interest, such as when we clean a dataset from noise

Core
Border
Outlier
Eps = 1cm
MinPts = 5Core
Border
Outlier
Eps = 1cm
MinPts = 5
Similarity searches given a database of objects, and a
“query” object, find all similar objects (neighbours) Google search
Given a query which a small document
Find all similar documents
Ranked order them

Final Notes on Data Mining
Forms the center of a set of research fields and applications dealing with data analysis: databases, statistics, machine learning,
artificial intelligence, information sciences/technology and the like
at the same time introduces a lot of new features rendering itself as a separate science.
scalability to large datasets

Not all types of patterns mined by data mining systems are interesting. Subjective and objective interesting
measures.

Market Basket Research We will mainly use the Market Basket
Research (MBR) application in our ARM description
A large set of items, e.g. products sold in a supermarket.
A large set of transactions or baskets, each of which contains a small set of the items (called an itemset) bought by a customer during a single visit to a store.

The Set Model Data is organized as a "TRANSACTION
TABLE" with 2 attributes: TT(Tid, Itemset)
A transaction is a customer transaction at a cash register.
Each customer is given an identifier, Tid, for every transaction made
Itemset is the set of items in the customer's "basket".
Note that tuples in TT are not "flat" (each itemset is a "set")
i.e. not relational (why?) a transformation can be made to equivalent
but normalized models 10 c d e9 b d e8 b c e7 b c d6 a d e 5 a c e4 a c d3 a b e2 a b d1 a b c TID Atts

The Normalized Set Model Data is organized as a
“NORMALIZED TRANSACTION TABLE" with 2 attributes: NTT(Tid,Iid)
An itemset is the group of items belonging to the same transaction
The TT(Tid, ItemSet) can be "transformed" to NTT(Tid, Iid) and vice versa
Could be stored in a database Very deep (10 to 30 tuples)
TID IID
1 a
1 b
1 c
2 a
2 b
2 d
3 a
3 b
3 e
4 a
4 c
4 d
5 a
5 c
5 e
6 a
6 d
6 e
7 b
7 c
7 d
8 b
8 c
8 e
9 b
9 d
9 e
10 c
10 d
10 e

The Boolean Model: "Boolean Transaction Table“: BTT(Tid, Item-1, Item-2,... Item-
n) Tid is a transaction identifier Each column is a particular
Item (1 column for each item) a 1 if item is in the basket a 0 if item is not in the basket
TT, NTT and BTT are equivalent This is the model mostly chosen
for ARM
TID a b c d e
1 1 1 1 0 0
2 1 1 0 1 0
3 1 1 0 0 1
4 1 0 1 1 0
5 1 0 1 0 1
6 1 0 0 1 1
7 0 1 1 1 0
8 0 1 1 0 1
9 0 1 0 1 1
10 0 0 1 1 1

Association Rule Mining Association Rule Mining (ARM) finds
interesting associations and/or correlation relationships among large sets of data items.
Association rules provide information in the form of "if-then" statements.
These rules are computed from the data unlike the if-then rules of logic, association
rules are probabilistic in nature strength could be measured

An association rule defines a relationship of the form: A C (if A then C) Read as A implies C, where A and C
are sets of items in a data set. A called antecedent and C the
consequent Given DB, ARM finds all the ARs

D = A data set comprising n records (transactions) and m Boolean valued attributes (BTT model)
I = The set of m attributes, {i1,i2, … ,im}, represented in D.
Itemset = Some subset of I. Each record in D is an itemset
For all rules AC: AI, CI, and AC= (A and C are disjoint).

An Example DB
Items = 5 I = {a,b,c,d,e}
Transactions = 10 D = {{a,b,c}, {a,b,d},
{a,b,e}, {a,c,d}, {a,c,e}, {a,d,e}, {b,c,d}, {b,c,e}, {b,d,e}, {c,d,e}}
10 c d e9 b d e8 b c e7 b c d6 a d e 5 a c e4 a c d3 a b e2 a b d1 a b c TID Atts
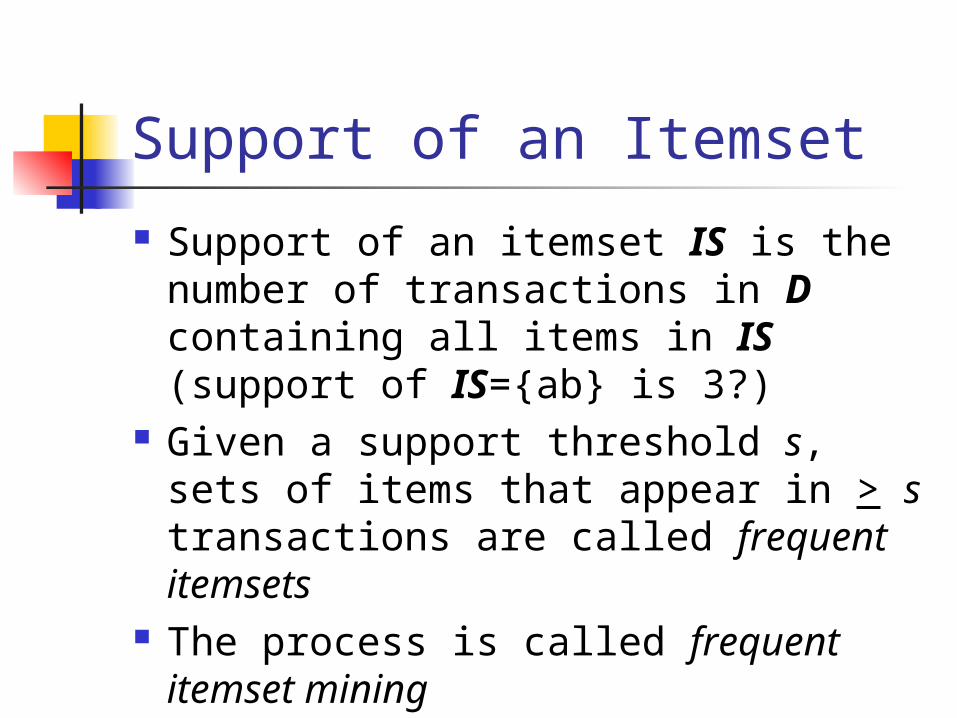
Support of an Itemset
Support of an itemset IS is the number of transactions in D containing all items in IS (support of IS={ab} is 3?)
Given a support threshold s, sets of items that appear in > s transactions are called frequent itemsets
The process is called frequent itemset mining

Items={m=milk, c=cheese, p=pepsi, b=bread, j=juice}.
Support threshold = 3 transactions.
T1 = {m, c, b} T2 = {m, p, j}T3 = {m, b} T4 = {c, j}T5 = {m, p, b} T6 = {m, c, b, j}T7 = {c, b, j} T8 = {b, c}
Frequent itemsets: {m}, {c}, {b}, {j}, {m, b}, {c, b}, {j, c}.
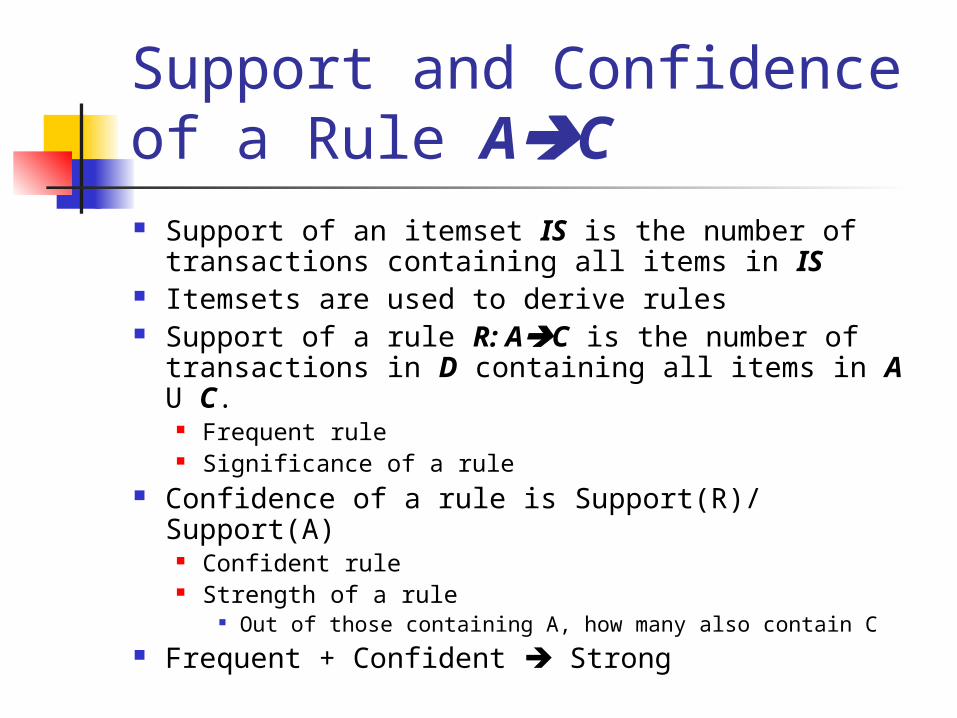
Support and Confidence of a Rule AC Support of an itemset IS is the number of
transactions containing all items in IS Itemsets are used to derive rules Support of a rule R: AC is the number of
transactions in D containing all items in A U C. Frequent rule Significance of a rule
Confidence of a rule is Support(R)/ Support(A) Confident rule Strength of a rule
Out of those containing A, how many also contain C Frequent + Confident Strong

ExampleB1 = {m, c, b} B2 = {m, p, j}B3 = {m, b} B4 = {c, j}B5 = {m, p, b} B6 = {m, c, b, j}B7 = {c, b, j} B8 = {b, c}
An association rule: {m, b} c. What is the confidence?
support(m, b, c) = 2 Support(m, b) = 4 Confidence = 2/4 = 50%.
And so what does that mean? 50% that contain {m, b} also contain c
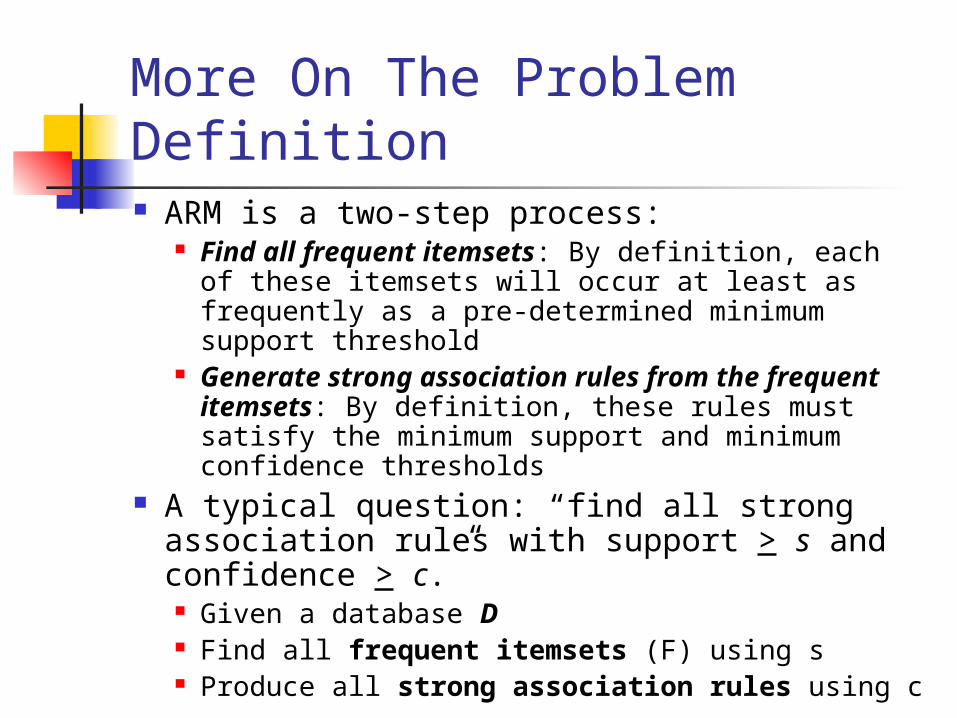
More On The Problem Definition ARM is a two-step process:
Find all frequent itemsets: By definition, each of these itemsets will occur at least as frequently as a pre-determined minimum support threshold
Generate strong association rules from the frequent itemsets: By definition, these rules must satisfy the minimum support and minimum confidence thresholds
A typical question: “find all strong association rules with support > s and confidence > c.” Given a database D Find all frequent itemsets (F) using s Produce all strong association rules using c

Finding F is the most computationally expensive part, once we have the frequent sets generating ARs is straight forward
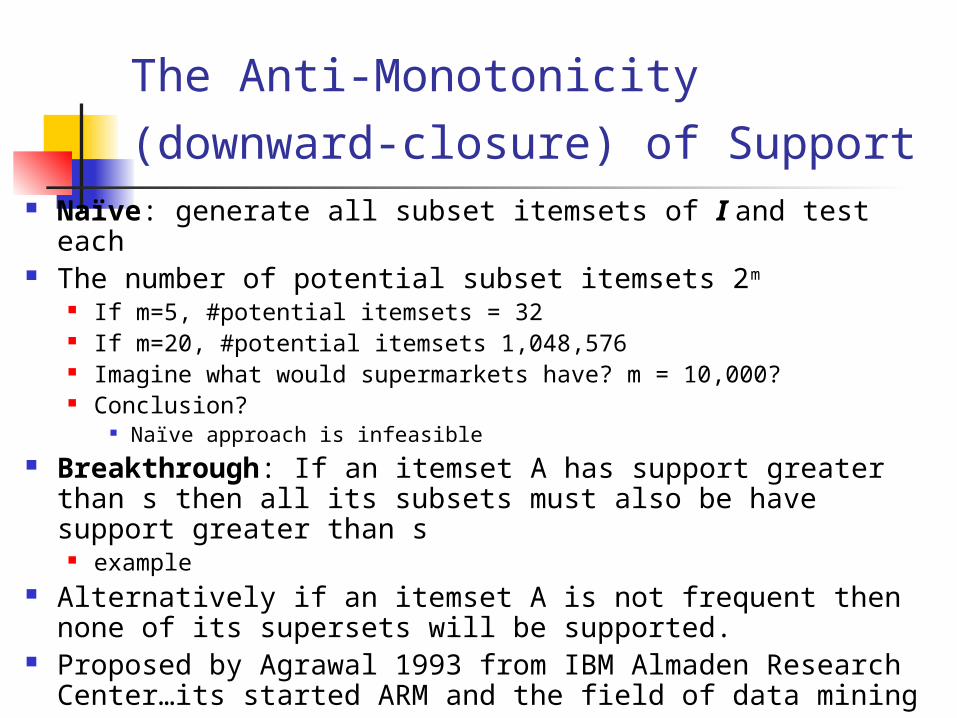
The Anti-Monotonicity (downward-
closure) of Support Naïve: generate all subset itemsets of I and test each The number of potential subset itemsets 2m
If m=5, #potential itemsets = 32 If m=20, #potential itemsets 1,048,576 Imagine what would supermarkets have? m = 10,000? Conclusion?
Naïve approach is infeasible Breakthrough: If an itemset A has support greater than s
then all its subsets must also be have support greater than s
example Alternatively if an itemset A is not frequent then none of
its supersets will be supported. Proposed by Agrawal 1993 from IBM Almaden Research
Center…its started ARM and the field of data mining

Apriori Proposed by Agrawal Apriori
Uses the downward-closure of support to reduce the number of itemsets that need to be counted (called candidate frequent itemsets C)
Works on a level-by-level basis (i.e. uses frequent itemsets L from the previous to generate frequent itemsets at this level)
Ck and Lk
At every level k generates Ck from Lk-1and counts their frequency in the database
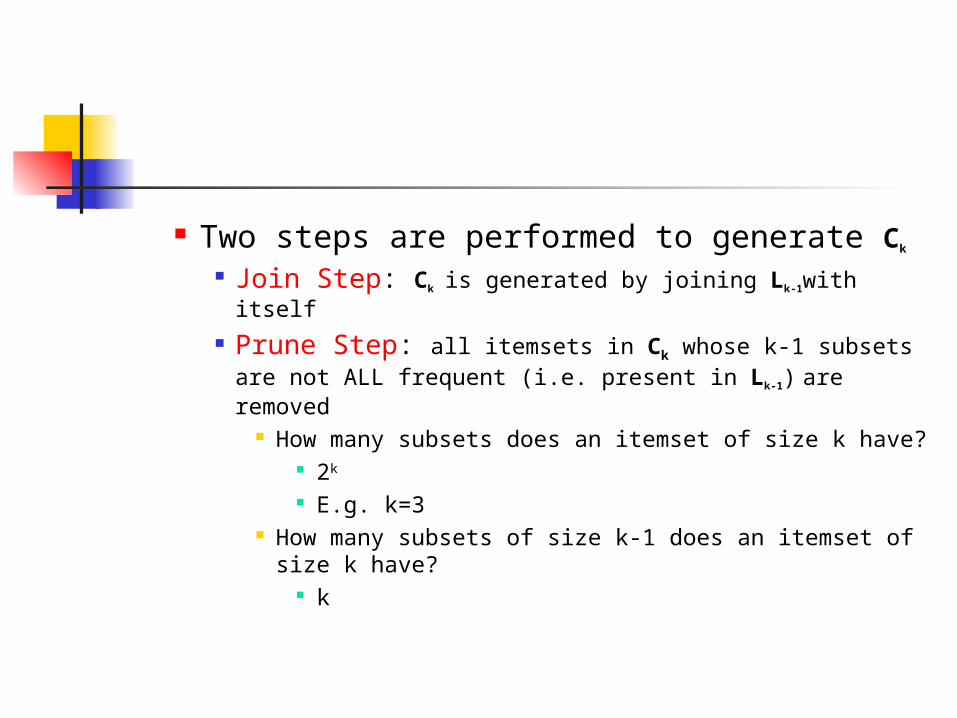
Two steps are performed to generate Ck
Join Step: Ck is generated by joining Lk-1with itself
Prune Step: all itemsets in Ck whose k-1 subsets are not ALL frequent (i.e. present in Lk-1) are removed
How many subsets does an itemset of size k have?
2k
E.g. k=3 How many subsets of size k-1 does an itemset of
size k have? k

The Apriori Algorithm Pseudo-code:
Ck: Candidate frequent itemset of size kLk : frequent itemset of size k
L1 = {frequent items};for (k = 1; Lk !=; k++) do begin
Ck+1 = candidates generated from Lk;Remove any itemset from Ck+1 that has at least
one infrequent k subsetfor each transaction t in database do
increment the counts of all candidates in Ck+1 that are contained in t (count the frequency of each itemset in Ck+1)
Lk+1 = candidates in Ck+1 with min_supportend
return k Lk;

Example of Generating Candidates
Suppose the items in all itemsets are listed in some order
L3={abc, abd, acd, ace, bcd}
Self-joining: L3*L3
Combine any two itemsets in Lk if they only differ by the last item
abcd from abc and abd
acde from acd and ace
C4 = {abcd , acde}
Pruning:
abcd: abc, abd, acd, bcd
acde: acd, ace, ade, cde
C4={abcd}

How To Generate Candidates? Lk Ck+1
Step 1: self-joining Lk insert into Ck+1
select p.item1, p.item2, …, p.itemk, q.itemk
from Lk p, Lk q
where p.item1=q.item1, …, p.itemk-1=q.itemk-1, p.itemk
< q.itemk
Step 2: pruningforall itemsets c in Ck+1 do
forall k-subsets s of c do
if (s is not in Lk) then delete c from Ck+1

An Example – Support 2
TID Items100 1 3 4200 2 3 5300 1 2 3 5400 2 5
Database D
Scan D
itemset sup.{1} 2{2} 3{3} 3{4} 1{5} 3
C1
C2 itemset sup{1 2} 1{1 3} 2{1 5} 1{2 3} 2{2 5} 3{3 5} 2
Scan D
itemset{1 2}{1 3}{1 5}{2 3}{2 5}{3 5}
C2
L3Scan D itemset sup{2 3 5} 2
C3 itemset{2 3 5}
itemset sup.{1} 2{2} 3{3} 3{5} 3
L1
itemset sup{1 3} 2{2 3} 2{2 5} 3{3 5} 2
L2

Generation of Association Rules Given all frequent itemsets Every frequent itemset I of size > 2 is
divided into a candidate head Y and a body X such that X intersection Y = {}. This process starts with Y = {}, resulting in the
rule I {} always holds with 100% confidence (why?)
After that, the algorithm iteratively generates candidate heads of size k + 1, starting with k = 0

Is Apriori Fast Enough? Performance Bottlenecks
The core of the Apriori algorithm: Uses frequent (k – 1)-itemsets to generate candidate frequent
k-itemsets Uses databases scan to collect counts for the candidate
itemset – 1 scan per level The bottleneck of Apriori: candidate generation
Huge candidate sets: 104 frequent 1-itemset will generate 107 candidate 2-
itemsets To discover a frequent pattern of size 100, e.g., {a1, a2, …,
a100}, one needs to generate 2100 1030 candidates. Multiple scans of database:
Needs n scans, n is the length of the longest pattern One scan per level

Improving Apriori Transaction reduction
Reducing the number of transactions scanned in future iterations
A transaction that does not contain any frequent k-itemsets cannot contain any frequent (k+1)-itemsets.
E.g. Frequent 1 itemsets {1, 3, 5} Trans = {2,4}
As a result, we need not consider it further for subsequent scans of D for l-itemsets where l>k.
Saves on scanning times

Partitioning Using this approach we only need two
database scans to generate all frequent itemsets
Good when original DB can’t fit in memory First, we divided D, into n non-overlapping
partitions such that each can easily fits into memory.
The minimum support threshold (referred to local support threshold) for itemsets in each partition is minsuppxN/|D| (where N is the number of transactions in that partition).
For each partition, all frequent itemsets within that partition are found. These are called local frequent itemsets.

For each itemset, we record tids of the transactions containing the items in the itemset. As a result, we could find the local frequent itemsets in just one database scan.
Local frequent itemsets may not be frequent with respect to the entire
database, D; however, any frequent itemset in D must occur
as a local frequent itemset in at least one partition
Therefore we could use the local frequent itemsets as candidates with respect to D.

Second, we scan D to get the support of all candidate itemsets (which have already been generated using the partitions).
Partition size and number of partitions are set so that each partition can fit into main memory and therefore be read only once in each phase.
Good when original DB can’t fit in memory

Sampling This is statistical-based approach the principle that since we can not deal with
the whole population, we can get a representative sample (usually random) whose size is much smaller than the population and work with that.
The accuracy of approaches used this idea depends on how “representative” the chosen sample is.
In short, we select a sample S form D and generate all frequent itemsets in S usually using a lower support threshold than minsupp.
Some approaches that follow this idea claim that they can mine all rules using samples.

Tries Another data structure that is commonly used
is a trie (or prefix-tree). The first approach to ever use tries in ARM is
Frequent Pattern Growth (FPGrowth) by Han et al.
The idea here is to view each transaction as an ordered string of items.
The idea is compress by maximizing overlap between transactions
Every k-itemset is attached to its k - 1-prefix. Every node stores the last item in the itemset it represents, its support, and its branches


Vertical Data Representation
Each item, I, is represented by a bit
vector, VI
The support of an item is the count
of 1s in its vector
The support of an itemset {a,b} is
the count of 1s in Va & Vb

TID Items100 1 3 4200 2 3 5300 1 2 3 5400 2 5
TT Layout
An Example
BTT LayoutTID 1 2 3 4 5100 1 0 1 1 0200 0 1 1 0 1300 1 1 1 0 1400 0 1 0 0 1
Binary Vertical (BV) Layout DTID 1 2 3 4 5100 1 0 1 1 0200 0 1 1 0 1300 1 1 1 0 1400 0 1 0 0 1

Support(3) = 3 Support (3,5) = 2 Support (1,3,5) = 1 Just ANDing operations Could be optimized by
compression through P-trees Saves time
Database D
TID 1 2 3 4 5
100 1 0 1 1 0
200 0 1 1 0 1
300 1 1 1 0 1
400 0 1 0 0 1

References - 2000 R. Agarwal, C. Aggarwal, and V. V. V. Prasad. A tree projection algorithm for generation of
frequent itemsets. In Journal of Parallel and Distributed Computing (Special Issue on High Performance Data Mining), 2000.
R. Agrawal, T. Imielinski, and A. Swami. Mining association rules between sets of items in large databases. SIGMOD'93, 207-216, Washington, D.C.
R. Agrawal and R. Srikant. Fast algorithms for mining association rules. VLDB'94 487-499, Santiago, Chile.
R. Agrawal and R. Srikant. Mining sequential patterns. ICDE'95, 3-14, Taipei, Taiwan. R. J. Bayardo. Efficiently mining long patterns from databases. SIGMOD'98, 85-93, Seattle,
Washington. S. Brin, R. Motwani, and C. Silverstein. Beyond market basket: Generalizing association rules to
correlations. SIGMOD'97, 265-276, Tucson, Arizona. S. Brin, R. Motwani, J. D. Ullman, and S. Tsur. Dynamic itemset counting and implication rules for
market basket analysis. SIGMOD'97, 255-264, Tucson, Arizona, May 1997. K. Beyer and R. Ramakrishnan. Bottom-up computation of sparse and iceberg cubes.
SIGMOD'99, 359-370, Philadelphia, PA, June 1999. D.W. Cheung, J. Han, V. Ng, and C.Y. Wong. Maintenance of discovered association rules in large
databases: An incremental updating technique. ICDE'96, 106-114, New Orleans, LA. M. Fang, N. Shivakumar, H. Garcia-Molina, R. Motwani, and J. D. Ullman. Computing iceberg
queries efficiently. VLDB'98, 299-310, New York, NY, Aug. 1998.

References (2) G. Grahne, L. Lakshmanan, and X. Wang. Efficient mining of constrained correlated sets.
ICDE'00, 512-521, San Diego, CA, Feb. 2000. Y. Fu and J. Han. Meta-rule-guided mining of association rules in relational databases.
KDOOD'95, 39-46, Singapore, Dec. 1995. T. Fukuda, Y. Morimoto, S. Morishita, and T. Tokuyama. Data mining using two-dimensional
optimized association rules: Scheme, algorithms, and visualization. SIGMOD'96, 13-23, Montreal, Canada.
E.-H. Han, G. Karypis, and V. Kumar. Scalable parallel data mining for association rules. SIGMOD'97, 277-288, Tucson, Arizona.
J. Han, G. Dong, and Y. Yin. Efficient mining of partial periodic patterns in time series database. ICDE'99, Sydney, Australia.
J. Han and Y. Fu. Discovery of multiple-level association rules from large databases. VLDB'95, 420-431, Zurich, Switzerland.
J. Han, J. Pei, and Y. Yin. Mining frequent patterns without candidate generation. SIGMOD'00, 1-12, Dallas, TX, May 2000.
T. Imielinski and H. Mannila. A database perspective on knowledge discovery. Communications of ACM, 39:58-64, 1996.
M. Kamber, J. Han, and J. Y. Chiang. Metarule-guided mining of multi-dimensional association rules using data cubes. KDD'97, 207-210, Newport Beach, California.
M. Klemettinen, H. Mannila, P. Ronkainen, H. Toivonen, and A.I. Verkamo. Finding interesting rules from large sets of discovered association rules. CIKM'94, 401-408, Gaithersburg, Maryland.

References (3) F. Korn, A. Labrinidis, Y. Kotidis, and C. Faloutsos. Ratio rules: A new paradigm for fast,
quantifiable data mining. VLDB'98, 582-593, New York, NY. B. Lent, A. Swami, and J. Widom. Clustering association rules. ICDE'97, 220-231,
Birmingham, England. H. Lu, J. Han, and L. Feng. Stock movement and n-dimensional inter-transaction association
rules. SIGMOD Workshop on Research Issues on Data Mining and Knowledge Discovery (DMKD'98), 12:1-12:7, Seattle, Washington.
H. Mannila, H. Toivonen, and A. I. Verkamo. Efficient algorithms for discovering association rules. KDD'94, 181-192, Seattle, WA, July 1994.
H. Mannila, H Toivonen, and A. I. Verkamo. Discovery of frequent episodes in event sequences. Data Mining and Knowledge Discovery, 1:259-289, 1997.
R. Meo, G. Psaila, and S. Ceri. A new SQL-like operator for mining association rules. VLDB'96, 122-133, Bombay, India.
R.J. Miller and Y. Yang. Association rules over interval data. SIGMOD'97, 452-461, Tucson, Arizona.
R. Ng, L. V. S. Lakshmanan, J. Han, and A. Pang. Exploratory mining and pruning optimizations of constrained associations rules. SIGMOD'98, 13-24, Seattle, Washington.
N. Pasquier, Y. Bastide, R. Taouil, and L. Lakhal. Discovering frequent closed itemsets for association rules. ICDT'99, 398-416, Jerusalem, Israel, Jan. 1999.

References (4) J.S. Park, M.S. Chen, and P.S. Yu. An effective hash-based algorithm for mining association rules.
SIGMOD'95, 175-186, San Jose, CA, May 1995. J. Pei, J. Han, and R. Mao. CLOSET: An Efficient Algorithm for Mining Frequent Closed Itemsets.
DMKD'00, Dallas, TX, 11-20, May 2000. J. Pei and J. Han. Can We Push More Constraints into Frequent Pattern Mining? KDD'00. Boston,
MA. Aug. 2000. G. Piatetsky-Shapiro. Discovery, analysis, and presentation of strong rules. In G. Piatetsky-
Shapiro and W. J. Frawley, editors, Knowledge Discovery in Databases, 229-238. AAAI/MIT Press, 1991.
B. Ozden, S. Ramaswamy, and A. Silberschatz. Cyclic association rules. ICDE'98, 412-421, Orlando, FL.
J.S. Park, M.S. Chen, and P.S. Yu. An effective hash-based algorithm for mining association rules. SIGMOD'95, 175-186, San Jose, CA.
S. Ramaswamy, S. Mahajan, and A. Silberschatz. On the discovery of interesting patterns in association rules. VLDB'98, 368-379, New York, NY..
S. Sarawagi, S. Thomas, and R. Agrawal. Integrating association rule mining with relational database systems: Alternatives and implications. SIGMOD'98, 343-354, Seattle, WA.
A. Savasere, E. Omiecinski, and S. Navathe. An efficient algorithm for mining association rules in large databases. VLDB'95, 432-443, Zurich, Switzerland.
A. Savasere, E. Omiecinski, and S. Navathe. Mining for strong negative associations in a large database of customer transactions. ICDE'98, 494-502, Orlando, FL, Feb. 1998.

References (5) C. Silverstein, S. Brin, R. Motwani, and J. Ullman. Scalable techniques for mining causal
structures. VLDB'98, 594-605, New York, NY. R. Srikant and R. Agrawal. Mining generalized association rules. VLDB'95, 407-419,
Zurich, Switzerland, Sept. 1995. R. Srikant and R. Agrawal. Mining quantitative association rules in large relational tables.
SIGMOD'96, 1-12, Montreal, Canada. R. Srikant, Q. Vu, and R. Agrawal. Mining association rules with item constraints.
KDD'97, 67-73, Newport Beach, California. H. Toivonen. Sampling large databases for association rules. VLDB'96, 134-145,
Bombay, India, Sept. 1996. D. Tsur, J. D. Ullman, S. Abitboul, C. Clifton, R. Motwani, and S. Nestorov. Query flocks:
A generalization of association-rule mining. SIGMOD'98, 1-12, Seattle, Washington. K. Yoda, T. Fukuda, Y. Morimoto, S. Morishita, and T. Tokuyama. Computing optimized
rectilinear regions for association rules. KDD'97, 96-103, Newport Beach, CA, Aug. 1997. M. J. Zaki, S. Parthasarathy, M. Ogihara, and W. Li. Parallel algorithm for discovery of
association rules. Data Mining and Knowledge Discovery, 1:343-374, 1997. M. Zaki. Generating Non-Redundant Association Rules. KDD'00. Boston, MA. Aug.
2000. O. R. Zaiane, J. Han, and H. Zhu. Mining Recurrent Items in Multimedia with Progressive
Resolution Refinement. ICDE'00, 461-470, San Diego, CA, Feb. 2000.

Questions ?
Thank you !!!Thank you !!!