Embed Size (px)
Citation preview
© Oliver Wyman LON-FSP22401-197
Asset Quality Review and Stress Test: Recent Experiences and Potential Implications for the MENA RegionDubai, 7th May 2014

1© Oliver Wyman LON-FSP22401-197 1
Agenda
1. AQR and stress test: setting a new standard for banking supervision
2. Applying the new methodologies to the prevailing context in MENA region: potential scenarios….
3. … And implications for MENA Banks
4. Concluding remarks

AQR and stress test: setting a new standard for banking supervision
1

3© Oliver Wyman LON-FSP22401-197 3
Since the start of the Eurozone crisis a number of AQRs and stress tests have been carried out in Europe with relevant impact on the Banks
Ireland – ‘10
• Economy: ~2% GDP EU• Asset Quality
Review• Credit Loss Projections• Loss Absorption
Capacity
Capital shortfall ~€24mld
Portugal – ’11
• Economy: ~2% GDP EU• Asset Quality
Review• Credit Loss Projections• Loss Absorption Capacity
Capital shortfall ~€7mld
Greece – ’11
• Economy: ~2% GDP EU• Asset Quality
Review• Credit Loss Projections• Loss Absorption Capacity
Capital shortfall ~€50mld
Cyprus – ’12
• Economy: ~0.2% GDP EU• Asset Quality
Review• Credit Loss
Projections• Loss Absorption Capacity
Capital shortfall ~€6mld
Slovenia – ’13
• Economy: ~0.4 % GDP EU
Capital shortfall ~€4.8mld
Spain – ‘12
• Economy: ~12% GDP EU
• Asset Quality Review
• Credit Loss Projections• Loss Absorption
Capacity
Capital shortfall~€60mld

44© Oliver Wyman LON-FSP22401-197
A new, Eurozone-wide Asset Quality Review and stress test has recently been undertaken by ECB
European Baking Union outlook Three Pillars of the European Banking Union and the Comprehensive Assessment
• Pillar 1: ECB will keep direct responsibility for the largest banks, but will have power to deal with small banksi f necessary (SSM)
• Pillar 2: Common resolution fund & mechanisms for failing banks
• Pillar 3: Common deposit- insurance schemet o prevent bank runs
• ECB - in close cooperation with the National Competent Authorities (NCAs) – started a “Comprehensive Assessment (CA)” of the 128 most relevant European Banks , covering around 85% of total assets of the banking system as a preparatory phase of the SSM set upTurkey
Georgia
Armenia
Austria Hungary
Czech
Serbia
Croatia
Finland
Italy
Spain
Sweden
Norway
Germany
France
Portugal
Romania
Bulgaria
Denmark
PolandBelarus
UkraineSlovakia
Greece
Neth.
Belgium
Ireland
Albania
Moldova
Lithuania
Latvia
Estonia
Lux.
Montenegro
Bosnia
Slovenia
Switz.
Macedonia
Uk
Iceland
Eurozone EU members not using Euro Non EU members EU Candidate countries

55© Oliver Wyman LON-FSP22401-197
Comprehensive Assessment is made up of 3 elements, the Asset Quality Review, is the one currently ongoing
Comprehensive assessment
1 Risk Assessment RAS)• Supervisory judgements on key risk factors,
such as liquidity, leverage and funding• Quantitative and qualitative analysis
2 Asset Quality Review (AQR)• Assessment of data quality, asset valuations,
classifications of non-performing exposures, collateral valuation and provisions
• Covering credit and market exposures, following a risk-based, targeted approach
3Stress Test (ST)• Forward-looking view of banks’ shock-
absorption capacity under stress• Conducted in collaboration with the European
Banking Authority
Goals of the Comprehensive Assessment• Transparency - enhancing the quality of
information available on the condition of banks
• Repair - identifying and implementing any necessary corrective actions
• Confidence building – assuring all stakeholders that banks are fundamentally sound and trustworthy

6© Oliver Wyman LON-FSP22401-197 6
The exercise has started in October 2013 and will be completed by November 2014, when there will be the transfer of power to the SSM
2013 2014
Nov Dec Jan Feb Mar Apr May Jun Jul Aug Sept Oct Nov Dec
Supervisory Risk
Assessment
Asset Quality Review
Stress Test
Start SSM
Com
preh
ensi
ve A
sses
smen
t
End of the Comprehensive Assessment exercise, publication of results and start of
corrective actionsLive activities On-site exerciseData collection
Illustrative timeline

7© Oliver Wyman LON-FSP22401-197 7
Asset Quality Review (AQR) and Stress Test (ST) parts of the exercises follow different, but complementary objectives
• Definition: an asset quality review considers the key attributes of the different asset portfolios of the bank to evaluate the “quality” of a bank’s assets
– Loan tape provides an overall characterisation of each portfolio
– Individual file review allows to get an on-the-ground understanding of the real portfolio quality
– Supplemented by independent real estate appraisals of top and random real estate collaterals by specialist firms
• Objective: for each portfolio the objective is to
– Understand portfolio asset mix and quality
– Assess need for adjustments to categorisation
– AQR outputs will serve as the basis for following stress tests
• Main elements:
Data completeness and reconciliation
Data Integrity Verification (DIV)
Individual loan file review
Real estate collateral review
Loss forecasting
Loss absorption capacity
Capital needs (under the specified scenario)
Asset Quality Review (AQR) Stress Testing (ST)
• Definition: a stress test quantifies and projects future losses under a baseline and an adverse macroeconomic scenario
– Bottom-up stress tests draw on detailed data at the individual bank level- Individual calculations designed in detail and
subsequently aggregated to system-level results- Generally more accurate, precise and reliable since
they use individualised, loan-by-loan data
– Top-down stress tests draw on system-level data (some breakdown at bank-level but not in-depth) - Generally apply techniques uniformly to all banks- Designed with the help of system-level
assumptions
• Objective: provide a loan-level loss estimate for each portfolio to estimate the capital required to maintain a specific capital ratio under said scenarios
• Elements:

Asset Quality Review1.1

99© Oliver Wyman LON-FSP22401-197
Asset Quality Review is split into a preparatory and three main phases
• The AQR is a risk-based assessment and focuses on those elements of individual banks’ balance sheets that are believed to be most risky or non-transparent
• Specific objectives of the AQR are the – assessment of adequate provisioning for credit exposures – determination of the appropriate valuation of collateral for
credit exposures – assessment of the valuation of complex instruments and
high-risk assets on banks’ balance sheets
• The AQR is divided into a preparatory and three main phases, which started in December 2013 and will last until October 2014
• Detailed indications on the methodology for phase 2 are provided in a comprehensive manual + series of appendices (> 300 paes)
1. Partially overlapping with phase 0
Phases of the AQR process
Phase 1Portfolio
selection1
Phase 2Performance ofAQR at national
level
Phase 3Report writing& disclosure
Phase 0AQR
preparationNov
embe
r ‘13
–Ja
nuar
y ‘1
4D
ecem
ber ‘
13 –
Febr
uary
‘14
Febr
uary
–Ju
ne ‘1
4Ju
ly –
Aug
ust ‘
14
The complete methodology manual has been made public by ECB

1010© Oliver Wyman LON-FSP22401-197
The core of the AQR consists of various work blocks, which started in February and last until the end of July
February March April May June July
Delivery/ check of CET1% breakdowns
Level III Fair Value exposure review
Collateral & RE valuation
PP & A¹ review
Loan tape creation
Sampling
DIV²
Credit file review (CFR)
Projections on findings of CFR
CET1% adjust-ment calculation
Quality assurance
Source: AQR Phase 2 Manual Version 1.01. Processes, policies & accounting review 2. Data integrity verification
Timeline for the key workblocks in Phase 2 of the AQR
1
2
4
5
6
8
Collective provisioning analysis7
3
9
General remarks on the methodology for Phase 2 of the AQR
All methodological standards are set centrally by the ECB program management
The methodological details have been consulted with the NCAs
The majority of analyses will be performed based on templates and output forms defined by the ECB, that will be populated by Audit firms

1111© Oliver Wyman LON-FSP22401-197
2
•
• All credit exposures of the portfolios selected during Phase 1 of the AQR and the portfolios connected to these
• Information about all loans and advances and debt securities (excl. securitisation) which are held at amortised cost for the above portfolios
• Off-balance sheet exposure (excl. derivatives)
Loan tape
Purpose of the loan tape Scope of the loan tape
Snapshots required for the loan tape Structure of the loan tape
• Provides the basis for Data Integrity Validation and the evaluation of collective provisioning practices
• Constitutes the universe for random sampling for the Credit File Review
• Two complete snapshots of all three data tapes are required:
i. End of year – Dec 2012ii. End of year – Dec 2013
• The 2012 snapshot is required for the evaluation of collective provisioning for retail exposures
• The loan tape consists of 3 sub-tapes:– Facilities tape– Collateral tape– Debtor tape
• Unique keys are requested such that facilities and collaterals can be aggregated up to the debtor level
Loan tape
EOY 2012
EOY 2013
The loan tape provides the data basis for the AQR which makes the loan tape generation one of the essential steps in the overall process
Source: ECB Phase 2 Manual

1212© Oliver Wyman LON-FSP22401-197
4
The sampling will be performed with no direct interaction with banks
General principles:• Only portfolios selected for Phase 2 will be sampled• No sampling of Retail exposures (with the exception of RRE)• One sample will be selected for each portfolio• Sampling process is designed to focus on areas of the portfolios with the greatest uncertainty (and therefore excludes significant parts
of the portfolio)
Files from the selected in-scope portfolios for Phase 2 will be sampled in order to carry out the Credit File Review
Define basis for sampling1 Stratify
portfolio2 Select priority group3 Select
main sample4 Select
reserve sample5
• Some parts will be excluded from sampling (see above)
• Stratification of the portfolios by risk and exposure
• Select top debtors by exposure size and riskiness bucket
• Calculate sample sizes and designate specific borrowers
• Calculate sample sizes and designate specific borrowers
Begin Credit File Review of priority
groups
Begin Credit File Review for remaining
(main) sample
The sampling process will be two-staged with an early identification of top exposures followed by the selection of the full sample
Source: ECB Phase 2 Manual 1.0

1313© Oliver Wyman LON-FSP22401-197
Key steps followed by Audit Firms as part of the CFRRequired input / priorities for banks
• Banks are required to deliver all information to perform (e.g. credit file documentation) the loan file review on time
• Open communication and interaction with Audit firms throughout on-site reviews is expected
• Banks can start preparation with regards to identify locations of key documentation (incl. foreign subsidiaries) and key contact persons
5
1 Credit File Review data preparation
• Banks collect and verify the completeness of the information necessary to complete the classification review
• Timely data delivery required
2 Review of the classification of the exposure
• Audit firms to review correct classification of the exposures in banks’ systems
3 Review of individual impairment and provisioning
• For non-Retail exposures only: Audit firms to analyse appropriate provisions given debtor status
The detailed Credit File Review (CFR) will provide information about misclassification and under-/ overprovisioning on sampled exposures
Source: ECB Phase 2 Manual

1414© Oliver Wyman LON-FSP22401-197
Credit file review - exampleAssessment of Non Performing Exposures
Going concern approach when:
• Operating cash flows continue and can service debt partially
• Collateral value is low and/or is not essential to the debtor’s cash flows
Gone concern approach when:
• Low or negative cash flows estimated going forward
• High collateral value and collateral is essential to the debtor’s cash flows
Perform gone or going concern approach & calculate provisioning
Decide on going or gone concern approach1 2
Going concern approachi. Steady-state cash flows: 1 period sustainable cashflows (EBITDA + Cash flow
adjustment + Sustainability adjustment) x Multipleii. Two-step DCF: Annual cash flow forecast and terminal value discounted by EIR1
Gone concern approachi. Estimate the liquidation time frame required for the assetsii. Estimate the cash flows by years including
a. Income generated from the asset during liquidation windowb. Proceeds from asset sale based on the market prices (discounted by EIR)
i. All physical assets should be valued on basis of market value in line with Blue Book or other international standards
ii. An existing appraisal in last 12 months from external appraisers qualify (should be indexed to current value)
iii. Estimate the cost of liquidationi. Market price haircut (based on liquidity of market and liquidation strategy)ii. Cost of legal enforcement and other liquidation costs
iv. Analyze the lien structure to estimate the accessible share of collateral value1. Effective interest rate of impaired facilitySource: ECB AQR Phase II Manual (public)

1515© Oliver Wyman LON-FSP22401-197
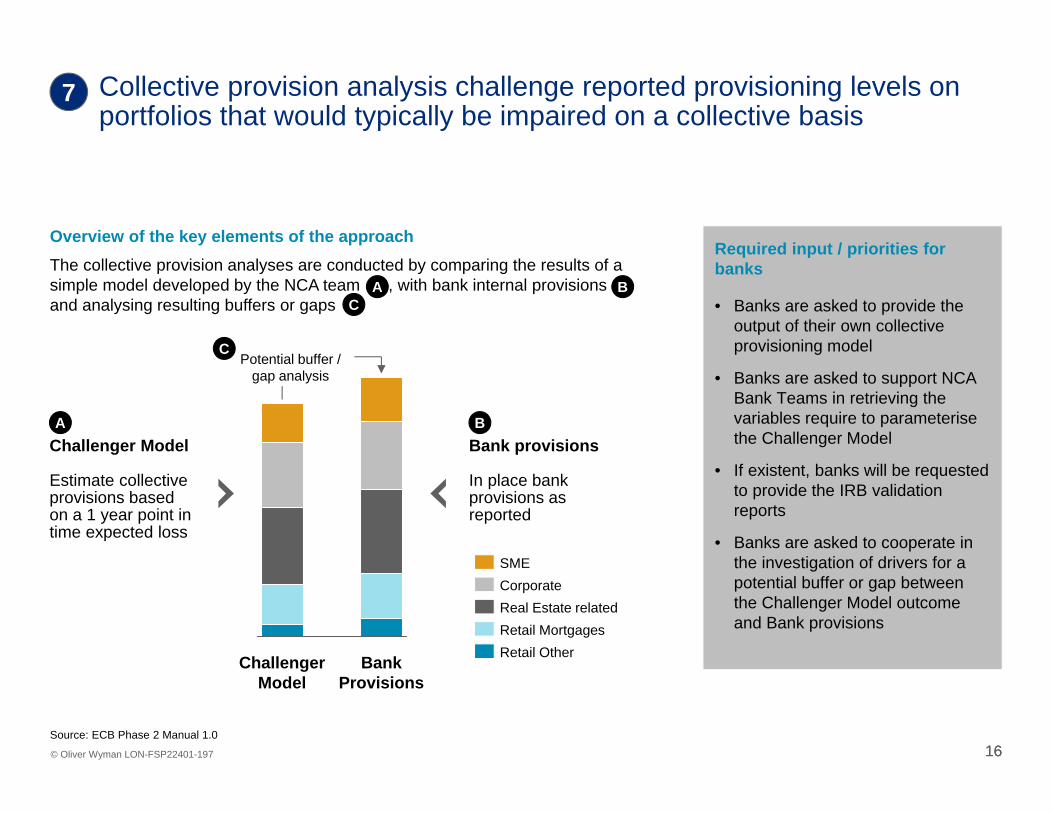
Overview of the key elements of the approachRequired input / priorities for banks
• Banks are required to provide basic information on collateral items (e.g. address for real estate) to facilitate the valuation – failure to deliver will result in a value of 0
• Banks can start preparation by checking availability of key information on their collateral databases
6
Complete sample selection for loan
file review
Determine the collateral items for
revaluation
Perform review based on ECB
standards
• Identify the credit files under review based on sampling
• Identify the sampled exposures with collateral items attached
• Determine the collateral sample for review– All items >€ 1 MM– >90% of collateral
items (in value) per debtor
– Has not been revalued on market value since 1/1/13
• Gather basic information required to perform valuations
• Real estate will be valued in line with European Standards EVS-2012 (Blue Book) and other international standards (e.g. RICS guidelines) unless more conservative local valuation standards are used
Collateral valuations will be used to identify if physical assets valuations are correctly reflected in provisions or carrying values
Source: ECB Phase 2 Manual
1616© Oliver Wyman LON-FSP22401-197
Overview of the key elements of the approachRequired input / priorities for banks
• Banks are asked to provide the output of their own collective provisioning model
• Banks are asked to support NCA Bank Teams in retrieving the variables require to parameterise the Challenger Model
• If existent, banks will be requested to provide the IRB validation reports
• Banks are asked to cooperate in the investigation of drivers for a potential buffer or gap between the Challenger Model outcome and Bank provisions
7
Bank Provisions
Challenger Model
Challenger Model
Estimate collective provisions based on a 1 year point in time expected loss
Bank provisions
In place bank provisions as reported
Retail OtherRetail MortgagesReal Estate relatedCorporateSME
Potential buffer / gap analysis
A B
C
The collective provision analyses are conducted by comparing the results of a simple model developed by the NCA team , with bank internal provisionsand analysing resulting buffers or gaps
A BC
Collective provision analysis challenge reported provisioning levels on portfolios that would typically be impaired on a collective basis
Source: ECB Phase 2 Manual 1.0

Stress test: recent experiences from selected European countries
1.2

18© Oliver Wyman LON-FSP22401-197 18
The bottom-up stress testing exercise estimates the potential capital need by comparing entities’ projected losses against their loss absorption capacityStress test: Oliver Wyman methodology
Potential capital needs
Loss absorption capacity
Provisions
Capitalbuffer
PPP
2013 2014 2015
New bookPerforming loansNon-performing loans
Projected loss calculation (loss forecasting) Loss absorption capacity
4. LGD modelling
5. Collateral asset valuation review
6. Exposure projections
2. Embedding of AQR results
3. Macroeconomic modelling
1. Bottom-up modelling – PD
2. Accumulated pre-provision profit:(PPP = NII - Fees - Costs)
3. Capital buffer: Credit deleveraging
1. Existing provisions currently in BS
Potential capital needs
Projected loss calculation (Loss forecasting)
• Bottom-up loan-level “economic loss” valuation of key assets/portfolios
• With particular emphasis on high risk areas
• 2 scenarios (base vs adverse stress) considered
• Detailed and accurate pre-provision profit generation forecasting (structural P&L component analysis)
• Capital excess/deficit under baseline and adverse scenario
• Serves as a basis to derive final requirements
II
III
II
II
III
Illustrative

19© Oliver Wyman LON-FSP22401-197 19
Macroeconomic modelData input
Loss forecasting built combining Macroeconomic models with micro analytics on specific risk factors (e.g., Default Rate – DR)
DR and NPL data
Source: Country A
Central Bank
Macro dataSource:
Country A Central Bank,
OxEcon, Eurostat
Projections for macroeconomic
variablesSource: IOs
Stationarityanalysis
andtransformation
1. Univariate and multivariate regressions for variable and model shortlisting
Households (Retail)
Corporate
Small business
RED
2. Final model identification
Households (Retail)
Corporate
Small business
RED
3. FinalCredit Quality
Indicator projections
Households (Retail)
Corporate
Small business
RED
Filter 1Filtering based on statistical significance and economic intuition(R-squared, P-stat, signs)
Filter 2Filtering based on goodness of fit and economic sense(Shape, credibility of projections)
Stationarityanalysis
Illustrative
I

20© Oliver Wyman LON-FSP22401-197 20
Loss absorption capacity component break-down
Loan loss provisions, pre-provision profit and the free capital buffer are the three components of Loss Absorption CapacityReal case example – pre SSM exercise supported by OW in a europeancountry
Recap of cornerstones• Clear rules and constraints to apply LLPs to
absorb losses • Confirmation of eoy 2012 baseline LLPs• Analyse breakdown into general/ generic
(performing) and specific (non-performing) LLPs
• Scenario definition• Confirmation of assumptions and methodological
questions• Business plan reconciliation• Benchmarking of PPP drivers• Normalisation of PPP to BoS base case• Stressing of normalized PPP to BoS adverse
case
• Confirmation of 2012 Core Tier 1 capital baseline• Confirmation of 2012 Regulatory Capital
Requirement (RWAs) and breakdown• Projection of Regulatory Capital Requirement
(RWAs) over 2013-2015• Projection of 2015 capital buffer in excess of
minimum capital requirements
1
2
3In-place loan loss
provisions (LLPs) 2012
Pre-provision profit (PPP)2013-2015
Capital buffer / shortfall 2015
Total Loss Absorption
Capacity 2015
1 2 3
Notes: LAC = Loss Absorption Capacity; LLPs = Loan Loss Provisions; PPP = Pre-Provision Profit; ST = Stress TestingSource: XYZ Stress Test and Asset Quality Review documentation
II

21© Oliver Wyman LON-FSP22401-197 21
Credit risk
Market risk
Ops risk
Pro-forma capital adequacy calculations3 years pro-forma projection
1. 8% for base case; 5.5% in adverse caseNotes: LAC = Loss Absorption Capacity; LLPs = Loan Loss Provisions; PPP = Pre-Provision Profit; ST = Stress Testing
Pro-forma baseline
Capital buffer
Capital shortfall
Current available
CT1 capital
Current RWA
Current ST capital
requirement
Current capital buffer /shortfall
x 8%1
A B B C
x 8%1
Future pro-forma available
CT1 capital
Future pro-forma RWA
Future pro-forma ST
capital requirement
Pro-forma future capital
buffer/ shortfall
A B B C
D RWA projection
Credit risk
Market risk
Ops risk
The capital ratios are projected based on current available CT1 capital and forward projected RWAs/capital requirement
Illustrative
III

Applying the new methodologies to the prevailing context in MENA region: potential scenarios
2

23© Oliver Wyman 23
Risk factors that could determine shocks for Banks in MENA region (1/2)High volatility of real estate prices are common in the region
• House prices recovered from the 2008-2009 severe drop
• Real Estate prices have been resilient since the 2009 drop, they have not been affected by– Troubled times in the region (in 2010) – and in Europe (in 2011)
• Dubai area market outlook for is positive because of economic growth and positive impact linked to International events (e.g. Expo 2020)
-50%
-40%
-30%
-20%
-10%
0%
10%
20%
30%
40%
50%
Q1'08 Q1'09 Q1'10 Q1'11 Q1'12 Q1'13
House prices in Dubai% change y/y
Source: Colliers International. Oliver Wyman analysis.
Another big financial crisis could hit house prices as in 2008, and the shock could spill over on banks’ asset quality (increasing NPLs)
Dubai is a case study for House prices in the region
After the drop in 2008, house prices have
been fairly stable even during troubled times

24© Oliver Wyman 24
Risk factors that could determine shocks for Banks in MENA region (2/2)Oil price and GDP shock scenario
• MENA region economy is heavily dependent on the oil sector
• Regional GDP is correlated with the oil prices; this is more evident after the crisis and can clearly be seen following 2009
• In crises period the effect is less evident and external facotrs rather than oil price can effect GDP of MENA economies (e.g. 2008 – 2009)
• A large and prolonged decline in the Oil price could lead to negative effects on Non-oil growth, hence on Corporate and Banking sectors
An oil price shock could spill over on banks’ assets quality (increase in NPLs)
-60%
-40%
-20%
0%
20%
40%
60%
80%
100%
2003 2007 2011
Oil price and MENA GDP% change y/y
Source: Datastream, Oxford Economics. Oliver Wyman analysis.
Oil price plays a big role in MENA region economy
After 2009, GDP of main MENA
countries is highly correlated
to oil price
During financial crises GDP of MENA
countries shrank
Oil priceMENA region GDPSaudi Arabia GDPUAE GDP

Implications for MENA Banks3

2626© Oliver Wyman LON-FSP22401-197
The trend towards increasing use of AQR and stress test in banking supervision will generate important implications both at Regulators and at Bank level
Regulator level1 • Adapt regulatory approach in AQR/Stress Test definition to recent best
practices
2 • Introduce rigorous Recovery and Resolution Planning requirements
Bank level –“technical”
3 • Ensure availability of relevant data
4 • Introduce advanced methodologies and tools to allow appropriate stress simulations
Bank level –“strategic”
5 • Preserve capital adequacy under stress scenarios
6 • Steer business decisions with the objective to maintain required robustness under severe assumptions
27© Oliver Wyman 27
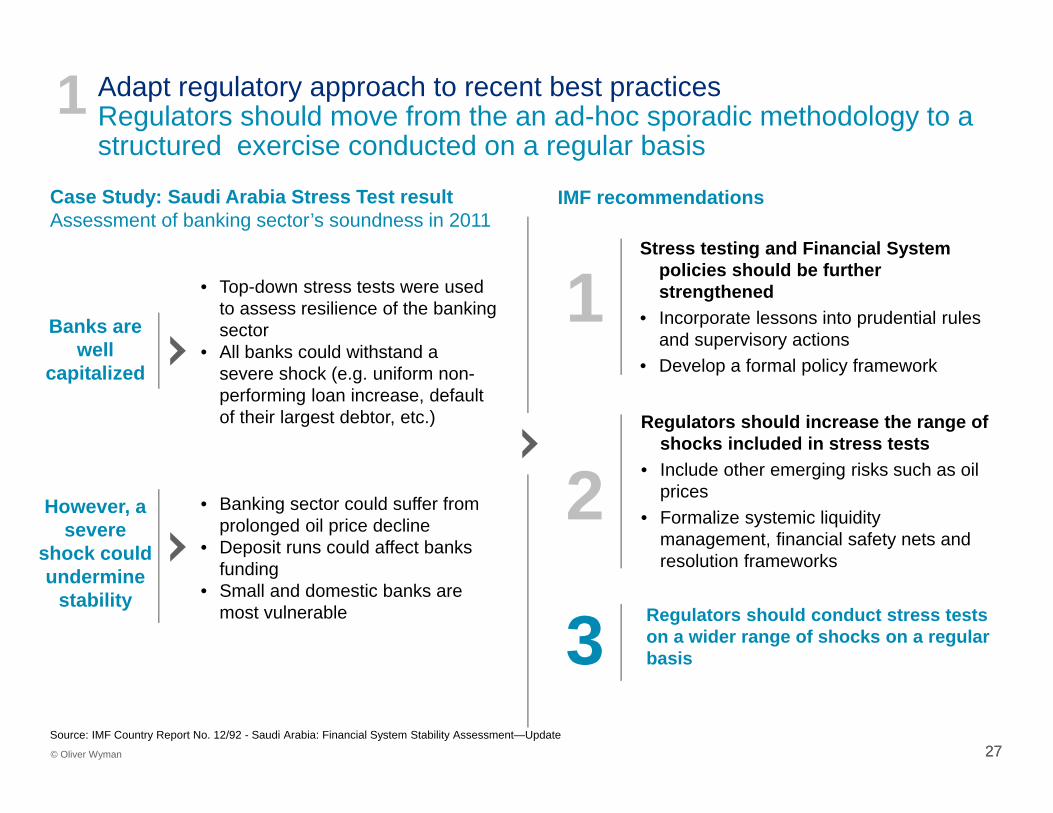
1Stress testing and Financial System
policies should be further strengthened
• Incorporate lessons into prudential rules and supervisory actions
• Develop a formal policy framework
2Regulators should increase the range of
shocks included in stress tests• Include other emerging risks such as oil
prices• Formalize systemic liquidity
management, financial safety nets and resolution frameworks
3 Regulators should conduct stress tests on a wider range of shocks on a regular basis
Adapt regulatory approach to recent best practicesRegulators should move from the an ad-hoc sporadic methodology to a structured exercise conducted on a regular basis
1Case Study: Saudi Arabia Stress Test resultAssessment of banking sector’s soundness in 2011
• Top-down stress tests were used to assess resilience of the banking sector
• All banks could withstand a severe shock (e.g. uniform non-performing loan increase, default of their largest debtor, etc.)
• Banking sector could suffer from prolonged oil price decline
• Deposit runs could affect banks funding
• Small and domestic banks are most vulnerable
IMF recommendations
Banks are well
capitalized
However, a severe
shock could undermine
stability
Source: IMF Country Report No. 12/92 - Saudi Arabia: Financial System Stability Assessment—Update

2828© Oliver Wyman LON-FSP22401-197
Introduce rigorous Recovery and Resolution Planning (RRP) requirementsOriginally introduced only with reference to Global SIFI, RRP requirements are being progressively extended to all banks
1. Identify initiatives in order to improve credibility and feasibility of recovery actions and level of “resolvability” of the institution
2. Improve quality and effectiveness of RRP and decreasing the cost of failure
2
To prevent bank from failing• Defining management actions and
triggers, with the aim of restoring the capital and liquidity position, and continuing operations
• Tied to stress testing and scenario analysis (“reverse stress testing”)
• Overseen by regulators’ supervisory staff
To prepare for orderly bank failure and transition to a bridge bank under government or 3rd party ownership• Defining key operations and assets
to enable an orderly transition• Identifying potential roadblocks to an
orderly resolution and appropriate mitigating plans
• Overseen by regulators’ resolution staff
Recovery plans
Resolution plans
Recovery vs. Resolution Plans The authority's objectives in recovery and resolution planning
• Operating model (e.g. decouple/create redundancy in the shared services in order to improve capability of the bank to break up in an orderly fashion)
• Business model (e.g. reduce volumes/ riskiness on trading and derivatives positions)
• Company set-up (e.g. segregate risky activities from deposits, hard ring-fence, or create a pure holding company)
• Capital constraints and limitations to financial resources circulation(e.g. adopt additional discretionary capital add-on or intra-group exposures, free circulation of capital and liquidity)
Potential focus areas for recommendations
29© Oliver Wyman LON-FSP22401-197 29
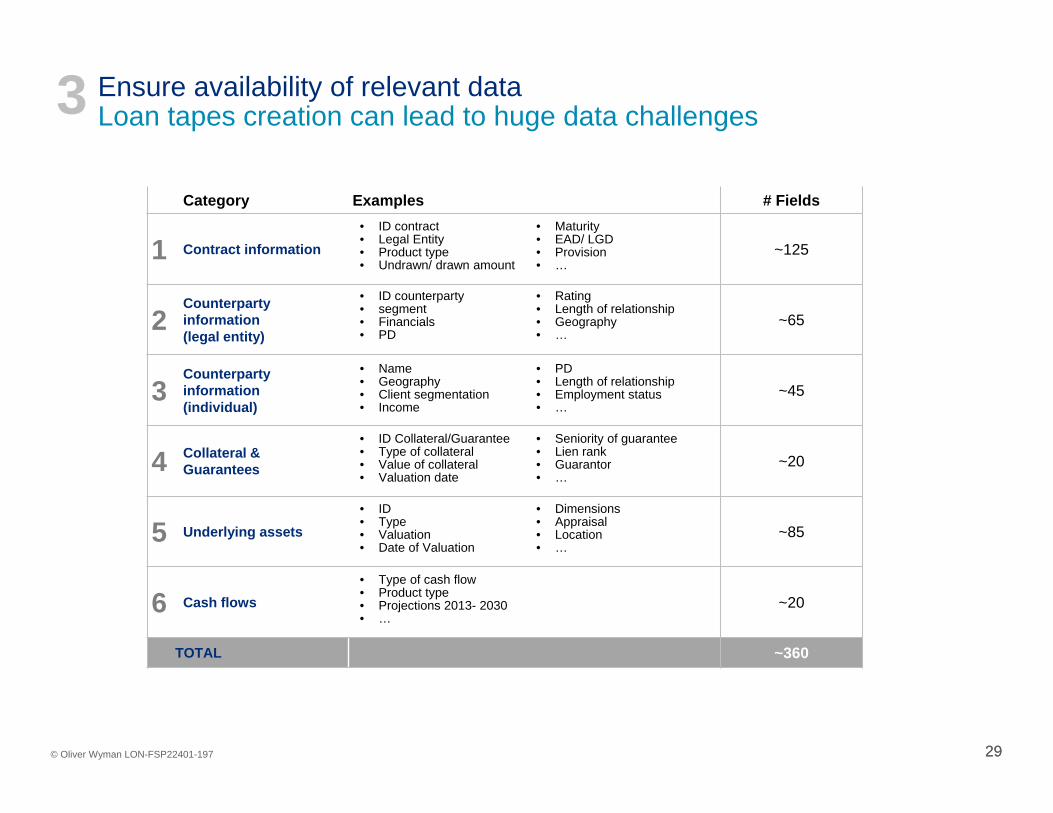
Ensure availability of relevant dataLoan tapes creation can lead to huge data challenges3
Category Examples # Fields
1 Contract information ~125
2Counterparty information(legal entity)
~65
3Counterparty information(individual)
~45
4 Collateral &Guarantees ~20
5 Underlying assets ~85
6 Cash flows ~20
TOTAL ~360
• ID contract• Legal Entity• Product type• Undrawn/ drawn amount
• Maturity• EAD/ LGD• Provision• …
• ID counterparty• segment• Financials• PD
• Rating• Length of relationship• Geography • …
• Name• Geography• Client segmentation• Income
• PD• Length of relationship• Employment status• …
• ID Collateral/Guarantee• Type of collateral• Value of collateral• Valuation date
• Seniority of guarantee• Lien rank• Guarantor• …
• ID• Type• Valuation• Date of Valuation
• Dimensions• Appraisal• Location• …
• Type of cash flow• Product type• Projections 2013- 2030• …

30© Oliver Wyman LON-FSP22401-197 30
Introduce advanced methodologies and tools to allow appropriate stress simulationsA granular modelling approach allows to leverage a broad spectrum of information sources, generating detailed and accurate results
4
Inputs & Parameters Modelling Scenario impacts
Scenarios Scenario resultsModular projections
Probability of default
Portfolio data
Parameters
EAD
Defaulted balances flows
Cured balances flows
Amortization/ prepayment
Risk parameters (PD, LGD, EAD)
0%
10%
20%
30%
40%
50%
2012 2013 2014
PD (%)
Base Adverse
30%
32%
34%
36%
38%
40%
2012 2013 2014
LGD (%)
Base Adverse
Balances evolution (performing, non-performing, substandard)
020406080100120140160180200
2011 2012 2013 2014
Portfolio composition (€MM)Base case
Substandard Performing loans NPLs
020406080100120140160180200
2011 2012 2013 2014
Portfolio composition (€MM)Stress case
Substandard Performing loans NPLs
Expected Loss
StockTotal 2011
(ALL) - by DRC segmentMortgages 45.847 4.065 1.731 5.796 5,9% 12,64%RED 72.278 10.111 8.229 18.340 17,8% 25,4%Public works 7.900 1.317 556 1.874 12,2% 23,7%Large Corporates 5.578 723 280 1.004 8,5% 18,0%SME 5.917 742 314 1.056 8,1% 17,8%Consumer Finance 5.770 704 369 1.073 8,4% 18,6%Total 143.290 17.663 11.481 29.144 12,5% 20,3%
Balances EL (€) EL (%)2011 EL
12-14EL
11-14EL
12-14EL
11-14
LGD
Secured
Unsecured
Non-performing loansPD
EAD
LGD
Macroeconomic
Bank strategy
PD models
Adjustments
Repayment & prepaymentCCF models
LGD models
Collateral haircuts
Cure rates
Inputs
Top-down planning and Stress Testing
Toolkit

3131© Oliver Wyman
Capital of top Mena banks in normal environment is above regulatory requirements…Top 5 MENA banks1 Tier 1 ratio and Capital Adequacy Ratio (CAR)2, 2013 data
…but the situation could change dramatically in stressed conditionsResults of stress test on Saudi Arabia banks in 20113
• Scenario defined– Oil price decline to historical average of $40
a barrel– Evolution of System’s Capital Adequacy
Ratio
Preserve capital adequacy under different scenarios (1/2)Capital adequacy in a normal environment does not mean safety in a stressed situation
5
16.5%
Emirates NBD PJSC
19.6%
15.3%
National Commercial Bank (The)
17.1%16.2%
Qatar National Bank
15.6%15.6%
Al Rajhi Bank
19.6%18.5%
National Bank of Abu Dhabi
18.2%
CARTier 1
Source: Annual reports. Banking Sector: structure, vulnerability and stress test, September 2011. Oliver Wyman analysis.1. Banks ranked on 2012 assets 2. Total regulatory capital 3. The exercise used 2010 data.
122Total assets$ bn
101 93 89 752015
14.8%
2011
16.2%
2010
17.7%
-1.9%
2014
5.2%
2013
10.8%
2012
Evolution of System’s Capital Adequacy Ratio

32© Oliver Wyman LON-FSP22401-197 32
Preserve capital adequacy under different scenarios (2/2)Recovery and Resolution Planning will become a key priority5
• Failed bank’s credit machinery stop, anddeposit accounts cease
• Deposit-guarantee fund pays off insured depositors
• Purchase of all or some assets and assuming liabilities by a healthy institution i.e. a merger, but for a closed bank
• Remaining assets sold/wound-down
• Temporary entity used to maintain essential services and preserve franchise value
• Institution sold or liquidated in an orderly way in the mid- to long-term
• Bank issues new equity to the government (common/preferred stock)
• Usually accompanied by liquidity assistance from the central bank
• Merger with another healthy financial institution with government assistance in the form of guarantees or direct support
• Capital infusion from existing shareholders or other interested parties
• Merger with another healthy financial institution
Clo
sed
bank
Private sector solutions
Liquidation/deposit pay-off
Assistedmerger
Direct government
aid
Bridgebank
ClosedPurchase &
Assumptions (P&A)
Ope
n ba
nk
Potential long list of resolution options
Category Example measures
“Business as usual” managerial levers
• Cost savings, e.g. marketing,legal, IT
• Sale of liquid trading book assets
• Hedging of credit portfolios• Restructuring of asset-portfolios• Other funding measures
(e.g. tighter collateral management)
Restructuring and sale of assets
• Reduction of structural costs, e.g. bonus or staff
• Sale of non-core assets• Sale and lease back of self
used real estate• Sale of other real estate and
property• Sale and outsourcing of back
office functions• Sale of minority holdings• Buy backs of hybrid instruments
Sale of business activities
• Sale of subsidiaries • Sale of foreign branches• Sale of group servicing
activities• Portfolio sales
Capital increase • Issue of new capital• CoCoCos
Examples of recovery measures

33© Oliver Wyman 33
Steer business decisions with the objective to maintain required robustness under severe assumptions (1/2)The experience of repeated stress tests required many banks to reduce exposure towards some vulnerable sectors
6
22%
18%
16%Personal loans
Other
28%
Banks & FI
Real Estate & Construction
Sovereign
16%
Group of UAE’s banks1
% total loans2, 2013 data
• Real Estate and construction loans represent a relevant share (28%) of the bank’s loans portfolio
• Another house price shock could affect asset quality (increasing NPLs)
• Data from 2009 house price decline could be used for stress tests purposes
Source: Annual reports. Oliver Wyman analysis.1. Group composed of NBAD, Union National Bank, ADCB. Note that for ADCB loans to hospitality sector were also considered in Real Estate sector. 2. Loans gross of the allowance for
impairment and interest suspended.
Regulators might require the bank to reduce exposure to RE sector
Mostly Energy (7%) Manufacturing (5%)
Banks should carefully manage concentration risk and modify their business decisions based on stress test results
27% of total loans
in 2012

34© Oliver Wyman LON-FSP22401-197 34
Steer business decisions with the objective to maintain required robustness under severe assumptions (2/2)Banks might consider to adopt capital optimization actions which may result more effective in stress conditions
6
1 Increase portfolio exposures in less cyclical sector
• Other things being equal the impact on RWA should be not material
• It can impact RWA if the bank use internal rating models that include the industry as one of the information used to assign the rating
• Non cyclical sectors will be less impacted by an economic downturn and will produce a lower level of expected losses
2 Increase geographic diversification of the portfolio
• It can lead to an increase of RWA in case the portfolio is diversified in non EU countries with bad credit quality
• Countries less correlated with the national economy will be less penalized by a downturn scenario
3 Use collaterals with less volatile values
• If collaterals are eligible, have the same face value and are of the same category, the impact on RWA should be negligible
• Collaterals with a more stable value should give more protection in case of an economic recession
General types of levers Typical impact on RWA (*) Typical impact in case of stress
(*) Depends on the use of Standard vs. Advanced approach and the characteristics of the rating models.

Concluding remarks4
36© Oliver Wyman LON-FSP22401-197 36
Summary and conclusions
• Asset Quality Review and Stress test are increasingly becoming the standard methodological approaches used by various regulators in Western Economies to supervise Bank’s safety and soundness
• These approaches are widely appreciated by the market professionals, who see the outcome of their application as an implicit “stamp” guaranteeing the quality of Banks’ balance sheet and financial accounts. Still, their application requires huge efforts and commitment from a wide range of actors involved
• Should a trend towards greater usage of these methodology emerge also in MENA region, we see six main implications – two of them for Regulators, the remaining four applicable to Banks– Regulatory Authorities should 1. adapt their approach in AQR/stress test application to
recent best practices and 2. introduce rigorous Recovery and Resolution Planning requirements
– Banks, in turn, should 3. ensure availability of relevant data, 4. introduce advanced methodologies and tools to allow appropriate stress simulations, 5. preserve capital adequacy under stress scenarios and 6. steer business decisions with the objective to maintain required robustness under severe assumptions