Embed Size (px)
Citation preview

RECENT EXPERIENCES IN FULL LOAD FULL PRESSURE SHOP TESTING OF A
HIGH PRESSURE GAS INJECTION CENTRIFUGAL COMPRESSOR
by
James M. Sorokes
Supervisor of Aerodynamics
Mark J. Kuzdzal
Rotordynamics Analysis Engineer
Dresser-Rand Company
Olean, New York
Mark R. Sandberg
Senior Rotating Equipment Engineer
ARCO Alaska, Inc.
Anchorage, Alaska
and
Gary M. Colby
Senior Performance Engineer
Dresser-Rand Company
Olean, New York
James M. Sorokes is Supervisor of Aerodynamics for Dresser-Rand's TurboProducts Division in Olean, New York. He has worked for Dresser-Rand (formerly Dresser-Clark) since graduating from St. Bonaventure University (1976). His job
functions include the development, design, and analysis of all aerodynamic components for centrifugal compressors. Mr. Sorokes is a member of AIAA, ASME, and the ASME Turbomachinery Committee. He has au
thored, or coauthored, numerous technical papers and holds two U.S. patents.
MarkJ. Kuzdzal is a RotordynamicsAnalysis Engineer at Dresser-Rand's TurboProducts Division. He has been employed there since obtaining his B. S.M. E. from the State University of New York at Buffalo (1988). Mr. Kuzdzal's major focus is on damper bearings and stability analysis. He has applied for two U.S. patents on bearings and has written two technical papers.
3
Mark R Sandberg is a Senior Rotating Equipment Engineer with ARCO Alaska, Inc. He has been a member of the Alaska ProjectManagementTeamsince 1988, working on several projects for Alaska's North Slope. Prior assignments with ARCO have been associated with onshore and offshore projects in the lower48 states of the U.S. His duties have included the conceptual design,
I specification and procurement, acceptance testing, and installation and startup of vari
ous types of rotating equipment. Previously, he was employed by Petro-Marine Engineering and The Dow Chemical Company. Mr. Sandberg received a B.S.M.E. (1975) and an M.S. in Mechanical Engineering (1977), both from the University of Illinois. He is a registered Professional Engineer in the State of Texas and a member of ASME.
INTRODUCTION
The second phase of the Prudhoe Bay Gas Handling Expansion Project (GHX-2) included several large, gas turbine driven, tandem compressors. Increasing gas offtake and the resulting increase in high pressure, gas reinjection requirements created the need for a near 50 percent increase in gas reinjection capacity and addition of nearly a quarter of a million hp. Each of the four gas turbine/tandem compressor trains is housed in a separate, enclosed module weighing up to 5400 tons. These modularized oil and gas processing facilities have been designed and fabricated in the lower 48 states. Once completed, the modules have been sealifted to the North Slope of Alaska, offloaded from the transport barges, and then moved into place with large, specially designed transport vehicles.

4 PROCEEDINGS OF THE TWENTY-THIRD TURBOMACHINERY SYMPOSIUM
One of the more notable achievements of this project was the utilization of large frame, single shaft, industrial gas turbines in mechanical drive service, previously used only for electric power generation. The higher horsepower gas turbines provided the required compression capacity with fewer trains of equipment and an equivalent fewer number of modules; resulting in substantial cost savings. The higher power output gas turbines, however, created the need for relatively larger compressors. A narrow allowable speed range and a moderate design output speed contributed to the larger size created by increased flow capacity. The ability to increase the tandem compressor train speed was also limited by the lack of experience in design and manufacture of speed increasing gears at the power and pitch line velocity limits imposed. Proposed compressor selections and configurations from several manufacturers were reviewed during the conceptual phase of the project. It became evident that most of the individual compressor selections, and all of the proposed tandem compressor configurations, contained compressor designs that went beyond the "experience envelope" of each of the manufacturers.
Limitations imposed by requirements of the process greatly influenced the selection of individual compressors. The gas compressed by the machines was a multicomponent mixture of light hydrocarbons and carbon dioxide with a molecular weight of 20.73. Suction pressures ranged from 500 psig to 573 psig. The suction temperature remained relatively constant at 59°F. The discharge pressure also .varied from 4257 psig to 3951 psig, respectively. Interstage cooling would be provided with air cooled heat exchangers that, within limits, would provide suction temperatures to the high stage compressor at some increment above ambient temperature. Interstage pressure was also limited to a minimum level by the cricondenbar, the point at which some of the multicomponent mixture could condense. An alternate case, where two of the four trains would operate during the first year on a slightly heavier molecular weight mix at similar conditions, was also imposed.
Other operational considerations also played a large part in the equipment selection. Liquids production is currently limited by the field-wide reinjection capacity of these machines and the existing reinjection machines. The efficient utilization of the total horsepower available from the turbines at any given ambient temperature is of great importance. This has historically resulted in the operation of the turbines at full load, exhaust temperature limits during most of the year except during periods of very low ambient temperatures. The corresponding effect on the compressors is operation over a large part of the compressor map, not at a single point or set of points at different speeds. In fact, the operation of these machines was estimated for the low stage compressor from near surge to the overload region of the curve, as seen in Figure 1. The high stage compressor also operated over a large range of the map, but not as extensively as the low stage machine.
PERFORMANCE GUARANTEES AND TESTING
Given the relatively narrow speed range set by the gas turbine and the extensive operating range requirements imposed by the process and operational considerations, a single point performance guarantee was not deemed adequate. A broad guarantee envelope was developed to provide assurance that proposed compressors would satisfy all project requirements. This guarantee was composed of distinct guarantees for head and efficiency across a broad flow range. The guarantees were established for the individual compressor bodies, not the entire tandem train. First, the equipment vendor was to propose a "pseudo-design" point that would be used to determine ASME Class III test
1.4
High Ambient Operating Point
Site Rated Point
1.2
0.8
' Low Ambient Operating Point
0.6 .__ ____ ..._ ____ _._ ____ __,_ ____ __, 0.5 0.75 1.25 1.5
Q I Q (Design)
Figure 1. Low Stage Compressor Performance Points.
parameters and for other design purposes. It was assumed that this point would be coincident with or lie in the vicinity of the maximum efficiency point of the curve. Next, a guarantee flow range was established using the proposal predicted surge point and a point factored from the "pseudo-design" point. The head guarantee envelope was constructed around this flow range. A minimum efficiency guarantee was also established using the guarantee flow range as a basis. Typical head and efficiency guarantee envelopes are shown in Figures 2 and 3.
1.2
� Ill e. 0.8 :r :r
0.6
Guarantee Envelope
0.4 L-----'"'------'-------'------' 0.6 0.8
Q I Q (Design)
Figure 2. Head Guarantee Envelope.
1.2 1.4
Verification of performance guarantees was to be confirmed by an extensive testing program. Normal mechanical testing in accordance with API 617 and Class III performance testing in accordance with ASME PTC 10 for each compressor were considered to provide minimal assurance that the guarantees had been met. ASME Class III performance testing of each compressor included four points on the design speed curve. Surge points at design speed, minimum speed and maximum continuous speed conditions were established. Off-speed performance points were also obtained, although these proved to be of marginal value considering the narrow speed range. In addition, ASME Class I performance testing of individual compressor bodies and

RECENT EXPERIENCES IN FULL LOAD FULL PRESSURE SHOP TESTING
OF A HIGH PRESSURE GAS INJECTION CENTRIFUGAL COMPRESSOR 5
c .!!' ..
1.2
e. 1 � c "
�
.f 0.8 IE w
. . . - · · · · · · · · · · ·
. - � , • .
. · • " . . . . . .
· · · · ··
· · ··
· · · · · ...
________ ___., Guarantee Envelope ·
0.6'------'------'------'--------' 0.6 0.8 1.2 1.4
Q I Q (Design)
Figure 3. Efficiency .Guarantee Envelope.
a four hour, full load string test were provided for a single train of equipment. Each of the Class I tests were comprised of five points, distributed along the design speed curve at site rated conditions. These tests were crucial extensions to the more conventional testing for several reasons.
• Thermodynamic performance of the compressors under actual field conditions across the entire map was of slight concern. Previous experience by ARCO Alaska, Inc. [1] showed good agreement between Class III shop testing and field testing when stage modeling techniques were utilized. Verification of performance under full load conditions prior to shipment was still viewed as worthwhile considering the remoteness of the field installation and lead time prior to startup and operation of the equipment. The narrow speed range available from the gas turbine driver also left little margin for speed corrections necessary to overcome any performance deviations.
• The mechanical performance of the compressors under full load conditions was of considerable interest. Application of centrifugal compressors in natural gas reinjection service has historically been an area where rotordynamic instabilities have been observed. This fact, along with the knowledge that compressors of this size had not been previously applied in this service by the OEM, alone provided ample justification for performing the Class I testing.
• Since this was the first application of the gas turbine in mechanical drive service, verification of its startup and operating characteristics was also desired. The significant starting torque required by the tandem compressors coupled to the single shaft, gas turbine created the need for a large, gas expansion starting turbine. Although the exact starting requirements could not be duplicated due to differences between the string test piping loops and the actual installation, dynamic characteristics of the starting sequence were of interest. Due to events that occurred during the testing, the shutdown characteristics of the equipment train were also of importance.
• The string test setup would provide a chance to assemble a complete equipment train prior to final assembly in the module. This offered the ability to identify physical fit-up and interface problems. A significant problem with the installation of the main load coupling was actually uncovered during the string test setup. Modifications were made and the issue was resolved prior to further testing and field installation.
• A complete test of this type would provide, at least in part, insight into the operation of the control system. The gas turbine
control panel became a necessary part of the string test. A large amount of the discrete startup and shutdown valving logic provided by the control panel had to be defeated due to differences in the string test loops, but a significant portion of the turbine control logic was tested .
The added cost and considerable time and effort spent in planning and executing the extensive Class I and string testing program was justified. Solutions to problems that were identified as a result of the testing were incorporated prior to startup of the machines on Alaska's North Slope. Considerable delays and expense associated with making modifications to equipment located in a remote location were avoided.
DESCRIPTION OF THE COMPRESSOR TRAIN
Each compressor train consists of three major pieces of turbomachinery. The driver is a frame 6 gas turbine capable of supplying approximately 65,000 hp to the two barrel-type compressors. The first body or the low pressure (low stage) compressor contains eight 29 in impellers. The second body is the high pressure (or high stage) back-to-hack compressor comprised of five 21 in and three 20 in impellers. The train is pictured in Figure 4 and each of the major components is labeled for clarity.
Figure 4. Equipment Train.
Most of the discussion concentrates on the low pressure (or low stage) unit. A cross sectional view of this compressor is shown in Figure 5. Several key components are labeled as they will be addressed in discussions that follow. The reader will note that the compressor is a common configuration with only one inlet and one discharge; commonly called a "straight-through" unit. As noted, there were eight impellers in the compressor, all 29 in in diameter. Each impeller was preceeded by radial inlet guidevanes; i.e., no preswirl; and followed by a vaneless diffus-

6 PROCEEDINGS OF THE TWENTY-THIRD TURBOMACHINERY SYMPOSIUM
er. Return bends (the 180 bend) and return channels were located downstream of the vaneless diffusers in the first seven stages. The last stage diffuser discharged into a standard scroll-type volute. The original build also included a shunt hole system which drew high pressure gas from the discharge volute and injected it onto the balance piston to help regulate the labyrinth leakage flow.
Figure 5. Cross-Sectional View Of Low Stage Compressor.
LOW PRESSURE, INERT GAS TESTING
All units for the new trains were initially tested at reduced pressure using an inert gas mixture. As noted above, the low pressure unit was performance tested following the guidelines of the ASME Power Test Code (PTC-10) [2] for a Class III test utilizing C02 as a test medium. The design and test operating conditions is given in Table 1. A schematic of the test loop and location of instrumentation is given in Figure 6.
Table 1. Design and Test-Class Ill Operating Conditions.
Class Ill
Expected Operating Conditions
Based on Pseudo Design Point
66588 37385/4
Design Test Design Test
Ps, PSIA 537.0 150.0 1754.6 250.0
Ts. °F 59.0 100.0 20.0 90.0
Pd, PSIA 1691 469.8 4099.8 413.9
Td, °F 250.6 294.5 121.1 208.13
Wt. Flow, #/Min. 18170 6985.0 18170 1820.0
MW 20.73 44.01 20.73 28.01
GHP 33639 6501 18322 1112.0
RPM 4860 3524 4860 4031
Results of the Class III tests demonstrated the units met all performance requirements. The test results for one of the low stage compressors are shown in Figure 7. During the performance test no substantial subsynchronous vibration was observed.
An API-617 5th edition [3] mechanical spin test was conducted withhelium used as the gas medium. Results demonstrated that the units met all requirements and one low stage compressor 665B was released to the hydrocarbon test stand. Subsynchronous vibration was not evident during the mechanical spin test.
FULL PRESSURE HYDROCARBON TESTING
An ASME PTC-10 Class I test requires a compressor to be tested on the specified gas under design conditions within the tolerances listed in Table 1 of the Test Code. The Class I test requirements are guidelines for conducting a field performance test on a compressor. In the manufacturer's shop, the specified
00
0 - Pressure. Total
0 - Temperature, Total
@ - Differential Pressure
® - Speed
Balance Piston Return Line
Inlet and Discharge Probes-- 4 @ 90'' Apart
Flowmeter Probes-- 2@ 180''
Apart
Figure 6. Class Ill Test Schematic.
+ + +
>-(.) z w 0 u:: u.. r - -w 0 z <( ::> :2:
Test Data
- Guaranteed Envelope
Q/N
Figure 7. Class Ill Test Results.
+
EFF. \
\I
' MU \ I
design gas is not available. Low design inlet temperatures are often not achievable at the manufacturer's shop due to cooling capabilities and ambient conditions. In these cases, a modified Class I [4] test must be performed.
MODIFIED CLASS I TEST CONDITIONS
The high pressure unit inlet temperature at the specified low ambient condition was 20°F. The minimum test inlet temperature achievable, due to ambient conditions and cooling water availability, was 100°F. Therefore, to demonstrate the compressor operation at specified inlet pressure and density, a molecular weight higher than design was required.
Local pipeline natural gas having a molecular weight of 18 was available to the manufacturer. To simulate the specified gas, this light hydrocarbon pipeline gas would have to be blended with carbon dioxide and/or propane to achieve the required

RECENT EXPERIENCES IN FULL LOAD FULL PRESSURE SHOP TESTING
OF A HIGH PRESSURE GAS INJECTION CENTRIFUGAL COMPRESSOR 7
properties. For the tested hydraulic performance of the unit to be relevant to the compressors' performance at field conditions, the k-value of the test gas must match the k-value of the customer's specified gas. The required increase in molecular weight resulted in excessive spiking of the pipeline gas. As. a result, the required k-value to maintain the design volume reduction could not be achieved.
The problem with test gas mixture was discussed with the customer and a decision was reached to test under a higher ambient design condition. An alternate design condition, having a 59°F inlet temperature, was chosen. Using this condition as a base, a test blend was obtained that met the requirements. The design condition tested .and the predicted test conditions are listed in Table 2. The pressure ratio and brake horsepower curves at specified conditions are shown in Figure 8 with the predicted test condition curve overplotted. The hydrocarbon test
Table 2. Design and Test-Class I Operating Conditions.
Modified Class I Expected Operating Conditions Based on Pseudo Design Point
665B8 373B5/4
Based 5°F Ambient Based 68°F Ambient
Desion Test Desion Test
Ps, PSIA 537.0 537.0 2002.0 2002.0
Ts, °F 59.0 100.0 83.0 100.0
Pd, PSIA 1690.7 1702.0 3966.0 3988.62
Td, °F 250.6 303.7 184.9 208.7
WI. Flow, #/Min. 18170 18170 15173 1517.3
Head 47700 47830 25019 25072
M.W. 20.73 22.863 20.73 21.924
BHP 33889 33981 15763 15808
RPM 4860 4860 4914 4914
blend for the low pressure unit was established using the same parameters outlined for the high pressure unit.
A modified Class I test conducted on a blended gas causes the test gas properties to be critical to the objective of the test. Allowable departures from the stated test conditions must be held tighter than those allowed by Table 1 of the A SME PTC-10. For example, ASME PTC-1 0 Table 1 allows an inlet variation of up to eight percent of inlet density for a Class I test. Allowing this variation would not hold the required tolerances on k-value and inlet compressibility factor to meet the test objective. Although the test was conducted under Class I guidelines, the allowable departures for a Class III test as defined by Table 3 of PTC-1 0 code must also be adhered to if a gas other than the specified gas is utilized. In addition, the end user and manufacturer mutually agreed that the inlet RTZ of the target test conditions would be maintained within two percent during the test run. Deviation of inlet temperature would result in the kvalue of the gas exceeding acceptable departure limits. Therefore, an agreement was reached that the inlet temperature would be maintained within 10°F of the test target condition.
ACCEPTANCE CRITERIA
The hydraulic performance under the hydrocarbon test conditions was guaranteed to be within five percent of the performance established on the low pressure inert gas test (Class III). Thermodynamic properties were evaluated using the BenedictWebb-Reuben-Starling (BWRS) [5] equation of state. Gas samples were taken throughout the test and compositions verified on-site using a gas chromatograph.
a. :X:
PREDICTED AT SPECIFIED CONDITIONS
0 PREDICTED DlSCH. PRESS. - CLASS I TEST
<> PREDICTED BHP- CLASS I TEST
�1.00·-· � � 0
0.60 -+t+t-H-+t-l+t+t-H-+t-l+t+t-H-t+t+t-H-+t-l+t+t-H+++M 0.60 0.80 1.00 1.20
NORMALIZED INLET VOLUME 1.40
Figure 8. Comparison of Class I Test Vs Specified Performance.
Mechanical acceptance criteria were per API-617 5th edition. The mechanical performance of the compressors was monitored by the manufacturer and a monitoring and diagnostic company. All vibration signals were recorded on tape and monitored live via oscilloscope, digital vector filters, and spectrum analyzers.
HYDROCARBON TEST SETUP AND INITIAL RESULTS
The compression train along with the contract auxiliaries would be tested under full pressure on the hydrocarbon blend. Figure 9 shows the test piping arrangement and location of instrumentation.
Balance Piston Return Line
0 - Pressure. Total
@ - Temperature, Total
@ - Differential Pressure
0 - Speed
Inlet and Discharge Probes·- 3@ 120" Apart
Flowmeter Probes-- 2@ 180'' Apart
Figure 9. Class I Test Schematic.

8 PROCEEDINGS OF THE TWENTY-THIRD TURBOMACHINERY SYMPOSIUM
The low pressure compressor test loop was brought up to pressure on the gas blend with the unit operating in the overload region of the performance map. Initial measurements indicated that the compressor was well within the expected tolerances. As the unit was throttled to lower capacities, a subsynchronous vibration of significant amplitude was observed, as can be seen in Figure 10. This occurred at approximately the design inlet capacity of the performance map. The frequencies were identified at six to eight percent of running speed and at 68 percent of running speed. The 68 percent frequency corresponded to the first natural frequency of the rotor/bearing system. The six to eight percent source was unknown at that point. The unit was unthrottled until vibrations were within acceptable operating limits. A second attempt at throttling demonstrated the subsynchronous vibration to be repeatable at the same inlet flow capacity. The test was then aborted due to the amplitude of the vibration.
.case
.(857
4858
4859
4858
4858
>
i
Figure 10. Frequency Spectra-Initial Class I Test.
A second test was conducted at design inlet pressure to determine if the vibration was a consequence of aerodynamic excitation. This test was conducted on a helium-nitrogen mixture having a molecular weight of 20 to reduce the volume reduction. If the cause was due to aerodynamic excitation then the vibration onset would occur at a lower inlet capacity than the test on hydrocarbon blend. The results showed that the vibration onset did occur at a lower capacity and at lower amplitudes. These lower amplitudes would be expected as the average density and power were lower under the inert gas blend relative to the hydrocarbon blend. The onset of the vibration could be moved with changes in the aerodynamic conditions and therefore demonstrated that the cause was aero related.
'
Since the six to eight percent frequency falls within the classic range for vaneless diffuser rotating stall [6], the initial reaction was that the rotor was responding to such a stall phenomenon. However, when comparing the predicted diffuser flow angles to standard vaneless diffuser stall criteria published by Jansen and Senoo [7, 8], none of the angles violated the Jansen guidelines, as can be seen in Table 3. It was also originally believed that the 68 percent of running frequency vibration was being driven by
Table 3. Calculated Diffuser Flow Angles Vs Jansen Critical Flow Angle For Rotating Stall.
Critical Flow Angle Stage Calculated Flow Angle For Rotating Stall
Number At Suroe Flow (Jensen, 1964) 1 69.4° 79.0° 2 70.5° 78.5° 3 70.6° 77.5° 4 71.2° 77.0° 5 70.6° 74.5° 6 70.4° 74.0° 7 70.9° 72.5° 8 70.6° 72.0°
the six to eight percent response. There were no other obvious explanations for the vibration phenomenon. Therefore, the low pressure unit was returned to the Class III stand where further diagnostic testing could be conducted.
DIAGNOSTIC TESTING ON THE CLASS III STAND
Unlike the earlier testing, stage instrumentation was installed on the Class III stand to allow acquisition of stage performance data. It was felt that such data might give some indication of which stage or stages were causing the vibration. Combination pressure/temperature probes were installed in the seven return bends. Two probes were located in each bend to insure redundancy. Inlet and discharge pipe probes were used to determine the performance for stages one and eight. All other stages were calculated on a return bend to return bend basis.
The results indicated an aerodynamic anomaly in several stages with the most dramatic being in the fifth stage. As can be seen in Figure 11, the stage five head coefficient curve showed a distinctive droop in the low flow region of the curve. This droop coincided with the onset ofthe subsynchronous vibration. Additionally, pulsations in the fifth and seventh stage return bend pressure gauges that coincided with the increase in subsynchronous activity were identified. Once established, it was necessary to increase inlet flow beyond the flow rate at which the subsynchronous response appeared to eliminate the subsynchronous vibration and pressure bounce; i.e., the phenomena exhibited a large hysteresis.
::I :2 -o .� n; E 0 z
Normalized Flow
Figure 11. Stage Five Performance Curve.

RECENT EXPERIENCES IN FULL LOAD FULL PRESSURE SHOP TESTING
OF A HIGH PRESSURE GAS INJECTION CENTRIFUGAL COMPRESSOR 9
The only subsynchronous vibration to appear during the Class III testing was near six to eight percent of running speed. The 68 percent frequency was not observed.
The aerodynamic characteristic and hysteresis behavior, combined with the vibration frequency range, tended to support the vane less diffuser rotating stall theory. Therefore, despite calculated flow angles that fell within accepted limits, the vaneless diffusers for stages five and seven were pinched. When the unit was tested with the narrow diffusers, however, there was no apparent change in the aerodynamic or subsynchronous vibration response. This test demonstrated that there must have been other factors or components contributing to the stall phenomena.
Some consideration was given to the impellers. However, impeller stall is typically found at higher frequencies, i.e., 50 to 80 percent of running speed [ 6] or 13 3 percent of running speed [9]. Impeller stall was, therefore, ruled out as a likely source for the rotor excitation. Further, CFD results on selected impellers appeared to support this conclusion.
RETURN SYSTEM CONSIDERATIONS
The remaining stage components to be examined were the return bends and return channels. The return bend is the 180 turn that redirects the flow from radially outward to radially inward. The return channel vanes then remove the remaining tangential swirl caused by the impeller and prepare the flow for injection into the next impeller. A typical return channel system is sketched in Figure 12.
+
Figure 12. Typical Return Channel.
There is limited information available in the open literature regarding stall characteristics of return bends or return channels. However, earlier works by Fulton [10] and Bonciani, et al. [11], do suggest that the return channel system can prompt a stall-like phenomenon if the return channel leading edge incidence becomes sufficiently large.
The calculated leading edge incidence levels for the low pressure compressor were reviewed and are presented in Table 4. As can be seen, the incidence angles were highly positive even at design flow and several stages exceeded +20 degrees in the region near surge. Note, the high design flow incidence levels were used because of the utmost emphasis that was placed on meeting a maximum flow condition. Such levels had not caused problems in other compressor applications including the high pressure unit on the subject train. Still, it was felt they may be a factor on the low pressure compressor. Therefore, a decision was made to change three return channels to investigate their effect on the performance and vibration characteristics.
Since the fifth stage had exhibited a drooping characteristic in its head coefficient curve, it was felt that the return channels both upstream and downstream of this stage should be modified.
Table 4. Return Channel Incidence Prior To ModificationDesign Flow Condition.
Return Channel Stage Incidence
1 +9.8° 2 + 11.0° 3 + 11.4° 4 +12.7° 5 + 13.8° 6 + 13.2 ° 7 + 16.2°
The return channel following stage three would also be modified. By observing changes in the results of stages three through six, insight could be gained as to the effect of the return channel modifications. Stage three characteristics would change only if the incidence on the downstream return channel was causing an effect back to the preceding stage. Stage six would only change if the upstream return channel is affecting the downstream impeller. Stages four and five would be influenced by both an upstream and downstream incidence change.
Return channel incidence is determined by two basic parameters. The first is the return channel vane inlet angle. The second is the approach angle of the flow. Flow entering the return channel passage is highly complex; with a· significant variance in flow angle from hub to shroud due to the 180 degree bend, wall curvature, and the resultant secondary flow effects. A typical flow angle profile into a return channel is given in Figure 13. This distribution is for a single flow condition. As flow is increased or decreased, this profile becomes more skewed. Obviously, understanding such a nonuniform flow profile requires that sophisticated 3-D CFD analyses be performed.
65.00
w 60.00 ..J (!) z ..:: 5: 0 ..J 55.00 LL
50.00
SHROUD DIAPHRAGM INLET HEIGHT HUB (BULB SIDE)
Figure 13. Typical Return Channel Inlet Flow Angle Profile.
It is a standard practice in the process turbomachinery industry to treat only the mean line incidence in the return channel using simple 1-D calculations. Experience has shown that proper setting of the mean angle will yield acceptable performance.

10 PROCEEDINGS OF THE TWENTY-THIRD TURBOMACHINERY SYMPOSIUM
Figure 14. Return Channel Inlet Velocity Triangle.
Under the 1-D approach, the flow angle can be determined by resolving the velocity triangle given in FigureJ4. The tangential velocity, cu6' can be approximated by multiplying the impeller exit swirl by the radius ratio of impeller exit· radius, r2, to the return channel leading edge radius, r6• The throughflow velocity, Cm6, is dependent on the inlet area, Ac6, of the return channel passage.
Since the area is a function of the passage width, b6, a convenient me·ans for adjusting the inlet flow angle, a6, is to modify the return channel vane height. A narrower inlet width will increase the meridional velocity; resulting in a more radial approach angle. Conversely, a wider width will decrease the meridional velocity and yield a more tangential approach angle. Of course, the alternative to changing the passage height is to change the leading edge angle. However, the time required to manufacture new vanes makes this option less attractive.
Therefore, to adjust the areas on the three selected return channels, the bulb sides would be removed and the vanes would be machined to the required heights to yield the incidence levels given in Table 5. Appropriate bulbs would then be fitted to the modified passages to maintain the appropriate diffuser passage widths as seen in Figure 15.
Table 5. Return Channel Incidence-Before and After Modification.
Return Channel Return Channel Stage Incidence IOrig.) Incidence (Mod.)
3 + 11.4° +6.95° 4 +12.7° +8.53° 5 +13.8° + 7.83°
Upon removing the bulbs, inspection of the vane passages revealed several problems. First, the return channel vanes upstream of stages four and five were found to be in error. The vanes, as constructed, would not properly deswirl the flow; resulting in an unacceptable amount of preswirl into the fourth and fifth stage impellers. An attempt was made to correct the vane shapes, but the success of this effort was questionable.
Second, the return channel vanes in all stages were very inconsistent in shape and leading edge profile. Sand castings had been used to form the return channels and the resulting parts did not conform to the required dimensional tolerances. There was notable variation vane-to-vane within a given return channel including vane leading and trailing edge diameters, vane thick-
Figure 15. Return Channel Modification.
ORIGINAL
AFTER REWORK
nesses, etc. Vane leading edge profiles also varied considerably, with some vanes having sharp or pointed edges while other were quite blunt or flat. Since schedule constraints precluded fabricating new return channels at this time, the existing components were modified and reinstalled for testing.
The retest yielded very encouraging results. The head rise in the fifth stage improved dramatically, as seen in Figure 16. The overall aerodynamic characteristics of the compressor also improved. Onset of the subsynchronous phenomenon moved to lower inlet flow, but not out of the required operating range. Given the positive results obtained, plans were made to modify the remaining return channels in the belief that optimizing their incidence levels would eliminate the vibration problem. Surprisingly, subsequent testing with all return channels modified failed due to high subsynchronous levels at the six to eight percent frequency.
FURTHER STATIONARY COMPONENT ANALYSES
In view of the continued problems, further analyses were performed on the diffuser and return channel designs. Though classic stall angle criteria and some earlier data had suggested that the diffuser widths were acceptable, recently published works by Kobayashi, et al. [12], suggested that the Senoo criteria [8] could overestimate the critical flow angle. The researchers found that stall could occur much earlier, i.e., at much lower flow angles, than predicted by the Senoo method. This was especially true for· lower flow coefficient stages with their associated narrow vaneless diffusers. Review of the low flow

RECENT EXPERIENCES IN FULL LOAD FULL PRESSURE SHOP TESTING
OF A HIGH PRESSURE GAS INJECTION CENTRIFUGAL COMPRESSOR 1 1
1.00
0.80 � c -fj ffi oil :I 0.60 :::E
, .. • !::1 iii e 0 z 0.40
0.40
+ Mu, Orig. Dlaph. 0 Elf., Orig. Dlaph. 0 Mu, Mod. Dlaph. 1::. Eff., Mod. Dlaph.
0.80 1.20 Nonnalized Flow
1.60 2.00
Figure 16. Stage Five Performance Curve-Before And After Modification.
stages (five through eight) in light of the newer criteria suggested that the stage five, seven, and eight diffuser widths should be reduced.
Additional works by Senoo and Kenoshita [ 13], noted that the critical diffuser flow angle for diffuser stall would decrease following impellers with very skewed exit flow profiles. CFD analyses on the impellers in stages two through four showed such skewed trends. Therefore, the diffuser widths for these stages were reduced by nearly 25 percent, even though prior testing did not suggest that narrower diffusers were required.
Further investigations were also conducted on the return channel vane profiles. First, the vanes used in the low pressure compressor were compared to those used in the high pressure unit. As noted earlier, the high pressure unit had experienced no subsynchronous problems despite having significantly higher incidence angles. Several differences were observed with the most notable of these being the rate of turning, Recall, the purpose of the return channel vanes is to deswirl the flow or turn it back to radially inward. The vanes used in the low pressure unit had a fairly short turning radius along the suction surface. This led to a theory that the flow was separating from the return channel vanes, causing a very disturbed flow profile into the downstream impeller. This skewed flowfield could promote problems in the impeller that could be contributing to the vibration phenomenon.
Given the above considerations and the vane inconsistencies due to casting problems, new return channels were developed for all stages in the low pressure unit. However, rather than optimize the incidence only through vane height changes (as in the earlier modifications), the vane leading edge angles were also increased-i.e., made more tangential. The more tangential angle required a wider channel width to maintain the necessary channel area. The larger width results in a larger passage area directly upstream of the return channel vanes, yielding a reduced meridional velocity. Consequently, changes in flow will result in smaller changes in approach angle as shown in Figure 17. The variation in approach angle for 25 percent of design flow on the original return channels is depicted by the triangle on the left. Flow angle variat.ion for the new designs is illustrated in the triangle on the right. Clearly, the variation in angle is reduced in the newer designs.
Original
c u 6
em 6
-25% Flow Design Flow
· +25% Flow
New
c u 6
�,=::�cr · · .• . . . 6
· • . . -25%Fiow Des1gn Flow
· +25% Flow
Figure 1 7. Return Channel Inlet Velocity Triangles-Two Approaches.
The level of incidence was also adjusted on the new. vanes. Avoiding high positive incidence in the low flow region of the compressor map required fairly high negative incidence in the high flow region. High incidence results in additional losses and can reduce overload capacity. Therefore, there was some concern that the unit would not maintain its high capacity operating characteristics. As will be seen, this concern was unwarranted.
New components were machined rather than cast to address the problems with vane consistency. It was believed that machining would also improve the vane surface finish which would offset part of the loss associated with the higher vane incidences in the overload region.
DIAGNOSTIC TESTING WITH DYNAMIC PRESSURE TRANSDUCERS
While awaiting the fabrication of new return channels, a decision was made to conduct additional diagnostic testing with more detailed instrumentation to further isolate the cause of the subsynchronous vibration. Dynamic pressure transducers (DPTs) were installed in the return bend area on each stage to identify any pressure pulsations. Tests would be conducted to determine if pressure pulsations encountered corresponded to the shaft vibrations detected in the radial probes. Observations would also determine if the rotor vibrations were sensitive to activity in any specific stages.
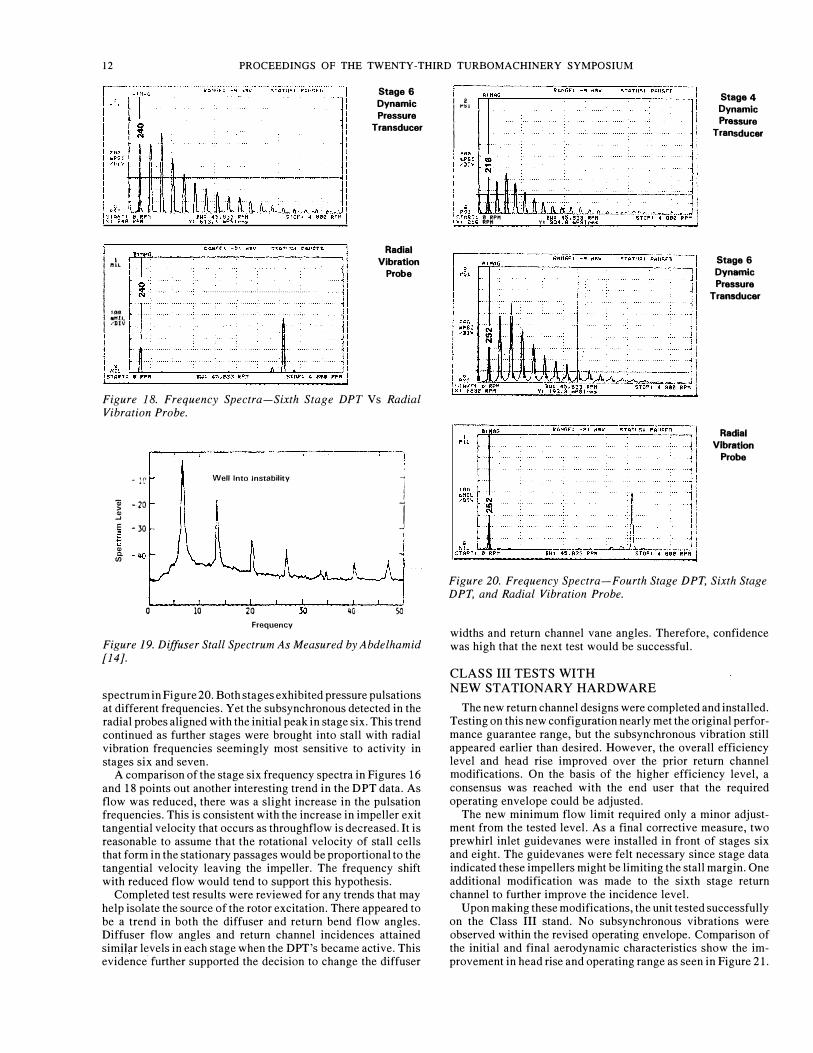
The tests were conducted on the Class III test stand. As always, the unit was started in the overload region of the performance map and was gradually throttled toward surge. In overload and near design flow, the DPTs showed little or no activity. As the unit was throttled to lower flows, activity was first detected in tbe sixth stage DPT. Simultaneously, the radial probes detected an increase in shaft vibration. Frequency spectra for both the sixth stage DPT and radial probes are given in Figure 18. Clearly, the radial vibrations are at the same frequency as the first peak in the DPT spectrum. The response was at six to eight percent of running speed, which falls within the suggested range for diffuser stall. Further, the frequency spectra bore a striking resemblance to those obtained by other researchers who had investigated diffuser rotating stall. For example, Abdelhamid, et a!. [14], measured the spectra shown in Figure 19. Still, Bonciani, et al. [11], also suggested that return channel stall could fall within the observed frequency range, though they published no frequency spectra. Therefore, the root cause of the problem was still not explicitly known.
Further throttling of the flow caused additional stages to exhibit pressure pulsations. As other stages stalled, the radial vibrations continued to increase. Curiously though, the radial vibration frequencies seemed to correspond with only one or two of the stages' DPTs. To illustrate, the frequency spectra for stages four and six are compared to the radial vibration probe
12 PROCEEDINGS OF THE TWENTY-THIRD TURBOMACHINERY SYMPOSIUM
I I I t ftU..
I I.R4 l,ot;R •'PI \I I
.................... : ......... : ........ :, .. .
Stage 6 Dynamic Pressure
Transducer
Radial
Vibration Probe
Figure 18. Frequency Spectra-Sixth Stage DPT Vs Radial Vibration Probe.
• 1C
;; -20 > ., _,
E ·30 B ., Q, Ul
0 10
Well Into Instability
20 30 Frequency
�0
l J
so
Figure 19. Diffuser Stall Spectrum As Measured by Abdelhamid [14].
spectrum in Figure 20. Both stages exhibited pressure pulsations at different frequencies. Yet the subsynchronous detected in the radial probes aligned with the initial peak in stage six. This trend continued as further stages were brought into stall with radial vibration frequencies seemingly most sensitive to activity in stages six and seven.
A comparison of the stage six frequency spectra in Figures 16 and 18 points out another interesting trend in the DPT data. As flow was reduced, there was a slight increase in the pulsation frequencies. This is consistent with the increase in impeller exit tangential velocity that occurs as throughflow is decreased. It is reasonable to assume that the rotational velocity of stall cells that form in the stationary passages would be proportional to the tangential velocity leaving the impeller. The frequency shift with reduced flow would tend to support this hypothesis.
Completed test results were reviewed for any trends that may help isolate the source of the rotor excitation. There appeared to be a trend in both the diffuser and return bend flow angles. Diffuser flow angles and return channel incidences attained simHar levels in each stage when the DPT's became active. This evidence further supported the decision to change the diffuser
i I 2
I ...
I
1.::, w• . • · .. �,�=J
Stage 4 Dynamic Pressure
Transducer
Stage 6 Dynamic Pressure
Transducer
Radial VIbration
Probe
Figure 20. Frequency Spectra-Fourth Stage DPT, Sixth Stage DPT, and Radial Vibration Probe.
widths and return channel vane angles. Therefore, confidence was high that the next test would be successful.
CLASS III TESTS WITH NEW STATIONARY HARDWARE
The new return channel designs were completed and installed. Testing on this new configuration nearly met the original performance guarantee range, but the subsynchronous vibration still appeared earlier than desired. However, the overall efficiency level and head rise improved over the prior return channel modifications. On the basis of the higher efficiency level, a consensus was reached with the end user that the required operating envelope could be adjusted.
The new minimum flow limit required only a minor adjustment from the tested level. As a final corrective measure, two prewhirl inlet guidevanes were installed in front of stages six and eight. The guidevanes were felt necessary since stage data indicated these impellers might be limiting the stall margin. One additional modification was made to the sixth stage return channel to further improve the incidence level.
Upon making these modifications, the unit tested successfully on the Class III stand. No subsynchronous vibrations were observed within the revised operating envelope. Comparison of the initial and final aerodynamic characteristics show the improvement in head rise and operating range as seen in Figure 21.

RECENT EXPERIENCES IN FULL LOAD FULL PRESSURE SHOP TESTING
OF A HIGH PRESSURE GAS INJECTION CENTRIFUGAL COMPRESSOR 13
><..> z w u u::: u. w Cl z <( :::J :E.
Q/N
EFF.
MU
" Figure 21. Compressor Performance Results-Initial Vs Final.
The unit was returned to the Class I stand for full-load, fullpressure hydrocarbon testing.
RETURN TO CLASS I STAND
Almost immediately upon startup on the Class I stand, a subsynchronous vibration was detected at approximately 68 percent of running speed. Initially, the amplitude was quite small and well below the end user's vibration specification. As the unit was throttled toward surge, the vibration amplitude continued to increase until the peak exceeded the acceptance limit. The low frequency response (six to eight percent of running speed) did not reappear in the operating envelope. Therefore, contrary to earlier beliefs, the 68 percent and six to eight percent frequencies were not related but were, in fact, separate phenomena. As there had been no indication of the 68 percent frequency on the Class III stand, it was determined that further diagnostic testing would have to be done at full-load and full-pressure.
ROTORDYNAMIC CON SID ERA TIONS
In the design phase, rotordynamic studies were conducted to determine the location of critical speeds and the rotor system's ability to resist subsynchronous vibrations. In both of these analyses, consideration was given to the influence of the tilt pad seals and damper bearings. The synchronous unbalance response analysis predicted the first critical speed to be 3150 cpm. The Class I full load full pressure test confirmed this analysis. Using the same rotordynamic model, a log decrement analysis was conducted. This analysis measures the ability of the rotor system to resist subsynchronous vibration and examines the logarithmic decrement of the first natural frequency while the rotor operates at the maximum continuous operating speed. Excitation is then analytically applied to the rotor to determine how much excitation the rotor system can withstand before the log decrement at the first natural frequency becomes zero. This value, typically called the excitation threshold, is compared to the expected excitation in the system. In this instance, a favorable margin existed and no problems were anticipated. This conclusion was confirmed by analyses performed by an independent consultant who was contracted by the end user. The following sections address the subsynchronous vibration com-
ponent which coincides with the first natural frequency and the steps taken to reduce this component within acceptable levels. The synchronous unbalance response analysis is not the focus of this discussion and will not be further addressed.
ANALYSIS AND TESTING WITH BEARING MODIFICATION
The first attempt at removing the first natural frequency component was to remove the tilt pad damper bearing from the system and replace it with a standard tilt pad bearing. Previous analyses showed that removing the damper bearing would increase the excitation threshold of the rotor system. A plot of how the log decrement of the first natural frequency changes with midspan excitation is shown in Figure 22. The excitation threshold of the original system was 77,000 lb/in (dotted line). When the damper bearings were removed the excitation threshold increased to 87,000 lb/in. The unit was run in this configuration and showed little or no change in vibration characteristics. A typical frequency spectrum demonstrating the subsynchronous component is shown in Figure 23.
1.00
0.90
0.60
:::!! 0.70 jl., P::
1!'5 0.60 0 .... "" I I 0.50
z !-< < 0.40
.... 0
z 0.30
r.. 0 !-< 0.20
z rz:l :::!! ro1 0.10 P:: u rz:l Q 0.00
t!) 0 ..:I -0.10
-0.20
-0.30
-0.40
-0.50
Determination of the amount of equivalent midspan excitation required to bring about rotor instability
10 20
MIDSPAN
1!'6588 CENTRIFUGAL COMPRESSOR BALANCE PISTON EFFECTS NEGLECTED AS II!DSPAN K•r IS INCREASED
c::n:cE DAMPER BRG FUU. TU.T PAD SEAL LOAD """""""NO DAIIPER FULL TU.T PAD SEAL LOAD � DAIIPER BRG REDUCED TU.T PAD SEAL LOAD
STABLE REGION
100 110 120
NSTABLE EGlON
Figure 22. Passive Excitation Plot.
ANALYSIS AND TESTING WITH OIL SEAL MODIFICATION
With a ratio greater than two of the excitation thresholds to the calculated excitation [15], it was believed that there may have been an excitation frequency in the system which coincided with the first natural frequency of the rotor system. An external excitation frequency matching the first natural frequency could be the source of the anomaly. This unit is supplied with tilt pad seals that offer a large direct stiffness. The tilt pad seals were
14 PROCEEDINGS OF THE TWENTY-THIRD TURBOMACHINERY SYMPOSIUM
e . . . . . . . . . ; M I L
£ T A�. T I !I R P M X I � 8 6 8 �PM
R A N G E l -17 dJY S T A T U S I P A U S U
· · · · · ·· · · · · · · · · ·i · · · · · · · · · · · · · · · · ·
. . . · · · · · · · · · · · · · · · · · · · · · · · · · · · · · · · · · · · · · · · · · · · · · · · · . . . . . . . . . . . . . . . . .
. . . . . . . . . . . . . . . . . .
S T D P I 6 8 8 8 R P M
Figure 23. Frequency Spectrum-Class I Test, 75 percent Design Flow, Balance Piston Tooth Labyrinth.
modified to reduce the direct stiffness and lower the first natural frequency. The change in the tilt pad seal design analytically changed the first natural frequency by approximately 250 cpm. The passive excitation plot given in Figure 22 shows this configuration to have a excitation threshold of 68,000 lb/in. Reducing the tilt pad seal load reduced the excitation threshold from the previous test. If the frequencies of the excitation mechanism and the rotor system's natural frequency had been coincident, they should now be separated. However, the excitation threshold should still be sufficiently high to suppress the subsynchronous component. The tilt pad damper bearings were reinstalled and the unit was rerun. Once again the component at the first natural frequency was present. However, the frequency seen during this test was approximately 200 cpm lower than what was observed with the higher load tilt pad seal.
BALANCE PISTON ACTUATION TESTING
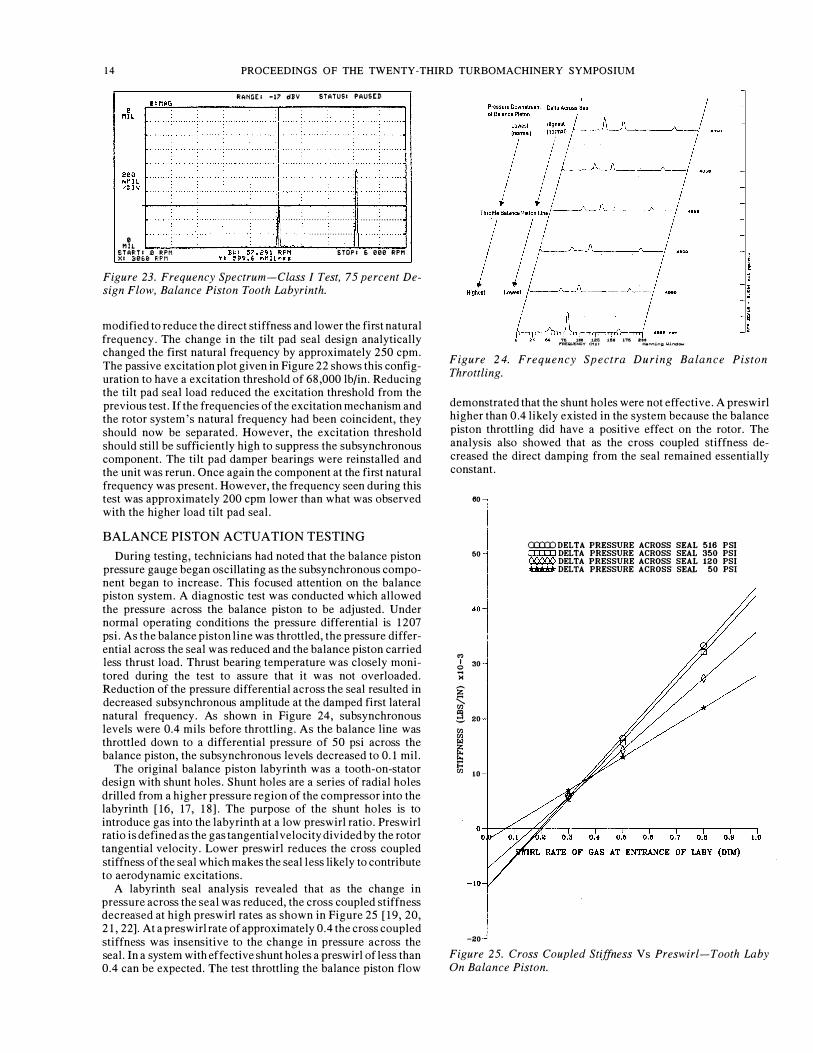
During testing, technicians had noted that the balance piston pressure gauge began oscillating as the subsynchronous component began to increase. This focused attention on the balance piston system. A diagnostic test was conducted which allowed the pressure across the balance piston to be adjusted. Under normal operating conditions the pressure differential is 1207 psi. As the balance piston line was throttled, the pressure differential across the seal was reduced and the balance piston carried less thrust load. Thrust bearing temperature was closely monitored during the test to assure that it was not overloaded. Reduction of the pressure differential across the seal resulted in decreased subsynchronous amplitude at the damped first lateral natural frequency. As shown in Figure 24, subsynchronous levels were 0.4 mils before throttling. As the balance line was throttled down to a differential pressure of 50 psi across the balance piston, the subsynchronous levels decreased to 0.1 mil.
The original balance piston labyrinth was a tooth-on-stator design with shunt holes. Shunt holes are a series of radial holes drilled from a higher pressure region of the compressor into the labyrinth [16, 17, 18]. The purpose of the shunt holes is to introduce gas into the labyrinth at a low preswirl ratio. Preswirl ratio is defined as the gas tangential velocity divided by the rotor tangential velocity. Lower preswirl reduces the cross coupled stiffness of the seal which makes the seal less likely to contribute to aerodynamic excitations.
A labyrinth seal analysis revealed that as the change in pressure across the seal was reduced, the cross coupled stiffness decreased at high preswirl rates as shown in Figure 25 [19, 20, 21, 22]. At a preswirl rate of approximately 0.4 the cross coupled stiffness was insensitive to the change in pressure across the seal. In a system with effective shunt holes a preswirl of less than 0.4 can be expected. The test throttling the balance piston flow
" ' '16 111 121 .I.ISI 1115 211
I"Jicq�JENCY (Hs> H-.l'lrd,ng WJ.rod-
Figure 24. Frequency Spectra During Balance Piston Throttling.
demonstrated that the shunt holes were not effective. A preswirl higher than 0.4 likely existed in the system because the balance piston throttling did have a positive effect on the rotor. The analysis also showed that as the cross coupled stiffness decreased the direct damping from the seal remained essentially constant.
on I 0 'H z � � Cll Cll r&l
� 1:: Cll
80
GO
30
20
10
-20
0::0::0 DELTA PRESSURE ACROSS SEAL 516 PSI DELTA PRESSURE ACROSS SEAL 350 PSI DELTA PRESSURE ACROSS SEAL 120 PSI DELTA PRESSURE ACROSS SEAL 50 PSI
Figure 25. Cross Coupled Stiffness Vs Preswirl-Tooth Laby On Balance Piston.

RECENT EXPERIENCES IN FULL LOAD FULL PRESSURE SHOP TESTING
OF A HIGH PRESSURE GAS INJECTION CENTRIFUGAL COMPRESSOR 15
The test showed that for this specific application, the shunt holes were not effective, most likely because there was not enough differential pressure between the high pressure source and the labyrinth seal. Modifications to improve the shunt hole system were impractical. A more attractive alternative was to employ a honeycomb seal which would eliminate the need for shunt holes.
ANALYSIS AND TESTING WITH HONEYCOMB SEAL
Analytical calculations showed that replacing the original tooth labyrinth with a honeycomb seal would increase the direct damping and reduce the cross coupled stiffness. A log decrement analysis was conducted comparing the influence of the stiffness and damping coefficients of the tooth labyrinth and the honeycomb (Figure 26). The coefficiimts used in the analysis assumed a preswirl ratio of 0.8. The excitation threshold decreased to 66,000 lb/in for the tooth labyrinth and increased to 90,000 lb/ in for the honeycomb from the original analysis which did not consider the balance piston effects.
1 .00
0 .90
0.80
::s 0.70 t:l.
l:t:
.n 0.80 0 .... "' I I 0.�0
z ..... < 0.40
.... ()
z 0.30
� 0 ..... 0.20
· z r.l · � o . t o l:t: u r.l � 0.00
" 0 '"' - 0 . 1 0
-0.20
- 0.30
-0.40
- 0.50
1 0 20 30
MIDSPAN Kx
� �
I §
40
86588 CENTRlFIJGAL COIIPRESSOR BALANCE PISTON K•y I S CONSTANT ltB MIDSPAN K>y I S INCRE/tBEO
= NO BAL. PIST. EFFECT - BONI!YCOIIB LADY PRES'If!RL =.8 """"""" TOOTH LADY PRESWJRL =.8
STABLE REGION
Figure 26. Passive Excitation Plot-Honeycomb Vs Tooth La by.
The full load full pressure test was conducted again with the tilt pad damper bearings, original tilt pad seals and honeycomb seal at the balance piston. The subsynchronous vibrations were reduced to within acceptable limits as shown in Figure 27.
The passive excitation plot given in Figure 22 shows an excitation threshold of 87,000 lb/in without the damper bearings. The test results of this configuration showed the subsyn-
I M I L
1 00 MM ! L / D I V
e
B = M�G
. . . . .
�- T R P. T l e. P. P M . . . . . . . . . · · � · · · · · · · ·
B�l l 57 . 2 9 1 P. P M STOP I 6 eee P. P M
Figure 27. Frequency Spectrum-Final Class I, 75 Percent Design Flow, Balance Piston Honeycomb Labyrinth.
chronous component at 66 percent of running speed. With the damper bearings and honeycomb seal installed, the excitation threshold is nearly the same at 90,000 lb/in. This configuration was stable during testing. CLearly, the tooth labyrinth was a major source of cross coupled stiffness. Removing this labyrinth and replacing it with a honeycomb seal not only reduced a major source of cross coupled stiffness but increased the available damping in the system.
Two case studies were cited by Zeidan, et al. [23], where compressors were operating in a stable fashion before a surge. In both instances, unstable operation persisted after the labyrinth clearances were increased by the surge. Honeycomb seals were utilized to help stabilize the units in the field. Similarly, the study herein describes the use of a honeycomb seal employed for the same reasons; stability enhancement. An important point made in the reference that was found to be accurate was that analytical calculations for the balance piston laby fell short of predicting the actual magnitudes of destabilizing cross coupling experienced (i.e., even with high preswirl rates, the compressor was predicted to be stable with the tooth labyrinth) [24, 25].
CONCLUSIONS
The most important conclusion to be drawn from the problems encountered on this compressor is that general aerodynamic and rotordynamic design criteria are not infallible. Despite an aero design that conformed to all generally accepted guidelines for avoiding stall, the unit clearly suffered from stall-like phenomena at a characteristic frequency of six to eight percent of running speed. Limited instrumentation made it impossible to detect the exact origin of the stall but the successful modifications demonstrated that the source was the stationary components.
Similarly, classic rotordynamic criteria predicted no difficulty. Unexpected aero-induced forces must have been present that contributed to an excitation of the first natural frequency of the rotor (68 percent of running speed). Obviously, much remains to be learned regarding the aeromechanical forces that contribute to rotor excitation and aerodynamic stall. Tests are ongoing or are planned that will improve the understanding of these forces.
In the interim, improved diffuser and return channel system acceptance criteria have been developed based on the test data obtained from this compressor. Corrections are being developed and applied to standard diffuser stall criteria that will account for such factors as : a) diffuser inlet geometry; b) skewed impeller exit flowfields; and c) wall contraction. · ·
Incidence limits have been modified in return channels to avoid high positive values in the low flow region ofthe .compressor map. New criteria which assess the turning rate on return

16 PROCEEDINGS O F THE TWENTY-THIRD TURBOMACHINERY SYMPOSIUM
channel vanes are being applied to minimize the likelihood of flow separation from the vane suction surface.
Use of high pressure, high frequency response transducers proved beneficial in identifying the cause of the six to eight percent subsynchronous problem; that being a stall in the stationary components. By placing the DPTs throughout the unit, it was possible to determine which stages stalled first and which had the heaviest influence on the shaft vibration levels.
In addition to stall, there are many other sources of aerodynamic excitation in a rotor system. In this instance, replacing the tooth labyrinth with a honeycomb not only reduced a major source of excitation, the balance piston labyrinth, but also added a significant amount of damping near the center of the rotor. Therefore, honeycomb seals will be considered for any similar high pressure compressors.
Experience on the low pressure compressor also pointed out the value of Class I versus Class III testing. The compressor did not exhibit the 68 percent frequency except when operated under full load and full pressure. Without the Class I test; the problem would have manifested itself in the field rather than at the OEM's facility. In the field, Alaska's North Slope, the resolution process would have been drawn out significantly.
Finally, successful solution of this problem was facilitated through the cooperation of the end user and OEM. Open communications existed throughout the troubleshooting process and the end user was advised of all proposed changes and their effect on compressor operation. On occasion, the end user assisted in deciding the most appropriate corrective action. Without this cooperative atmosphere, the problem resolution would have been far more difficult.
NOMENCLATURE
Ac6 gross area at return channel entrance = 2n r6 b6 a6 return channel entrance flow angle B6 vane height at return channel entrance cm6 meridional velocity at return channel entrance cu6 tangential velocity at return channel entrance
DPT dynamic pressure transducer
k ratio of specific heats
MW gas molecular weight
R gas constant = 1 545/MW
r2 impeller exit radius
r6 return channel vane inlet radius
T temperature
Z compressibility
REFERENCES
1. Klein, J. M. and Draughon, P. A., "Field Performance Testing of an Uprated Gas Reinjection Compressor/Turbine Train," ASME paper 91-GT-48 (1991).
2. "Compressors and Exhausters," ASME Power Test Code 10, 1965 (reaffirmed 1979), ANSI PTC10 (1974).
3. "Centrifugal Compressors for General Refinery Service," API Standard 617, Fifth Edition (1988).
4. Colby, G. M., "Hydraulic Performance Testing of Centrifugal Compressors - Hydrocarbon Versus Inert Gas," Proceedings Of The !MechE, paper C102/87, pp. 59-66 (1987).
5. Hopke, S. W. and Lin, C., "Application of the BWRS Equation to Natural Gas Systems," 76th National AICHE Conference (1974).
6. Frigne, P. and Van Den Braembussche, R., "Distinction Between Different Types of Impeller and Diffuser Rotating Stall in a Centrifugal Compressor With Vaneless Diffuser," ASME paper 83-GT-61 (1983).
7. Jansen, W., "Rotating Stall in a Radial Vaneless Diffuser," ASME paper 64-FE-6 (1964).
8. Senoo, Y. and Kinoshita, Y., "Limits of Rotating Stall and Stall in Vaneless Diffuser of Centrifugal Compressors," ASME paper 78-GT-19 (1978).
9. Madhavan, S. and Wright, T., "Rotating Stall Caused by Pressure Surface Flow Separation on Centrifugal Fan Blades," Journal of Engineering for Gas Turbines and Power, 107, pp. 775-781 (July 1985).
10. Fulton, J. W. "Subsynchronous Vibration of Multistage Centrifugal Compressors Forced by Rotating Stall," The Fourth Workshop on Rotordynamic Instability Problems in High Performance Turbomachinery, The Turbomachinery Laboratory, Texas A&M University, College Station, Texas (1986).
11. Bonciani, L., Terrinoni, L., and Tesei, A., "Unsteady Flow Phenomena in an Industrial Centrifugal Compressor Stage," Second Workshop on Rotordynamic Instability Problems in High Performance Turbomachinery, The Turbomachinery Laboratory, Texas A&M University, College Station, Texas (1982).
12. Kobayashi, Y., Hishida, H., Takagi, T., and Fukushima, Y., "A Study on the Rotating Stall of Centrifugal Compressors," 2nd Report, "Effect of Vaneless Diffuser Inlet Shape on Rotating Stall," Nippon Kikaigakkai Ronsbunshu (B hen), 56, (529), pp. 98-103 (September 1990).
13. Senoo, Y. and Kinoshita, Y., "Influence of Inlet Flow Conditions and Geometries of Centrifugal Vane less Diffusers on Critical Flow Angle For Reverse Flow," ASME Journal of Fluids Engineering, 99, pp. 98-103 (March 1977).
14. Abdelhamid, A. N., Colwill, W. H., and Barrows, J. F., "Experimental Investigation of Unsteady Phenomena in Vaneless Radial Diffusers," Transactions of the ASME, 101, pp. 52-60 (January 1979).
15. Wachel J. C. and von Nimitz, W. W., "Assuring The Reliability of Offshore Gas Compression Systems," European Offshore Petroleum Conference And Exhibition, EUR205 (1980).
16. Marshall, D. F., Hustak, J. F., and Memmott, E. A., "Elimination of Subsynchronous Vibration Problems in a Centrifugal Compressor by the Application of Damper Bearings , Tilting Pad Seals, and Shunt Holes," Eastern Regional Machinery Conference, ASME (November 1993).
17. Memmott, E. A., "Tilt Pad Seal and Damper Bearing Applications to High Speed and High Density Centrifugal Compressors," IFToMM, Proceedings of the 3rd International Conference on Rotordynamics," Lyon, France (1990).
18. Memmott, E. A, "Stability of Centrifugal Compressors by Application of Tilt Pad Seals, Damper Bearings, and Shunt Holes," !MechE, Fifth International Conference on Vibrations in Rotating Machinery, Bath, England (1992).
19. Kirk, R. G., "Labyrinth Seal Analysis for Centrifugal Compressor Design-Theory and Practice," Proceedings of the International Conference on Rotordynamics," Tokyo, Japan (1986).
20. Kirk, R. G., "Evaluation of Aerodynamic Instability Mechanisms for Centrifugal Compressors-Part 1: Current Theory,"

RECENT EXPERIENCES IN FULL LOAD FULL PRESSURE SHOP TESTING
OF A HIGH PRESSURE GAS INJECTION CENTRIFUGAL COMPRESSOR 17
Journal of Vibration Stress, and Reliability in Design, 110 (April 1988).
21. Kirk, R. G., "Evaluation of Aerodynamic Instability Mechanisms for Centrifugal Compressors-Part II : Advanced Analysis," Journal of Vibration Stress, and Reliability in Design, 110 (April 1988).
22. Kirk, R.G., "A Method for Calculating Inlet Swirl Velocity," A SME 11th Biennial c;onference on Mechanical Vibration and Noise, Boston, Massachusetts (1987).
23. Zeidan, F., Perez, R., and Stephenson, D. M., "The Use of Honeycomb Seals in Stabilizing Two Centrifugal Compressors," Proceedings of the Twenty-Second Turbo machinery Symposium, The Turbomachinery Laboratory, Texas A&M University, College Station, Texas, pp. 3-16 (1993).
24. Childs, D., Elrod, D., and Ramsey, C., "Annular Honeycomb Seals : Additional Test Results for Leakage and Rotordynamic Coefficients," IFToMM Third International Conference on Rotordynamics, pp. 303 - 306 (1990).
25. Childs, D., Elrod, D., and Hale, K., "Annular Honeycomb Seals: Test Results for Leakage and Rotordynamic Coeffi-
cients; Comparisons to Labyrinth and Smooth Configurations," ASME Transactions, Journal of Tribology, 111, pp. 293-301 (April 1989) .
ACKNOWLEDGMENTS
The authors would like to thank Rotordynamics Seal Research, Inc., for supplying the stiffness and damping coefficients of the honeycomb seal. In addition, thanks are extended to Jim Shufelt, Ed Thierman, Jay Koch, Karen Trevaskis, and Valerie Van Son for their assistance in generating the figures included herein. They also acknowledge the efforts and numerous suggestions offered by Lewis Broadbent (formerly of ARCO Alaska, Inc.) and Dennis O'Dea of Exxon Research and Engineering. Furthermore, thanks are extended to the Dresser-Rand Test Engineering Staff for their efforts during the testing of this compressor. Finally, thanks are extended to Dresser-Rand and ARCO Alaska, Inc., along with the other Prudhoe Bay Unit owners for allowing the publishing of this work.

18 PROCEEDINGS O F THE TWENTY-THIRD TURBOMACHINERY SYMPOSIUM