Embed Size (px)
Citation preview

1
Assessing trends in the electrical efficiency of computation over time
Jonathan G. Koomey, Ph.D. Consulting Professor, Stanford University
http://www.koomey.com Presented at LLNL, Livermore, CA
November 16, 2010

2
Alternate title: Why we can expect ever more amazing
mobile computing devices in coming decades
Jonathan G. Koomey, Ph.D. Consulting Professor, Stanford University
http://www.koomey.com Presented at LLNL, Livermore, CA
November 16, 2010

The key result: computations per kWh have doubled every
1.6 years since the 1940s
3
Koomey, Jonathan G., Stephen Berard, Marla Sanchez, and Henry Wong. 2009b. Assessing trends in the electrical efficiency of computation over time. Oakland, CA: Analytics Press. August 17. <http://www.intel.com/pressroom/kits/ecotech>. In Press at the IEEE Annals of the History of Computing as of May 2010.

Moore’s law
• Not a “law” but an empirical observation about components/chip – 1965: doubling every year – 1975: doubling every 2 years
• Characterizes economics of chip production, not physical limits
• Often imprecisely cited, interpretations changed over time (Mollick 2006)
4

Moore’s original graph
5
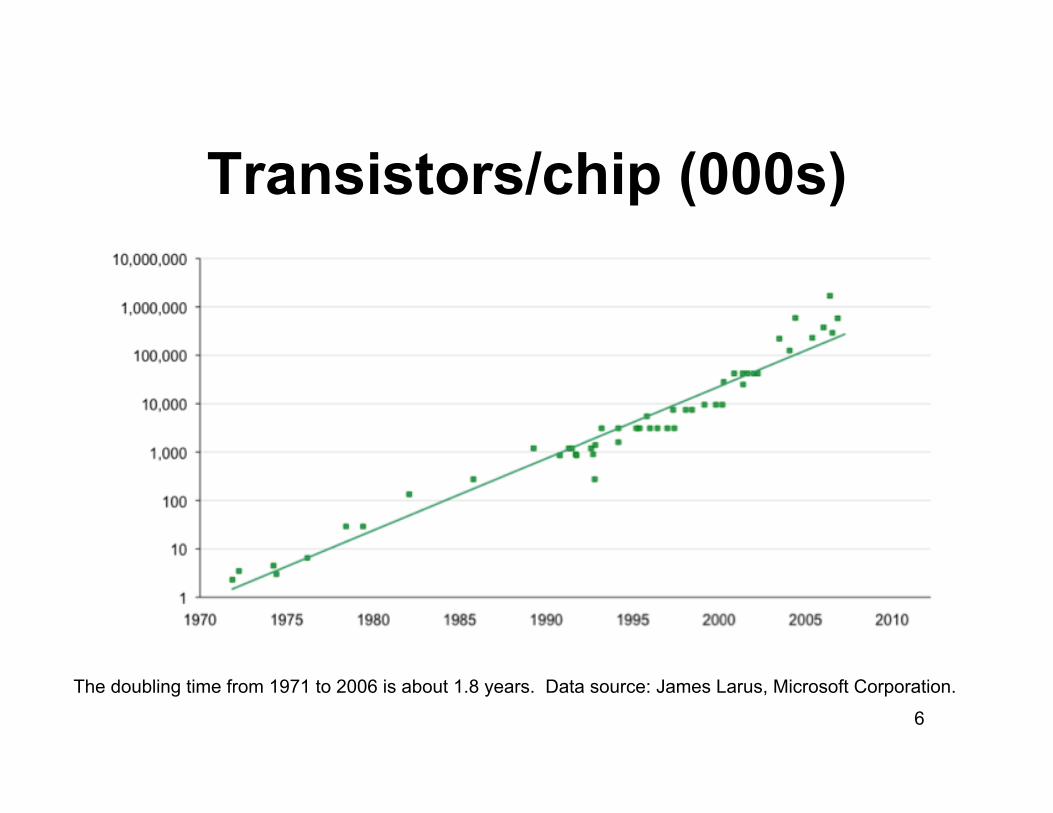
Transistors/chip (000s)
6
The doubling time from 1971 to 2006 is about 1.8 years. Data source: James Larus, Microsoft Corporation.
Origins of this work
• I initially thought to replicate my recent work on costs, energy, and performance trends in servers (Koomey et al. 2009a), for computing more generally
• Discovering Nordhaus (2007) led me to reorient my research – He analyzed costs and performance – I focused on energy and performance
7

First I made this graph
8
Calculations per second per 2009$ of purchase cost

Then I made this one
9
Computations per kWh

But this one really got me to investigate
10
Computations per kWh

Method
• Computations per kWh =
11
€
Number of computations per hour at full load
Measured electricity consumption per hour at full load (kWh)

Data
• Performance from Nordhaus (2007) or normalized to that source using benchmarks for more recent computers
• Used measured power data, either published (e.g. Weik 1955, 1961, 1964) or from archival or recent computers – with computer fully utilized – with screen power subtracted for portables
12

Performance trends
• Performance trends with real software ≠ performance trends from benchmarks ≠ transistor trends!
• Doubling time for performance per computer = 1.5 years in the PC era
13
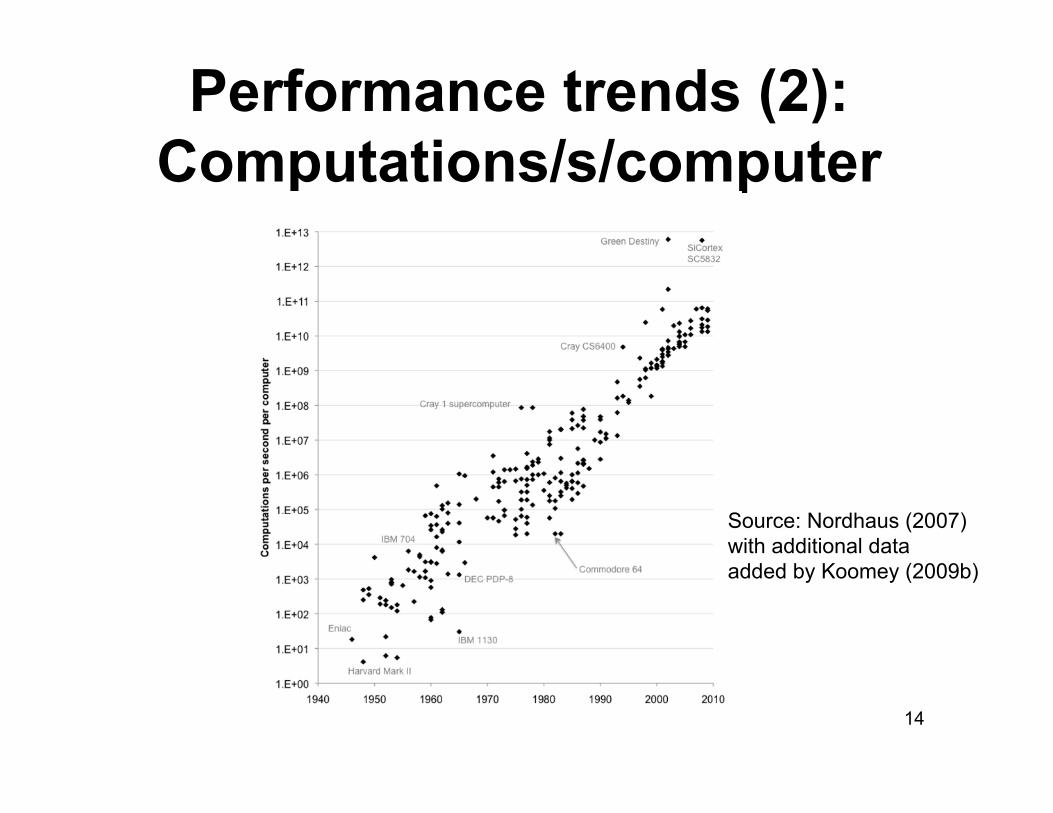
Performance trends (2): Computations/s/computer
14
Source: Nordhaus (2007) with additional data added by Koomey (2009b)

Because that’s where the computers are…
• Power measurements conducted at – Microsoft computer archives – Lawrence Berkeley National Laboratory – My in-laws’ basement – Erik Klein’s computer archives
• Computer History Museum’s web sites and discussion forums
15

An oldie but a goodie
16

And another
17

Still another
18

Erik Klein, computer history buff
19

Good correlation, clear results
• R2 for computations/kWh – 0.983 for all computers, 1946-2009 – 0.970 for PCs, 1975-2009
• Doubling time for computations/kWh – All computers: 1.6 years – PCs: 1.5 years – Vacuum tubes: 1.35 years
• Big jump from tubes to transistors 20

21
Computing efficiency trends

Efficiency trends: PCs only
22

Implications • Actions taken to improve performance
also improve computations per kWh – Transistors: Smaller, shorter distance source
to drain, fewer electrons – Tubes: Smaller, lower capacitance
• Trends make mobile and distributed computing ever more feasible (battery life doubles every 1.5 years at constant computing power)
23

Laptops growing fast (world installed base, billions)
24 Sources—1985: Arstechnica + Koomey calcs 1996-2008: IDC

An example of mobile computing enabled by efficiency
25
http://www.bigbellysolar.com
• Compacts trash 5 x • Sends text message when full • PC panel uses ambient light • An economic and environmental home run

Implications (2)
• We’re far from Feynman’s theoretical limit for computations/kWh – 1985: Factor of 1011 potential
– 1985 to 2009: Improvement of < 105
• Assuming trends in chips continue for next 5-10 years, significant efficiency improvements still to come
26

Future work • Add more laptops to the data set (also
PDAs, perhaps game consoles) • Investigate how trends might differ
between mainframes, PCs, PDAs, laptops, and servers
• Are power and performance trends for low-end chips different than for the most sophisticated CPUs?
• Real world performance vs. benchmarks 27
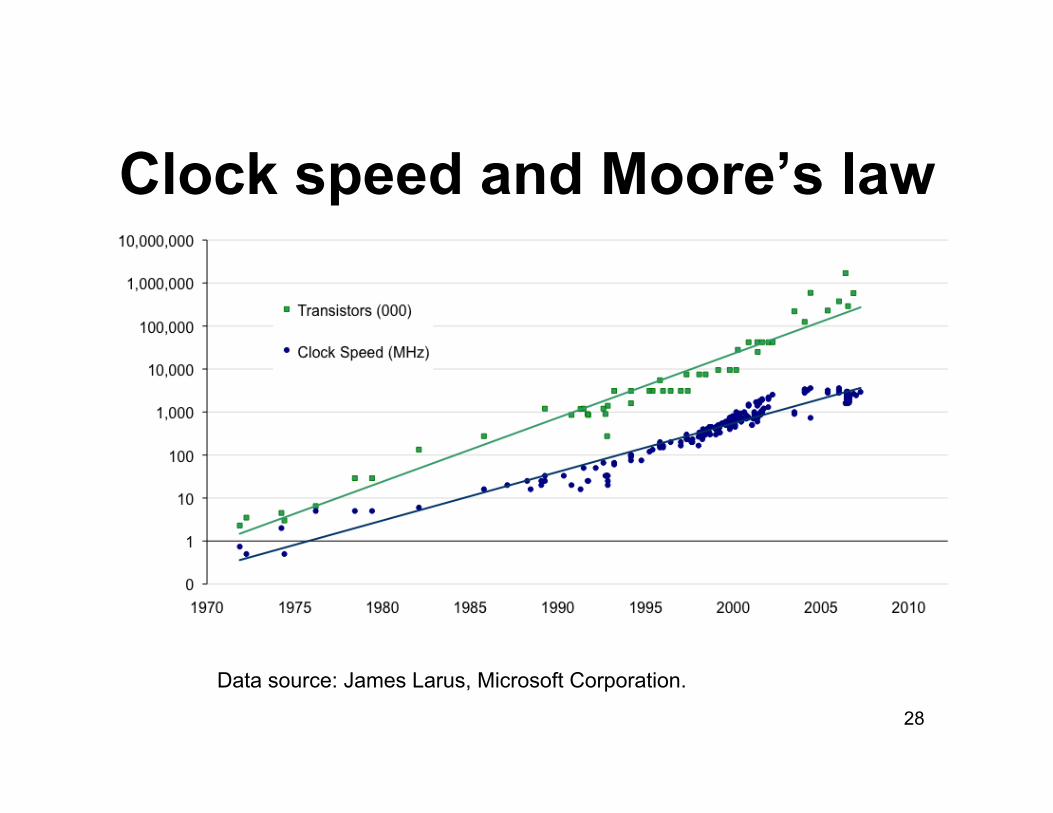
Clock speed and Moore’s law
28
Data source: James Larus, Microsoft Corporation.

A complexity: multiple cores
29 Data source: James Larus, Microsoft Corporation.

Big unanswered questions
• Are there technological innovations (software or hardware) that could allow us to substantially exceed the historical trend in the electrical efficiency of computation?
• What roadblocks might prevent these trends from continuing after the current innovation pipeline is exhausted?
30

31
Conclusions • Quantitative results
– In the PC era (1976-2009) performance per computer and computations per kWh doubled every 1.5 years
– From ENIAC to the present, computations per kWh doubled every 1.6 years
• Performance and efficiency improvements inextricably linked.
• Still far from theoretical limits • Big implications for mobile technologies

32
References • Feynman, Richard P. 2001. The Pleasure of Finding Things Out: The
Best Short Works of Richard P. Feynman. London, UK: Penguin Books.
• Koomey, Jonathan G., Christian Belady, Michael Patterson, Anthony Santos, and Klaus-Dieter Lange. 2009a. Assessing trends over time in performance, costs, and energy use for servers. Oakland, CA: Analytics Press. August 17. <http://www.intel.com/pressroom/kits/ecotech>. In press at IEEE Annals of the History of Computing.
• Koomey, Jonathan G., Stephen Berard, Marla Sanchez, and Henry Wong. 2009b. Assessing trends in the electrical efficiency of computation over time. Oakland, CA: Analytics Press. August 17. <http://www.intel.com/pressroom/kits/ecotech>
• Mollick, Ethan. 2006. "Establishing Moore’s Law." IEEE Annals of the History of Computing (Published by the IEEE Computer Society). July-September. pp. 62-75.

References (2) • Moore, Gordon E. 1965. "Cramming more components onto integrated circuits."
In Electronics. April 19.
• Moore, Gordon E. 1975. "Progress in Digital Integrated Electronics." IEEE, IEDM Tech Digest. pp. 11-13. <http://www.ieee.org/>
• Nordhaus, William D. 2007. "Two Centuries of Productivity Growth in Computing." The Journal of Economic History. vol. 67, no. 1. March. pp. 128-159. <http://nordhaus.econ.yale.edu/recent_stuff.html>
• Weik, Martin H. 1955. A Survey of Domestic Electronic Digital Computing Systems. Aberdeen Proving Ground, Maryland: Ballistic Research Laboratories. Report No. 971. December. <http://ed-thelen.org/comp-hist/BRL.html>
• Weik, Martin H. 1961. A Third Survey of Domestic Electronic Digital Computing Systems. Aberdeen Proving Ground, Maryland: Ballistic Research Laboratories. Report No. 1115. March. <http://ed-thelen.org/comp-hist/BRL61.html>
• Weik, Martin H. 1964. A Fourth Survey of Domestic Electronic Digital Computing Systems (Supplement to the Third Survey). Aberdeen Proving Ground, Maryland: Ballistic Research Laboratories. Report No. 1227. January. <http://ed-thelen.org/comp-hist/BRL64.html>
33