Embed Size (px)
Citation preview
TCH ReseaRCH RepoRT | augusT 2013
The Clearing House | 450 West 33rd Street | New York, NY 10001 | 212.613.0100 | theclearinghouse.org
Assessing the Basel III Net Stable Funding Ratio in the Context of Recent Improvements in Longer-Term Bank Liquidity
2 I. IntroductIon
4 II. ExEcutIvE Summary
7 III. HIStorIcal Background and currEnt contExt of lIquIdIty rEgulatIon
A. Reserve Requirements and the Historical Regulation of Liquidity in the U.S. . . . . . . . . . . . . . . . . . . . . . . . . . . . . . . . . . . . . . . . . . . . . . . . . . . . . . . . . .8
B. The Supervisory Review Approach to Liquidity Regulation . . . . . . . . . . . . . . . . . . . . . . . . . . . . . . . . . . . . . . . . . . . . . . . . . . . . . . . . . . . . . . . . . . . . . . . . . . . . . . . . . . . . . . . . . . . . . .9
C. Developments in Liquidity Regulation Since the Financial Crisis . . . . . . . . . . . . . . . . . . . . . . . . . . . . . . . . . . . . . . . . . . . . . . . . . . . . . . . . . . . . . . . . . . . . . . . . . . . . . . . . . .9
D. Supervisory Stress Testing of Liquidity and Other Potential U.S. Regulatory Initiatives . . . . . . . . . . . . . . . . . . . . . . . . . . . . . . . .11
E. Implications of the Historical Background and Current Context of Liquidity Regulation . . . . . . . . . . . . . . . . . . . . . . . . . . . . .12
13 Iv. aS currEntly formulatEd, tHE nSfr framEwork SuffErS from multIplE flawS
A. Quantitative Improvements in Bank Liquidity Since 2010 Empirically Demonstrate Shortcomings in the Overall Accuracy of the Current NSFR as a Tool for Assessing Liquidity Risk . . . . . . . . . . . . . . . . . . . . . . . . . . . . . . . . . . . . . . . . . .14
B. The Structure and Key Elements of the Current NSFR Suffer from Conceptual Challenges. . . . . . . . . . . . . . . . . . . . . . . . .19
C. Recalibrations Needed to Improve the Accuracy of the Current NSFR as a Liquidity Risk Measure . . . . . . . . . . . .20
23 v. tHE currEnt nSfr’S flawS could HavE SErIouS nEgatIvE conSEquEncES aS a puBlIc polIcy mattEr
25 appEndIx a – Summary of tHE currEnt nSfr

2Assessing the BAsel iii net stABle Funding RAtio in the Context oF ReCent impRovements in longeR-teRm BAnk liquidity the CleARing house
I. IntroductionThe Clearing House Association L.L.C. (“The Clearing House”), an association of major commercial banks, is committed to promoting effective liquidity risk management.1 Recognizing that deficiencies in this area were among the principal lessons learned from the financial crisis, we have strongly supported efforts by the Basel Committee on Banking Supervision (the “Basel Committee”), the Financial Stability Board, the U.S. Federal banking regulatory agencies (the “Agencies”), and the banking industry to evaluate and improve both regulatory liquidity standards and banking industry liquidity practices more generally. One of the cornerstones of the international regulatory community’s efforts to enhance liquidity risk management is the Basel Committee’s liquidity framework, first adopted in December 2010 and subsequently revised in January 2013 (as revised, the “Basel III Liquidity Framework”), which establishes short-term and longer-term quantitative liquidity metrics known as the Liquidity Coverage Ratio (the “LCR”) and the Net Stable Funding Ratio (the “NSFR”), respectively.2 Other regulatory efforts in this area include the liquidity-related provisions of the proposed enhanced prudential supervision regulations of the Board of Governors of the Federal Reserve System (the “Federal Reserve”) to implement Section 165 of the Dodd-Frank Wall Street Reform and Consumer Protection Act (the “Dodd-Frank Act”).3
The Clearing House has been extensively involved in the development and refinement of the Basel III Liquidity Framework and other liquidity reforms by providing constructive, data-based analyses regarding the appropriateness and impact of various liquidity
1 Established in 1853, The Clearing House is the oldest banking association and payments company in the United States. It is owned by the world’s largest commercial banks, which collectively employ over two million people and hold more than half of all U.S. deposits. The Clearing House Association L.L.C. is a nonpartisan advocacy organization representing – through regulatory comment letters, amicus briefs and white papers – the interests of its owner banks on a variety of systemically important banking issues. Its affiliate, The Clearing House Payments Company L.L.C., provides payment, clearing and settlement services to its member banks and other financial institutions, clearing almost $2 trillion daily and representing nearly half of the automated-clearing-house, funds-transfer and check-image payments made in the U.S. See The Clearing House’s web page online at www.theclearinghouse.org.
2 See Basel Committee, Basel III: International framework for liquidity risk measurement, standards and monitoring (December 2010) (the “2010 Liquidity Framework”); Basel Committee, Basel III: The Liquidity Coverage Ratio and liquidity-risk monitoring tools (January 2013) (the “Basel III: Final LCR Framework”).
3 The Section 165 proposals are discussed in more detail in Part III.C below.
requirements and related recommendations.4 With respect to the LCR, The Clearing House previously prepared quantitative analyses and an accompanying white paper to assess the financial market, public policy, and borrower implications of the LCR and recommend improvements to address deficiencies of the LCR as initially proposed.5
The NSFR was originally proposed by the Basel Committee in 2009 and incorporated largely without change into the Basel III Liquidity Framework. Since its proposal, the NSFR has been widely noted, including by regulators, as requiring significant additional work and as being further from ready implementation than the LCR.6
The NSFR, a detailed description of which is included as Appendix A, seeks to “limit over-reliance on short-term wholesale funding during times of buoyant market liquidity and encourage better assessment of liquidity risk across all on- and off-balance sheet items.”7 The NSFR requires each bank to maintain available stable funding (“ASF”) that exceeds its required stable funding (“RSF”), as determined by standardized ASF and RSF “factors” specified in the Basel III Liquidity Framework for each type of asset.8
4 See, e.g., Letter from The Clearing House to the Basel Committee (April 16, 2010) (the “Liquidity Proposal Comment Letter”); Letters from The Clearing House to Timothy F. Geithner (November 5, 2010; November 2, 2011; December 14, 2012); The Clearing House, How much capital is enough? – Capital Levels and G-SIB Capital Surcharges (September 26, 2011); The Clearing House, Assessing the Liquidity Coverage Ratio (November 2, 2011); Joint Comment Letter from The Clearing House, the American Bankers Association, the Financial Services Forum, The Financial Services Roundtable, and the Securities Industry and Financial Markets Association to the Federal Reserve concerning the Section 165 Domestic Proposal (April 27, 2012) (the “Section 165 Letter”); The Clearing House, U.S. Banking Industry Liquidity Update (December 14, 2012). All letters and studies are available online at www.theclearinghouse.org.
5 See The Clearing House, The Basel III Liquidity Framework: Impacts and Recommendations (November 2, 2011) (the “2011 Liquidity White Paper”), available at http://www.theclearinghouse.org/index.html?f=073502; The Clearing House, U.S. Banking Industry Liquidity Update (December 14, 2012), available at http://www.theclearinghouse.org/index.html?f=074637.
6 See, e.g., Liquidity Proposal Comment Letter, supra note 4; see also Basel Committee, Group of Governors and Heads of Supervision endorses revised liquidity standard for banks (January 6, 2013) (describing the NSFR as “remain[ing] subject to an observation period”); Daniel K. Tarullo, Evaluating Progress in Regulatory Reforms to promote Capital Stability (May 3, 2013), http://www.federalreserve.gov/newsevents/speech/ tarullo20130503a.htm (the “Tarullo Speech”) (describing the NSFR as “still-under-construction”).
7 2010 Liquidity Framework, supra note 2, at 25.
8 Stable funding is defined as “the portion of those types and amounts of equity and liability financing expected to be reliable sources of funds over a one-year time horizon under conditions of extended stress.” Id. at 25.

3Assessing the BAsel iii net stABle Funding RAtio in the Context oF ReCent impRovements in longeR-teRm BAnk liquidity the CleARing house
Conceptually, the ASF is intended to capture the portion of the liabilities that a bank expects will not be withdrawn by creditors over an extended, one-year horizon of liquidity stress, while the RSF is intended to capture the potential liquidation value of assets over that same horizon.9 The Basel III Liquidity Framework requires that a bank maintain a minimum NSFR, which is a bank’s ASF divided by its RSF, of greater than 100%. In the wake of the finalization of the LCR, the Basel Committee and the Agencies have now turned their attention to a review of “the structure and parameters of the NSFR.”10
As part of our continuing work to inform regulatory efforts to improve liquidity standards, The Clearing House has undertaken a quantitative analysis of the impact of the current NSFR and has prepared this report to assess the current NSFR, and analyze its policy implications within the historical and current context of liquidity management and regulation. More particularly, this report seeks to inform the Basel Committee and the Agencies in their ongoing review of the NSFR by:
y Examining the prescriptive, ratio-based approach of the NSFR in the broader context of liquidity regulation – both historically and in the view of more recent
9 The NSFR includes ASF factors assigned to different categories of liabilities, which aim to represent the amount of funds that would be withdrawn by creditors over a one-year stress scenario. Liabilities that have remaining contractual maturities of greater than one year are assigned a 100% ASF factor. Liabilities that have remaining contractual maturities of less than one year are assigned ASF factors lower than 100%, indicating the assumed likelihood that the funding can be relied upon or will be rolled over during a period of stress.
Similar to the ASF, assets are broken out into contractual maturity buckets of less than one year and greater than one year and then further segmented by the credit risk. Highly liquid assets, like cash and central bank deposits, are assumed to be fully liquid and therefore require 0% stable funding. Longer remaining-maturity assets require more stable funding than shorter remaining-maturity assets and higher credit-risk assets require more stable funding than lower credit-risk assets. Overall, the RSF calibration seems intended to represent the likelihood that an asset could be liquidated or financed on a secured basis during a stress event, and the magnitude of discounts in market values realized during such times or the haircuts required to borrow on a secured basis.
10 Janet L. Yellen, Regulatory landscapes – a US perspective (June 2, 2013), http://www.federalreserve.gov/newsevents/speech/yellen20130602a.htm (the “Yellen Speech”), at 3. For the original and finalized LCR proposals: Basel Committee, Consultative Document: International framework for liquidity measurement, standards and monitoring (December 2009) (the “Basel Committee Liquidity Consultative Document”) and Basel Committee, Group of Governors and Heads of Supervision endorses revised liquidity standard for banks, Press release (January 6, 2013); see also Basel III: Final LCR Framework, supra note 2. For comments by the Basel Committee and the Agencies: Stefan Ingves, Where to next? Priorities and themes for the Basel Committee (March 12, 2013), http://www.bis.org/review/r130312a.pdf; Stefan Ingves, From Ideas to implementation (January 24, 2013), http://www.bis.org/review/r130124a.pdf; Stefan Ingves, Current focus of the Basel Committee: Raising the bar (November 15, 2012).
supervisory developments that have emerged since the NSFR was first proposed;
y Empirically analyzing the current NSFR as a quantitative measure of recent changes in the U.S. banking industry’s liquidity profile relative to a variety of other commonly accepted longer-term liquidity metrics;
y Identifying empirical, analytical, and public policy shortcomings of the NSFR as currently formulated, including important distinctions between the NSFR and other measures that have not been appropriately recognized in the current NSFR framework; and
y Recommending improvements to the current NSFR framework and the regulation of longer-term liquidity, including specific changes that would more accurately reflect true liquidity risk.
Both the quantitative analysis and recommended policy improvements described in this report can inform policymakers as they assess the current NSFR framework with a view towards finalizing more appropriate and effective longer-term liquidity standards. The Clearing House looks forward to the opportunity to engage in a dialogue and consultation with the Basel Committee and the Agencies in their efforts concerning the revision of the NSFR, and we believe that this report will provide a meaningful contribution to this process.
Finally, we also note that the regulatory environment with respect to liquidity risk continues to evolve, with recent indications of interest by some supervisors in additional types of liquidity regulation, including (i) supervisory liquidity stress testing exercises and/or (ii) regulatory regimes that would involve the calibration of capital requirements by reference to certain liquidity or funding profiles.11 As part of our continuing effort to inform public policy decisions about the appropriate manner in which to regulate liquidity risk, The Clearing House expects to offer similar analyses of each of these policy developments and proposals around liquidity in the near future as further details about them become publicly available.
11 See Tarullo Speech, supra note 6.

4Assessing the BAsel iii net stABle Funding RAtio in the Context oF ReCent impRovements in longeR-teRm BAnk liquidity the CleARing house
Executive Summary• Since 2010, U.S. commercial banks in the aggregate have improved their liquidity profiles as an objective
matter.
• The current NSFR framework fails to adequately reflect the improvements in these common and objective measurements of bank liquidity, and therefore demonstrates substantial analytical weakness.
• The review of the NSFR by the Basel Committee and the Agencies should be conducted in the context of other liquidity-related regulatory initiatives already ongoing.
• The existence of multiple, complementary liquidity regulatory tools and supervisory approaches permits policymakers to design each particular regulatory element in a targeted manner.
• The current NSFR framework suffers from other analytical challenges that should be addressed.
• Flaws in the current NSFR could require firms to hold excess liquidity, which can negatively impact consumers, businesses and the economy as a whole, both in the U.S. and internationally.
• Before the NSFR is finalized and implemented, it is critical that the ASF and RSF factors be revisited and calibrated more carefully and more granularly.

5Assessing the BAsel iii net stABle Funding RAtio in the Context oF ReCent impRovements in longeR-teRm BAnk liquidity the CleARing house
II. Executive Summary y Since 2010, u.S. commercial banks in the aggregate
have improved their liquidity profiles as an objective matter. The Clearing House performed a quantitative review and analysis of internal and proprietary liquidity data collected from 11 large U.S. banks, whose assets total approximately $9.2 trillion, or approximately 52.6% of U.S. banking industry assets, as well as data from publicly available data sources on the liquidity of the U.S. banking industry generally.12 A key empirical finding of this analysis is that, since 2010, U.S. commercial banks’ longer-term liquidity position has improved in a number of ways, including by:
■ Reducing reliance on wholesale funding by $248 billion (as a percentage of liabilities, a 3.6 percentage point reduction);
■ Reducing net short-term funding by $584 billion (as a percentage of liabilities, a 4.6 percentage point reduction);
■ Reducing interbank loans by $42.4 billion (as a percentage of assets, a 0.5 percentage point reduction); and
■ Increasing demand deposits by $308 billion (as a percentage of assets, a 2.1 percentage point increase).
y However, the current nSfr framework fails to adequately reflect the improvements in these common and objective measurements of bank liquidity, and therefore demonstrates substantial analytical weakness. The estimated NSFR of the 11 large U.S. banks included in The Clearing House’s quantitative review and analysis has remained largely static, increasing by only approximately 1.0 percentage point over the same period. Simply put, if the NSFR were an effective measure of liquidity, it should capture and positively correlate to objective improvements in liquidity in at least a roughly concomitant manner. Nearly all the objective liquidity measures we reviewed showed quantitative improvements greater than the increase in the NSFR over the relevant period, and the aggregation of these individual elements would presumably be expected to yield some increase in the NSFR that is at least equal to – if not synergistically greater than – the sum of its parts. Yet our findings indicate that this is not the case.
y the review of the nSfr by the Basel committee and the agencies should be conducted in the context of, and take into account, other liquidity-related
12 For purposes of this report, we use the term “bank” to refer to both bank holding companies and their depository institution subsidiaries, unless the context otherwise requires.
regulatory initiatives already ongoing. The NSFR is only one of several U.S. regulatory initiatives that relate to liquidity, which include the LCR, enhanced prudential standards for liquidity mandated by the Dodd-Frank Act, the ongoing C-LAR liquidity stress assessment of certain large U.S. banks, and possible future regulations tying required levels of regulatory capital to required levels of liquidity or funding structures. Great care should be taken to understand how the various rules work together synergistically (or not) in order to avoid unintended consequences.
y the existence of multiple, complementary liquidity regulatory tools and supervisory approaches permits policymakers to design each particular regulatory element – including the nSfr – in a thoughtful, balanced and suitably targeted manner. The NSFR cannot and should not be designed to address all possible sources of liquidity and all possible liquidity scenarios. Instead, the current use of multiple regulatory and supervisory tools for liquidity means that the NSFR need not and should not, by itself, be calibrated to unrealistic and artificially high levels.
y the current nSfr framework also suffers from other analytical challenges that should be addressed.
■ First, the current formulation of the NSFR framework is intended to create a standardized, universally applicable set of assumptions about the effects of a generic liquidity stress on a bank for a relatively long 12-month period, and yet also assumes that management will take no positive discretionary action in response to that stress, such as balance sheet reduction, a change in asset mixes and proactive efforts to slow deposit run-off. That assumption, while perhaps more defensible in the context of shorter-term measures such as the LCR, should be replaced by some factor or adjustment for management action, subject to appropriate supervisory review and validation.
■ Second, the current NSFR is asymmetrical insofar as it assumes that, at the same time management is abstaining from taking any beneficial action, management is elsewhere taking affirmative actions during the 12-month stress period that would weaken its overall liquidity position, such as renewing maturing mortgage loans at very high rates. This asymmetry is similarly illogical and inconsistent with realistic expectations.
■ Third, the current NSFR’s binary approach to categorizing liabilities as either “stable” or “non-stable” creates a “cliff effect” for funding at the one-year time

6Assessing the BAsel iii net stABle Funding RAtio in the Context oF ReCent impRovements in longeR-teRm BAnk liquidity the CleARing house
horizon, which can distort a bank’s true long-term funding position.
y flaws in the current nSfr could require firms to hold excess liquidity, which can negatively impact consumers, businesses and the economy as a whole, both in the u.S. and internationally. Holding excess liquidity entails a trade-off: on the one hand, short-term demands can be serviced more readily; on the other hand, this is at the expense of investment in future projects.13 Because they lead to relatively less long-term investment, excessive holdings of liquidity can lead to reduced availability of credit, and thus have adverse macroeconomic growth implications. Indeed, excess liquidity would be a potential result should the final NSFR be inadequately designed and/or calibrated to artificially high levels. Our empirical analysis indicates that the current aggregate U.S. banking industry shortfall in ASF ranges from approximately $1.4 trillion to approximately $2.4 trillion (equal to between 9% and 15% of 2012 U.S. annual gross domestic product), depending on whether banks are assumed to manage to a 100% NSFR or (to provide a buffer against the risks associated with potential noncompliance) a 110% NSFR. Closing this gap would likely require U.S. banks to turn to the capital markets to raise longer-term funding, in large quantities over a relatively short period of time, increasing overall costs of funding and depressing banks’ net interest margins, returns on equity and willingness to lend to customers of all types.
y Before the nSfr is finalized and implemented, it is critical that the aSf and rSf factors be revisited and calibrated more carefully and more granularly. In particular, the ASF factors for wholesale and retail deposits are generally too low (that is, assume too high a rate of run-off) and do not reflect actual experiences with these liability categories. Similarly, RSF factors for U.S. government-sponsored enterprise (“GSE”) mortgage-backed securities (“MBS”), corporate and sovereign debt, residential and retail loans and “other assets” (an extremely broad and undifferentiated category in the current NSFR) are often too high (that is, assume too little ability to realize liquidity in respect of the assets) relative to actual experience. Especially in the latter case, this is often due to insufficient granularity in the proposed ASF and RSF categories and failure to adequately differentiate between certain types of assets and liabilities based on their liquidity characteristics.
13 See Douglas W. Diamond & Philip H. Dybvig, Bank Runs, Deposit Insurance, and Liquidity, 91 Journal of Political Economy 401 (1983) (describing the costs and benefits to society of banks holding too little or too much liquid funding). If too much is invested, banks will not be able to meet their liquidity needs and will need to liquidate investments at a high cost. If too much is held in liquid assets, the lower return on deposits would be earned. Thus, the model, along with other banking theories that have expanded on it, illustrates how excess liquid assets can have real economic costs.

7Assessing the BAsel iii net stABle Funding RAtio in the Context oF ReCent impRovements in longeR-teRm BAnk liquidity the CleARing house
Historical Background and Current Context of Liquidity Regulation• Reserve Requirements and the Historical Regulation of Liquidity in the U.S.
• The Supervisory Review Approach to Liquidity Regulation
• Developments in Liquidity Regulation Since the Financial Crisis
• Supervisory Stress Testing of Liquidity and Other Potential U.S. Regulatory Initiatives
• Implications of the Historical Background and Current Context of Liquidity Regulation

8Assessing the BAsel iii net stABle Funding RAtio in the Context oF ReCent impRovements in longeR-teRm BAnk liquidity the CleARing house
III. Historical Background and Current Context of Liquidity Regulation
The 2007–2009 financial crisis indisputably demonstrated “how quickly and severely liquidity risks can crystalize and certain sources of funding can evaporate.”14 The issue of how to best regulate and ensure bank liquidity, however, is not new but is rather a concern with which policymakers have struggled since the beginnings of the development of a modern banking system in the 19th century.15 The historical progression of policy responses to financial crises discussed below amply demonstrates that reliance on any one particular method of liquidity regulation is often misplaced in the face of subsequent experience, and therefore the better answer may very well be to approach liquidity holistically from a variety of regulatory perspectives. In turn, the existence of multiple regulatory tools and supervisory approaches that have developed over time should permit each particular regulatory element – including the NSFR – to be properly calibrated in a balanced manner. In particular, the inherent conservatism of applying multiple, overlapping supervisory and regulatory tools to a single subject – liquidity risk – means that policymakers can and should avoid the understandable temptation to calibrate each individual element in the regulatory arsenal, by itself, to unrealistic and overly conservative levels.
a. rESErvE rEquIrEmEntS and tHE HIStorIcal rEgulatIon of lIquIdIty In tHE u.S.
Liquidity regulation has been a feature of the U.S. banking system for nearly 200 years. In the United States, state legislatures in Virginia, Georgia and New York began to deal with the aftermath of another banking crisis, the Panic of 1837, with respect to liquidity by introducing formal reserve requirements – that is, generally, requirements for banks to hold ready liquid assets, usually in the form of cash, specie and/or reserve deposits at other financial institutions, equal to a specified percentage of
14 Basel Committee Liquidity Consultative Document, supra note 10, at 1.
15 See, e.g., Walter Bagehot, Lombard Street: A description of the Money Market 48-49 (London, Henry S. King & Co. 3d ed. 1873) (“Ordinarily discredit does not at first settle on any particular bank.... At first, incipient panic amounts to a kind of vague conversation: Is A. B. as good as he used to be? Has not C. D. lost money? and a thousand such questions. A hundred people are talked about, and a thousand think, ‘Am I talked about, or am I not?’ ‘Is my credit as good as it used to be, or is it less?’ And every day, as a panic grows, this floating suspicion becomes both more intense and more diffused; it attacks more persons; and attacks them all more virulently than at first.”).
their liabilities.16 The basic purpose of reserves was to “meet sudden and unexpected demands” of a bank’s depositors and other creditors, including “to meet sudden apprehension or panic arising in any manner, rational or irrational.”17 By 1895, commercial banks in 21 states were required to hold reserves ranging from 10% to 33% of their liabilities, including some or all of their deposit liabilities.18 At the federal level, following the passage of the National Banking Acts during the Civil War, national banks were required to hold reserves equal to 15% or 25% of their deposits, depending on where the bank was located.19 The Panic of 1907 demonstrated that these reserve requirements were not, in and of themselves, sufficient to deal with a liquidity crisis. As a result, the Federal Reserve System was established under the Federal Reserve Act of 1913 to serve as the United States’ central bank and lender of last resort through the discount window, reserve requirements and other tools.20 The Federal Reserve Act also lessened reserve requirements, such that by the 1930s “reserve requirements were no longer seen by the Federal Reserve as playing an important role in providing liquidity,” given that “[s]ince the establishment of the Federal Reserve System, the liquidity of an individual bank [was] more adequately safeguarded by the presence of the Federal Reserve Banks, which were organized for the purpose, among others, of increasing the liquidity of member banks by providing for the rediscount of their eligible paper, than by the possession of legal reserves.”21
Since that time, the focus and reason for reserve requirements have generally shifted away from their origin as liquidity regulation toward other purposes.22 As the function of reserve requirements has substantially shifted over time, the basic policy issue of ensuring that a
16 See Mark A. Carlson, Lessons from the Historical Use of Reserve Requirements in the United States to Promote Bank Liquidity, at 4 (Finance and Economics Discussion Series, Divisions of Research & Statistics and Monetary Affairs, Federal Reserve, Staff Working Paper No. 2013-11, January 24, 2013). Prior to 1935, bank liabilities included both deposits and bank notes in circulation.
17 Bagehot, supra note 15, at 29.
18 Id.
19 12 Stat. 665 § 41; 13 Stat. 99 § 31; see also Carlson, supra note 16, at 5-6.
20 See Carlson, supra note 16, at 19-20.
21 See id. at 19-20 (citing Robert Rodkey, Legal Reserves in American Banking, at 64 (University of Michigan, School of Business Administration, Bureau of Business Research, 1934)), 24 (citing Federal Reserve Memorandum, Member Bank Reserve Requirements – Analysis of the Committee Proposal (1938)).
22 See 12 U.S.C. § 461(a)-(b); 12 C.F.R. § 204.1(b).

9Assessing the BAsel iii net stABle Funding RAtio in the Context oF ReCent impRovements in longeR-teRm BAnk liquidity the CleARing house
bank has access to a pool of readily available liquid assets to meet unexpected demands – whether of depositors or other creditors – remains as relevant as ever, and so banking supervisors have shifted their attention to other regulatory frameworks for liquidity over time.
B. tHE SupErvISory rEvIEw approacH to lIquIdIty rEgulatIon
For at least 35 years, the Agencies have approached liquidity regulation principally through a system of supervisory standards and scrutiny.23 Under the Agencies’ Uniform Financial Institution Rating System, the “L” in the composite “CAMELS” rating stands for liquidity.24 Under this system, the supervisory assessment of an institution’s liquidity is based on various factors, including: “the adequacy of liquidity sources compared to present and future needs and the ability of the institution to meet liquidity needs without adversely affecting its operations or condition; the availability of assets readily convertible to cash without undue loss; access to money markets and other sources of funding; the level of diversification of funding sources, both on- and off-balance sheet, the degree of reliance on short-term, volatile sources of funds, including borrowings and brokered deposits, to fund longer-term assets; the trend and stability of deposits; the ability to securitize and sell certain pools of assets; and the capability of management to properly identify, measure, monitor, and control the institution’s liquidity position, including the effectiveness of funds management strategies, liquidity policies, management information systems, and contingency funding plans.”25 Regulatory assessments and supervision of liquidity is a crucial component of the Agencies’ detailed examination regime for both bank holding companies and their depository institution subsidiaries.26
23 See Federal Deposit Insurance Corporation (“FDIC”), PR-52-78, Banking Agencies Adopt Uniform Interagency Bank Soundness Rating System, Federal Banking Law Reporter Regulatory Developments (1945 to present) (May 10, 1978); see also FDIC, The First Fifty Years: A History of the FDIC 1933-1983 at 128-32 (Washington, D.C. 1984), available at http://www.fdic.gov/bank/analytical/firstfifty/.
24 See Federal Banking Agencies, SR 96-38 (December 27, 1996); see also 12 C.F.R. § 225.8(d)-(f ).
25 SR 96-38, supra note 24, at 11-12.
26 For national banks, see Office of the Comptroller of the Currency, Comptroller’s Handbook – Safety and Soundness, Liquidity (June 2012). For state member banks and bank holding companies, see Federal Reserve, Commercial Bank Examination Manual, Section 4020; Federal Reserve, Bank Holding Company Supervision Manual, Section 4010; Federal Reserve, Trading and Capital Markets Activities Manual, Section 2030. For state non-member banks, see Federal Deposit Insurance Corporation, Revised Examination Guidance for Liquidity and Funds Management (Trans. No. 2002-01) (Nov. 19, 2001); Federal Deposit Insurance Corporation, Liquidity Risk Management, Financial Institution Letter 84-2008 (August 2008). See also Basel Committee, Principles for Sound Liquidity Risk Management and Supervision (September 2008) (the “Basel Liquidity Principles”).
Similarly, prior to the proposal and adoption of the Basel III Liquidity Framework, liquidity was also seen at the international level solely as a supervisory review, or “Pillar 2,” matter, whereby the Basel Committee expected that “[b]anks should evaluate the adequacy of capital given their own liquidity profile and the liquidity of the markets in which they operate” and “[s]upervisors should regularly perform a comprehensive assessment of a bank’s overall liquidity risk management framework and liquidity position to determine whether they deliver an adequate level of resilience to liquidity stress given the bank’s role in the financial system.”27
c. dEvElopmEntS In lIquIdIty rEgulatIon SIncE tHE fInancIal crISIS
Although this historical emphasis on supervisory processes for liquidity risk management was broadly viewed as sufficient for a number of years, significant weaknesses were revealed over the course of the 2007–2009 financial crisis. In particular, the financial crisis identified deficiencies in banks’ liquidity risk management, including “insufficient holdings of liquid assets, funding risky or illiquid asset portfolios with potentially volatile short-term liabilities, and a lack of meaningful cash flow projections and liquidity contingency plans.”28 At the international level, policymakers reacted to these identified weaknesses by quickly establishing new global liquidity standards – the LCR and the NSFR – as part of the Basel III set of bank regulatory reforms.
In the United States, the Agencies first sought to address some of these issues in their revised 2010 Interagency Policy Statement on Liquidity Risk Management, which “articulates the process that depository institutions should follow in appropriately identifying, measuring, monitoring, and controlling their funding and liquidity risks… [and] re-emphasizes the importance of cash flow projections, diversified funding sources, stress testing, a cushion of liquid assets, and a formal, well-developed contingency funding plan as primary tools for measuring and managing funding and liquidity risks.”29 In addition, the Agencies’ supervisory liquidity requirements are meant to be tailored for each specific institution, reflecting an expectation that “all supervised financial institutions… manage their liquidity risk using processes and systems that are commensurate with their complexity, risk profile, and scope of operations.”30
27 Basel Committee, Consultative Document: Pillar 2 (Supervisory Review Process), at 161 (January 2001) (bank internal assessments); Basel Liquidity Principles, supra note 26, at 4 (supervisory assessments).
28 Federal Reserve, Interagency Policy Statement on Funding and Liquidity Risk Management, 75 Fed. Reg. 13,660 (Mar. 22, 2010).
29 See id.; see also Basel Liquidity Principles, supra note 26; Federal Banking Agencies, SR 10-6, at 1 (March 17, 2010).
30 Id.

10Assessing the BAsel iii net stABle Funding RAtio in the Context oF ReCent impRovements in longeR-teRm BAnk liquidity the CleARing house
This immediate supervisory response was followed shortly thereafter by enactment of the Dodd-Frank Act, Section 165 of which mandates that the Federal Reserve implement enhanced prudential supervision standards for certain domestic and foreign banks with over $50 billion in assets, including “liquidity requirements.”31 In late 2011, the Federal Reserve proposed regulations implementing these statutory requirements for U.S. domestic institutions (the “Section 165 Domestic Proposal”), followed by a related proposal for foreign banking organizations (the “Section 165 FBO Proposal,” and together with the Section 165 Domestic Proposal, the “Section 165 Proposals”) in late 2012.32
The Section 165 Domestic Proposal’s liquidity-related requirements in many ways build upon the Agencies’ existing, supervisory-based approach to liquidity oversight, and include the following elements:
y Corporate Governance Provisions. Detailed provisions with respect to responsibilities of the board of directors and its risk committee, as well as senior management, with respect to various liquidity-related matters such as liquidity risk tolerance, the liquidity costs, benefits and risks of each significant new business line, contingency funding plans, liquidity metrics, cash flow projections, liquidity stress testing and liquidity buffer composition.
y Cash Flow Projections. Requiring covered banks to produce comprehensive cash flow projections that, among other things, take into account cash flows arising from assets, liabilities and off-balance-sheet exposures over “short-term and long-term periods that are appropriate to the covered bank’s capital structure, risk profile, complexity, activities, size and other risk related factors.”33 They also require covered banks to identify and quantify discrete and cumulative cash flow mismatches.
y Internal Liquidity Stress Testing. Mandating covered banks to regularly stress test cash flow projections and to use those stress tests in determining the size of their liquidity buffers, incorporating a range of stress scenarios, taking into consideration, among other things, market stress, idiosyncratic stress and combinations of the two, and address potential actions of other market participants experiencing liquidity stress. The time horizons, at a minimum, must include an overnight time horizon, a 30-day time horizon, a 90-day
31 12 U.S.C. § 5365(a); 12 U.S.C. § 5365(b)(1)(A)(ii).
32 Federal Reserve, Enhanced Prudential Standards and Early Remediation Requirements for Covered Companies, 77 Fed. Reg. 594 (Jan. 5, 2012) (the “Section 165 Domestic Proposal”); Federal Reserve, Enhanced Prudential Standards and Early Remediation Requirements for Foreign Banking Organizations and Foreign Nonbank Financial Companies, 77 Fed. Reg. 76,628 (December 28, 2012) (the “Section 165 FBO Proposal”).
33 Section 165 Domestic Proposal, 77 Fed. Reg. at 607.
time horizon and a one-year time horizon. This stress testing must incorporate the following assumptions: for the first 30 days of a liquidity stress scenario, only highly liquid assets that are unencumbered may be used as a cash flow source to offset projected funding needs; for periods beyond the first 30 days, highly liquid assets that are unencumbered and other “appropriate funding sources” may be used as cash flow sources.
y Maintenance of Liquidity Buffer. Requiring covered companies to maintain a liquidity buffer of “highly liquid assets” that are “unencumbered.” The liquidity buffer must be sufficient to meet projected net cash outflows and the projected loss or impairment of existing funding sources for 30 days over a range of liquidity stress scenarios, using the liquidity stress testing referenced above. For purposes of the liquidity buffer, the term “highly liquid assets” is defined to mean (i) cash, (ii) securities issued or guaranteed by the U.S. government, a U.S. government agency or a U.S. government-sponsored agency, or (iii) any other asset that the covered company demonstrates to the satisfaction of the Federal Reserve (x) has low credit and low market risk, (y) is traded in an active secondary two-way market that has observable prices, and (z) meets other standards and is of a type that investors have historically purchased in periods of financial market distress during which market liquidity is impaired.
y Contingency Funding Plan. Mandating each covered bank to “establish and maintain a contingency funding plan that sets out the [bank’s] strategies for addressing liquidity needs during liquidity stress events.”34 The contingency funding plan must: include a quantitative assessment incorporating information generated by the stress testing described above; include an event management process that sets out the covered company’s procedures for managing liquidity during identified liquidity stress events; include procedures for monitoring emerging liquidity stress events; and provide for periodic testing of the components of the contingency funding plan to assess its reliability during liquidity stress events.
y Specific Limits. Requiring each covered bank to establish or maintain limits on potential sources of liquidity risk, including: concentrations of funding by instrument type, single counterparty, counterparty type, secured and unsecured funding and other liquidity risk identifiers; the amount of specified liabilities maturing within various time horizons; and off-balance-sheet exposures and other exposures that could create funding needs during liquidity stress events.
y Monitoring. Mandating a variety of monitoring requirements, including with respect to “liquidity risk exposures and funding needs within and across
34 Id., 77 Fed. Reg. at 648.
11Assessing the BAsel iii net stABle Funding RAtio in the Context oF ReCent impRovements in longeR-teRm BAnk liquidity the CleARing house
significant legal entities, currencies, and business lines” and intraday liquidity positions.35
It is worth noting that although conceptually similar to the Basel III Liquidity Framework in respect of the types of risks that it seeks to address, the Section 165 Domestic Proposal differs in a number of substantial respects, including that: (i) unlike the Basel III Liquidity Framework (with the LCR’s 30-day time horizon and the NSFR’s one-year time horizon), covered companies are afforded some discretion in establishing appropriate periods, thereby avoiding the potential pitfalls of 30-day and one-year “cliff effects”; (ii) covered companies have greater flexibility in the definition of “highly liquid assets” without the differentiation between Level 1 and Level 2 assets that exists for purposes of the LCR; (iii) covered companies are permitted to establish their own liquidity risk tolerances for each time horizon other than the liquidity buffer’s 30-day horizon, taking into account each bank’s individual capital structure, risk profile, complexity, activities, size, and other appropriate risk-related factors; and (iv) the incorporation of some responsive management actions into liquidity stress tests and contingency funding plans is permitted.
Most importantly, the Section 165 Domestic Proposal does not impose rigid, prescriptive, one-size-fits-all regulatory ratios like the LCR and the NSFR. The Section 165 Domestic Proposal significantly enhances the Agencies’ heretofore supervisory approach to liquidity regulation as described above, while maintaining its appropriate flexibility for each covered company to tailor its liquidity management to its particular asset/liability mix and other applicable facts and circumstances.
The Clearing House, in a joint trades comment letter dated April 27, 2012, to the Federal Reserve addressing the Section 165 Domestic Proposal, generally endorsed “the liquidity risk management tools addressed” therein given that “the core principles embedded within the [Section 165 Domestic Proposal] reflect actual risk and are consistent with current enhanced liquidity-risk
35 Id., 77 Fed. Reg. at 649. The Section 165 FBO Proposal generally takes a similar approach to liquidity regulation for the U.S. intermediate holding company (“IHC”) to be set up by certain foreign banking organizations (“FBOs”) with more than $50 billion in global assets and more than $10 billion in U.S. assets (excluding branch and agency assets) as the Section 165 Domestic Proposal, subject to certain exceptions having to do with liquidity stress testing and liquidity buffer requirements that would apply separately (and somewhat differently in scope and context) to an FBO’s U.S. branch/agency network and to its U.S. IHC. Section 165 FBO Proposal, 77 Fed. Reg. at 76,646-50. In addition, FBOs with $50 billion or more in total assets and combined U.S. assets of less than $50 billion would be required to report to the Federal Reserve annually on the results of a global or U.S. liquidity stress test or be forced into a net due-to funding position, or a net due-from funding position, with non-U.S. affiliated entities equal to no more than 25% of the third-party liabilities of its combined U.S. operations, on a daily basis. Id. at 76,653.
management practices of many banks.”36
d. SupErvISory StrESS tEStIng of lIquIdIty and otHEr potEntIal u.S. rEgulatory InItIatIvES
The core set of liquidity-related regulatory reforms that we have described above has also been followed by other supervisory developments and trends that indicate that liquidity regulation is likely to continue to evolve in the future. For example, we understand that the Federal Reserve also has recently begun conducting a horizontal supervisory liquidity stress-test assessment of certain large U.S. banks, colloquially referred to as “C-LAR.”37 In addition, the Federal Reserve has recently previewed other potential regulatory initiatives that relate to liquidity.38 For example, Federal Reserve Governor Tarullo recently expressed special concerns regarding the potential systemic risk of large firms that rely on the use of short-term wholesale funding.39 Governor Tarullo suggested that the best approach for addressing this issue may be through the imposition of a meaningfully higher liquidity requirement or a meaningfully higher capital requirement, noting that “the relationship between the two also matters.”40 He also identified “requiring higher levels of capital for large firms unless their liquidity position is substantially stronger than minimum requirements” as a possible approach. 41 Governor Tarullo stated that such a suggested “approach would allow a firm of systemic importance to choose between holding capital in greater amounts… or changing the amount and composition of its liabilities.”42 The capital requirements would consist of additional common equity capital requirements that are “material.”43
36 Section 165 Letter, supra note 4, at 22-23.
37 See Shahien Nasiripour, Fed begins stress test on bank liquidity, The Financial Times (December 13, 2012); see also 12 C.F.R. § 225.8.
38 See Tarullo Speech, supra note 6; Yellen Speech, supra note 10.
39 In anticipation of potential regulatory initiatives related to short-term/wholesale funding like those noted in Governor Tarullo’s speech, The Clearing House has formed a short-term/wholesale funding task force to study and provide industry thought leadership on such proposals as further details become publicly available.
40 Tarullo Speech, supra note 6; see also Daniel K. Tarullo, Opening Statement at Federal Reserve Board Open Meeting (July 2, 2013), http://www.federalreserve.gov/newsevents/press/bcreg/tarullo20130702a.htm (“[S]taff is currently working on a recommendation for an advance notice of proposed rulemaking to seek comment on possible approaches to requiring additional measures that would directly address risks related to short-term wholesale funding, including a requirement that large firms substantially dependent on such funding hold additional capital.”).
41 Tarullo Speech, supra note 6.
42 Id.
43 Id.

12Assessing the BAsel iii net stABle Funding RAtio in the Context oF ReCent impRovements in longeR-teRm BAnk liquidity the CleARing house
E. ImplIcatIonS of tHE HIStorIcal Background and currEnt contExt of lIquIdIty rEgulatIon
The evolution of these approaches to how to best regulate and ensure bank liquidity – ranging from reserve requirements to central bank liquidity backstops to supervisory review of liquidity to post-financial crisis enhancements to the prudential supervision of liquidity as embodied in the Section 165 Proposals to the Basel III Liquidity Framework – underscores two important and interrelated observations of which the Basel Committee and the Agencies should be mindful in reviewing and revising the current NSFR.
First, the historical progression of policy responses to financial crises amply demonstrates that over-emphasis on one particular method of liquidity regulation – such as reserve requirements or central bank lending – as a potential panacea to the question of how to best ensure bank liquidity is often misplaced in the face of subsequent experience. From a public policy perspective, the better answer is likely to be a holistic approach to liquidity from a variety of regulatory perspectives, including prescriptive quantitative ratio-based approaches such as the LCR (itself a kind of conceptual successor to nineteenth-century reserve requirements), supervisory or “Pillar 2”-like regulatory review of bank liquidity risk management practices, and enhanced prudential supervision of liquidity (e.g., as embodied in the Section 165 Proposals). As a new metric to be introduced on top of these existing complementary tools, the NSFR metric will not be – and does not need to aspire to be – a stand-alone solution to the public policy issue of bank liquidity, addressing all possible sources of liquidity risk and all possible liquidity scenarios. Rather, it should be viewed as one aspect of a holistic portrait of bank liquidity, and, as such, integrated with other existing tools in a balanced manner. This is achievable as both a conceptual and a practical matter. For example, the Federal Reserve’s approach to liquidity-related quantitative analyses and metrics as set forth in the Section 165 Domestic Proposal for the most part permits covered companies to achieve a proper balance between appropriate levels of liquidity over a range of time horizons, on the one hand, and the adverse consequences of excessive holdings of liquidity, on the other hand.44
While there can be no certainty as to exactly what the next crisis will look like or when it might occur, the Agencies, other regulators and the banking industry as a whole will certainly be much better prepared to deal with the next crisis given past experience and various regulatory initiatives and innovations since 2007–2009. The multi-faceted nature of this regulatory response counsels against the understandable temptation to treat each individual element in that arsenal as the dominant or even sole
44 See Section 165 Letter, supra note 4; see also Diamond & Dybvig, supra note 13.
element and thereby to calibrate that element, by itself, to unrealistic and artificially high levels. The existence of multiple regulatory tools and supervisory approaches should permit each particular regulatory element – like the NSFR – to be properly calibrated in a balanced manner because there are redundancies in dealing with the same subject matter in the supervisory arsenal – like Pillar 2 review and enhanced prudential supervision.45 As set forth in Part V below, there are negative consequences of excessive holdings of liquidity – consequences not just for banks, but, more importantly, for their customers and the broader economy as a whole.
Therefore, the NSFR should neither be structured nor calibrated to such a high level as to tilt the balance towards excessive liquidity and its concomitant negative economic effects. Unfortunately, as we describe in Part IV.A below, The Clearing House’s quantitative analysis indicates that the key aspects of the current NSFR are improperly calibrated in just that manner. Accordingly, we have included in this report a number of specific recommendations, described in Parts IV.B and IV.C, designed to facilitate a more balanced NSFR framework.
Second, the ultimate, revised NSFR framework should take into account the various multiple regulatory initiatives relating to liquidity that have been developed since the financial crisis, including the Section 165 Proposals, the C-LAR liquidity stress-test assessment of certain large U.S. banks and possible future regulations tying required levels of regulatory capital to required levels of liquidity (or vice versa) and their likely impact and effect – both individually and in the aggregate. In finalizing the NSFR, it is important that the regulatory community consider how it and these other reforms will work together synergistically (or not). If these various new reforms are not harmonized in their development or in their application, unintended public policy consequences and “pile-on” effects are likely to result.
45 Moreover, ensuring that the NSFR is not over-emphasized – either because it is the only longer-term measure that is used or because it is calibrated to artificially high levels and therefore requires disproportionate resources and management attention to satisfy – will allow an appropriate focus on other key aspects of medium-term liquidity planning, such as a more qualitative supervisory review of management contingency plans and internal controls.

13Assessing the BAsel iii net stABle Funding RAtio in the Context oF ReCent impRovements in longeR-teRm BAnk liquidity the CleARing house
As Currently Formulated, the NSFR Framework Suffers from Multiple Flaws• Quantitative Improvements in Bank Liquidity Since 2010 Empirically Demonstrate Shortcomings
in the Overall Accuracy of the Current NSFR as a Tool for Assessing Liquidity Risk
• The Structure and Key Elements of the Current NSFR Suffer from Conceptual Challenges
• Recalibrations Needed to Improve the Accuracy of the Current NSFR as a Liquidity Risk Measure

14Assessing the BAsel iii net stABle Funding RAtio in the Context oF ReCent impRovements in longeR-teRm BAnk liquidity the CleARing house
IV. As Currently Formulated, the NSFR Framework Suffers from Multiple Flaws
a. quantItatIvE ImprovEmEntS In Bank lIquIdIty SIncE 2010 EmpIrIcally dEmonStratE SHortcomIngS In tHE ovErall accuracy of tHE currEnt nSfr aS a tool for aSSESSIng lIquIdIty rISk
As previously described in The Clearing House’s 2011 Liquidity White Paper, since the onset of the financial crisis, banks have enhanced their liquidity risk management practices, which are now firmly rooted in dynamic forward-looking stress testing, disciplined corporate governance, contingency funding plans and comprehensive liquidity risk gradation of how a bank’s various balance sheet instruments will behave under stress.46
To inform our assessment of the current NSFR, The Clearing House undertook extensive empirical quantitative research into bank liquidity and the current NSFR, which has two main components. First, The Clearing House gathered and analyzed publicly available data sources with respect to the U.S. commercial banking industry as a whole concerning the following standard generally accepted bank liquidity metrics over the same time horizon: (i) reliance on wholesale funding; (ii) reliance on interbank lending; (iii) demand deposits as a percentage of assets; and (iv) amount of short-term liabilities as compared to short-term assets. Second, The Clearing House analyzed internal and proprietary liquidity data from December 31, 2010 to June 30, 2012 collected from 11 large U.S. banks, whose assets collectively total approximately $9.2 trillion, or approximately 52.6% of the U.S. banking industry (the “Participating Banks”).47 Using this liquidity data, we then calculated (i) an estimated aggregate U.S. banking industry ASF and RSF and (ii) an estimated aggregate U.S. banking industry NSFR (the “Industry NSFR”).48 These two data sets facilitate a comparison of changes in the Industry NSFR to
46 See 2011 Liquidity White Paper, supra note 5, at 32-37.
47 All Participating Banks offer both retail and wholesale products; eight have investment banking divisions; and two are subsidiaries of FBOs. The Clearing House gathered liquidity data from the Participating Banks as of the end of every two quarters from the end of 2010 to the end of the second quarter of 2012.
48 The estimated aggregate U.S. banking industry ASF and RSF and the Industry NSFR were computed using all Participating Banks in accordance with the methodology published in the 2010 Liquidity Framework. The estimated aggregate U.S. banking industry shortfall (the “NSFR Shortfall”) is calculated only with respect to Participating Banks that have less than a 100% current NSFR, because the excess liquidity of these banks is not fungible across the industry. As the Participating Banks comprise approximately 52.6% of the U.S. commercial banking industry by assets ($9.2 trillion out of $17.5 trillion), the NSFR Shortfall is calculated by multiplying the total shortfall from the 11 Participating Banks by 1.90 (or $17.5 trillion / $9.2 trillion).
changes in other accepted measures of U.S. commercial banking industry liquidity.
Simply put, if the NSFR were an effective measure of liquidity, it should capture and positively correlate to other objective improvements in liquidity in at least a roughly concomitant manner. However, our quantitative analysis demonstrates that, despite objective improvements in these standard liquidity metrics, which indicate that the U.S. commercial banking industry is objectively safer from a liquidity perspective, the Industry NSFR did not increase commensurably. This result demonstrates that the current NSFR suffers from analytical and policy shortcomings that need to be proactively addressed as part of the ongoing review of the NSFR framework.
1. reduced reliance on wholesale funding
As shown in Exhibit 1, from December 2010 through June 2012, U.S. commercial banks have reduced their reliance on wholesale funding as a percentage of total liabilities by 3.6 percentage points, from 23.2% to 19.6%, or $248 billion.49 This reduction in reliance on wholesale funding is significant because of the role that wholesale funding is considered by some to have played in the recent financial crisis.50
49 Wholesale funding includes commercial paper, brokered deposits and repurchase agreements, but does not include deposits from corporate customers. Reliance on wholesale funding is defined as: [(Total borrowings) + (Brokered Deposits)] / [(Total borrowings) + (Total Deposits)]. This ratio depicts the portion of a bank’s total funds that are from wholesale sources.
50 See, e.g., William Dudley, Fixing Wholesale Funding to Build a More Stable Financial System (February 1, 2013), http://www.newyorkfed.org/newsevents/speeches/2013/dud130201.html (“Not only did this aspect of our financial system create the potential for a firm to fail in an extraordinarily rapid manner when faced with a loss of market confidence, but it also served as a channel through which the effects of those failures were widely propagated throughout the broader financial system.”).

15Assessing the BAsel iii net stABle Funding RAtio in the Context oF ReCent impRovements in longeR-teRm BAnk liquidity the CleARing house
ExHIBIt 1: wHolESalE fundIng mEtrIcS51
U.S. commercial banks reliance on wholesale fundingPercent
0
5
10
15
20
25
30
35
20121008060220009896941992 04
$2,417T
$2,169T
Reliance on wholesale funding (%) Crisis period
+15.7ppt(’92-’08)
-11.6ppt(’08-’12 Q2)
-3.6pptor $248B (’10-’12 Q2)
51 Source: Call reports (Consolidated Reports of Condition and Income) for all U.S. commercial banks (annual reports from 1992–2011; quarterly reports for the second quarter of 2012).
Further evidence for this conclusion can be found in the commercial paper and repo markets where, consistent with the foregoing reduction in reliance on wholesale funding, the market for commercial paper and repurchase agreements also has declined over time. Commercial paper outstanding declined to $1.0 trillion from its peak volume of $2.0 trillion in 2006, and repo and reverse repo agreements declined to $4.9 trillion from their peak volume of $6.5 trillion in 2008, as shown in Exhibit 2. Although short-term markets are no longer in crisis mode, banks have steadily decreased their short-term funding reliance as described further in Part IV.A.2 below.

16Assessing the BAsel iii net stABle Funding RAtio in the Context oF ReCent impRovements in longeR-teRm BAnk liquidity the CleARing house
ExHIBIt 2: dEclInE of commErcIal papEr and rEpo markEt poSt-crISIS52
0
5
10
15
20
96 97 98 99 00 01 02 03 04 05 06 07 08 09 10 11
+5ppt
$1.0T
$2.0T
$0.8T
$1,6T
0
10
20
30
40
50
96 97 98 99 00 01 02 03 04 05 06 07 08 09 10 11
+24ppt
$4.9T
$6.5T
$1.7T
Commercial paper outstanding as % of US GDP, Percent
Repurchase and reverse repurchase agreements outstanding as % of US GDP, Percent
Crisis period
52 Source: Commercial paper data from SIFMA report on Outstanding Money Market Instruments. Repo and reverse repo data from Federal Reserve Bank of New York, Financing by U.S. Government Securities Primary Dealers (figures cover financing involving U.S. government, federal agency, corporate and federal agency MBS securities). GDP data sourced from Work Bank data.
2. reducing proportion of short-term funding
Since 2007, U.S. commercial banks have gone from a net short-term liability surplus – that is, short-term liabilities were funding long-term assets – to a net short-term liability deficit – that is, there are fewer short-term liabilities than short-term assets. The ratio of net short-term liabilities to total assets is usually referred to as “rollover risk” and indicates the degree of exposure assumed by funding assets with short-term liabilities.53 Generally, the higher the rollover risk number, the more vulnerable a bank is to disruptions in funding sources, which can result in the need to raise funding for existing assets.
As shown in Exhibit 3, from December 2010 to June 2012, the aggregate net short-term liability deficit of the U.S. banking industry increased by $584 billion, from negative
$322 billion to negative $906 billion. This finding clearly demonstrates that banks had a lower rollover risk as of June 2012 and are therefore less likely to have their funding disrupted than they were at the end of 2010.
53 Net Short-term Liabilities/Assets = [(Short-term Liabilities) - (Short-term Assets)] / [Total Assets]. “Short-term,” for these purposes, refers to instruments with a contractual maturity of one year or less. Short-term liabilities are defined as time deposits with remaining maturity of one year or less, other borrowed money with remaining maturity of one year or less, deposits in foreign offices with remaining maturity of one year or less, securities sold under agreements to repurchase and federal funds purchased and demand notes issued to the U.S. Treasury. Short-term Assets are defined as interest-bearing bank balances, federal funds sold and securities purchased under agreements to resell, debt securities with a remaining maturity of one year or less and loans and leases with a remaining maturity of one year or less.

17Assessing the BAsel iii net stABle Funding RAtio in the Context oF ReCent impRovements in longeR-teRm BAnk liquidity the CleARing house
ExHIBIt 3: dEcrEaSE In nEt SHort-tErm fundIng54
-8
-6
-4
-2
0
2
4
6
8
10
03 02 12
-$906B
11 2010
-$322B
2001 07 06 05 08 09 04
Net short-term funding of U.S. commercial banks
Percent
Net short-term liabilities to total assets Crisis period
-4.6ppt
54 Source: Call reports (Consolidated Reports of Condition and Income) for all U.S. Commercial Banks (annual reports from 2001–2011; quarterly reports for the second quarter of 2012).
3. reducing reliance on interbank lending
As shown in Exhibit 4, since 2008 interbank lending has decreased by approximately $330 billion. For the U.S. commercial banking industry in the aggregate, interbank borrowings decreased from 4.1% of total assets in June 2008 to 0.9% of total assets in June 2012, a 77% decline. From December 2010 through June 2012, interbank loans as a percentage of total assets decreased by 0.5 percentage points, from 1.4% to 0.9%. Total interbank loans decreased by $42.4 billion, from $160.9 billion to $118.5 billion, over the same period.
The Basel Committee has postulated that lower rates of interbank lending may reduce the risk of contagion in light of the possibility of “financial distress at one institution [leading to] distress at other institutions given the network
of contractual obligations.”55 This is because bank balance sheets have liquidity risk arising from rollover risk and maturity mismatch between short-term, liquid liabilities and long-term, less liquid assets; excessive liquidity risk may expose banks to runs which, where interconnectivity and coordination failures are also present, can lead to broader panic and insolvency. Thus, because the interbank lending market provides a potential channel of contagion in certain situations, over-reliance on interbank loans may raise systemic risk.
55 Basel Committee, Global systemically important banks: assessment methodology and the additional loss absorbency requirement, at 7 (November 2011). However, we also note that interbank lending is not necessarily and inherently linked to contagion risk and can be a stabilizing factor to the banking sector as a whole by playing an important positive role as both a source of bank liquidity and a means of investing capital on the asset side of the balance sheet for the lending banks. Nevertheless, the decline in interbank lending is consistent with U.S. commercial banks’ general shift away from shorter-dated funding as described in this Part IV.A. See Xavier Freixas, Bruno M. Parigi & Jean-Charles Rochet, Systemic Risk, Interbank Relations, and Liquidity Provision by the Central Bank, 32 Journal of Money, Credit and Banking 611-38 (August 2000); Giulia Iori, Saqib Jafarey & Francisco G. Padilla, Systemic Risk on the Interbank Market, 61 Journal of Economic Behavior and Organization 525-42 (December 2006).

18Assessing the BAsel iii net stABle Funding RAtio in the Context oF ReCent impRovements in longeR-teRm BAnk liquidity the CleARing house
ExHIBIt 4: rEductIon of IntErBank lEndIng; ImprovEmEnt In dEpoSIt BaSE56
U.S. Commercial banks funding trends Percent
0
1
2
3
4
5
6
7
Q4 2010
$160.9B
$536.5B
Q4 2008
Q2 2012
$118.5B
$844.2B
Q4 2006
$448.5B
Interbank loans / Total assets
Demand deposits / Total assets Crisis period
-0.5ppt(-$42.4B)
+2.1ppt($307.7B)
$330B = $448.5-118.5B-77% = (0.9-4.1)/4.1
56 Source: Federal Reserve Economic Data (FRED), Federal Reserve Bank of St. Louis, Demand Deposit and Interbank Loans data for all Commercial Banks, Seasonally Adjusted.
4. Improvements to deposit base
As also indicated in Exhibit 4 above, demand deposits of U.S. commercial banks increased by $308 billion, from $536.5 billion in December 2010 to $844.2 billion in June 2012, representing a 2.1 percentage point increase in demand deposits as a percentage of total assets, from 4.5% to 6.6%. As generally recognized, demand deposits, and especially retail deposits, generally are more stable than other sources of funding, including wholesale funding.57
57 See, e.g., 2011 Liquidity White Paper, supra note 5, at 16-19 (discussing the deposit run-off experiences of Wachovia and other large U.S. banks during the 2007–2009 financial crisis). Acknowledgment of the relative stability of demand deposits is also embedded in the LCR and the current NSFR. See Basel III: Final LCR Framework, supra note 2, at 67 (specifying assumed run-off rates in the LCR stress scenario of 0%-10% for retail deposits versus 5%-100% for different types of unsecured wholesale funding); 2010 Liquidity Framework, supra note 2, at 27 (specifying assumed run-off rates in the NSFR stress scenario of 10%-20% for demand deposits versus 50%-100% for different types of wholesale funding).
5. despite objective improvements in these liquidity metrics, the aggregate industry nSfr did not increase commensurably
The Clearing House’s empirical quantitative analysis shows that the Industry NSFR would be at 87% as of July 2012, representing an approximately 1.0 percentage point improvement from the December 2010 Industry NSFR of 86%. Thus, despite these objective positive changes in banks’ liquidity profiles as demonstrated in Parts IV.A.1-4 above, as currently formulated, the Industry NSFR would have only shown an improvement of approximately one percentage point over the same period. Yet all but one of the liquidity elements described above show quantitative improvements greater than the increase in the Industry NSFR over the same period, and the aggregation of these individual elements would be expected to yield presumably some increase in the Industry NSFR that is at least equal to – if not synergistically greater than – the sum of its parts. As illustrated by Exhibit 5, our findings indicate that this is clearly not the case.

19Assessing the BAsel iii net stABle Funding RAtio in the Context oF ReCent impRovements in longeR-teRm BAnk liquidity the CleARing house
Exhibit 5: recent u.S. banking industry liquidity management improvements are not reflected in the current nSfr
2.1%
0.5%
3.6%
4.6%
1.0%
Improvements from Q4 2010- Q2 2012
Percentage points (absolute)
NSFR Reduction in reliance on wholesale
funding as a percentage of total liabilities
Reduction in interbank loans as a
percentage of total assets
Reduction in net short-term liabilities as a percentage of
total assets
Increase in demand
deposits as a percentage of
total assets
These empirical results, as well as the other issues discussed in Part IV.B below, demonstrate that the NSFR, as currently formulated, suffers from analytical shortcomings that should therefore be proactively addressed. Fundamentally, a liquidity metric that is empirically demonstrated not to correlate to common and objective measurements of improvements in bank liquidity is simply not credible and does not further the goal shared by the regulatory community and the banking industry “to improve the banking sector’s ability to absorb shocks arising from financial and economic stress, whatever the source, thus reducing the risk of spillover from the financial sector to the real economy.”58
B. tHE StructurE and kEy ElEmEntS of tHE currEnt nSfr SuffEr from concEptual cHallEngES
In addition to the empirical evidence that the current NSFR fails to reflect holistic improvements in banks’ funding profiles, and apart from the specific errors in the proposed calibration of certain elements of the current NSFR that we identify in Part IV.C below, there are several conceptual challenges with the NSFR that should be reconsidered in the context of the review of this metric.
First, the current NSFR is constructed as a standardized, universally applicable set of assumptions about the impact of a generic, longer-term stress event on a bank, and yet those assumptions do not take into account contingent actions that management may take in the event of a stress scenario to actively and prudently manage liquidity risk
58 2010 Liquidity Framework, supra note 2, at 1.
in a positive manner. For example, prudent and measured management responses to stress could include any action from balance sheet reduction (or reducing rates of asset growth) to a change in asset mixes to proactive efforts to slow deposit run-off, but the current NSFR assumes that no such actions will ever be taken.
This assumption should be reconsidered. Even during the financial crisis, banks were able to conduct asset sales, securitize, raise capital, and take other similar measures to bolster liquidity. It is true that certain mitigating actions may not be available in times of stress, but assuming that a bank would take essentially no responsive action over an entire year obscures the NSFR’s ability to meaningfully reflect and evaluate the strength and stability of a bank’s medium-term funding profile. For example, the NSFR could be modified to include a factor or adjustment that could be applied based on potential management responses or alternative funding activities under the applicable stress conditions (similar to the “appropriate funding sources” concept under the Section 165 Domestic Proposal). The use of this factor or adjustment would certainly be subject to close supervisory scrutiny and validation, which in turn would reflect the quality of the bank’s liquidity and funding management processes and procedures. If modified in this manner, the NSFR would cease to suffer from the compounding effect of unduly conservative assumptions and produce a more realistic view of the extent to which banks have properly matched assets and funding horizons.
Second, the current NSFR is asymmetrical insofar as it assumes that, at the same time management is abstaining

20Assessing the BAsel iii net stABle Funding RAtio in the Context oF ReCent impRovements in longeR-teRm BAnk liquidity the CleARing house
from taking any positive action, management is elsewhere taking affirmative actions during the 12-month stress period that would weaken its overall liquidity position. This assumption is similarly illogical and inconsistent with realistic expectations. For example, the current NSFR implicitly assumes that a bank will choose to renew or originate new residential mortgage loans equal to 65%-85% of mortgage loan repayments due within the one-year time horizon, even though responsible management may very well cause the bank not to do so if renewals and originations at that level would strain the bank’s liquidity during a period of stress.59 Introducing some type of factor or adjustment into the NSFR for management action would also resolve this conceptual asymmetry.
Third, the current NSFR’s binary approach to categorizing liabilities as either “stable” or “non-stable” creates a “cliff effect” for funding at the one-year time horizon, which can distort a bank’s true long-term funding position and suggest a false comparability between banks whose funding profiles are actually quite different in terms of overall stability. For example, a bank whose term funding sources have residual maturities of three months (50% of term funding) and 13 months (50% of term funding) would look the same under the current NSFR, with respect to term funding sources as a bank whose term funding sources have residual maturities of 11 months (50% of term funding) and 36 months (50% of term funding), even though the bank with 13 months of stable term funding would go from having 50% stable term funding to 0% stable term funding within a month. In the ordinary course of business, the bank with 13 months of stable funding would presumably roll over its funding to prevent a dramatic drop in its NSFR. Yet this is precisely what it might not be able to do during a period of stress. The “time decay” of the NSFR – that is, its sensitivity to the passage of time, which is large for the bank with 13 months of stable term funding and much smaller for the bank with 36 months of stable term funding – seems highly relevant but is not captured by the NSFR itself. In this respect, the current NSFR’s static, one-year balance-sheet approach differs from the stressed-cash-flow approach that most banks currently use today, which includes assessments
59 This is reflected in the fact that residential mortgages with a maturity of less than one year would generally have an RSF factor of either 65% or 85%, which is effectively an assumption that a bank could not realize liquidity from 65%-85% of those loans within the one-year time horizon, notwithstanding that they are due to mature. The reason for this would presumably be that the bank had used the proceeds from the maturing loans to renew or originate new loans at 65%-85% of the same volume at a minimum. By contrast, if the bank were assumed to retain cash proceeds from the maturing loans, their RSF factor should be 0% (or perhaps slightly higher to account for expected losses on the loans). It may be reasonable to set the RSF factor above this level to reflect the fact that ceasing all mortgage lending over a year’s time could be harmful to a bank’s long-term franchise, but the blanket assumption that banks could categorically not realize liquidity from more than 15%-35% of loans maturing within one year is unreasonable.
of additional maturities between the 30-day LCR and the one-year current NSFR. This highlights again how no one ratio can, in and of itself, provide an adequate profile of liquidity. In light of the foregoing, we urge the Basel Committee to recognize that the NSFR should not be structured in an inflexible and one-size-fits-all manner.
c. rEcalIBratIonS nEEdEd to ImprovE tHE accuracy of tHE currEnt nSfr aS a lIquIdIty rISk mEaSurE
For the empirical and analytical reasons described above, The Clearing House respectfully urges the Basel Committee and the Agencies to revise the very structure and underlying assumptions of the NSFR framework as a whole. If a metric like the existing formulation of the NSFR is nevertheless to ultimately be implemented – and even if it is properly situated as only one liquidity measure among several, as we have advocated – it is critical that, at minimum, it be calibrated more carefully and more granularly so as to accurately reflect industry experience.60 More specifically, the factors that the current NSFR proposal prescribes for the calculation of both ASF and RSF should be recalibrated to properly reflect the stability and stickiness of funding sources and the liquidity of held assets, including marketability, price volatility and market depth.
1. aSf recalibrations
For purposes of calculating ASF factors under the current NSFR, deposits are divided into three categories: (i) stable retail and SME deposits; (ii) less stable retail and SME deposits; and (iii) wholesale deposits. In general, this categorization fails to sufficiently reflect the fact that deposit “stickiness” varies by customer and account characteristics and does not reflect the experiences of Participating Banks during the financial crisis.
y Wholesale deposits. Wholesale deposits as a category are proposed to have ASF factors that imply run-off in excess of rates experienced by Participating Banks during the financial crisis. Furthermore, unlike in the LCR, operational deposits are not assumed to run off at lower rates than non-operational deposits even though operational deposits are more stable. While the ASF does separate wholesale deposits by source (i.e., from financial corporations versus from non-financial corporations), a more granular categorization of wholesale deposits would additionally differentiate wholesale deposits by their purpose, that is, whether they are operational or non-operational. Under the LCR, operational deposits are treated at lower run-off rates than non-operational deposits because of their
60 This would also be consistent with the evolution of the LCR, which the Basel Committee recalibrated in January 2013 so that certain assumed inflow and outflow rates better reflect actual experience of the banking industry in times of stress. See Basel III: Final LCR Framework, supra note 2.

21Assessing the BAsel iii net stABle Funding RAtio in the Context oF ReCent impRovements in longeR-teRm BAnk liquidity the CleARing house
higher stability, which is an apt distinction that should also be reflected in the NSFR.61 On average, wholesale deposits account for 25% of Participating Banks’ total liabilities. As of June 2012, 61.5% of these wholesale deposits were operational. Reflecting the distinction between operational and non-operational wholesale deposits in the NSFR would better model the reality of these deposits and improve the Industry NSFR by 8.4 percentage points, decreasing the NSFR Shortfall by $887 billion.62
y Retail deposits. Many of the Participating Banks also believe that retail deposits as a category are likewise proposed to have ASF factors that imply run-off in excess of rates experienced by banks during the financial crisis. Furthermore, additional types of accounts, including online and mobile accounts in certain cases, should be considered stable. A report published by the European Banking Authority noted that, in addition to transactional accounts, accounts fitting the following criteria are also considered stable and are less likely to leave the bank or change banks: (i) those belonging to employees; (ii) joint accounts; (iii) accounts that have had a relationship with the bank for more than 10 years; and (iv) accounts linked to at least three other products from the bank.63 Furthermore, as the banking industry continues to evolve from a brick-and-mortar model to an online and mobile business model, additional consideration should be given to the treatment of online deposits, which it may be appropriate to treat as stable. While certain online deposits may reflect a customer’s second or third account that has been created to take advantage of higher interest rates, other online accounts are stable primary accounts, similar to those opened in a brick-and-mortar branch. The current NSFR treats online accounts as a separate category, whose final calibration, as yet unknown, is likely to equal or exceed the calibration for non-stable retail deposits. As of June 2012, on average, stable retail deposits accounted for
61 While it is possible that operational deposits might become less stable over extended liquidity stress horizons, the treatment of all wholesale deposits as being equally risky seems inconsistent with the experience of the Participating Banks.
62 This calculation in support of an “operational deposits” distinction makes the following changes from the existing proposal: for non-financial deposits, those that are “operational” are given a 25% run-off rate and those that are non-operational are given a 75% run-off rate. For “financial” deposits, as defined by the BIS, a 25% run-off “operational” category is created, while financial non-operational deposits remain at a 100% run-off factor. For purposes of this calculation, “operational deposits” were those categorized as such by the Participating Banks, and generally include deposits from customers with deeper relationships with the bank (for example, those also using credit, cash management and payments services from the bank) and balances that are used for purposes of working capital, payments and transactions.
63 European Banking Authority, New bank liquidity Rules: Dangers Ahead (October 2, 2012), http://www.eba.europa.eu/cebs/media/aboutus/bsg/20121002_BSG_Liquidity_Paper_incl_amendment.pdf.
23% of Participating Banks’ total liabilities. If the factor for stable retail deposits were increased by 5 percentage points, to 95%, the Industry NSFR would improve by 1.9 percentage points, decreasing the NSFR Shortfall by $180 billion.64
2. rSf recalibrations
On the asset side of the balance sheet, the NSFR assigns RSF factors, reflecting assumptions about the liquidity that could be realized from the assets within the one-year time horizon, which should be consistent with the assets’ tenor and risk level. However, in many cases the RSF treatment of certain assets is not consistent either with historical experience or with the treatment of other assets.
y U.S. GSE MBS. Under the current NSFR, MBS issued and/or backed by U.S. GSEs require 20% stable funding, while securities issued or backed explicitly and directly by the U.S. government require only 5% stable funding. This results in a differential treatment of securities issued by Ginnie Mae (which have explicit government backing) and those issued by Fannie Mae and Freddie Mac (which do not have explicit government backing but have been effectively supported by the U.S. government since entering conservatorship in 2008), when historically the market has not reflected any such distinction.65 If U.S. GSE MBS were treated comparably to Ginnie Mae MBS for so long as U.S. GSE MBS were effectively supported by the U.S. government at 5% RSF instead of 20% RSF, the Industry NSFR would be better aligned with the empirical data and would improve by 1.4 percentage points, with the NSFR Shortfall decreasing by approximately $155 billion.
64 Furthermore, just as we believe that the ASF factor for stable retail deposits is too low at 90%, it may also be the case that the ASF factor for less stable retail deposits – currently 80% – is too high. While an 80% RSF factor does imply twice the run-off rate (i.e., 20% versus 10% for stable deposits), this may nonetheless understate the average differences in key “stickiness” characteristics between the stable and less stable buckets. If the factor for less stable retail deposits decreased by 20 percentage points, to 60%, the Industry NSFR would decrease by 3.0 percentage points.
65 During the financial crisis, Freddie-issued MBS saw a 196 bps decline in yield spread, Fannie-issued MBS saw a 194 bps decline, and Ginnie Mae and FHA-issued MBS saw a 191 bps decline, each over ten-year Treasuries. The highest point of yield spread and lowest point of yield spread during the crisis occurred on the same days across the MBS issued by Freddie Mac, Fannie Mae, and Ginnie Mae. Source: Bloomberg.
Moreover – and perhaps even more to the point – the fact that GSE debt securities are highly correlated with U.S. Treasury securities and trade at consistent and very narrow spreads to U.S. Treasury securities having comparable maturities suggests that the market perceives almost no credit risk vis-à-vis the underlying obligor in any of these securities, which have trading prices that instead depend primarily upon movements in interest rates. See Letter from The Clearing House and the American Securitization Forum to the Federal Banking Agencies, at 12-13 (October 22, 2012).

22Assessing the BAsel iii net stABle Funding RAtio in the Context oF ReCent impRovements in longeR-teRm BAnk liquidity the CleARing house
y Corporate and sovereign debt. More granular treatment of corporate and sovereign debt in the RSF factors would be consistent with the approach utilized by Participating Banks to manage their liquidity. The current NSFR separates these assets into four categories from 5% RSF for sovereign debt rated AAA to AA- with residual maturities of more than one year to 100% RSF for corporate debt rated below A- (or having certain other characteristics that disqualify it from a lower category). This categorization is insufficiently granular to reflect the differences in liquidity risk between different assets. Additional granularity in the RSF factors beyond these broad categories would allow for a more precise accounting of the true liquidity risk of these securities.66 If the average RSF factor for all corporate and sovereign debt were reduced by 10 percentage points, the Industry NSFR would increase by 0.1 percentage points and the NSFR Shortfall would decrease by approximately $6 billion.
y Residential and retail loans. The current NSFR applies RSF factors to residential and other retail loans that are overly conservative and inconsistent with Participating Banks’ liquidity experiences. For example, the current NSFR would require U.S. banks to hold between 65%-85% stable funding for residential loans, despite the ability of those banks to borrow against these loans at any time (subject to appropriate haircuts) from the Federal Home Loan Bank system or to securitize or sell conforming loans through the GSEs.67 Decreasing the RSF factors for these loans by 10 percentage points, to between 55%-75% depending on loan quality, would increase the Industry NSFR by 1.4 percentage points and the NSFR Shortfall would decrease by approximately $158 billion.
y Other assets. As of June 2012, “other assets” as defined in the current NSFR, which are automatically assigned an RSF factor of 100%, constituted 40% of all Participating Banks’ assets. This “other assets” bucket includes items that are indeed clearly illiquid, such as premises and equipment and goodwill and other intangibles. However, this category also includes assets that may have significant marketability, such as derivative assets, retail loans with a maturity of greater than one year and private-label MBS. The marketability of these assets,
66 In the United States, because of the prohibition on the use of credit ratings of Section 939A of the Dodd-Frank Act, a different measure of credit risk differentiation would need to be used.
67 The FHLB system was established in 1932 to provide advances to support residential mortgage finance by member institutions. FHLB advances proved to be a stable source of funding throughout the financial crisis, even at the four institutions in our data set that failed or were acquired under distress, including Wachovia, Washington Mutual, National City and Colonial Bank. More than half of the Participating Banks indicated that the FHLB system is a significant and cost-efficient source of funding for their institutions that they could and would utilize as a liquidity resource during a period of extended financial stress.
and hence their liquidity value during a crisis, varies widely within the “other assets” category and suggests that these assets ought not to all be treated the same.68 A decrease in the aggregate RSF treatment of “other assets” by 10 percentage points would increase the Industry NSFR by 6.9 percentage points and decrease the NSFR Shortfall by $671 billion.
68 For example, while private-label MBS performed poorly during the crisis, current vintages of this asset enjoy significantly greater credit enhancement relative to earlier vintages. See Offering Circulars, Presale Reports, Fitch Ratings, [email protected]. Credit enhancements are basically protection, in the form of financial support, to cover losses on securitized assets in adverse conditions. See Benjamin H. Mandel et al., The Role of Bank Credit Enhancement in Securitization, http://www.FRBNY Economic Policy Review (July 2012), available at newyorkfed.org/research/epr/12v18n2/1207mand.pdf.
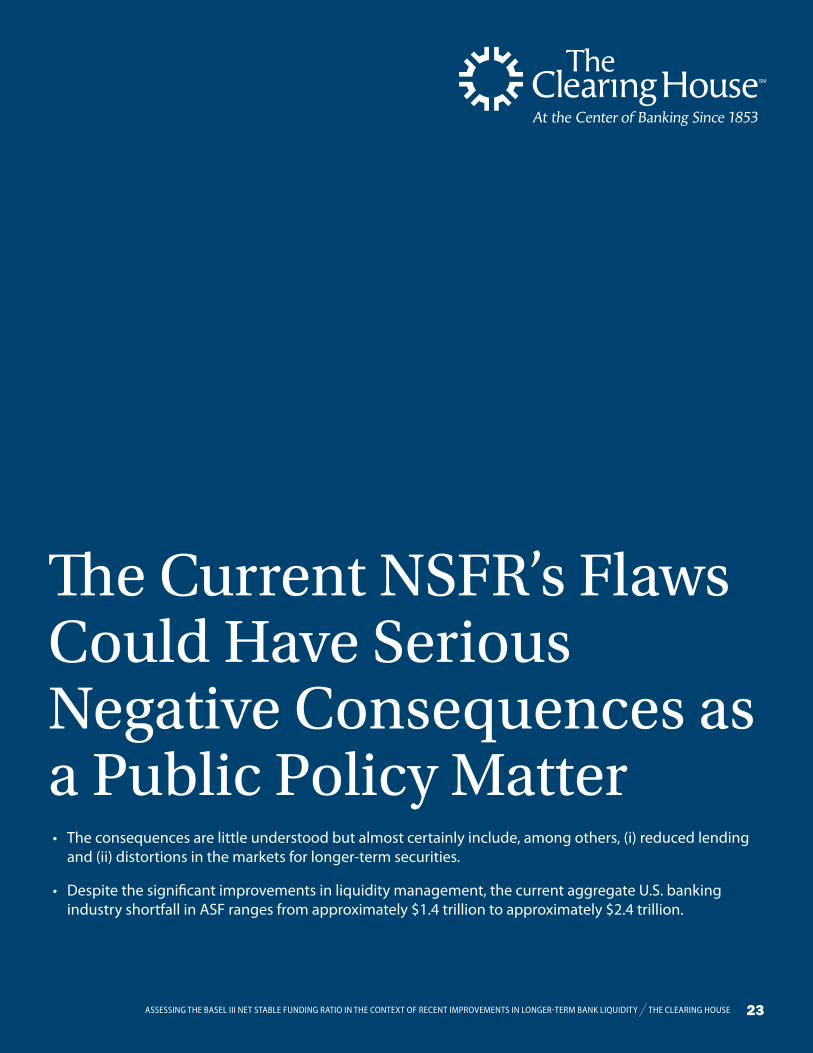
23Assessing the BAsel iii net stABle Funding RAtio in the Context oF ReCent impRovements in longeR-teRm BAnk liquidity the CleARing house
The Current NSFR’s Flaws Could Have Serious Negative Consequences as a Public Policy Matter• The consequences are little understood but almost certainly include, among others, (i) reduced lending
and (ii) distortions in the markets for longer-term securities.
• Despite the significant improvements in liquidity management, the current aggregate U.S. banking industry shortfall in ASF ranges from approximately $1.4 trillion to approximately $2.4 trillion.

24Assessing the BAsel iii net stABle Funding RAtio in the Context oF ReCent impRovements in longeR-teRm BAnk liquidity the CleARing house
V. The Current NSFR’s Flaws Could Have Serious Negative Consequences as a Public Policy Matter
The flaws in the current NSFR are not simply technical problems. Indeed, they could have a negative impact for consumers, businesses and the economy as a whole, both in the U.S. and internationally. As the Federal Reserve itself readily acknowledged in the preamble to the Section 165 Domestic Proposal, “too much liquidity can entail substantial opportunity costs and have a negative impact on the covered [bank’s] profitability.”69 We agree with that observation, but it understates the potential negative effects of excessive holdings of liquidity. More important are the consequences for the public, as well as for the financial system and economy more broadly, of too much liquidity, not only as maintained by individual banks but also as maintained across the banking system. The consequences are little understood but almost certainly include, among others, (i) reduced lending as banks replace loans with investments in highly liquid assets and (ii) distortions in the markets for longer-term securities (including U.S. Treasury securities and mortgage-backed securities), as banks invest more heavily in shorter-term securities to satisfy regulatory requirements.70
Despite the significant improvements in liquidity management discussed in Part IV.A above, our empirical analysis indicates that the current aggregate U.S. banking industry shortfall in ASF ranges from approximately $1.4 trillion to approximately $2.4 trillion (equal to between 9% and 15% of 2012 U.S. annual gross domestic product). As of June 2012, the U.S. banking industry would need an additional $1.4 trillion of ASF to meet a 100% NSFR requirement, assuming that all adjustments were to happen on the liability side of the balance sheet. Furthermore, it is likely that banks will manage to an NSFR target that includes a buffer above the minimum (e.g., 110%) to avoid regulatory criticism, potential supervisory sanctions and market penalties that could result from the risk of falling below the 100% level. If the industry decided to manage to a 110% NSFR, the current aggregate U.S. banking industry shortfall in ASF would increase to $2.4 trillion.
69 Section 165 Domestic Proposal, 77 Fed. Reg. at 77,643.
70 Since the onset of the financial crisis, there has been a relative dearth of research focused on the macroprudential and macroeconomic effects of enhanced liquidity risk standards of the type contemplated by the Basel III Liquidity Framework or the Section 165 Proposals as compared to the attention accorded capital requirements. For a discussion of liquidity-related research as of April 2013, see Oxford Economics, Analyzing the impact of bank capital and liquidity regulations on US economic growth (April 2013), available at http://www.theclearinghouse.org/index.html?f=074938.
Closing this gap would likely require U.S. banks to turn to the capital markets to raise longer-term funding, in large quantities, over a relatively short period of time, all of which could greatly increase the overall costs of funding. This, in turn, could depress banks’ net interest margins and returns on equity, making funding (including equity) more expensive still. Together with the heightened liquidity requirements that the current NSFR would impose on certain short-dated loans as well as derivatives used for hedging, this could create a cycle negatively affecting the ability and willingness of banks to lend at reasonable rates to customers of all types and thereby to perform one of their core financial intermediation functions of maturity transformation.
While the financial crisis clearly showed that increased regulation should not be rejected just because it may affect the profitability of the financial sector, we urge the Basel Committee and the Agencies to bear in mind that strong lending markets, and the appropriate availability of credit, are important not just to banks but to all participants in the worldwide economy, from individual consumers to large businesses. In the case of the NSFR, the core issue is not over-regulation, but regulation that, in light of the various empirical and analytical shortcomings identified in Parts IV.A-C above, is not well tailored to measure and address actual liquidity risks and, therefore, does not come close to justifying its costly negative side effects.

25Assessing the BAsel iii net stABle Funding RAtio in the Context oF ReCent impRovements in longeR-teRm BAnk liquidity the CleARing house
Appendix A: Summary of the Current NSFR

26Assessing the BAsel iii net stABle Funding RAtio in the Context oF ReCent impRovements in longeR-teRm BAnk liquidity the CleARing house
Appendix A: Summary of the Current NSFRa. wHat arE tHE componEntS of avaIlaBlE
StaBlE fundIng?
Conceptually, the ASF is the portion of the liabilities that banks expect will not be withdrawn by creditors over a one-year horizon of extended stress. Liabilities are assigned weights, which aim to approximate the amount of funds that would be withdrawn by creditors over a one-year stressed scenario. Liabilities that have a remaining contractual maturity greater than one year are counted at their full value. Liabilities that have a contractual maturity of less than one year are assigned a weight indicating the likelihood that the funding can be relied upon or will be rolled over during a period of stress.
ASF assigns liabilities and equities a weight to reflect the likelihood that the bank will be able to use the funding over a one-year horizon of extended stress. Factors vary by quality and stability of funding.
y all funding with maturity greater than one year (termed or perpetual) has a weight of 100%. This category includes Tier 1 and 2 capital, preferred stock, and the total amount of borrowing with a remaining maturity greater than one year.
y funding sourced from stable retail and small medium enterprise (“SmE”) deposits, with maturities of less than one year, has a weight of 90%. Stable is defined as deposits covered by an effective deposit insurance scheme (for example, the FDIC) or public guarantee. Less stable retail and SME deposits with maturities of less than one year have a weight of 80%. “Less stable” deposits are typically funds over the insurance coverage, high-value deposits, deposits from high-net-worth individuals, deposits that can be withdrawn quickly, or those in a foreign currency.
y wholesale funding from non-financials, sovereigns, central banks, and pSEs, with maturities of less than one year, receive less preferential treatment and count only as 50% ASF.
y other liabilities and equities not included in the three groups above are not considered “stable funding” and receive no weight.
B. wHat arE tHE componEntS of rEquIrEd StaBlE fundIng?
Conceptually, the RSF measures the potential liquidation value of assets over a one-year horizon of liquidity stress. Similar to the ASF, assets are broken out into maturity buckets of less than one year and greater than one year, then further segmented by the credit risk. Longer remaining-maturity assets require more stable funding
than shorter remaining-maturity assets. Lower credit-risk assets require less stable funding than higher credit-risk assets. Overall, the RSF calibration is meant to discourage asset concentration in less liquid assets and provide an estimate of potential devaluation during a liquidity crisis.
RSF buckets total assets by remaining maturity and credit risk to determine the amount of stable funding required to be held against the asset.
y cash, unencumbered short-term (less than one-year) instruments, securities, repo securities, and loans to financial institutions do not require long-term stable funding, as they can reasonably be funded with shorter-term liabilities.
y unencumbered marketable securities issued or guaranteed by sovereigns, central banks, and pSEs vary in treatments according to the risk weight.
■ Securities with a 0% risk weight require 5% of their value to be funded with ASF.
■ Securities with a 20% risk weight require 20% stable funding.
y unencumbered longer-term corporate bonds also vary in treatment by risk weight.
■ Corporate bonds rated AA- or higher, which have a 20% risk weight according to BIS methodology, require 20% stable funding.
■ Corporate bonds rated A+ to A-, which have a 50% risk weight according to BIS methodology, require 50% stable funding.
■ All other longer-term corporate bonds, which range in 100-to-150% risk weight according to BIS methodology, require 100% stable funding.
y unencumbered gold and equities, not issued by financial institutions or affiliates, require 50% stable funding.
y unencumbered residential mortgages vary in treatment by risk weight and duration.
■ Residential mortgages of any duration with a risk weight less than 35% require 65% stable funding.
■ Residential mortgages with a higher credit risk require 85% stable funding if their remaining maturity is under one year, and 100% if their remaining maturity is greater than one year.
y loans to non-financial corporate and sovereign

27Assessing the BAsel iii net stABle Funding RAtio in the Context oF ReCent impRovements in longeR-teRm BAnk liquidity the CleARing house
clients vary in treatment by risk weight and quality.
■ Loans with less than one year remaining maturity require 50% stable funding.
■ Loans with greater than one year remaining maturity require 65% stable funding if the risk weight is less than 35% and100% stable funding if the risk weight is higher than the 35% threshold.
y loans to retail and SmEs vary in treatment by maturity.
■ Loans with remaining maturities of less than one year require 85% stable funding.
■ Loans with remaining maturities of greater than one year require 100% stable funding.
y all other assets not included above require 100% stable funding. For example, allowances for loan and lease losses (ALLL) are counted as an asset that requires 100% stable funding.
y additional off-balance sheet assets are also included in the rSf.
■ Conditionally revocable credit and liquidity facilities to any clients are given a 5% weight.
■ Other contingent obligations (for example, guarantees, letter of credits) will have factors determined by the national supervisor.
c. mInImum nSfr at grEatEr tHan 100%
The NSFR is required to be greater than 100%. A bank’s ASF has to be greater than the required stable funding of its assets. This requirement inherently sets a risk-appetite floor for banks in the amount of the short-term funding it can hold for long-term assets. Although banks can still decide their own asset-liability management strategy, they have to maintain at least the minimum NSFR. Banks will be more likely to try to maintain a buffer between their computed NSFR and the required floor.

a B o u t t H E c l E a r I n g H o u S E
Established in 1853, The Clearing House is the oldest banking association and payments company in the United States. It is owned by the world’s largest commercial banks, which collectively employ over two million people and hold more than half of all U.S. deposits.
The Clearing House Association L.L.C. is a nonpartisan advocacy organization representing – through regulatory comment letters, amicus briefs and white papers – the interests of its owner banks on a variety of systemically important banking issues.
Its affiliate, The Clearing House Payments Company L.L.C., provides payment, clearing and settlement services to its member banks and other financial institutions, clearing almost $2 trillion daily and representing nearly half of the automated-clearing-house, funds-transfer and check-image payments made in the U.S. See The Clearing House’s web page online at www.theclearinghouse.org.
paul SaltzmanPresident of The Clearing House Association, EVP and General Counsel of The Clearing House Payments Company 212.613.0138 | [email protected]
david wagnerExecutive Managing Director and Head of Finance Affairs 212.613.9883 | [email protected]
Brett waxmanSenior Vice President and Associate General Counsel 212.612.9211 | [email protected]
Brittany BaumannVice President, Economist 212.613.0154 | [email protected]
Sridhar IyerSenior Vice President, Head of Research 212.613.9804 | [email protected]
Jill HersheyExecutive Managing Director and Head of Government Affairs 202.649.4601 | [email protected]
peter mckillopSenior Vice President and Director of Strategic Communications and Member Engagement 212.613.9853 | [email protected]
n E w yo r k | 450 West 33rd Street | New York, NY 10001wa S H I n g to n , d. c . | 1001 Pennsylvania Avenue | Suite 720 - North Tower | Washington, DC 20004t E l 212.613.0100 | www.theclearinghouse.org