Embed Size (px)
Citation preview
The Basel III Liquidity Framework: Impacts andRecommendations
November 2, 2011
i
Table of Contents
Page
Introduction............................................................................................................... 1
A. Executive Summary............................................................................................. 2B. Recommendations .............................................................................................. 3
I. Quantitative Assessment of the LCR – the Shortfall ........................................ 6
II. Empirical Evidence Suggests Modifications to the Basel III Standards ........... 9
A. Basel III Assumptions About Liquid Assets; Convertibility ofAgency Securities ............................................................................................... 9
B. Calibrations In Some Areas Are More Conservative Than U.S. Banks’ WorstCase/Worst Period Experience............................................................................ 13
C. Federal Home Loan Bank Advances .................................................................... 14D. Case History Suggests the Evidence is Unreliable................................................ 16
III. The Competitive Landscape .............................................................................. 21
A. European Union ................................................................................................. 21B. Asia ................................................................................................................... 22
IV. Policy and Market Consequences – Problematic or Unknown ........................ 24
A. Market and Customer Implications ................................................................... 24B. The Impact of New Incentives to Increase Holdings in Sovereign Debt ............. 26C. The Impact of Reduced Agency Holdings on the Mortgage Market ................... 29D. Perverse Prudential Implications of the Asymmetric Treatment
of Financial Institution Liquidity Facilities.......................................................... 30
V. Enhanced Practices for Liquidity-Risk Management ........................................ 32
A. Introduction ........................................................................................................ 32B. Recent Developments in Liquidity-Risk Management in the U.S......................... 32C. Current Enhanced Practices ................................................................................ 33D. Classification of Liquidity Risk and Benefits ........................................................ 36E. Incorporation of Liquidity Risk in Funds Transfer Pricing .................................... 36F. Conclusion .......................................................................................................... 37

ii
Page
VI. Other Qualitative Considerations ..................................................................... 38
A. Role of Government Liquidity Facilities During the Financial Crisis..................... 38B. Conflicting Capital and Liquidity Regulation........................................................ 39C. Research Assessment.......................................................................................... 39
Glossary .................................................................................................................. 45
Appendix Background

1
Introduction
The Clearing House Association L.L.C. (The Clearing House), an association of major commercial banks,1
and our members are committed to effective liquidity-risk management and strongly support efforts bythe Basel Committee on Banking Supervision (Basel Committee or BCBS), the Financial Stability Board(FSB) and U.S. regulators to improve both regulatory standards and banking-industry practice in thisarea. The cornerstone of the regulatory community’s efforts to enhance liquidity-risk management isthe Basel Committee’s final liquidity framework issued in December 2010 (Basel III liquidity framework).2
The Clearing House has closely followed the development of the Basel liquidity framework, submittingcomment letters both to the Basel Committee and the U.S. regulators.3 We have made substantialeffort to inform our views with quantitative analysis. We have prepared and shared with U.S. regulatorsas well as the BCBS several quantitative analyses of the impact of Basel III, both liquidity and capital, onU.S. banks. We are enclosing with this white paper an analysis entitled Assessing the Liquidity CoverageRatio (the Liquidity Study).4
Although this white paper reflects our views as to the strengths and deficiencies of the Basel III liquidityframework as reflected in comment letters and the aforementioned studies, our objective in preparingthis white paper, as well as the Liquidity Study, is broader – namely, to present an assessment of certainfinancial-market, public-policy and borrower implications of the Basel III liquidity framework andaddress more generally improvements in approaches to liquidity-risk management that banks haveimplemented since the onset of the financial crisis, focusing on the liquidity coverage ratio (LCR), whichis the 30-day liquidity measure, in that framework.5
1Established in 1853, The Clearing House is the oldest banking association and payments company in the United
States. It is owned by the world’s largest commercial banks, which collectively employ over 2 million people andhold more than half of all U.S. deposits. The Clearing House Association L.L.C. is a nonpartisan advocacyorganization representing – through regulatory comment letters, amicus briefs and white papers – the interests ofits owner banks on a variety of systemically important banking issues. Its affiliate, The Clearing House PaymentsCompany L.L.C., provides payment, clearing, and settlement services to its member banks and other financialinstitutions, clearing almost $2 trillion daily and representing nearly half of the automated-clearing-house, funds-transfer, and check-image payments made in the U.S. See The Clearing House’s web page atwww.theclearinghouse.org.
2BCBS, Basel III: International Framework for Liquidity Risk Measurement, Standards and Monitoring (Dec. 16,
2010), available at http://www.bis.org/publ/bcbs188.pdf.
3Letter from The Clearing House to the BCBS (April 16, 2010); Letter from The Clearing House to Timothy F.
Geithner, Secretary, U.S. Department of the Treasury, Ben S. Bernanke, Chairman, Board of Governors of theFederal Reserve System, Sheila C. Bair, Chairman, Federal Deposit Insurance Corporation, John G. Walsh, ActingComptroller of the Currency, John E. Bowman, Acting Director, Office of Thrift Supervision, and William C. Dudley,President, Federal Reserve Bank of New York (November 5, 2010). Both letters are available on The ClearingHouse’s website at http://www.theclearinghouse.org.
4Some of the results in the Liquidity Study are based on proprietary information and are thus provided only under
confidential conditions to U.S. regulators, although conclusions drawn from that information are addressed in thiswhite paper where possible and appropriate.
5We are not addressing in any length in this white paper the other new liquidity measure included in the Basel III
liquidity framework – the one-year liquidity measure referred to as the net stable funding ratio (NSFR). As
2
A. Executive Summary
Key observations and conclusions presented in this paper include the following:
The U.S. banking industry’s estimated LCR shortfall has increased, from approximately $1.1 trillionat December 2009 (representing a 70% industry-wide LCR) to approximately $1.4 trillion atDecember 2010 (representing a 60% industry-wide LCR), both as reflected in the Liquidity Study.The $1.4 trillion estimated shortfall at December 2010 is a conservative, and likely understated,amount for two reasons. First, it reflects the liquidity shortfall necessary for U.S. banks to achieve a100% LCR, as opposed to a higher LCR ratio (110%, for example) that we expect banks will manageto in order to avoid the supervisory and other consequences of an LCR deficiency. Second, the$1.4 trillion is based upon bank balance sheets as of December 2010, which are atypical, reflectingfor a variety of reasons disproportionate holdings of cash, cash equivalents and Treasury securities.Assuming banks ultimately manage to a 110% LCR, and based on a more normalized pre-crisisbalance sheet with more loans and less cash, cash equivalents and Treasury securities, thedifferential could be as much as $2.0 trillion. The enormity of this shortfall might suggest that U.S.banks are at undue liquidity risk. However, this is simply not the case. The shortfall is primarilydriven by the specific prescriptions and quantitative calibrations of the Basel III framework that areneither based on sound empirical research nor supported by industry experience during the 2008financial crisis. The mere fact that the U.S. banking industry’s liquid asset shortfall under the LCRincreased between year-end 2009 and 2010, while during the same period banks increased theproportion of their assets consisting of cash, cash equivalents, Treasury securities and other liquidassets and reduced their net cash outflows over a 30-day horizon, illustrates the importance ofrevisiting and revising elements of the LCR. See Section I of this white paper.
U.S. implementation of the LCR needs to take into account the unique circumstances of U.S. banksand U.S. banking, financial and housing markets. Certain of the LCR’s provisions produce undulyconservative measures of liquidity for U.S. banks, failing to accurately capture their liquiditypositions. These fall into two areas. The first is calibrations – run-off factors for deposits and otherliabilities and assumed draw rates on credit and liquidity facilities – that are much moreconservative than the experience of even the most stressed banks during their most stressedperiods during the financial crisis (i.e., worst case/worst period experience). The second is sourcesof liquidity that (i) are unduly limited because they are treated as Level 2 (L2) assets subject to a capequal to 40% of Level 1 (L1) assets, notwithstanding that they may have better credit characteristicsand were demonstrably more liquid throughout the financial crisis than some L1 assets (forexample, Fannie Mae and Freddie Mac MBS and debentures as compared to certain Europeansovereign securities), or (ii) that are not even recognized as a source of liquidity (borrowing capacitywith Federal Home Loan Banks (FHLBs), for example). See Section II of this white paper.
indicated in our comment letters referred to in footnote 2, while we believe that the LCR is a sensible measuresimilar to standards applied by most banks for management purposes, the NSFR is a much less common approachand, we believe, requires a more fundamental review and revision before serious consideration could be given toits implementation.

3
In implementing the LCR, international regulators must balance the desirability of uniforminternational standards against the need to accommodate unique considerations in specificjurisdictions. It is already becoming apparent that regulators in jurisdictions other than the UnitedStates are measuring strict implementation against the need to craft a meaningful domesticliquidity-risk regulatory regime. At least pending refinement of the LCR through the observationperiod to better adapt to unique national circumstances, it is extremely important that the U.S.regulators show similar flexibility. See Section III of this white paper.
It is important that policy makers understand and study the impact of the Basel III liquidityframework on end-users – that is, bank customers. The Liquidity Study analyzes five products thatwill be affected through price, structure or availability for customers. See Section IV.A of this whitepaper.
Prescriptive arithmetic liquidity ratios are not, taken alone, a sufficient response to the need formore robust liquidity risk management. We strongly endorse the on-going efforts of banks, withthe assistance of their regulators, to enhance their liquidity risk management practices. Formulaicratios are just one tool and, inevitably, have deficiencies. In Section V, we describe our memberbanks’ enhanced practices in this area.
Research addressing the assumptions underlying the Basel III liquidity framework is limited andinconclusive. While economists at the Bank for International Settlements (BIS) have been unable toconfidently qualify the impact of the liquidity rules, the BCBS has prescribed these rules usingassumptions of uncertain validity. Academic and regulatory research makes it clear that even theBasel Committee and the BIS have significant qualms about the assumptions on which these rulesare premised. See Section VI.C of this white paper.
Finally, we have also addressed in this white paper certain other problematic policy and marketconsequences of the framework’s implementation (Section IV) and certain other qualitativeconsiderations that bear upon the implementation of the Basel III framework (Section VI).
B. Recommendations
The Basel III liquidity framework is a work in progress that in many respects reflects substantialimprovements in liquidity risk management and supervision but also has significant deficiencies. Theframework itself, as initially released in December 2010, recognizes the work-in-progress aspect byproviding for observation periods during which banks will report to supervisors but not be subject to theLCR or NSFR as binding constraints.6 The Liquidity Study and the related discussions in this white paperpoint to the major deficiencies in the LCR in its current form, at least as applied to U.S. banks, and frameour recommendations, as follows:
6The observation period for the LCR runs through mid-2013, with the LCR to be introduced on January 1, 2015.
The observation period for the NSFR runs through mid-2016, with the NSFR to be introduced as a minimumstandard by January 1, 2018. The Basel III final framework recites that the BCBS “is prepared to make revisions tospecific components of the standards if this proves necessary in light of the analyses conducted and the datacollected during the observation period.” BCBS, Basel III liquidity framework, supra note 2, at ¶197.
4
Reconciliation of consistent application across jurisdictions and recognition of unique nationalcircumstances: it is essential that final rules result in consistent application across jurisdictionsin order to ensure a level playing field from a competitive perspective. Consistent applicationdoes not, however, required identical rules. At least pending refinement of the LCR through theobservation period to better adapt to unique national circumstances, it is extremely importantthat the U.S. regulators show the same flexibility that regulators in other countries are showing.In order to ensure consistent application across jurisdictions, we believe that national regulatorsshould expand the review process contemplated for a number of aspects of the Basel III liquidityand capital frameworks to ensure that deviations from “base” Basel III liquidity rules do notdetract from the rigor and cross-border substantive equivalence of the Basel III liquidity rulesbut instead are justified based on the circumstances of particular countries.
Adjustments to reflect U.S. national circumstances: four adjustments to the LCR should bemade by U.S. regulators to reflect U.S. experience and circumstances – both worst case/worstperiod experience during the financial crisis and the operations of U.S. markets (including howthey finance mortgage originations). These changes should be made at inception – that is,before the observation period begins. They are:
The Basel III liquidity framework’s run-off factors for non-operational deposits (75% for non-financial institution deposits and 100% for financial institution deposits) should be adjustedto percentages that are closer to U.S. banks’ worst case/worst period experience during thefinancial crisis (41% for non-financial institution non-operation deposits and 38% forfinancial institution non-operational deposits).
The Basel III liquidity framework’s assumption that the draw-down rate on liquidity lines willbe fully drawn (that is, a 100% draw-down rate) should be modified to reflect an assumeddraw-down rate that is closer to U.S. banks’ worst case/worst period experience during thefinancial crisis (which was in the 9% to 10% range depending on the type of facility backedby the liquidity line).
Fannie Mae and Freddie Mac mortgage-backed securities (MBS) and debt securities shouldbe recognized as L1 assets with no haircut. Agency MBS and debt securities proved to havebetter or more sustained convertibility during the financial crisis than many sovereign debtsecurities, with U.S. Treasury securities and Japanese Government Bonds (JGBs) being theonly securities with deeper markets.
The FHLB system is unique to the United States. It proved itself to be a reliable source ofliquidity for U.S. banks throughout the financial crisis. As discussed in Section II.C of thiswhite paper, we urge the U.S. regulators and the FHLBs to discuss improvements to theFHLB advance system that may address concerns regulators have expressed – for example,as to the appropriateness of giving liquidity credit for over-night advance facilities. Broadlystated, however, we strongly believe that the LCR should recognize committed FHLBfacilities as a source of liquidity.
Research and process: there has been a relative dearth of research focused either on theassumptions on which the Basel III liquidity framework’s rules are based or the macroprudential

5
and macreconomic effects of enhanced liquidity-risk standards as compared to the attentionthat has been given to the assumptions and effects of enhanced core capital requirements. Thisis true with respect to both research generated by the regulatory community and the academiccommunity. The Clearing House has attempted to address for U.S. banks one piece of this in theLiquidity Study – namely, key assumptions underlying the LCR’s calibrations. We urgepolicymakers at all levels – legislative as well as regulatory – to acquire sound research andanalysis addressing in particular macroprudential and macroeconomic effects of the Basel IIIliquidity framework along with other reforms that effect those considerations. We areparticularly concerned with the negative consequences of the LCR and other reforms,considered together, for the U.S. housing market and the potential distortions they mayintroduce into global markets, including the markets for sovereign debt.
* * *
Although regulators who review this white paper will be well versed in the details of the Basel IIIframework and supervisory approaches to liquidity risk management more generally, otherpolicymakers may not. We have included as an Appendix to this white paper a background sectiondescribing the Basel III liquidity framework and other supervisory initiatives.
6
I. QUANTITATIVE ASSESSMENT OF THE LCR – THE SHORTFALL
A critical element in evaluating any rule is a quantitative assessment of its impact if implemented. TheBasel Committee provided an initial quantitative impact study (QIS) of the Basel III liquidity rules whenthey were released in December 2010,7 using bank data as of December 2009. The Basel Committee’sQIS made separate calculations for “Group 1 banks”, which is defined as 94 banks that have Tier 1capital in excess of €3 billion, are well diversified and internationally active, and “Group 2 banks”, whichis defined as all other banks for which data were gathered. The Basel Committee’s QIS study was not, ofcourse, limited to U.S. banks. It showed an average LCR of 83% for Group 1 banks and 98% for Group 2banks, respectively, as of December 2009, with an aggregate liquid asset shortfall for all banks in thesample (that is, Group 1 and Group 2 banks) of €1.73 trillion. Although the QIS is conducted on anongoing, semi-annual basis, with a more recent exercise including bank data submitted as of December2010, the Basel Committee’s conclusions from this exercise have yet to be publicly released.
The Clearing House prepared the Liquidity Study in an effort to itself quantitatively assess the impact ofthe LCR on U.S. banks if implemented. The Liquidity Study analyzes the LCR’s impact both as ofDecember 2009 and as of December 2010.8 The data were compiled based on the template issued bythe Basel Committee in mid-2011 for its ongoing QIS, incorporating results into the revised frameworkthat include changes in the calculation of the cap on L2 assets.
Assuming that the impact conclusions in the BCBS QIS (albeit not broken out separately for banks byjurisdictions ) are generally consistent across jurisdictions, the Liquidity Study shows that the BaselCommittee’s QIS results substantially understate the likely LCR shortfall across the banking industry atDecember 2009. It also shows that the shortfall largely results from a handful of assumptionsembedded in the LCR’s calibrations that are extremely conservative as compared to U.S. banks’ worstcase/worst period experience during the financial crisis. Moreover, the Liquidity Study shows that, forU.S. banks, the shortfall increased between December 2009 and December 2010, notwithstanding thatU.S. banks had substantially higher levels of liquid assets and had taken meaningful steps to reduce netcash outflows between those two dates. Specifically:
The Liquidity Study shows for U.S. banks:
7BCBS, Results of the comprehensive quantitative impact study (Dec. 16, 2010) available at
http://www.bis.org/publ/bcbs186.pdf. The Basel Committee’s QIS sets forth an estimated aggregate LCR shortfallfor the 263 banks in the study, expressed in Euro, and an average LCR as of December 2009 for the two groups ofbanks in the study. It does not, however, provide any of the underlying data and analysis supporting thatinformation.
8The December 2009 analysis is based on data as of that date from ten existing banks, representing 54% of U.S.
banking assets ($8.8 trillion). The December 2010 analysis is based on data from 14 existing banks, representing58% of U.S. banking assets ($9.4 trillion). The data were compiled based on the template issued by the BaselCommittee in mid-2011 for its ongoing QIS, incorporating results into the revised framework that include changesin the calculation of the cap on L2 assets. Except as otherwise indicated, financial and statistical data included inthis white paper either appear in or were derived from information in the Liquidity Study or were developed inconnection with the preparation of the Liquidity Study.
7
as of December 2009, an industry-wide LCR of 70%, which means a liquid asset shortfall ofapproximately $1.1 trillion; and
as of December 2010, an industry-wide LCR of 60%, which means an LCR shortfall ofapproximately $1.4 trillion.
The approximately $1.4 trillion shortfall at December 2010 is actually understated. The totalpractical shortfall as determined using the December 2010 data may be as high as $2.0 trillion.There are two reasons for the difference:
Banks will not manage to or target a 100% LCR. In order to avoid regulatory criticism andsanctions, as well as market penalties, that could result from having an LCR less than theminimum regulatory requirement (that is, 100%), banks inevitably will manage to a targetedLCR that includes a “cushion” above the 100% minimum – for example, manage to atargeted ratio of 110% (with a ratio of 110% adding another approximately $200 billion tothe shortfall).
Banks’ balance sheet composition at December 2010 was abnormal. Due to ongoingfinancial market instability, banks have stockpiled L1 and L2 assets, holding historically highlevels of cash and U.S. Treasuries, while credit demand remains subdued. Under normalmarket conditions, banks would not generally hold these assets in such large volumes. Asdemand for loans picks up, banks would normally decrease cash and other low-yieldingliquid funding sources and substitute loans for liquid assets, exacerbating the LCR’s adverseimplications and worsening the unintended consequences of the LCR, which are discussed inSection VI of this white paper. As market conditions normalize, the shortfall could rise by anadditional $400 billion if banks re-balanced their asset composition to pre-crisis proportions.
The increase in the LCR shortfall between December 2009 and December 2010, notwithstandingthe fact that banks have moved their asset compositions to historically high levels of cash andU.S. Treasuries, as discussed further below, highlights the flaws in the LCR and the need toreconsider certain of its provisions. The most important contributor to this counterintuitive(and, we believe, manifestly wrong) result for U.S. banks is the interplay between (i) thetreatment of MBS guaranteed by Fannie Mae and Freddie Mac, as well as Fannie Mae andFreddie Mac debentures as L2 instead of L1 liquid assets and (ii) the requirement, which was achange in the LCR methodology after the Basel Committee’s initial QIS analysis9 that LCRcalculations be based upon an assumed unwind of repos on those assets.
As to outflows, the liquid asset shortfall is driven primarily by products where a largediscrepancy exists between current bank assumptions and those on which the LCR is premised.However, as discussed in the Liquidity Study, there are significant empirical discrepanciesbetween actual market performance under even acute stress and the LCR’s assumptions. Thus,it cannot be concluded that banks in this QIS are in fact at such risk that $1.4 trillion, or evenmore, in additional liquid assets is warranted.
9BCBS, Basel III framework for liquidity frequently asked questions (July 5, 2011) available at
http://www.bis.org/publ/bcbs199.pdf.
8
The drop in the LCR year-over-year demonstrates the deficiencies in the LCR as presented in the Basel IIIliquidity framework because, parallel to the drop in the LCR, the banks in the sample used for this studyin fact dramatically increased their holdings of liquid assets and improved net outflows, and are thusconsiderably more liquid.
Improvements in the Stock of Liquid Assets. L1 and L2 assets increased, improving the industryLCR by 9% and 10%, respectively, between 2009 and 2010. Additionally, the percent of centralbank reserve cash to total assets for the U.S. industry has dramatically increased since 2009. Asof the first quarter of 2009, cash holdings to total assets were just above 5% but increased toover 7% in 2010, and shot up significantly to approximately 10% in the first quarter of 2011. Theratio of Treasuries held by banks to total assets followed a similar trajectory. The ratio wasapproximately 5% as of the first quarter of 2009, increased to around 6% throughout 2010, andshot up to 8.8% in the first quarter of 2011.
Improvements in Cash Flow. An increase of cash inflows and secured funding improved the U.S.industry LCR by 6% and 5%, respectively, between 2009 and 2010. Further, compared to thefourth quarter of 2007, banks in the first quarter of 2011 have increased both deposits and Tier1 common equity by 19%. Conversely, less stable funding sources, such as repos and debt,declined by 35% and 18%, respectively, since 2007. Finally, the percent of wholesale fundingwith tenor less than 30 days has decreased from 21.8% in 2007 to 6.1% in 2011, which has alsocontributed to reduced LCR outflows.
Banks in the Liquidity Study have indicated that, if the LCR is implemented as finalized in 2010, they willneed to make fundamental adjustments, impacting both customers and key financial markets (includingthose for U.S. Treasury securities and agency mortgage-backed securities). These actions includeexchanging L2 assets for L1 assets and issuing more debt in order to hold more L1 assets, a move thatwould put banks at other risks (e.g., interest rate risk) and adversely affect credit availability, becauseproceeds of these new debt issues would need to be diverted to large holdings of sovereign obligationsand similar assets, not the less liquid assets that meet market and macroeconomic needs. Banks willdecrease the liquidity lines they make available for customers, reduce non-operational deposits and/orcurtail other short-term funding sources. The discussion of the product and market impacts provided inSection IV.A. addresses these actions, making clear that, while several may have beneficial liquidityresults, they pose significant problems for customers in affected market segments.
9
II. EMPIRICAL EVIDENCE SUGGESTS MODIFICATIONS TO THE BASEL III STANDARDS
The Basel III liquidity framework specifies that the LCR
“aims to ensure that a bank maintains an adequate level of unencumbered, high-quality liquid assets that can be converted into cash to meet its liquidity needs for a30 calendar day time horizon under a significantly severe stress scenario specified bysupervisors.”
The highlighted phrase lends itself to nuanced interpretations, but the nuances – and differentoutcomes that can flow from them – are critical. For example, are the rules based on failed banks orstressed banks? If the standards are designed to ensure that no bank ever fails due to liquidity risk, thenthey will establish so high a liquidity-risk threshold that few, if any, banks could operate under them asefficient providers of credit intermediation services because the cost of matching all potential claims(e.g., on lines of credit) would be prohibitive. In contrast, if the rules are designed to ensure that banks(i) are able to absorb liquidity stress even in system-wide stress scenarios and (ii) reflect in the pricing oftheir products the costs of that amount of liquidity, so that in most cases regulators can exercisediscretion as to when and how to intervene as opposed to feeling compelled to intervene because theconsequences of non-intervention are so severe, that goal is laudable and regulatory standards toachieve it are appropriate.
We have discussed below aspects of the LCR that concern us because they tend to support a “no bankever fails due to liquidity risk” goal as opposed to goals oriented toward reflecting true liquidity costs inthe pricing of products and preserving flexibility for regulators and governments more generally in timesof stress. A robust banking system, and prudential standards designed to achieve it, should not bepremised on government intervention as the solution, even in scenarios that are highly stressed.However, neither should such a system be premised on a “no bank ever fails due to liquidity risk” goal.Achieving the correct balance between goals, on the one hand, and calibrations, on the other hand,requires a transparent and empirical analysis of liquidity metrics (whether the convertibility of aparticular class of assets or an analysis of cash inflows and outflows that produce a realistic measure ofnet cash outflows).
Our empirical focus has been on U.S. banks and the U.S. market, largely because of resource constraints.If the BCBS and other policy makers are concerned that U.S. experience is not representative ofinternational experience, we encourage them to replicate our analysis in other jurisdictions.
A. Basel III Assumptions About Liquid Assets; Convertibility of Agency Securities
The Basel III rules are based on the Basel III liquidity framework’s definition of “liquid assets” for LCRpurposes – i.e., assets that can be converted into cash during the time periods specified in the LCR, evenduring a period of system-wide stress. However, this critical definition in the Basel III rules is based onincorrect assumptions not supported by the actual liquidity of varying asset classes in the marketplace.10
10The enhanced practices for liquidity risk management outlined in Section V of this paper are intended to provide
a consistent framework for assessing liquid assets, which should be based not solely on the issuer – as is done inthe Basel III rules – but importantly on how readily a bank can convert an asset into cash under stress.
10
The data presented in this Section II.A assess assets based on what makes them in fact readilyconvertible: the ability to transact in large size with only minimal loss under stress. Measures of theliquidity of an asset class are varied, but key ones include daily volume traded, traded bid-ask spreads(which factor in volatility and indicate market depth), the size of a market, and the existence of an activeand robust “repo” market. Although the Basel Committee has provided composite assessments of theimpact of the liquidity standards,11 it has not provided the empirical analysis on which the LCR and NSFRare premised. It is essential that it do so because, absent transparent analytics on which to assess theLCR’s calibrations, critical assumptions underlying the rules are unknown and, thus, their policy impactremains at best uncertain.
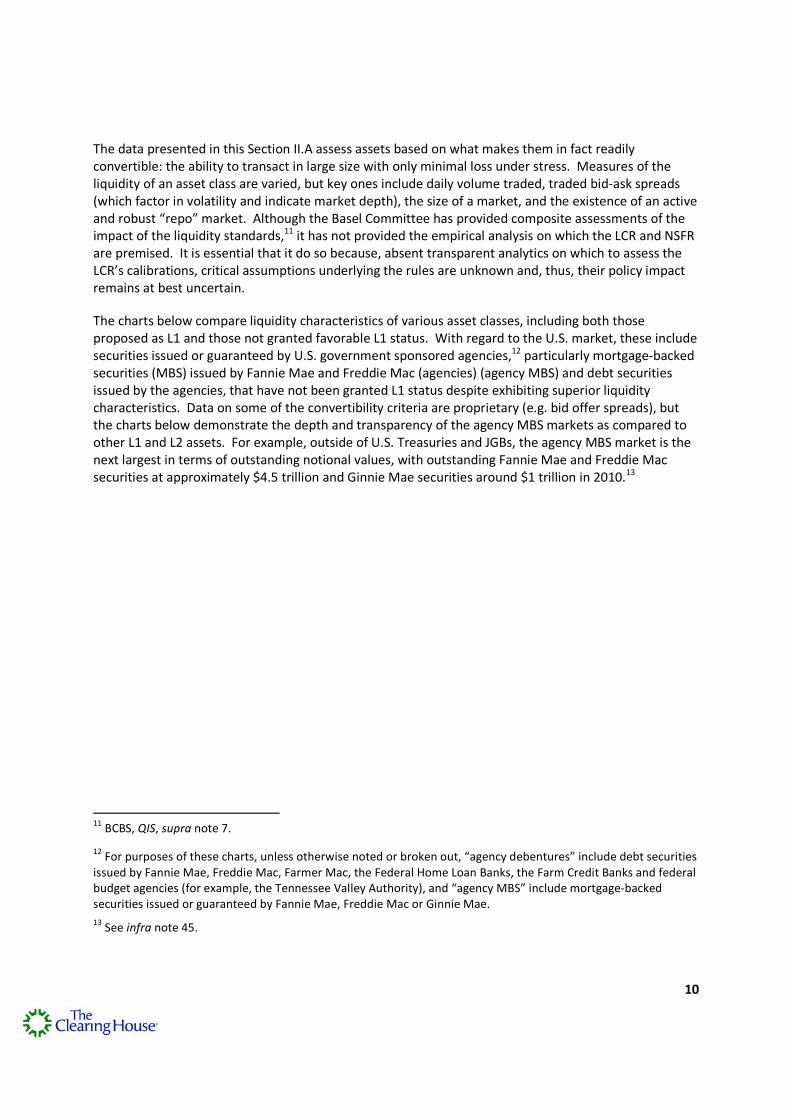
The charts below compare liquidity characteristics of various asset classes, including both thoseproposed as L1 and those not granted favorable L1 status. With regard to the U.S. market, these includesecurities issued or guaranteed by U.S. government sponsored agencies,12 particularly mortgage-backedsecurities (MBS) issued by Fannie Mae and Freddie Mac (agencies) (agency MBS) and debt securitiesissued by the agencies, that have not been granted L1 status despite exhibiting superior liquiditycharacteristics. Data on some of the convertibility criteria are proprietary (e.g. bid offer spreads), butthe charts below demonstrate the depth and transparency of the agency MBS markets as compared toother L1 and L2 assets. For example, outside of U.S. Treasuries and JGBs, the agency MBS market is thenext largest in terms of outstanding notional values, with outstanding Fannie Mae and Freddie Macsecurities at approximately $4.5 trillion and Ginnie Mae securities around $1 trillion in 2010.13
11BCBS, QIS, supra note 7.
12For purposes of these charts, unless otherwise noted or broken out, “agency debentures” include debt securities
issued by Fannie Mae, Freddie Mac, Farmer Mac, the Federal Home Loan Banks, the Farm Credit Banks and federalbudget agencies (for example, the Tennessee Valley Authority), and “agency MBS” include mortgage-backedsecurities issued or guaranteed by Fannie Mae, Freddie Mac or Ginnie Mae.
13See infra note 45.
11
Total Securities Amount Outstanding End of Year (USD $bn equivalent14)
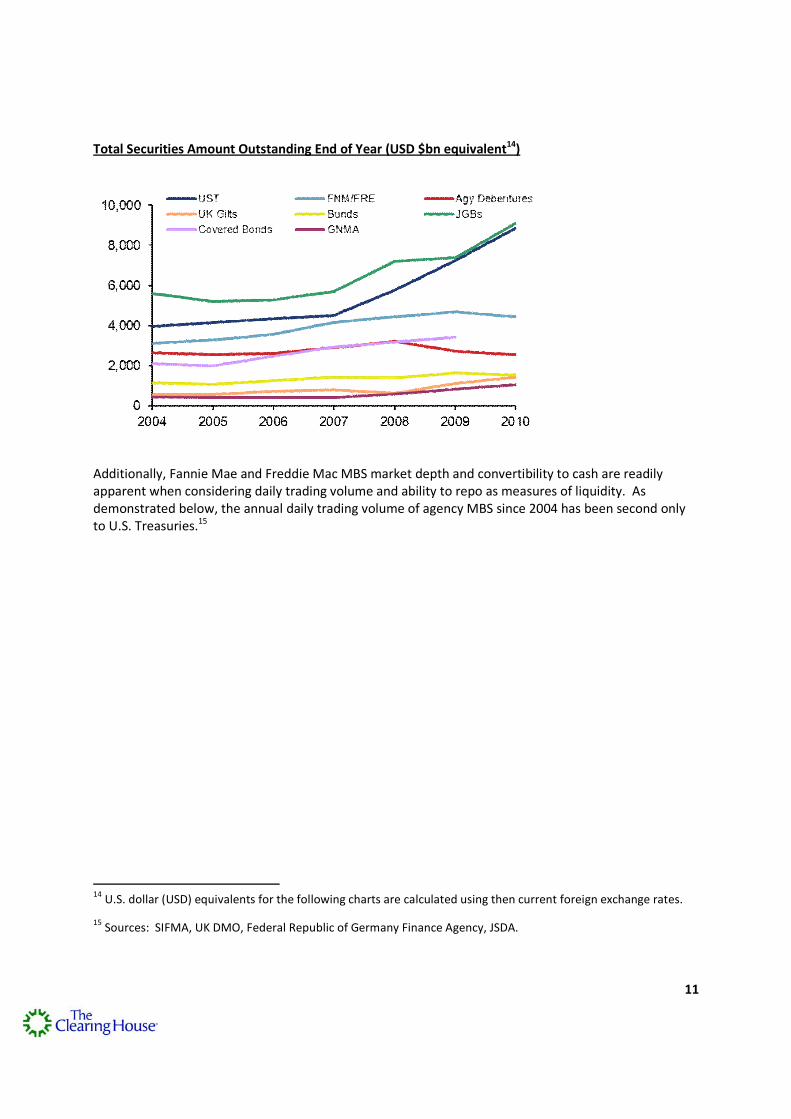
Additionally, Fannie Mae and Freddie Mac MBS market depth and convertibility to cash are readilyapparent when considering daily trading volume and ability to repo as measures of liquidity. Asdemonstrated below, the annual daily trading volume of agency MBS since 2004 has been second onlyto U.S. Treasuries.15
14U.S. dollar (USD) equivalents for the following charts are calculated using then current foreign exchange rates.
15Sources: SIFMA, UK DMO, Federal Republic of Germany Finance Agency, JSDA.
12
Daily Trading Volume (USD $bn equivalent - excludes Bills except as indicated)
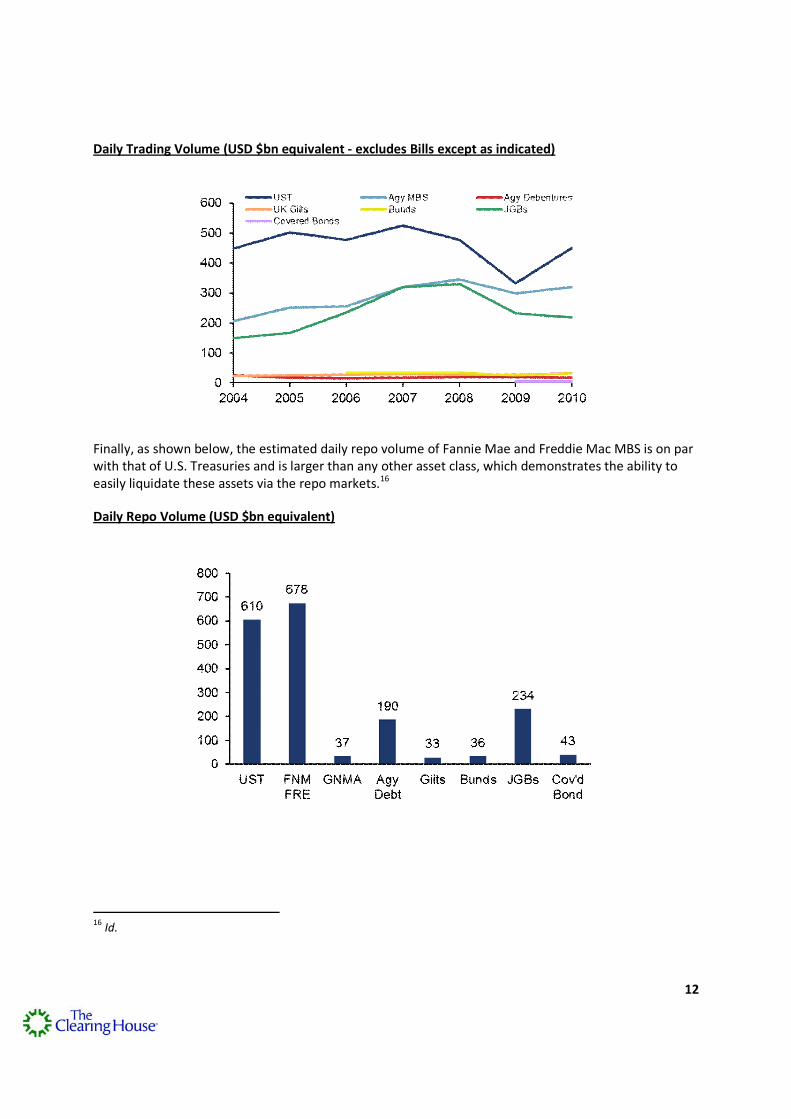
Finally, as shown below, the estimated daily repo volume of Fannie Mae and Freddie Mac MBS is on parwith that of U.S. Treasuries and is larger than any other asset class, which demonstrates the ability toeasily liquidate these assets via the repo markets.16
Daily Repo Volume (USD $bn equivalent)
16Id.
13
B. Calibrations In Some Areas Are More Conservative Than U.S. Banks’ Worst Case/Worst PeriodExperience
The Liquidity Study focused on the Basel III liquidity framework’s calibrations – that is, the requiredassumed run-off rates for deposits and other liabilities and drawdown rates for credit and liquidityfacilities.17 The data made available by the banks participating in the Liquidity Study generally was on amonthly basis from August 2008 through March 2009.
In comparing run-off rates and drawdown rates of banks participating in the Liquidity Study to the BaselIII requirements, the study uses the worst case data point – that is, (i) with respect to run-off rates as toa particular type of deposit, the highest run-off rate for any bank in the sample in any month during theperiod covered by the study and (ii) for drawdown rates as to a particular type of facility, the highestdrawdown rate for any bank in the sample in any month during the period covered by the study(referred to in this white paper as the “worst-case/worst-period” result). The study included data fromfour banks that failed or effectively failed – Wachovia, Washington Mutual, National City and Colonial.
The Liquidity Study shows that in some areas (run-off rates for retail deposits and credit lines tocorporate customers) the Basel III assumptions are generally reflective of worst-case/worst-periodexperience. But it also shows that in other areas, the Basel III requirements are extremely conservativeand not remotely reflective of U.S. experience. The primary examples in this regard are the run-offfactors for non-operational wholesale deposits (where the worst-case/worst period maximum run-offrates were 38-41%, depending on the type of deposit, compared to required assumed run-off rates of75-100%) and drawdown rates on liquidity lines to nonfinancial and financial customers (where theworst-case/worst-period drawdowns during the crisis were 9-10% compared to the LCR’s assumed100%).
The Liquidity Study’s comparison of the LCR’s calibrations to U.S. experience are set forth at pages 16 to20 and 24 to 27 of the study, with the data concerning the areas where there is the greatest divergence– non-operational wholesale deposits and drawdown rates on liquidity lines to non-financial andfinancial customers – appearing at pages 19 to 20 and 27. We share the regulatory community’s viewthat an area for further inquiry suggested by these results is an analysis of the consequences for endusers (that is, customers). We have made some efforts in that regard, addressed at pages 40 to 46 ofthe Liquidity Study and discussed further in Section IV.A, below. However, evaluating end userconsequences (for example, potentially higher fees or interest rates for some products and reducedavailability for others) presents a number of challenges. These include the complexities (and perhapseven impossibility) of conducting a dynamic evaluation that takes into account alternative products, ascompared to the analysis in the Liquidity Study which was conducted on a static basis, and theuncertainties in predicting real-life customer behavior in response to future events. We do not thinkregulators should be accepting of incorrect calibrations merely because the consequences are uncertainor cannot be proven ex ante. Instead, we strongly believe that sound regulation requires a clearstatement of the goal (see the introduction of this Section II) and calibrations based on empiricalanalysis that can reasonably be expected to implement that goal (without a bias to either excessiveconservatism or excessive leniency).
17See supra note 8 concerning the banks that participated in the Liquidity Study.
14
C. Federal Home Loan Bank Advances
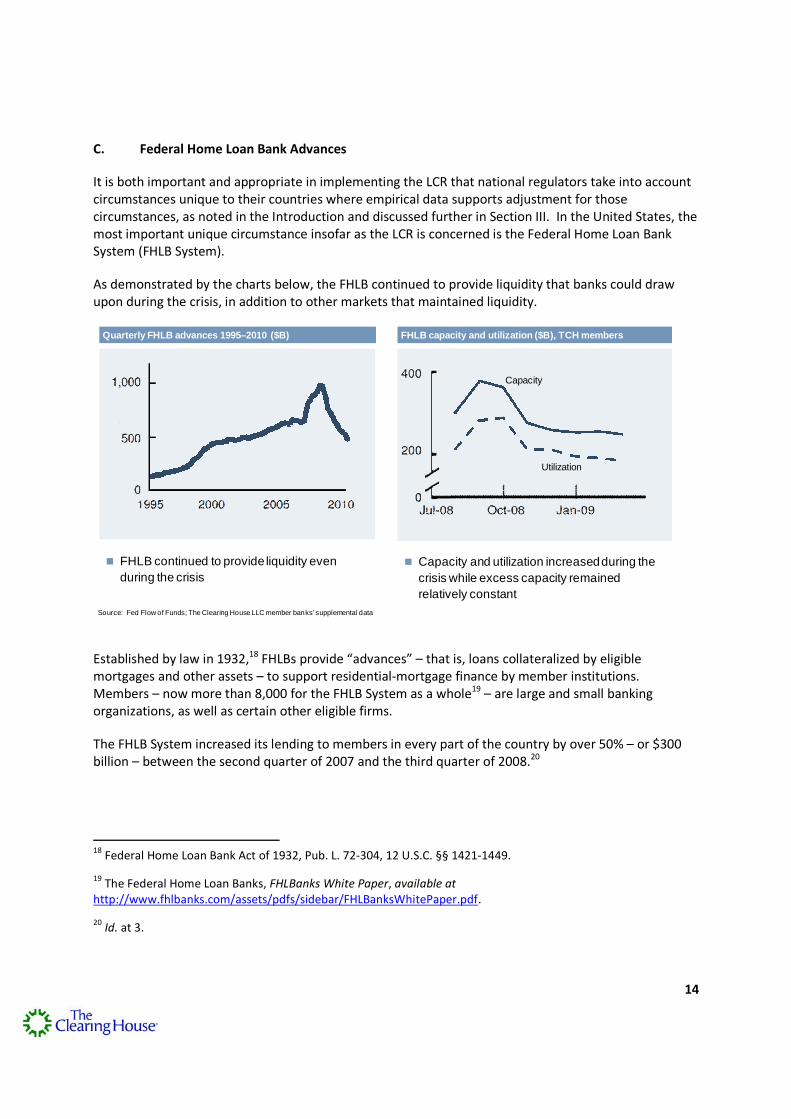
It is both important and appropriate in implementing the LCR that national regulators take into accountcircumstances unique to their countries where empirical data supports adjustment for thosecircumstances, as noted in the Introduction and discussed further in Section III. In the United States, themost important unique circumstance insofar as the LCR is concerned is the Federal Home Loan BankSystem (FHLB System).
As demonstrated by the charts below, the FHLB continued to provide liquidity that banks could drawupon during the crisis, in addition to other markets that maintained liquidity.
FHLB continued to provide liquidity even
during the crisis
Capacity and utilization increasedduring the
crisis while excess capacity remained
relatively constant
Quarterly FHLB advances 1995–2010 ($B) FHLB capacity and utilization ($B), TCH members
Capacity
Utilization
Source: Fed Flow of Funds; The Clearing House LLC member banks’ supplemental data
Established by law in 1932,18 FHLBs provide “advances” – that is, loans collateralized by eligiblemortgages and other assets – to support residential-mortgage finance by member institutions.Members – now more than 8,000 for the FHLB System as a whole19 – are large and small bankingorganizations, as well as certain other eligible firms.
The FHLB System increased its lending to members in every part of the country by over 50% – or $300billion – between the second quarter of 2007 and the third quarter of 2008.20
18Federal Home Loan Bank Act of 1932, Pub. L. 72-304, 12 U.S.C. §§ 1421-1449.
19The Federal Home Loan Banks, FHLBanks White Paper, available at
http://www.fhlbanks.com/assets/pdfs/sidebar/FHLBanksWhitePaper.pdf.
20Id. at 3.
15
Some in the official sector have expressed concern that the FHLB role does not warrant recognitionbecause the FHLBs pose taxpayer risk. However, a taxpayer subsidy would only occur in the event theFHLB System incurred a loss. Levels of protection exist to make this highly unlikely because:
the Banks are 100% privately capitalized with member stock and retained earnings;21
joint and several liability within the FHLB System protects individual district FHLBs;22
FHLB haircuts on the collateral that must back all advances are conservative, generally rangingfrom 25% to 50%;
no FHLB has experienced a credit loss on advances;23 and
none of the FHLBs required government assistance during the financial crisis.
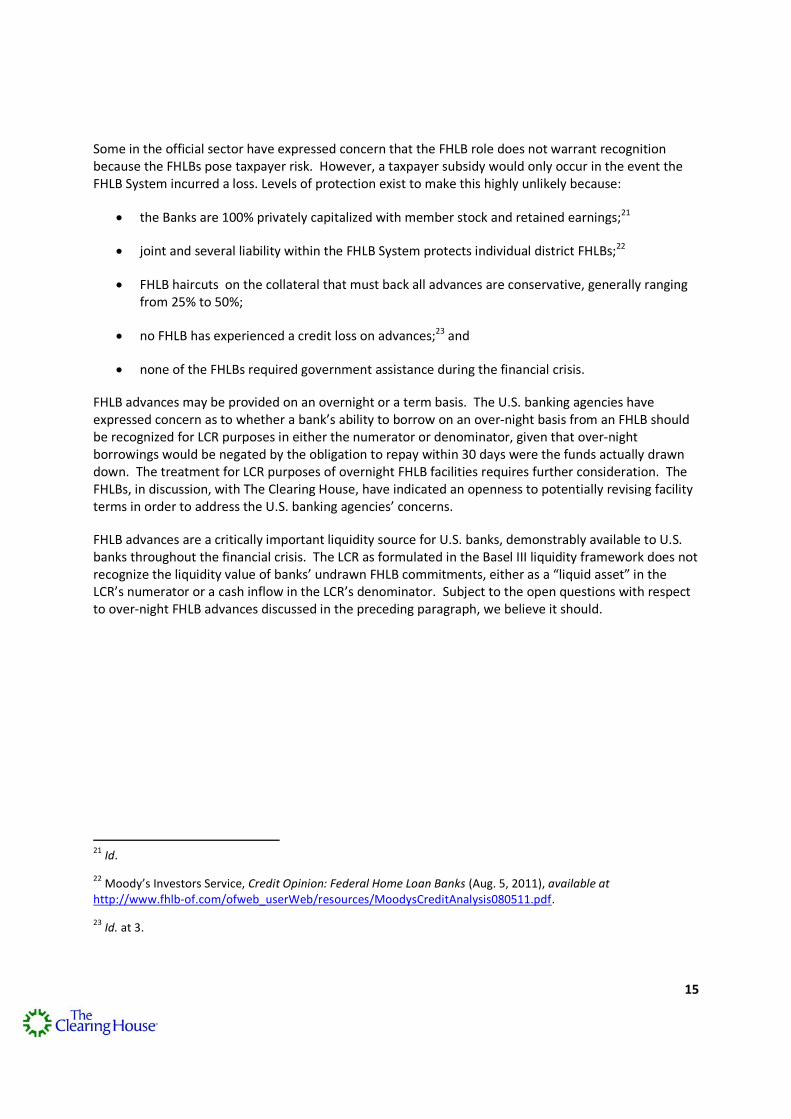
FHLB advances may be provided on an overnight or a term basis. The U.S. banking agencies haveexpressed concern as to whether a bank’s ability to borrow on an over-night basis from an FHLB shouldbe recognized for LCR purposes in either the numerator or denominator, given that over-nightborrowings would be negated by the obligation to repay within 30 days were the funds actually drawndown. The treatment for LCR purposes of overnight FHLB facilities requires further consideration. TheFHLBs, in discussion, with The Clearing House, have indicated an openness to potentially revising facilityterms in order to address the U.S. banking agencies’ concerns.
FHLB advances are a critically important liquidity source for U.S. banks, demonstrably available to U.S.banks throughout the financial crisis. The LCR as formulated in the Basel III liquidity framework does notrecognize the liquidity value of banks’ undrawn FHLB commitments, either as a “liquid asset” in theLCR’s numerator or a cash inflow in the LCR’s denominator. Subject to the open questions with respectto over-night FHLB advances discussed in the preceding paragraph, we believe it should.
21Id.
22Moody’s Investors Service, Credit Opinion: Federal Home Loan Banks (Aug. 5, 2011), available at
http://www.fhlb-of.com/ofweb_userWeb/resources/MoodysCreditAnalysis080511.pdf.
23Id. at 3.
16
D. Case History Suggests the Evidence is Unreliable
Wachovia Corporation (Wachovia) was the largest U.S. bank or thrift holding company to fail – that is,either file for bankruptcy or, in order to avoid a bankruptcy filing, be acquired by a more healthy bankholding company (Wells Fargo & Company (Wells Fargo) in the case of Wachovia) – during the financialcrisis. An examination of Wachovia’s actual experience with respect to
its ability to borrow in the repo market against agency MBS and debentures,
draw-down experience on liquidity facilities, and
run-off experience with respect to wholesale deposits
demonstrates the extreme conservatism of the assumptions underlying the LCR’s calibrations. TheWachovia experience also highlights the impact of important material differences in deposit insuranceschemes on run-off rates for insured deposits.
Wachovia was a typical commercial bank with an equal mix of commercial and retail activities, but was avery troubled institution throughout much of 2008.24 After the bankruptcy of Lehman Brothers onSeptember 15, 2008, Wachovia came under severe liquidity pressure. On October 3, 2008, at a pointwhen Wachovia was liquid, Wachovia agreed to be acquired by Wells Fargo. Wells Fargo providedliquidity support that day to ensure Wachovia’s balance at the Federal Reserve was greater than zero.
24 See, e.g., David Mildenberg, Wachovia Has Record $8.9 Billion Loss, Cuts Dividend (July 22, 2008), available athttp://www.bloomberg.com/apps/news?pid=newsarchive&sid=a3cStztOg8pk.
1. Wachovia Bank, National Association Repo by Collateral Type
Wachovia’s balance sheet performance at this time demonstrates that, even for a failed bank, the Basel III LCR calibrations are incorrect. For example, repos of L1 and L2 assets provided significant liquidity for Wachovia at the height of its crisis. Wachovia raised funds in September 2008 during its period of most severe stress through repo funding of Treasuries, agency debentures and agency MBS. The chart below shows that repo funding continued into October at declining balances due to the availability of other
sources.25
2. Credit and Liquidity Facility Draw Assumptions
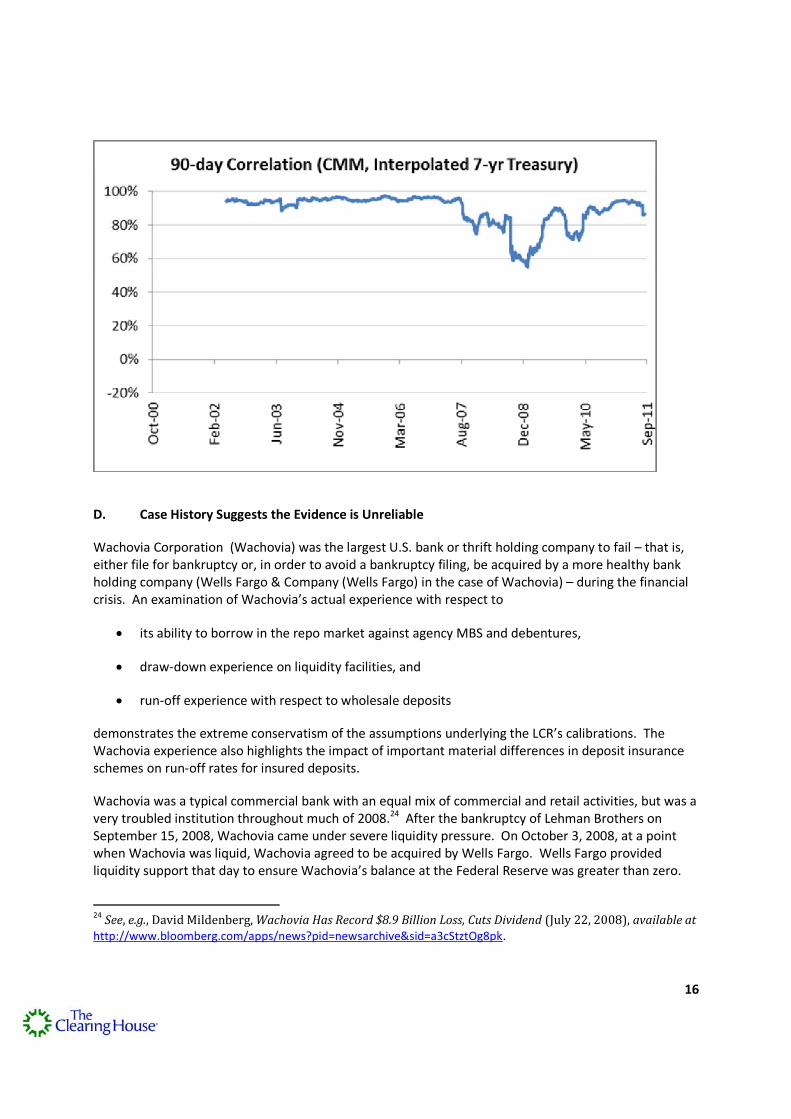
Similarly, Wachovia’s actual crisis experience for credit facility draws, in addition to corporate and financial institution deposit run-offs, suggest the LCR factors are either significantly mis-calibrated or do not reflect differences in national banking practices. As can be seen in the charts below, the Basel III factors provide for dramatically more severe conditions than the actual Wachovia experience.
($ billions)
8/31/2008
9/30/2008 10/31/2008
30 Day
Change in
Utilization
Basel
Factor
Basel Factor
vs Experience
Non-Financial
Corporate Draws - Commitments $ 358.3 $ 350.8 $ 349.0
Outstandings 193.6 198.6 201.0 Utilization 54.0% 56.6% 57.6% 1.0% 10.0% 10.1 x
Retail Draws - Commitments $ 85.7 $ 84.8 $ 83.9
Outstandings 29.0 29.3 29.7 Utilization 33.8% 34.6% 35.4% 0.8% 5.0% 6.2 x
Additionally, the worst liquidity line drawdowns were well below LCR factors. Liquidity lines to financials and non-financials experienced 9% and 10% maximum drawdowns, respectively, during the crisis, while the LCR provides for 100% draws for both.
25 Wachovia historical data is provided by Wells Fargo.
17
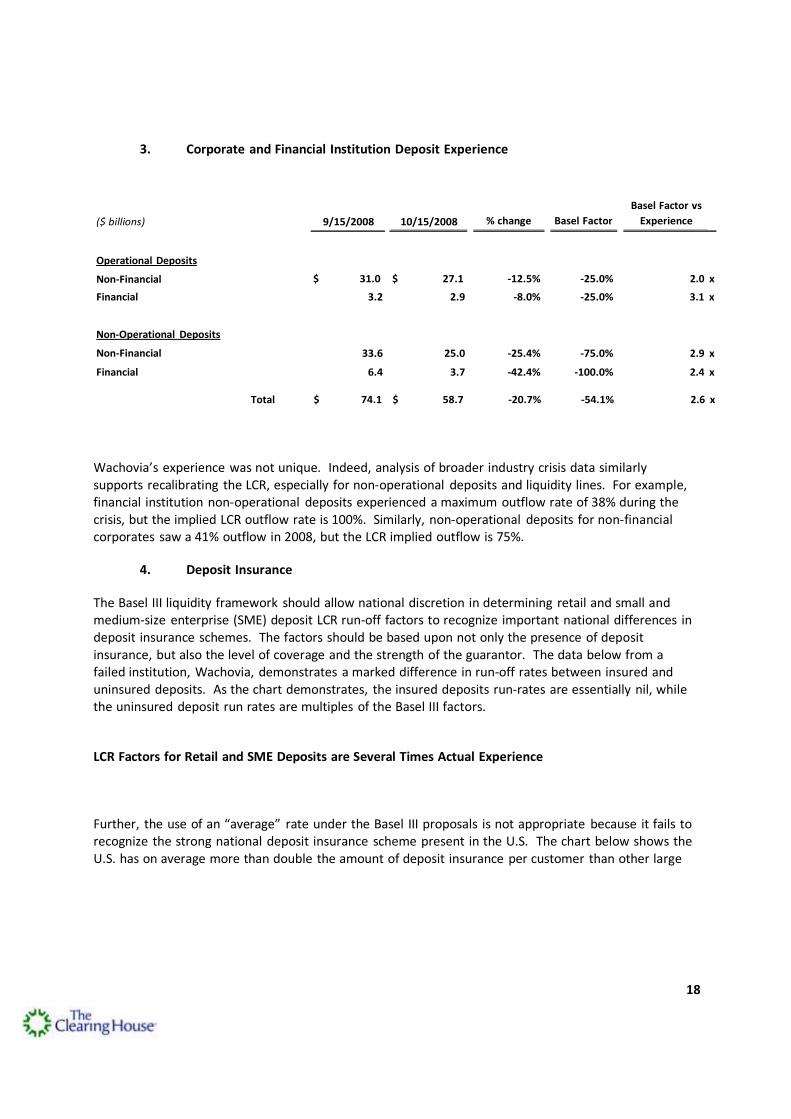
3. Corporate and Financial Institution Deposit Experience
($ billions)
9/15/2008
10/15/2008
% change
Basel Factor
Basel Factor vs
Experience
Operational Deposits
Non-Financial
$ 31.0
$ 27.1
-12.5%
-25.0%
2.0 x
Financial 3.2 2.9 -8.0% -25.0% 3.1 x
Non-Operational Deposits
Non-Financial
33.6
25.0
-25.4%
-75.0%
2.9 x
Financial 6.4 3.7 -42.4% -100.0% 2.4 x
Total $ 74.1 $ 58.7 -20.7% -54.1% 2.6 x
Wachovia’s experience was not unique. Indeed, analysis of broader industry crisis data similarly supports recalibrating the LCR, especially for non-operational deposits and liquidity lines. For example, financial institution non-operational deposits experienced a maximum outflow rate of 38% during the crisis, but the implied LCR outflow rate is 100%. Similarly, non-operational deposits for non-financial corporates saw a 41% outflow in 2008, but the LCR implied outflow is 75%.
4. Deposit Insurance
The Basel III liquidity framework should allow national discretion in determining retail and small and medium-size enterprise (SME) deposit LCR run-off factors to recognize important national differences in deposit insurance schemes. The factors should be based upon not only the presence of deposit insurance, but also the level of coverage and the strength of the guarantor. The data below from a failed institution, Wachovia, demonstrates a marked difference in run-off rates between insured and uninsured deposits. As the chart demonstrates, the insured deposits run-rates are essentially nil, while the uninsured deposit run rates are multiples of the Basel III factors.
LCR Factors for Retail and SME Deposits are Several Times Actual Experience
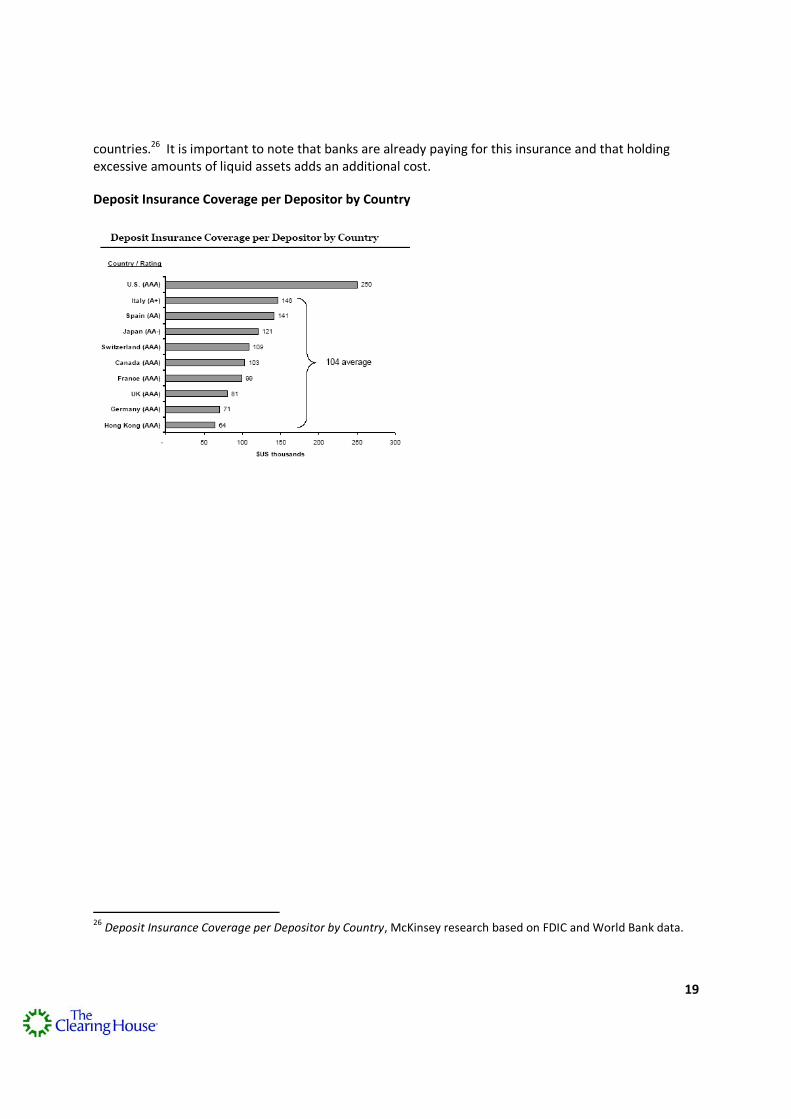
Further, the use of an “average” rate under the Basel III proposals is not appropriate because it fails to recognize the strong national deposit insurance scheme present in the U.S. The chart below shows the U.S. has on average more than double the amount of deposit insurance per customer than other large
18
19
countries.26 It is important to note that banks are already paying for this insurance and that holdingexcessive amounts of liquid assets adds an additional cost.
Deposit Insurance Coverage per Depositor by Country
26Deposit Insurance Coverage per Depositor by Country, McKinsey research based on FDIC and World Bank data.
20
III. THE COMPETITIVE LANDSCAPE
The Basel III rules are intended as a global framework for all member nations.27 It is important,therefore, to consider the Basel III rules not just in their own light and in the context of pending U.S.regulatory actions to craft a meaningful domestic liquidity-risk regulatory regime (see Section C ofAppendix 2), but also in light of whether other BCBS member nations in fact implement Basel III asfinalized. If only the U.S. implements Basel III as prescribed in the final standards released by the BaselCommittee, the U.S. not only would be adhering to rules that do not appropriately reflect U.S. crisisexperience and market functions, but it would also place U.S. banks at undue risk because other nationswill permit banks that compete with U.S. banks or are their counterparties to take liquidity risk thatcould be captured through meaningful compliance and robust enhanced practices.
It is essential that final rules result in consistent application across jurisdictions in order to ensure a levelplaying field from a competitive perspective. Consistent application does not, however, requireidentical rules – for example, disregard of a liquidity source that is unique to a particular country (in theUnited States, most importantly, agency MBS and debentures and FHLB advances) or that calibrations ofrun-off factors and assumed draw-down rates on credit and liquidity facilities be identicalnotwithstanding that experience may differ country-by-country, depending upon the circumstances inparticular countries (in the United States, most importantly, non-operational wholesale deposits andliquidity facilities). At least pending refinement of the LCR through the observation period to betteradapt to unique national circumstances, it is extremely important that the U.S. regulators show thesame flexibility that regulators in other countries are showing. In order to ensure consistent applicationacross jurisdictions, we believe that national regulators should expand the peer review processcontemplated for a number of aspects of the Basel III liquidity and capital frameworks to ensure thatdeviations from “base” Basel III liquidity rules do not detract from the rigor and cross-border substantiveequivalence of the Basel III liquidity rules but instead are justified based on the circumstances ofparticular countries.
A. European Union
The European Commission (EC) finalized Capital Requirements Directive IV (CRD IV)28 and presented it tothe European Parliament for final action in July 2011. A framework for implementing the Basel IIIliquidity standards is among a panoply of regulatory provisions included in CRD IV. CRD IV potentiallypermits a looser definition of eligible liquid assets under the LCR and does not commit toimplementation of the NSFR. For example, while Basel provides the prescriptive definition of L1 and L2assets as outlined in Section B.1 of the attached appendix, CRD IV allows a broad definition of liquidassets that includes "transferable assets that are of extremely high liquidity and credit quality" and
27BCBS members come from: Argentina, Australia, Belgium, Brazil, Canada, China, France, Germany, Hong Kong
SAR, India, Indonesia, Italy, Japan, Korea, Luxembourg, Mexico, the Netherlands, Russia, Saudi Arabia, Singapore,South Africa, Spain, Sweden, Switzerland, Turkey, the United Kingdom and the United States.
28Press Release, European Commission, Commission wants stronger and more responsible banks in Europe (July
20, 2011), available athttp://europa.eu/rapid/pressReleasesAction.do?reference=IP/11/915&format=HTML&aged=0&language=EN&guiLanguage=en.
21
"transferable assets that are of high liquidity and credit quality."29 Although the directive includesvarious suggestions as to ratios the European Banking Authority (EBA) should consider in assessing abank’s liquidity over a thirty-day horizon, the directive requires only that a bank demonstrate itsresilience, not that it actually meet the LCR as prescribed by the Basel Committee. Additionally, the ECwill only “consider proposing an NSFR after an observation and review period in 2018.”30
EU legislative deliberations will likely take place through the end of 2011 and could potentially reshapethe liquidity rules mandated in CRD IV. National guidelines will follow this and are expected to bereleased in 2012 in order to satisfy the Basel deadline of January 1, 2013 implementation.
B. Asia
Asian nations are similarly working towards implementation of the Basel liquidity standards, but areencountering challenges, such as a significant shortage of eligible liquid assets that qualify under theLCR. Specifically, in countries such as Australia, Hong Kong and Singapore, there is a limited supply ofgovernment securities, which constitute L1 assets, and non-bank corporate debt, which qualify as L2assets.31 These nations are currently considering a number of options on how to address this problem.For example, the Reserve Bank of Australia plans to establish a government liquidity facility which willcover LCR shortfalls in exchange for a market-based fee and qualifying collateral.32 The size of thefacility and final rules are under consideration and pending consultation during 2011 and 2012. Notably,establishment of a government facility that is essentially paid by banks for services that facilitatecompliance would not appear to meet Basel III’s goals of ensuring that banks themselves institute robustliquidity-risk management protocols in conformity with the rule. This raises significant questions bothabout the degree of real international implementation and the subsequent competitiveness andregulatory-arbitrage implications resulting from approaches such as those under consideration inAustralia.
The Hong Kong Monetary Authority (HKMA) is similarly weighing how to address the dearth of qualifyingliquid assets, with banks told to adjust portfolios to address an overreliance on bank-issued paper thatdoes not qualify under the LCR, and a current lack of qualifying sovereign, central bank and non-financial
29European Commission Proposal for a Regulation, On Prudential Requirements for Credit Institutions and
Investment Firms, Part III (July 20, 2011), at 85, available athttp://ec.europa.eu/internal_market/bank/docs/regcapital/CRD4_reform/20110720_regulation_proposal_part3_en.pdf.
30 European Commission Proposal for a Regulation, On Prudential Requirements for Credit Institutions andInvestment Firms, Part I (July 20, 2011), at 6, available athttp://ec.europa.eu/internal_market/bank/docs/regcapital/CRD4_reform/20110720_regulation_proposal_part1_en.pdf.
31 Rachel Armstrong, Basel Liquidity Rules Pose Risks for Asia-Pacific Banks, Reuters (Mar. 21, 2011) available athttp://www.reuters.com/article/2011/03/21/us-asia-basel-liquidity-idUKTRE72K0SG20110321.
32Reserve Bank of Australia, Australian Implementation of Global Liquidity Standards (Dec. 17, 2010) available at
http://www.rba.gov.au/media-releases/2010/jmr-10-31.html.

22
corporate debt.33 Again, it is unclear how binding this approach will be, in contrast to the prescriptiveratios adopted by the Basel Committee. The HKMA is discussing options for covering liquidity shortfallsrevealed by 2010 and 2011 QIS results, and will prepare draft legislative amendments by the thirdquarter of 2011, which will be introduced in the 2011-2012 legislative session.34 Similarly, in the wake ofthe QIS results released in December 2010 that showed South Korean banks were below average globalliquidity ratios,35 South Korea established a task force composed of various regulators and academicexperts to determine how it should implement the Basel liquidity standards.36
Interestingly, the China Banking Regulatory Commission (CBRC) issued guidance earlier this year statingthat the LCR and NSFR will come into effect on January 1, 2012, with only two-year and five-yearobservation periods, respectively, but banks should meet the ratios by the end of 2013 and 2016,respectively.37 In a follow-up release, the CBRC noted that “quantitative impact measurements showthat the majority of domestic banks have already reached or will reach shortly the regulatoryrequirements on liquidity.”38
33Viren Vaghela, HKMA’s Yuen Urges Banks to Take Action Now on Basel III LCR; Warns of Negative Impact for
Corporate Debt Markets (Mar. 29, 2011), available at http://www.risk.net/asia-risk/news/2038355/hkma-s-yuen-urges-banks-action-basel-iii-lcr-warns-negative-impact-corporate-debt-markets.
34HKMA, Circular – Implementation of Basel III in Hong Kong (Jan. 16, 2011) available at,
http://www.info.gov.hk/hkma/eng/guide/circu_date/20110126e1.pdf.
35Financial Services Commission and Financial Supervisory Service, Basel III Quantitative Impact Study and Its
Implications (Dec. 17, 2010), available at www.fsc.go.kr/downManager?bbsid=BBS0048&no=72729.
36Financial Services Commission, Financial Services Commission has Launched a Task Force to Follow Up With G20
Agreement (Mar. 10, 2011), available at http://fsckorea.wordpress.com/2011/03/10/financial-services-commission-has-launched-a-task-force-to-follow-up-with-g20-agreement/.
37CBRC, Guiding Opinions on the Implementation of New Regulatory Standards in China’s Banking Sector (Apr. 27,
2011), available athttp://www.lawinfochina.com/NetLaw/display.aspx?db=law&sen=rLdDdW4drhdDdWcdrLd5dWddrLdGdWPd9DdydWcdrddTdWudrDdTdWEd/DdDdWud/ddTdWud9Dd+&Id=8709&.
38CBRC, The CBRC Respond to Questions of the Press Relating to the Guiding Opinions on the Implementation of
New Regulatory Standards in China’s Banking Industry (May 3, 2011) available athttp://www.cbrc.gov.cn/english/home/jsp/docView.jsp?docID=20110613FCE47ABD05FA4204FF5BCBC854991A00.
23
IV. POLICY AND MARKET CONSEQUENCES – PROBLEMATIC OR UNKNOWN
In its December 2010 release, the Basel Committee stated that it would review the LCR and NSFR for“unintended consequences” and, if these are found, revise the rule as needed.39 We have highlightedbelow several areas where the likely consequences of the rules may be unintended and are problematic,or at the least may not be .
A. Market and Customer Implications
In connection with this project, the Liquidity Study analyzed five products (and related markets) that willbe affected as a result of the LCR. The Clearing House chose these products for analysis because theyare the products directly affected by the areas where the LCR’s calibrations most significantly divergefrom U.S. worst case/worst period experience – namely, non-operational wholesale deposits anddrawdown rates on liquidity lines to non-financial and financial customers.40 The five products arecommercial paper (CP) backstops, financial institution liquidity lines, variable rate demand note (VRDN)backstops, corporate non-operational deposits, and financial institution non-operational deposits.
The Liquidity Study shows that, as of December 2010, the amounts of liquidity held by banks used in thesample for the analysis with respect to the five products was roughly in line with the worst case/worstperiod outflow rates during the financial crisis.41 The analysis undertaken by The Clearing Houseattempted to quantify the impacts on these products of implementation of the LCR, as reflected in theBasel III liquidity framework, including the pricing and availability of these products. Because of theconstraints imposed by antitrust laws, we are describing in this Section IV.A, and have included with theversion of the Liquidity Study that accompanies this white paper, only a general discussion of themethodology used and its results. The Clearing House has presented the more detailed results to theU.S. banking agencies on a confidential basis.
1. Methodology
The Liquidity Study arrived at these conclusions by distributing the impact of the LCR among bankproducts based on the difference between the LCR runoff factors prescribed in the Basel III rules andinternal bank outflow assumptions for each product. As indicated above, the main driver of productselection was based on discrepancies between the LCR runoff factor and the actual experience of banksduring the crisis, although other considerations, including market size and constituencies of interest,were also taken into account. To develop a fact-based view of the LCR on banks, products, and markets,a coordinated approach was taken:
39BCBS, Basel III, supra note 2, at 2.
40See Section II.B of this white paper.
41See page 42 of the Liquidity Study for a comparison of the historical amounts of liquidity held by banks against
these products as compared to worst case/worst period outflow rates during the financial crisis and implied LCRcalibrations.
24
i. internal data on the current economics and cost impact of the LCR was collected acrossfourteen products and thirteen banks, which account for $9.2 trillion in assets,representing 57% of total U.S. bank assets;
ii) twenty-five product managers were interviewed across eleven banks in order tounderstand the implications for product pricing, structure, and availability in responseto increased costs;
iii) thirteen customers and investors were interviewed to understand the implications ofthe product impact for their cash-management, financing, and investing activities; and
iv) ten bank treasurers were interviewed to understand the implications for overall balancesheet management (e.g., overall lending availability).
2. Commercial Paper Backstops
CP is a low-cost, short-term financing instrument used by large corporations, banks, and other financialinstitutions (e.g., money market funds), with a market size of $1.1 trillion in the first quarter of 2011.Approximately $500 billion of outstanding CP requires a liquidity line backstop to qualify as investmentgrade. Additionally, institutions have historically relied more significantly on CP, with the market size in2007 at approximately $2 trillion. From the sample of banks surveyed, the price of CP backstops isexpected to rise and its structure may change as well due to the LCR. As noted above, the primarydriver of the cost increase is the discrepancy between banks’ internal liquidity models, historical outflowrates experienced during the 2008 crisis, and the LCR’s implied outflow rate. For example, banks havehistorically held between three to 16% of liquidity against CP backstops. While this was provedinsufficient in some instances, when considering that the maximum outflow rate during the 2008financial crisis was as high as 10%, the LCR requires a stringent 100% coverage. This substantialdiscrepancy will lead to dramatic changes in the CP market and will change how current CP customersfund themselves.
3. Financial Institution Liquidity Lines
Financial institution (FI) liquidity lines are used by money market funds, broker-dealers, pension funds,insurance companies, and sellers of assets (e.g., auto finance, credit card companies). Using traditionaldefinitions of FI, the market size of FI liquidity lines is approximately $350 billion. However, the Basel IIIliquidity rules are based upon a much broader definition of FIs than is traditionally used in the industry.As a result, additional research likely is needed to understand the aggregate amount of credit andliquidity lines outstanding to firms that may fall within the LCR’s broad definition of an FI. Again, thecost of providing these liquidity lines is expected to rise as a result of the LCR implied runoff rate, andthe structure of the product may change as well. Historically, banks hold an average of 19% liquidityagainst these products, which experienced maximum outflows of 9% during the crisis. Nevertheless, theLCR factor again accounts for a 100% drawdown rate.
4. Variable Rate Demand Notes
Variable Rate Demand Notes (VRDNs) are low-cost, long-term financing instruments that are primarilyused by municipalities, hospitals, and higher-education institutions to borrow long-term at short-term
25
rates. The market as of the second quarter of 2011 was approximately $360 billion, which is down from$420 billion prior to the financial crisis. The reasons for the decrease in VRDNs cited by banks includethe fact that municipalities exited the market and that banks also exited the letter-of-credit (LC), orstandby bond purchase agreements (SBPA) markets which provide the backstops necessary to qualifyVRDNs as investment grade. Ultimately, the LCR may lead to a decrease in availability and an increase inprice for VRDNs. Again the primary reason is the 100% LCR implied outflow rate, compared to 18%historically held by banks and a 10% maximum outflow during the crisis.
5. Non-Operational Deposits
Non-operational deposits are comprised of Money Market Deposit Accounts (MMDAs), term deposits,and a portion of Demand Deposit Accounts (DDAs), estimated to be approximately 15% of the depositbase. There is significant variability across banks in classification of deposits as operational or non-operational – for example, some banks treat sweep accounts as operational, while others consider themnon-operational. This complicates analysis in this product category. However, under the Baselcategorization, the market stands at approximately $1.5 trillion. Non-operational deposits alsorepresent approximately 30% of corporate short term cash and 10% of FI short term cash.
Again, the discrepancy between the Basel calibrations and the historical worst case run-off rates willcause price increases for these products. For example, while corporate non-operational depositsexperienced a maximum outflow of 41% during the crisis, the LCR implied outflow rate is 75%. Similarly,FI non-operational deposits experienced a 38% maximum runoff in 2008 but the LCR requires 100%coverage.
B. The Impact of New Incentives to Increase Holdings in Sovereign Debt
The Basel III liquidity rules evidence a strong preference for banks to use sovereign securities to meettheir LCR requirements. The underlying rationale for this preference would seem to be that sovereignsecurities that meet certain liquidity benchmarks may be just as good as cash during a stress scenario.The support for this argument is questionable and discounted not only by experiences with sovereigndebt during the recent crisis in Europe, but also by a new supervisory study on sovereign credit riskpublished by the BIS Committee on the Global Financial System (CGFS).42 This is discussed further inSection VI.C., where key research related to the liquidity rules is assessed. Here, we focus specifically onthe unintended customer and product implications of this reliance.
The LCR rules will lead to a substantially higher demand by banks for sovereign debt. The LCR dividesthe “stock of liquid assets”, which is the numerator in the ratio, into two categories: L1 (cash, centralbank deposits and sovereign securities (0% risk weighting)); and L2 (agency MBS and debt securities,non-financial corporate debt and covered bonds (with a haircut)). To be LCR compliant, banks will need
42BIS, The Impact of Sovereign Credit Risk on Bank Funding Conditions (July 11, 2011), available at
http://www.bis.org/publ/cgfs43.pdf.
26
to carry a larger proportion of sovereign debt with explicit sovereign backing in their investmentportfolios.43
This will force banks' asset concentrations into relatively few asset categories, thus altering theeconomic appeal of those assets and market dynamics in those asset classes (i.e., potentially creating ashortage of liquid assets). Of course, the more banks concentrate in a few asset classes, the greater therisk to the bank and the financial system. First, a bank will have more capital at risk in a single assetclass, thus limiting the prudential resilience that portfolio diversification provides.
Additionally, this asset concentration in sovereign obligations could also exert downward pressure on“risk-free” interest rates, especially at medium- and long-term maturities. In particular, the yields ofliquid buffer eligible securities are expected to decline relative to those of non-liquid asset buffer eligiblesecurities, so that yield spreads between them would become wider. These generally form the basis forpricing of both wholesale and consumer credit products, ultimately leading to higher costs of credit.
Further, the LCR liquid asset buffer, as defined, will result in a high degree of correlation across certaintypes of asset classes among financial institutions. Firms may be forced to take similar actions to reachcompliance and, during market stress, this may well result in multiple financial institutions attempting toliquidate the same or similar types of assets (herd mentality) which will cause dislocation in marketpricing. During the 2008-2009 credit crisis, many securities regarded as highly liquid in pre-crisis timessuddenly became illiquid. What seems liquid today may be less liquid tomorrow (i.e., Europeansovereigns) or under specific circumstances (i.e., U.S. debt crisis/S&P downgrade). This argues for awider classification of liquid assets (as outlined below) versus the current narrow definition. As seenwith the European sovereign crisis, government securities are not always a consistent source of stability.With a broader spectrum of eligible assets, a financial institution is less likely to experience cliff effects(eligible today, not eligible tomorrow) and volatility.
In addition, LCR calibrations currently bifurcate the market into assets that generally either fully qualifyor do not qualify at all, with limited exceptions for L2 assets that qualify but only with haircuts. This kindof bifurcation will significantly change how markets function in the future because today’s marketscapture the liquidity value within pricing and haircuts. A more diversified approach would mitigate thisrisk by providing at least some inclusion for a wider array of products based on liquidity characteristics.
The LCR’s focus on sovereign debt has particular implications in the U.S. due to banks’ holdings ofagency securities (principally MBS and debentures), along with the importance of advances from theFHLB System as a liquidity source for U.S. banks. Specific issues relating to the role of agencies in theLCR are discussed in Section II.A. Here, we address the unintended consequences of the adversetreatment of agency obligations: bank investment portfolios will be less diversified going forward. Theremay also be a potentially significant decline in bank investment in agency MBS and debentures withoutany offsetting improvement in liquidity.
43 In order to meet the LCR shortfall solely by buying L1 assets, U.S. banks would need to increase their U.S.Treasury holdings from 3.2% of total outstanding Treasuries to 14%. If these banks also determine that holdingagencies is less attractive than Treasuries, banks could hold up to 28% of total outstanding Treasuries, and thisratio could rise even higher if Treasury issuances return to lower historical levels.
27
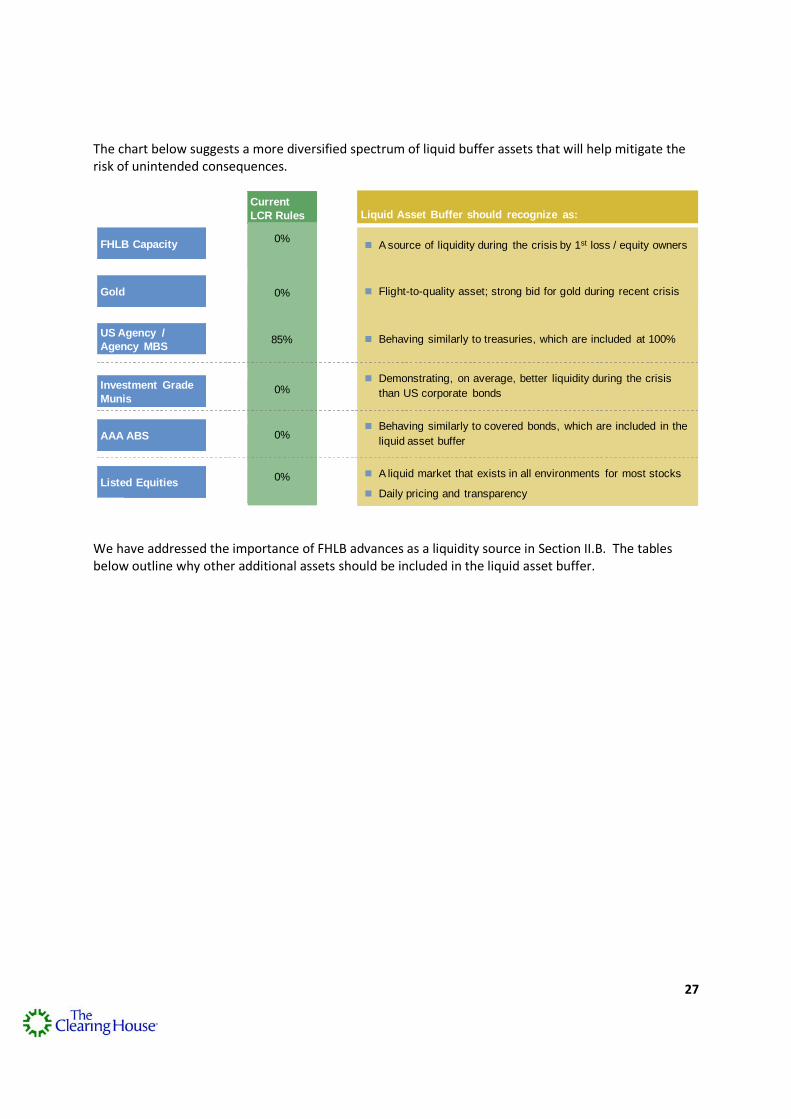
The chart below suggests a more diversified spectrum of liquid buffer assets that will help mitigate therisk of unintended consequences.
CurrentLCR Rules Liquid Asset Buffer should recognize as:
US Agency /Agency MBS
85% Behaving similarly to treasuries, which are included at 100%
Gold 0% Flight-to-quality asset; strong bid for gold during recent crisis
FHLB Capacity0%
A source of liquidity during the crisis by 1st loss / equity owners
AAA ABS 0% Behaving similarly to covered bonds, which are included in the
liquid asset buffer
Listed Equities0% A liquid market that exists in all environments for most stocks
Daily pricing and transparency
0% Demonstrating, on average, better liquidity during the crisis
than US corporate bondsInvestment GradeMunis
We have addressed the importance of FHLB advances as a liquidity source in Section II.B. The tablesbelow outline why other additional assets should be included in the liquid asset buffer.
28
0
200
400
600
800
1,000
1,200
1,400
1,600
1,800
1/07 11/07 9/08 7/09 5/10
Gold S&P 500 Index
Source: FactSet
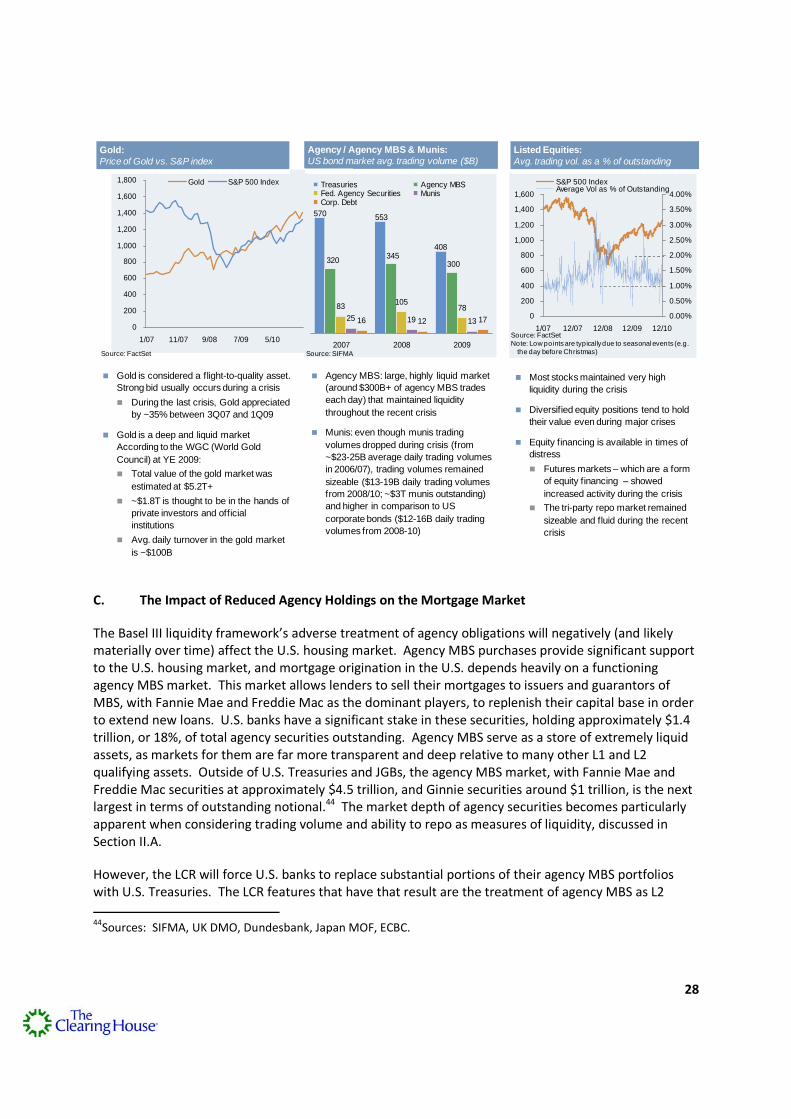
Gold is considered a flight-to-quality asset.
Strong bid usually occurs during a crisis
During the last crisis, Gold appreciated
by ~35% between 3Q07 and 1Q09
Gold is a deep and liquid market
According to the WGC (World Gold
Council) at YE 2009:
Total value of the gold market was
estimated at $5.2T+
~$1.8T is thought to be in the hands of
private investors and official
institutions
Avg. daily turnover in the gold market
is ~$100B
Gold:Price of Gold vs. S&P index
83105
78
25 19 1316 12 17
408
570 553
300345
320
2007 2008 2009
Treasuries Agency MBSFed. Agency Securities MunisCorp. Debt
Agency / Agency MBS & Munis:US bond market avg. trading volume ($B)
Agency MBS: large, highly liquid market
(around $300B+ of agency MBS trades
each day) that maintained liquidity
throughout the recent crisis
Munis: even though munis trading
volumes dropped during crisis (from
~$23-25B average daily trading volumes
in 2006/07), trading volumes remained
sizeable ($13-19B daily trading volumes
from 2008/10; ~$3T munis outstanding)
and higher in comparison to US
corporate bonds ($12-16B daily trading
volumes from 2008-10)
0
200
400
600
800
1,000
1,200
1,400
1,600
1/07 12/07 12/08 12/09 12/10
0.00%
0.50%
1.00%
1.50%
2.00%
2.50%
3.00%
3.50%
4.00%
S&P 500 IndexAverage Vol as % of Outstanding
Listed Equities:Avg. trading vol. as a % of outstanding
Source: FactSetNote: Low pointsare typicallydue to seasonal events (e.g.
the day before Christmas)Source: SIFMA
Most stocks maintained very high
liquidity during the crisis
Diversified equity positions tend to hold
their value even during major crises
Equity financing is available in times of
distress
Futures markets – which are a form
of equity financing – showed
increased activity during the crisis
The tri-party repo market remained
sizeable and fluid during the recent
crisis
C. The Impact of Reduced Agency Holdings on the Mortgage Market
The Basel III liquidity framework’s adverse treatment of agency obligations will negatively (and likelymaterially over time) affect the U.S. housing market. Agency MBS purchases provide significant supportto the U.S. housing market, and mortgage origination in the U.S. depends heavily on a functioningagency MBS market. This market allows lenders to sell their mortgages to issuers and guarantors ofMBS, with Fannie Mae and Freddie Mac as the dominant players, to replenish their capital base in orderto extend new loans. U.S. banks have a significant stake in these securities, holding approximately $1.4trillion, or 18%, of total agency securities outstanding. Agency MBS serve as a store of extremely liquidassets, as markets for them are far more transparent and deep relative to many other L1 and L2qualifying assets. Outside of U.S. Treasuries and JGBs, the agency MBS market, with Fannie Mae andFreddie Mac securities at approximately $4.5 trillion, and Ginnie securities around $1 trillion, is the nextlargest in terms of outstanding notional.44 The market depth of agency securities becomes particularlyapparent when considering trading volume and ability to repo as measures of liquidity, discussed inSection II.A.
However, the LCR will force U.S. banks to replace substantial portions of their agency MBS portfolioswith U.S. Treasuries. The LCR features that have that result are the treatment of agency MBS as L2
44Sources: SIFMA, UK DMO, Dundesbank, Japan MOF, ECBC.

29
assets, which are limited to 40% of L1 assets, and the “at least” 15% haircut applied to all L2 assets,including agency MBS. Banks replacing agency MBS with U.S. Treasuries would significantly impair theU.S. mortgage market at a point when rapid recovery is needed in this vital area.
D. Perverse Prudential Implications of the Asymmetric Treatment of Financial InstitutionLiquidity Facilities
The LCR imposes an asymmetric treatment between lenders and borrowers of credit lines. All lines ofcredit to financial institutions (both credit commitments and liquidity commitments) are assumed to be100% drawn for purposes of calculating net cash outflows, while all lines of credit from financialinstitutions are assumed to be unavailable for purposes of calculating net cash inflows during the LCR’s30-day stress scenario. The rule assumes that “other banks may not be in a position to honor creditlines, or may decide to incur the legal and reputational risk involved in not honoring the commitment.”45
But the point of the LCR is to ensure that banks are in a position to honor credit lines. If Bank A has aliquidity facility with Bank B, and both banks are subject to the LCR rules, then Bank B will have pre-funded the liquidity facility. Yet the rules do not allow Bank A to include the potential inflow fromdrawing on Bank B.
Even in a severe downturn, the expected availability of credit lines will almost always be greater thanzero and utilization is extremely unlikely to be 100%. During the financial crisis, the total draw on linesof credit by financial institutions was less than 10% of the available outstanding lines. In the view of TheClearing House, these factors should include, among others, an assessment of the contractual clauses inthe lines of credit, the jurisdiction-specific consequences of failing to honor such lines of credit andhistorical data regarding the availability of such commitments in periods of financial distress.
In addition, in computing the LCR as proposed, a financial institution would have to assume that allinter-company unfunded credit lines to all affiliates of the institution will be fully drawn whileasymmetrically assuming no corresponding inflows to the receiving affiliate. This asymmetric treatment,when applied to intra-group liquidity inflows and outflows, could disincentivize groups from maintainingthe types of group liquidity management arrangements that can greatly strengthen the resilience of anentity or the group to external shocks.
The consequence of this rule is that banks will dramatically reduce liquidity lines to other banks becausethe LCR’s required assumption that they are 100% drawn does not reasonably reflect real liquidity riskand imposes significant cost (especially in light of the incorrect treatment of L1 and L2 assetsaddressed). This is truly a perverse result, as of course liquidity lines provide tremendous support tostressed financial institutions and, thus, are essential shock-absorbers. Even absent stress, theseliquidity lines are vital, as they make it possible for receiving banks to maintain reasonable funding levelssecure in the knowledge that liquidity is only a call away if market conditions vary or unanticipatedopportunities arise. Regulators are rightly concerned about “interconnectedness” – that is, the risk thatintra-industry exposures can lead to reverberations of market stress that undermine otherwise soundfinancial institutions. However, this interconnectedness is being addressed in numerous venues (e.g.,the significant change in regulatory capital imposed elsewhere in the Basel III rules for credit exposuresto larger financial institutions and pending large-exposure limits). A sound liquidity framework requires
45BCBS, Basel III liquidity framework, supra note 2, at ¶ 111.

30
that bank lines of credit to others be appropriately funded, but the LCR’s assumptions are punitive andunnecessary in light of recent, catastrophic-risk experience.
31
V. ENHANCED PRACTICES FOR LIQUIDITY-RISK MANAGEMENT
A. Introduction
Prescriptive arithmetic liquidity ratios, even if perfectly calibrated and internationally consistent, takenalone are not a sufficient response to the need for more robust liquidity risk management. Formulaicratios are just one tool and, inevitably, have deficiencies. In response to the financial crisis, U.S. banks,with the assistance of their regulators, have made substantial progress in enhancing their liquidity riskmanagement practices. Enhanced practices at these firms are rooted in forward-looking stressscenarios, disciplined corporate governance and comprehensive risk gradation of how a bank’s variousbalance-sheet instruments will behave under stress. This section presents a composite description ofwhat our member banks believe is the current approach to liquidity-risk management at larger (roughly$50 billion in assets or greater) banking organizations in the U.S.46
U.S. regulators played an important role in improving industry practices by establishing new policies onliquidity risk and by stepping up scrutiny of practices firm-by-firm. All of these changes have significantlyenhanced liquidity, making the calibrations of the current rules still more quixotic given the increase(discussed in Section I) – not reduction as one would expect – in the liquidity shortfall uncovered in theanalysis of QIS data from 2009 to 2010.
B. Recent Developments in Liquidity-Risk Management in the U.S.
Liquidity-risk management in the U.S. has evolved rapidly since the crisis. Financial institutions thatsurvived the disruptions in the financial markets in 2007-2009 had to adjust their practices and risktolerances to account for actual experiences that exceeded their prior worst case expectations. U.S.regulators also responded by issuing new regulations described in Section C of Appendix 2 and byincreasing their focus on liquidity-risk management practices on a firm-by-firm basis.
1. Lessons Learned by Financial Institutions
Prior to the crisis, with the exception of a few larger institutions that actively used scenario analysis,most financial institutions relied on backward-looking balance-sheet liquidity metrics, such as liquidassets as a percentage of total assets, or static ones that track current funding spreads. It was generallyassumed that a majority of a bank’s assets could provide reliable liquidity through asset-basedborrowing and securitization. As banks began to face illiquid markets for mortgages, commercial realestate, corporate loans, automobile and card assets, they were forced to revise their assumptions.Many banks began to do scenario analysis for the first time to assess their liquidity positions.
2. Core Principles Established by the U.S. Regulators
U.S. regulators also played an important role in guiding banks towards more conservative practices.Previously, guidance on liquidity-risk management largely took the form of guidance from examiners
46This description of enhanced practices is focused on depository institutions and therefore does not address the
specific requirements of broker/dealers or trust banks, though many of the principles described herein apply tothese types of institutions.
32
rather than explicit rules for U.S. banks. During the crisis, regulatory examiners substantially increasedtheir scrutiny of liquidity-risk management and reviewed each bank’s overall framework in-depth,focusing on longer-term stress testing, contingency funding plans (CFPs), corporate governancestructure and organizational obstacles to enhanced practices. The issuance of proposed regulatoryguidance in 2009,47 finalized in 2010 as an Interagency Final Policy Statement on Funding and LiquidityRisk Management,48 was a significant milestone, building on the Basel Principles of 2008.49
However, the U.S. did not stop with the 2010 interagency statement. In June 2011, the agenciespublished Proposed Guidance on Stress Testing for Banking Organizations with More than $10 Billion inTotal Consolidated Assets that establishes core principles to meet stress scenarios for both capital andliquidity.50 This guidance codifies the advice regulators had been providing banks for several years – thatstress testing is an important risk management practice that supports forward-looking assessment ofrisk. This is not yet reflected in the Basel III rules. Further, the Federal Reserve has mandated severalstringent stress tests for the nineteen largest banking organizations, most notably the ComprehensiveCapital Analysis and Review (CCAR) stress tests in early 201151 that incorporate aspects of liquidity riskto forward-looking capital planning. The Federal Reserve has now proposed far more stringent capital-plan standards52 that more directly link capital and liquidity stress-testing and forward-looking analysis,again going well beyond the Basel III standards.
C. Current Enhanced practices
In general, emerging enhanced practices at larger financial institutions integrate liquidity-riskmanagement within overall strategic planning. Liquidity-risk management is recognized as an importantrisk management function that requires dedicated resources and oversight consistent with other riskareas such as credit risk, operational risk and market risk. In addition, acknowledgement of the interplaybetween credit, market, operational, and liquidity risks during the crisis has promoted strongeralignment and understanding across the risk functions and capital planning. Since liquidity risk is oftenthe after-effect of adverse credit, operational or market events, an enterprise-wide approach to capitaland liquidity stress testing is taken, ensuring that the various risk management and capital planningfunctions consider stress scenarios in concert, with iterative feedback loops that evaluate ultimateeffects. Enhanced practices for the largest institutions have evolved towards the integration of forward-looking views of liquidity risk with the overall strategic planning for the institution. This is in sharpcontrast to the “silo” approach taken in Basel III, where capital, liquidity, operational and market risksare addressed as if there were no interactions among them.
47Proposed Guidance on Funding, infra note 100.
48Final Policy Statement, infra note 101.
49 BCBS, Principles, infra note 87.
50Proposed Guidance on Stress Testing, infra note 102.
51Federal Reserve System, Comprehensive Capital Analysis and Review: Objectives and Overview (Mar. 18, 2011),
available at http://www.federalreserve.gov/newsevents/press/bcreg/bcreg20110318a1.pdf.
52FRB, Capital Plans, infra note 103.
33
Financial institutions should focus on both short-term liquidity and longer-term ‘structural’ liquidityensuring that institutions fund long-term illiquid assets with long-term liabilities. Each requires its ownframework and analysis, and is best communicated with metrics specific to the horizon. The objective ofshort-term liquidity is to ensure that there is an adequate liquidity buffer to address unexpected adversedevelopments over a short time period in which mitigating actions are not feasible. The objective ofstrategic liquidity analysis is to identify vulnerabilities in the institution’s balance sheet or businessmodel that may only manifest themselves over the course of months or years. When suchvulnerabilities are identified, the firm can take proactive, deliberate steps to either remove them or toensure that they are mitigated. The two approaches work in a complementary fashion.
1. Short-Term Liquidity
a. Typically U.S. institutions utilize overnight and other short-term horizons, suchas seven days out to 30 days, to establish short-term liquidity buffers using quantitative metrics similarto the LCR. Recognizing that, in the short-term, the firm is less able to react to a substantial unexpectedfunding gap due to an operational error or sudden stress, these buffers incorporate a high degree ofconservatism. Only highly reliable sources of liquidity are included in the buffer such as cash and asset-based funding sources that can be tapped readily with reliable counterparties (e.g., FHLB and repocounterparties).
b. As also noted in Section V.D below, the judgments that firms make indeveloping their internal liquidity metrics are complex and take into account firm-specific conditions,such as their current and potential financial position and standing in various markets. In contrast, theLCR and NSFR are formulaic and while useful as broad, standardized measures, firms, with supervisoryreview, are better able to evaluate the liquidity of their assets, liabilities and OBS items based on theirclient capacity, market participation, operational capability and current and potential financialcondition.
c. Additional stress may be incorporated through adoption of formal scenarios,similar to those used in the longer-term strategic framework, focused on specific factors over a shortersurvival horizon. Alternatively, the sources of liquidity can be increasingly restricted and/or haircutaccording to a pre-established schedule of escalating stress stages. In either methodology,measurement of liquidity buffers takes into account the diminished liquidity value of liquid assets due toidiosyncratic as well as market liquidity and funding liquidity developments.
2. Longer-Term Strategic Liquidity
a. Financial institutions conduct multiple stress scenarios over time horizons ofone year or longer (survival horizons) that address the vulnerabilities of the institution. Suchvulnerabilities may include over-reliance on certain funding sources, loan/investment portfolios thatexhibit high credit risk or unreliable market liquidity, considerable off-balance sheet (OBS) commitmentsthat would generate cash outflows in times of stress, and/or a business model that requires a minimumrating. The scenarios contemplate institution-specific events, systemic market disruptions and acombination of the two.
b. The development of stress scenarios is an iterative process whereby executivemanagement and the board are actively engaged in the discussion of which scenario or scenarios

34
express the risk tolerance of the firm. The level of risk tolerance determines the severity of the scenarioand, in turn, the results of the stress scenarios help management articulate both its risk tolerance andmanagement of that risk. Once the level of risk tolerance is established, that stress scenario or set ofscenarios that reflect management’s risk tolerance are used to establish minimum liquidity buffers thatare to be maintained throughout the designated survival period.
c. These liquidity buffers may take the form of minimum projected liquid assetsthat remain after all forecasted cash outflows in the scenario or a ratio of liquid assets as a proportion ofsuch forecasted outflows.
d. Stress scenarios help optimize the mix of balance sheet liquidity and structuralliquidity. Balance sheet liquidity, or highly liquid assets that can be readily converted to cash in stress,can be reduced to the extent that projected cash outflows in times of stress can be reduced. Projectedoutflows may be reduced by adding structural liquidity, or term funding that has no potential for earlywithdrawal under any circumstances. Just as credit risk management can minimize reserves for creditlosses by maintaining a high quality loan portfolio, liquidity-risk management can minimize liquid assetholdings by maintaining a highly reliable liability portfolio through sufficient structural liquidity. Theoptimal mix of balance sheet and structural liquidity will depend upon a number of factors including therelative costs of each. Generally an overall targeted amount of structural liquidity is established giventhe institution’s unique balance sheet structure. For example, many firms utilize a cash capital orworking capital ratio, which is similar in nature to the NSFR, whereby structural liquidity is sized to coverthe firm’s least liquid assets.
e. Stress scenarios also inform contingency funding planning. Through stresstesting, the reliability of the institution’s deposits, wholesale funding sources and contingent assets areanalyzed. Each of these will contribute to cash outflows during times of stress, though not always forthe same reasons. CFPs describe the framework for managing adverse liquidity events and are a keycomponent of the firm’s stress tests. The CFP prescribes roles and responsibilities, management actionsfor various levels of stress, and identifies alternative contingent sources of liquidity to ensure that thefirm may continue to fund normal operating requirements. Enhanced practices also dictate that riskcapacity, as derived from stress test results, is linked with a firm’s liquidity position as calculated on adaily basis.
f. Stress testing, limits on liquidity mismatches, and contingency funding planningare dynamic. As macroeconomic, market, and institution-specific conditions change, stress scenarios,liquidity mismatch limits, and CFPs are adjusted to ensure that they are relevant in light of currentconditions.
35
D. Classification of Liquidity Risk and Benefits
A critical aspect of liquidity-risk management that underpins stress testing is the identification andclassification of balance sheet instruments and QBS with respect to their liquidity risk characteristics,specifically how the various instruments will behave in stress conditions. Run-off factors for liabilities,draw-down factors for contingent assets and liquidity values for liquid assets are analyzed and assignedfor each scenario.
Just as credit risk managers classify loans for ultimate sizing of reserves for credit losses and capital,liquidity risk managers grade assets, liabilities and OBS items to determine both the appropriate amountof high-quality liquid assets to maintain and the likely “time to liquidity”. However, unlike existingframeworks for measuring credit risk (accounting standards under U.S. GAAP or IFRS, and regulatoryapproaches under the Basel Committee’s capital frameworks), there is no standardized approach forliquidity risk classification. Liquidity risk managers apply a judgmental approach, taking intoconsideration industry data that demonstrate behavior in past crises, as well as input from subjectmatter experts in the lines of business. In current practice, regulatory examiners review management’sstress scenario assumptions to ensure that they are well thought out and are reasonable.
Liquid assets are carefully monitored to ensure that ongoing developments, both institution-specific andmacroeconomic, are captured in estimating the liquidity value of liquid assets in stress conditions.Alignment and strong communication with colleagues managing market risk and credit risk, as well asfront-line colleagues dealing directly with the financial markets, clients and operational considerationswith respect to the firm’s investment and wholesale funding portfolios, are critical to ensure thatliquidity risk managers have relevant information about liquidity value and timing. Assumptions aboutliquidity values and time to liquidity in stress conditions are made based on risk gradation of the variousasset types, and these assumptions are reviewed on a regular basis.
The importance of risk and benefit classification cannot be emphasized enough. Analogous to capitalallocation to cover credit and market risks through classification of appropriate risk-weighting of assetsunder Basel II, a bank’s assets, liabilities and OBS items must also be “risk-weighted”. There are manycomplicated factors to consider such as how the various liabilities and contingent assets operate inapplicable markets and the particulars of the product features.
E. Incorporation of Liquidity Risk in Funds Transfer Pricing
The risk classification described above is used to allocate costs and benefits of liquidity to business linesto ensure alignment of their risk-taking incentives with the liquidity risk exposure their activities createfor the institution as a whole. In addition to the normal operating costs and benefits of liquidity in afirm’s funds transfer pricing (FTP) program, financial institutions also assess the costs of contingentliquidity that must be reserved for products that give rise to increased liquidity needs during times ofstress, when new funding is unlikely to be available. These institutions incorporate liquidity costs,benefits and risks in internal product pricing, performance measurement and the new product approvalprocess for all material activities.

36
F. Conclusion
The Clearing House supports banks’ and regulators’ endeavors to develop a comprehensive liquidity riskmonitoring framework that incorporates a standardized, properly calibrated quantitative approach tomeasuring liquidity risk. Metrics that capture an institution’s liquidity position in a forward-lookingstress scenario are unarguably the most meaningful and reflect enhanced practices at larger banks and,over time, the LCR and NSFR could serve as two quantitative metrics for liquidity risk to be incorporatedas standardized measures that would be part of the overall liquidity risk management framework.However, we believe that these two measures should supplement, not supplant, internal measures ofrisk, and should be evaluated alongside the internal measures when evaluating the overall liquidityposition of the firm. At the core of liquidity stress scenarios lies a liquidity risk/benefit classificationscheme that predicts the behavior of an institution’s liabilities and contingent assets under stress, aswell as the liquidity value of its liquid assets under stress. Assessing the liquidity value of liquid assets isthe easier of the two given that there is a limited set of liquid asset types that can be considered reliablein times of stress. U.S. financial institutions and regulators must work together to establish acomprehensive liquidity risk monitoring framework which ensures that risk classification of liabilities andcontingent assets are appropriately calibrated and synchronized across firms before a standardizedmetric can be established.
37
VI. OTHER QUALITATIVE CONSIDERATIONS
A. Role of Government Liquidity Facilities During the Financial Crisis
As discussed in Section II and demonstrated in the Liquidity Study, the Basel liquidity rules employ run-off factors that fail to reflect actual experience of U.S. banks during the financial crisis. In contrast, thecalibrations in the Liquidity Study, described in this paper, are derived from data received from TheClearing House member banks that reflect actual worst-case/worst-period experience generally inadvance of the establishment of government liquidity support facilities deployed during the crisis.
Regulators have asked whether it is possible to filter out the impact of U.S. government supportprograms -- or more broadly the perception that the U.S. government may provide support – from theworst case/worst period analysis of calibrations reflected in The Clearing House Liquidity White Paper.The question is a good one, and it is very difficult to completely remove government support – actual orpotential – from this type of analysis. However, comparison of the timing of U.S. government supportprograms during the financial crisis and the experience of several banks that failed during the crisisbefore most government support programs were in place provides a partial answer. Moreover,calibrating the LCR to a standard that truly eliminates all governmental support – again, actual orpotential – tends toward the “no bank ever fails due to liquidity risk” goal discussed in the introductoryparagraphs of Section II. We believe such a goal is impractical.
As shown in the Liquidity Study, government liquidity support from the Federal Reserve Board, Treasuryand FDIC reached its peak in December of 2008 at nearly $1.2 trillion of net liquidity. However, it isimportant to recognize that these facilities were not all established in a single instance. Many of thesefacilities were intermittently deployed between the fourth quarter of 2007 and the fourth quarter of2008 as the full extent of the crisis became apparent. Further, many of the emergency liquidity facilitieswere used to support non-banking organizations (e.g., money-market funds) and/or financial institutions(investment banks, foreign institutions) not included in this study. Thus, the actual existence of massivegovernment liquidity-support programs – which of course were put in place in the crisis – does notsupport a simple conclusion that bank calibrations in this study are far less severe than those in theBasel III standard solely due to use of emergency-support programs.
The Liquidity Study, in contrast to the assumptions incorporated in the Basel rules, presents calibrationdata that reflects actual worst-case/worst-period scenarios, though perhaps not the worst case possible,for two U.S. banks that failed during the financial crisis: Wachovia Bank and Washington Mutual.Importantly, Wachovia and Washington Mutual failed and were acquired by other banks on October 3,2008 and September 25, 2008, respectively, before the majority of government liquidity facilities hadbeen established. Indeed, on October 3, 2008, when Wachovia Bank was sold to Wells Fargo, the onlygovernment liquidity facility directed towards banks then in operation was the Term Auction Facility(TAF), which was established by the Federal Reserve Board on December 12, 2007. While Wachovia andWashington Mutual both made use of this facility, they collectively accessed only $20 billion before theireventual sales. Therefore, calibrations derived from these two institutions can serve as appropriatebenchmarks for stress in the absence of government support. Initial conclusions that can be drawn fromthese acquired institutions demonstrate that:
38
The worst 30-day run-off for retail deposits at insured depositories was in-line with the LCR, butuninsured deposits experienced a significantly more severe run-off factor.
The worst run-offs in demand deposit accounts and negotiable order of withdrawal accountswere less severe than the LCR factor for operational wholesale deposit accounts, and run-offs inmoney market demand accounts and non-core deposits was less severe than the non-operational account factor.
B. Conflicting Capital and Liquidity Regulation
A key prudential concern is the manner in which the LCR works in tandem with the capital requirementsapplicable to large U.S. banks. Even if the Basel III capital and liquidity rules were wholly justified asfinalized, the two standards intersect to result in unintended and adverse consequences.
First, the Basel III rules require capital adjustments based on unrealized gains and losses, increasingearnings and capital volatility related to holdings of obligations marked to market under applicableaccounting standards. This creates an incentive for some banks to move away from fixed-income andother assets favored under the liquidity rules even though these assets may pose little long-term creditrisk – the reason they are selected for favorable treatment in the liquidity rules. While the fixed-incomeassets favored in the liquidity rules are generally granted favorable risk-based capital treatment, U.S.banks are under significant pressure to increase capital against these risk weightings which affects theirability to hold all assets and may even create incentives to hold higher-risk ones. Further, the U.S. is theonly nation with a leverage capital requirement that forces significant amounts of capital to be heldeven against assets such as U.S. Treasury obligations that are granted a zero under the risk-weightingscheme. Pressures here are clearly evident, as recent market events have led to unprecedentedamounts of these holdings and further leverage-related capital stress.
Second, the LCR forces U.S. banks to shift out of certain asset classes – e.g., holdings of agency MBS anddebentures – to U.S. Treasuries and other sovereign debt. This will have a significant and adverseimpact on the U.S. mortgage market, but it also has a surprising impact on the structure of the U.S.banking industry: it will force big U.S. banks to grow their balance sheets even larger so that they canhold enough capital to offset the cost of the LCR’s forced asset shift. However, deposit products presenttheir own risks – e.g., interest-rate mismatches. Thus, to be prudent, a bank will need to “gross-up” itsbalance sheet with hedging instruments to match its liability profile, essentially ballooning its balancesheet for non-business reasons created by an ill-designed liquidity measure that forces uneconomicliability strategies that, in turn, require new hedging strategies for continued safe-and-sound operation.
C. Research Assessment
Since the onset of the financial crisis, there has been a relative dearth of research focused on theassumptions on which the Basel III liquidity framework’s rules are based and macroprudential andmacroeconomic effects of enhanced liquidity-risk standards as compared to the attention accordedcapital requirements. And the limited research published to date is inconclusive. Academic andregulatory research discussed further below makes clear that even the Basel Committee and its parentorganization, the Bank for International Settlements (BIS), have significant qualms about theassumptions on which these rules are premised. The International Monetary Fund (IMF) has sounded aclear, cautionary note, stating that “[P]olicymakers will need to be conscious of the interactive effects of
39
multiple approaches to mitigate systemic risks. Capital surcharges or other tools to control systemicsolvency risk could help mitigate systemic liquidity risk.”53 The Clearing House does not support a capitalsurcharge and has elsewhere conducted extensive research on it to demonstrate its adverseimplications,54 but these problematic results are compounded when a surcharge is imposed in tandemwith a new, costly liquidity requirement that is implemented at the same time numerous other newrules are being put in place with unknown implications when all are taken into full account. Even theChairman of the Federal Reserve Board, Ben Bernanke, has noted that the total cost of all of these rulesis still unknown to the regulators.55
1. Concerns with a Bank-Centric Approach
As the IMF paper cited above addresses, the current approach to governing liquidity risk is bank-centric.56 As a result, it may encourage a transfer of liquidity risk from regulated banks to unregulated,or less regulated, “shadow” organizations, doing little thereby to prevent future financial crises. The FSBhas begun to consider how various bank-centric rules may encourage the transfer of financial activitiesfrom regulated providers of credit intermediation (e.g., traditional banking) to shadow firms,57 but hastaken no concrete action yet to address this major risk. It is vital that the liquidity rules, like all theothers now being demanded of banking organizations, be carefully calibrated to prevent risk migrationoutside of regulated institutions and from nations with meaningful regulatory regimes to “haven” states.
2. Studies Evaluating the LCR’s and NSFR’s Impact Are Inconclusive
The studies that have sought to evaluate the impact of the LCR and NSFR have been inconclusive at best.As many of the studies have noted, accurately measuring liquidity data and modelling challenges makethe pending standards particularly difficult to analyze.58 For example, two BCBS reports published in
53 Jeanne Gobat et al., International Monetary Fund: How to Address the Systemic Part of Liquidity Risk: GlobalFinancial Stability Report (April 2011), available athttp://www.imf.org/external/pubs/ft/gfsr/2011/01/pdf/press2.pdf.
54Letter from The Clearing House to Timothy Geithner, Secretary, U.S. Department of Treasury, Ben Bernanke,
Chairman, Board of Governors of the Federal Reserve System, Sheila Bair, Chairman, FDIC, and John Walsh, ActingComptroller of the Currency, OCC (June 15, 2011) available athttp://www.theclearinghouse.org/index.html?f=072373.
55Chairman Bernanke, Remarks at a Question and Answer Session Following Chairman Bernanke’s Speech on the
U.S. Economic Outlook (June 7, 2011) (transcript available at http://video.cnbc.com/gallery/?video=3000026289)(stating: “Has anybody done a comprehensive analysis of the impact on credit? I can’t pretend that anybody reallyhas. It’s just too complicated. We don’t really have the quantitative tools to do that.”).
56Gobat, supra note 54.
57 Financial Stability Board, Shadow Banking: Scoping the Issues, (Apr. 12, 2011), available athttp://www.financialstabilityboard.org/publications/r_110412a.pdf.
58BCBS, An Assessment of the Long-Term Economic Impact of Stronger Capital and Liquidity Requirements (Aug. 18,
2010) at 14, available at http://www.bis.org/publ/bcbs173.pdf.
40
August 2010 assess the transition to the LCR and NSFR59 and the long-term economic impact of thesestandards.60 Both studies acknowledge that a number of assumptions need to be made in order tomodel the effects of the liquidity rules, noting further that these assumptions are subject to debate. Anassessment of the status of recent research, focusing principally on these BCBS and related studies, ishelpful to understanding the quantitative and qualitative analytics presented elsewhere in this whitepaper.
The BCBS study on long-term effects does not advocate particular calibration levels, but it does estimatethat, in order for banks to meet the NSFR, lending spreads will increase by fourteen basis points aftersynergies with increased capital requirements are taken into account.61 While the report suggests thereare net economic benefits for enhancing capital and liquidity requirements, it concedes that, inmeasuring the impact of liquidity, “there is a range of uncertainty around estimates of centraltendencies, reflecting data limitations and the need for various modeling assumptions.”62 Indeed, thereport does not specifically evaluate the LCR because “based on the information available…it was onlypossible to model the December 2009 proposal for the NSFR, albeit imperfectly.”63
Similarly, the BCBS study on the transition phase to enhanced prudential standards states that “a 25%increase in liquid asset holdings is estimated to lower GDP by a maximum of 0.13% of GDP” butconcedes that many of the models used to arrive at this number were more “uncertain about theseresults than those for capital, noting that the statistical relationship between liquidity ratios and lendingspreads tended to be weak. Given data limitations, not all member nations were able to model thepotential impact of the NSFR.”64
Similarly problematic, a BIS working paper offers a map for bank compliance with the NSFR andestimates the corresponding increase in lending spreads to be twelve basis points after accounting forthe fall in risk-weighted assets due to capital synergies, but the methodology is admittedly “based on aseries of assumptions” and the “estimates are sensitive to changes in the balance sheet structure.”65
The results of a more recent study performed by the BIS Monetary and Economic Department were inline with these BCBS findings.66 Using a number of widely accepted macroeconometric models to
59BCBS, Assessing the Macroeconomic Impact of the Transition to Stronger Capital and Liquidity Requirements –
Interim Report (Aug. 18, 2010), available at http://www.bis.org/publ/othp10.pdf.
60BCBS, Long-Term Economic Impact, supra note 59.
61Id. at 24.
62Id. at 31.
63Id. at 23.
64BCBS, Macroeconomic Impact, supra note 60, at 18.
65 BIS, Working Paper No. 324: Mapping Capital and Liquidity Requirements to Bank Lending Spreads (Nov. 2010) at27-28, available at http://www.bis.org/publ/work324.pdf.
66P. Angelini et al., BIS Working Paper No. 338, BASEL III: Long-Term Impact on Economic Performance and
Fluctuations (Feb. 2011), available at http://www.bis.org/publ/work338.pdf.
41
analyze the impact of various combinations of higher capital ratios and liquidity targets on long-termeconomic performance, this paper found that a 25% increase in the liquidity ratio (as defined in thesemodels) results in an eight basis point reduction in baseline output projections, and a 50% increaseresults in a fifteen basis point reduction.67 In addition to economic performance, this study alsoexamined the long-term effect of higher liquidity requirements on economic fluctuations and found thata 25% increase in the liquidity ratio results in a 1% reduction in the standard deviation of output.68
While the results of this study were, in the opinion of the authors, consistent with those of the BCBSfindings presented above, they acknowledge limitations of the approach that introduce uncertainty totheir conclusions. Specifically, the study acknowledges that current macroeconometric models are notwell suited to forecasting the impact of the Basel III liquidity standards because they either do notaccount for bank liquidity entirely or they rely upon “very simple [liquidity] definitions (e.g. [sic] the ratioof cash and government bonds to total assets), quite distant from the complex measures introduced bythe new rules.”69 In addition, the study points out that data gaps and modelling uncertainty did notallow for an account of national heterogeneities.70
While BIS economists have been unable to confidently quantify the impact of the liquidity rules, theBCBS has prescribed these rules using assumptions of uncertain validity. For example, the Basel IIIliquidity rules evidence a strong preference for banks to use sovereign securities to meet the LCRrequirements. The underlying rationale for this preference would seem to be that sovereign securitiesthat meet certain liquidity benchmarks may be just as good as cash during a stress scenario.71 Thesupport for this argument is questionable and discounted by a new supervisory study andrecommendations on sovereign credit risk published by the BIS Committee on the Global FinancialSystem (CGFS).72 This paper demonstrates that downgrades in sovereign credit reduce the ability ofbanks to cost-effectively access important funding channels such as the market for wholesale funds.73
The CGFS notes that the advanced economies, specifically the U.S. and EU members, may be entering aperiod of heightened sovereign risk due to the extraordinary measures undertaken by these countriesduring the financial crisis and their ongoing fiscal struggles with debt and rising government obligationcosts.74 While the Basel III liquidity rules are not specifically mentioned in this paper, the CGFS doesconclude that the financial crisis has shown that sovereign debt may not be liquid or riskless in all
67Id. at 20.
68Id.
69 Id. at 5.
70Id. at 1.
71BCBS, Basel III liquidity framework, supra note 2, at ¶¶ 38-40.
72BIS, The Impact of Sovereign Credit Risk on Bank Funding Conditions (July 11, 2011), available at
http://www.bis.org/publ/cgfs43.pdf.
73Id. at 1.
74 Id.

42
instances, and it advises national authorities to proceed with caution when implementing policies whichincentivize banks to hold large amounts of government securities.75
3. Only One Study Attempts to Assess the Basel III Liquidity Framework’s Impact on theBanking Industry Per Se
Only one final study to date attempts to assess the impact of the liquidity rules on the banking industryper se, though the authors to our knowledge conduct this examination in combination with the newcapital rules. In a recent paper, Bill Allen et al. conclude that Basel III will force banks to change theircurrent business model from one of asset-driven liability management, which is predicated on easyaccess to the short-term wholesale markets, to one of asset management, where asset volumes areconstrained by the availability of long-term funding.76 Otherwise stated, bank balance sheet size will belimited by the ability to attract funding and not the ability to find assets.77 According to the authors, thisconstraint will inevitably result in higher lending rates to compensate banks for the increase in theirfunding costs.78 However, this paper finds that “in the long run (once there is a full adjustment) thecosts of credit to most bank borrowers will be only moderately affected …,”79 citing as an examplecorporate loan portfolio increases of no more than 60 basis points.80 The authors support thisconclusion by asserting that policymakers will adjust fiscal and monetary policies to mitigate the impactof the Basel III rules on bank lending rates.81 In addition, the authors argue that banks will absorb somemeasure of the Basel III costs through efficiency gains and cost reductions rather than pass along the fullcost impact to their customers.82 This positive result is, however, tempered by a more negativeassessment in this study of the rules’ effects at the riskier end of the credit spectrum. There, high creditrisk borrowers such as small businesses will bear the brunt of the rules’ impact as Basel III punishes bankassets with higher risk weightings or those more likely to be impaired during a major economicdownturn.83 This is a significant factor since these companies often do not have access to fundingthrough capital markets. The resultant tightening of credit at this end of the spectrum could, therefore,move these “borrowers to more expensive forms of credit (or den[y] them credit altogether).”84 The
75Id. at 2.
76Bill Allen et al., Basel III: is the cure worse than the disease? (Sept. 2010) at 3, available at
http://papers.ssrn.com/sol3/papers.cfm?abstract_id=1688594.
77Id. at 4.
78Id. at 13.
79Id. at 4.
80Id. at 26.
81 Id. at 13.
82Id. at 17.
83Id. at 28.
84Id. at 28 (quoting Ben Bernanke, Credit in the Macroeconomy, Federal Reserve Bank of New York Quarterly
Review (Spr. 1993) at 56).

43
authors suggest that the exclusion of these types of borrowers from the credit market may have long-term negative effects on economic output as small businesses are important engines of employmentand business innovation.85
85Id. at 29.

44
Glossary
ABS – Asset Backed SecuritiesBasel Committee or BCBS – Basel Committee on Banking SupervisionBHC – Bank Holding CompanyBIS – Bank for International SettlementsBIS CGFS – Bank for International Settlements Committee on the Global Financial SystemCBRC – China Banking Regulatory CommissionCCAR – Comprehensive Capital Analysis and ReviewCFP – Contingency Funding PlansCGFS – BIS Committee on the Global Financial SystemCMM – Constant Maturity MortgageCP – Commercial PaperCRAs – Credit Rating AgenciesCRD IV – Capital Requirements Directive IVDDAs – Demand Deposit AccountsEBA – European Banking AuthorityEC – European CommissionECB – European Central BankEU – European UnionFHLBs – Federal Home Loan BanksFHLB System – Federal Home Loan Bank SystemFI – financial institutionFI Liquidity Lines – Financial Institution Liquidity LinesFSB – Financial Stability BoardFTP – Funds Transfer PricingGAAP – Generally Accepted Accounting PrinciplesGSE – Government Sponsored EnterpriseHKMA – Hong Kong Monetary AuthorityIFRS – International Financial Reporting StandardsIMF – International Monetary FundJGBs – Japanese Government BondsL1 Assets – Level 1 AssetsL2 Assets – Level 2 AssetsLC – Letter of CreditLCR – Liquidity Coverage RatioThe Liquidity Study – the study attached as Appendix 1LTD Ratio – Loan-to-Deposit RatioMBS – Mortgage-Backed SecuritiesMcKinsey & Company, Inc. – McKinseyMMDA – Money Market Deposit AccountsMMMFs – Money Market Mutual FundsNSFR – Net Stable Funding RatioOBS Assets – Off-Balance Sheet AssetsQIS – Quantitative Impact StudyRWAs – Risk Weighted Assets

45
SBPA – Standby Bond Purchase AgreementsSeptember Clearing House Study – the study attached as Appendix 2SME – Small and Medium EnterprisesUSG – United States GovernmentVRDN – Variable Rate Demand NotesWells Fargo – Wells Fargo and Company
46
Appendix
Background
As noted in the Introduction to this white paper, the Basel III liquidity framework is the cornerstone ofthe regulatory community’s response to inadequacies in liquidity-risk management that becameapparent during the financial crisis. Liquidity risk is the risk that a bank or other entity will be caughtshort – that is, while it has the capital and other assets to meet its obligations over time, it cannot honorimmediate claims because the funds to do so are inaccessible, previously committed or simply not inplace. In this Appendix 2, we have summarized the Basel III liquidity framework and highlightedliquidity-risk regulatory developments in the United States apart from pending implementation of theBasel III standards.
A. Global Regulatory Action
The liquidity rules in Basel III reflect lessons learned during the financial crisis. Liquidity stress in thecrisis began in 2007 and, in some cases, occurred at financial institutions that, while in full compliancewith applicable capital standards or even well above Basel II requirements, still experienced acute stressor even failed. Markets evaluated the capital position of firms in real time and assessed the amount andcomposition of capital. As a result, the evaluation of a firm’s viability may have differed from thedefinition of solvency in the regulatory capital rules and in certain instances resulted in denial of marketfunding. Because markets before the crisis were in boom mode, institutions (especially non-banks likeLehman Brothers) were easily able to obtain funding and often sought to maximize returns by moving toshorter-term instruments that cost less even though the assets being funded had considerably longertenors. Often, off-balance sheet (OBS) assets, especially non-contractual ones, went wholly unfundedeven though firms under pressure needed to fund these assets to honor their explicit or implicitcommitments under stress to avert still more extreme stress in what they feared would be a downwardspiral of systemic risk. When markets froze and short- and long-term funding markets evaporated,many firms were threatened because they simply could not meet their immediate obligations. Inresponse, hundreds of billions of dollars in government facilities were rapidly constructed to supportfinancial markets in turmoil due to the liquidity strains and the solvency crisis brewing as a result ofrapidly deteriorating asset quality and insufficient capital.
It is vital to note the inter-relationship between liquidity and capital regulation, as well as the impact ofthese two critical regulatory issues with another important pending reform: new resolution practices forvery large financial institutions, including cross-border ones, to ensure that they can be resolved understress and that none is too big to fail. Liquidity and capital stress reverberate in ways clearly seen duringthe financial crisis that could likely have been handled at the time had effective resolution protocolsbeen in place in concert with improved capital and liquidity resilience. For example, when firmsscramble to meet claims from counterparties for which they lack ready funds, they will often seek to sellassets to raise these funds. Doing so under stress market conditions creates “fire sales” – that is,downward spirals of market prices as investors seek to unload assets before prices drop still farther asmore panicky sellers seek to do the same. Downward asset pricing creates “cliff effects,” situations inwhich a single action like stress on one systemic institution leads to dramatic reductions in assetvaluations that, in turn, undermine capital adequacy, precipitating another round of market andregulatory actions that exacerbate stress and provoke still more systemic risk. The absence of proven
47
orderly-resolution protocols for systemic institutions during the crisis made the drop off these cliffs stillmore pronounced and quick because investors feared unbridled market chaos as even the soundestsystemic firms struggled to handle the catastrophic stress of a financial market seemingly in free-fall.
To address the liquidity-risk issues experienced during the crisis, the final Basel III liquidity standardswere issued in December 2010 following principles-based global guidance in this area in 200886 and aproposal for a more prescriptive set of quantitative requirements released in 2009.87 The final standardsbuild on the earlier requirements, but go well beyond them by stipulating two minimum quantitativerequirements: a liquidity coverage ratio (LCR) and a net stable funding ratio (NSFR), along withnumerous supplementary requirements.
When the Basel Committee released the final standards, the United States, through the regulators thatsit on the Basel Committee, made clear that it intended to implement the rules. National regulators do,however, have discretion not only with regard to certain aspects of these ratios, but also are able to varycertain parameters to reflect national conditions and/or to set higher minimums. As with the capitalrules, the Basel Committee plans “rigorous” evaluation to ensure that nations meet at least theminimum liquidity rules and apply them in a fair, transparent fashion. However, the complexity of thestandards and the significant scope of national discretion could still result in wide variation amongimplementing nations. Indeed, variance is already emerging, with the European Union (see SectionIII.A.) initially deciding not only to liberalize the LCR (essentially making it a goal, not a binding rule), butalso to defer implementation of the NSFR. The fate of the Basel III standards in major Asian markets isalso, at best, unclear (see Section III.B.).
The final Basel III standards are to be implemented through rules nations must finalize by year-end2012, but numerous transitions to them are provided. Bank reporting to supervisors on the LCR andNSFR is to begin on January 1, 2012, for the observation periods,88 although the degree to which this canoccur is at best uncertain given the absence of final implementing standards in the U.S. and other keynations. “Unintended consequences” will be addressed as they are identified through these transitions,based in part on findings through an observation period that was to begin in 2011 for the LCR. The LCRwill then be “introduced” on January 1, 2015, with any changes to it made by mid-2013. The NSFR,including any revisions, will move to a minimum standard by January 1, 2018, with changes to itfollowing the observation period made by mid-2016.89 However, this entire schedule is uncertain due tothe lack of final implementing rules, differing national regimes related to liquidity and, most importantly,the uncertain results of the observation periods. The degree to which banks, including those in the U.S.,will be held to the LCR and NSFR during the implementation period is also uncertain, as is the marketimpact of any reporting related to the rules as they are tested.
86BCBS, Principles for Sound Liquidity Risk Management and Supervision (Sept. 25, 2008), available at
http://www.bis.org/publ/bcbs144.pdf.
87BCBS, Consultative Document: International Framework for Liquidity Risk Measurement, Standards and
Monitoring (Dec. 17, 2009), available at http://www.bis.org/publ/bcbs165.pdf.
88BCBS, Basel III liquidity standards, supra, note 2, at 197.
89Id.
48
B. Basel III Liquidity-Risk Standards: Key Provisions
The Basel III standards are complex, imposing significant operational and supervisory challenges forcovered banking organizations and their regulators. The global rules are to apply at the parent, legalentity and branch/subsidiary level, taking into account an array of complexities (e.g., varying currenciesin which obligations are held, legal impediments to fund transfer, and operational requirements toreport liquidity under stress as quickly as daily).
1. Liquidity Coverage Ratio
This standard aims to ensure that a bank maintains a sufficient level of cash and other unencumbered,high-quality liquid assets that can be converted into cash to meet liquidity needs for a thirty calendarday time horizon under a significantly severe liquidity stress scenario specified by supervisors. The stockof liquid assets at a minimum should enable the bank to survive until Day 30 of the stress scenario, bywhich time it is assumed that appropriate corrective actions will be taken by management and/orregulators, and/or the bank can be resolved in an orderly fashion.90 The rules include numerous ways tostress-test liquidity, including mandatory consideration of stresses such as a ratings downgrade, marketvolatility, and rapid drawdown of liquidity facilities.
The standard requires that the value of the ratio be no lower than 100% (i.e., the stock of high-qualityliquid assets should at least equal total net cash outflows). Banks and supervisors are also expected tobe aware of any potential mismatches within the 30-day period and to ensure that sufficient liquidassets are available to meet any cash flow gaps.91
Critical to the LCR (as well as to the NSFR, as shall be discussed below) are the definitions underlying keyterms. In order to qualify as a “high-quality liquid asset,” assets should be liquid under stress and,ideally, be central-bank eligible. The standards detail the characteristics and operational requirementsthat meet these criteria, with liquidity judged according to the stress scenarios discussed above.92
Eligible assets are divided into Level 1 (L1) assets (which may be held without limit) and Level 2 (L2)ones, which may comprise up to 40% of the stock (taking into account the unwind of certain secured-funding transactions). National supervisors may also apply haircuts to L1 assets based on factors such asduration or risk. Ratings are among the criteria determining these levels, a provision in Basel III that willcomplicate implementation in the U.S., where the Dodd-Frank Act bars reliance on ratingsdeterminations in all federal regulation. 93 Quantitative and qualitative criteria for L2 assets are amongthe factors up for review during the observation period, along with strategies for nations with scantsupplies of otherwise eligible L2 assets.
90BCBS, Basel III liquidity standards, supra note 2, at ¶ 15.
91Id. at ¶¶ 16-19.
92Id. at ¶¶ 12-13.
93Dodd-Frank Wall Street Reform and Consumer Protection Act, Pub. L. No. 111-203, Section 939A (2010).
49
Total net cash outflows are defined as the total expected cash outflows minus the total expected cashinflows in the specified stress scenario for the subsequent thirty calendar days. Total expected cashoutflows are calculated by multiplying the outstanding balances of various categories or types ofliabilities and OBS commitments by their expected runoff or drawdown rates. Total expected cashinflows are calculated by multiplying the outstanding balances of various categories of contractualreceivables by the rates at which they are expected to flow in under the scenario up to an aggregate capof 75% of total expected cash outflows,94 with one of the most critical factors here being the expectedoutflows of deposits and other funding sources under stress (minimum rates are included in the rule). Aset of limits on other contractual inflows is also established, with a 0% inflow assumed for “operational”deposits with other financial institutions.
The rules, in one of the more stringent provisions, require banks to assume zero inflow from their ownliquidity facilities from other institutions – that is, banks are to assume that they receive no liquidityfrom third parties to handle outflow demands. Conversely, banks providing liquidity facilities are toassume that these are fully drawn down.95
2. Net Stable Funding Ratio
This standard establishes a minimum acceptable amount of stable funding based on the liquiditycharacteristics of a firm’s assets and OBS activities over a one year horizon under stress (defined for theNSFR to include a broader range of events than under the LCR). This metric is designed to act as aminimum enforcement mechanism to complement the LCR and reinforce other supervisory efforts bypromoting structural changes in banks’ liquidity-risk profiles away from short-term funding mismatchestoward more stable, longer-term funding of assets and OBS business activities. The NSFR is defined asthe ratio of the amount of available stable funding compared with the amount of required stablefunding. This ratio must be above 100%. 96
“Stable funding” is the portion of those types and amounts of equity and liability financing expected tobe reliable sources of funds under extended stress over a one year horizon. The amount of requiredfunding is a function of the liquidity characteristics of various types of assets held, OBS contingentexposures incurred and/or the activities pursued by the institution. The rule defines available stablefunds, including in this the bank’s capital, long-term liabilities, and some wholesale-funding sources.97
Different run off factors are assigned to various forms of deposit liabilities.
3. Additional Requirements – Monitoring Tools
The Basel III standards include not only these ratios, but also additional prudential requirements. Theseinclude reporting of contractual maturity mismatches, concentration reporting, reporting related to
94BCBS, Basel III liquidity standards, supra note 2, at ¶ 50.
95Id. at ¶ 111.
96Id. at ¶ 120-121.
97Id. at 122-128.
50
available unencumbered assets (which might be needed under stress), and market-risk monitoringstandards.98
C. U.S. Regulatory Action Related to Liquidity Risk
Apart from the progress of international regulators on liquidity risk, the U.S. has established its ownframework of robust standards that do not rely on the untested and questionable LCR and NSFR ratios.The U.S. began this process with an interagency proposal in 200999 that led to final liquidity-riskmanagement standards in 2010.100 This guidance was followed up in 2011 with a proposal for stilltougher stress-testing for bank holding companies (“BHCs”) with assets over $10 billion101 and an evenmore stringent proposed rule from the Federal Reserve covering BHCs with assets over $50 billion.102
Although both of these more recent proposals are in large part focused on capital, each also addressesliquidity, considering it in connection with forward-looking capital resilience and the array of other risks(e.g., operational and market risk) that may at times be even more important than capital adequacy andliquidity.
While the U.S. has tried to adopt a comprehensive rulemaking approach, the Basel III rules treat capital,liquidity, operational and market risk – the only ones covered to date with formal standards – in “silo”fashion. That is, each of these rules is freestanding and mandated as if none of the others were in placeor as if any of the other risks covered in these rules have inter-related effects that require a synopticapproach to effective enterprise-wide risk management.
Another key difference between the U.S. liquidity rules to date and the global approach is that manyU.S. liquidity-risk standards apply to all insured depositories, not just to internationally active ones(although tougher standards are reserved for the biggest BHCs). As a result, they provide greaterprotection not just to financial markets, but also to the FDIC’s Deposit Insurance Fund and broaderregulatory considerations, rightly addressing the fact that, under stress, even seemingly smallinstitutions can create systemic risk.
98Id. at ¶¶ 137-183.
99Office of the Comptroller of the Currency, Federal Reserve System, Federal Deposit Insurance Corporation,
Office of Thrift Supervision, National Credit Union Administration, Proposed Guidance on Funding and Liquidity RiskManagement, 74 Fed. Reg. 127 (July 6, 2009), available at http://edocket.access.gpo.gov/2009/pdf/E9-15800.pdf.
100Office of the Comptroller of the Currency, Federal Reserve System, Federal Deposit Insurance Corporation,
Office of Thrift Supervision, National Credit Union Administration, Final Policy Statement on Funding and LiquidityRisk Management, 75 Fed. Reg. 54 (Mar. 22, 2010), available at http://edocket.access.gpo.gov/2010/pdf/2010-6137.pdf.
101Office of the Comptroller of the Currency, Federal Reserve System, FDIC, Proposed Guidance on Stress Testing
for Banking Organizations With More Than $10 Billion in Total Consolidated Assets 76 Fed Reg. 115 (June 15,2011), available at http://www.gpo.gov/fdsys/pkg/FR-2011-06-15/pdf/2011-14777.pdf.
102Federal Reserve System, Proposed Rule to Require Large Bank Holding Companies to Submit Capital Plans to the
FRB on an Annual Basis 76 Fed Reg. 117 (June 17, 2011), available at http://www.gpo.gov/fdsys/pkg/FR-2011-06-17/pdf/2011-14831.pdf.
51
In addition, the U.S. rules incorporate a strong mandate for corporate governance, directing boards ofdirectors and senior management to take a hands-on role in this area through actions such as approvingrisk tolerances, ensuring that liquidity-risk standards meet these tolerances, validating performance andholding senior management accountable for it. The 2010 guidance incorporates in clear-binding form arecommendation from senior supervisors around the world that boards of directors set the “riskappetite,”103 requiring boards of directors to establish risk tolerances and other parameters related toliquidity risk, with senior management then charged with implementing and reporting on these board-directed limits and policies. As emphasized in an array of recent global statements, the U.S. guidancealso stipulates internal controls through independent risk management, with line management alsogiven a far greater role both in budgeting for liquidity risk (e.g., through pricing) and in being heldresponsible for compliance with board and management standards.
Finally, it is important to note that the U.S. standards do not disadvantage obligations of government-sponsored enterprises (GSEs), granting recognition of the ready market value of agency securities that isnot, as shall be discussed in more detail in Section III, appropriately reflected in the Basel III standards.
103Senior Supervisors Group (“SSG”), Observations on Developments in Risk Appetite Frameworks and IT
Infrastructure (Dec. 23, 2010), available athttp://www.newyorkfed.org/newsevents/news/banking/2010/an101223.pdf.