Embed Size (px)
Citation preview
HVTT 2012
ASSESMENT OF DUTCH LONGER AND HEAVIER VEHICLES WITH A
PERFORMANCE BASED APPROACH AND ITS APPLICABILITY TO EUROPE
K. Kural, MSc, Research
Associate at HAN
University of Applied
Sciences, PhD student at
Eindhoven University of
Technology
I.J.M. Besselink, MSc,
PhD, assistant professor at
Eindhoven University of
Technology
J.P. Pauwelussen, MSc,
MBA, PhD, Professor in
Mobility Technology at
HAN University of
Applied Sciences
H. Nijmeijer, MSc, PhD,
Professor and Chair of
Dynamics and Control
group at Eindhoven
University of Technology
Karel Kural 1)
2), Igo Besselink
2), Joop Pauwelussen
1), Henk Nijmeijer
2)
1) HAN University of Applied Sciences, Arnhem
2) Eindhoven University of Technology
PO BOX 2217, Arnhem 6802 CE, The Netherlands
Phone: +31 26 384 93 62
Fax: +31 26 384 93 85
Email: [email protected]
Abstract
The volume of goods transported as well as the number of commercial vehicles in Europe
has increased substantially over the past decade. The sixteen years old European directive on
vehicle weights and dimensions does not fully reflect on these circumstances and allows
commercial vehicles up to 18.75m of length and weight of 44t for international transport. As
the Dutch experience reveals, the legalization of longer and heavier vehicles (LHV) on
highways makes transportation of goods more efficient, sustainable and is applicable even in
highly populated regions. This paper is benchmarking the performance of all currently used
Dutch LHV combinations, two potential LHV concepts satisfying the logistic needs, and
conventional European combinations using the Australian performance based approach.
Furthermore it discusses applicability of performance based standards to Europe as an
alternative to current prescriptive legislation and shows that performance of LHV’s can differ
very much.
Keywords: High Productivity Vehicles, Performance Based Standards, Modeling, Testing
HVTT 2012
1. Introduction
After the crisis in 2009, it is evident that economic development and transport are
inextricably linked. Just as development increases transport demand so. Conversely the
availability and flexibility of transport stimulates further development by enabling trade.
However, both public and freight transport-sector CO2 emissions represent according to
nowadays estimates 23% of overall CO2 emissions from fossil fuel combustion. The freight
transport sector itself accounts for approximately 15% of the overall greenhouse gas emissions
[1]. With emissions predicted to increase by two thirds over the next thirty years any credible
and coherent future strategy must emphasize innovative thinking and cooperation across the
full range of stakeholders aimed at improving the environmental performance of the transport
sector, without compromising the mobility and access on which economic growth and
development largely depend.
The impact of emissions aside, one should also consider that the amount of transported
goods is almost directly related to the GDP (gross domestic product) of a country. In Europe,
transport of goods has grown by 30% between 1995 and 2006. From this portion about 75%
of transport was done over the inland public roads or highways [2]. In the future it is foreseen
[1] that the growth of the freight transport between years 2000 and 2020 will be 55%.
The above mentioned growth forecasts of future transport automatically imply issues like
growing emissions, increased infrastructure usage and traffic congestion, and further increase
of demands from logistic perspective.
Based on this point of view and positive experience with usage of LHV´s from Scandinavia
a research project involving co-operation of academic institutes (HAN and TU/e) and major
heavy truck industry players has started. The project is aiming at the investigation of new
commercial vehicle concepts for the years 2020+ which reduce CO2 emissions, meet the
future needs of logistics companies, are compatible with existing infrastructure and facilitate
inter-modal cross border transport within Europe (i.e. concepts will be based on existing
modules used in road-rail-water-air).
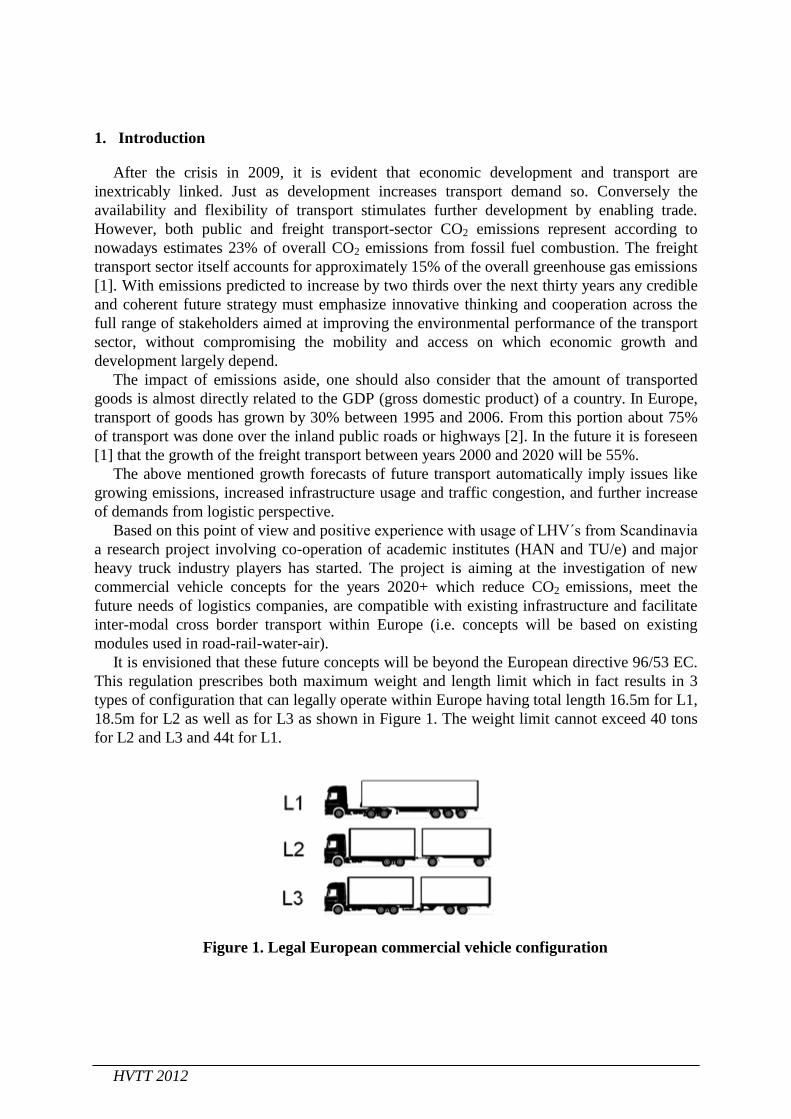
It is envisioned that these future concepts will be beyond the European directive 96/53 EC.
This regulation prescribes both maximum weight and length limit which in fact results in 3
types of configuration that can legally operate within Europe having total length 16.5m for L1,
18.5m for L2 as well as for L3 as shown in Figure 1. The weight limit cannot exceed 40 tons
for L2 and L3 and 44t for L1.
Figure 1. Legal European commercial vehicle configuration
HVTT 2012
To increase the productivity, reduce operating costs and generally investigate the
applicability of Longer and Heavier Vehicles (LHV) in highly populated European conditions,
the Dutch government has started originally a small scale experiment (involving 4 vehicles) in
December 2000 to investigate the potential of LHV’s. Over the years this experiment has
grown with 162 vehicles at the end of 2006. In 2010 the experiment ended with very positive
overall reactions from both road authorities and fleet operators. During the period from 2000-
2010 there have been only 19 road accidents, fully documented in [3], involving LHV’s. The
accidents were mainly of light character without casualties and were not caused by the LHV in
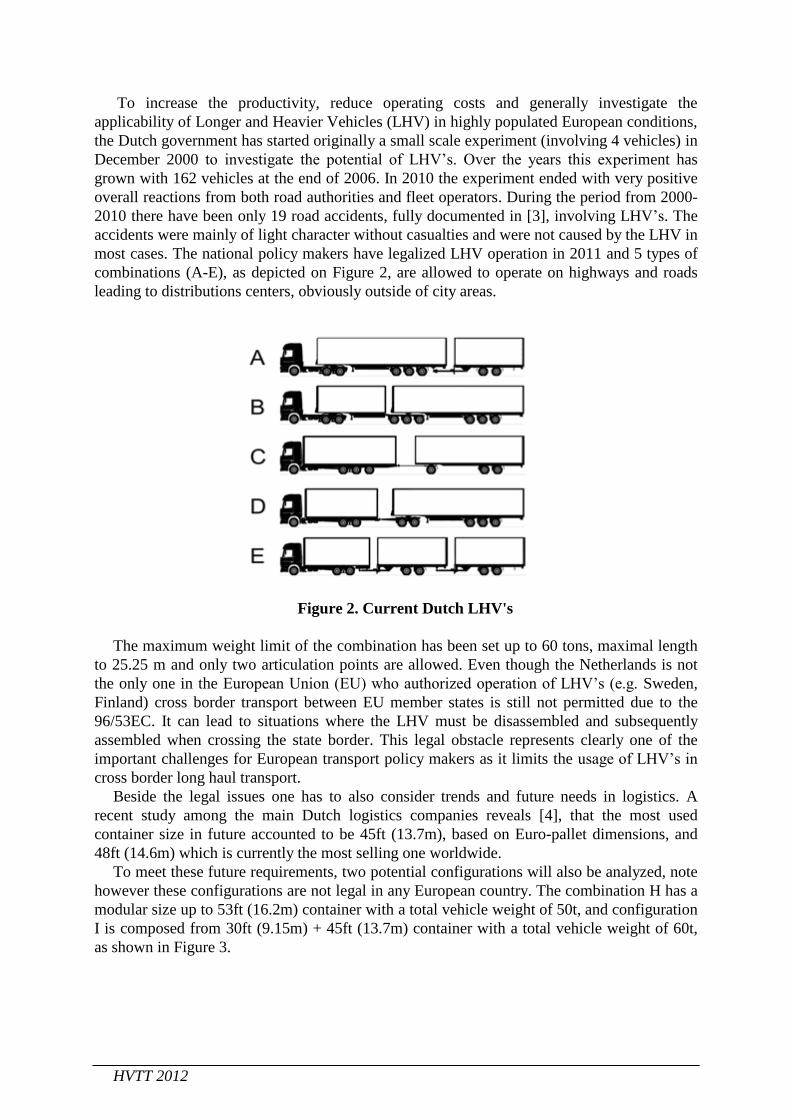
most cases. The national policy makers have legalized LHV operation in 2011 and 5 types of
combinations (A-E), as depicted on Figure 2, are allowed to operate on highways and roads
leading to distributions centers, obviously outside of city areas.
Figure 2. Current Dutch LHV's
The maximum weight limit of the combination has been set up to 60 tons, maximal length
to 25.25 m and only two articulation points are allowed. Even though the Netherlands is not
the only one in the European Union (EU) who authorized operation of LHV’s (e.g. Sweden,
Finland) cross border transport between EU member states is still not permitted due to the
96/53EC. It can lead to situations where the LHV must be disassembled and subsequently
assembled when crossing the state border. This legal obstacle represents clearly one of the
important challenges for European transport policy makers as it limits the usage of LHV’s in
cross border long haul transport.
Beside the legal issues one has to also consider trends and future needs in logistics. A
recent study among the main Dutch logistics companies reveals [4], that the most used
container size in future accounted to be 45ft (13.7m), based on Euro-pallet dimensions, and
48ft (14.6m) which is currently the most selling one worldwide.
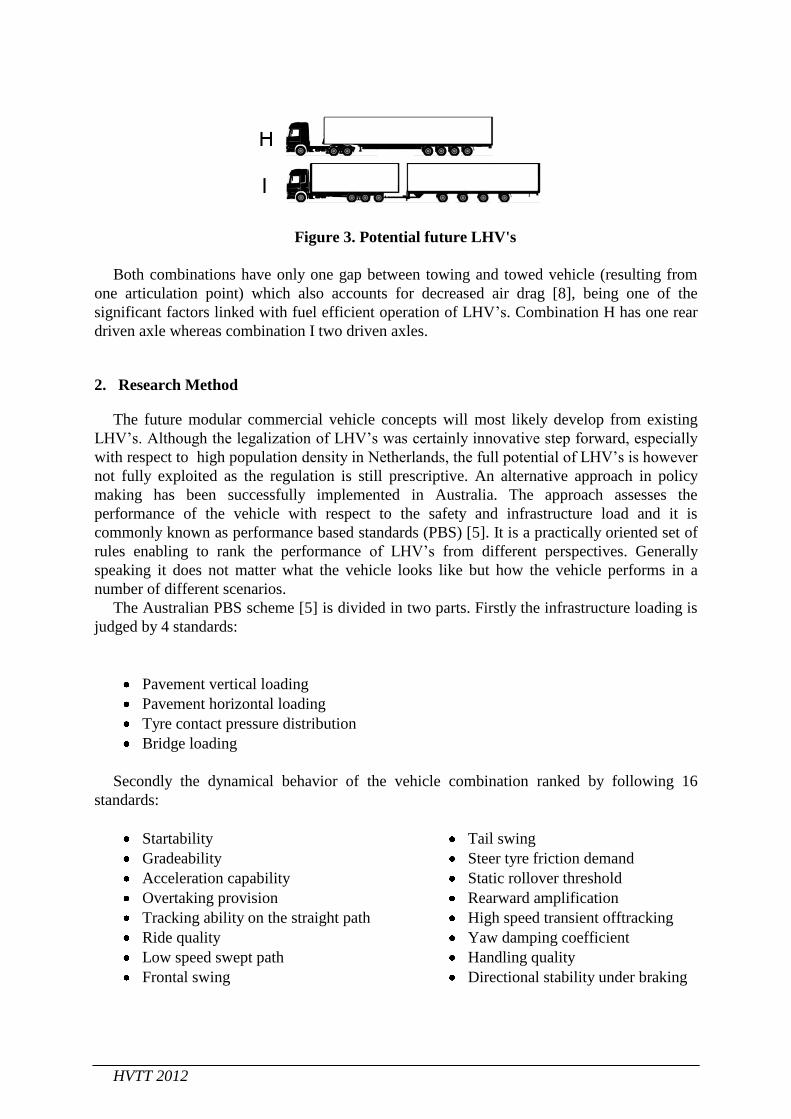
To meet these future requirements, two potential configurations will also be analyzed, note
however these configurations are not legal in any European country. The combination H has a
modular size up to 53ft (16.2m) container with a total vehicle weight of 50t, and configuration
I is composed from 30ft (9.15m) + 45ft (13.7m) container with a total vehicle weight of 60t,
as shown in Figure 3.
HVTT 2012
Figure 3. Potential future LHV's
Both combinations have only one gap between towing and towed vehicle (resulting from
one articulation point) which also accounts for decreased air drag [8], being one of the
significant factors linked with fuel efficient operation of LHV’s. Combination H has one rear
driven axle whereas combination I two driven axles.
2. Research Method
The future modular commercial vehicle concepts will most likely develop from existing
LHV’s. Although the legalization of LHV’s was certainly innovative step forward, especially
with respect to high population density in Netherlands, the full potential of LHV’s is however
not fully exploited as the regulation is still prescriptive. An alternative approach in policy
making has been successfully implemented in Australia. The approach assesses the
performance of the vehicle with respect to the safety and infrastructure load and it is
commonly known as performance based standards (PBS) [5]. It is a practically oriented set of
rules enabling to rank the performance of LHV’s from different perspectives. Generally
speaking it does not matter what the vehicle looks like but how the vehicle performs in a
number of different scenarios.
The Australian PBS scheme [5] is divided in two parts. Firstly the infrastructure loading is
judged by 4 standards:
Pavement vertical loading
Pavement horizontal loading
Tyre contact pressure distribution
Bridge loading
Secondly the dynamical behavior of the vehicle combination ranked by following 16
standards:
Startability
Gradeability
Acceleration capability
Overtaking provision
Tracking ability on the straight path
Ride quality
Low speed swept path
Frontal swing
Tail swing
Steer tyre friction demand
Static rollover threshold
Rearward amplification
High speed transient offtracking
Yaw damping coefficient
Handling quality
Directional stability under braking
HVTT 2012
Each standard has 4 levels reflecting the performance. Depending on the performance level
the vehicle is allowed to access on dedicated parts of the road network, e.g. Level 1 has
general access on any road whereas Level 4 can operate only at remote areas.
In this paper we restrict ourselves only to safety related dynamic standards measures. These
will be used to assess the performance of all current Dutch LHV combination together with
existing legal European commercial vehicle configurations and potential LHV concepts
reflecting on future logistic requirements.
Since the assessment of all performance measures for the various configurations by real
experimental testing would be both expensive and time consuming, it has been concluded to
carry out the analysis by computer simulations.
The models [7] have been created in multi-body domain using ‘TU/e – Commercial
Vehicle Library’ which allows simulation of various commercial vehicle combinations. The
library itself has been developed in a modular way using Matlab Simulink/SimMechanics
which makes it transparent and highly generic. The complexity of models is well balanced
with calculation time and aims to represent overall dynamical behavior of vehicle
combinations with sufficient accuracy. Through the central library one can fast and easily
modify particular components so its modification can be (if required) further distributed to the
linked models. The scripts attached to the library also enable simulation and easy modification
of predefined test scenarios like rollover stability, braking performance or rearward
amplification which has been already used in past for internal research [11,12]. For
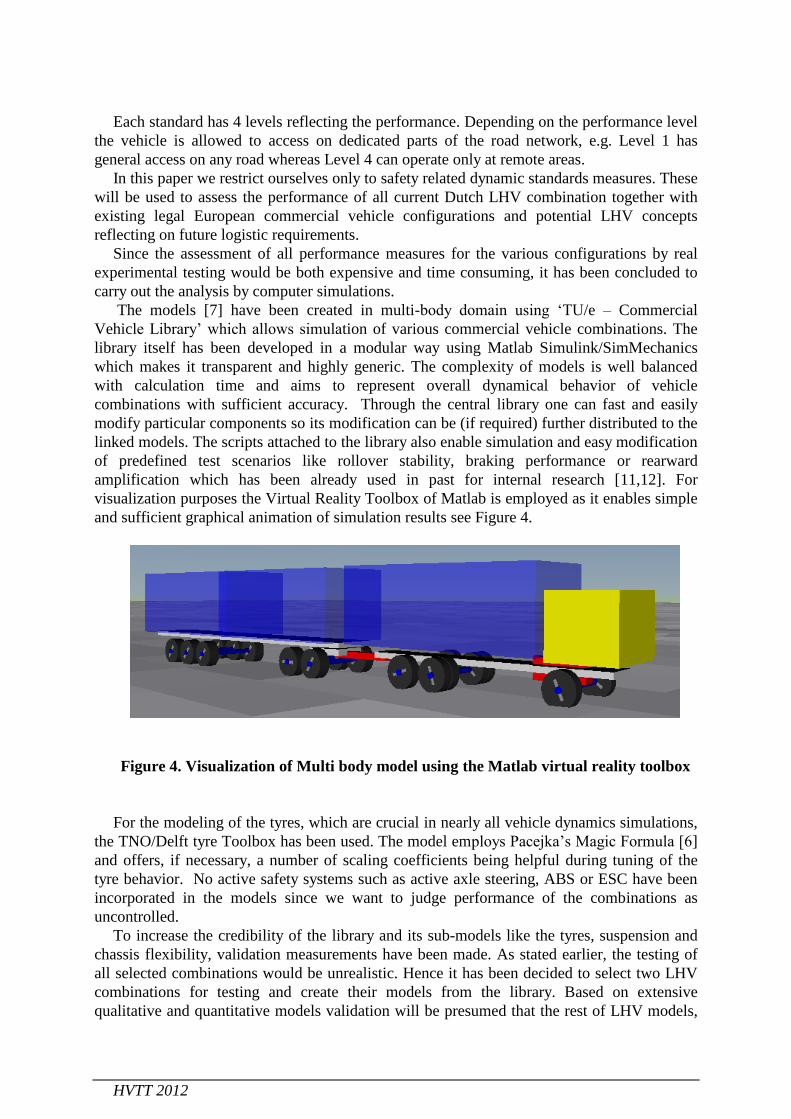
visualization purposes the Virtual Reality Toolbox of Matlab is employed as it enables simple
and sufficient graphical animation of simulation results see Figure 4.
Figure 4. Visualization of Multi body model using the Matlab virtual reality toolbox
For the modeling of the tyres, which are crucial in nearly all vehicle dynamics simulations,
the TNO/Delft tyre Toolbox has been used. The model employs Pacejka’s Magic Formula [6]
and offers, if necessary, a number of scaling coefficients being helpful during tuning of the
tyre behavior. No active safety systems such as active axle steering, ABS or ESC have been
incorporated in the models since we want to judge performance of the combinations as
uncontrolled.
To increase the credibility of the library and its sub-models like the tyres, suspension and
chassis flexibility, validation measurements have been made. As stated earlier, the testing of
all selected combinations would be unrealistic. Hence it has been decided to select two LHV
combinations for testing and create their models from the library. Based on extensive
qualitative and quantitative models validation will be presumed that the rest of LHV models,
HVTT 2012
being assembled from identical sub-models of TU/e – Commercial vehicle Library, will
perform with sufficient accuracy.
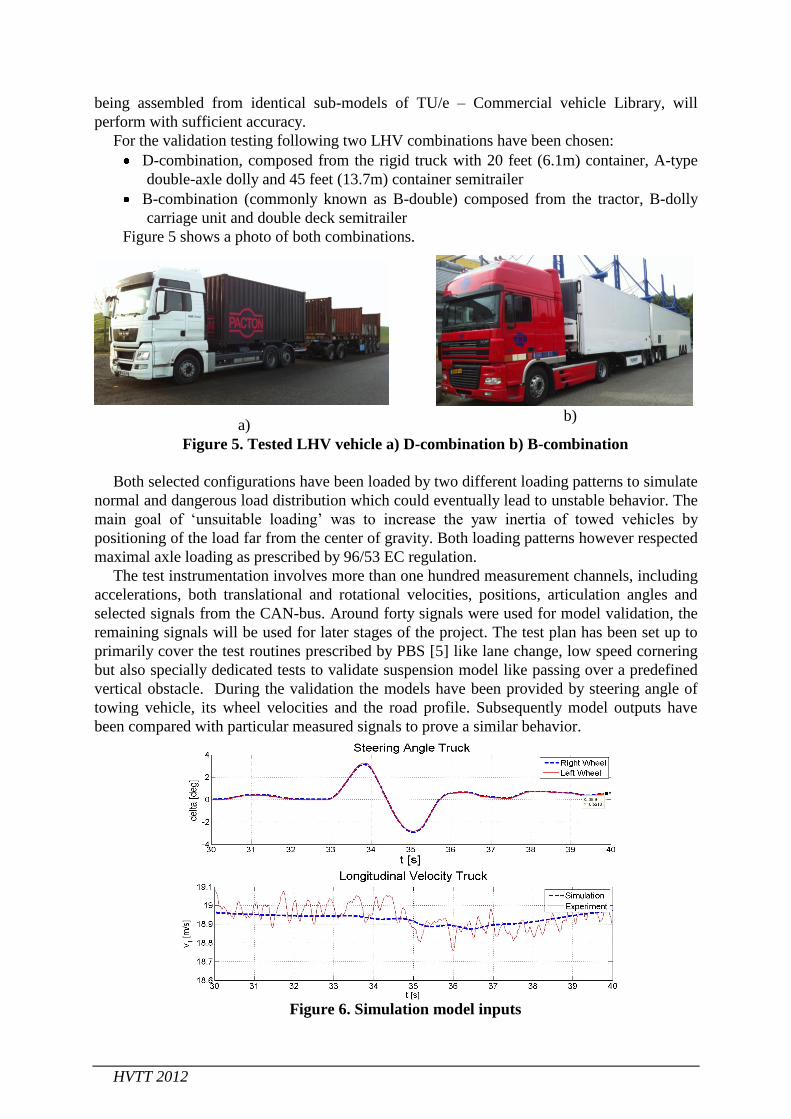
For the validation testing following two LHV combinations have been chosen:
D-combination, composed from the rigid truck with 20 feet (6.1m) container, A-type
double-axle dolly and 45 feet (13.7m) container semitrailer
B-combination (commonly known as B-double) composed from the tractor, B-dolly
carriage unit and double deck semitrailer
Figure 5 shows a photo of both combinations.
a) b)
Figure 5. Tested LHV vehicle a) D-combination b) B-combination
Both selected configurations have been loaded by two different loading patterns to simulate
normal and dangerous load distribution which could eventually lead to unstable behavior. The
main goal of ‘unsuitable loading’ was to increase the yaw inertia of towed vehicles by
positioning of the load far from the center of gravity. Both loading patterns however respected
maximal axle loading as prescribed by 96/53 EC regulation.
The test instrumentation involves more than one hundred measurement channels, including
accelerations, both translational and rotational velocities, positions, articulation angles and
selected signals from the CAN-bus. Around forty signals were used for model validation, the
remaining signals will be used for later stages of the project. The test plan has been set up to
primarily cover the test routines prescribed by PBS [5] like lane change, low speed cornering
but also specially dedicated tests to validate suspension model like passing over a predefined
vertical obstacle. During the validation the models have been provided by steering angle of
towing vehicle, its wheel velocities and the road profile. Subsequently model outputs have
been compared with particular measured signals to prove a similar behavior.
Figure 6. Simulation model inputs
HVTT 2012
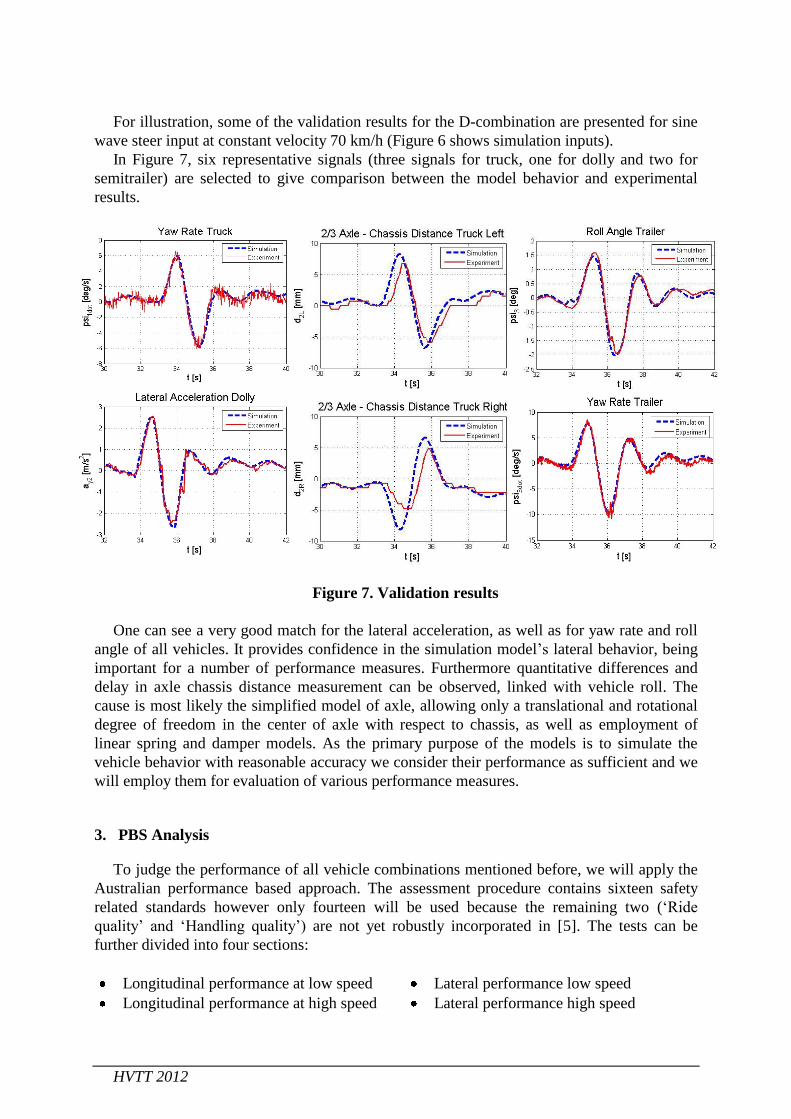
For illustration, some of the validation results for the D-combination are presented for sine
wave steer input at constant velocity 70 km/h (Figure 6 shows simulation inputs).
In Figure 7, six representative signals (three signals for truck, one for dolly and two for
semitrailer) are selected to give comparison between the model behavior and experimental
results.
Figure 7. Validation results
One can see a very good match for the lateral acceleration, as well as for yaw rate and roll
angle of all vehicles. It provides confidence in the simulation model’s lateral behavior, being
important for a number of performance measures. Furthermore quantitative differences and
delay in axle chassis distance measurement can be observed, linked with vehicle roll. The
cause is most likely the simplified model of axle, allowing only a translational and rotational
degree of freedom in the center of axle with respect to chassis, as well as employment of
linear spring and damper models. As the primary purpose of the models is to simulate the
vehicle behavior with reasonable accuracy we consider their performance as sufficient and we
will employ them for evaluation of various performance measures.
3. PBS Analysis
To judge the performance of all vehicle combinations mentioned before, we will apply the
Australian performance based approach. The assessment procedure contains sixteen safety
related standards however only fourteen will be used because the remaining two (‘Ride
quality’ and ‘Handling quality’) are not yet robustly incorporated in [5]. The tests can be
further divided into four sections:
Longitudinal performance at low speed
Longitudinal performance at high speed
Lateral performance low speed
Lateral performance high speed
HVTT 2012
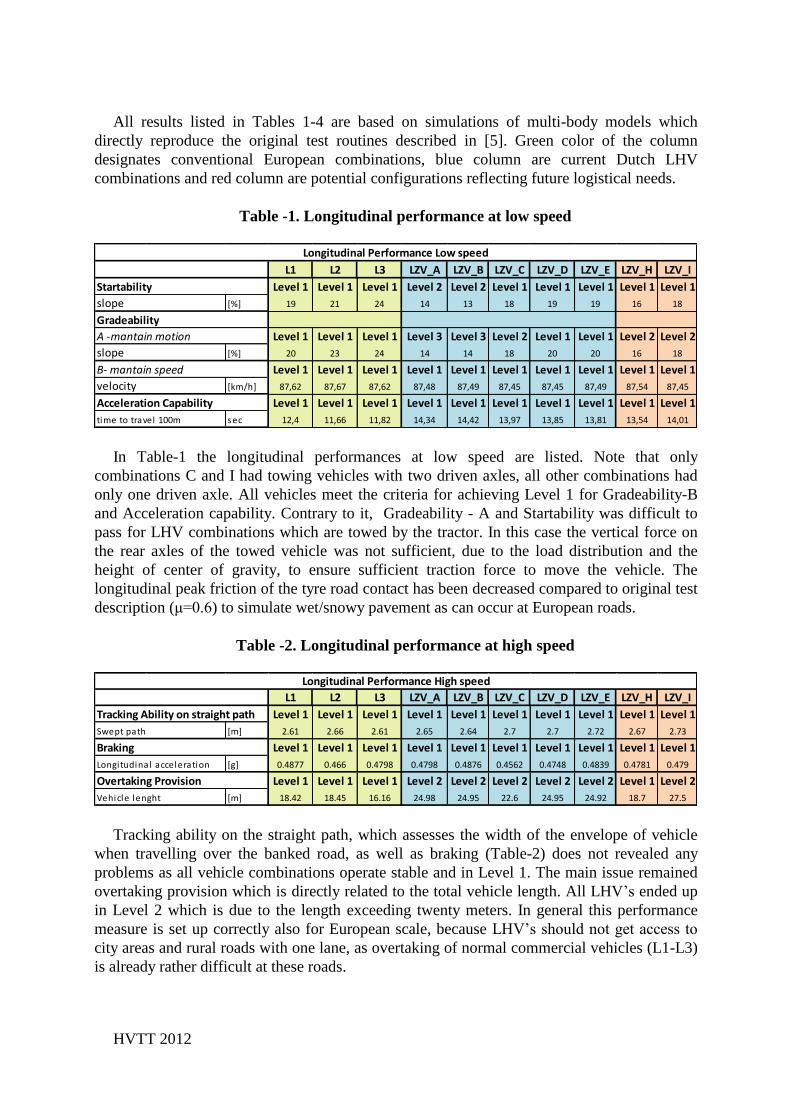
All results listed in Tables 1-4 are based on simulations of multi-body models which
directly reproduce the original test routines described in [5]. Green color of the column
designates conventional European combinations, blue column are current Dutch LHV
combinations and red column are potential configurations reflecting future logistical needs.
Table -1. Longitudinal performance at low speed
L1 L2 L3 LZV_A LZV_B LZV_C LZV_D LZV_E LZV_H LZV_I
Level 1 Level 1 Level 1 Level 2 Level 2 Level 1 Level 1 Level 1 Level 1 Level 1
[%] 19 21 24 14 13 18 19 19 16 18
Level 1 Level 1 Level 1 Level 3 Level 3 Level 2 Level 1 Level 1 Level 2 Level 2
[%] 20 23 24 14 14 18 20 20 16 18
Level 1 Level 1 Level 1 Level 1 Level 1 Level 1 Level 1 Level 1 Level 1 Level 1
[km/h] 87,62 87,67 87,62 87,48 87,49 87,45 87,45 87,49 87,54 87,45
Level 1 Level 1 Level 1 Level 1 Level 1 Level 1 Level 1 Level 1 Level 1 Level 1
time to travel 100m sec 12,4 11,66 11,82 14,34 14,42 13,97 13,85 13,81 13,54 14,01
Startability
slope
Gradeability
A -mantain motion
slope
B- mantain speed
velocity
Acceleration Capability
Longitudinal Performance Low speed
In Table-1 the longitudinal performances at low speed are listed. Note that only
combinations C and I had towing vehicles with two driven axles, all other combinations had
only one driven axle. All vehicles meet the criteria for achieving Level 1 for Gradeability-B
and Acceleration capability. Contrary to it, Gradeability - A and Startability was difficult to
pass for LHV combinations which are towed by the tractor. In this case the vertical force on
the rear axles of the towed vehicle was not sufficient, due to the load distribution and the
height of center of gravity, to ensure sufficient traction force to move the vehicle. The
longitudinal peak friction of the tyre road contact has been decreased compared to original test
description (μ=0.6) to simulate wet/snowy pavement as can occur at European roads.
Table -2. Longitudinal performance at high speed
L1 L2 L3 LZV_A LZV_B LZV_C LZV_D LZV_E LZV_H LZV_I
Tracking Ability on straight path Level 1 Level 1 Level 1 Level 1 Level 1 Level 1 Level 1 Level 1 Level 1 Level 1
[m] 2.61 2.66 2.61 2.65 2.64 2.7 2.7 2.72 2.67 2.73
Level 1 Level 1 Level 1 Level 1 Level 1 Level 1 Level 1 Level 1 Level 1 Level 1
Longitudinal acceleration [g] 0.4877 0.466 0.4798 0.4798 0.4876 0.4562 0.4748 0.4839 0.4781 0.479
Level 1 Level 1 Level 1 Level 2 Level 2 Level 2 Level 2 Level 2 Level 1 Level 2
Vehicle lenght [m] 18.42 18.45 16.16 24.98 24.95 22.6 24.95 24.92 18.7 27.5
Braking
Overtaking Provision
Swept path
Longitudinal Performance High speed
Tracking ability on the straight path, which assesses the width of the envelope of vehicle
when travelling over the banked road, as well as braking (Table-2) does not revealed any
problems as all vehicle combinations operate stable and in Level 1. The main issue remained
overtaking provision which is directly related to the total vehicle length. All LHV’s ended up
in Level 2 which is due to the length exceeding twenty meters. In general this performance
measure is set up correctly also for European scale, because LHV’s should not get access to
city areas and rural roads with one lane, as overtaking of normal commercial vehicles (L1-L3)
is already rather difficult at these roads.
HVTT 2012
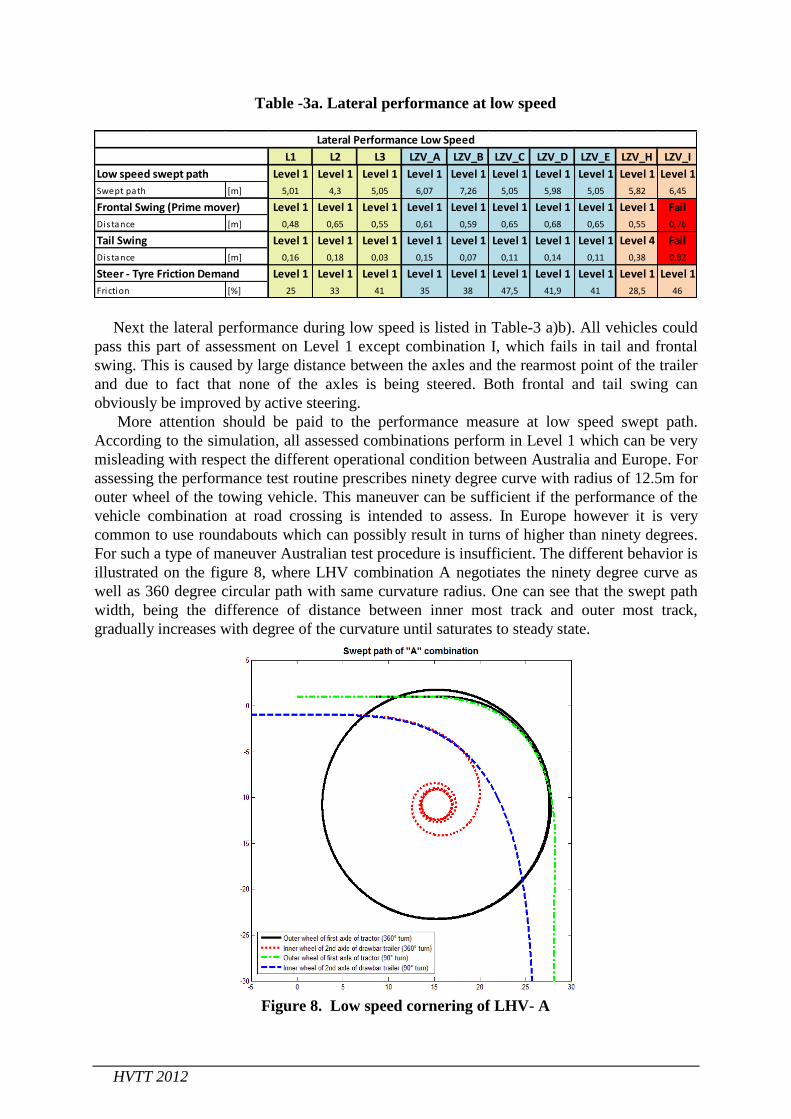
Table -3a. Lateral performance at low speed
L1 L2 L3 LZV_A LZV_B LZV_C LZV_D LZV_E LZV_H LZV_I
Level 1 Level 1 Level 1 Level 1 Level 1 Level 1 Level 1 Level 1 Level 1 Level 1
[m] 5,01 4,3 5,05 6,07 7,26 5,05 5,98 5,05 5,82 6,45
Frontal Swing (Prime mover) Level 1 Level 1 Level 1 Level 1 Level 1 Level 1 Level 1 Level 1 Level 1 Fail
[m] 0,48 0,65 0,55 0,61 0,59 0,65 0,68 0,65 0,55 0,76
Level 1 Level 1 Level 1 Level 1 Level 1 Level 1 Level 1 Level 1 Level 4 Fail
[m] 0,16 0,18 0,03 0,15 0,07 0,11 0,14 0,11 0,38 0,82
Steer - Tyre Friction Demand Level 1 Level 1 Level 1 Level 1 Level 1 Level 1 Level 1 Level 1 Level 1 Level 1
[%] 25 33 41 35 38 47,5 41,9 41 28,5 46
Low speed swept path
Swept path
Distance
Tail Swing
Distance
Lateral Performance Low Speed
Friction
Next the lateral performance during low speed is listed in Table-3 a)b). All vehicles could
pass this part of assessment on Level 1 except combination I, which fails in tail and frontal
swing. This is caused by large distance between the axles and the rearmost point of the trailer
and due to fact that none of the axles is being steered. Both frontal and tail swing can
obviously be improved by active steering.
More attention should be paid to the performance measure at low speed swept path.
According to the simulation, all assessed combinations perform in Level 1 which can be very
misleading with respect the different operational condition between Australia and Europe. For
assessing the performance test routine prescribes ninety degree curve with radius of 12.5m for
outer wheel of the towing vehicle. This maneuver can be sufficient if the performance of the
vehicle combination at road crossing is intended to assess. In Europe however it is very
common to use roundabouts which can possibly result in turns of higher than ninety degrees.
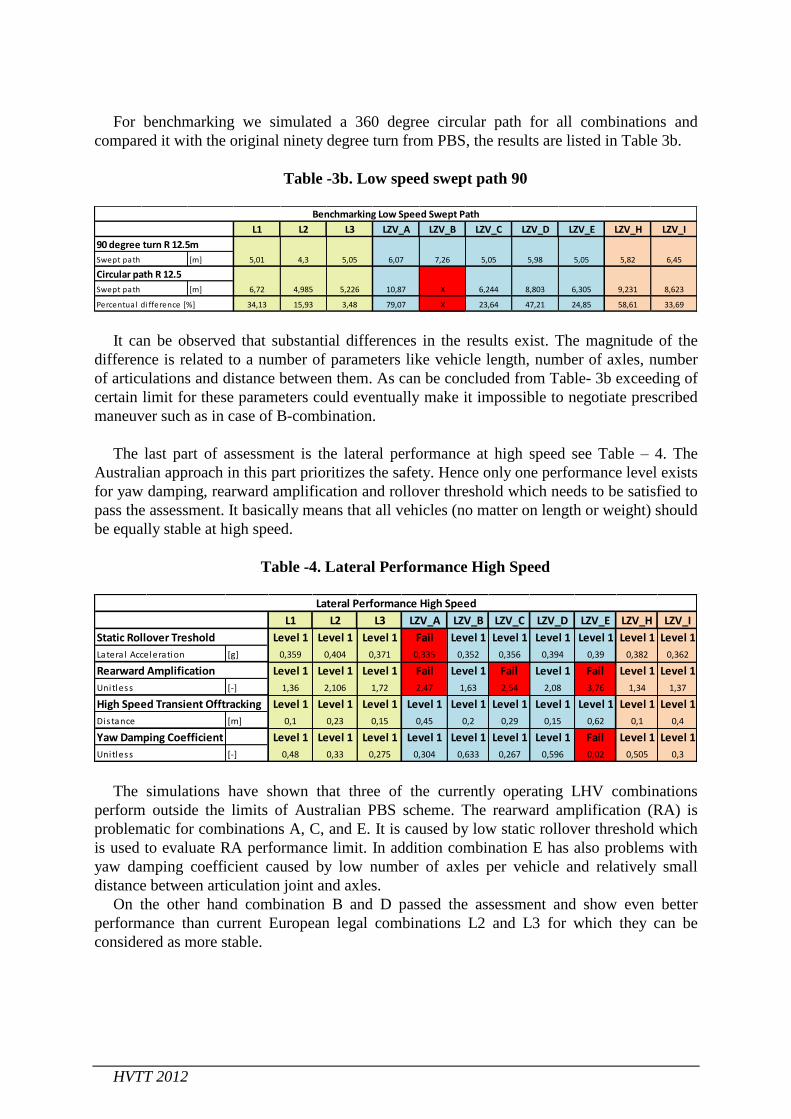
For such a type of maneuver Australian test procedure is insufficient. The different behavior is
illustrated on the figure 8, where LHV combination A negotiates the ninety degree curve as
well as 360 degree circular path with same curvature radius. One can see that the swept path
width, being the difference of distance between inner most track and outer most track,
gradually increases with degree of the curvature until saturates to steady state.
Figure 8. Low speed cornering of LHV- A
HVTT 2012
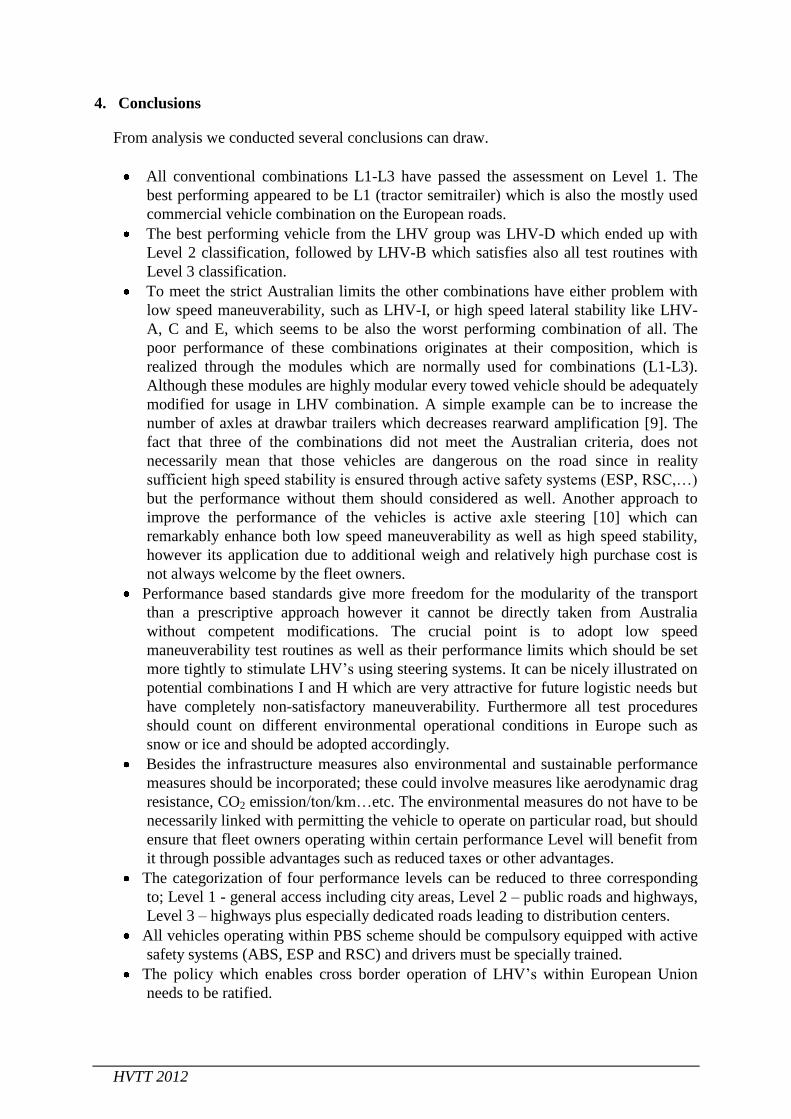
For benchmarking we simulated a 360 degree circular path for all combinations and
compared it with the original ninety degree turn from PBS, the results are listed in Table 3b.
Table -3b. Low speed swept path 90
L1 L2 L3 LZV_A LZV_B LZV_C LZV_D LZV_E LZV_H LZV_I
90 degree turn R 12.5m
[m] 5,01 4,3 5,05 6,07 7,26 5,05 5,98 5,05 5,82 6,45
[m] 6,72 4,985 5,226 10,87 X 6,244 8,803 6,305 9,231 8,623
34,13 15,93 3,48 79,07 X 23,64 47,21 24,85 58,61 33,69Percentual di fference [%]
Benchmarking Low Speed Swept Path
Swept path
Circular path R 12.5
Swept path
It can be observed that substantial differences in the results exist. The magnitude of the
difference is related to a number of parameters like vehicle length, number of axles, number
of articulations and distance between them. As can be concluded from Table- 3b exceeding of
certain limit for these parameters could eventually make it impossible to negotiate prescribed
maneuver such as in case of B-combination.
The last part of assessment is the lateral performance at high speed see Table – 4. The
Australian approach in this part prioritizes the safety. Hence only one performance level exists
for yaw damping, rearward amplification and rollover threshold which needs to be satisfied to
pass the assessment. It basically means that all vehicles (no matter on length or weight) should
be equally stable at high speed.
Table -4. Lateral Performance High Speed
L1 L2 L3 LZV_A LZV_B LZV_C LZV_D LZV_E LZV_H LZV_I
Level 1 Level 1 Level 1 Fail Level 1 Level 1 Level 1 Level 1 Level 1 Level 1
Lateral Acceleration [g] 0,359 0,404 0,371 0,335 0,352 0,356 0,394 0,39 0,382 0,362
Level 1 Level 1 Level 1 Fail Level 1 Fail Level 1 Fail Level 1 Level 1
[-] 1,36 2,106 1,72 2,47 1,63 2,54 2,08 3,76 1,34 1,37
High Speed Transient Offtracking Level 1 Level 1 Level 1 Level 1 Level 1 Level 1 Level 1 Level 1 Level 1 Level 1
[m] 0,1 0,23 0,15 0,45 0,2 0,29 0,15 0,62 0,1 0,4
Yaw Damping Coefficient Level 1 Level 1 Level 1 Level 1 Level 1 Level 1 Level 1 Fail Level 1 Level 1
[-] 0,48 0,33 0,275 0,304 0,633 0,267 0,596 0,02 0,505 0,3
Distance
Unitless
Lateral Performance High Speed
Static Rollover Treshold
Rearward Amplification
Unitless
The simulations have shown that three of the currently operating LHV combinations
perform outside the limits of Australian PBS scheme. The rearward amplification (RA) is
problematic for combinations A, C, and E. It is caused by low static rollover threshold which
is used to evaluate RA performance limit. In addition combination E has also problems with
yaw damping coefficient caused by low number of axles per vehicle and relatively small
distance between articulation joint and axles.
On the other hand combination B and D passed the assessment and show even better
performance than current European legal combinations L2 and L3 for which they can be
considered as more stable.
HVTT 2012
4. Conclusions
From analysis we conducted several conclusions can draw.
All conventional combinations L1-L3 have passed the assessment on Level 1. The
best performing appeared to be L1 (tractor semitrailer) which is also the mostly used
commercial vehicle combination on the European roads.
The best performing vehicle from the LHV group was LHV-D which ended up with
Level 2 classification, followed by LHV-B which satisfies also all test routines with
Level 3 classification.
To meet the strict Australian limits the other combinations have either problem with
low speed maneuverability, such as LHV-I, or high speed lateral stability like LHV-
A, C and E, which seems to be also the worst performing combination of all. The
poor performance of these combinations originates at their composition, which is
realized through the modules which are normally used for combinations (L1-L3).
Although these modules are highly modular every towed vehicle should be adequately
modified for usage in LHV combination. A simple example can be to increase the
number of axles at drawbar trailers which decreases rearward amplification [9]. The
fact that three of the combinations did not meet the Australian criteria, does not
necessarily mean that those vehicles are dangerous on the road since in reality
sufficient high speed stability is ensured through active safety systems (ESP, RSC,…)
but the performance without them should considered as well. Another approach to
improve the performance of the vehicles is active axle steering [10] which can
remarkably enhance both low speed maneuverability as well as high speed stability,
however its application due to additional weigh and relatively high purchase cost is
not always welcome by the fleet owners.
Performance based standards give more freedom for the modularity of the transport
than a prescriptive approach however it cannot be directly taken from Australia
without competent modifications. The crucial point is to adopt low speed
maneuverability test routines as well as their performance limits which should be set
more tightly to stimulate LHV’s using steering systems. It can be nicely illustrated on
potential combinations I and H which are very attractive for future logistic needs but
have completely non-satisfactory maneuverability. Furthermore all test procedures
should count on different environmental operational conditions in Europe such as
snow or ice and should be adopted accordingly.
Besides the infrastructure measures also environmental and sustainable performance
measures should be incorporated; these could involve measures like aerodynamic drag
resistance, CO2 emission/ton/km…etc. The environmental measures do not have to be
necessarily linked with permitting the vehicle to operate on particular road, but should
ensure that fleet owners operating within certain performance Level will benefit from
it through possible advantages such as reduced taxes or other advantages.
The categorization of four performance levels can be reduced to three corresponding
to; Level 1 - general access including city areas, Level 2 – public roads and highways,
Level 3 – highways plus especially dedicated roads leading to distribution centers.
All vehicles operating within PBS scheme should be compulsory equipped with active
safety systems (ABS, ESP and RSC) and drivers must be specially trained.
The policy which enables cross border operation of LHV’s within European Union
needs to be ratified.
HVTT 2012
5. References
[1].European Commission’s White Paper on Transport, 2001,
http://ec.europa.eu/transport/strategies/doc/2001_white_paper/lb_com_2001_0370_en.pd
f
[2]. European Union Road Federation (ERF), European road statistics 2009, June 2009,
http://www.erf.be/media/stats/ERF-
2009%20European%20Union%20Road%20Statistics%20BOOKLET_V07_update.pdf
[3]. Rakic, B.,Stageman, J., Monitoring Traffic Safety Longer and Heavier Vehicles, RWS,
July 2011
[4]. Meijer, N., An analysis of how the developments in packaging industry will influence the
dimensions of freight carriers, 2011, HAN University of Applied Sciences, Arnhem,
Faculty of management
[5].National Transport Commission Australia, 2008, Performance Based Standards Scheme,
The Standards and Vehicle assessment Rules, www.ntc.gov.au
[6]. Pacejka, H.B.: Tyre and vehicle dynamics, Second edition, Butterworth-Heinemann 2006,
Oxford
[7]. Besselink, I.J.M.: Evaluation of the lateral dynamics of complex articulated commercial
vehicles, Presented at the Commercial Vehicle Workshop Graz, May 2008
[8]. Raemdonck,G.: Time – Averaged Phenomenological Investigation of a Wake Behind a
Bluff Body, , BBAA 2008
[9]. Luijten, M.F.J..: Lateral Dynamic Behavior of Articulated Commercial Vehicles, Master
Thesis 2010, Eindhoven University of Technology
[10].Odhams, AMC and Roebuck, RL and Jujnovich, BA and Cebon, D (2011) Active
steering of a tractor-semi-trailer, Proceedings of the Institution of Mechanical Engineers,
Part D: Journal of Automobile Engineering, 225. pp. 847-869. ISSN 0954-4070
[11] G. Isiklar. Simulation of complex articulated commercial vehicles for different driving
manoeuvres. Master’s thesis, Eindhoven University of Technology, Department
Mechanical Engineering, Dynamics and Control Group, 2007. DCT 2007.122.
[12] M. Pinxteren. Brake and roll-over performance of longer heavier vehicle combinations.
Master’s thesis, Eindhoven University of Technology, Department Mechanical
Engineering, Dynamics and Control Group, 2009. DCT 2009.063.