Embed Size (px)
Citation preview
TRI-DRIVE PRIME MOVER TYRE FORCES
Obtained B.E. from Monash University Melbourne, Australia. Completed a 12-month placement at the University of California, Berkeley in 2007. In his current role at ARRB Group Ltd Luke specialises in the simulation, testing and analysis of the dynamic performance of heavy vehicles.
Obtained B.E. and Ph.D. from Monash University Melbourne, Australia. Nick has previously worked as a tyre expert for Honda’s Formula 1 team. In his current role at ARRB Group Ltd Nick specialises in the simulation, testing and analysis of the dynamic performance of heavy vehicles.
L.B. CALLAWAYARRB Group LtdAustralia
N.J. TREVORROWARRB Group LtdAustralia
Abstract
This paper outlines the findings from a large scale simulation based investigation into the forces generated at the tyre/road interface of the drive tyres of tri-drive heavy vehicles while turning relatively tight turns at low speed, climbing grades at steady speed and during start-up. Vehicles ranging from a rigid concrete agitator to AAB-quad road train combinations were simulated with most vehicles being simulated in both a tandem-drive and tri-drive configuration. Specific reference to the tri-drive prime mover policy in Queensland, Australia is made with the study being intended to be used as a key input into the review of this policy. Keywords: tri-drive, tridem, drive group, heavy vehicle, prime mover, tractor, pavement, road, damage
1
1. Introduction
The use of three drive axles for heavy vehicles provides the benefits of spreading vertical forces between more drive tyres in comparison to more common tandem-drive configurations. This also allows a maximum torque share of less than 50% to any one drive axle which is not possible for tandem drive vehicles. The reduction of peak torque share to any one axle is widely regarded to be particularly advantageous from a pavement damage perspective for vehicles with a relatively high gross combination mass (GCM) during start-up and when climbing grades. However there is concern about increased scrubbing forces associated with tri-drives when turning corners particularly those with a tight radius. It is for these reasons that the current Queensland Department of Transport and Main Roads (TMR) tri-drive prime mover policy restricts the use of tri-drives to combinations with a GCM of 150 tonnes or greater.
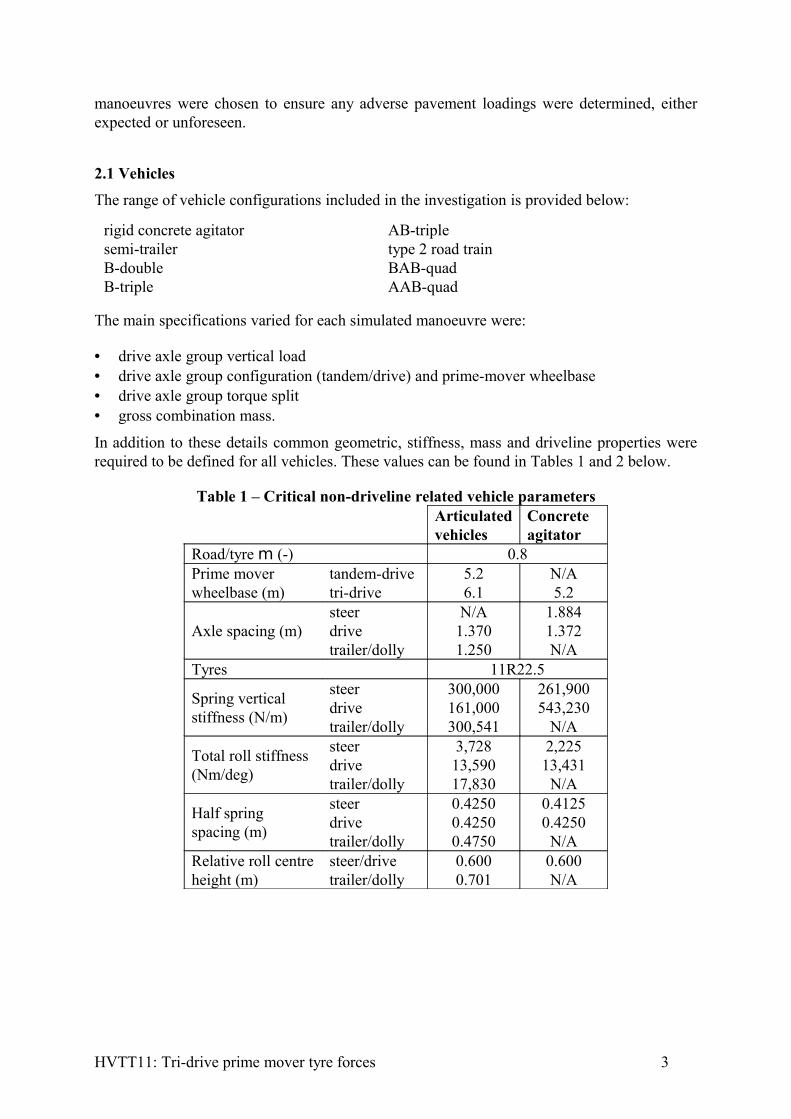
The policy of restricting the use of tri-drives to combinations with a high GCM means that if the goods being transported by large vehicles (which incorporate tri-axle trailer groups) are to be delivered to sites that are only accessible via non-road train roads, these vehicles are split between several smaller combinations which are required to make use of tandem or single axle drive prime movers. The issue with this is that sometimes the process of splitting these larger combinations up means that a tandem-drive axle group replaces a tri-axle trailer group and hence the tandem-drive axles are overloaded (Figure 1).
Figure 1 – Overloading of tandem-drive groups when larger combination is separatedIn order to avoid these load distribution issues industry has requested that Queensland’s tri-drive policy be reviewed which led to the current TMR funded project. Previously there was limited information available relating to forces generated at the tyre/road interface for tri-axle drive groups. It is for this reason that TMR engaged ARRB Group Ltd (ARRB) to simulate a wide range of vehicles with both tandem and tri-drive prime movers so that a more performance orientated approach can be incorporated into the review of TMR’s tri-drive policy.
2. Method
Vehicles were analysed using ARRB’s multi-body dynamic simulation tool, AutoSim. A range of vehicles was simulated undertaking a series of manoeuvres, which were of particular interest in analysing road damage. The results of these simulations are reported in terms of vertical and road plane (horizontal) loads imparted on the pavement at each wheel location and relative damage coefficient for vertical loads. The comprehensive range of vehicles and
HVTT11: Tri-drive prime mover tyre forces 2
manoeuvres were chosen to ensure any adverse pavement loadings were determined, either expected or unforeseen.
2.1 VehiclesThe range of vehicle configurations included in the investigation is provided below:
The main specifications varied for each simulated manoeuvre were:
• drive axle group vertical load• drive axle group configuration (tandem/drive) and prime-mover wheelbase• drive axle group torque split• gross combination mass.
In addition to these details common geometric, stiffness, mass and driveline properties were required to be defined for all vehicles. These values can be found in Tables 1 and 2 below.
Table 1 – Critical non-driveline related vehicle parametersArticulated vehicles
Concrete agitator
Road/tyre m (-) 0.8Prime mover wheelbase (m)
tandem-drivetri-drive
5.26.1
N/A5.2
Axle spacing (m)steerdrivetrailer/dolly
N/A1.3701.250
1.8841.372N/A
Tyres 11R22.5
Spring vertical stiffness (N/m)
steerdrivetrailer/dolly
300,000161,000300,541
261,900543,230
N/A
Total roll stiffness (Nm/deg)
steerdrivetrailer/dolly
3,72813,59017,830
2,22513,431
N/A
Half spring spacing (m)
steerdrivetrailer/dolly
0.42500.42500.4750
0.41250.4250
N/ARelative roll centre height (m)
steer/drivetrailer/dolly
0.6000.701
0.600N/A
HVTT11: Tri-drive prime mover tyre forces 3
rigid concrete agitatorsemi-trailerB-doubleB-triple
AB-tripletype 2 road trainBAB-quadAAB-quad
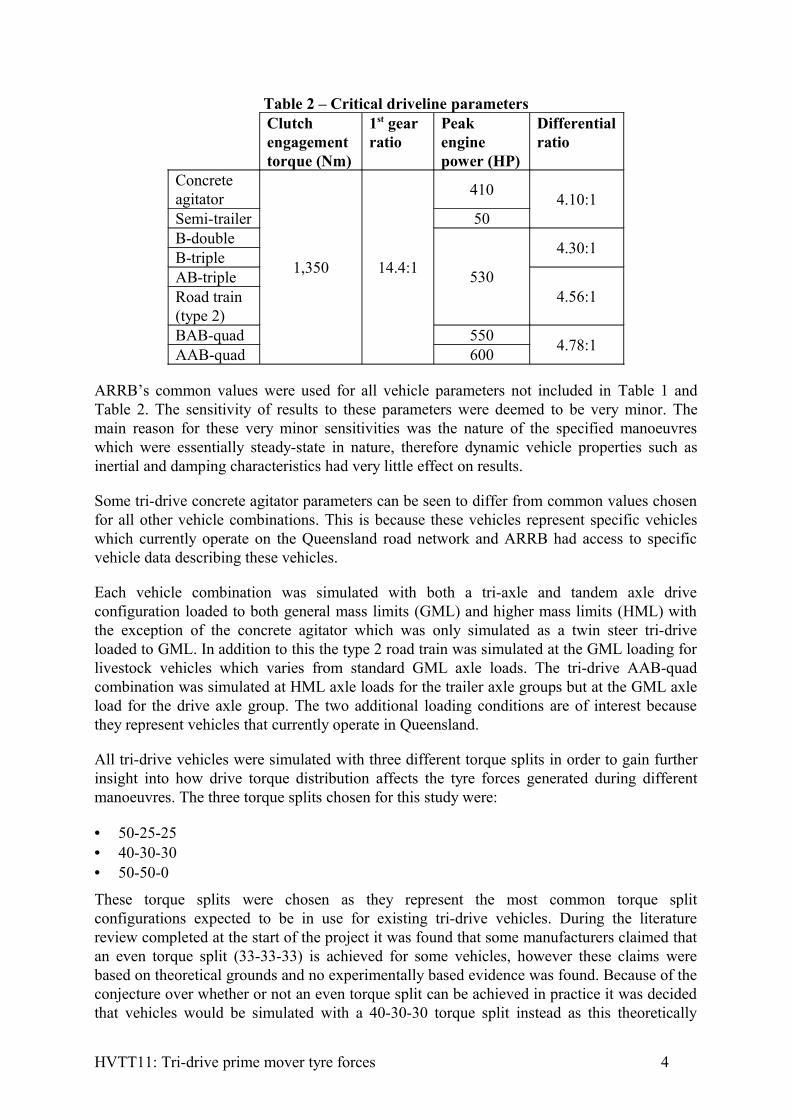
Table 2 – Critical driveline parametersClutch engagement torque (Nm)
1st gear ratio
Peak engine power (HP)
Differential ratio
Concrete agitator
1,350 14.4:1
410 4.10:1Semi-trailer 50B-double
530
4.30:1B-tripleAB-triple
4.56:1Road train (type 2)BAB-quad 550 4.78:1AAB-quad 600
ARRB’s common values were used for all vehicle parameters not included in Table 1 and Table 2. The sensitivity of results to these parameters were deemed to be very minor. The main reason for these very minor sensitivities was the nature of the specified manoeuvres which were essentially steady-state in nature, therefore dynamic vehicle properties such as inertial and damping characteristics had very little effect on results.
Some tri-drive concrete agitator parameters can be seen to differ from common values chosen for all other vehicle combinations. This is because these vehicles represent specific vehicles which currently operate on the Queensland road network and ARRB had access to specific vehicle data describing these vehicles.
Each vehicle combination was simulated with both a tri-axle and tandem axle drive configuration loaded to both general mass limits (GML) and higher mass limits (HML) with the exception of the concrete agitator which was only simulated as a twin steer tri-drive loaded to GML. In addition to this the type 2 road train was simulated at the GML loading for livestock vehicles which varies from standard GML axle loads. The tri-drive AAB-quad combination was simulated at HML axle loads for the trailer axle groups but at the GML axle load for the drive axle group. The two additional loading conditions are of interest because they represent vehicles that currently operate in Queensland.
All tri-drive vehicles were simulated with three different torque splits in order to gain further insight into how drive torque distribution affects the tyre forces generated during different manoeuvres. The three torque splits chosen for this study were:
• 50-25-25• 40-30-30• 50-50-0
These torque splits were chosen as they represent the most common torque split configurations expected to be in use for existing tri-drive vehicles. During the literature review completed at the start of the project it was found that some manufacturers claimed that an even torque split (33-33-33) is achieved for some vehicles, however these claims were based on theoretical grounds and no experimentally based evidence was found. Because of the conjecture over whether or not an even torque split can be achieved in practice it was decided that vehicles would be simulated with a 40-30-30 torque split instead as this theoretically
HVTT11: Tri-drive prime mover tyre forces 4
represents a worst case from a pavement damage standpoint. All tandem drive vehicles were simulated with a 50-50 torque split.
2.2 ManoeuvresThere are three categories of manoeuvre that are of particular interest when analysing the pavement damaging effects of tri-axle drive groups. These are tight turns, ascending grades and start-up.
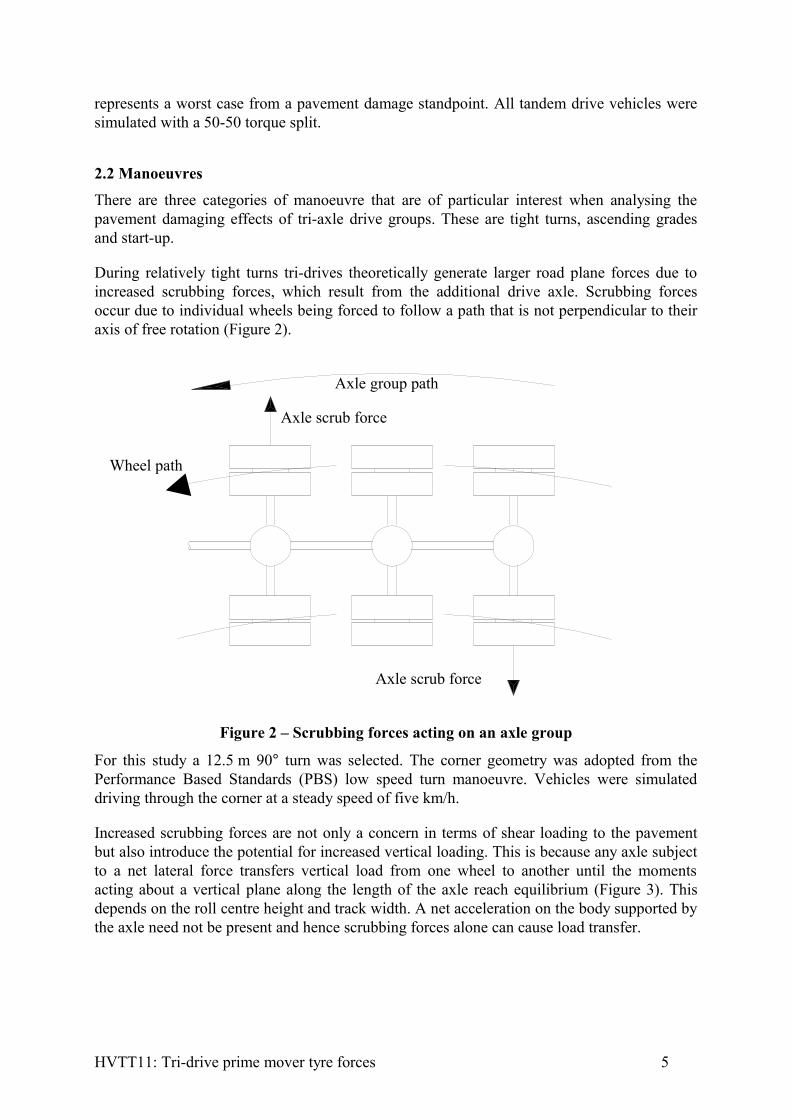
During relatively tight turns tri-drives theoretically generate larger road plane forces due to increased scrubbing forces, which result from the additional drive axle. Scrubbing forces occur due to individual wheels being forced to follow a path that is not perpendicular to their axis of free rotation (Figure 2).
Figure 2 – Scrubbing forces acting on an axle group
For this study a 12.5 m 90° turn was selected. The corner geometry was adopted from the Performance Based Standards (PBS) low speed turn manoeuvre. Vehicles were simulated driving through the corner at a steady speed of five km/h.
Increased scrubbing forces are not only a concern in terms of shear loading to the pavement but also introduce the potential for increased vertical loading. This is because any axle subject to a net lateral force transfers vertical load from one wheel to another until the moments acting about a vertical plane along the length of the axle reach equilibrium (Figure 3). This depends on the roll centre height and track width. A net acceleration on the body supported by the axle need not be present and hence scrubbing forces alone can cause load transfer.
HVTT11: Tri-drive prime mover tyre forces 5
Axle group path
Wheel path
Axle scrub force
Axle scrub force
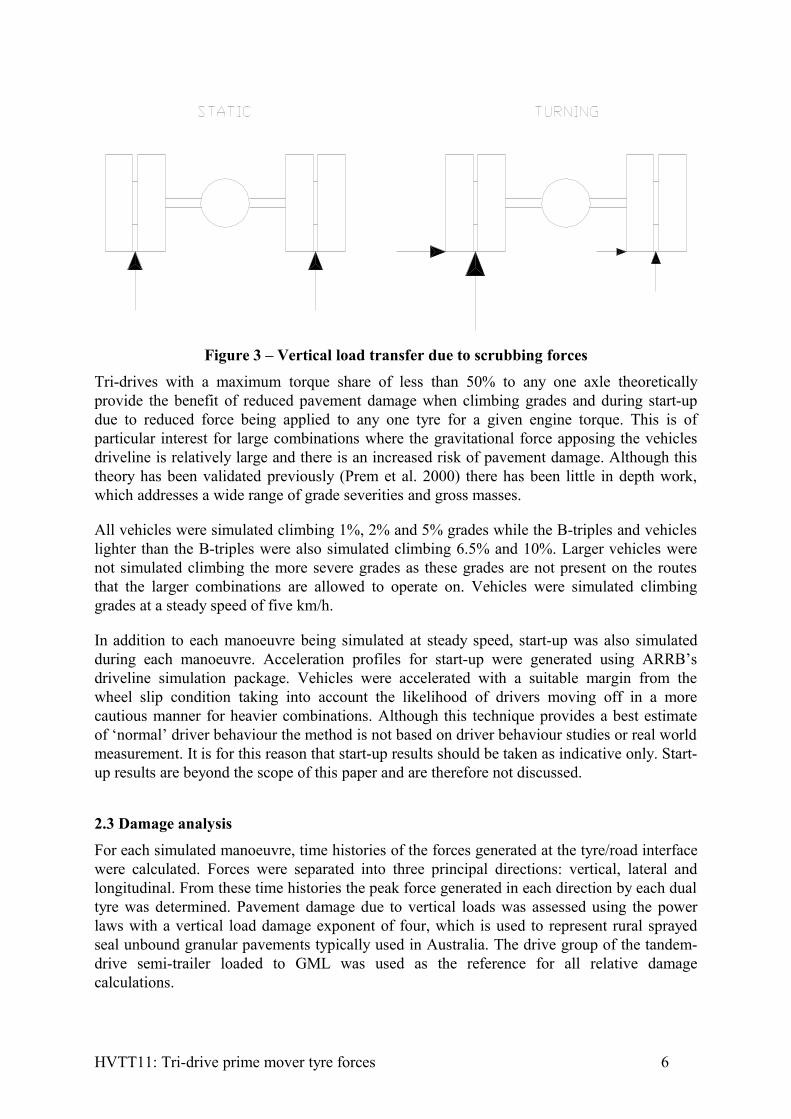
Figure 3 – Vertical load transfer due to scrubbing forcesTri-drives with a maximum torque share of less than 50% to any one axle theoretically provide the benefit of reduced pavement damage when climbing grades and during start-up due to reduced force being applied to any one tyre for a given engine torque. This is of particular interest for large combinations where the gravitational force apposing the vehicles driveline is relatively large and there is an increased risk of pavement damage. Although this theory has been validated previously (Prem et al. 2000) there has been little in depth work, which addresses a wide range of grade severities and gross masses.
All vehicles were simulated climbing 1%, 2% and 5% grades while the B-triples and vehicles lighter than the B-triples were also simulated climbing 6.5% and 10%. Larger vehicles were not simulated climbing the more severe grades as these grades are not present on the routes that the larger combinations are allowed to operate on. Vehicles were simulated climbing grades at a steady speed of five km/h.
In addition to each manoeuvre being simulated at steady speed, start-up was also simulated during each manoeuvre. Acceleration profiles for start-up were generated using ARRB’s driveline simulation package. Vehicles were accelerated with a suitable margin from the wheel slip condition taking into account the likelihood of drivers moving off in a more cautious manner for heavier combinations. Although this technique provides a best estimate of ‘normal’ driver behaviour the method is not based on driver behaviour studies or real world measurement. It is for this reason that start-up results should be taken as indicative only. Start-up results are beyond the scope of this paper and are therefore not discussed.
2.3 Damage analysisFor each simulated manoeuvre, time histories of the forces generated at the tyre/road interface were calculated. Forces were separated into three principal directions: vertical, lateral and longitudinal. From these time histories the peak force generated in each direction by each dual tyre was determined. Pavement damage due to vertical loads was assessed using the power laws with a vertical load damage exponent of four, which is used to represent rural sprayed seal unbound granular pavements typically used in Australia. The drive group of the tandem-drive semi-trailer loaded to GML was used as the reference for all relative damage calculations.
HVTT11: Tri-drive prime mover tyre forces 6
Currently there is no agreement on the link relating road plane forces to pavement damage. A common tool used to determine pavement responses from tyre loads is CIRCLY. It has been applied in a relative pavement surface damage calculation by assuming that the number of allowable loadings in the plane of the road a chip seal can sustain is proportional to the inverse of peak tensile strain in the plane of the road raised to the power of five (Prem et al. 2000). There is general agreement that this link between the critical strains in the pavement layers and pavement wear has not been validated with real wear or damage data (Pearson & Leydon 2004, Vuong et al. 2002). It is for this reason that relative pavement damage due to road plane forces was assessed via the comparison of force magnitudes directly rather than calculating theoretical relative damage.
3. Results
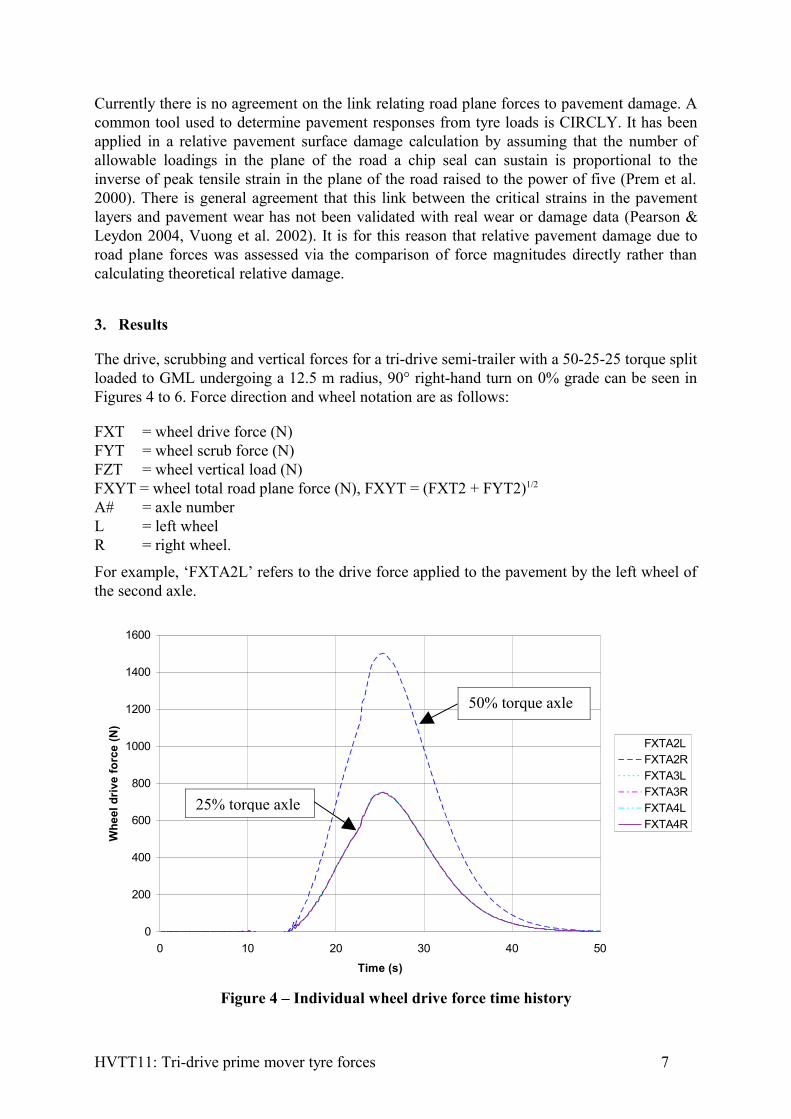
The drive, scrubbing and vertical forces for a tri-drive semi-trailer with a 50-25-25 torque split loaded to GML undergoing a 12.5 m radius, 90° right-hand turn on 0% grade can be seen in Figures 4 to 6. Force direction and wheel notation are as follows:
FXT = wheel drive force (N)FYT = wheel scrub force (N)FZT = wheel vertical load (N)FXYT = wheel total road plane force (N), FXYT = (FXT2 + FYT2)1/2
A# = axle numberL = left wheelR = right wheel.
For example, ‘FXTA2L’ refers to the drive force applied to the pavement by the left wheel of the second axle.
0
200
400
600
800
1000
1200
1400
1600
0 10 20 30 40 50
Time (s)
Whe
el d
rive
forc
e (N
)
FXTA2LFXTA2RFXTA3LFXTA3RFXTA4LFXTA4R
Figure 4 – Individual wheel drive force time history
HVTT11: Tri-drive prime mover tyre forces 7
50% torque axle
25% torque axle
-40000
-30000
-20000
-10000
0
10000
20000
30000
40000
0 10 20 30 40 50
Time (s)
Whe
el s
crub
forc
e (N
)
FYTA2LFYTA2RFYTA3LFYTA3RFYTA4LFYTA4R
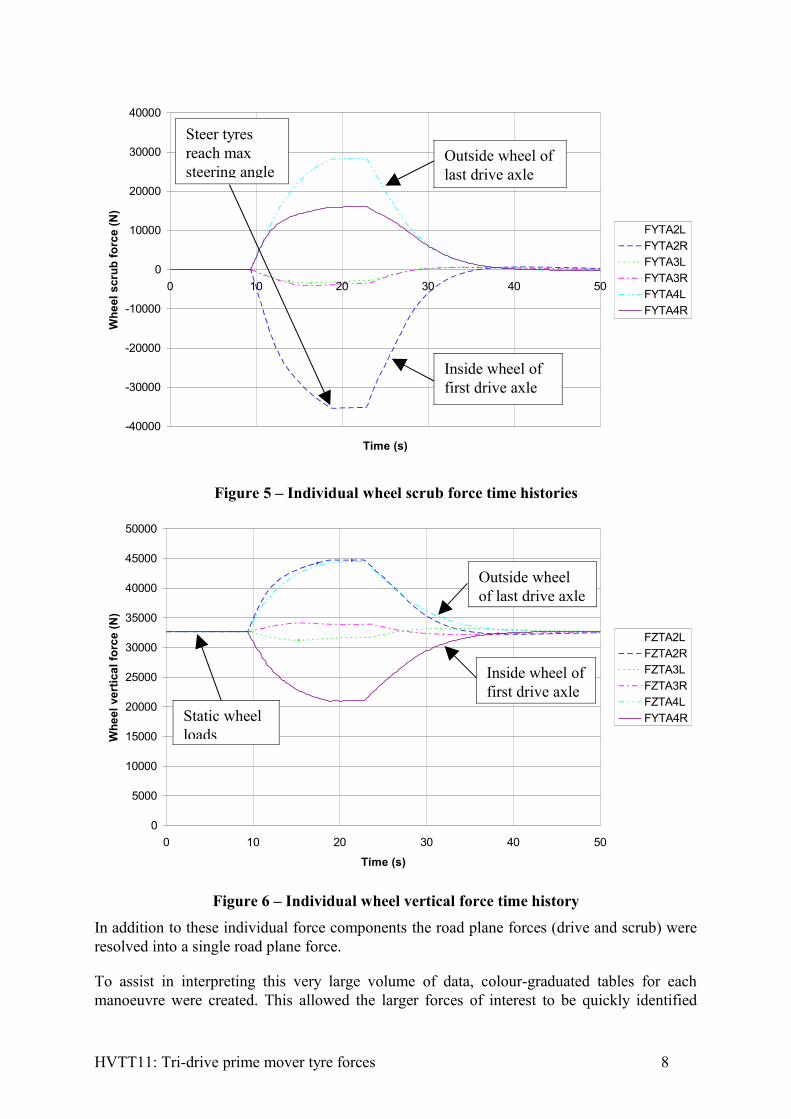
Figure 5 – Individual wheel scrub force time histories
0
5000
10000
15000
20000
25000
30000
35000
40000
45000
50000
0 10 20 30 40 50
Time (s)
Whe
el v
ertic
al fo
rce
(N)
FZTA2LFZTA2RFZTA3LFZTA3RFZTA4LFYTA4R
Figure 6 – Individual wheel vertical force time historyIn addition to these individual force components the road plane forces (drive and scrub) were resolved into a single road plane force.
To assist in interpreting this very large volume of data, colour-graduated tables for each manoeuvre were created. This allowed the larger forces of interest to be quickly identified
HVTT11: Tri-drive prime mover tyre forces 8
Outside wheel of last drive axle
Inside wheel of first drive axle
Outside wheel of last drive axle
Inside wheel of first drive axle
Static wheel loads
Steer tyres reach max steering angle
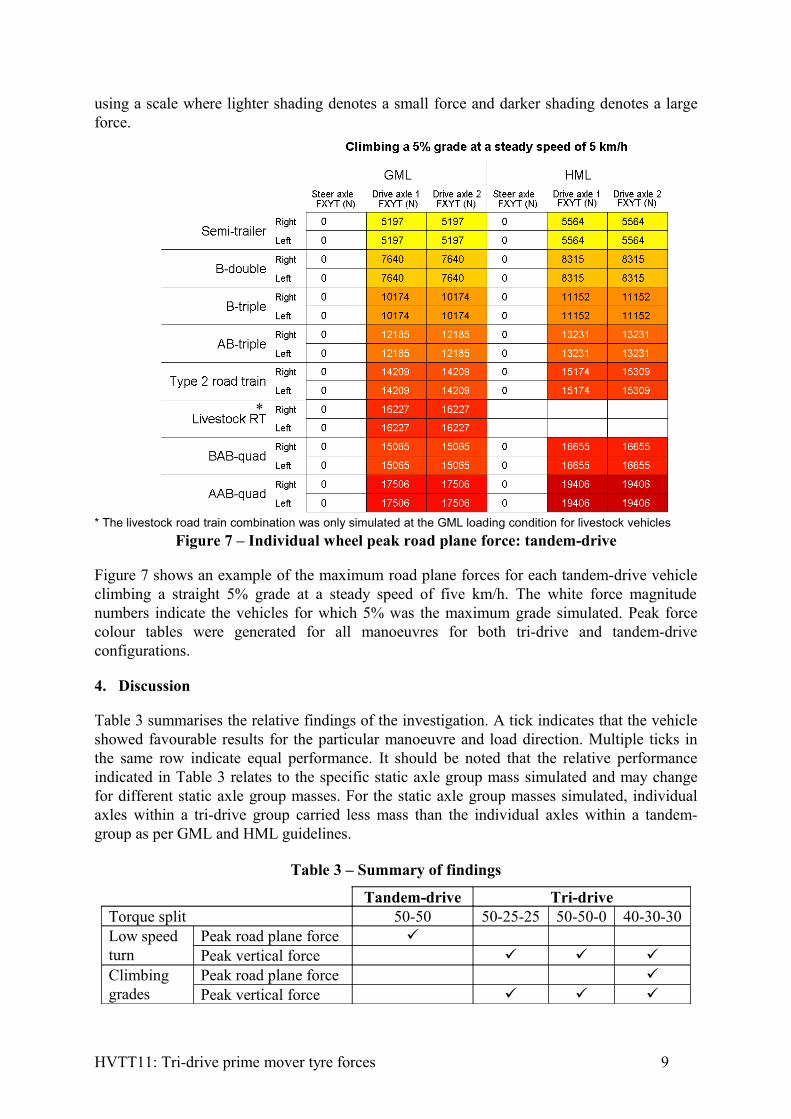
using a scale where lighter shading denotes a small force and darker shading denotes a large force.
* The livestock road train combination was only simulated at the GML loading condition for livestock vehiclesFigure 7 – Individual wheel peak road plane force: tandem-drive
Figure 7 shows an example of the maximum road plane forces for each tandem-drive vehicle climbing a straight 5% grade at a steady speed of five km/h. The white force magnitude numbers indicate the vehicles for which 5% was the maximum grade simulated. Peak force colour tables were generated for all manoeuvres for both tri-drive and tandem-drive configurations.
4. Discussion
Table 3 summarises the relative findings of the investigation. A tick indicates that the vehicle showed favourable results for the particular manoeuvre and load direction. Multiple ticks in the same row indicate equal performance. It should be noted that the relative performance indicated in Table 3 relates to the specific static axle group mass simulated and may change for different static axle group masses. For the static axle group masses simulated, individual axles within a tri-drive group carried less mass than the individual axles within a tandem-group as per GML and HML guidelines.
Table 3 – Summary of findings
Tandem-drive Tri-driveTorque split 50-50 50-25-25 50-50-0 40-30-30Low speed turn
Peak road plane force Peak vertical force
Climbing grades
Peak road plane force Peak vertical force
HVTT11: Tri-drive prime mover tyre forces 9
*
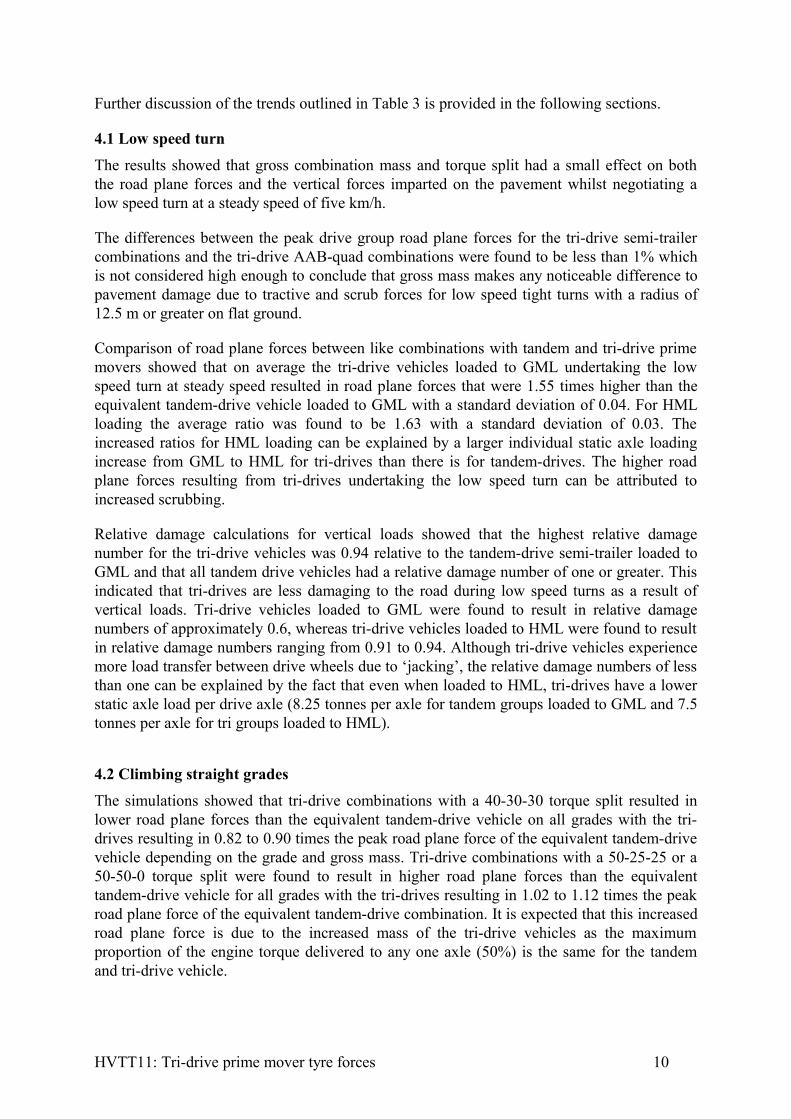
Further discussion of the trends outlined in Table 3 is provided in the following sections.
4.1 Low speed turnThe results showed that gross combination mass and torque split had a small effect on both the road plane forces and the vertical forces imparted on the pavement whilst negotiating a low speed turn at a steady speed of five km/h.
The differences between the peak drive group road plane forces for the tri-drive semi-trailer combinations and the tri-drive AAB-quad combinations were found to be less than 1% which is not considered high enough to conclude that gross mass makes any noticeable difference to pavement damage due to tractive and scrub forces for low speed tight turns with a radius of 12.5 m or greater on flat ground.
Comparison of road plane forces between like combinations with tandem and tri-drive prime movers showed that on average the tri-drive vehicles loaded to GML undertaking the low speed turn at steady speed resulted in road plane forces that were 1.55 times higher than the equivalent tandem-drive vehicle loaded to GML with a standard deviation of 0.04. For HML loading the average ratio was found to be 1.63 with a standard deviation of 0.03. The increased ratios for HML loading can be explained by a larger individual static axle loading increase from GML to HML for tri-drives than there is for tandem-drives. The higher road plane forces resulting from tri-drives undertaking the low speed turn can be attributed to increased scrubbing.
Relative damage calculations for vertical loads showed that the highest relative damage number for the tri-drive vehicles was 0.94 relative to the tandem-drive semi-trailer loaded to GML and that all tandem drive vehicles had a relative damage number of one or greater. This indicated that tri-drives are less damaging to the road during low speed turns as a result of vertical loads. Tri-drive vehicles loaded to GML were found to result in relative damage numbers of approximately 0.6, whereas tri-drive vehicles loaded to HML were found to result in relative damage numbers ranging from 0.91 to 0.94. Although tri-drive vehicles experience more load transfer between drive wheels due to ‘jacking’, the relative damage numbers of less than one can be explained by the fact that even when loaded to HML, tri-drives have a lower static axle load per drive axle (8.25 tonnes per axle for tandem groups loaded to GML and 7.5 tonnes per axle for tri groups loaded to HML).
4.2 Climbing straight gradesThe simulations showed that tri-drive combinations with a 40-30-30 torque split resulted in lower road plane forces than the equivalent tandem-drive vehicle on all grades with the tri-drives resulting in 0.82 to 0.90 times the peak road plane force of the equivalent tandem-drive vehicle depending on the grade and gross mass. Tri-drive combinations with a 50-25-25 or a 50-50-0 torque split were found to result in higher road plane forces than the equivalent tandem-drive vehicle for all grades with the tri-drives resulting in 1.02 to 1.12 times the peak road plane force of the equivalent tandem-drive combination. It is expected that this increased road plane force is due to the increased mass of the tri-drive vehicles as the maximum proportion of the engine torque delivered to any one axle (50%) is the same for the tandem and tri-drive vehicle.
HVTT11: Tri-drive prime mover tyre forces 10
It was also noted that there was a correlation between the ratio of drive group loading and gross mass and the relative road plane forces between tri-drive and tandem drive vehicles. For a given static drive group vertical loading (GML or HML) the ratio between tri-drive and tandem-drive road plane forces was found to decrease with an increase in gross mass. This finding indicates an reduced advantage for tandem-drives over tri-drives with a 50-25-25 or 50-50-0 torque split and an increased advantage of tri-drives with a maximum torque share of less than 50% (40-30-30 torque split or other) over tandem-drives in terms of the maximum tractive force when climbing grades for heavier vehicles.
Relative damage analysis for vertical loads showed that all tri-drive vehicles resulted in a relative damage of less than one in comparison to the tandem-drive semi-trailer loaded to GML with relative damage generally noted to increase with gross mass and grade for a given static drive group loading. Relative damage numbers for tri-drive vehicles ranged from 0.42 to 0.49 for GML loading and from 0.72 to 0.78 for HML loading for all grades and combination types. All tandem-drive combinations were found to have a relative damage coefficient of one or greater on all grades simulated. The damage numbers of less than one can be attributed to the lower static force per individual drive axle for tri-drive vehicles. This trend is not expected to hold for equal static vertical load per axle due to pitching and load transfer characteristics.
4.3 Comparison between manoeuvresIt was found that both the peak vertical and peak road plane forces generated during the low speed turn were larger than the peak forces generated on the maximum grade that each vehicle was simulated on. Peak vertical forces were higher during the low speed turn due to ‘jacking’, whereas the larger road plane forces generated during a low speed turn can be attributed to scrubbing forces. Peak road plane forces were found to be of a similar magnitude for tandem vehicles undertaking the low speed turn and climbing a 10% grade. The road plane forces generated by tri-drive vehicles during the low speed turn were found to be significantly higher than those resulting from climbing the 10% grade.
5. Conclusions
Results showed that gross mass and torque split had little effect on the peak road plane forces generated during low speed turns. Tri-drive vehicles were found to generate larger road plane forces than the equivalent tandem-drive vehicle with the forces being 1.55 times larger on average for tri-drive vehicles loaded to GML and 1.63 times larger on average for HML loading. Higher road plane forces for tri-drives can be attributed to increased ‘scrubbing’ during turns.
Tri-drive vehicles which incorporate a torque share of 50% were found to provide little or no benefit over tandem-drive vehicles in terms of reducing peak road plane forces when climbing grades at steady speed. Tri-drive vehicles with a 40-30-30 torque split were found to result in road plane forces that were 10% to 18% lower than the equivalent tandem-drive vehicle depending on the grade and gross mass.
Relative damage calculations showed for vertical loads that tri-drive vehicles resulted in lower relative damage numbers than all tandem drive vehicles on all grades and during the low speed turn at steady speed. This was concluded to be mainly due to a lower static load per drive axle. Comparison with relative damage calculations for static individual axle loads
HVTT11: Tri-drive prime mover tyre forces 11
indicated that for an equal static load per axle, a tri-drive would result in a higher peak vertical force than the same combination with a tandem-drive. This can be attributed to the different load transfer characteristics between drive axles due to pitching while climbing grades and scrubbing while turning corners.
References
• Pearson, B & Leydon, P 2004, ‘Performance-based standards: challenges in developing infrastructure protection standards’, International Symposium on Heavy Vehicle Weights and Dimensions, 8th, 2004, Muldersdrift, South Africa, Document Transformation Technologies, Johannesburg, 9 pp.
• Prem, H, Ramsay, E, Potter, D & Patane, J 2000, ‘Pavement damaging effects of road trains‘, International Symposium on Heavy Vehicle Weights and Dimensions, 6th, 2000, Saskatoon, Saskatchewan, Canada, International Forum for Road Transport Technology, Regina, Saskatchewan, Canada, pp. 197-218.
• Vuong, BT, Yeo, REY & Sharp, KG 2002, ‘Review of the technical basis of heavy vehicle performance standard for horizontal tyre force’, working paper prepared for the National Road Transport Commission, ARRB Transport Research, Vermont South, Vic.
HVTT11: Tri-drive prime mover tyre forces 12