Embed Size (px)
Citation preview

Monitoring Results of Two PBS Demonstration Vehicles in the Forestry Industry in South Africa
Paul Nordengen, CSIR, South Africa
Contents • Introduc)on • Vehicle Monitoring
– Distance travelled – Tons transported – Combina)on mass & payload – Road wear – Fuel consump)on & efficiency – Safety performance
• Way forward
Background • 7ISHVWD, Del,, June 2002: PBS workshop • Melbourne, Feb 2003: PBS seminar
• RTMS accreditaHon system iniHated in the forestry industry in 2003 – prerequisite for PBS involvement
• April 2004, Study tour to Australia with DoT and forestry industry representaHves
• PBS commiPee established in 2004
• April 2005, Study tour with Board Members of the SA Road Freight AssociaHon
Background (cont.) • LePer of support from Minister of Transport • Two global forestry & paper companies, Mondi and Sappi, indicated an interest in PBS demonstraHon projects
• ARRB and MSD in Australia appointed to carry out PBS assessments based on Level 2 of the Australian system
• Two PBS demonstraHon vehicles commissioned in Nov and Dec 2007
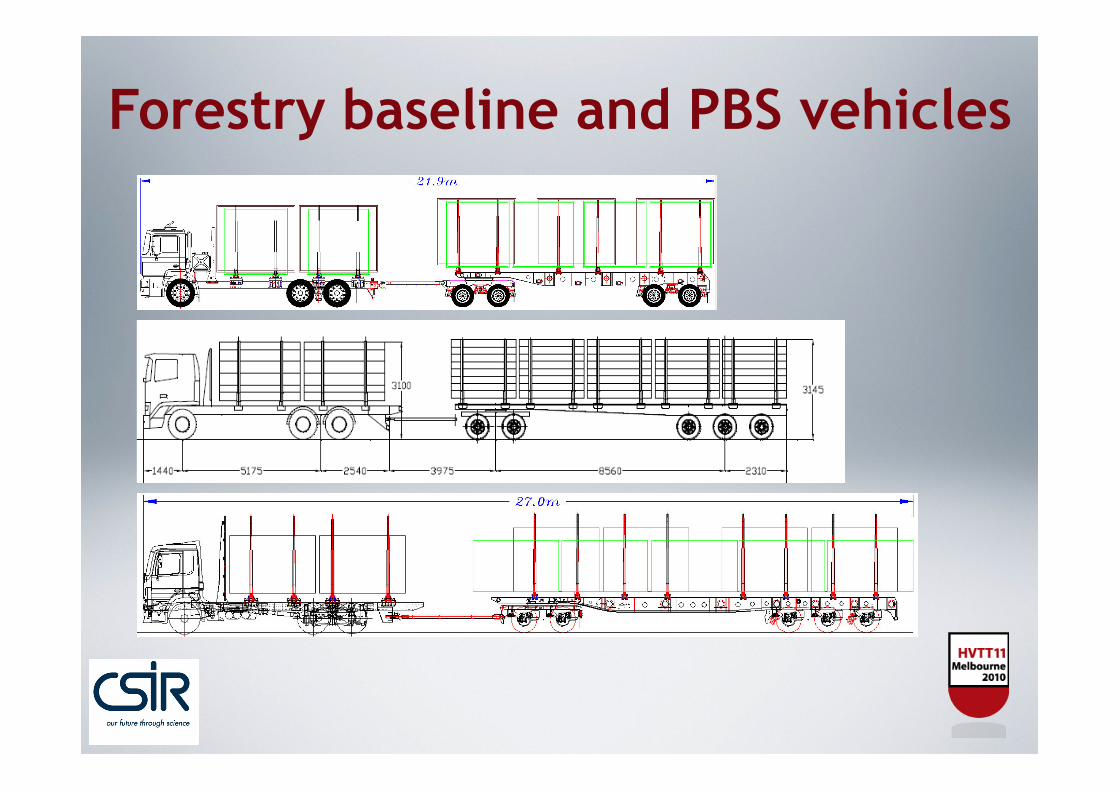
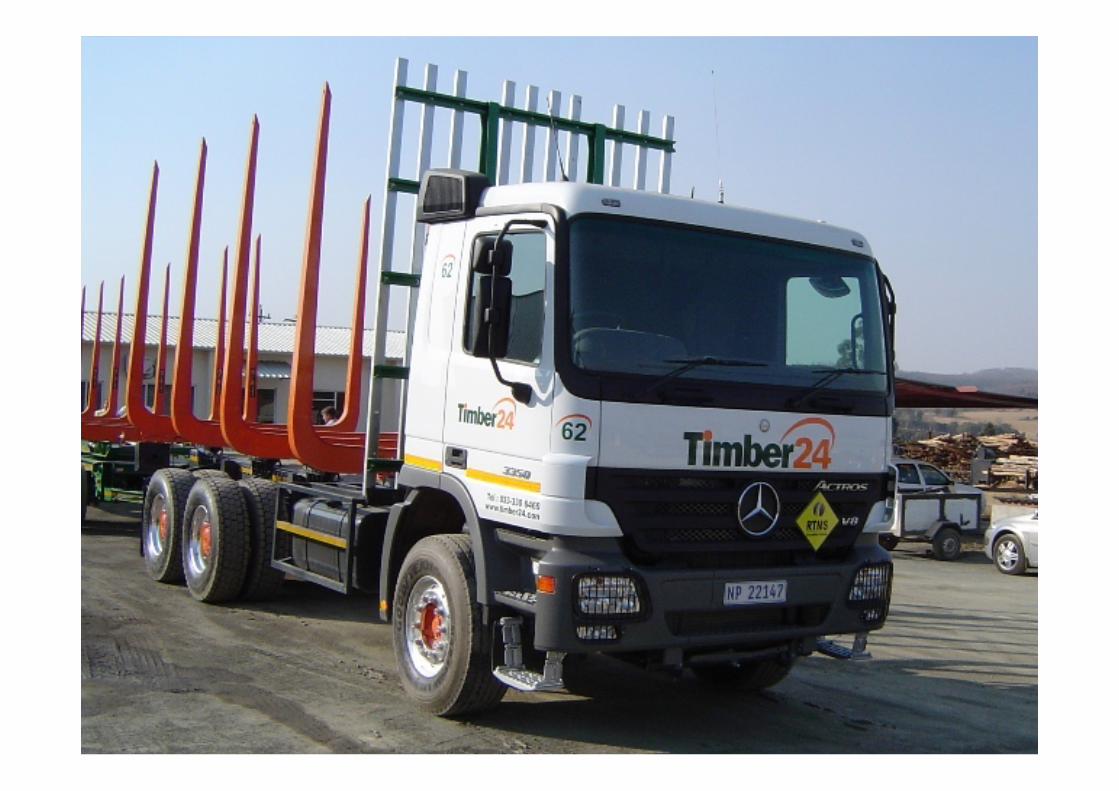
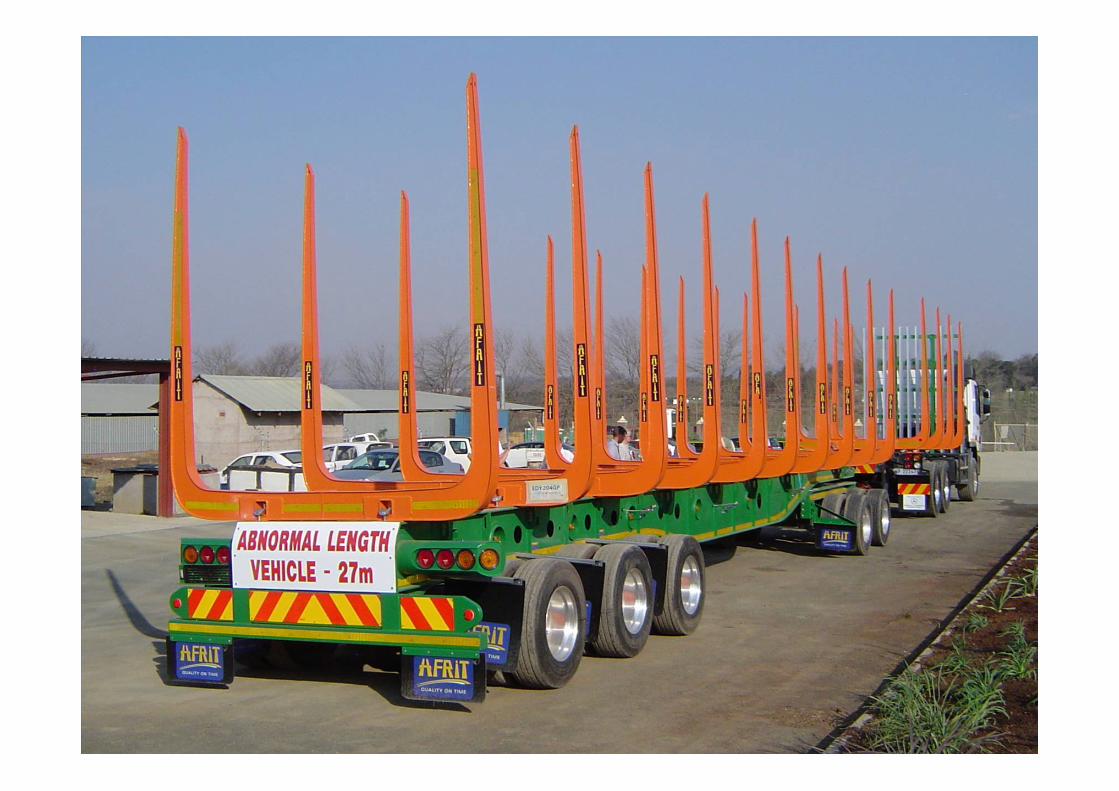
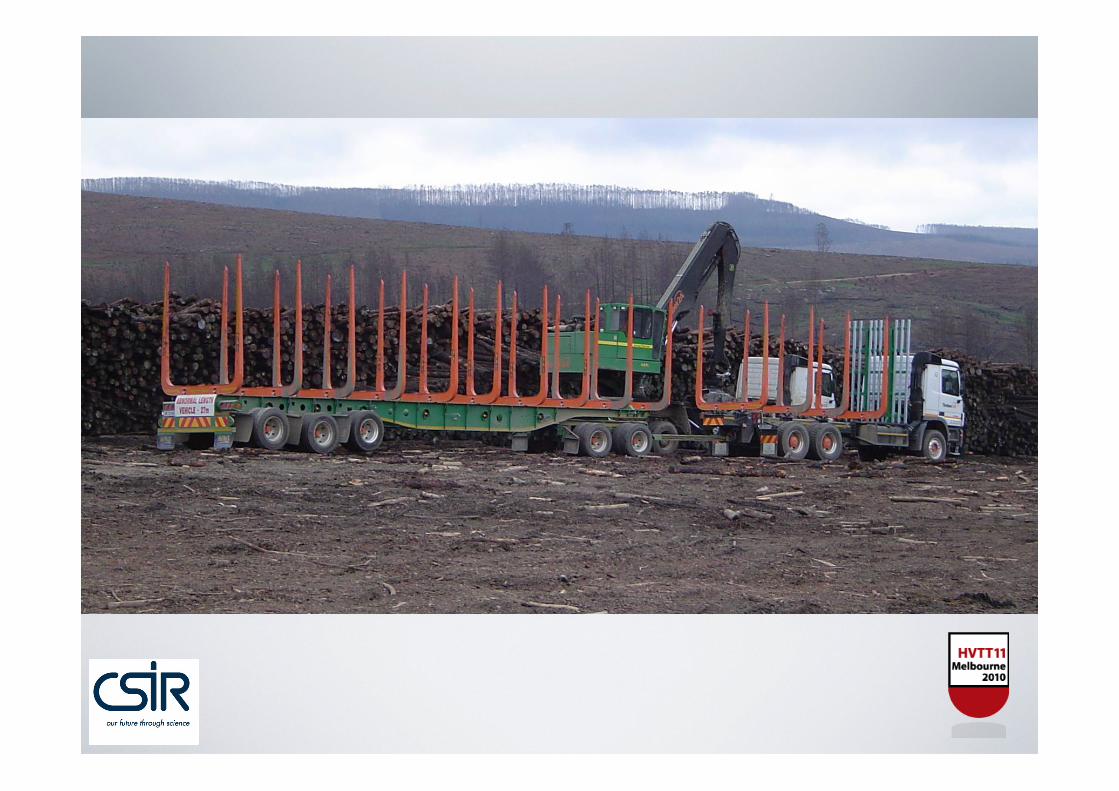
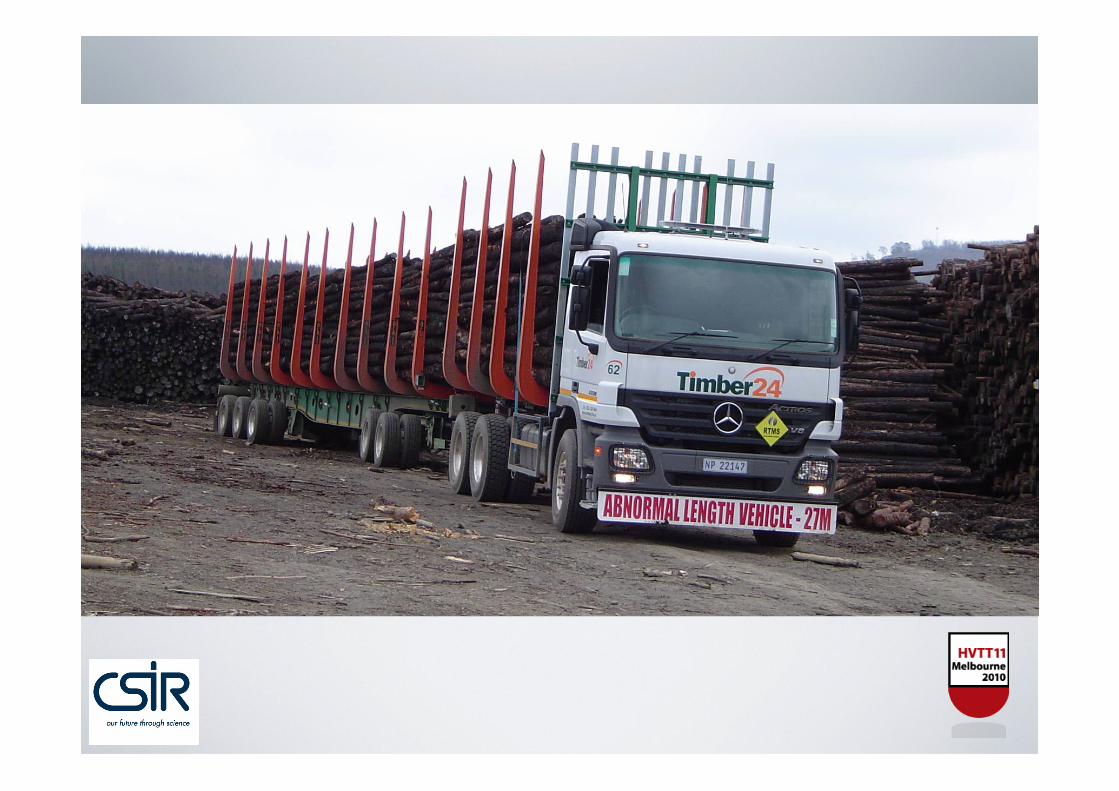
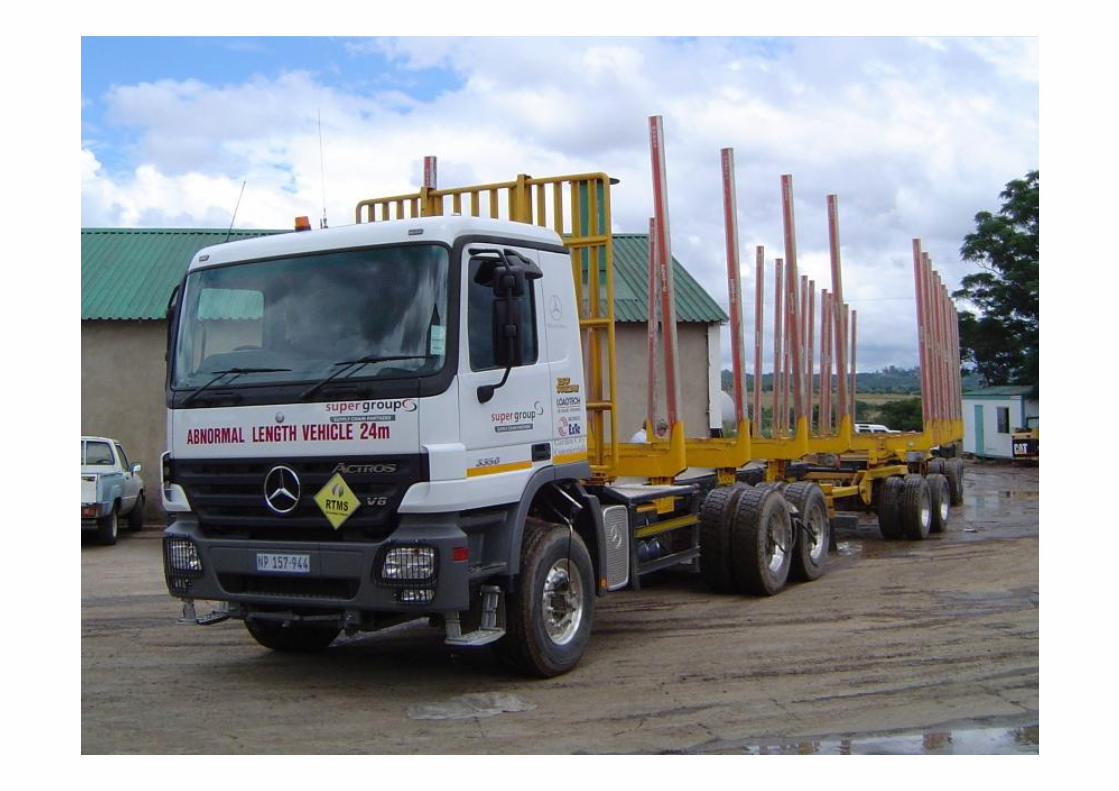
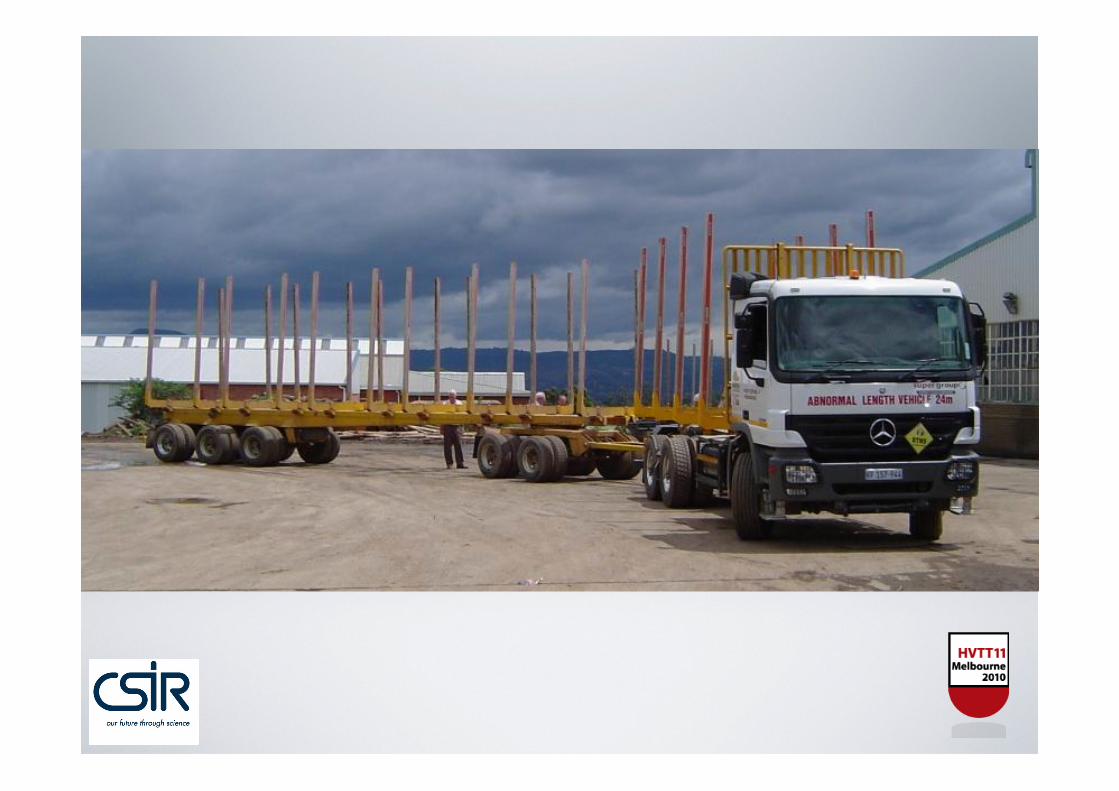
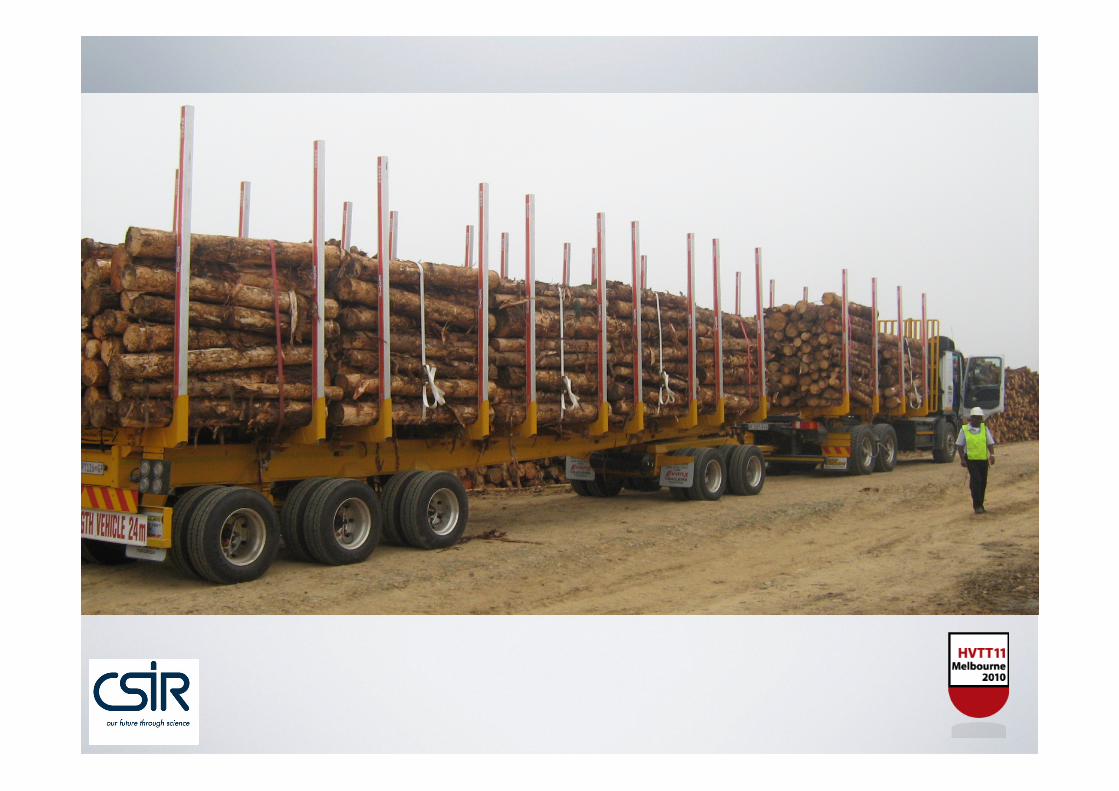
Forestry baseline and PBS vehicles

PBS Lane Change Manoeuvre (SAE J2179)
Source: Mechanical System Dynamics, Melbourne, 2007
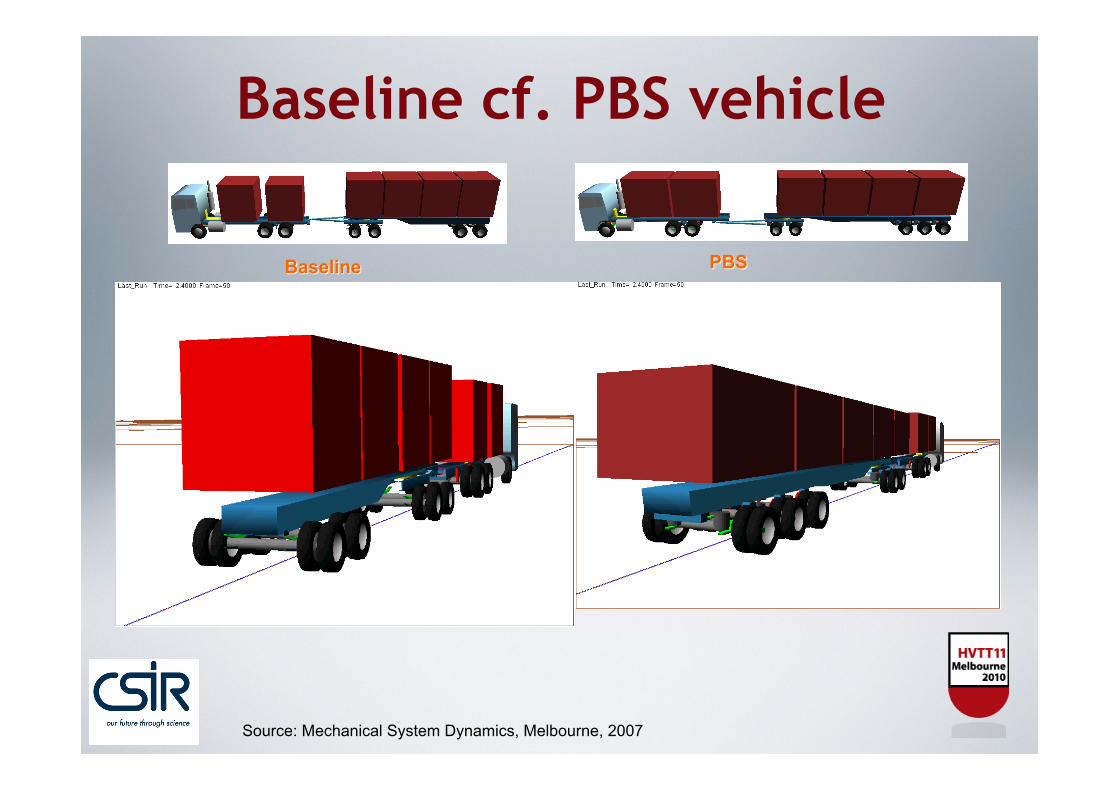
Baseline cf. PBS vehicle
Source: Mechanical System Dynamics, Melbourne, 2007
Parameters to Monitor • Distance travelled per month and lead distance per trip
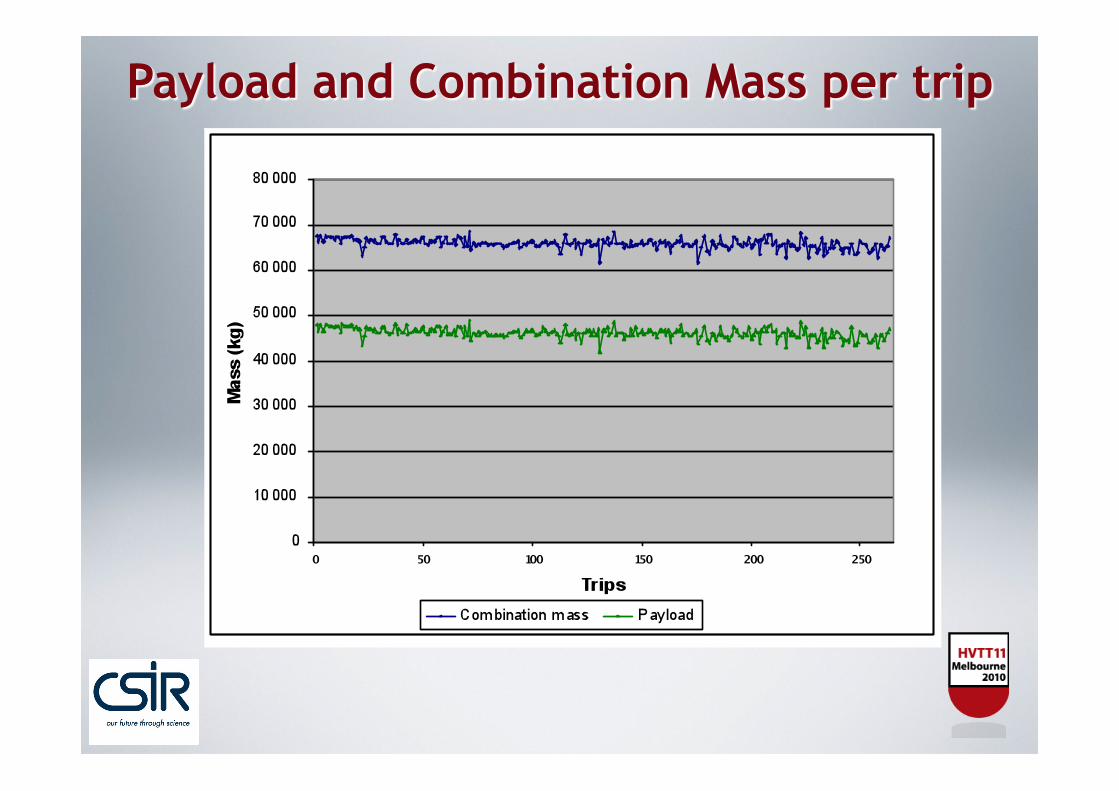
• CombinaHon mass and payload • Average speeds (loaded & unloaded) • Trip duraHon • Fuel consumpHon & efficiency
• Incidents/accidents • Breakdowns • Tyre life and costs • Life cycle of foundaHon brakes • Suspension life • Community reacHon
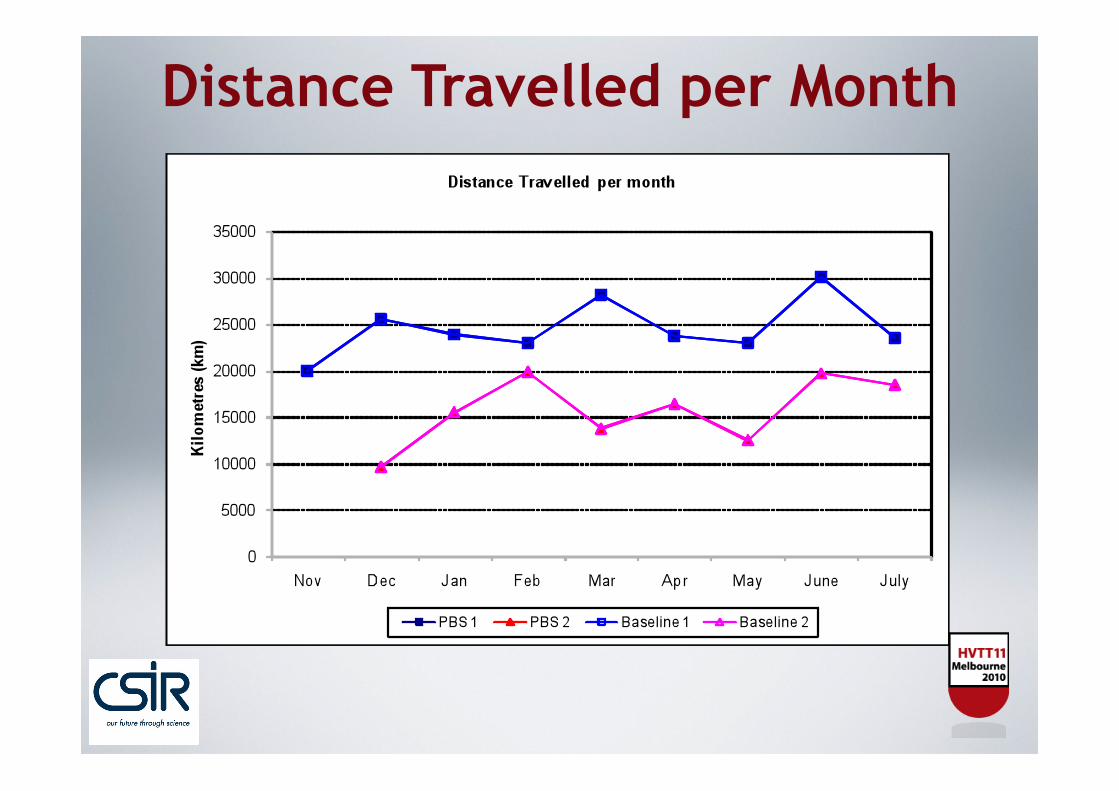
Distance Travelled per Month
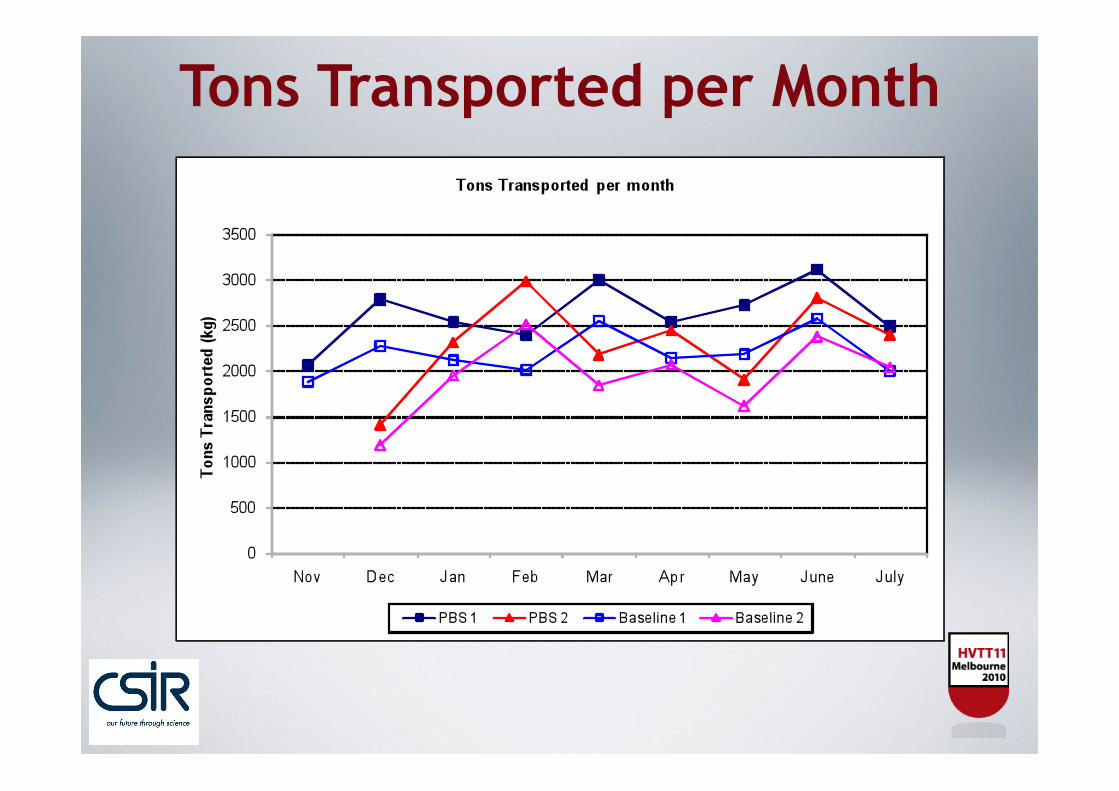
Tons Transported per Month
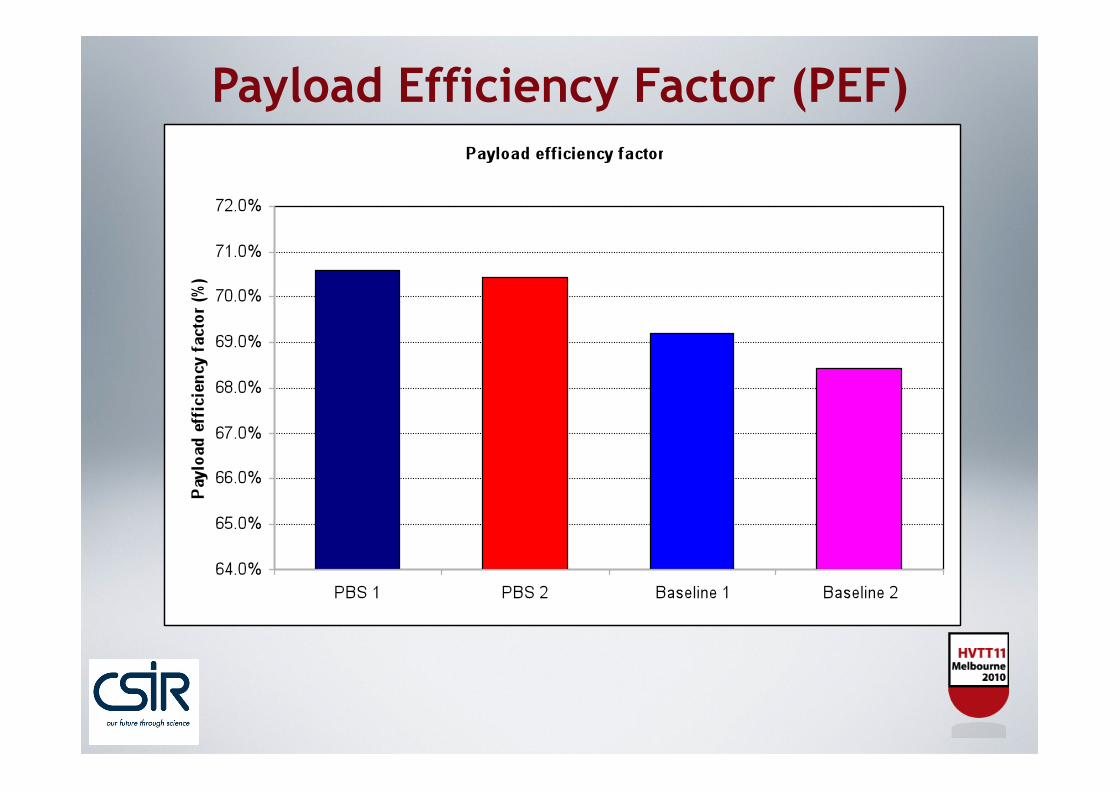
Payload Efficiency Factor (PEF)
© CSIR 2008 www.csir.co.za
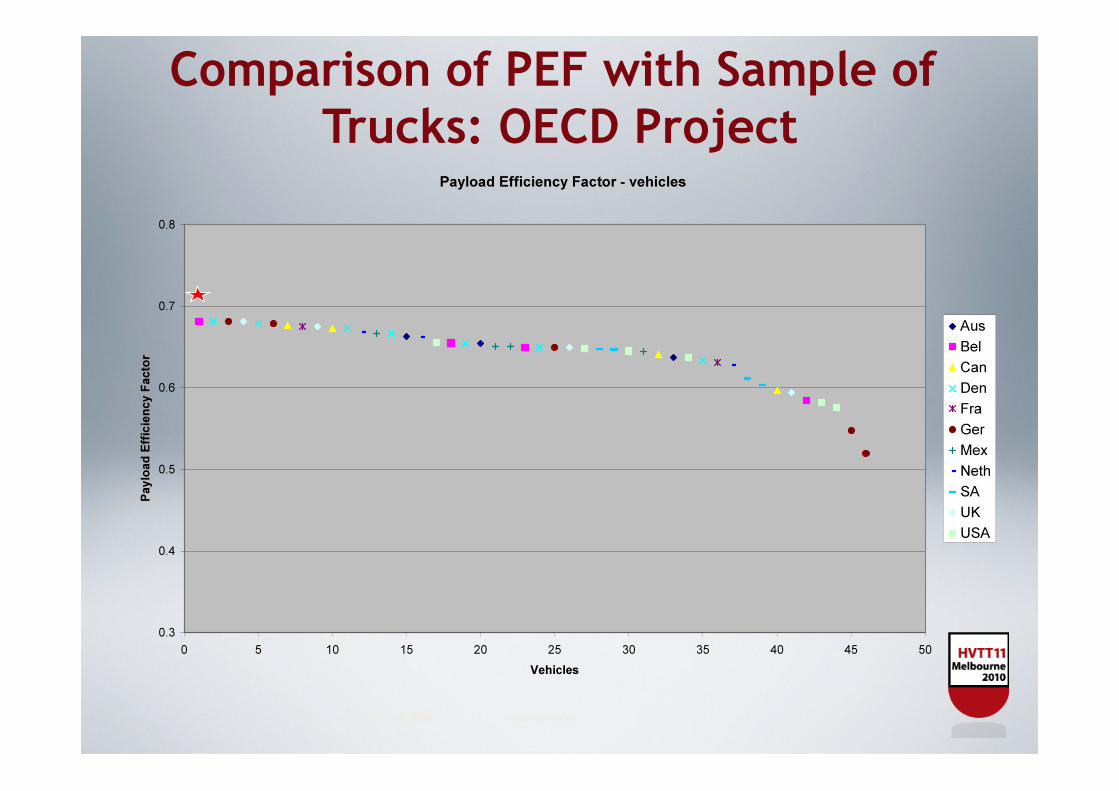
Comparison of PEF with Sample of Trucks: OECD Project
Slide# 22
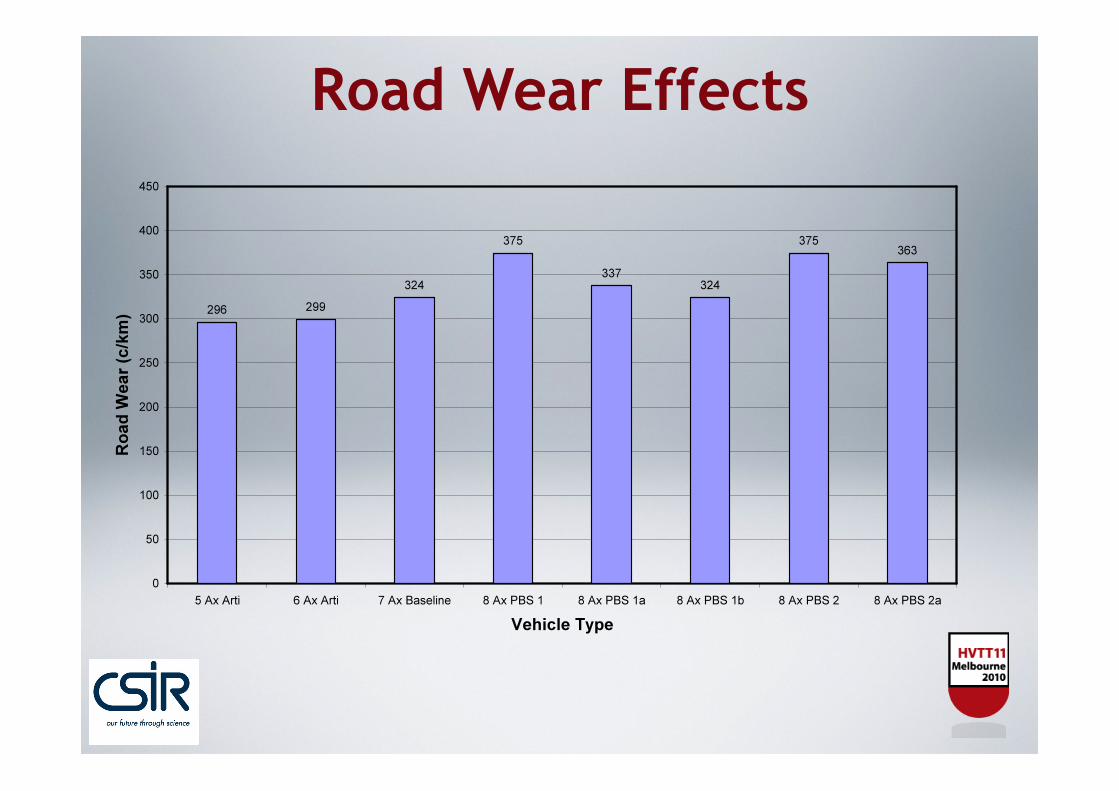
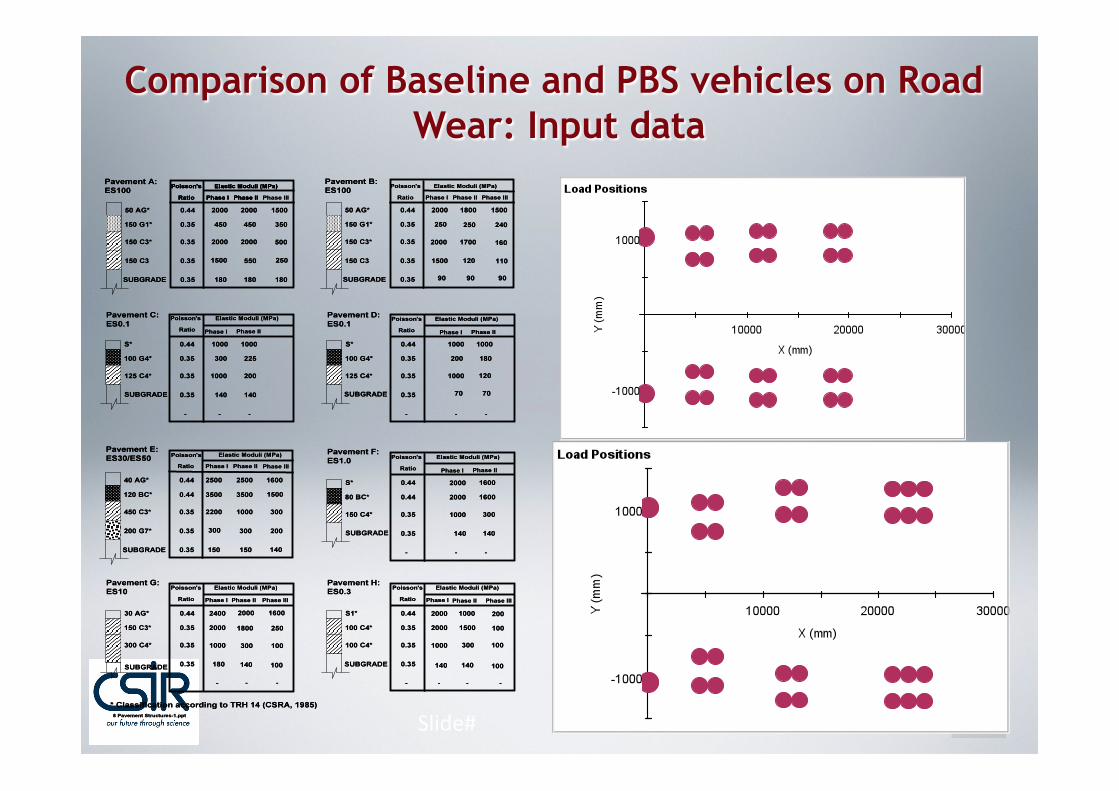
Road Wear Effects
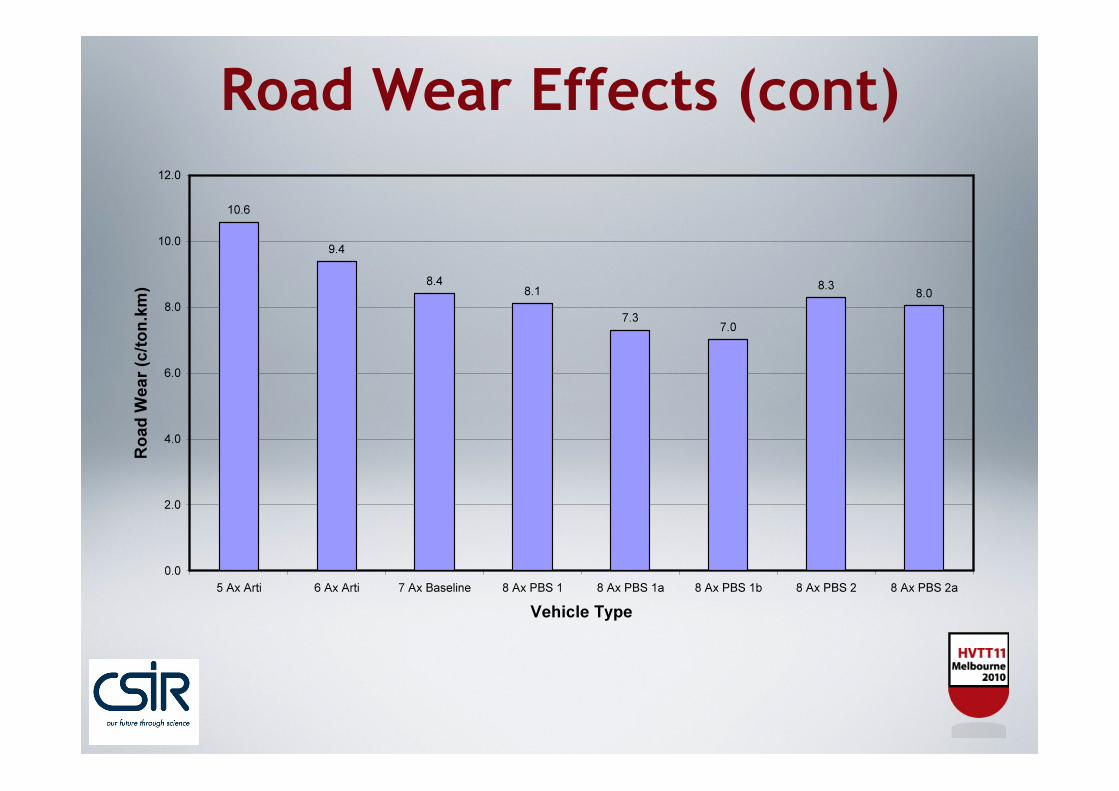
Road Wear Effects (cont)
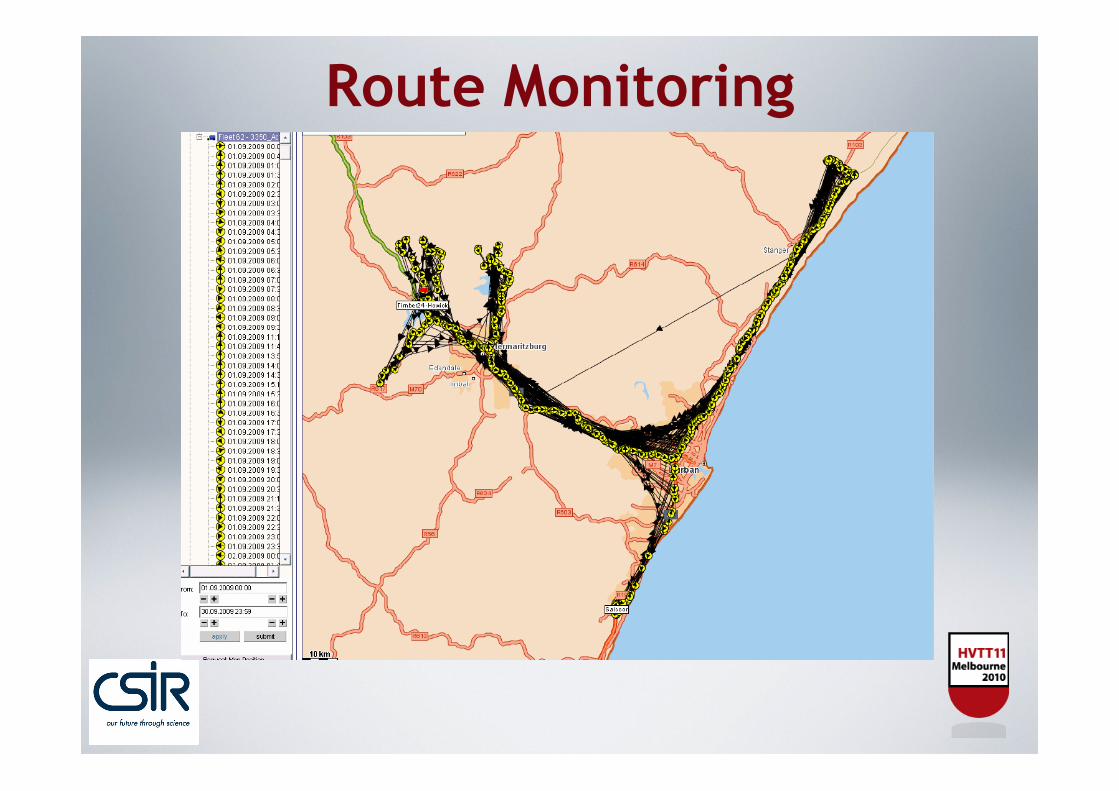
Route Monitoring
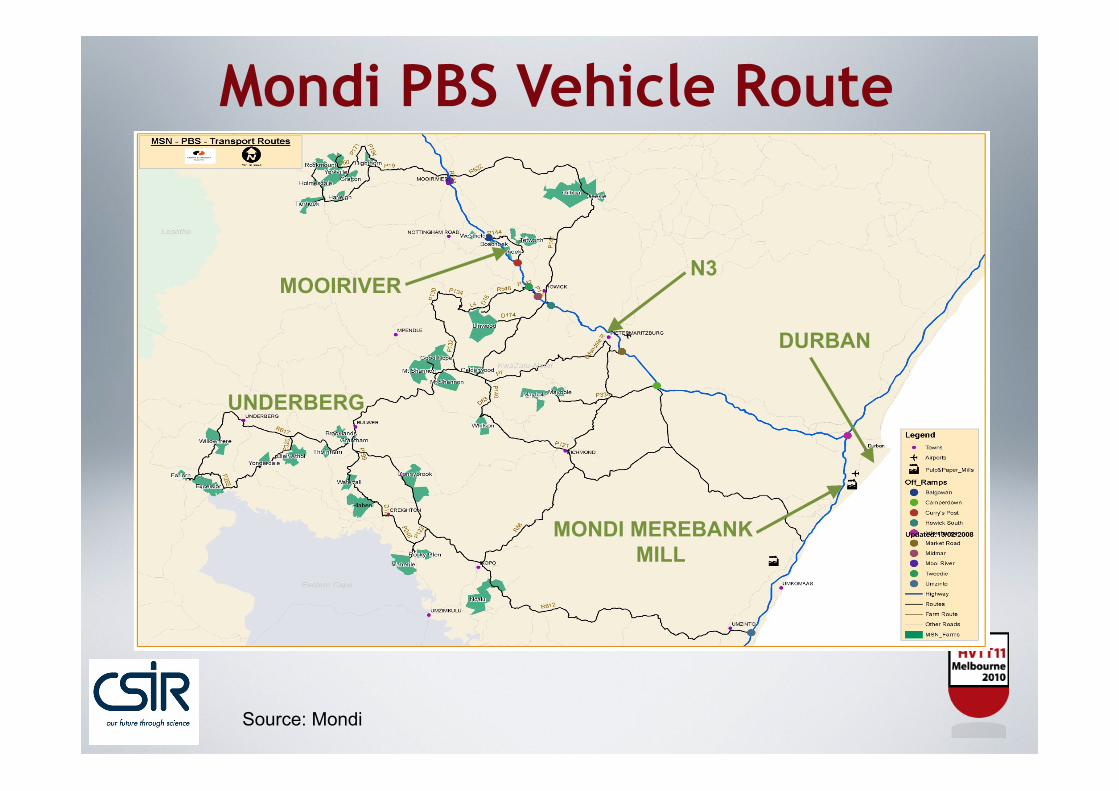
MONDI MEREBANK MILL
DURBAN
N3
UNDERBERG
MOOIRIVER
Mondi PBS Vehicle Route
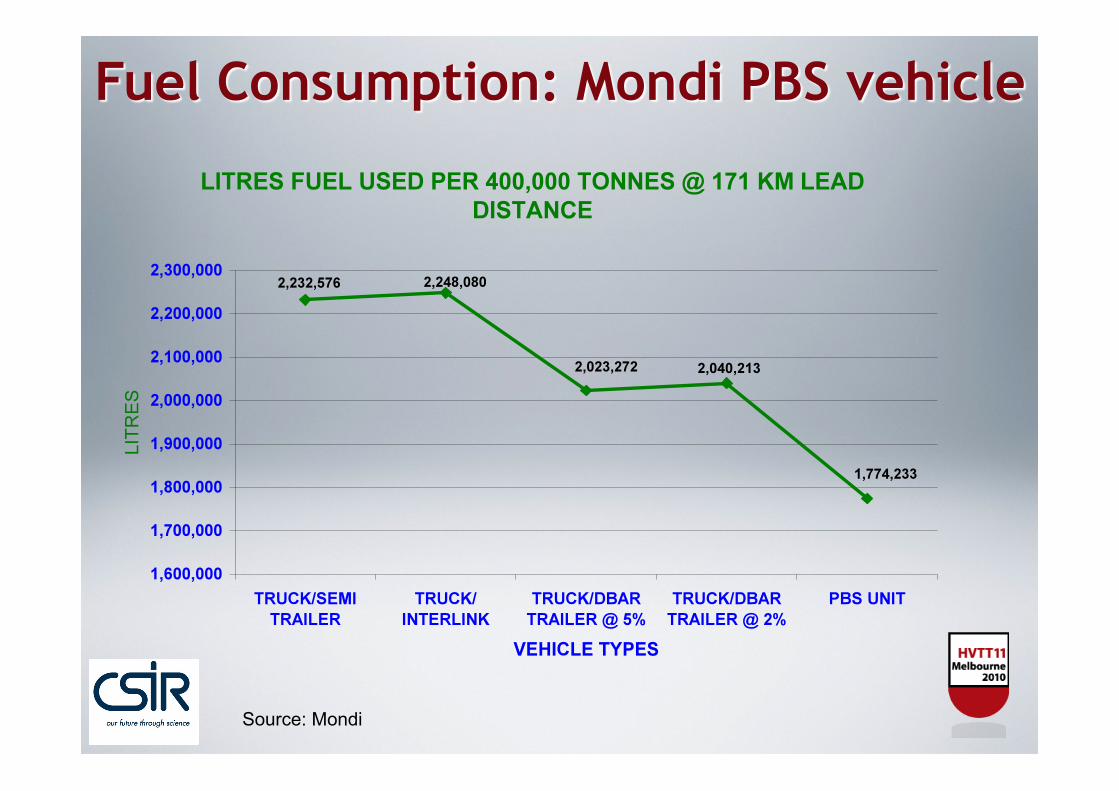
Source: Mondi
Source: Mondi
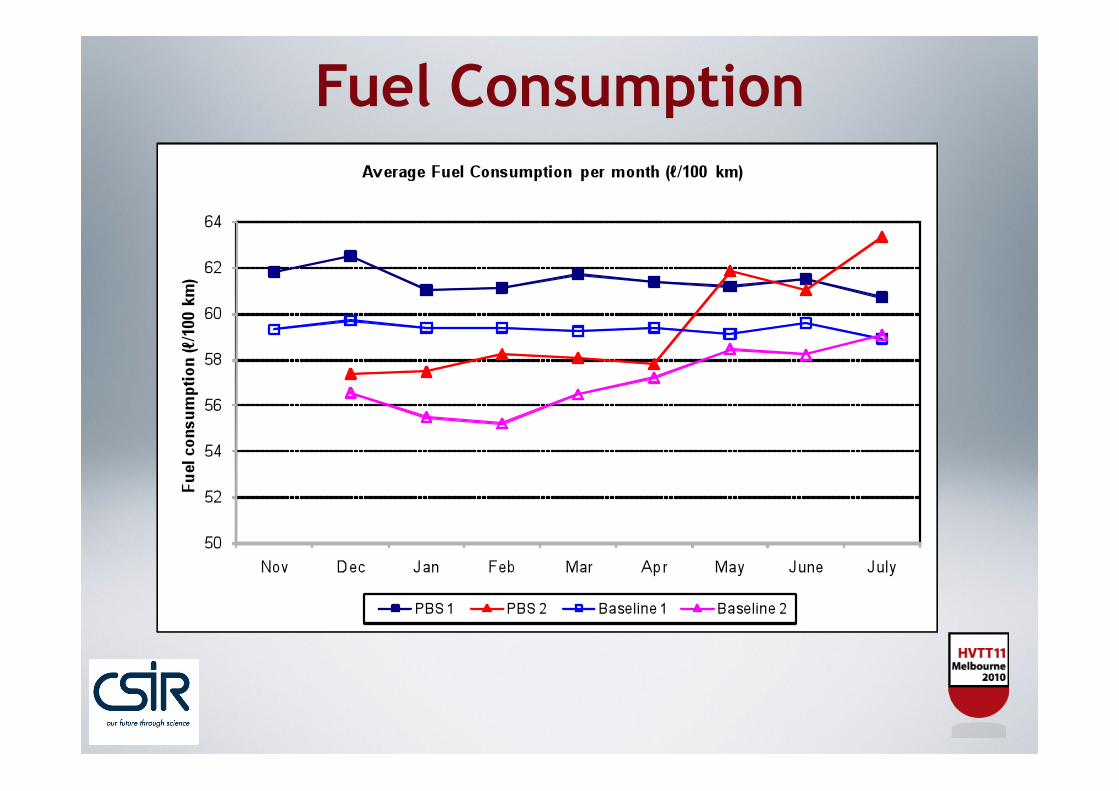
Fuel Consumption
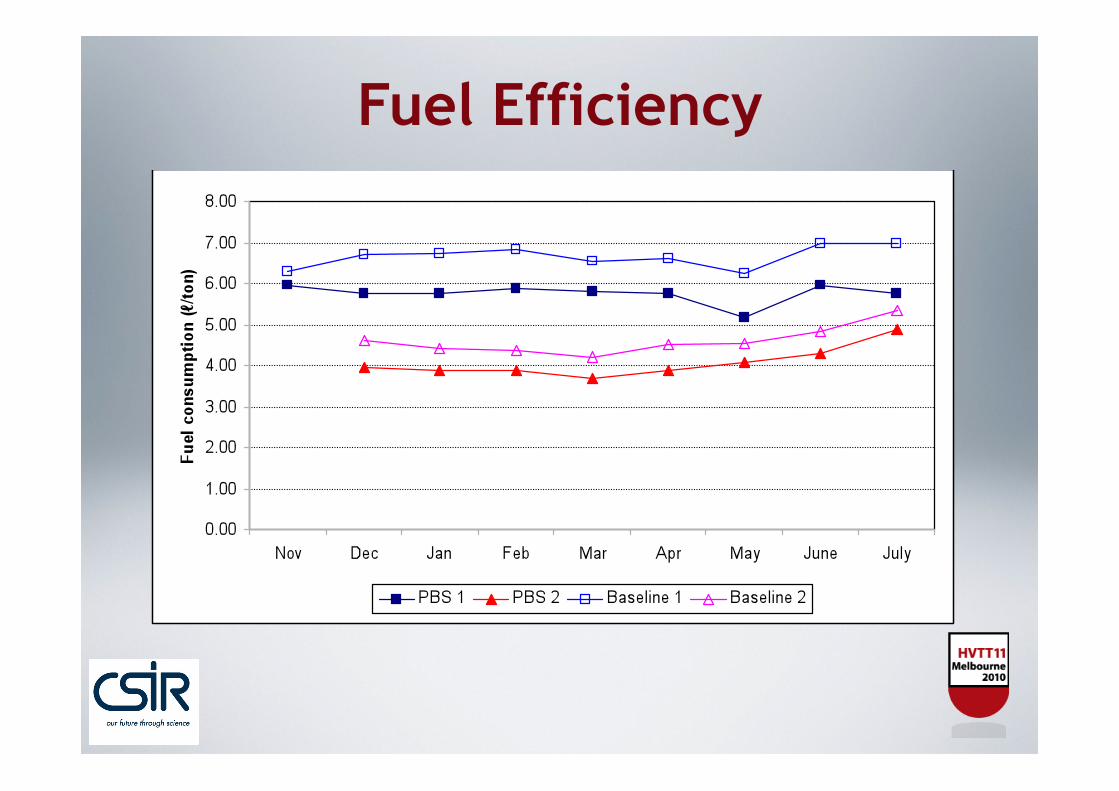
Fuel Efficiency
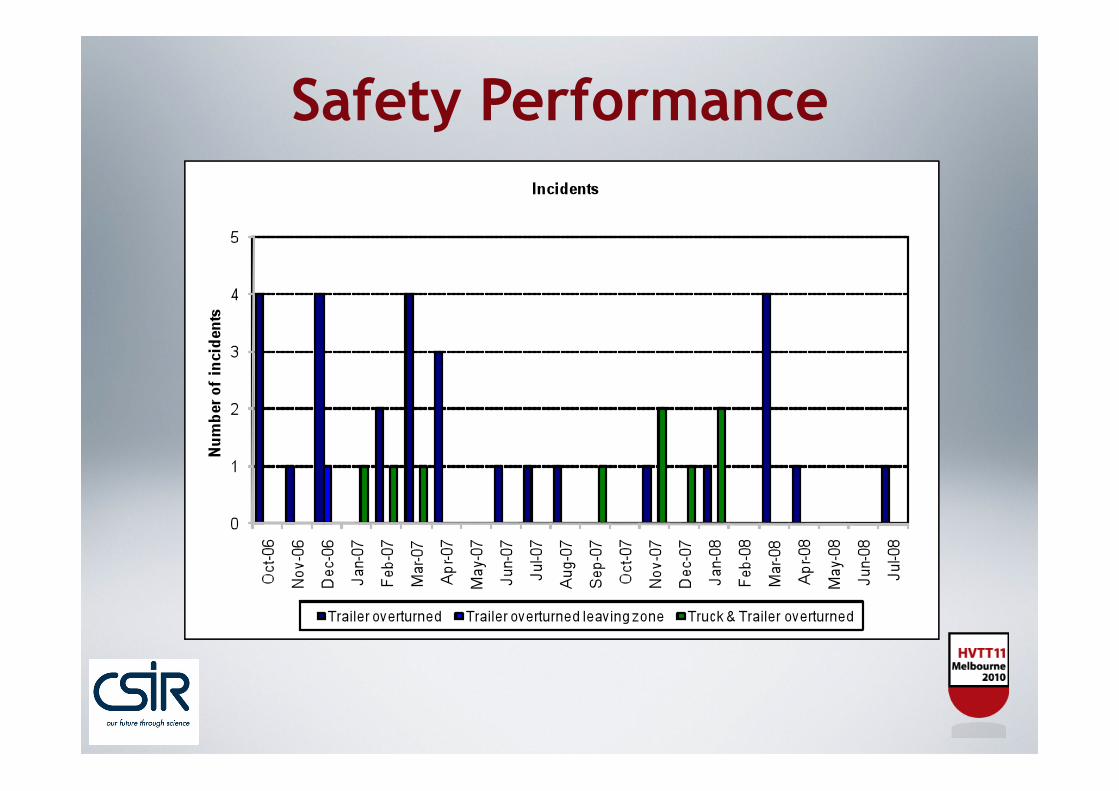
Safety Performance

Slide# 31
Summary of Performance Outcomes
Performance indicator Measured result
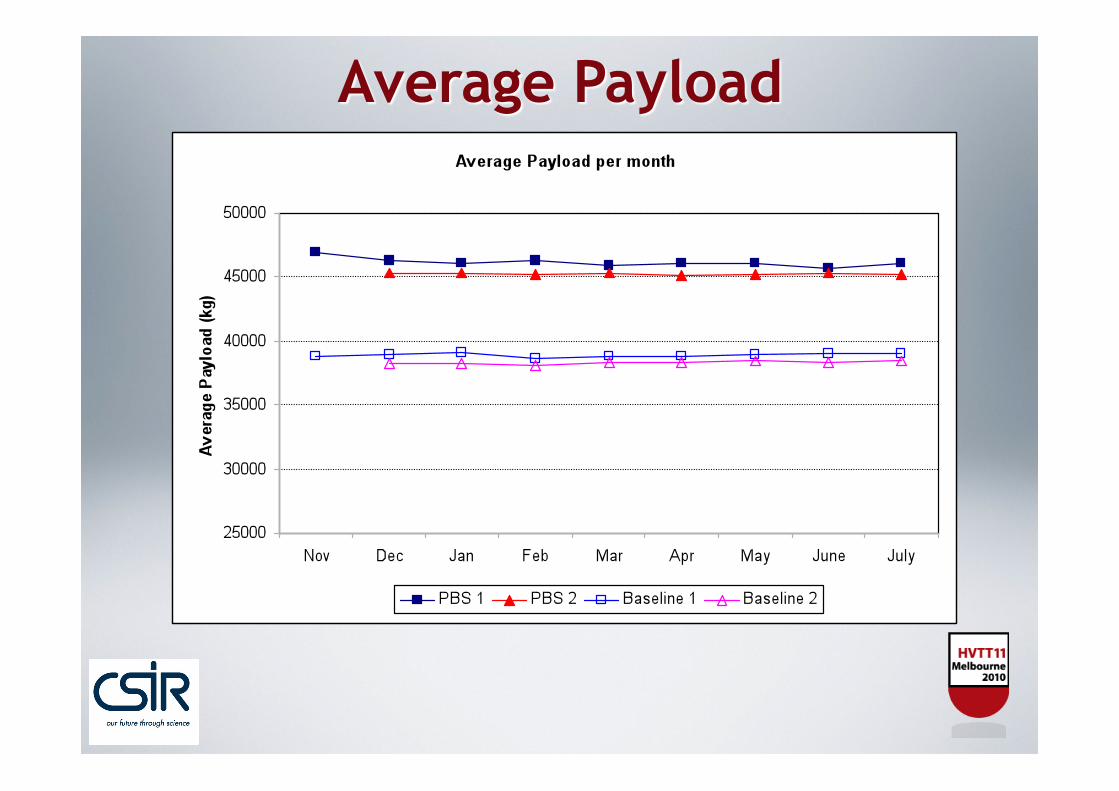
Payload Average improvement: 19.3 %
Payload Efficiency Factor Increase from 69.3 % to 70.5 %
Tons transported per month Average increase: 19.3 %
Fuel efficiency Average savings: 12.7 %
Fuel savings (based on 700 000 tons/annum contract) 485 000 litres per annum
Fleet size Reduction of 17 %
Incident/accidents* Reduction from 3.1 to 1.1 per month
CO2 emissions (based on 700 000 tons/annum contract)
Reduction of 1 280 tons of CO2 per annum
Road wear Reduction varies from 2 to 23 %
*Based on a fleet of 45 new vehicle combinations incorporating a number of PBS design features
Two vehicles, 8 months operation
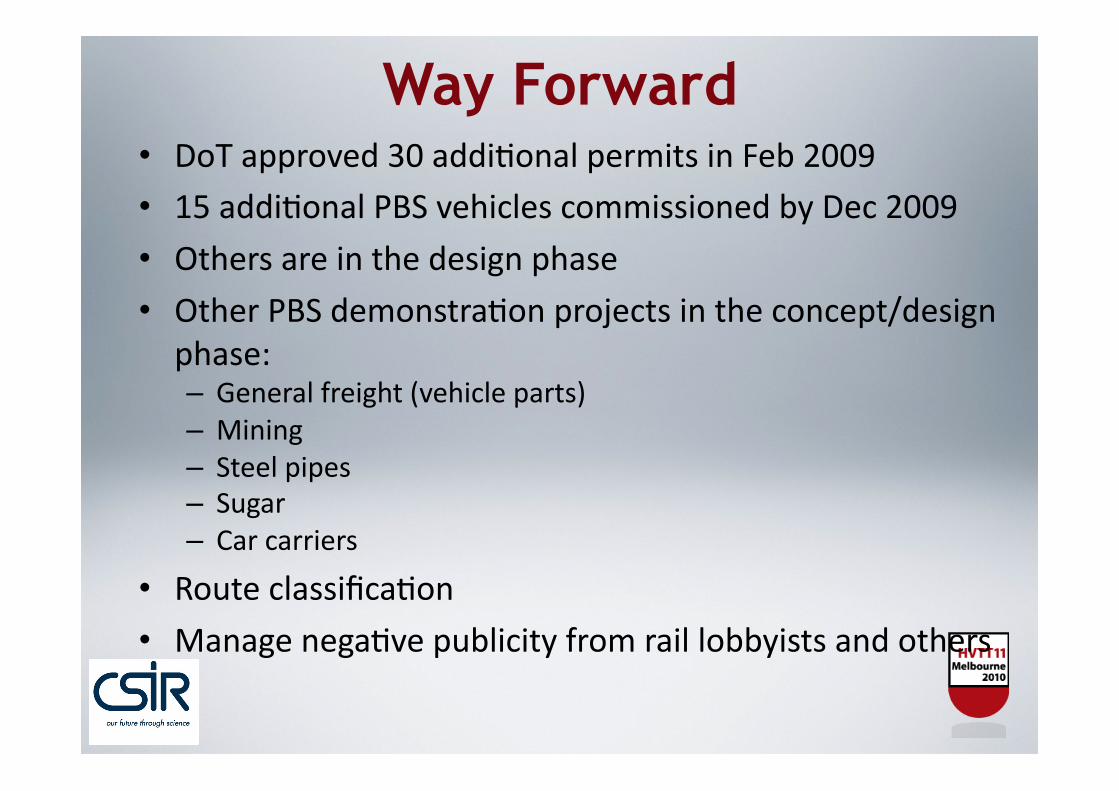
Way Forward • DoT approved 30 addiHonal permits in Feb 2009 • 15 addiHonal PBS vehicles commissioned by Dec 2009
• Others are in the design phase • Other PBS demonstraHon projects in the concept/design phase: – General freight (vehicle parts) – Mining – Steel pipes – Sugar – Car carriers
• Route classificaHon • Manage negaHve publicity from rail lobbyists and others
Acknowledgements • Department of Transport • KwaZulu-‐Natal Department of Transport
• Mondi
• Sappi • NaHonal Transport Commission
• VicRoads • Queensland Transport • RoadUser • Mechanical System Dynamics • ARRB
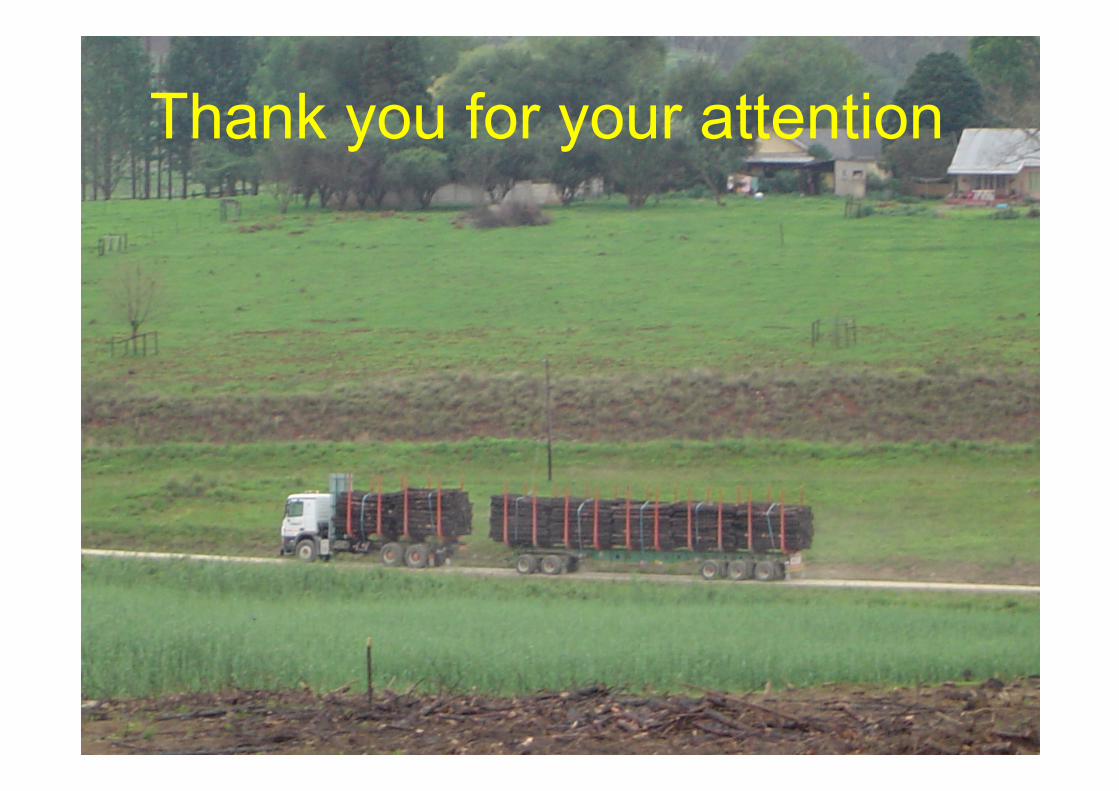
Thank you for your attention


![User Manual - Analog Metricanalogmetric.com/download/2A3 PP Amplifier User Manual.pdf · [2A3 Push-Pull Tube Amplifier ] Analog Metric 6 5. If no any abnormal events, turn off the](https://img.dokumen.tips/doc/110x75/5ae78f757f8b9a87048f854e/user-manual-analog-pp-amplifier-user-manualpdf2a3-push-pull-tube-amplifier-.jpg)


![Poster Indesign (2A3) - NVvPM · 2020. 11. 7. · Poster_Indesign (2A3).indd 1 07-11-2020 18:20. ZOR N vPM Nederlandse Vereniging voor Praktijk Management VMM].nwpm.com UWZORG ONZEZORG](https://img.dokumen.tips/doc/110x75/61119185ff4697347112a3f7/poster-indesign-2a3-nvvpm-2020-11-7-posterindesign-2a3indd-1-07-11-2020.jpg)


![[2A3]Big Data Launching Episodes](https://img.dokumen.tips/doc/110x75/547ed1625906b5d8718b4726/2a3big-data-launching-episodes.jpg)

