Embed Size (px)
Citation preview

Asphalt Characterization
Utilizing Gel Permeation Chromatography (GPC)
1William Daly, 1Ionela Glover, 1Ioan Negulescu, 2Christopher Abadie,1,2Louay Mohammad, and
1Rafael Cueto1 Louisiana State University and
2Louisiana Transportation Research CenterBaton Rouge, LA

2
The Co-authors
Ionela Glover
Louay Mohammad Rafael Cueto
Chris AbadieIoan Negulescu
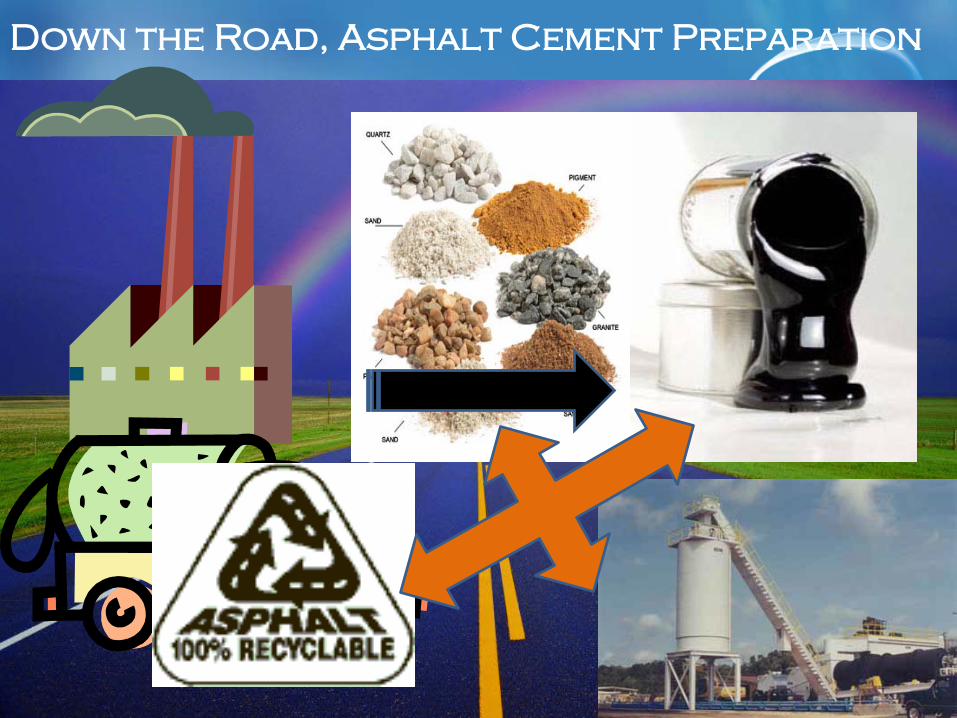
Down the Road, Asphalt Cement Preparation
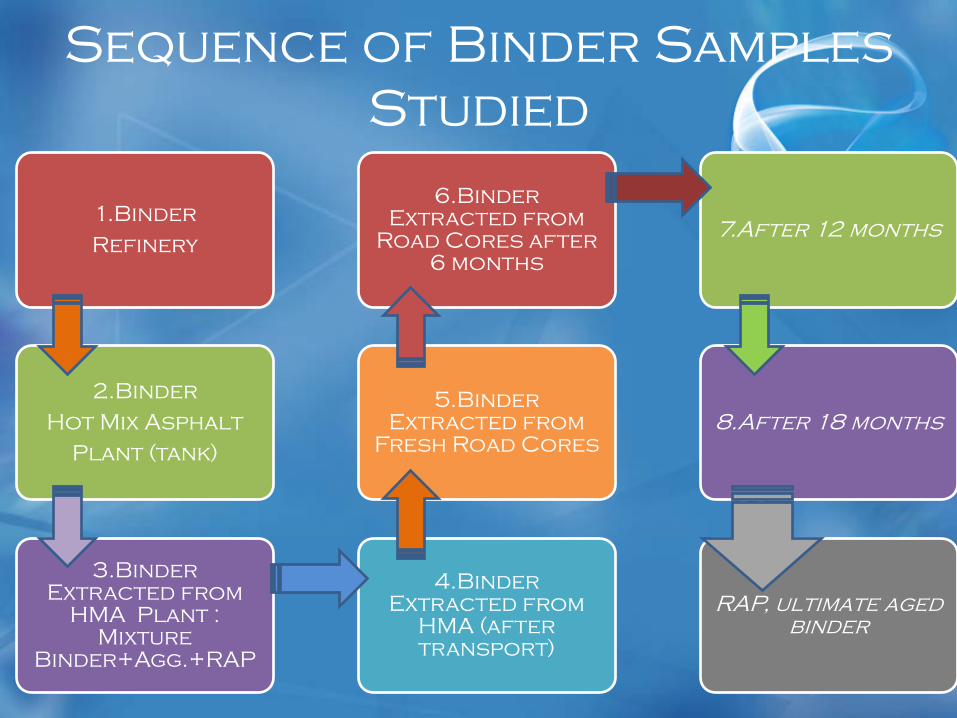
Sequence of Binder Samples Studied
1.BinderRefinery
2.Binder Hot Mix Asphalt
Plant (tank)
3.Binder Extracted from
HMA Plant : Mixture
Binder+Agg.+RAP
4.Binder Extracted from
HMA (after transport)
5.Binder Extracted from
Fresh Road Cores
6.Binder Extracted from
Road Cores after 6 months
7.After 12 months
8.After 18 months
RAP, ultimate aged binder
5
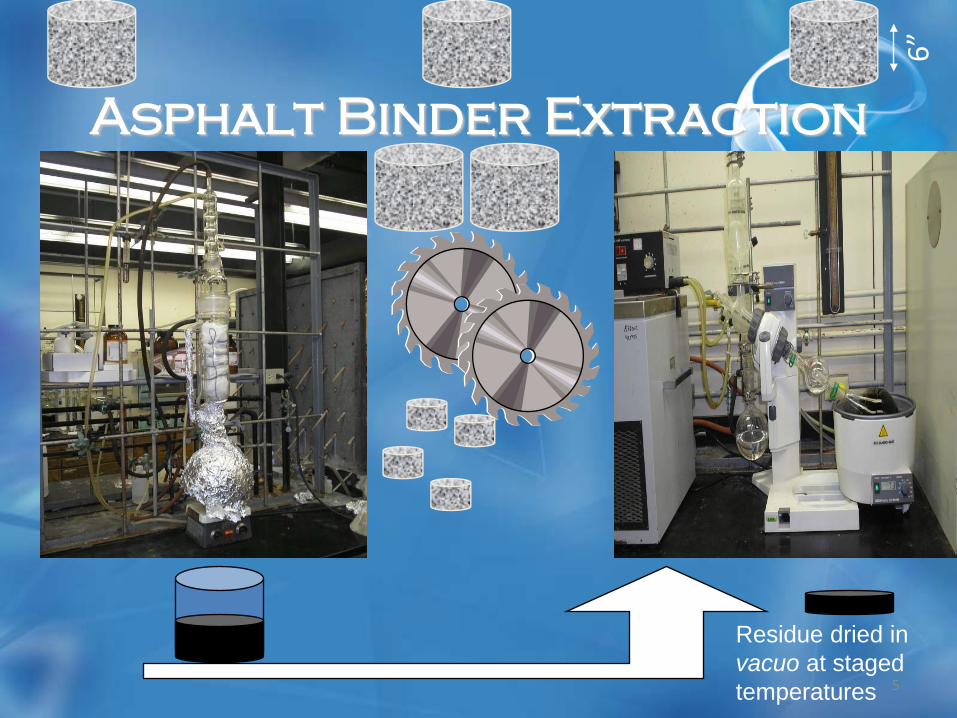
Asphalt Binder Extraction
6”
Residue dried in vacuo at staged temperatures
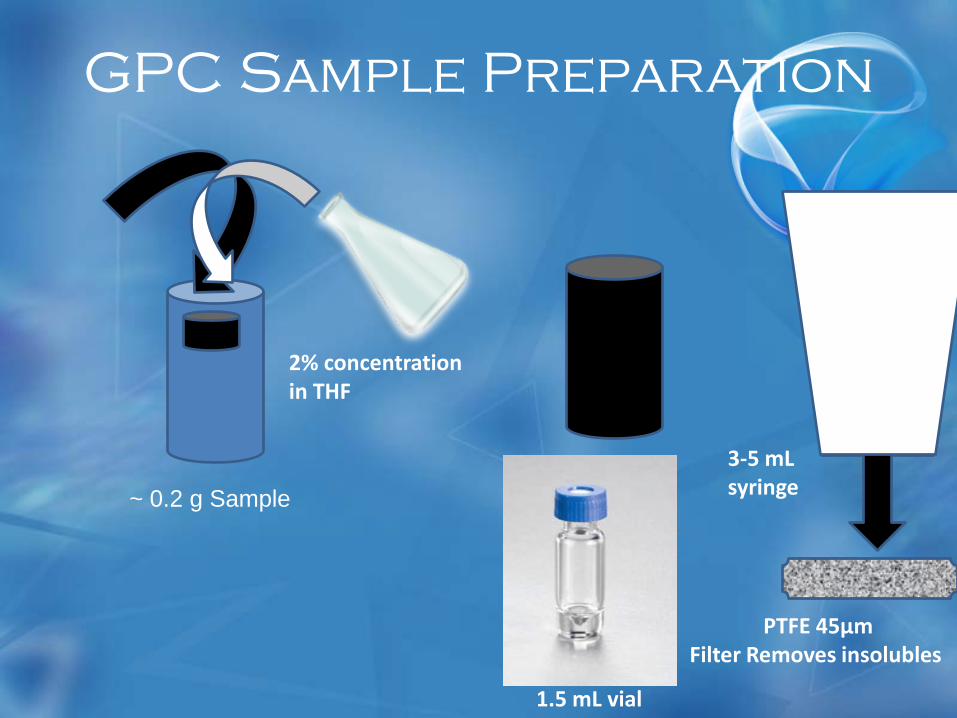
GPC Sample Preparation
2% concentrationin THF
3-5 mLsyringe
PTFE 45µmFilter Removes insolubles
1.5 mL vial
~ 0.2 g Sample
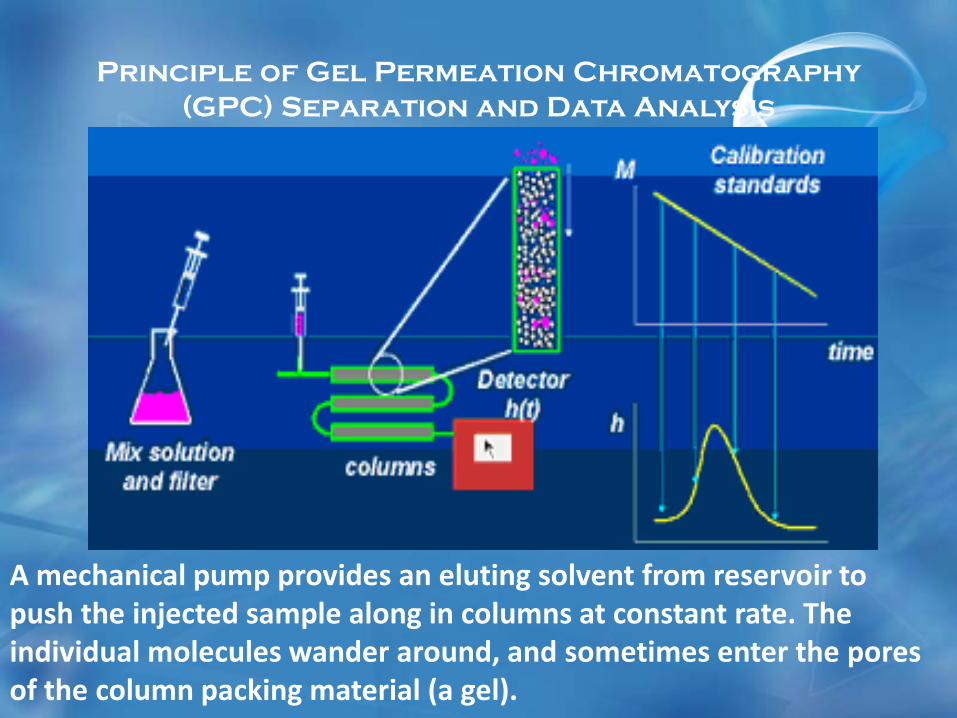
Principle of Gel Permeation Chromatography (GPC) Separation and Data Analysis
A mechanical pump provides an eluting solvent from reservoir to push the injected sample along in columns at constant rate. The individual molecules wander around, and sometimes enter the pores of the column packing material (a gel).
8
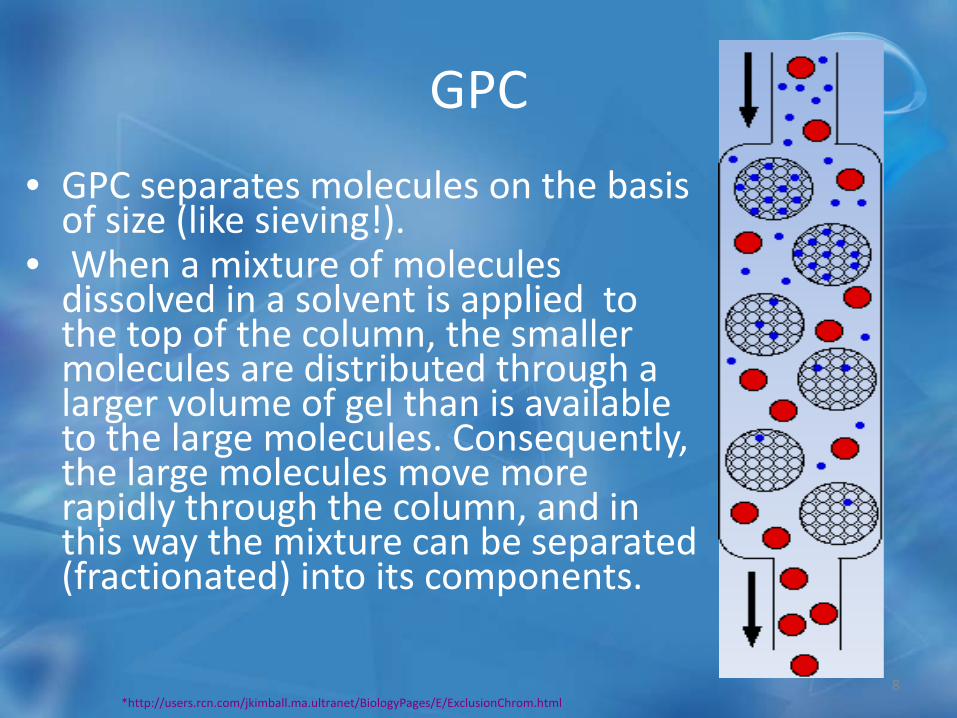
GPC
• GPC separates molecules on the basis of size (like sieving!).
• When a mixture of molecules dissolved in a solvent is applied to the top of the column, the smaller molecules are distributed through a larger volume of gel than is available to the large molecules. Consequently, the large molecules move more rapidly through the column, and in this way the mixture can be separated (fractionated) into its components.
*http://users.rcn.com/jkimball.ma.ultranet/BiologyPages/E/ExclusionChrom.html
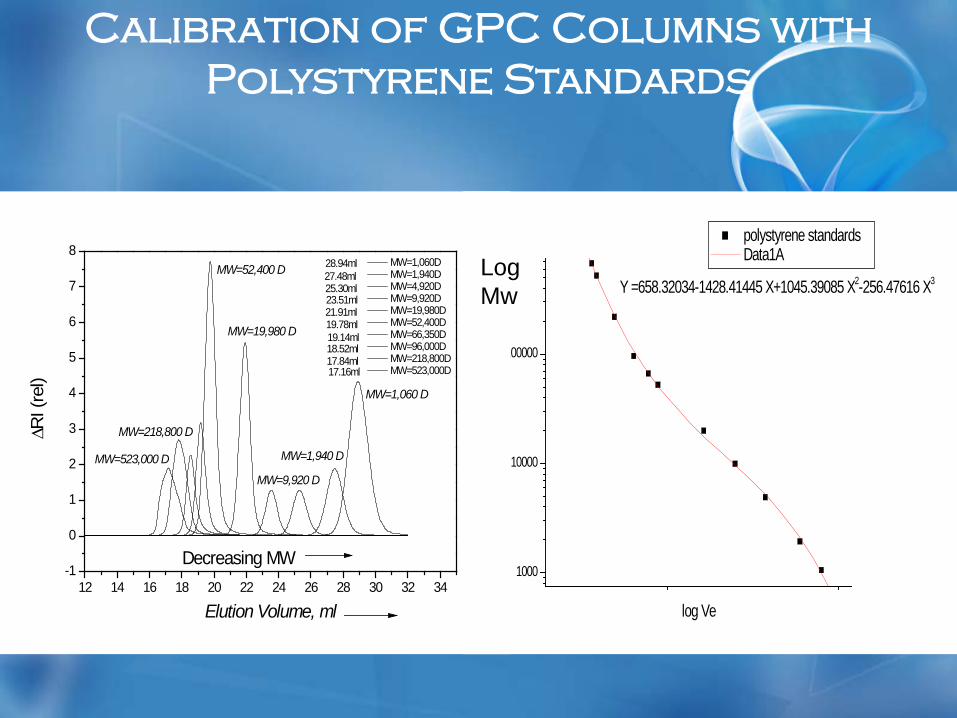
Calibration of GPC Columns with Polystyrene Standards
1000
10000
100000
Y =658.32034-1428.41445 X+1045.39085 X2-256.47616 X3
log M
w
log Ve
polystyrene standards Data1A
12 14 16 18 20 22 24 26 28 30 32 34-1
0
1
2
3
4
5
6
7
8
MW=1,940 D
MW=9,920 D
MW=218,800 D
MW=52,400 D
MW=19,980 D
MW=523,000 D
17.16ml17.84ml18.52ml19.14ml19.78ml
23.51ml21.91ml
25.30ml27.48ml
∆RI (
rel)
Elution Volume, ml
MW=1,060D MW=1,940D MW=4,920D MW=9,920D MW=19,980D MW=52,400D MW=66,350D MW=96,000D MW=218,800D MW=523,000D
28.94ml
MW=1,060 D
Decreasing MW
Log Mw
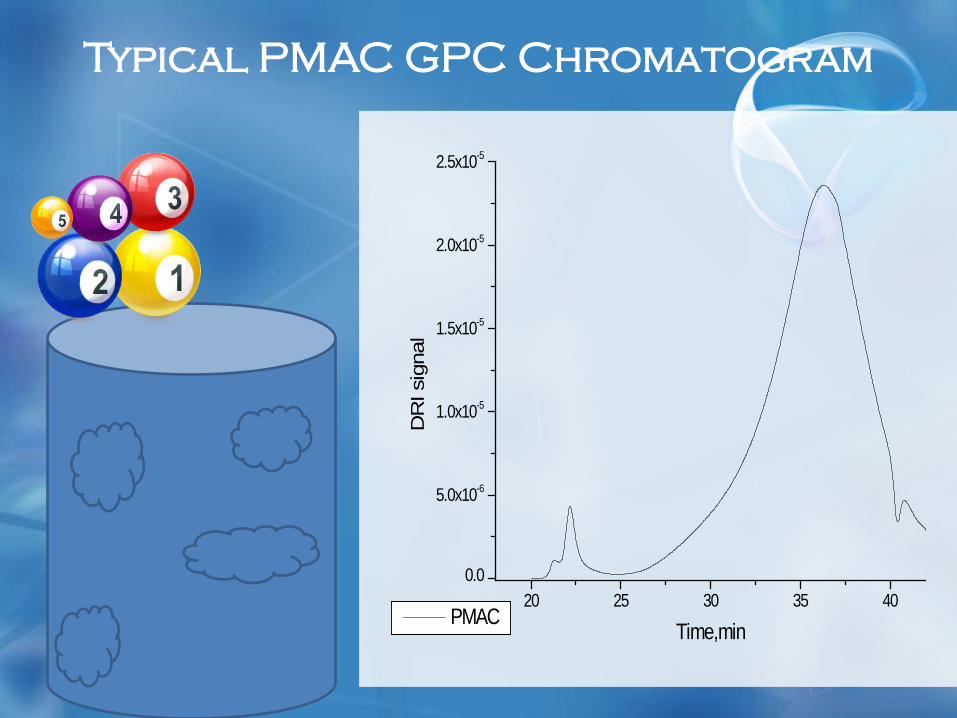
Typical PMAC GPC Chromatogram
20 25 30 35 400.0
5.0x10⁻⁶
1.0x10⁻⁵
1.5x10⁻⁵
2.0x10⁻⁵
2.5x10⁻⁵
DR
I sig
nal
Time,min PMAC
11
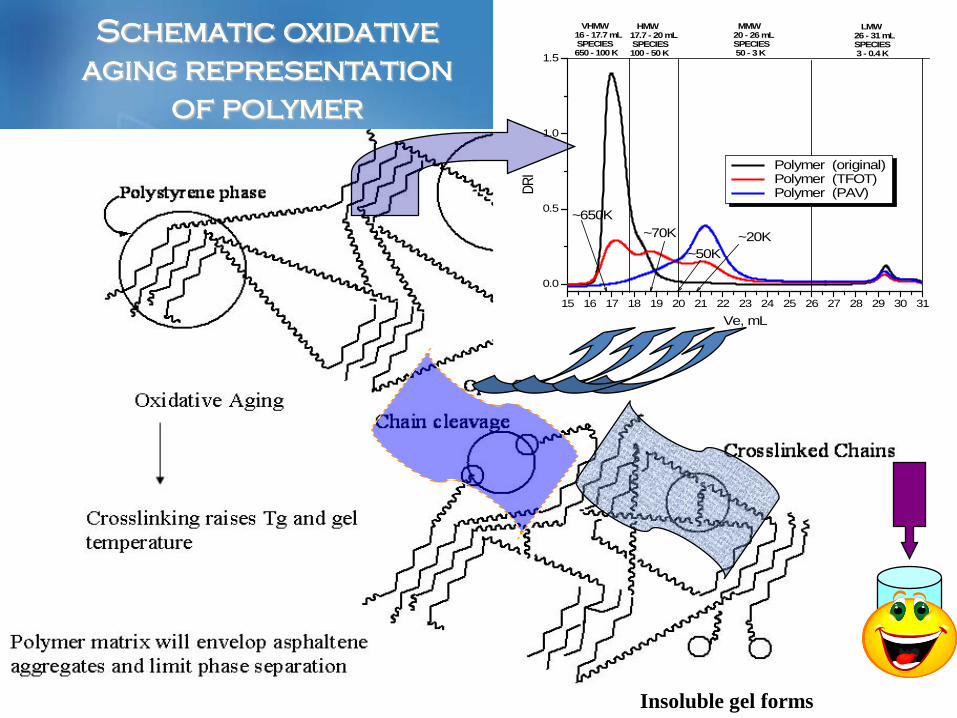
Schematic oxidative aging representation
of polymer
15 16 17 18 19 20 21 22 23 24 25 26 27 28 29 30 31
0.0
0.5
1.0
1.5
~650K
HMW 17.7 - 20 mL SPECIES 100 - 50 K
LMW 26 - 31 mL SPECIES 3 - 0.4 K
MMW 20 - 26 mL SPECIES 50 - 3 K
VHMW 16 - 17.7 mL SPECIES 650 - 100 K
~50K~70K ~20K
DRI
Ve, mL
Polymer (original) Polymer (TFOT) Polymer (PAV)
Insoluble gel forms

During Aging Displacement of Maltenes Leads to Asphaltene aggregation
13
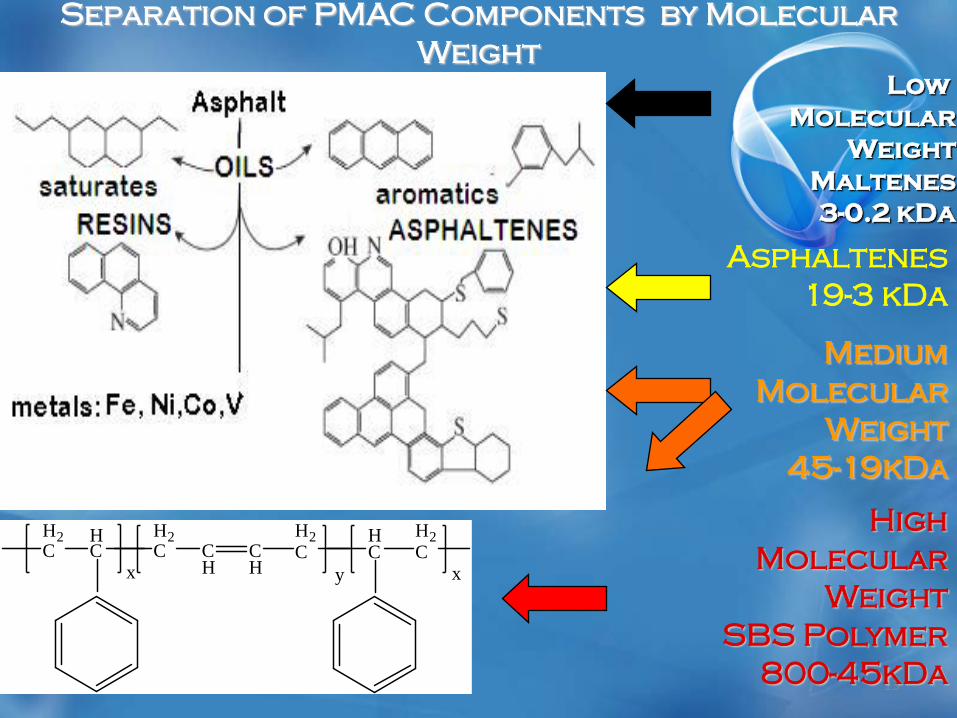
Separation of PMAC Components by Molecular Weight
H2C C
H
H2C
HC
x
HC
H2CC
H
H2C
y x
Low Molecular
WeightMaltenes3-0.2 kDa
MediumMolecular
Weight45-19kDa
High Molecular
WeightSBS Polymer
800-45kDa
Asphaltenes19-3 kDa
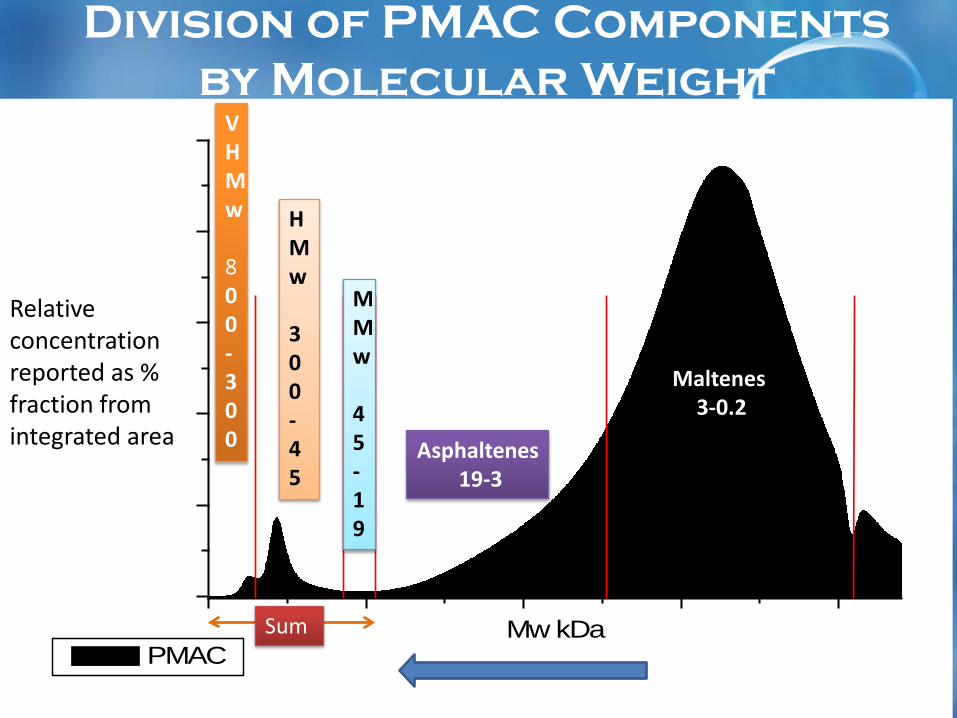
Division of PMAC Components by Molecular Weight
DRI s
ignal
Mw kDa PMAC
VHMw
800-300
HMw
300-45
MMw
45-19
Asphaltenes19-3
Maltenes3-0.2
Sum
Relative concentration reported as % fraction from integrated area
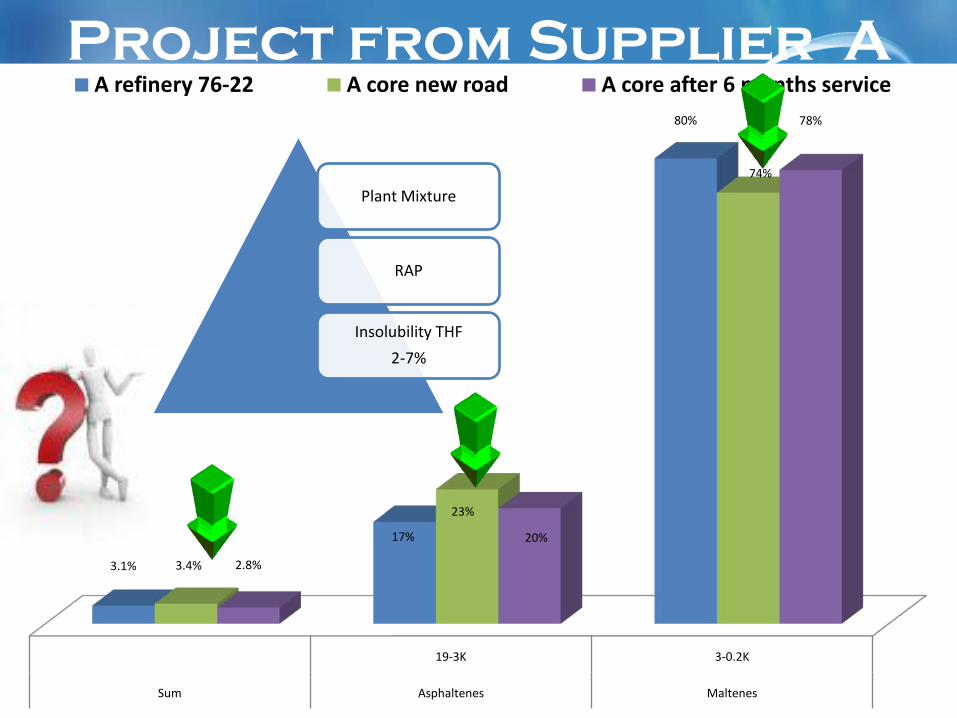
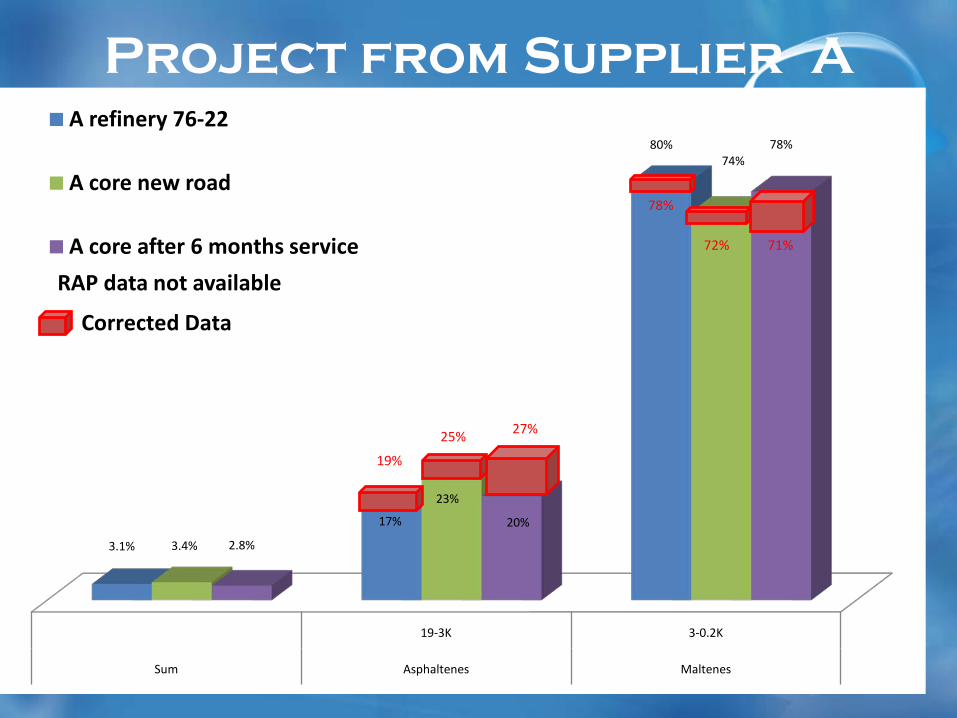
Project from Supplier A
19-3K 3-0.2K
Sum Asphaltenes Maltenes
3.1%
17%
80%
3.4%
23%
74%
2.8%
20%
78%
A refinery 76-22 A core new road A core after 6 months service
Plant Mixture
RAP
Insolubility THF
2-7%
Project from Supplier A
19-3K 3-0.2K
Sum Asphaltenes Maltenes
3.1%
17%
80%
3.4%
23%
74%
2.8%
20%
78%
A refinery 76-22
A core new road
A core after 6 months service
Corrected Data
27%25%
71%72%
78%
RAP data not available
19%

Project from Supplier B
1000-19kDa 19-3kDa 3-0.2kDa
Sum Mw Asphaltenes Maltenes
2.1%
16%
82%
2.4%
16%
82%
1.7%
25%
73%
3.4%
20%
77%
3.4%
19%
77%
3.2%
20%
77%
B refinery 76-22
B plant 76-22
RAP
B mix plant
B mix road
B cores new road
17%
81%
74%
24%Corrected Data
6 month data comparable to fresh road data
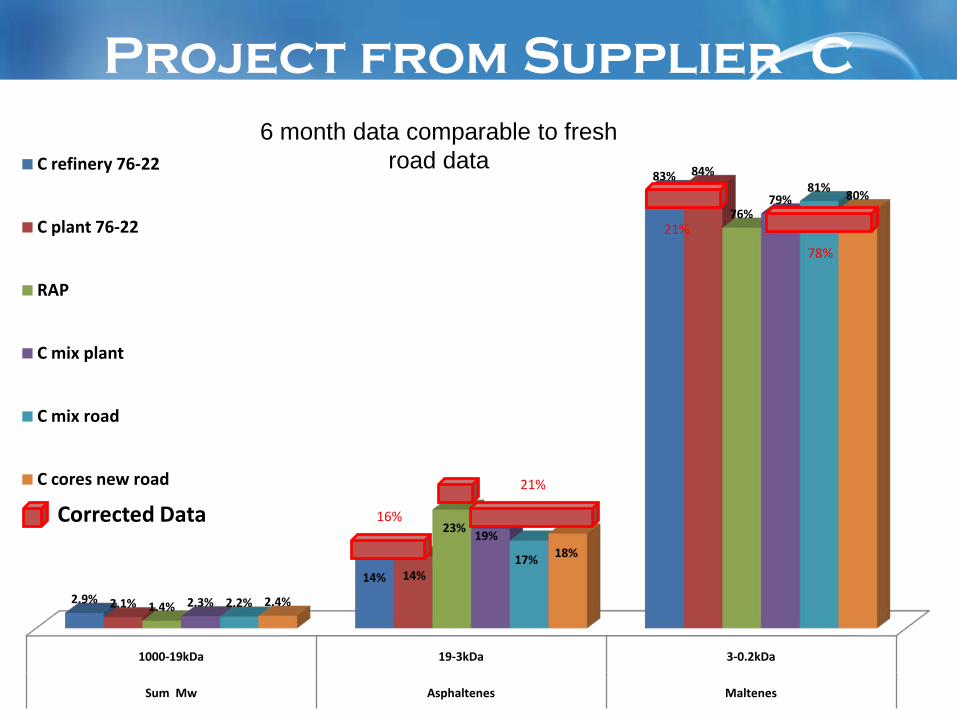
Project from Supplier C
1000-19kDa 19-3kDa 3-0.2kDa
Sum Mw Asphaltenes Maltenes
2.9%
14%
83%
2.1%
14%
84%
1.4%
23%
76%
2.3%
19%
79%
2.2%
17%
81%
2.4%
18%
80%
C refinery 76-22
C plant 76-22
RAP
C mix plant
C mix road
C cores new road
78%
21%
21%
16%Corrected Data
6 month data comparable to fresh road data
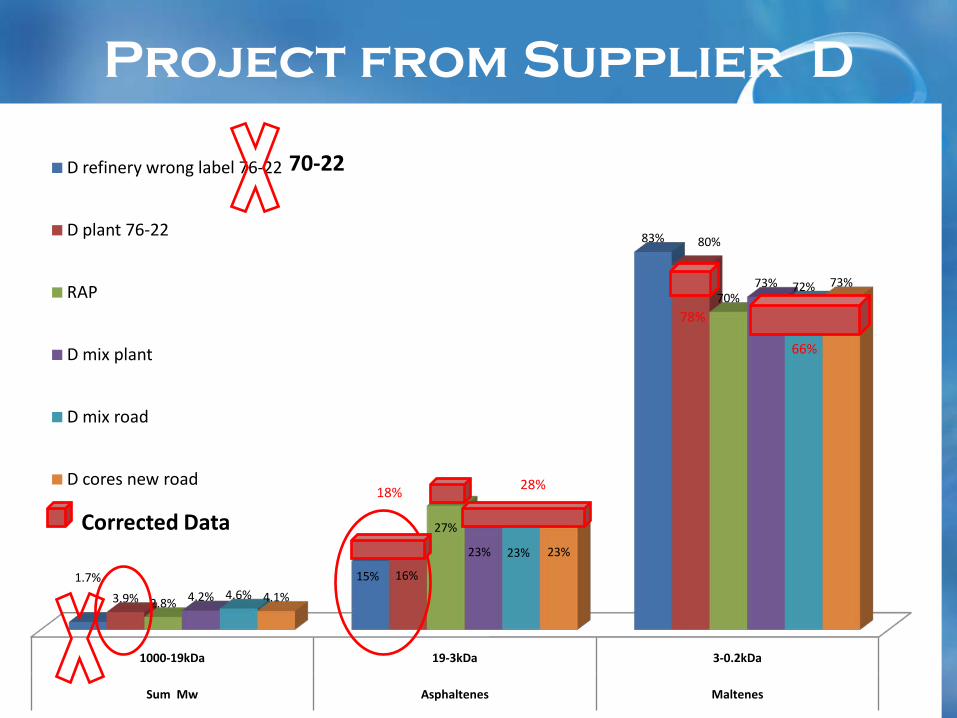
Project from Supplier D
1000-19kDa 19-3kDa 3-0.2kDa
Sum Mw Asphaltenes Maltenes
1.7% 15%
83%
3.9%
16%
80%
2.8%
27%
70%
4.2%
23%
73%
4.6%
23%
72%
4.1%
23%
73%
D refinery wrong label 76-22
D plant 76-22
RAP
D mix plant
D mix road
D cores new road
70-22
28%
78%
66%
18%
Corrected Data
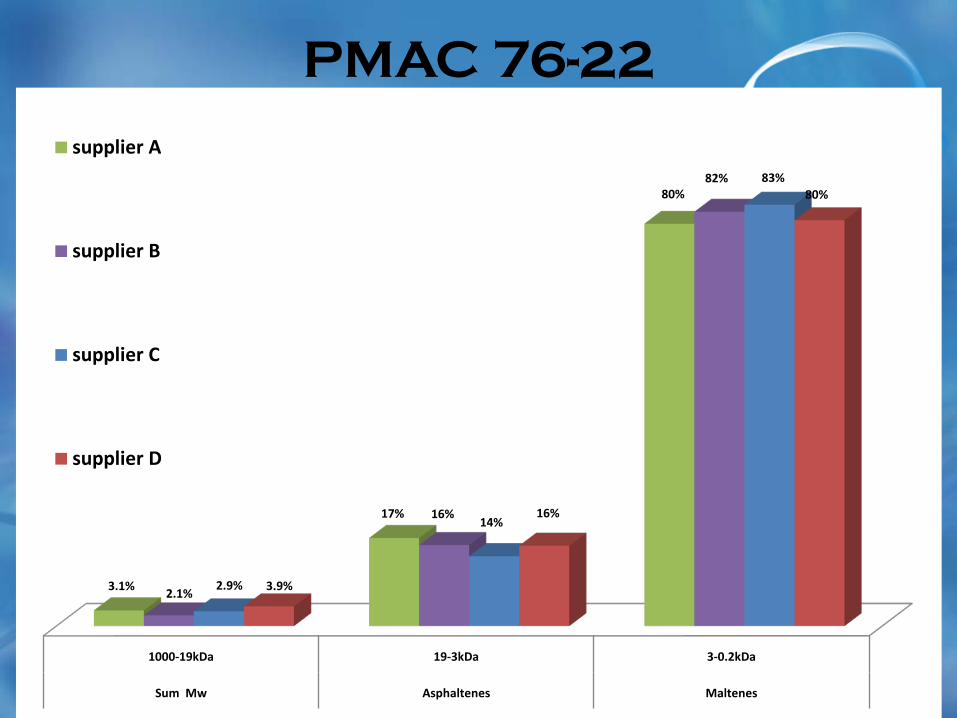
PMAC 76-22
1000-19kDa 19-3kDa 3-0.2kDa
Sum Mw Asphaltenes Maltenes
3.1%
17%
80%
2.1%
16%
82%
2.9%
14%
83%
3.9%
16%
80%
supplier A
supplier B
supplier C
supplier D
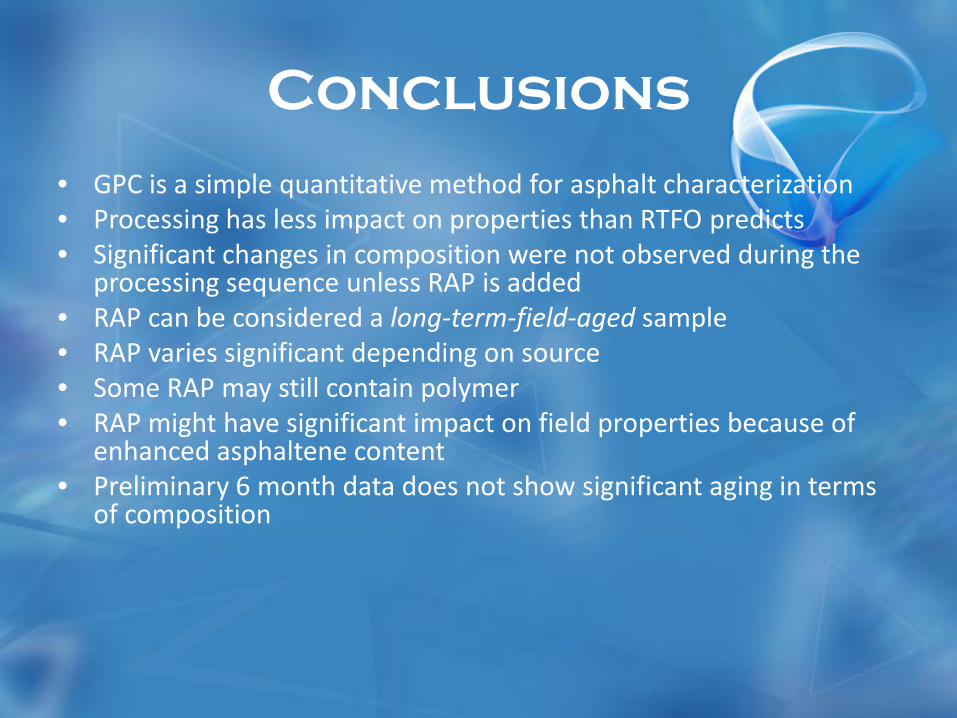
Conclusions
• GPC is a simple quantitative method for asphalt characterization• Processing has less impact on properties than RTFO predicts• Significant changes in composition were not observed during the
processing sequence unless RAP is added• RAP can be considered a long-term-field-aged sample• RAP varies significant depending on source• Some RAP may still contain polymer• RAP might have significant impact on field properties because of
enhanced asphaltene content• Preliminary 6 month data does not show significant aging in terms
of composition

22
Thank You ,Any Questions?
30 25 20 15 10 5 0-0.02
0.00
0.02
0.04
0.06
0.08
0 5 10 15 20 25 30
-1
0
1
2
3
4
5
6
7
8
9
10
11
Log
MW
∆RI
Flowing (Elution) Time (or Volume), min (ml)
AC30 +3% SBS TFOT
MW 120,000
MW 750MW 9,000
Decreasing MW
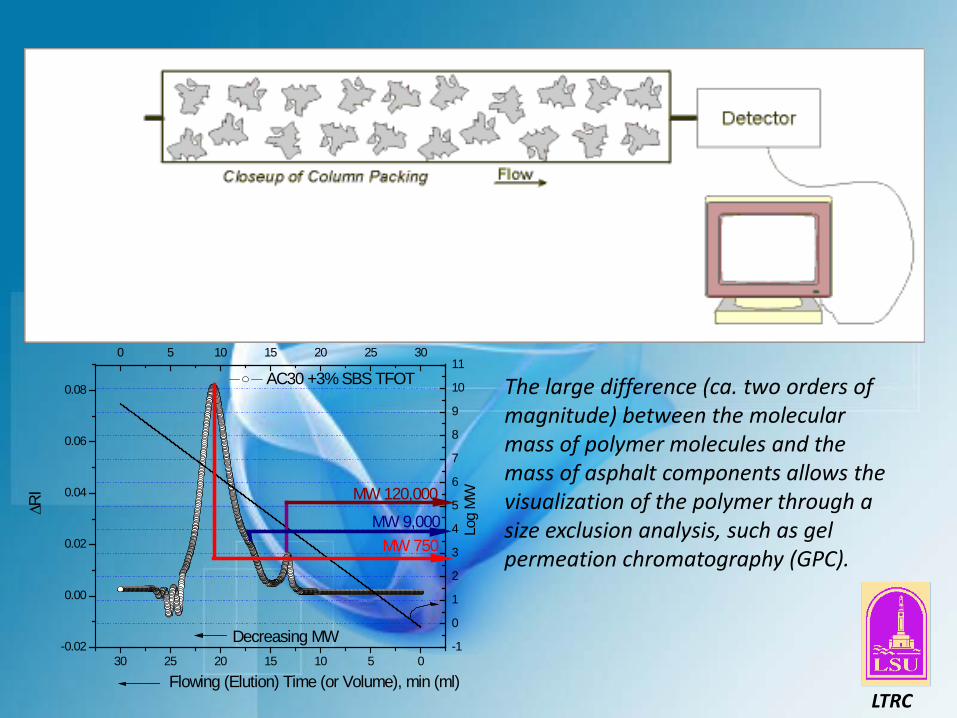
The large difference (ca. two orders of magnitude) between the molecular mass of polymer molecules and the mass of asphalt components allows the visualization of the polymer through a size exclusion analysis, such as gel permeation chromatography (GPC).
LTRC
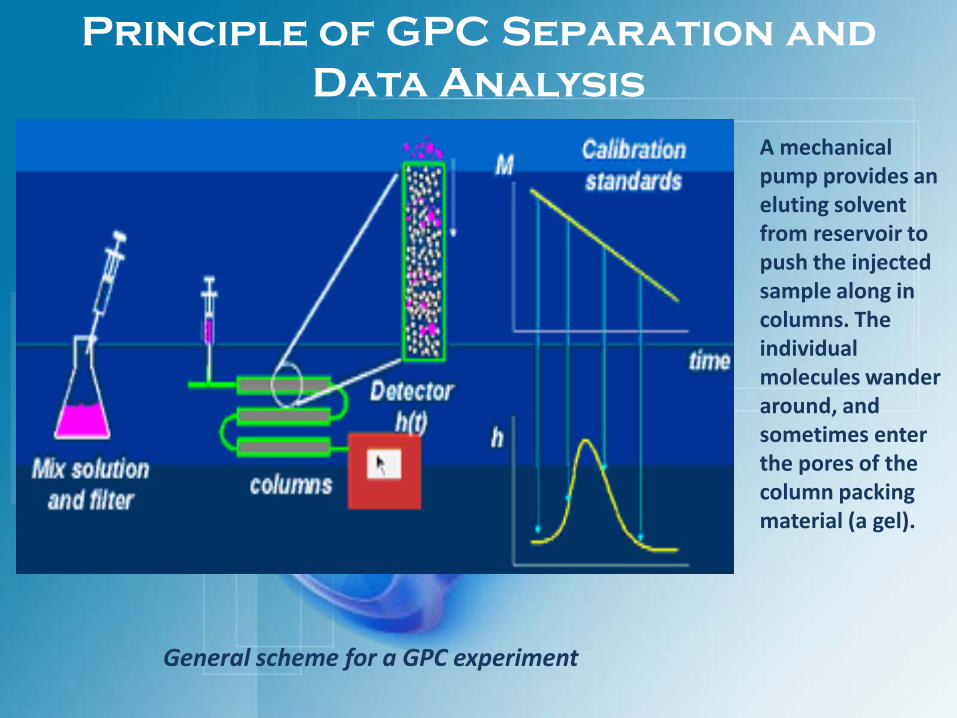
General scheme for a GPC experiment
Principle of GPC Separation and Data Analysis
A mechanical pump provides an eluting solvent from reservoir to push the injected sample along in columns. The individual molecules wander around, and sometimes enter the pores of the column packing material (a gel).

•6 month data comparable to fresh road data