Embed Size (px)
Citation preview

Drying Rate of Five Base-Layer Garments UtilizingPermeation Kettles with Infrared Thermographic
Documentation
Test Documentation
Purpose and Scope
This test provides relative and absolute drying rate data for five base-layer garments.
Summary of Results
The tables below shows average drying rates for each pair of garments that weretested. The XOSKIN Technology Nylon garment dried substantially faster than theother test garments.
Test: Under Armour Cold Gear Infra-Red vs. XOSKIN
Garment Drying Rate (Grams/Minute)Under Armour Cold Gear 3.2XOSKIN 4.1
Test: Icebreaker Sonic Wool vs. XOSKIN
Garment Drying Rate (Grams/Minute)Icebreaker Sonic Wool 2.2XOSKIN 3.8

Test: The North Face FlashDry vs. XOSKIN
Garment Drying Rate (Grams/Minute)The North Face FlashDry 2.7XOSKIN 3.8
Test: XOSKIN Polypropylene vs. XOSKIN Nylon-Both used XOSKIN Technology Nylon
Garment Drying Rage (Grams/MinuteXOSKIN Polypropylene 2.5XOSKIN Nylon 3.2
Intentionally Left Blank
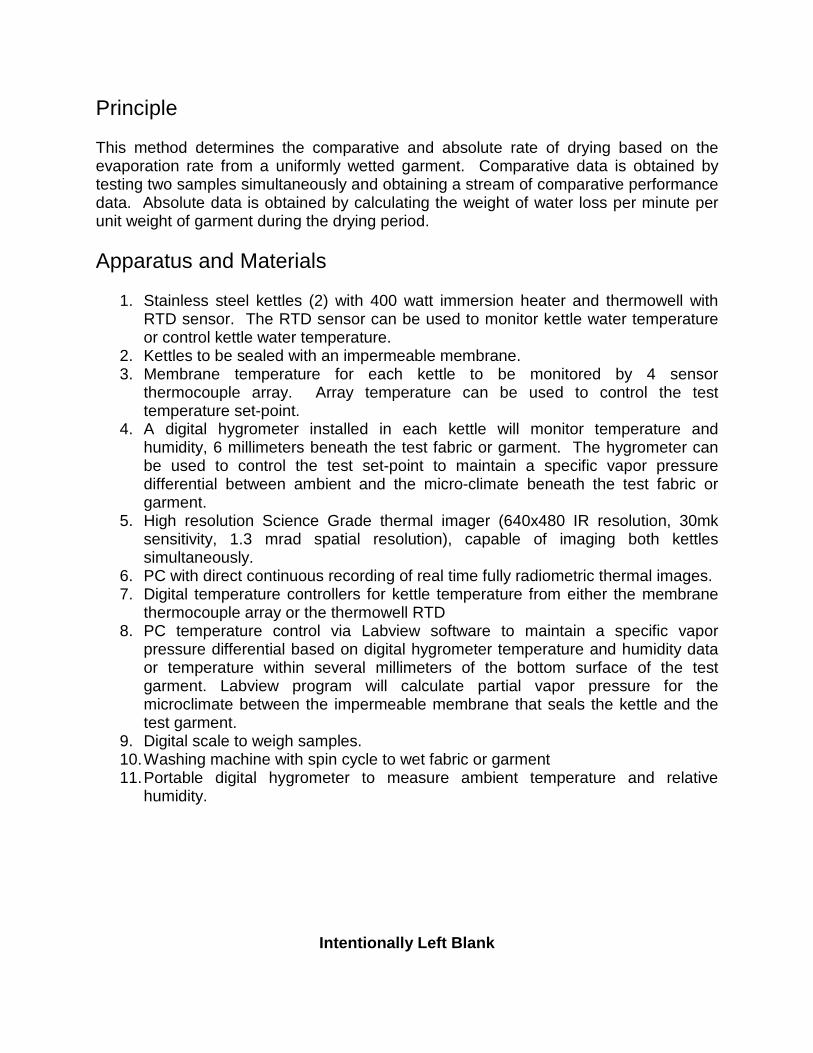
Principle
This method determines the comparative and absolute rate of drying based on theevaporation rate from a uniformly wetted garment. Comparative data is obtained bytesting two samples simultaneously and obtaining a stream of comparative performancedata. Absolute data is obtained by calculating the weight of water loss per minute perunit weight of garment during the drying period.
Apparatus and Materials
1. Stainless steel kettles (2) with 400 watt immersion heater and thermowell withRTD sensor. The RTD sensor can be used to monitor kettle water temperatureor control kettle water temperature.
2. Kettles to be sealed with an impermeable membrane.3. Membrane temperature for each kettle to be monitored by 4 sensor
thermocouple array. Array temperature can be used to control the testtemperature set-point.
4. A digital hygrometer installed in each kettle will monitor temperature andhumidity, 6 millimeters beneath the test fabric or garment. The hygrometer canbe used to control the test set-point to maintain a specific vapor pressuredifferential between ambient and the micro-climate beneath the test fabric orgarment.
5. High resolution Science Grade thermal imager (640x480 IR resolution, 30mksensitivity, 1.3 mrad spatial resolution), capable of imaging both kettlessimultaneously.
6. PC with direct continuous recording of real time fully radiometric thermal images.7. Digital temperature controllers for kettle temperature from either the membrane
thermocouple array or the thermowell RTD8. PC temperature control via Labview software to maintain a specific vapor
pressure differential based on digital hygrometer temperature and humidity dataor temperature within several millimeters of the bottom surface of the testgarment. Labview program will calculate partial vapor pressure for themicroclimate between the impermeable membrane that seals the kettle and thetest garment.
9. Digital scale to weigh samples.10.Washing machine with spin cycle to wet fabric or garment11.Portable digital hygrometer to measure ambient temperature and relative
humidity.
Intentionally Left Blank

Procedure
1. Preheat kettle water to obtain target temperature at top surface of impermeablemembrane. Typical test temperature will be 120oF at an ambient of 70oF.
2. Weigh both test samples.3. Place samples in washing machine and subject samples to rinse and spin cycles.4. Begin recording thermal images of the kettles. Images will be acquired at a rate
of 3 frame per second.5. Begin recording temperature and humidity data from the digital hygrometer.6. Record ambient temperature and humidity.7. When rinse/spin cycle is completed, remove garments and weigh both test
samples to determine absorbed water weight.8. Install one garment on each kettle. Each garment will be installed with an elastic
band around the edge of the sample.9. Remove power from kettle heaters. No additional heat energy will be added to
the process during the drying period.10.Test will continue until thermal imager shows that both samples have reached a
stable, elevated temperature. The hygrometer data will show equal low humiditylevels in the microclimate beneath the test samples when drying is completed.
11.Remove and weigh the samples to confirm complete drying. If any water weightremains, repeat the test.
12.Repeat this procedure 4-5 times to evaluate the impact of wetting variation fromthe rinse/spin dry wetting method. Obtain data that is reflective of averagemoisture absorption for the series of tests
13.Analysis and reporting steps below will be conducted for the average sampleresults.
14.Review video to obtain time to dry for each sample. Time to dry for each samplewill occur when stable, elevated sample temperatures are achieved.
15.Produce a time lapse video of the thermal images to compress the dryingprocess to two minutes of video.
16. If desired, produce still infrared images at specific time intervals to illustrate thedrying rate differential between the two garments.
17.Plot Time vs. Average Temp for each Kettle. When temperature rise levels,garment is dry. Read drying time from plot.
18.Plot Partial Vapor Pressure vs Time for each Kettle. When the microclimatepartial vapor pressure reaches a constant low value, garment is dry. Read dryingtime from plot.
19.Calculate garment rate of drying: Water weight lost/garment weight /time
Intentionally Left Blank

Test Report
Test Conditions:Ambient—70oF, 52% relative humidityKettle membrane temperature—120oFInitial Kettle water temperature—135oFFinal Kettle water temperature—134oF (typical)
Test Garments:
Icebreaker Sonic Long Sleeve Crew-USD$99.9996% Merino Wool, 150 gm/meter24% Lycra
Under Armour Men’s Cold Gear Infrared Long Sleeve V-Neck-USD$69.9993% Polyester7% Elastane
XOSKIN Nylon Long Sleeve-USD$89.0066% Nylon32% XOSKIN Technology Nylon2% Spandex in neck and hem (not in the body of the shirt)
The North Face Men’s Warm Long-Sleeve Crew Neck FlashDry-USD$50.00100% Polyester
XOSKIN Polypropylene Long Sleeve (Test Control)66% Polypropylene32% XOSKIN Technology Nylon2% Spandex in neck and hem (not in the body of the shirt)
Garment Weights (all weights in grams):
Garment Dry Weight(grams)
Wet Weight(grams)
Added Water(grams)
% Wetting
Icebreaker 183 269 86 47UA Cold Gear 227 340 113 50TNF FlashDry 219 378 (average) 159 (average) 73 (average)XOSKINNylon
144 241 (average) 97 (average) 84 (average)
XOSKINPolypropylene
168 234 (average) 68 (average) 39 (average)
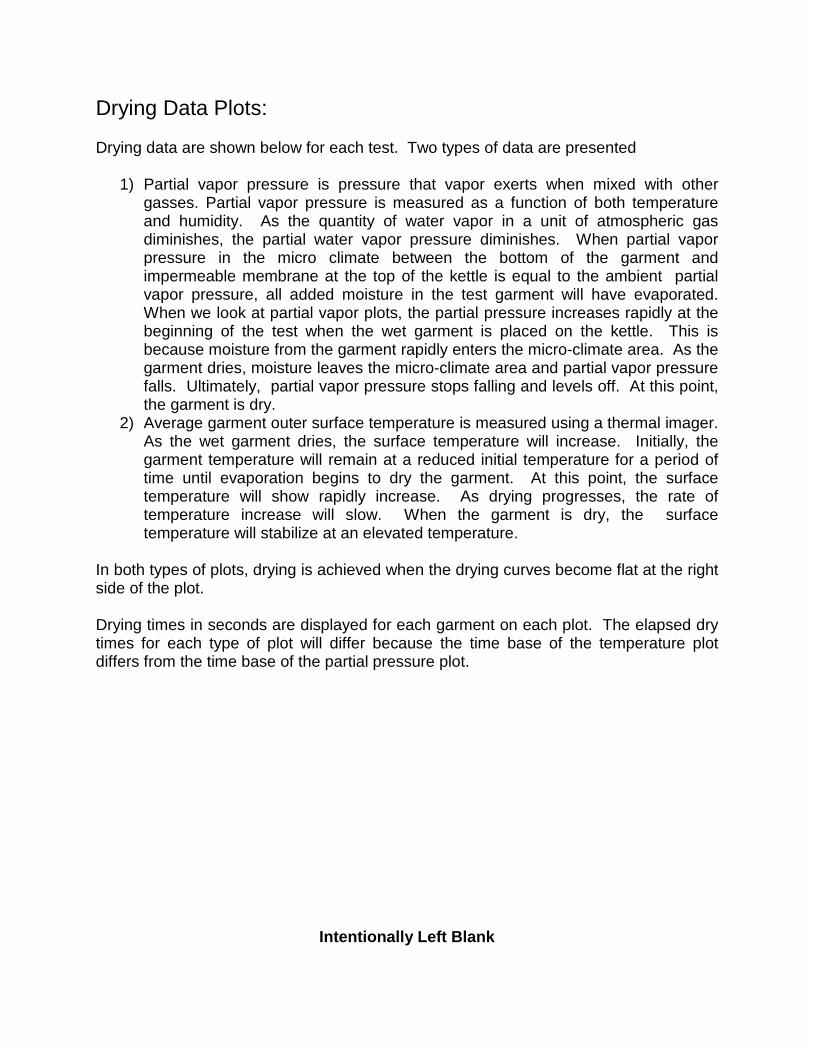
Drying Data Plots:
Drying data are shown below for each test. Two types of data are presented
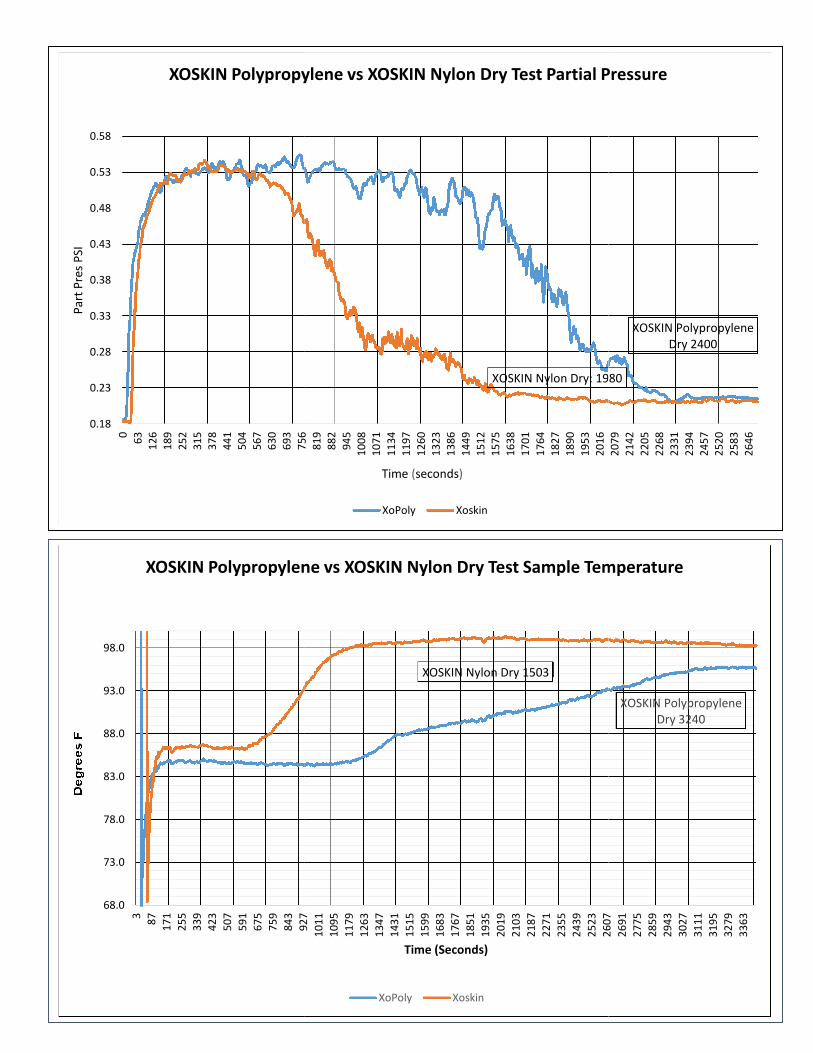
1) Partial vapor pressure is pressure that vapor exerts when mixed with othergasses. Partial vapor pressure is measured as a function of both temperatureand humidity. As the quantity of water vapor in a unit of atmospheric gasdiminishes, the partial water vapor pressure diminishes. When partial vaporpressure in the micro climate between the bottom of the garment andimpermeable membrane at the top of the kettle is equal to the ambient partialvapor pressure, all added moisture in the test garment will have evaporated.When we look at partial vapor plots, the partial pressure increases rapidly at thebeginning of the test when the wet garment is placed on the kettle. This isbecause moisture from the garment rapidly enters the micro-climate area. As thegarment dries, moisture leaves the micro-climate area and partial vapor pressurefalls. Ultimately, partial vapor pressure stops falling and levels off. At this point,the garment is dry.
2) Average garment outer surface temperature is measured using a thermal imager.As the wet garment dries, the surface temperature will increase. Initially, thegarment temperature will remain at a reduced initial temperature for a period oftime until evaporation begins to dry the garment. At this point, the surfacetemperature will show rapidly increase. As drying progresses, the rate oftemperature increase will slow. When the garment is dry, the surfacetemperature will stabilize at an elevated temperature.
In both types of plots, drying is achieved when the drying curves become flat at the rightside of the plot.
Drying times in seconds are displayed for each garment on each plot. The elapsed drytimes for each type of plot will differ because the time base of the temperature plotdiffers from the time base of the partial pressure plot.
Intentionally Left Blank

2382 Dry
1586 Dry0.2
0.25
0.3
0.35
0.4
0.45
0.5
0.55
0.6
0.65
0
66
13
2
19
8
26
4
33
0
39
6
46
2
52
8
59
4
66
0
72
6
79
2
85
8
92
4
99
0
10
56
11
22
11
88
12
54
13
20
13
86
14
52
15
18
15
84
16
50
17
16
17
82
18
48
19
14
19
80
20
46
21
12
21
78
22
44
23
10
23
76
24
42
P
a
r
t
P
r
e
s
p
S
I
Time Seconds
Icebreaker vs XOSKIN Dry Test Partial Pressure
Iceberg Part Pressure Xoskin Part Pressure
Icebreaker Dry 2405
XOSKIN Dry 1728
85.0
87.0
89.0
91.0
93.0
95.0
97.0
99.0
101.0
0
72
14
4
21
6
28
8
36
0
43
2
50
4
57
6
64
8
72
0
79
2
86
4
93
6
10
08
10
80
11
52
12
24
12
96
13
68
14
40
15
12
15
84
16
56
17
28
18
00
18
72
19
44
20
16
20
88
21
60
22
32
23
04
23
76
24
48
25
20
D
e
g
r
e
e
s
F
Time Seconds
Icebreaker vs XOSKIN Dry Test Average Sample Temperature
Iceberg Xoskin

UA Dry 2096
XOSKIN Dry 11940.18
0.23
0.28
0.33
0.38
0.43
0.48
0.53
0.580
60
12
0
18
0
24
0
30
0
36
0
42
0
48
0
54
0
60
0
66
0
72
0
78
0
84
0
90
0
96
0
10
20
10
80
11
40
12
00
12
60
13
20
13
80
14
40
15
00
15
60
16
20
16
80
17
40
18
00
18
60
19
20
19
80
20
40
21
00
21
60
22
20
22
80
P
a
r
t
P
r
e
s
P
S
I
Time Seconds
UA Cold Gear vs XOSKIN Dry Test Partial Pressure
UA Cold Gear Part Pressure Xoskin Part Pressure
XOSKIN Dry 1116
UA Dry 2124
65.0
70.0
75.0
80.0
85.0
90.0
95.0
100.0
105.0
0 180 360 540 720 900 1080 1260 1440 1620 1800 1980 2160
D
e
g
r
e
e
s
F
Time
UA Coldgear vs XOSKIN Dry Test Sample Temperature
UA ColdGear Xoskin

TNF Dry 4539
XOSKIN Dry 1500
0.18
0.23
0.28
0.33
0.38
0.43
0.48
0.53
0.58
31
17
23
13
45
45
95
73
68
78
01
91
51
02
91
14
31
25
71
37
11
48
51
59
91
71
31
82
71
94
12
05
52
16
92
28
32
39
72
51
12
62
52
73
92
85
32
96
73
08
13
19
53
30
93
42
33
53
73
65
13
76
53
87
93
99
34
10
74
22
14
33
54
44
94
56
34
67
7
P
a
r
t
P
r
e
s
P
S
I
Time
The North Face FlashDry vs XOSKIN Dry Test Partial Pressure
FlashDry Xoskin
TNF Dry 4650
XOSKIN Dry 1119
65.0
70.0
75.0
80.0
85.0
90.0
95.0
100.0
105.0
31
17
23
13
45
45
95
73
68
78
01
91
51
02
91
14
31
25
71
37
11
48
51
59
91
71
31
82
71
94
12
05
52
16
92
28
32
39
72
51
12
62
52
73
92
85
32
96
73
08
13
19
53
30
93
42
33
53
73
65
13
76
53
87
93
99
34
10
74
22
14
33
54
44
94
56
34
67
7
D
e
g
r
e
e
s
F
Time
The North Face FlashDry vs XOSKIN Dry Test Sample Temp
FlashDry Xoskin
0.18
0.23
0.28
0.33
0.38
0.43
0.48
0.53
0.580
63
12
61
89
25
23
15
37
8
44
15
04
56
76
30
69
3
75
6
Par
tP
res
PSI
XOSKIN Polypropylene vs XOSKIN Nylon Dry Test Partial Pressure
XOSKIN Nylon Dry: 1980
75
68
19
88
2
94
51
00
81
07
1
11
34
11
97
12
60
13
23
13
86
14
49
15
12
15
75
16
38
17
01
17
64
18
27
18
90
19
53
20
16
20
79
Time (seconds)
XOSKIN Polypropylene vs XOSKIN Nylon Dry Test Partial Pressure
XoPoly Xoskin
XOSKIN PolypropyleneDry 2400
XOSKIN Nylon Dry: 1980
20
79
21
42
22
05
22
68
23
31
23
94
24
57
25
20
25
83
26
46
XOSKIN Polypropylene vs XOSKIN Nylon Dry Test Partial Pressure
68.0
73.0
78.0
83.0
88.0
93.0
98.0
3
87
17
1
25
5
33
9
42
3
50
7
59
1
67
5
75
9
84
3
92
7
XOSKIN Polypropylene vs XOSKIN Nylon Dry Test Sample Temperature
XOSKIN Nylon Dry 1503
92
7
10
11
10
95
11
79
12
63
13
47
14
31
15
15
15
99
16
83
17
67
18
51
19
35
20
19
21
03
21
87
22
71
23
55
24
39
25
23
26
07
Time (Seconds)
XOSKIN Polypropylene vs XOSKIN Nylon Dry Test Sample Temperature
XoPoly Xoskin
XOSKIN PolypropyleneDry 3240
26
07
26
91
27
75
28
59
29
43
30
27
31
11
31
95
32
79
33
63
XOSKIN Polypropylene vs XOSKIN Nylon Dry Test Sample Temperature

Kettle Thermal Images
The pages below provide thermal images that illustrate the drying process for eachgarment pair. The progress of drying can be seen from the color changes.
The wet garments are mounted on the kettles. At the start of the test, wet garments aretypically purple in color due their low temperatures. As the fabric dries, the surfacetemperatures rise and as they warm become green, then yellow and finally red. Whenthe warming ceases and elevated surface temperatures remain constant, the garmentis dry.
The images are produced at 10 minute intervals.
Following the still images are embedded videos that illustrate the drying process incompressed time. This means that the drying process, which occurs over 20-40minutes is viewed in less than a minute.
Intentionally Left Blank

Icebreaker vs. XOSKIN Infrared Drying Images at 10 MinuteIntervals
0 Minutes 10 Minutes
20 Minutes 30 Minutes
40 Minutes
Icebreaker Sonic is Left Image.
XOSKIN is Right Image.
Cold (purple is wet)Warm (yellow, green, red) is dry.
The XOSKIN garment achieves temperature stability by 30 minutes. The surfacetemperature of the Icebreaker continues to rise for approximately 10 minutes more.

Under Armour Cold Gear vs. XOSKIN Infrared Drying Images at10 Minute Intervals
0 Minutes 10 Minutes
20 Minutes 30 Minutes
40 Minutes
Under Armour Cold Gear Infra-Red isLeft Image.
XOSKIN is Right Image
Cold (purple is wet)Warm (yellow, green, red) is dry.
The XOSKIN garment achieves a stable temperature in less than 20 minutes. The UACold Gear garment requires an additional 20 minutes to achieve stable temperatures.

The North Face FlashDry vs. XOSKIN Infrared Drying Images at10 Minute Intervals
The North Face FlashDry isLeft Image.
XOSKIN is Right Image
Cold (purple is wet)Warm (yellow, green, red) isdry.
The XOSKIN garment achieves a stable temperature in about 25 minutes. The NorthFace FlashDry garment requires an additional 30 minutes to achieve stable
temperatures.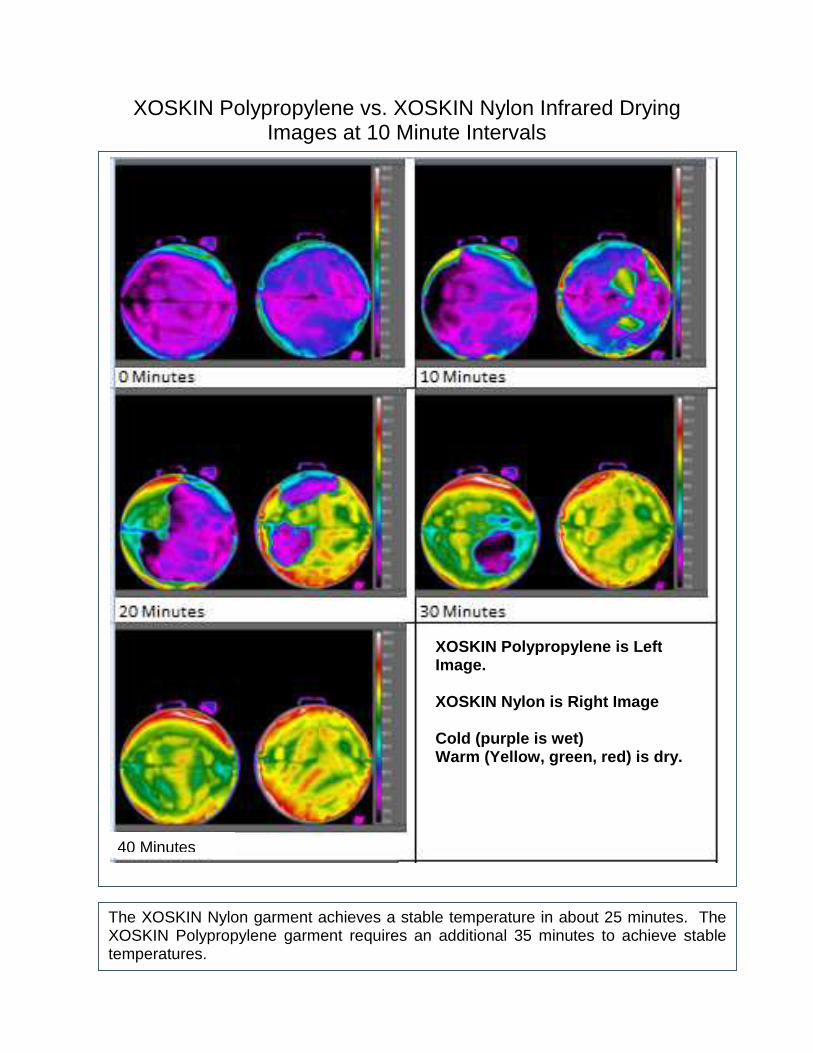
XOSKIN Polypropylene vs. XOSKIN Nylon Infrared DryingImages at 10 Minute Intervals
XOSKIN Polypropylene is LeftImage.
XOSKIN Nylon is Right Image
Cold (purple is wet)Warm (Yellow, green, red) is dry.
40 Minutes
The XOSKIN Nylon garment achieves a stable temperature in about 25 minutes. TheXOSKIN Polypropylene garment requires an additional 35 minutes to achieve stable
t emperatures.
Quantitative Drying Data
The table below provides drying time and rate data for each garment pair.
The data sho
VaporPressureTest Dry
Tempera-ture Test
Avg DryTime
Test GarmentTime(seconds)
Dry Time(seconds)
Data(seconds)
Drying Rate(grams/minute)
Icebreakervs. XOSKIN
Icebreaker 2382 2405 2393.5 2.2
XOSKIN 1586 1728 1657 3.8
Dry Time Diff 796 677 736.5
% Difference 67% 72% 69% 73%
UA ColdGear vs.XOSKIN
Cold Gear 2096 2124 2110 3.2
XOSKIN 1194 1116 1155 4.1
Dry Time Diff 902 1008 955
% Difference 57% 53% 55% 28%
TNFFlashDry vs.XOSKIN
FlashDry 3600 3755 3678 2.7
XOSKIN 1455 1208 1332 3.8
Dry Time Diff 2145 2547 2346
% Difference 40% 32% 36% 41%
XOSKINPolyprop vs.XOSKINNylon
XOSKIN Polyp 1643 1943 1793 2.5
XOSKIN Nylon 1788 1772 1780 3.2
Dry Time Diff -145 171 13
ws that the XOSKIN Technology Nylon garment dries significantly faster ineach case.
% Diff 109% 92% 99% 28%