Embed Size (px)
Citation preview

Hydrogen Oxidation Reaction in Alkaline Media: Relationship between
Electrocatalysis and Electrochemical Double-Layer Structure
Nagappan Ramaswamy1, Shraboni Ghoshal, Michael K. Bates2, Qingying Jia, Jingkun Li, and
Sanjeev Mukerjee*
Northeastern University Center for Renewable Energy Technology,
Department of Chemistry and Chemical Biology,
317 Egan Research Center, 360 Huntington Avenue,
Northeastern University, Boston, MA 02115 USA
Present Addresses:1General Motors Corporation, Global Fuel Cell Activities, 895 Joslyn Avenue, Pontiac, MI
48340 USA2NanoTerra Inc. 737 Concord Avenue, Cambridge, MA 02138 USA
* Corresponding Author
E-mail Address: [email protected]
Phone: +1 617 373-2382; Fax: +1 617 373-8949

Supporting Methods:
X-ray Absorption Spectroscopic (XAS) Measurements: The in situ XAS studies at Pt L3-edge
(11564 eV), Ru K-edge (22117 eV) were performed at X11A beamline of National Synchrotron
Light Source (NSLS, Brookhaven National Laboratory, NY). The in situ XAS studies at Ni K-
edge 8333 eV and Cu K-edge at 8983 eV were performed at X19A beamline of NSLS. Detailed
information on the spectro-electrochemical cell design are given elsewhere1. Working electrodes
were prepared on acid-washed carbon cloth by coating an ink consisting of catalyst dispersed in
a 1:1 mixture of deionized water:2-propanol. The metal loadings was chosen to yield an
absorption cross section of ~0.2 to 0.5. Prior to spectro-electrochemical cell assembly, the
electrodes were wetted with the alkaline electrolyte via vacuum impregnation. Argon saturated
0.1 M NaOH was used as the electrolyte. Pristine acid-washed carbon cloth was used as the
counter electrode. Externally placed reversible hydrogen electrode (RHE) made from argon
saturated 0.1 M NaOH was used as the reference electrode connected to the
spectroelectrochemical cell via an alkaline salt bridge. Prior to the start of each experiment, the
working electrodes were activated by potential cycling between 0.05 V and a prescribed anodic
potential (typically 1.2 V vs RHE for Pt, and 0.8 V for other catalysts of interest here) in argon
saturated 0.1 M NaOH. During XAS data collection, the working electrode was fixed at the
potential of interest until steady-state current was reached. XAS Spectra were collected in both
transmission and fluorescence mode (using a PIPS detector), while the working electrode was
held at constant potential for the entirety of the XAS data collection duration. Metal foil
(typically ~4 µm thickness) of the corresponding elements was placed between the transmission
and reference ionization chambers for X-ray beam alignment.
EXAFS Analysis: EXAFS analysis were performed using the IFEFFIT suite (version 1.2.10,
IFEFFIT copyright 2008, Mathew Newville, University of Chicago,
http://cars9.uchicago.edu/ifeffit/)2. All scans were carefully aligned and calibrated using the
reference foil to account for any changes in beam energy throughout the course of the
experiments. Background subtraction and normalization was performed using the AUTOBK
algorithm in Athena (Bruce Ravel, Copyright 2008), a subroutine of IFEFFIT. The normalized
EXAFS data were then imported into the Artemis program where EXAFS fits were carried out
using a k-range window of 2.0 - 13 Å-1 (Kaiser-Bessel) and an R-window of 1.5 - 3.5 Å-1.

Delta-Mu Analysis: EXAFS and XANES are bulk averaged spectroscopic techniques that
overlook the electrochemical reactions occurring on the catalyst surface. Delta-Mu (Δµ) is a
surface sensitive, spectral subtraction technique in the XANES region where the catalyst bulk
structure is effectively removed leading to information on the chemical identity of the adsorbed
intermediates, nature of the active site and site-specificity of the surface adsorbates.3,4 Data
analysis for Delta-Mu (Δµ) studies has been dealt with in detail elsewhere and only a brief
summary is given here.1,3-8 This involves careful calibration of the metal edge energy and
alignment to standard reference scan to account for any drift in the beam energy. A special
postedge normalization procedure was then applied to the aligned scans via a cubic spline
function which normalizes the oscillations over a specific energy range (typically 25 to 200 eV
with respect to E0) on a per-atom basis in order to involve only the XANES region. The
experimental Δµ difference spectra were obtained using the equation :
Δµ = µ(V) - µ(clean V)
where µ(V) is the XANES spectra of the catalyst at various potentials. µ(clean V) is the
reference XANES signal at potential where the catalyst is ideally free of any electrochemical
adsorbates (Hupd, Oads, OHads). Typically for Pt L3-edge, experimental XANES signal at 0.54 V vs
RHE (double-layer region) is used as the reference potential for clean surface. Interpretation of
the experimental Δµ signatures was achieved by constructing various structural models via
WebLab ViewerPro (Version 3.7, Copyright 2000, Molecular Simulations Inc.). For instance,
"Janin-cluster type Pt6" were used in the form Pt6-HUPD to mimic the HUPD formation or Pt-OHad to
mimic oxide formation on Pt catalyst in different coordinate positions, i.e. either atop or fcc etc.
Theoretical XANES spectra of these structural model with and without the desired adsorbates
were then simulated using the FEFF 8.0 code.9 These theoretical XANES spectra were then
subjected to the same difference process utilized for the experimental data according to the
following relationship:
Δµt = µ(Pt6-ads) - µ(Pt6-Clean)
where the "ads" represents the desired adsorbate of interest such as HUPD or oxide species (Oads or
OHads) in a specific binding site on the catalyst. Experimental Δµ spectra were then compared to
theoretical Δµ signatures in terms of the line shape, and energy position.

Synthesis of PtNb/C Catalyst: PtNb/C catalyst was synthesized using H2Pt(OH)6 and niobium
pentachloride as the precursors. Niobium pentachloride was first converted to peroxoniobic acid
via the following steps. Niobium pentachloride (200 mg) was dissolved in 1 mL ethanol. A clear,
yellow solution was obtained. This solution was added into 8 mL of 0.3 M NH3 aqueous
solution. A white precipitate of niobic acid was obtained. The reaction mixture was centrifuged
at 3000 rpm for 5 min. The precipitate was washed with deionized water and again centrifuged
after thorough mixing. The supernatant was discarded. This step was repreated three times to
remove impurities. The preceipitate was then dispersed in 30% H2O2 solution. The molar ratio of
Nb:H2O2 = 1:10. Solution was stirred for 5 minutes under cooling with ice. A transparent yellow
solution of peroxoniobic acid was thus obtained. 592 mg of H2Pt(OH)6 was dissolved in 30 mL
H2SO4 solution. The reaction was run overnight until a clear solution was obtained. 30 mL of
water was added into the clear solution thus obtained. 730 mg of Vulcan XC-72R carbon was
added. The slurry was then sonicated for 30 minutes. With 1 M NaOH, the pH was adjusted to
3.5. The peroxoniobic acid solution was then added very slowly to the slurry. The slurry was
heated close to boiling for an hour. It was then cooled to room temperature, filtered and dried
overnight in a vacuum oven. The solid thus obtained was then heated in a reducing atmosphere
(5% H2 in Argon) at 900 degrees for 8 hours to obtain PtNb/C catalyst. Figure S15 below shows
the transmission electron microscope images and particle size distribution of the as synthesized
PtNb/C catalyst.

Table S1: HOR anode overpotentials at a kinetic current density of 1 A/mgPt. Data were corrected for electrolyte ohmic and hydrogen mass transport resistances.
Catalyst Electrolyte EiR-free (mV) at ik = 1 A/mgPt
22 °C 40 °CTKK 46% Pt/C 0.1 M HClO4 20 --
0.1 M NaOH 192 --Johnson Matthey 20% Pt/C 0.1 M HClO4 -- 18
0.1 M NaOH -- 136ETEK-BASF 20% PtRu/C 0.1 M NaOH -- 2520% PtNb/C 0.1 M NaOH -- 55

Table S2: Pt d-orbital vacancy per atom for the Pt/C and PtNb/C alloy electrocatalysts as obtained from in situ XANES experiments at 0.04, 0.54 and 0.94 V vs. RHE in N2 saturated 0.1 M HClO4 and 0.1 M KOH electrolytes.
Catalyst
0.1 M HClO4 0.1 M KOH0.04 V 0.54 V 0.94 V 0.04 V 0.54 V 0.94 V
Pt/C 0.305 0.313 0.322 0.303 0.307 0.315PtNb/C -- -- -- 0.310 0.315 0.325
The d-band vacancies of Pt in the carbon supported Pt-based catalysts were calculated according to the following equation:10
(hJ)total,sample = (1.0 + fd) (hJ)total,reference
where (hJ)total,reference corresponds to the total number of unoccupied d-states for pure Pt reference foil which has been evaluated to be 0.3.11,12
fd = (ΔA3 + 1.11 ΔA2)/(A3 + 1.11A2)r
where ΔA3 and ΔA2 are expressed by
ΔA2 = (A2s - A2r) and ΔA3 = (A3s - A3r)
The terms A2 and A3 represent the areas under L2 and L3 absorption edges of the sample (s) and reference (r) material.

Figure S1: Magnified image of TKK 46% Pt/C cyclic voltammetry at room temperature (20 mV/s) showing the HUPD region in argon saturated 0.1 M HClO4 (red) and 0.1 M NaOH (blue) electrolyte.

Figure S2: XANES spectra of Pt/C catalyst at the Pt L3 and L2 edges measured in N2 saturated acid and alkaline electrolytes at 0.04, 0.54 and 0.94 V vs. RHE.
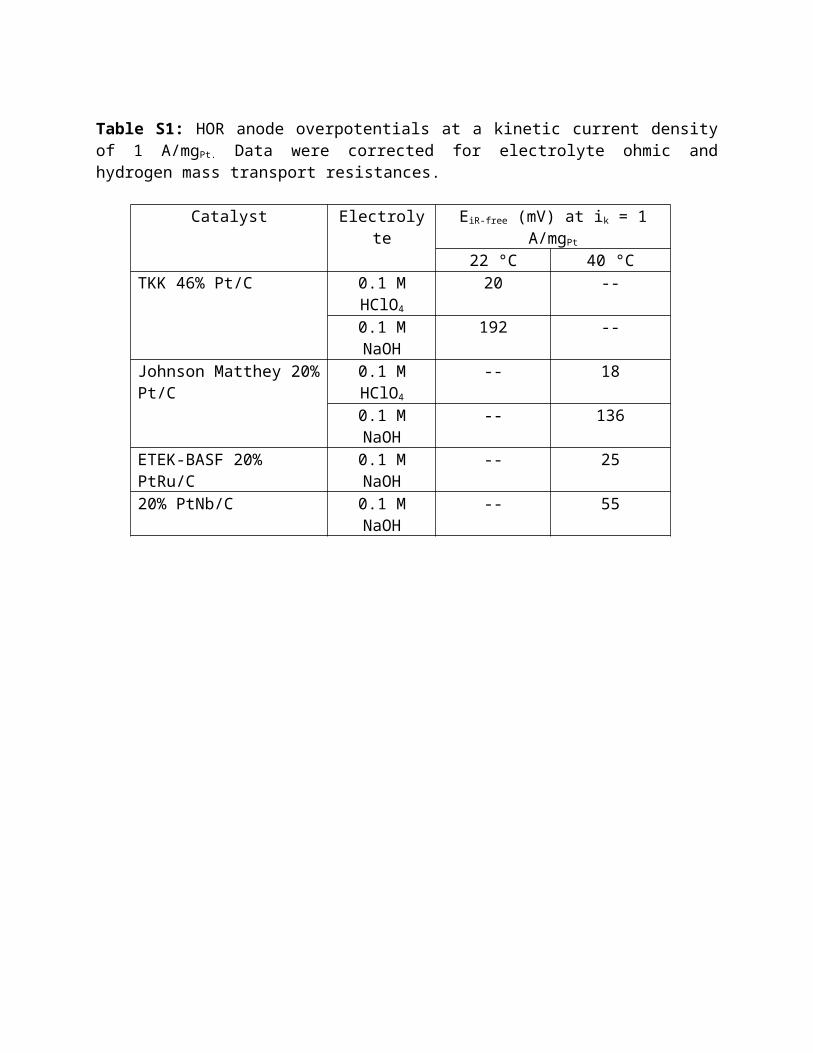
Figure S3: (a) XANES spectra region and (b) first derivative of the XANES region for the Pt/C catalyst obtained under in situ conditions at Pt L3-edge in argon saturated 0.1 M NaOH electrolyte at various potentials as indicated. Inset in (a) is a magnification of the Pt L3-edge 'white line'. Gray vertical dashed line indicates the Pt L3-edge at 11564 eV.
Figure S3a shows the XANES spectral feature measured at Pt L3-edge of a Pt/C catalyst under in situ conditions in argon saturated 0.1 M NaOH electrolyte at various potentials from 0.04 V to 1.0 V vs RHE. Figure S3b shows the corresponding first derivative of the Pt L3-edge XANES spectra. Pt L3-edge at 11564 eV represents the transition of core shell electrons (2p3/2) to empty states in the vicinity of the Fermi level (5d5/2) thereby providing the ability to probe the Pt d-band vacancies.10 The presence of adsorbed electronegative species such as OHad on Pt essentially modulates the d-band structure (i.e. increases the d-band vacancy or causes a down-shift in the d-band center) due to transfer of electron density away from Pt. Increase in electrode potential from 0.04 to 1.0 V vs. RHE does not lead to change in the Pt L3-edge position indicating lack of any major changes in the bulk oxidation state of Pt. Contrarily, the white line intensity (Figure S2a inset) of Pt3-edge begins to increase at potentials E ≥ 0.7 V vs RHE. This indicates that the formation of Pt-OHad via the specific adsorption of hydroxide anions occurs only at potentials E ≥ 0.7 V vs RHE. Most importantly, there is no sign of Pt-OHad formation at potentials E < 0.54 V vs RHE. This clearly shows that there is no evidence for the formation of Pt-OH ad in the HUPD
region on Pt/C catalyst in dilute alkaline electrolytes.

Figure S4: (a) Experimental Δµ spectra of Pt/C catalyst in argon saturated 0.1 M NaOH obtained by subtracting Pt L3-edge XANES spectra at the indicated potentials from the XANES spectra at 0.54 V vs RHE according to Δµ = µ(V) - µ(0.54 V). (b) Theoretical Δµ signature of Pt-HUPD, and Pt-OHad adsorbed with various site symmetries on Pt6 Janin cluster. (c) Structural models based on Janin-type Pt6 clusters with HUPD and OHad used to generate the theoretical Δµ signatures.
Experimental Δµ spectra of Pt/C catalyst in argon saturated 0.1 M NaOH (Figure S3a) was obtained via spectral subtraction of XANES at various potentials from the clean XANES spectra at 0.54 V vs RHE. These Δµ features of HUPD and water activation on Pt in dilute acidic electrolytes have been discussed widely in prior publications.5-7 The results shown here in 0.1 M NaOH are qualitatively similar to the earlier observations in acid. Briefly, at 0.24 V and 0.40 V the Δµ spectral features are clearly simulated by the Pt-HUPD theoretical signatures shown in Figure S3b. Pt-HUPD Δµ signature is characterized by a sharp negative peak at ~0 eV followed by a sharp positive feature around 5 to 10 eV above the Pt L3-edge. Further at a potential of 0.7 V vs RHE, a small positive peak is obtained in the experimental Δµ spectrum near the absorption edge energy. Subsequently, as the potential is increased the peak increases in magnitude and energy. This signature change is qualitatively consistent with a previous report in dilute acid electrolyte5-7
which described it as a transition from atop OH (at 0.7 V) to n-fold O (n = 2 or 3, typically indistinguishable). Figure S3c also shows the structural models based on "Janin-type Pt6" clusters used to run theoretical Δµ simulations.

Figure S5: Schematic illustration showing a possible mechanism of electrochemical CO oxidation on Pt in alkaline electrolyte in the absence of specifically adsorbed Pt-OHad species.
Electrocatalytic processes proceed via the reaction between adsorbed intermediates, and the hydroxide species required for HOR in alkaline media should exist in the electrochemical double-layer region either in a surface adsorbed state (Pt-OHad) localized in the IHP or in an analogous reactive form accessible by Had intermediate. One route for Pt-OHad formation in alkaline electrolytes is via specific adsorption of OH‾ anions (Pt + OH‾ → Pt-OH ad + e‾) above potential of zero charge (Epzc).13,14 Recent studies have hypothesized that Pt-OHad formed in this route on “Pt-defect sites” (even in the Hupd region well below Epzc) furnishes the OHad species necessary in HOR.15,16 The evidence for the apparent existence of Pt-OHad in Hupd region comes from CO-stripping studies in alkaline media (so-called “pre-ignition region” related to early onset of CO-stripping in Hupd region at ~0.2 V).17,18 Such a pre-ignition behavior was suggested to not take place in acidic electrolytes due to possible occupation of supporting electrolyte anions on “Pt-defect sites”. Formation of Pt-OHad species in the Hupd region would imply that the plane of closest approach of hydroxide anions is the inner-Helmholtz plane (IHP). However, from the electrochemical and spectroscopic proof shown here (Figures S2 and S3), there is no specifically adsorbed Pt-OHad type species in the Hupd species clearly negating the possibility of hydroxide anions approaching the negatively charged Pt surface to the IHP.
This brings into question the mechanism of electrochemical CO oxidation at potentials as low as ~0.2 V on Pt. We propose that in the absence of specifically adsorbed Pt-OHad species in the Hupd region, the hydroxide species required for CO oxidation merely arises from the solution phase due to the abundance of OH‾ in the electrolyte. According to this mechanism shown above, reactive hydroxide species required for electrochemical CO oxidation is present in the outer-Helmholtz plane in a quasi-specifically adsorbed to form Pt-COad
…OHq-ad. This implies that the plane of closest approach of hydroxide anions in the Hupd region is limited to the outer-Helmholtz plane (OHP).

Accordingly, the reactions could be written as follows:
Pt-(COad)IHP + 2(OH‾)OHP → Pt-COad…(OH)q-ad → Pt + CO2 + H2O + e‾
where the OH‾ anion approaches the COad platinum surface up to the outer-Helmholtz plane followed by its direct interaction with CO to form the Pt-COad
…(OH)q-ad transition state structure. The OHq-ad species represents the reactive hydroxide species in a quasi-adsorbed state located at plane of closest approach (i.e. OHP) prior to the electron transfer and eventual formation of CO2.
Only at potentials positive of ~0.7 V where the Pt-OHad is formed via the specific adsorption of hydroxide anions directly on the Pt surface, the more well-known electrochemical CO oxidation process could be proposed to occur as follows:
Pt-(COad)IHP + 2Pt-(OHad)IHP → Pt + CO2 + H2O + e‾

Figure S6: (Top) Cyclic voltammetry of carbon supported Ru, PtRu, Nb, PtNb catalysts in argon purged 0.1 M HClO4 electrolyte at 20 mV/s. Electrode loading - 20 µg/cm2 of the metal on 0.247 cm2 glassy carbon disk electrode. (Bottom) HOR polarization curves as shown in Figure 3a along with a Ru/C catalyst shown here for comparison purposes in H2 saturated dilute electrolytes.
Figure S7: (a) XANES spectral region of PtRu/C catalyst obtained under in situ conditions at Ru K-edge in argon saturated 0.1 M NaOH electrolyte at various potentials as indicated. Inset in (a) is a magnification of the Ru K-edge white line and (b) represents the magnification of the Ru K-edge to illustrate the shift in XANES edge position with increasing anodic potentials. Gray vertical dashed line indicates the Ru K-edge at 22117 eV.
-1.2-1.0-0.8-0.6-0.4-0.20.00.20.4
0 0.2 0.4 0.6 0.8 1
i (A
/cm
2 )
E [V]
Ru/C
PtRu/C
-0.4-0.3-0.2-0.10.00.10.20.30.4
0 0.2 0.4 0.6 0.8 1 1.2
i (A
/cm
2 )
E (V)
Nb/CPtNb/C

Figure S5a shows the Ru K-edge XANES spectral feature of PtRu/C catalyst under in situ conditions in argon saturated 0.1 M NaOH electrolyte as a function of potential. Ru K-edge spectra correspond to the electronic excitation of core-level electrons from 1s levels to empty states with p-orbital character near the Fermi level. Arrows in Figures S5a&b indicate the change in Ru K-edge position and the white line intensity. It can be observed that at 0.05 V the XANES spectral feature in terms of the Ru K-edge position (22117 eV) and the white-line intensity that there is no evidence of oxide adsorption. Only at potentials E > 0.2 V, positive shift in the XANES edge position and marginal increase in the white line intensity indicate the formation of Ru-OHad. With increasing potentials (E > 0.2 V), the formation of electronegative oxide species on Ru from specific adsorption of hydroxide anions on Ru causes a shift in the electron density near the Fermi level of Ru atoms towards the oxide species, this increasing d-band electron vacancies and positive shift in the XANES edge position.

Figure S8: (a) In situ experimental Δµ signatures of Ru/C catalyst obtained by subtracting Ru K-edge XANES spectra at the various indicated potentials from the Ru K-edge XANES spectra collected at 0.30 V as reference according to Δµ = µ(V) - µ(0.30 V) in argon saturated 0.1 M NaOH. (Qualitatively similar delta-mu results were obtained on the PtRu/C catalyst at Ru K-edge. Ru K-edge delta-mu signatures of Ru/C catalyst is shown due to the ease of simulating the theoretical Δµ signatures on a monometallic surface as opposed to the alloy)
Experimental Δµ spectra of Ru/C catalyst in argon saturated 0.1 M NaOH (Figure S5a) was obtained via spectral subtraction of XANES at various potentials from that at 0.3 V vs RHE according to the following equation:
Δµe = µe(V) - µe(0.3 V)
For Ru K-edge XANES, experimental XANES signal at 0.30 V was used as the reference potential for psuedo-clean surface. As observed in the Ru cyclic voltammetry and Ru K-edge XANES, HUPD on Ru below 0.2 V was immediately followed by Ru-OHad formation at E > 0.2 V vs RHE rendering the choice of a completely clean surface devoid of any adsorbates not possible.
"Janin-type Ru6 cluster" was used in the form Ru6-HUPD to mimic the HUPD formation or Ru-OHad
to mimic oxide formation on Ru sites at different coordinate positions, i.e. either atop or fcc etc. Theoretical XANES spectra of these structural model with and without the desired adsorbates were then simulated using the FEFF 8.0 code9. These theoretical XANES spectra were then subjected to the same difference process utilized for the experimental data according to the following relationship:
Δµt = µt(Ru6-ads) - µt(Ru6-OHad)
where the "ads" represents the desired adsorbate of interest such as HUPD or oxide species (Oads or OHads) in a specific binding site on the catalyst. Theoretical µ(Ru6-OHad) was used as the

reference signature to mimic the experimental spectra at 0.3 V vs RHE. Experimental Δµ spectra were then compared to theoretical Δµ signatures in terms of the line shape, and energy position.
Delta-mu (Δµ) technique, a surface sensitive spectral subtraction methodology in the XANES region3,7 (see Supplementary Methods, Supporting Information), is utilized here to identify the chemical nature of surface adsorbates on Ru and detect any interference from Ru-OHad at potentials relevant for HOR. The experimental Δµ (Δµe) spectra of Ru shown in Figure S6 at 0.05 V and 0.2 V indicates a large positive feature from -40 to -20 eV followed by a negative dip at roughly -5 eV. Δµe spectra were extracted by subtracting the experimental Ru K-edge XANES absorption probabilities (µe) at the corresponding potentials of interest from that at 0.3 V. Typical Δµ studies are carried out by subtracting the XANES spectra at potentials of interest from that at a reference potential where the surface is observed to be devoid of any adsorbates. 7 For instance, Pt Δµe spectra are extracted by using the experimental Pt L3-edge XANES at 0.54 V as the reference potential where no adsorbates (Hupd, OHad) are observed.5-7 In the case of Ru, it was observed from CV (Figure 3) and XAS results (Supplementary Figures S5) that Ru-Hupd
formation (E ≤ 0.2 V) is immediately succeeded by Ru-OHad formation (E > 0.2 V) imparting a limitation on Δµ analysis such that no particular reference potential could be used for adsorbate-free Ru-surface. Nevertheless, Δµe was extracted by using experimental XANES at 0.3 V as the reference signal, and the theoretical delta-mu (Δµt) simulation was modified to suit this liability. The Δµt spectra were obtained by subtracting the theoretical absorption probabilities (µt) of Ru-Hupd from that of Ru-OHad (to simulate oxide growth at 0.3 V).
The experimental Δµ signatures of Ru-HUPD observed at 0.05 V and 0.2 V vs RHE are discussed in the main text. The experimental Δµ signatures at 0.6 V is characterized by negative dip at roughly -10 eV followed by a positive peak feature at the Ru K-edge absorption edge energy (i.e. E-E0 = 0 eV). These Δµ spectral features at potentials greater than 0.6 V continue to grow in magnitude concomitant to oxide growth on Ru (using XANES at 0.3 V as the reference signal, the Δµ signatures above 0.6 V vs RHE are qualitatively consistent with oxide formation on Ru although the transition from atop O to n-fold O (n = 2 or 3 or greater) are typically indistinguishable).

Figure S9: (Top) Theoretical Δµ signature obtained via the subtraction of simulated Ru K-edge XANES spectra of HUPD on Ru6 cluster with various site symmetries from atop-OHad adsorbed Ru6 cluster. (Bottom) Structural models used for XANES simulation showing HUPD adsorbed on Ru6 cluster at various adsorbate positions.
The theoretical signatures for Δµ of Hupd were similar despite the various adsorption site symmetries on Ru6 clusters.
Theoretical Delta Mu for Ru-HUPD
E-E0 [eV]
-60 -40 -20 0 20 40 60 80
[a
.u]
atop HUPD
two-fold HUPD
fcc HUPD
hcp HUPD
atop HUPD two-fold HUPD fcc HUPD hcp HUPD
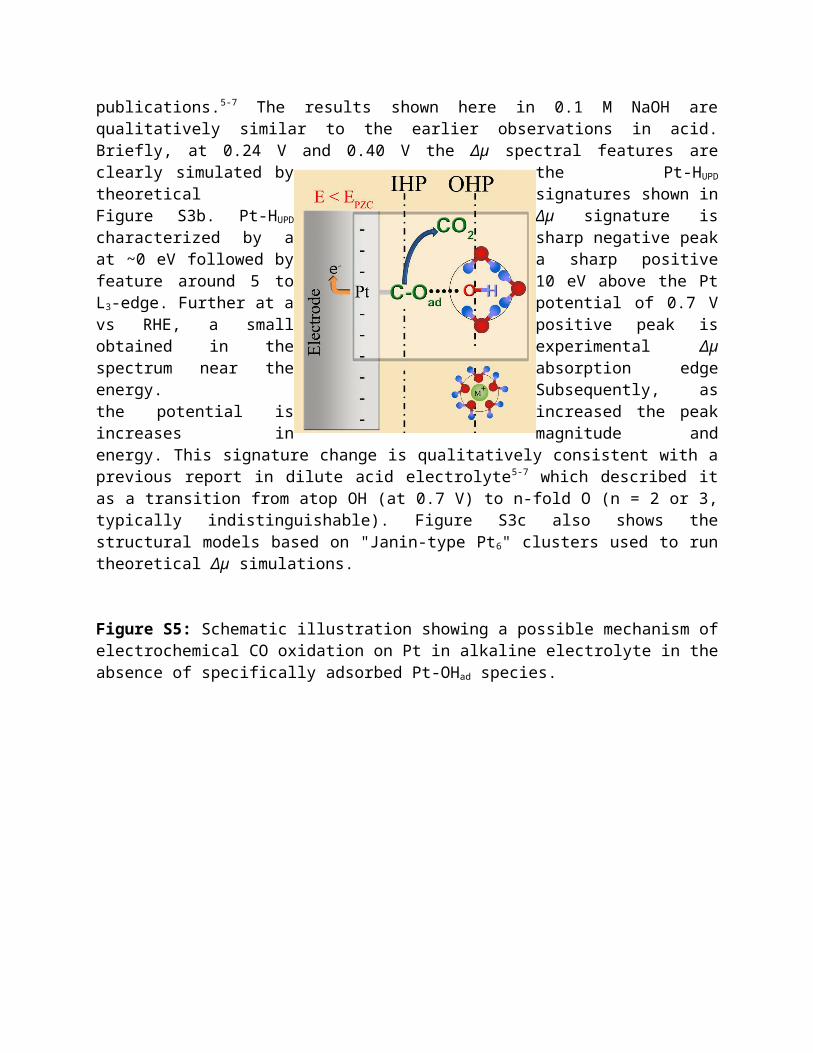
Figure S10: Theoretical Δµ signature obtained via the subtraction of simulated Ru K-edge XANES spectra of atop-HUPD on Ru6 cluster from adsorbate-free Ru6 cluster Δµ = µ(Ru6-HUPD) - µ(Ru6-Clean)
Further, several theoretical simulation were carried out using clean Ru6 cluster as the reference structure for simulating the theoretical Δµ signature. As can be seen in supplementary Figure S7 the theoretical Δµ fits in this case were unsuccessful and did not predict the experimentally observed Δµ signatures.
Unsuccessful Delta Mu Fit
E-E0 [eV]
-100 -50 0 50 100 150 200 250
[a
.u]
[Ru6-Hupd(atop)] - [Ru6]

Figure S11: XANES spectra of Pt/C and PtNb/C catalysts at the Pt L3 and L2 edges measured in N2 saturated alkaline electrolyte at 0.04, 0.54 and 0.94 V vs. RHE.

Figure S12: (a) Phase corrected Fourier transformed EXAFS and (b) normalized XANES of PtNb/C at Nb K-edge obtained under in situ conditions at in argon saturated 0.1 M NaOH electrolyte at various potentials as indicated.
Figure S13: (a) Normalized XANES spectra and (b) first derivative XANES region of Ni/C material obtained under in situ conditions at Ni K-edge in argon saturated 0.1 M NaOH electrolyte at various potentials as indicated. Also shown for comparison are the XANES spectra of standard nickel materials such as Ni foil, NiO, Ni(OH)2. Gray vertical dashed lines indicate the Ni K-edge positions at 8333 eV for elemental Ni, 8345 eV for NiO, and 8346 eV for Ni(OH)2.

Ni K-edge at 8333 eV in the Ni metal foil scan corresponds to the excitation of core-level electrons from 1s levels to empty states with p-orbital character (4p states) near the Fermi level. This feature at 8333 eV in the Ni metal foil scan is a dipole allowed 1s→4p transition. In the case of the NiO and Ni(OH)2 samples this XANES edge is absent and instead a weakly defined pre-edge feature is observed around ~8333 eV. This pre-edge feature is due to the dipole forbidden 1s→3d transition. This forbidden transition is made possible due to the hybridization of Ni 3d orbital with that of the 2p electron states from oxygen. This hybridization causes the Ni 3d orbital to assume p-like symmetry and makes possible the dipole forbidden 1s→3d transition. The primary signature for Ni in NiO and Ni(OH)2 is observed as sharp peaks around 8345 eV and 8346 eV in the first derivative spectra shown above. The Ni K-edge spectra of Ni/C catalyst above indicate a mixed character between that of metallic and oxidized Ni under all potentials from 0.05 V to 1.04 V. Given the non-noble nature of Ni, the XAS results of Ni/C catalyst under in situ conditions is interpreted as a bulk metallic Ni with a surface NiO(H) content.

Figure S14: (a) Normalized XANES spectra, (b) first derivative XANES region and (c) phase corrected Fourier transformed EXAFS of Cu/C material obtained under in situ conditions at Cu K-edge in argon saturated 0.1 M NaOH electrolyte at various potentials as indicated. Also shown for comparison are the spectra of standard copper materials such as Cu powder, Cu2O, CuO. Gray vertical dashed line indicates the Cu K-edge positions at 8979 eV for elemental Cu, 8980 eV for Cu2O, and 8983 eV for CuO.
Cu K-edge XANES spectra at 8979 eV for elemental Cu represents the transition of core-level s electrons to the low-lying p-states (4p) near the Fermi level. The first derivative of the Cu K-edge XANES shown above indicate Cu K-edge positions at 8979 eV, 8980 eV and 8983 eV for elemental Cu, Cu+, and Cu2+
oxidation states, respectively. The in situ XAS data for Cu/C catalyst obtained at 0.6 and 0.8 V clearly indicate that Cu exists in the Cu+ oxidation state. On the other hand, the first derivative XAS spectra at 0.1 V shows a minor positive shift to 8979.5 eV indicating a mixed Cu0 and Cu+ character. Also, the Fourier transformed R-space plots (phase corrected) of Cu K-edge EXAFS clearly shows the presence of Cu-O(H) bond at all potentials from 0.1 V to 0.8 V. The phase corrected Cu-O(H) bond length at 1.7 Å increases in its intensity whereas the Cu-Cu bond at 2.5 Å decreases in intensity with potential from 0.01 V to 0.8 V vs RHE.

Figure S15: (a) Cyclic voltammetry and (b) HOR activity of PtCo/C catalyst in dilute alkaline electrolyte. PtCo/C catalyst deposited on the glassy carbon disk electrode was first studied in an argon purged 0.1 M KOH electrolyte followed by measurement of its HOR activity in H2 purged 0.1 M KOH ("Before Cycling in Acid"). After this, the electrode was potential cycled in 0.1 M HClO4 following which the electrode was transferred back to 0.1 M KOH electrolyte to measure CV and HOR under alkaline conditions ("After Cycling in Acid"). Potential cycling of PtCo/C catalyst in acid electrolyte leads to the loss of Co-oxyhydroxide feature.19 Concomitantly, the HOR activity is also observed to drop.

Figure S16: High Resolution Transmission Electron Microscope images of as-synthesized PtNb/C catalyst. Also shown is the particle size distribution.
0
10
20
30
40
1 2 3 4 5 6 7 8 9 10 11 12Freq
uncy
(cou
nts)
Particle Size (nm)
Particle Size Distribution
PtNb/C

Figure S17: X-ray diffraction patterns of TKK 46% Pt/C, Johnson-Matthey 20% Pt/C and 50% PtRu/C. Also included is the in-house synthesized PtNb/C catalyst.

References
1 Arruda, T. M. et al. Fundamental Aspects of Spontaneous Cathodic Deposition of Ru onto Pt/C Electrocatalysts and Membranes under Direct Methanol Fuel Cell Operating Conditions: An in Situ X-ray Absorption Spectroscopy and Electron Spin Resonance Study. J. Phys. Chem. C 114, 1028-1040 (2010).
2 Newville, M. IFEFFIT: interactive XAFS analysis and FEFF fitting. Journal of Synchrotron Radiation 8, 322-324 (2001).
3 Mukerjee, S. & Arruda, T. In-situ synchrotron spectroscopic studies of electrocatalysis on highly dispersed nano-materials. Mod. Aspects Electrochem. 50, 503-572 (2010).
4 Lewis, E. A., Segre, C. U. & Smotkin, E. S. Embedded cluster [Delta]-XANES modeling of adsorption processes on Pt. Electrochimica Acta 54, 7181-7185 (2009).
5 Teliska, M., Murthi, V. S., Mukerjee, S. & Ramaker, D. E. Correlation of water activation, surface properties, and oxygen reduction reactivity of supported Pt-M/C bimetallic electrocatalysts using XAS. Journal of the Electrochemical Society 152, A2159-A2169 (2005).
6 Teliska, M., O'Grady, W. E. & Ramaker, D. E. Determination of H Adsorption Sites on Pt/C Electrodes in HClO4 from Pt L2,3 X-ray Absorption Spectroscopy. Journal of Physical Chemistry B 108, 2333-2344 (2004).
7 Teliska, M., O'Grady, W. E. & Ramaker, D. E. Determination of O and OH Adsorption Sites and Coverage in Situ on Pt Electrodes from Pt L23 X-ray Absorption Spectroscopy. Journal of Physical Chemistry B 109, 8076-8084 (2005).
8 Arruda, T. M., Shyam, B., Ziegelbauer, J. M., Mukerjee, S. & Ramaker, D. E. Investigation into the Competitive and Site-Specific Nature of Anion Adsorption on Pt Using In Situ X-ray Absorption Spectroscopy. J. Phys. Chem. C 112, 18087-18097 (2008).
9 Ankudinov, A. L., Ravel, B., Rehr, J. J. & Conradson, S. D. Real-space multiple-scattering calculation and interpretation of x-ray-absorption near-edge structure. Physical Review B: Condensed Matter and Materials Physics 58, 7565-7576 (1998).
10 Mukerjee, S., Srinivasan, S. & Soriaga, M. P. Role of structural and electronic properties of Pt and Pt alloys on electrocatalysis of oxygen reduction. An in situ XANES and EXAFS investigation. Journal of the Electrochemical Society 142, 1409-1422 (1995).
11 Brown, M., Peierls, R. E. & Stern, E. A. White lines in x-ray absorption. Physical Review B 15, 738-744 (1977).
12 Mattheiss, L. F. & Dietz, R. E. Relativistic tight-binding calculation of core-valence transitions in Pt and Au. Physical Review B 22, 1663-1676 (1980).
13 Markovic, N. M., Gasteiger, H. A. & Ross, P. N., Jr. Oxygen reduction on platinum low-index single-crystal surfaces in alkaline solution: rotating ring diskPt(hkl) studies. Journal of Physical Chemistry 100, 6715-6721 (1996).
14 Ramaswamy, N. & Mukerjee, S. Influence of Inner- and Outer-Sphere Electron Transfer Mechanisms during Electrocatalysis of Oxygen Reduction in Alkaline Media. The Journal of Physical Chemistry C 115, 18015-18026 (2011).
15 Schmidt, T. J., Ross, P. N. & Markovic, N. M. Temperature dependent surface electrochemistry on Pt single crystals in alkaline electrolytes Part 2. The hydrogen evolution/oxidation reaction. J. Electroanal. Chem. 524-525, 252-260 (2002).
16 Strmcnik, D. et al. Improving the hydrogen oxidation reaction rate by promotion of hydroxyl adsorption. Nat Chem 5, 300-306 (2013).
17 Schmidt, T. J., Ross, P. N. & Markovic, N. M. Temperature-Dependent Surface Electrochemistry on Pt Single Crystals in Alkaline Electrolyte: Part 1: CO Oxidation. J. Phys. Chem. B 105, 12082-12086 (2001).
18 Marković, N. M. et al. Effect of Temperature on Surface Processes at the Pt(111)−Liquid Interface: Hydrogen Adsorption, Oxide Formation, and CO Oxidation. The Journal of Physical Chemistry B 103, 8568-8577 (1999).

19 Ramaswamy, N. et al. Enhanced activity and interfacial durability study of ultra low Pt based electrocatalysts prepared by ion beam assisted deposition (IBAD) method. Electrochimica Acta 54, 6756-6766 (2009).