Embed Size (px)
Citation preview
ARCHIVES OF CIVIL ENGINEERING, LVIII, 2, 2012
DOI: 10.2478/v.10169-012-0009-9
PREDICTION OF ASPHALT CREEP COMPLIANCE USING ARTIFICIALNEURAL NETWORKS
A. ZOFKA1, I. YUT2
Creep compliance of the hot-mix asphalt (HMA) is a primary input of the current pavementthermal cracking prediction model used in the US. This paper discusses a process of trainingan Artificial Neural Network (ANN) to correlate the creep compliance values obtained from theIndirect Tension (IDT) with similar values obtained on small HMA beams from the Bending BeamRheometer (BBR). In addition, ANNs are also trained to predict HMA creep compliance fromthe creep compliance of asphalt binder and vice versa using the BBR setup. All trained ANNsexhibited a very high correlation of 97 to 99 percent between predicted and measured values.The binder creep compliance functions built on the ANN-predicted discrete values also exhibiteda good correlation when compared with the laboratory experiments. However, the simulation oftrained ANNs on the independent dataset produced a significant deviation from the measured valueswhich was most likely caused by the differences in material composition, such as aggregate typeand gradation, presence of recycled additives, and binder type.
Key words: asphalt binder, Hot Mix Asphalt, Artificial Neural Networks, Beam Bending Rheometer, cre-ep compliance, Indirect Tension test.
1. I
An Artificial Neural Network (ANN) is a layered system of neurons with weighted con-nections. It typically consists of an input layer, an output layer, and one or more hiddenlayers of interconnected processors (neurons) H [1]. Using a sample dataset ofinput and target values, an ANN can be trained to recognize a relationship betweeninputs and targets. As early as the late 1980s, civil engineers began using ANN forstructural evaluation and traffic analysis (F and K [2][3]). Since the 1990s,pavement researchers have successfully used ANNs for analyzing and predicting pave-ment performance (D [4], A-O and M [5], C and P
[6]; T et al. [7][8]). In particular, the ANNs were trained to predict rheologicalproperties of bituminous materials in the following applications:
1 Ph. D., Assistant Professor, Department of Civil and Environmental Engineering, University ofConnecticut, 261 Glenbrook Road, Unit 2037, Storrs Mansfield, CT, e-mail: [email protected]
2 M. S., Ph.D. Candidate, Department of Civil and Environmental Engineering, University of Con-necticut, 261 Glenbrook Road, Unit 2037, Storrs Mansfield, CT, e-mail: [email protected]

154 A. Z, I. Y
– Backcalculation of layer moduli for HMA pavements (C et al. [9])– Performance of porous HMA (M et al. [10])– Prediction of pavement fatigue life (H et al. [11])– Prediction of thermal cracking in the HMA pavements (Z [12])– Modeling of the HMA creep compliance (Z [13])– Prediction of dynamic modulus (E*) of the HMA from its resilient modulus (L-
C et al. [14], C et al. [15])– Evaluation of rubberized HMA containing reclaimed asphalt pavement (X and
A [16])Creep compliance of the hot-mixed asphalt (HMA) mixture is a primary material
input for the pavement thermal cracking prediction model in the recently developedMechanistic-Empirical Pavement Design Guide (M-EPDG) (H et al. [17]). TheIndirect Tension (IDT) test is currently the standard procedure for determining thecreep compliance of the HMA (R and B [18]). On the other hand, thecreep compliance and corresponding creep stiffness of the asphalt binders is typicallydetermined using a Bending Beam Rheometer (BBR) (B et al. [19]). Previousstudies have indicated that using the BBR device for HMA testing is a viable alterna-tive to IDT testing, especially for the practical and surrogate estimation of the HMAcreep compliance (Z et al. [20], Z and Y [21]). BBR testing of HMA thinbeams eliminates the need for the chemically extraction of the asphalt binder fromthe pavement cores. Using the BBR approach, asphalt binder properties, such as creepcompliance, can be backcalculated from the HMA results (Z [22]). Furthermore,multiple regression analysis successfully used the BBR creep measurements to predictthe IDT creep values for different temperature levels at fixed time points (Z et al.[23][24]).
This paper presents the underlying concept of ANNs, briefly describes the creeptesting procedures and experimental design, and discusses the process of training ANNsto correlate the IDT and BBR results for the HMA specimens. The paper also analyzesthe feasibility of using ANNs for predicting the HMA creep compliance from thebinder creep compliance and vice versa using the BBR experimental setup. Finally, theuniversality of trained ANNs was verified using an independent dataset.
2. U
Similar to a biological nervous system, an ANN consists of highly interconnected signalprocessors (neurons). Signals may only be allowed to travel through the neuron layersfrom input to output (feed-forward movement) or they can travel in both directions(feedback-, or loop- movement). Accordingly, two types of ANNs are available forsolving complex problems (Haykin [1]). Fig. 1 illustrates the layout of a feed-forwardANN with one hidden layer, as modeled in MATLAB R©Neural Network ToolboxTM5(Demuth et al. [25]). Each neuron in the input layer represents one input value p. The

P A C C U A N N 155
p value is multiplied by a previously assigned weight W to produce an input signal foreach neuron in the hidden layer. The input signals are simultaneously sent to all of theneurons in the hidden layer through weighted connections. Each neuron in the hiddenlayer sums all of the weighted inputs and adds bias b to produce an activation signalni j, as in the following equation:
(2.1) ni j =∑
i
(W jpi
)+ b j
where:i =number of inputs (summation index)j = number of neurons in the hidden layer
Fig. 1. Typical feed-forward ANN structure.
Next, the activation signal ni j is transformed into hidden output ai j using transferfunction f . Four transfer functions are available for the modeling of the output: (1)threshold (hardlim), (2) linear (purelin), (3) logistic sigmoid (logsig), and (4) hyper-bolic tangent sigmoid (tansig) (Haykin [1]). Eq. (2.2) through Eq. (2.5) show themathematical expressions of the transfer functions:
(2.2) ai j = hard lim(ni j < 0) = 0; ai j = hard lim(ni j > 0) = 1
(2.3) ai j = purelin(ni j) = ni j
(2.4) ai j = logsig(ni j) =1
1 + e−ni j

156 A. Z, I. Y
(2.5) ai j = tansig(ni j) =1 − e−ni j
1 + e−ni j
The hidden output ai j becomes an activation signal for a neuron in output layer asshown in the following equation:
(2.6) N jk =∑
j
(Wkai j
)+ bk
where k = number of outputsThe network output is then produced by the transformation of N jk into a predicted
value Ok = f(N jk) using one of the above functions – Eq. (2.2) through Eq. (2.5).Finally, the difference between predicted value Ok and target value Tk is evaluated bythe following error function (Moody [26]):
(2.7) Ek =12
∑
k
(Tk − Ok)2
The ultimate objective of training the ANN is to minimize error function Ek , thusimproving the ANN’s performance. This is done by adjusting the weight and biasvalue of each connection. While different minimization algorithms are available, themost popular is the back-propagation (BP) algorithm, as reported in the previouslymentioned studies. The BP algorithm is a method for computing the gradient of theerror function for each of training iterations with respect to the weights assigned to thefeed-forward network. The ANN training process can be stopped when the gradientapproaches a value of zero. A detailed description of the BP algorithm can be foundelsewhere (M [26], R and M [27], D et al. [25]).
3. C
An IDT test, the standard creep testing procedure for the HMA, induces the stress statesimilar to the stress state under a wheel load in the asphalt layer of pavement (R
and B [18]). During the IDT test, a cylindrical specimen is loaded verticallyalong its length and displacements are measured on both faces of the specimen. Fromthe test results, displacement curves are obtained under a constant load and the creepcompliance function D(t) is calculated using appropriate data interpretation procedures(R and B [18], Z et al. [28], C [29]). The IDT creep testfor the HMA specimens is typically performed at three temperatures, 0◦C, -10◦C, and-20◦C, regardless of the PG grade of the asphalt binder used in the mix (AASHTO[30]).
The BBR device is used to determine the creep compliance of asphalt bindersas part of the AASHTO specification in the US (B et al. [19], AASHTO [31]).The BBR device is based on the 3-point bending setup commonly used to characterize

P A C C U A N N 157
construction materials. A constant force is applied to the middle of the beam specimenand beam deflections are measured throughout the test. The creep compliance functionD(t) can then be obtained from elementary Bernoulli-Euler beam theory (G andT [32]).
Recently, a new approach was proposed to employ the BBR device to determinecreep compliance of the HMA (Z et al. [20]). Testing thin HMA beams in theBBR device has several advantages over IDT testing: the BBR testing procedure isvery easy and repeatable, sample size allows for a nearly nondestructive evaluationof the HMA in existing pavements, and the thin beams allow for an analysis of theeffect of aging at relatively small pavement depths. Furthermore, by using appropriatecomposite materials models or other statistical techniques, the properties of asphaltbinder can be backcalculated from the asphalt mixture results. This would eliminatethe chemical extraction procedure that is typically used to obtain binder samples fromthe HMA (Z et al. [20]).
4. E
4.1. M
Ten different asphalt binders and two aggregate sources were used to produce twentydifferent HMA mixes considered in this study. The asphalt binders represented typicalmaterials used in the colder climates in the US, including both modified and unmodifiedbinders. The two aggregate types were limestone and granite. The nominal maximumaggregate size (NMAS) of the aggregate blends was 12.5 mm. The optimum content ofasphalt binder (6.0 and 6.9 percent for granite and limestone aggregates, respectively)in the mix design was determined at 4 percent air voids. The actual air content asmeasured on the gyratory specimens, ranged between 3.7 and 4.8 percent. Table 1shows the types of the asphalt binders and the HMA mix identification system usedthroughout this study.
4.2. E T
All 10 asphalt binders were aged using the Rolling Thin Film Oven Test (RTFOT)procedure (AASHTO [33]) and then tested in the BBR device with two replicatesper each test temperature. Twenty HMA mixes were tested in the IDT and the BBRdevices. Both creep tests were performed for 1000 s at three temperatures selectedrelative to the lower PG grade of the asphalt binder used in a given HMA specimen.Due to different temperature susceptibilities, the size of the temperature incrementsdiffered between materials, with a step of 12◦C for the HMA and a smaller step of 6◦Cfor asphalt binders (see Table 2). At least 3 replicates were used in the IDT testing pereach temperature/material combination.

158 A. Z, I. Y
Table 1Designation system for HMA.
Asphalt binderdesignations
HMA mix designations
Granite aggregate Limestone aggregate
Mod
ified
asph
altbi
nder
s PG 58-40:M11 58-40:M1:GR5 58-40:M1:LM6
PG 58-34:M1 58-34:M1:GR 58-34:M1:LM
PG 58-34:M22 58-34:M2:GR 58-34:M2:LM
PG 64-34:M1 64-34:M1:GR 64-34:M1:LM
PG 64-34:M2 64-34:M2:GR 64-34:M2:LM
PG 64-28:M1 64-28:M1:GR 64-28:M1:LM
Unm
odifi
edas
phal
tbi
nder
s PG 58-28:U13 58-28:U1:GR 58-28:U1:LM
PG 58-28:U24 58-28:U2:GR 58-28:U2:LM
PG 64-28:U1 64-28:U1:GR 64-28:U1:LM
PG 64-22:U1 64-22:U1:GR 64-22:U1:LM
1)M1=Binder Modifier #1; 2)M2=Binder Modifier #2; 3)U1=Unmodified binder (Source #1);4)U2= Unmodified binder (Source #2); 5)GR=Granite Aggregate; 6)LM=Limestone Aggregate
The BBR testing of HMA beams followed a procedure similar to the asphalt binderBBR testing. The total number of HMA beams tested was approximately 600. Twentymixtures were tested at three temperature levels with an average of 10 replicates pereach mixture/temperature combination. More details on the experimental design canbe found elsewhere (Zoa and Yut [21], Zoa [22], Zoa et al. [23][24]).
Table 2Test temperatures for HMA and asphalt binders.
Test temperature valueTest temperature level
HMA (IDT and BBR) Asphalt binders (BBR)
(PG1+10)+12 H (High) –
(PG+10) I (Intermediate) H (High)
(PG+10)-6 – I (Intermediate)
(PG+10)-12 L (Low) L (Low)1PG refers to the lower PG limit (i.e. the second number in the PG designation in Table 1)

P A C C U A N N 159
5. T
In this study, three different ANNs were considered and trained separately for thefollowing cases:– Case A: ANN model to predict the IDT HMA creep compliance from the BBR
tests on thin HMA beams.– Case B: ANN model to predict the HMA creep compliance from the BBR tests on
asphalt binder.– Case C: ANN model to backcalculate the creep compliance of the asphalt binders
from the BBR tests on thin HMA beams.The datasets, training processes, and verification results of the above cases are
discussed next.
5.1. C D T ANN
The datasets used for ANN training was compiled from the BBR and IDT test results.The following variables were considered: creep compliance, D(t), performance gradePG (high and low temperature grades), presence of binder modifier, testing temperature,aggregate type, and air void content. Real (numerical) values were used for the inputsof D(t), performance grade, and air voids, while the remaining variables were assignedbinary (0/1) inputs. Three separate datasets were created for cases A, B, and C, forwhich separate ANNs were trained to simultaneously predict D(t) at 16, 60, 120, 240,500, and 1000 s. Table 3 summarizes the datasets used for the ANN training.
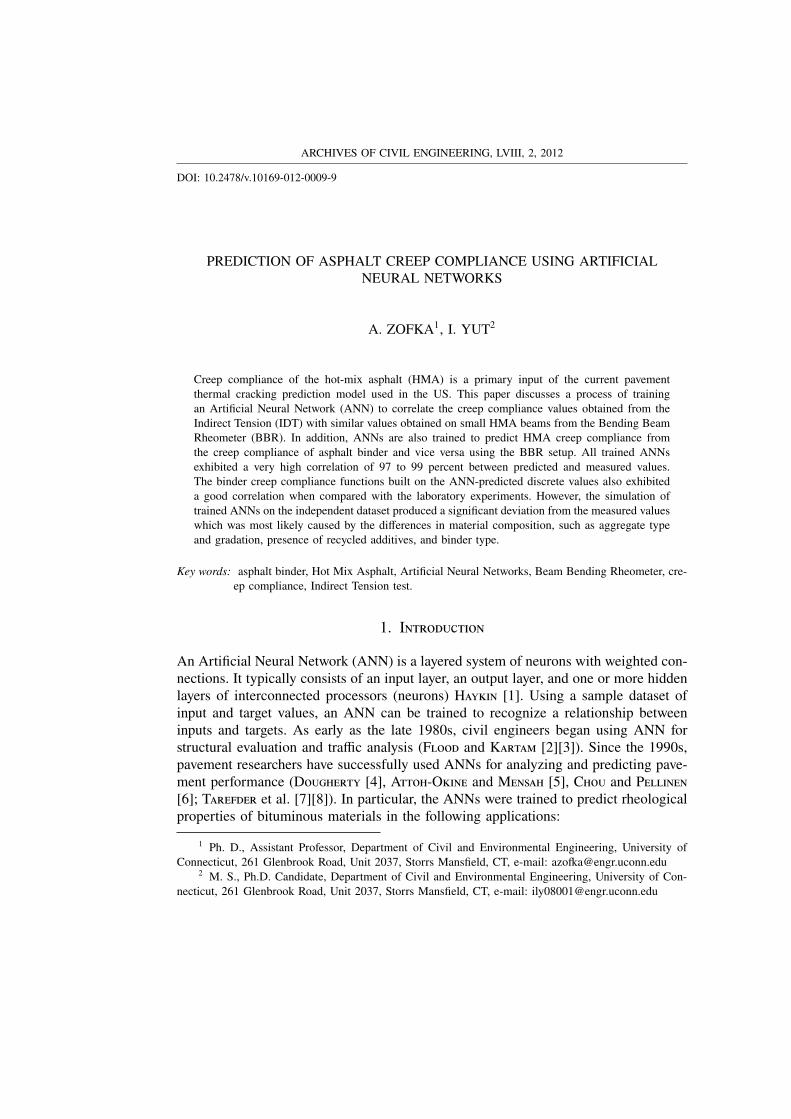
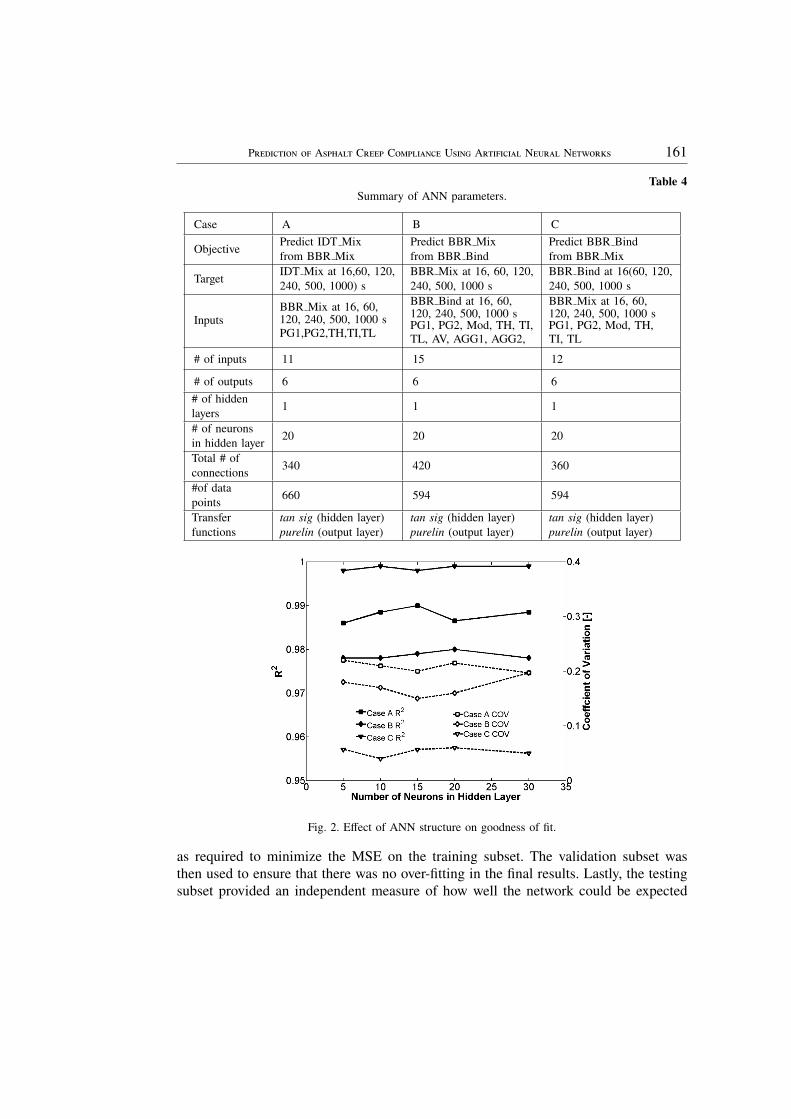
The typical architectural parameters of the ANN are the number of inputs (i), thenumber of outputs (k), the number of hidden layers, and number of neurons in eachhidden layer ( j). The ANN parameters and transfer functions used in this study aresummarized in Table 4 with the dataset descriptions for each case. Note that all threecases utilized six measured values of D(t) (at 16, 60, 120, 240, 500, and 1000 s) as inputvariables but include different combinations of explanatory variables (factors). Thosecombinations were finalized through iterative processes in which only the variablesthat significantly contributed to the minimization of the mean-squared error (MSE) ina particular case were included in the corresponding dataset.
Additionally, the effect of the amount of neurons in the hidden layers on thegoodness of fit was evaluated by training ANN with 5 to 30 neurons for each case (A, B,and C). Fig. 2 illustrates the change in R-squared and the coefficient of variation (COV)with an increase in the number of neurons. The R-squared trends fluctuate around 0.99,0.98, and 0.999 for cases A, B, and C, respectively. Although the difference betweencases in terms of R-squared is statistically significant, it is sufficiently small to bepractically neglected. On the other hand, the three cases (A, B, and C) yield moredistinctive trends in the variability of results, as measured by COV. Fig. 2 shows CaseC with the lowest COV at about 5 to 7 percent, Case B with a COV of 15 to 17percent, and Case A with the highest COV of around 20 percent. Possible reasons for

160 A. Z, I. Y
Table 3Summary of variables for the ANN training.
Variable IndexDesignation
(Input/ Target)
ValueAssigned(Real/Binary)
Range(min;max)
Level1
Level2
Level3
High temperaturegrade (Tmax), ◦C PG1 Input Real 58; 64
Low temperaturegrade (Tmin), ◦C PG2 Input Real -40; -22
Modifier,Yes/No [1/0] Mod Input Binary N/A 1 0
Air VoidsContent, % AV Input Real 3.72; 4.80
Tmin+12for mix,Tmin forbinders, ◦C
TH Input Binary N/A 1 0 0
Tmin for mix,Tmin-6 forbinders, ◦C
TI Input Binary N/A 0 1 0
Tmin-12 for mix,Tmin-12 forbinders, ◦C
TL Input Binary N/A 0 0 1
Binder creepcompliance fromBBR test, D(t)(1/GPa)
BBR BindInput (Case B)/Target (Case C) Real 0.8; 59
Aggregate Type– Granite AGG1 Input Binary N/A 0 1
Aggregate Type– Limestone AGG2 Input Binary N/A 1 0
Mix creepcompliance fromBBR test, D(t)(1/GPa)
BBR MixTarget (Case B)/Input (Cases A
and C)Real 0.05; 1.48
Mix creepcompliance fromIDT test, D(t)(1/GPa)
IDT Mix Target (Case A) Real 0.03; 2.32
such differences are discussed in the following section. Based on this assessment ofthe effect of the number of neurons on ANN goodness of fit, an amount of 20 neuronswas selected to be used in all cases so that the results are comparable. This number ofneurons also satisfies the “golden rule” of ANNs, to have approximately half as manyneuron connections (see Table 4) as data points in the dataset (S [34]).
To create and evaluate each case’s ANN, each dataset was randomly divided intothree subsets – training, validation, and testing – containing 60 percent, 20 percent, and20 percent of data points, respectively. First, the ANN performed as many iterations
P A C C U A N N 161
Table 4Summary of ANN parameters.
Case A B C
ObjectivePredict IDT Mixfrom BBR Mix
Predict BBR Mixfrom BBR Bind
Predict BBR Bindfrom BBR Mix
TargetIDT Mix at 16,60, 120,240, 500, 1000) s
BBR Mix at 16, 60, 120,240, 500, 1000 s
BBR Bind at 16(60, 120,240, 500, 1000 s
InputsBBR Mix at 16, 60,120, 240, 500, 1000 sPG1,PG2,TH,TI,TL
BBR Bind at 16, 60,120, 240, 500, 1000 sPG1, PG2, Mod, TH, TI,TL, AV, AGG1, AGG2,
BBR Mix at 16, 60,120, 240, 500, 1000 sPG1, PG2, Mod, TH,TI, TL
# of inputs 11 15 12
# of outputs 6 6 6# of hiddenlayers 1 1 1
# of neuronsin hidden layer 20 20 20
Total # ofconnections 340 420 360
#of datapoints 660 594 594
Transferfunctions
tan sig (hidden layer)purelin (output layer)
tan sig (hidden layer)purelin (output layer)
tan sig (hidden layer)purelin (output layer)
Fig. 2. Effect of ANN structure on goodness of fit.
as required to minimize the MSE on the training subset. The validation subset wasthen used to ensure that there was no over-fitting in the final results. Lastly, the testingsubset provided an independent measure of how well the network could be expected

162 A. Z, I. Y
to perform on data not used in the training process. The prediction for each subset wasevaluated by the level of correlation (R2) between predicted (Output) and measured(Target) values of D(t).
It should be noted that originally three different training/validation/testing subsetdivisions were used in this study (50/25/25, 60/20/20, and 70/15/15). It was foundhowever that they did not yield any significant difference in terms of goodness of fitand therefore only the results of the 60/20/20 division are reported in this paper.
5.2. A ANN R
Fig. 3, Fig. 4, and Fig. 5 include charts of the correlation between the output and targetvalues of D(t) for all values in cases A, B, and C, respectively. Analysis of the R2
values for Case A shown in Fig. 3 suggests that the HMA creep compliance valuesfrom the IDT and the BBR beams test are highly correlated (R2 =0.99). Similarly, Fig.4 and Fig. 5 show high goodness of fit values for cases B and C respectively, whichillustrate the ability of the ANNs to predict the creep compliance of the HMA mixfrom the creep compliance of asphalt binders and vice versa. It can also be observedthat the overall R2 value for each dataset does not differ much between the cases withvalues ranging between 0.98 and 0.999.
Fig. 3. Correlation charts of ANN outputs versus targets for Case A (all values).
It should be noted that the similarly high correlations between ANN predictionsand the measured values in Cases A, B, and C were accompanied by different levels

P A C C U A N N 163
Fig. 4. Correlation charts of ANN outputs versus targets for Case B (all values).
Fig. 5. Correlation charts of ANN outputs versus targets for Case C (all values).

164 A. Z, I. Y
of variability in the predicted values. Case A (predict IDT D(t) Mix from BBR D(t)Mix) had the greatest dispersion of ANN-predicted values as seen in the correlationchart found in Fig. 3. Case B (predict BBR D(t) Mix from BBR D(t) Binder) exhibitednoticeably lower variability (Fig. 4). Finally, Case C (predict BBR D(t) Binder fromBBR D(t) Mix) yielded a very low variation in predicted values (Fig.5). One possibleexplanation for such a phenomenon is that in Case A, the variation in the ANN predic-tions was affected by variations in both the BBR and the IDT tests performed on theHMA samples which typically produces higher variability than asphalt binder testing.
To further investigate the ANN predictions, the predicted and experimentally de-termined creep compliance curves were constructed and compared separately for eachcase. In practical applications, such as the previously mentioned M-EPDG approach,the entire creep compliance functions are used to predict pavement performance asopposed to discrete values.
5.3. A C C ANN S
Based on the ANN-predicted and test measured values at 16, 60, 120, 240, 500, and1000 s, creep compliance functions were constructed for each considered case (A, B,and C). Altogether, 60 pairs of creep functions were plotted for Case A and 54 pairs ofcreep curves were plotted for both Case B and C. The curves were then evaluated interms of the percent error between the output (predicted) and target (measured) values.It was found that at 95 percent reliability the average percent error of the predictedcreep compliance values were approximately 40, 30, and 10 percent for Cases A, B,and C, respectively. Examples of the creep compliance curves and their associatedprediction errors are found in Fig. 6, Fig. 7, and Fig. 8. The ANN-predicted errorsshown in these figures correspond well with the variation in the BBR-measured valuesof the HMA creep compliance reported elsewhere (Zoa 2007; Zoa et al. 2008b).
Fig. 6. Representative Creep Curves for Case A.

P A C C U A N N 165
Fig. 7. Representative Creep Curves for Case B.
Fig. 8. Representative Creep Curves for Case C.
5.4. V U ANN I D
As shown above, the ANNs trained in this study using the BBR and IDT data pro-duced a high correlation between measured and predicted creep compliance values.The final phase of this study was intended to verify the universality of trained ANNs,e.g. their ability to retain a high correlation between measured and predicted values

166 A. Z, I. Y
when using entirely independent data. The verification dataset included the BBR- andIDT-measured values of D(t) at 16, 60, 120, and 240 s for the following two HMAs:
Warm Mixed Asphalt (WMA) with PG 58-34 modified asphalt binder and graniteaggregate including up to 20% of Reclaimed Asphalt Pavement (RAP), 4% air voids(WMA:58-34:M:RAP).
Dense-graded HMA with PG 58-28 unmodified binder and granite aggregate inc-luding 5% of manufactured waste shingles, 4% air voids (58-28:U:GRS).
Corresponding asphalt binders were aged using the Pressure Aging Vessel (PAV)procedure (AASHTO [35]) which is different from the RTFOT procedure used for thedevelopment of the ANNs. To eliminate this inconsistency, simple adjustment factorswere applied to the PAV values. The factors were determined as a function of the testtemperature using a large creep compliance binder database (Marasteanu et al. [36]).
The previously trained ANNs were simulated using verification data as inputs, andthe produced outputs were then compared with target (measured) values. It was notedthat the range of prediction errors for the verification dataset was significantly widerthan that for the training dataset. The percent error in the predicted creep compliancevalues ranged between approximately 10 to 60 percent for Case A, 5 to 55 percentfor Case B, and 20 to 80 percent for Case C. The comparison of creep curves forCase A (Fig. 9a) yielded a fairly high level of prediction (within 10-20 percent fromthe measured values) for the RAP-modified mix WMA:58-34:M:RAP. However, theANN simulation of the same case for the HMA mix with 5% shingles (58-28:U:GRS)produced remarkably high deviation (within 40 to 60 percent) from the measured values(Fig. 9a). Fig. 10 illustrates the opposite trend for Case B (15 to 60 percent error forWMA:58-34:M:RAP and only 5 to 15 error for 58-28:U:GRS). In Case C, ANN failedto yield any reasonable level of prediction for both type of binders, yielding 20 to 80percent deviation from measured D(t) values.
Higher error in the predictions generated by the verification datasets can be pri-marily attributed to the differences in the material composition: the verification setcontained recycled additives that typically introduce higher variability into any cha-racterization testing, and such materials were not used when developing the ANNsstructures. Furthermore, the binder aging conversion factors (from PAV to RTFOT)as well as binder type may contribute up to 10% to the prediction error. Aggregatemechanical properties and gradation distribution also differed in the verification datawhich increased further the error of prediction. One potential solution to improveprediction accuracy is to expand and to diversify training dataset, and to implementadditional factors that would account for material heterogeneity.

P A C C U A N N 167
Fig. 9. Case A Verification: Creep Curves for a) binder WMA:58-34:M:RAP, b) binder 58-28:U:GRS.

168 A. Z, I. Y
Fig. 10. Case B Verification: Creep Curves for a) binder WMA:58-34:M:RAP, b) binder 58-28:U:GRS.

P A C C U A N N 169
Fig. 11. Case C Verification: Creep Curves for a) binder WMA:58-34:M:RAP, b) binder 58-28:U:GRS.

170 A. Z, I. Y
6. C
This paper explores the feasibility of using ANNs to predict the creep compliance ofasphalt binders from the BBR tests on the HMA specimens and vice versa. It alsoevaluates the ANNs ability to correlate BBR data for HMA beams with the results ofthe more traditional IDT testing on short HMA cylinders.
The experimental effort described in this paper included the IDT and BBR resultsfor 20 HMA mixes with different rheological properties at three temperature levels.The 20 HMA mixes were produced by combining 10 modified and unmodified bindersof different performance grades with two types of aggregates – granite and limestone.For the full dataset, the RTFOT-aged binders were also tested in the BBR device inaccordance with the standard AASHTO procedure.
The experimentally obtained creep compliance values for the HMA and binderswere used to train feed-forward, back-propagation Artificial Neural Networks. SeparateANNs were considered for the following three cases:1. Case A: predict the IDT HMA creep compliance from the BBR tests on thin HMA
beams.2. Case B: predict the creep compliance of the HMA mix from the BBR tests results
on the corresponding asphalt binder.3. Case C: backcalculate creep compliance of the binder from the BBR test results
on the corresponding HMA beams.It was found that the ANN prediction models demonstrated very high correlation
of 97 to 99 percent between ANN-predicted and experimentally measured values for allthree cases albeit with different levels of variability. Furthermore, the creep compliancecurves for all three cases showed fairly good agreement (5 to 20 percent error) withmeasured values. Lastly, the universality of the trained ANNs was tested by using theBBR and IDT test results from the independent source. The simulation results showedsignificantly higher level of deviation from target values (10 to 80 percent error). Higherror values could be attributed to the significantly different material compositionof the verification set. The materials in the verification dataset included ReclaimedAsphalt Pavement (RAP) and manufactured waste shingles. In addition, the gradationand mechanical properties of the aggregate differed from the original material used todevelop the ANNs.
Based on an analysis of the ANN training and verification results produced in thisstudy, it can be reasonably concluded that ANNs are suitable for predicting the creepcompliance of the HMA from the BBR-measured creep compliance of the binder, espe-cially in the initial material evaluation process. Furthermore, trained ANNs can matchthe BBR-measured creep compliance of HMAs with the creep compliance obtainedfrom the more traditional IDT procedure. Predicted HMA creep compliance values canthen be used in the pavement performance models included in the M-EPDG. However,one should keep in mind that ANNs may produce high prediction errors if material

P A C C U A N N 171
composition is significantly different from the original material used to calibrate theANNs.
A
The materials used in this paper were obtained from the National Pooled Fund Study776 (Marasteanu et al. [36]). All experimental testing was conducted at the Universityof Minnesota under the supervision of Professor Mihai Marasteanu to whom the authorsare sincerely grateful. The authors also thank Mr. Tim Clyne for providing independentdata from MnROAD Research facility.
R
1. S. H, Neural networks and learning machines, Prentice Hall, New York, NY 1999.2. I. F, N. K, Neural networks in civil engineering. I: Principles and understanding. Journal
of Computing in Civil Engineering, 8, 131-48, 1994a.3. I. F, N. K, Neural networks in civil engineering. II: Systems and application. Journal of
Computing in Civil Engineering, 8, 149-62, 1994b.4. M. D, A review of neural networks applied to transport. Transportation Research Part C:
Emerging Technologies, 3, 247-60, 1995.5. N.O. A-O, S. M, Potential applications of system identification techniques in pavement
performance modeling. Proceedings of the Second International Symposium on Maintenance andRehabilitation of Pavements and Technological Control, National Center for Asphalt Technology,Auburn, Alabama, 2001.
6. S. C, T.K. P, Assessment of construction smoothness specification pay factor limits usingartificial neural network modeling. Journal of Transportation Engineering, 131, 563-70, 2005.
7. R.A. T, L. W, M. Z, Development and application of a rut prediction model forflexible pavement. Transportation Research Record 1936, 201-9, 2005a.
8. R.A. T, L. W, M. Z, Neural network model for asphalt concrete permeability. Journalof Materials in Civil Engineering, 17, 19-27, 2005b.
9. H. C, A. G, E. T, M.R. T, Backcalculation of full-depth asphalt pave-ment layer moduli considering nonlinear stress-dependent subgrade behavior. International Journalof Pavement Engineering, 6, 171-82, 2005.
10. A. M, A. M, M. M, T. S, Performance of porous asphalt concrete.Journal of the Association of Asphalt Paving Technologists, 75, 1053-94, 2006.
11. C. H, Y.M. N, S.A. R, Predicting asphalt concrete fatigue life using artificialneural network approach. Paper No. 07-1607, 86th Transportation Research Board Annual Meeting(CD-ROM), Transportation Research Board, National Research Council, Washington, DC. 2007.
12. M. Z, Thermal cracking prediction using artificial neural network. In Al-Qadi, Scarpas & Loizos(Ed.), Pavement Cracking, Taylor and Francis Group, 379-86, 2008a.
13. M. Z, Modeling the creep compliance of asphalt concrete using the artificial neural networktechnique. Proceedings of the Annual Congress of the Geo-Institute of ASCE (GeoCongress 2008),New Orleans, LA, 1-7, 2008b.

172 A. Z, I. Y
14. A.T. LC, Y.R. K, S.R. R, Backcalculation of dynamic modulus from resilient modulusof asphalt concrete with an artificial neural network. Transportation Research Record: Journal ofTransportation Research Board, 2057, 107-13, 2008.
15. H. C, K. G, M.B. B, Neural networks based concrete airfield pavementlayer moduli backcalculation. Civil Engineering and Environmental Systems, 25, 185-99, 2008.
16. F. X, S.N. A, Artificial neural network approach to estimating stiffness behavior ofrubberized asphalt concrete containing reclaimed asphalt pavement. Journal of Transportation, 135,8, 580-9, 2009.
17. J.P. H, et al., Development of the 2002 guide for the design of new and rehabilitated pavementstructures: Phase II. Report for National Cooperative Highway Research Program, TransportationResearch Board, National Research Council, Washington, DC., 2004.
18. R. R, W.G. B, The development of a measurement and analysis system to accuratelydetermine asphalt concrete properties using the Indirect Tensile mode. Journal of the Association ofAsphalt Paving Technologists, 61, 304-28, 1992.
19. H. B, D.A. A, D. C, The Bending Beam Rheometer; a simple device formeasuring low-temperature rheology of asphalt binders. Journal of Association of Asphalt PavingTechnologists, 61, 117-53, 1992.
20. A. Z, M. M, X. L, T. C, J. MG, Simple method to obtain asphalt binderslow temperature properties from asphalt mixtures properties. Journal of the Association of AsphaltPaving Technologists, 80, 255-82, 2005.
21. A. Z, I. Y, Alternative procedure for determination of hot mix asphalt creep compliance.ASTM Journal of Testing and Evaluation, 39, 1, 1-11, 2011.
22. A. Z, Investigation of asphalt concrete creep behavior using 3-point bending test. Ph.D. disser-tation, University of Minnesota, Minneapolis, MN, 2007.
23. A. Z, M. M, M. T, Determination of asphalt mixture creep compliance at lowtemperatures using thin beam specimens. Transportation Research Record 2057, 134-9, 2008a.
24. A. Z, M. M, M. T, Investigation of asphalt mixture creep compliance at lowtemperatures. Journal of Road Materials and Pavement Design, 9, 269-286, 2008b.
25. H. D, M. B, M. H, Neural network toolbox 5 user’s guide. The MathWorks, Inc.,Natick, MA, 2007.
26. J.E. M, The effective number of parameters: an analysis of generalization and regularization innonlinear learning systems. Advances in neural information processing systems 4, Morgan KaufmanPublishers, San Mateo, CA, 1992.
27. R.D. R, R.J. M, Neural smithing: supervised learning in feedforward artificial neural networks,The MIT Press, Cambridge, MA, 1992.
28. W. Z, A. D, D.E. N, Viscoelastic analysis of diametral compression of asphaltconcrete. Journal of Engineering Mechanics, 123, 6, 596-603, 1997.
29. D. C, Analysis of creep data from Indirect Tension test on asphalt concrete. Journal of theAssociation of Asphalt Paving Technologists, 67, 458-77, 1998.
30. AASHTO Standard T 322-03, Determining the creep compliance and strength of hot-mix asphalt(HMA) using the Indirect Tensile test device. Standard Specifications for Transportation Materialsand Methods of Sampling and Testing, AASHTO, Washington, DC, 2005a.
31. AASHTO Standard T313-05, Standard method of test for determining the flexural creep stiffness ofasphalt binder using the Bending Beam Rheometer (BBR), Standard Specifications for TransportationMaterials and Methods of Sampling and Testing, AASHTO, Washington, DC, 2005b.
32. J.M. G, S.P. T, Mechanics of materials, Third Edition, PWS-KENT Publishing Company,Boston, MA, 1990.

P A C C U A N N 173
33. AASHTO Standard T240-03, Standard method of test for effect of heat and air on a moving filmof asphalt (Rolling Thin-Film Oven Test), Standard Specifications for Transportation Materials andMethods of Sampling and Testing, AASHTO, Washington, DC, 2005c.
34. W. S, Neural Networks: Frequently Asked Questions. Retrieved December 1, 2011, fromftp://ftp.sas.com/pub/neural/FAQ.html, 1997.
35. AASHTO Standard PP, Practice for accelerated aging of asphalt binder using Pressurized AgingVessel (PAV), Standard Specifications for Transportation Materials and Methods of Sampling andTesting, AASHTO, Washington, DC, 1998.
36. M. M, et al., Investigation of low temperature cracking in asphalt pavements – NationalPooled Fund Study 776. Report MN/RC 2007-43, Minnesota Department of Transportation, St. Paul,MN, 2007.
Extended Abstract
Creep compliance of the hot-mix asphalt (HMA) is a primary input of the pavement thermal crackingprediction model in the recently developed Mechanistic-Empirical Pavement Design Guide (M-EPDG)in the US. The HMA creep compliance is typically determined from the Indirect Tension (IDT) testsand requires complex experimental setup. On the other hand, creep compliance of asphalt binders isdetermined from a relatively simple three- point bending test performed in the Bending Beam Rheometer(BBR) device. This paper discusses a process of training an Artificial Neural Network (ANN) to correlatethe creep compliance values obtained from the IDT with those from an innovative approach of testing HMAbeams in the BBR. In addition, ANNs are also trained to predict HMA creep compliance from the creepcompliance of asphalt binder and vice versa using the BBR setup. All trained ANNs exhibited a very highcorrelation of 97 to 99 percent between predicted and measured values. The binder creep compliancecurves built on the ANN-predicted values also exhibited good correlation with those obtained fromlaboratory experiments. However, the simulation of trained ANNs on the independent dataset produced asignificant deviation from the expected values which was most likely caused by the differences in materialcomposition, such as aggregate type and gradation, presence of recycled additives, and binder type.
Remarks on the paper should be Received December 12, 2011sent to the Editorial Officenot later than September 30, 2012
revised versionJune 10, 2012