Embed Size (px)
Citation preview
78
ORIGINAL ARTICLE DOI: ORIGINALNI RAD UDC:
Serbian Dental Journal, vol. 65, No 2, 2018
ORIGINAL ARTICLE DOI: 10.2478/sdj-2018-0008ORIGINALNI RAD UDC: 616.31-07:528.7; 616.314-089.23
Photogrammetry based space analysis measurements in orthodontic diagnosis
Marijana Arapović-Savić1, Mihajlo Savić2, Mirjana Umićević-Davidović1, Adriana Arbutina1, Nenad Nedeljković3, Branislav Glišić3
1University of Banja Luka, Faculty of Medicine, Department of Orthodontics, Banja Luka, Republic of Srpska, Bosnia and Herzegovina;2University of Banja Luka, Faculty of Electrical Engineering, Banja Luka, Republic of Srpska, Bosnia and Herzegovina;3University of Belgrade, Faculty of Dental Medicine, Department of Orthodontics, Belgrade, Serbia
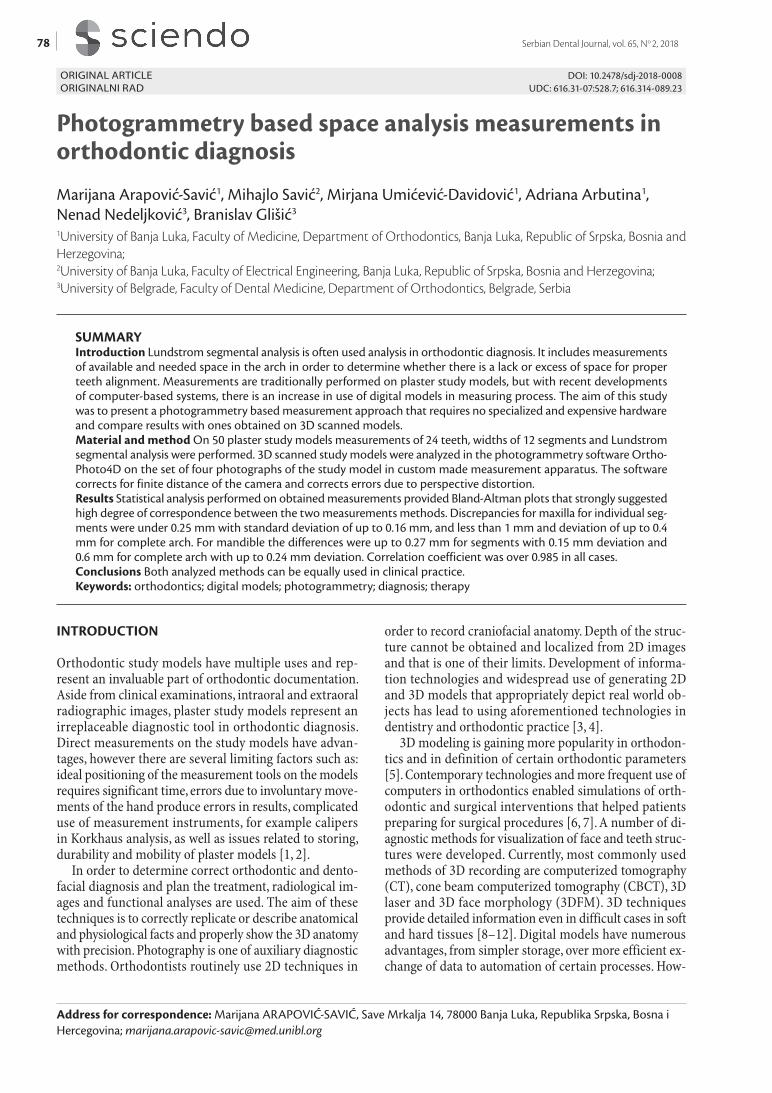
SUMMARYIntroduction Lundstrom segmental analysis is often used analysis in orthodontic diagnosis. It includes measurements of available and needed space in the arch in order to determine whether there is a lack or excess of space for proper teeth alignment. Measurements are traditionally performed on plaster study models, but with recent developments of computer-based systems, there is an increase in use of digital models in measuring process. The aim of this study was to present a photogrammetry based measurement approach that requires no specialized and expensive hardware and compare results with ones obtained on 3D scanned models.Material and method On 50 plaster study models measurements of 24 teeth, widths of 12 segments and Lundstrom segmental analysis were performed. 3D scanned study models were analyzed in the photogrammetry software Ortho-Photo4D on the set of four photographs of the study model in custom made measurement apparatus. The software corrects for finite distance of the camera and corrects errors due to perspective distortion.Results Statistical analysis performed on obtained measurements provided Bland-Altman plots that strongly suggested high degree of correspondence between the two measurements methods. Discrepancies for maxilla for individual seg-ments were under 0.25 mm with standard deviation of up to 0.16 mm, and less than 1 mm and deviation of up to 0.4 mm for complete arch. For mandible the differences were up to 0.27 mm for segments with 0.15 mm deviation and 0.6 mm for complete arch with up to 0.24 mm deviation. Correlation coefficient was over 0.985 in all cases.Conclusions Both analyzed methods can be equally used in clinical practice.Keywords: orthodontics; digital models; photogrammetry; diagnosis; therapy
Address for correspondence: Marijana ARAPOVIĆ-SAVIĆ, Save Mrkalja 14, 78000 Banja Luka, Republika Srpska, Bosna i Hercegovina; [email protected]
INTRODUCTION
Orthodontic study models have multiple uses and rep-resent an invaluable part of orthodontic documentation. Aside from clinical examinations, intraoral and extraoral radiographic images, plaster study models represent an irreplaceable diagnostic tool in orthodontic diagnosis. Direct measurements on the study models have advan-tages, however there are several limiting factors such as: ideal positioning of the measurement tools on the models requires significant time, errors due to involuntary move-ments of the hand produce errors in results, complicated use of measurement instruments, for example calipers in Korkhaus analysis, as well as issues related to storing, durability and mobility of plaster models [1, 2].
In order to determine correct orthodontic and dento-facial diagnosis and plan the treatment, radiological im-ages and functional analyses are used. The aim of these techniques is to correctly replicate or describe anatomical and physiological facts and properly show the 3D anatomy with precision. Photography is one of auxiliary diagnostic methods. Orthodontists routinely use 2D techniques in
order to record craniofacial anatomy. Depth of the struc-ture cannot be obtained and localized from 2D images and that is one of their limits. Development of informa-tion technologies and widespread use of generating 2D and 3D models that appropriately depict real world ob-jects has lead to using aforementioned technologies in dentistry and orthodontic practice [3, 4].
3D modeling is gaining more popularity in orthodon-tics and in definition of certain orthodontic parameters [5]. Contemporary technologies and more frequent use of computers in orthodontics enabled simulations of orth-odontic and surgical interventions that helped patients preparing for surgical procedures [6, 7]. A number of di-agnostic methods for visualization of face and teeth struc-tures were developed. Currently, most commonly used methods of 3D recording are computerized tomography (CT), cone beam computerized tomography (CBCT), 3D laser and 3D face morphology (3DFM). 3D techniques provide detailed information even in difficult cases in soft and hard tissues [8–12]. Digital models have numerous advantages, from simpler storage, over more efficient ex-change of data to automation of certain processes. How-
79Stomatološki glasnik Srbije. 2018;65(2):78-88
ever, question often raised is whether these models truth-fully depict study models orthodontic therapy is based on. Aside from this, real world obstacle to wider use is also the cost of high quality 3D scanners and software packages required for quality work [13, 14, 15].
Other than 3D scanning, during the measurement pro-cess, it is possible to use digital photographs through the process called photogrammetry. Today, photogrammetry implies modeling based on a set of photographs, although the term itself is derived from “measuring from photo-graphs” [16]. Modeling based on photographs through the use of photogrammetry is considered one of the most advanced techniques of image processing that provides accurate data and detailed 3D information. This method allows precision and reliability of data tied to the image and control points (CP) that represent locations of corre-sponding points in two or more digital images and can be used to connect images. Therefore, there is a requirement of at least two images in order to recreate 3D information through the use of projection and perspective geometry [17]. In order for a set of photographs to be a basis for photogrammetry, there needs to be an overlap between the images. This means that each geometric element that we want to locate must be present in at least two photo-graphs [16, 17].
The aim of this paper was to describe an alternative ap-proach in measuring process during space analysis based on the use of photogrammetry in custom developed Or-thoPhoto4D software. This program calculates and cor-rects errors due to perspective distortion.
MATERIAL AND METHODS
Fifty sets of plaster study models were used in the study. All study models were with permanent dentition, with-out caries lesions with adequate restorations. In the first
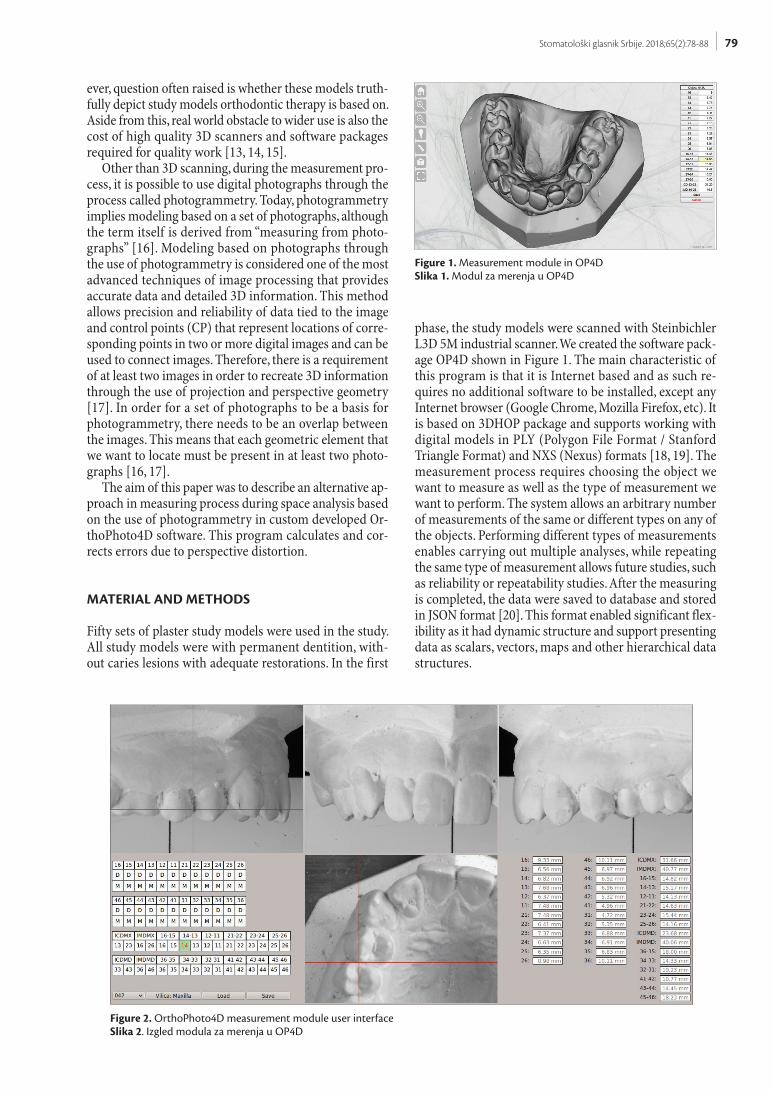
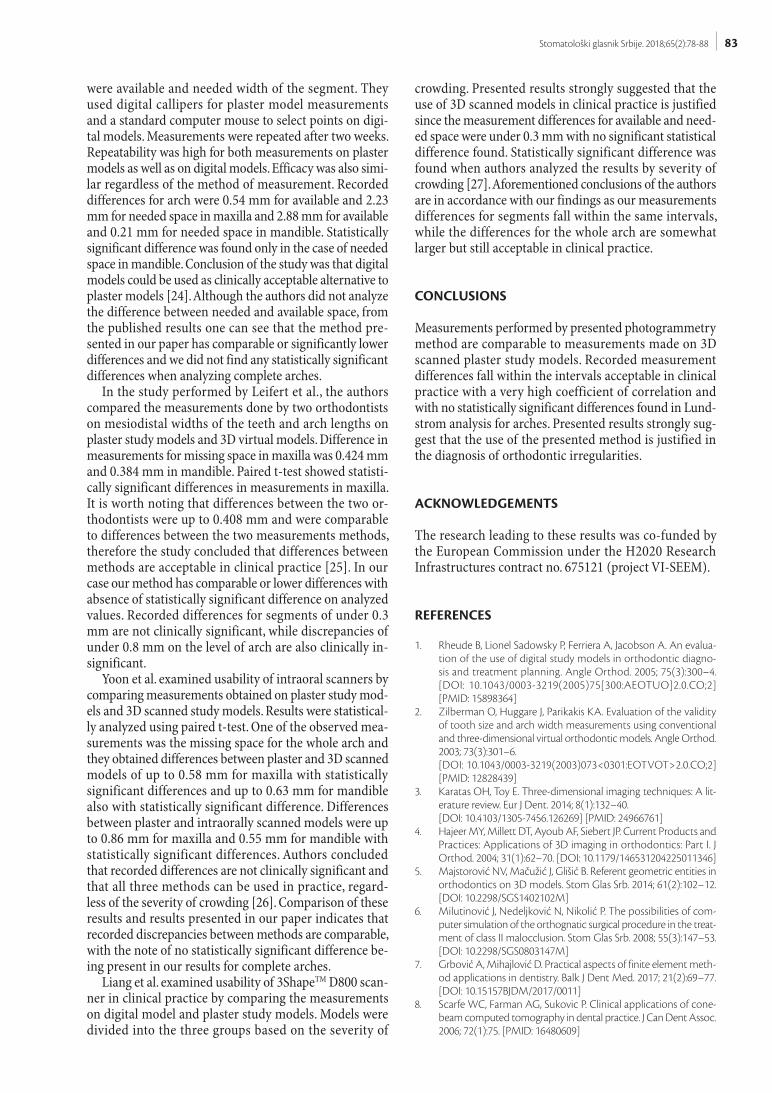
phase, the study models were scanned with Steinbichler L3D 5M industrial scanner. We created the software pack-age OP4D shown in Figure 1. The main characteristic of this program is that it is Internet based and as such re-quires no additional software to be installed, except any Internet browser (Google Chrome, Mozilla Firefox, etc). It is based on 3DHOP package and supports working with digital models in PLY (Polygon File Format / Stanford Triangle Format) and NXS (Nexus) formats [18, 19]. The measurement process requires choosing the object we want to measure as well as the type of measurement we want to perform. The system allows an arbitrary number of measurements of the same or different types on any of the objects. Performing different types of measurements enables carrying out multiple analyses, while repeating the same type of measurement allows future studies, such as reliability or repeatability studies. After the measuring is completed, the data were saved to database and stored in JSON format [20]. This format enabled significant flex-ibility as it had dynamic structure and support presenting data as scalars, vectors, maps and other hierarchical data structures.
Figure 1. Measurement module in OP4DSlika 1. Modul za merenja u OP4D
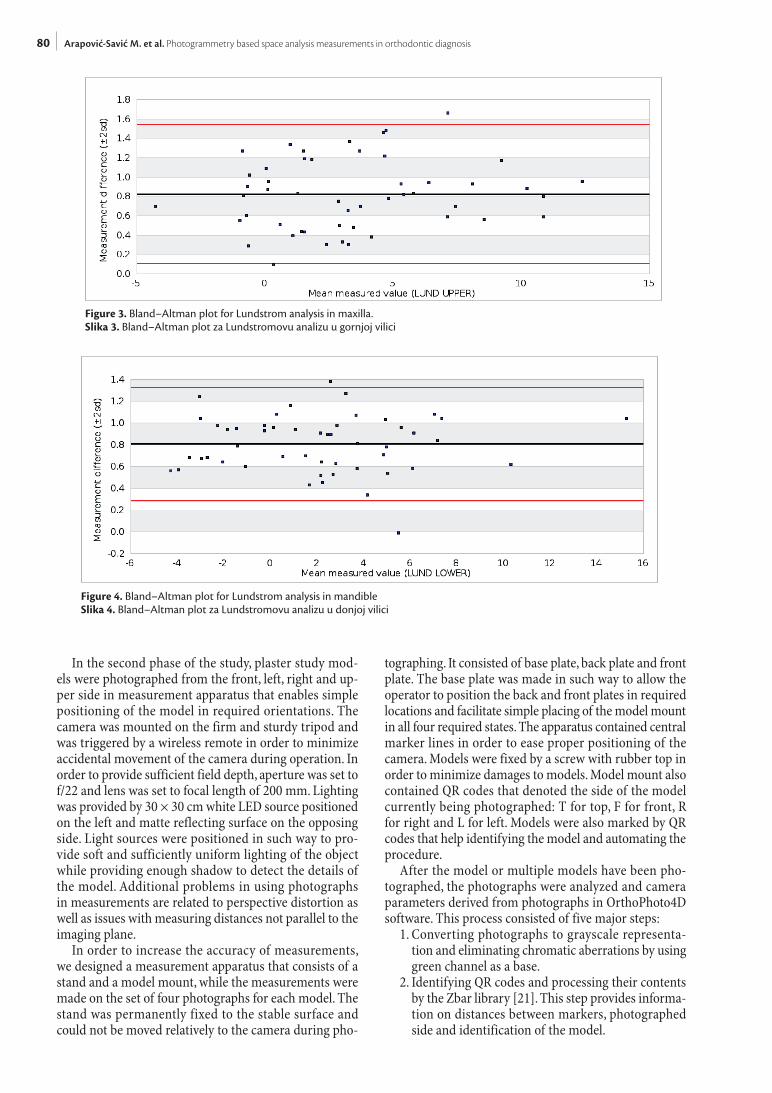
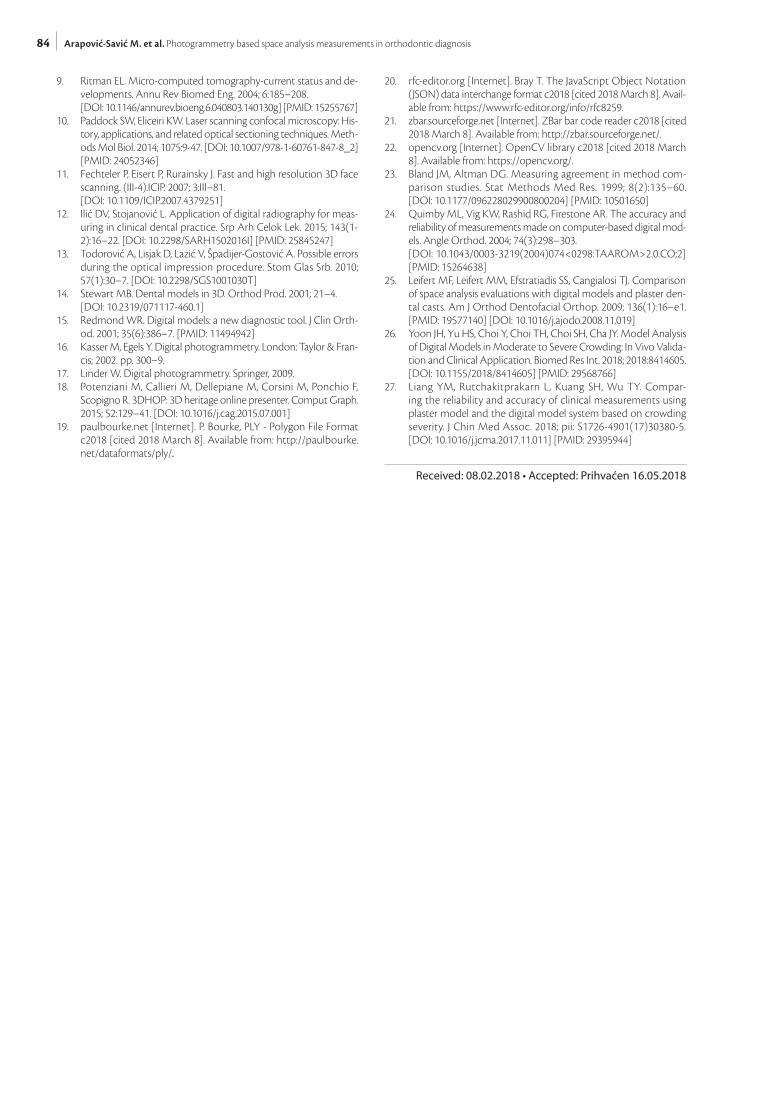
Figure 2. OrthoPhoto4D measurement module user interfaceSlika 2. Izgled modula za merenja u OP4D
80
In the second phase of the study, plaster study mod-els were photographed from the front, left, right and up-per side in measurement apparatus that enables simple positioning of the model in required orientations. The camera was mounted on the firm and sturdy tripod and was triggered by a wireless remote in order to minimize accidental movement of the camera during operation. In order to provide sufficient field depth, aperture was set to f/22 and lens was set to focal length of 200 mm. Lighting was provided by 30 × 30 cm white LED source positioned on the left and matte reflecting surface on the opposing side. Light sources were positioned in such way to pro-vide soft and sufficiently uniform lighting of the object while providing enough shadow to detect the details of the model. Additional problems in using photographs in measurements are related to perspective distortion as well as issues with measuring distances not parallel to the imaging plane.
In order to increase the accuracy of measurements, we designed a measurement apparatus that consists of a stand and a model mount, while the measurements were made on the set of four photographs for each model. The stand was permanently fixed to the stable surface and could not be moved relatively to the camera during pho-
tographing. It consisted of base plate, back plate and front plate. The base plate was made in such way to allow the operator to position the back and front plates in required locations and facilitate simple placing of the model mount in all four required states. The apparatus contained central marker lines in order to ease proper positioning of the camera. Models were fixed by a screw with rubber top in order to minimize damages to models. Model mount also contained QR codes that denoted the side of the model currently being photographed: T for top, F for front, R for right and L for left. Models were also marked by QR codes that help identifying the model and automating the procedure.
After the model or multiple models have been pho-tographed, the photographs were analyzed and camera parameters derived from photographs in OrthoPhoto4D software. This process consisted of five major steps:
1. Converting photographs to grayscale representa-tion and eliminating chromatic aberrations by using green channel as a base.
2. Identifying QR codes and processing their contents by the Zbar library [21]. This step provides informa-tion on distances between markers, photographed side and identification of the model.
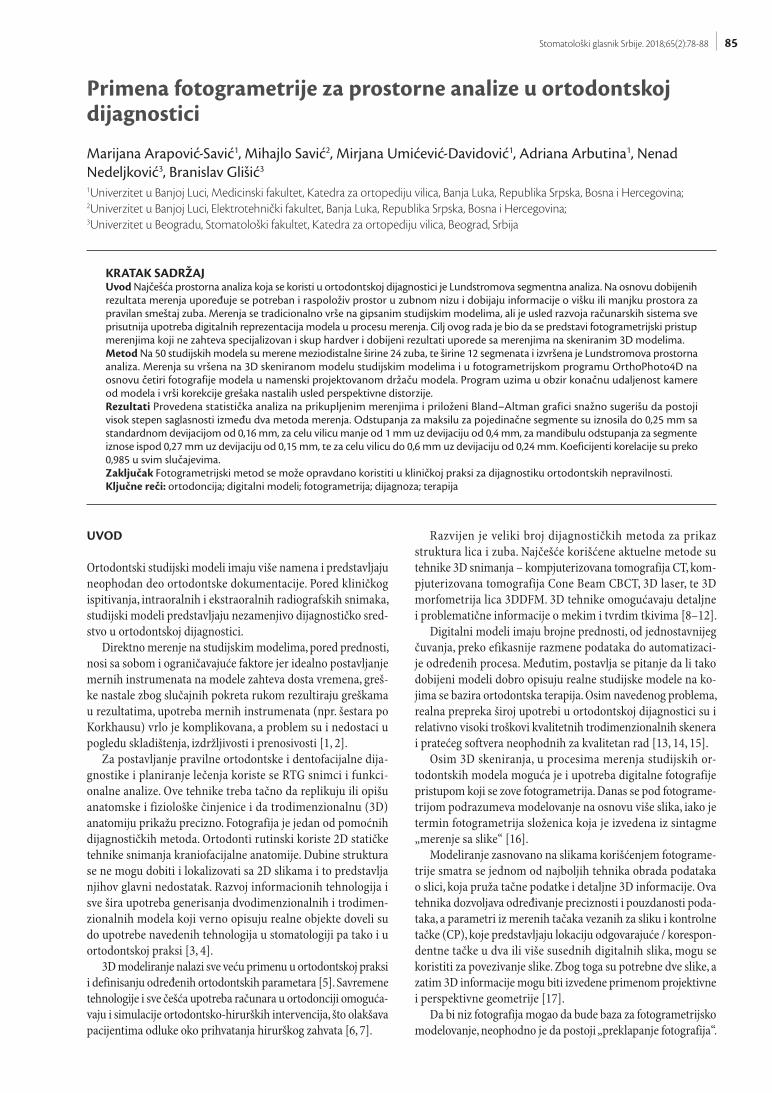
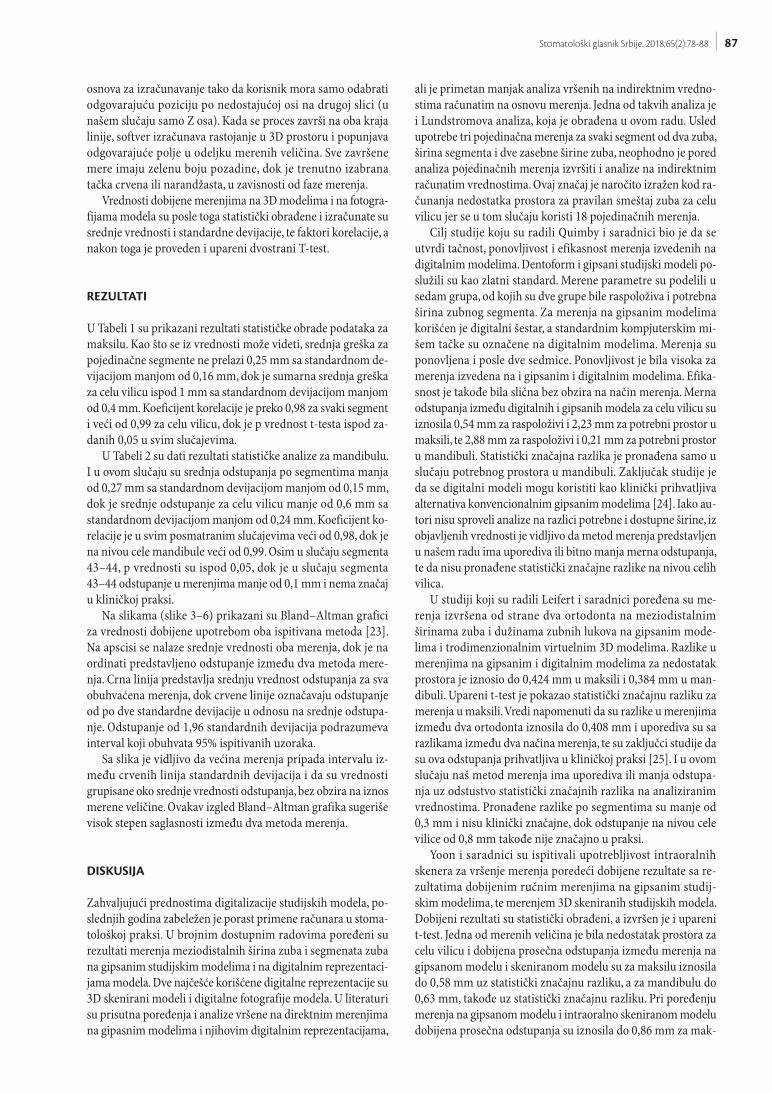
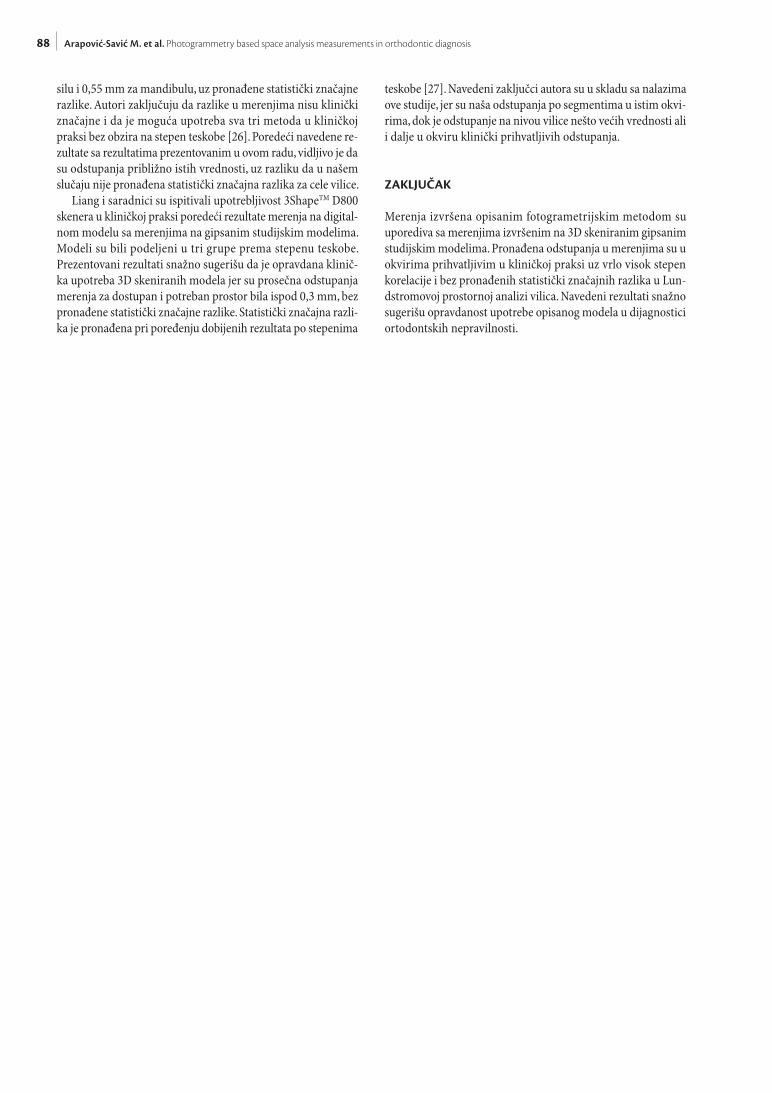
Figure 3. Bland–Altman plot for Lundstrom analysis in maxilla.Slika 3. Bland–Altman plot za Lundstromovu analizu u gornjoj vilici
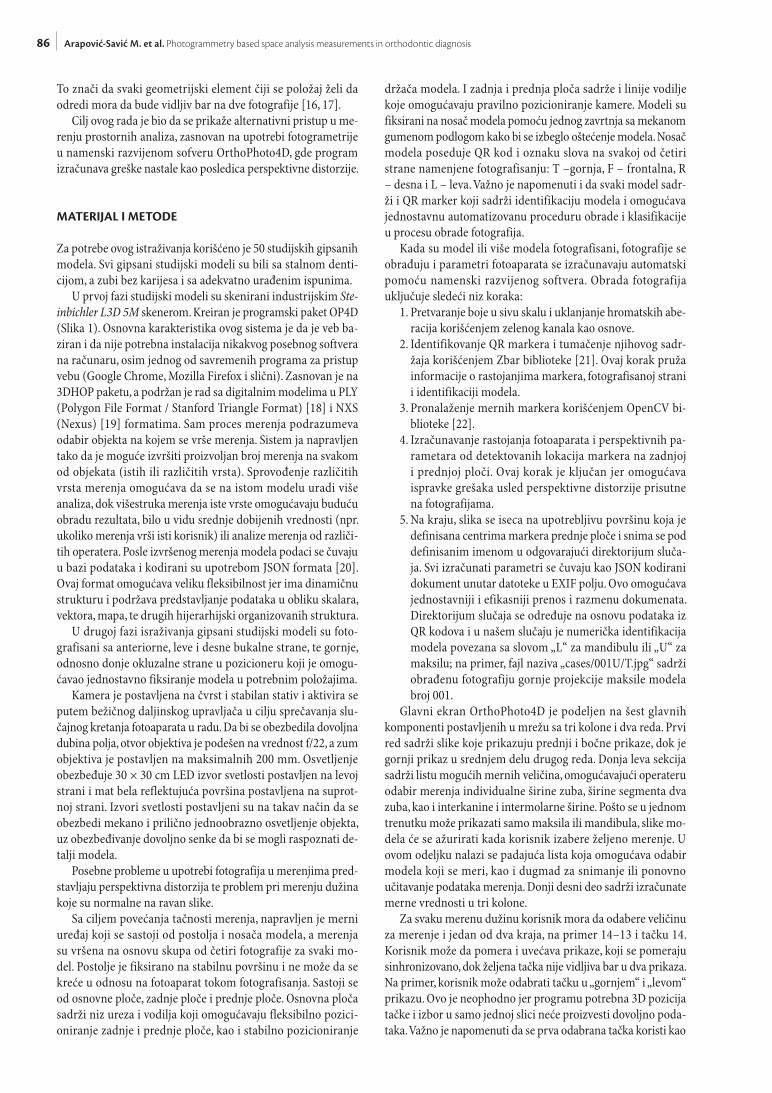
Figure 4. Bland–Altman plot for Lundstrom analysis in mandibleSlika 4. Bland–Altman plot za Lundstromovu analizu u donjoj vilici
Arapović-Savić M. et al. Photogrammetry based space analysis measurements in orthodontic diagnosis
81Stomatološki glasnik Srbije. 2018;65(2):78-88
3. Identifying measurement markers by Open CV li-brary [22].
4. Deriving the camera-object distance and perspective parameters based on measured distances of markers on the back and front plates. This step was crucial as data derived here were used to correct the perspec-tive errors.
5. The final step consisted of cropping the image to the area defined by the front plate markers and saving the file to defined case directory. All data derived during the process were stored in JSON format in a field within EXIF structure of the JPEG file that provided simple and efficient storage and transfer of data. Case directories as determined from data in QR codes and in our case was numerical identification of the model where letter L was for mandible and U for maxilla, for example, file named “cases/001U/T.jpg” denoted processed photograph of the top projection of maxilla of the model number 001.
Measurement user interface view of OrthoPhoto4D consists of six components in a grid consisting of two rows and three columns. Front, left and right model view are placed on the top row, the top model view is in the
middle of the bottom row. Bottom left section contains the list of possible measurements and the operator can choose between tooth width, segment width, inter-canine and inter-molar width. Due to the fact that we can display only one arch at the time, model views will automatically update if the operator selects a point from currently hid-den arch. This section also contains model chooser and “Save” and “Load” buttons. Measured values are presented in a three-column grid in the bottom right section.
For each measurement, the operator has to select cor-responding measurement button and one of the two end points, for example 14-13 segment and 14 point. The op-erator can translate and enlarge the views that are auto-matically synchronized, in order to select the point in at least two views. As an example, the operator can select the location of the point in “top” and “left” views. This require-ment is mandatory in order to locate the point in 3D space and there is insufficient information in location in just one projection. The first selected point is used to calculate two coordinates while the second location is used only for the third coordinate (Z axis in this case). Once the opera-tor locates both ends of the measured length the program will calculate the length in 3D space and display the value
Figure 5. Bland–Altman plot for Lundstrom analysis for all segments in maxillaSlika 5. Bland–Altman plot za Lundstromovu analizu svih segmenata u gornjoj vilici
Figure 6. Bland–Altman plot for Lundstrom analysis for all segments in mandibleSlika 6. Bland–Altman plot za Lundstromovu analizu svih segmenata u donjoj vilici
82
in the value field section. Each completed measurement is denoted by green background color with measurements in progress being red or orange depending on the current phase of measurement. Measurement values obtained on 3D models and photographs were subsequently statisti-cally processed and the mean values and standard devia-tions were calculated, as well as correlation coefficients and paired t-test.
RESULTS
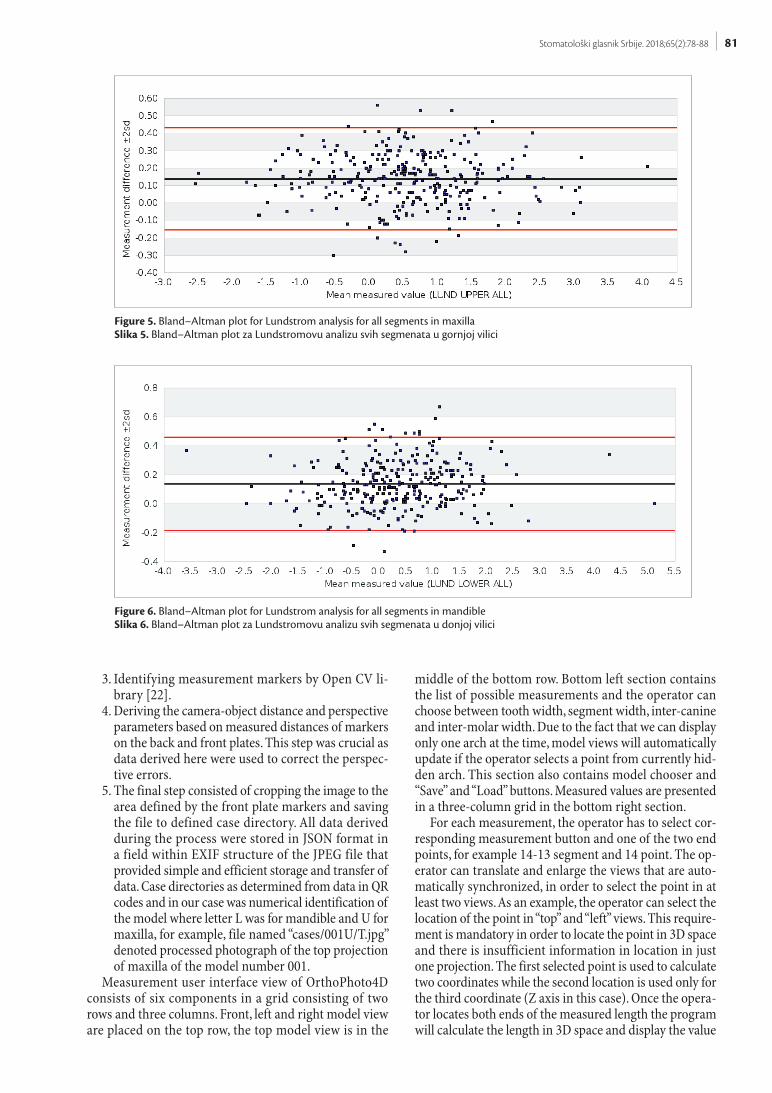
Table 1 contains the results of statistical analysis of the maxilla measurements. Mean value of difference for indi-vidual segments was under 0.25 mm with standard devia-tion of under 0.16 mm while the mean difference for the whole arch was under 1 mm and deviation under 0.4 mm. Correlation coefficient was over 0.98 for each segment and over 0.99 for the arch, while p values of t-test were under required 0.05 in all cases (p<0.0001).
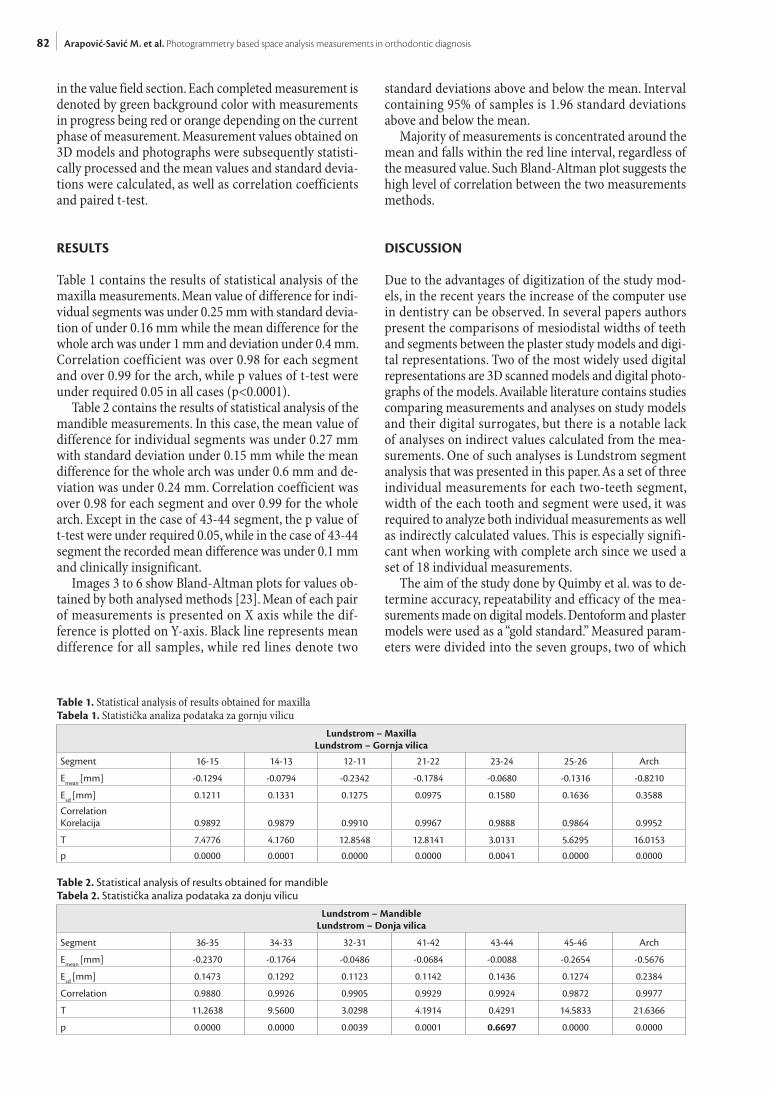
Table 2 contains the results of statistical analysis of the mandible measurements. In this case, the mean value of difference for individual segments was under 0.27 mm with standard deviation under 0.15 mm while the mean difference for the whole arch was under 0.6 mm and de-viation was under 0.24 mm. Correlation coefficient was over 0.98 for each segment and over 0.99 for the whole arch. Except in the case of 43-44 segment, the p value of t-test were under required 0.05, while in the case of 43-44 segment the recorded mean difference was under 0.1 mm and clinically insignificant.
Images 3 to 6 show Bland-Altman plots for values ob-tained by both analysed methods [23]. Mean of each pair of measurements is presented on X axis while the dif-ference is plotted on Y-axis. Black line represents mean difference for all samples, while red lines denote two
standard deviations above and below the mean. Interval containing 95% of samples is 1.96 standard deviations above and below the mean.
Majority of measurements is concentrated around the mean and falls within the red line interval, regardless of the measured value. Such Bland-Altman plot suggests the high level of correlation between the two measurements methods.
DISCUSSION
Due to the advantages of digitization of the study mod-els, in the recent years the increase of the computer use in dentistry can be observed. In several papers authors present the comparisons of mesiodistal widths of teeth and segments between the plaster study models and digi-tal representations. Two of the most widely used digital representations are 3D scanned models and digital photo-graphs of the models. Available literature contains studies comparing measurements and analyses on study models and their digital surrogates, but there is a notable lack of analyses on indirect values calculated from the mea-surements. One of such analyses is Lundstrom segment analysis that was presented in this paper. As a set of three individual measurements for each two-teeth segment, width of the each tooth and segment were used, it was required to analyze both individual measurements as well as indirectly calculated values. This is especially signifi-cant when working with complete arch since we used a set of 18 individual measurements.
The aim of the study done by Quimby et al. was to de-termine accuracy, repeatability and efficacy of the mea-surements made on digital models. Dentoform and plaster models were used as a “gold standard.” Measured param-eters were divided into the seven groups, two of which
Table 1. Statistical analysis of results obtained for maxillaTabela 1. Statistička analiza podataka za gornju vilicu
Lundstrom – MaxillaLundstrom – Gornja vilica
Segment 16-15 14-13 12-11 21-22 23-24 25-26 Arch
Emean [mm] -0.1294 -0.0794 -0.2342 -0.1784 -0.0680 -0.1316 -0.8210
Esd [mm] 0.1211 0.1331 0.1275 0.0975 0.1580 0.1636 0.3588
CorrelationKorelacija 0.9892 0.9879 0.9910 0.9967 0.9888 0.9864 0.9952
T 7.4776 4.1760 12.8548 12.8141 3.0131 5.6295 16.0153
p 0.0000 0.0001 0.0000 0.0000 0.0041 0.0000 0.0000
Table 2. Statistical analysis of results obtained for mandibleTabela 2. Statistička analiza podataka za donju vilicu
Lundstrom – MandibleLundstrom – Donja vilica
Segment 36-35 34-33 32-31 41-42 43-44 45-46 Arch
Emean [mm] -0.2370 -0.1764 -0.0486 -0.0684 -0.0088 -0.2654 -0.5676
Esd [mm] 0.1473 0.1292 0.1123 0.1142 0.1436 0.1274 0.2384
Correlation 0.9880 0.9926 0.9905 0.9929 0.9924 0.9872 0.9977
T 11.2638 9.5600 3.0298 4.1914 0.4291 14.5833 21.6366
p 0.0000 0.0000 0.0039 0.0001 0.6697 0.0000 0.0000
Arapović-Savić M. et al. Photogrammetry based space analysis measurements in orthodontic diagnosis
83Stomatološki glasnik Srbije. 2018;65(2):78-88
were available and needed width of the segment. They used digital callipers for plaster model measurements and a standard computer mouse to select points on digi-tal models. Measurements were repeated after two weeks. Repeatability was high for both measurements on plaster models as well as on digital models. Efficacy was also simi-lar regardless of the method of measurement. Recorded differences for arch were 0.54 mm for available and 2.23 mm for needed space in maxilla and 2.88 mm for available and 0.21 mm for needed space in mandible. Statistically significant difference was found only in the case of needed space in mandible. Conclusion of the study was that digital models could be used as clinically acceptable alternative to plaster models [24]. Although the authors did not analyze the difference between needed and available space, from the published results one can see that the method pre-sented in our paper has comparable or significantly lower differences and we did not find any statistically significant differences when analyzing complete arches.
In the study performed by Leifert et al., the authors compared the measurements done by two orthodontists on mesiodistal widths of the teeth and arch lengths on plaster study models and 3D virtual models. Difference in measurements for missing space in maxilla was 0.424 mm and 0.384 mm in mandible. Paired t-test showed statisti-cally significant differences in measurements in maxilla. It is worth noting that differences between the two or-thodontists were up to 0.408 mm and were comparable to differences between the two measurements methods, therefore the study concluded that differences between methods are acceptable in clinical practice [25]. In our case our method has comparable or lower differences with absence of statistically significant difference on analyzed values. Recorded differences for segments of under 0.3 mm are not clinically significant, while discrepancies of under 0.8 mm on the level of arch are also clinically in-significant.
Yoon et al. examined usability of intraoral scanners by comparing measurements obtained on plaster study mod-els and 3D scanned study models. Results were statistical-ly analyzed using paired t-test. One of the observed mea-surements was the missing space for the whole arch and they obtained differences between plaster and 3D scanned models of up to 0.58 mm for maxilla with statistically significant differences and up to 0.63 mm for mandible also with statistically significant difference. Differences between plaster and intraorally scanned models were up to 0.86 mm for maxilla and 0.55 mm for mandible with statistically significant differences. Authors concluded that recorded differences are not clinically significant and that all three methods can be used in practice, regard-less of the severity of crowding [26]. Comparison of these results and results presented in our paper indicates that recorded discrepancies between methods are comparable, with the note of no statistically significant difference be-ing present in our results for complete arches.
Liang et al. examined usability of 3ShapeTM D800 scan-ner in clinical practice by comparing the measurements on digital model and plaster study models. Models were divided into the three groups based on the severity of
crowding. Presented results strongly suggested that the use of 3D scanned models in clinical practice is justified since the measurement differences for available and need-ed space were under 0.3 mm with no significant statistical difference found. Statistically significant difference was found when authors analyzed the results by severity of crowding [27]. Aforementioned conclusions of the authors are in accordance with our findings as our measurements differences for segments fall within the same intervals, while the differences for the whole arch are somewhat larger but still acceptable in clinical practice.
CONCLUSIONS
Measurements performed by presented photogrammetry method are comparable to measurements made on 3D scanned plaster study models. Recorded measurement differences fall within the intervals acceptable in clinical practice with a very high coefficient of correlation and with no statistically significant differences found in Lund-strom analysis for arches. Presented results strongly sug-gest that the use of the presented method is justified in the diagnosis of orthodontic irregularities.
ACKNOWLEDGEMENTS
The research leading to these results was co-funded by the European Commission under the H2020 Research Infrastructures contract no. 675121 (project VI-SEEM).
REFERENCES
1. Rheude B, Lionel Sadowsky P, Ferriera A, Jacobson A. An evalua-tion of the use of digital study models in orthodontic diagno-sis and treatment planning. Angle Orthod. 2005; 75(3):300–4. [DOI: 10.1043/0003-3219(2005)75[300:AEOTUO]2.0.CO;2] [PMID: 15898364]
2. Zilberman O, Huggare J, Parikakis KA. Evaluation of the validity of tooth size and arch width measurements using conventional and three-dimensional virtual orthodontic models. Angle Orthod. 2003; 73(3):301–6. [DOI: 10.1043/0003-3219(2003)073<0301:EOTVOT>2.0.CO;2] [PMID: 12828439]
3. Karatas OH, Toy E. Three-dimensional imaging techniques: A lit-erature review. Eur J Dent. 2014; 8(1):132–40. [DOI: 10.4103/1305-7456.126269] [PMID: 24966761]
4. Hajeer MY, Millett DT, Ayoub AF, Siebert JP. Current Products and Practices: Applications of 3D imaging in orthodontics: Part I. J Orthod. 2004; 31(1):62–70. [DOI: 10.1179/146531204225011346]
5. Majstorović NV, Mačužić J, Glišić B. Referent geometric entities in orthodontics on 3D models. Stom Glas Srb. 2014; 61(2):102–12. [DOI: 10.2298/SGS1402102M]
6. Milutinović J, Nedeljković N, Nikolić P. The possibilities of com-puter simulation of the orthognatic surgical procedure in the treat-ment of class II malocclusion. Stom Glas Srb. 2008; 55(3):147–53. [DOI: 10.2298/SGS0803147M]
7. Grbović A, Mihajlović D. Practical aspects of finite element meth-od applications in dentistry. Balk J Dent Med. 2017; 21(2):69–77. [DOI: 10.15157BJDM/2017/0011]
8. Scarfe WC, Farman AG, Sukovic P. Clinical applications of cone-beam computed tomography in dental practice. J Can Dent Assoc. 2006; 72(1):75. [PMID: 16480609]
84
9. Ritman EL. Micro-computed tomography-current status and de-velopments. Annu Rev Biomed Eng. 2004; 6:185–208. [DOI: 10.1146/annurev.bioeng.6.040803.140130g] [PMID: 15255767]
10. Paddock SW, Eliceiri KW. Laser scanning confocal microscopy: His-tory, applications, and related optical sectioning techniques. Meth-ods Mol Biol. 2014; 1075:9-47. [DOI: 10.1007/978-1-60761-847-8_2] [PMID: 24052346]
11. Fechteler P, Eisert P, Rurainsky J. Fast and high resolution 3D face scanning. (III-4).ICIP. 2007; 3:III–81. [DOI: 10.1109/ICIP.2007.4379251]
12. Ilić DV, Stojanović L. Application of digital radiography for meas-uring in clinical dental practice. Srp Arh Celok Lek. 2015; 143(1-2):16–22. [DOI: 10.2298/SARH1502016I] [PMID: 25845247]
13. Todorović A, Lisjak D, Lazić V, Špadijer-Gostović A. Possible errors during the optical impression procedure. Stom Glas Srb. 2010; 57(1):30–7. [DOI: 10.2298/SGS1001030T]
14. Stewart MB. Dental models in 3D. Orthod Prod. 2001; 21–4. [DOI: 10.2319/071117-460.1]
15. Redmond WR. Digital models: a new diagnostic tool. J Clin Orth-od. 2001; 35(6):386–7. [PMID: 11494942]
16. Kasser M, Egels Y. Digital photogrammetry. London: Taylor & Fran-cis; 2002. pp. 300–9.
17. Linder W. Digital photogrammetry. Springer, 2009.18. Potenziani M, Callieri M, Dellepiane M, Corsini M, Ponchio F,
Scopigno R. 3DHOP: 3D heritage online presenter. Comput Graph. 2015; 52:129–41. [DOI: 10.1016/j.cag.2015.07.001]
19. paulbourke.net [Internet]. P. Bourke, PLY - Polygon File Format c2018 [cited 2018 March 8]. Available from: http://paulbourke.net/dataformats/ply/.
20. rfc-editor.org [Internet]. Bray T. The JavaScript Object Notation (JSON) data interchange format c2018 [cited 2018 March 8]. Avail-able from: https://www.rfc-editor.org/info/rfc8259.
21. zbar.sourceforge.net [Internet]. ZBar bar code reader c2018 [cited 2018 March 8]. Available from: http://zbar.sourceforge.net/.
22. opencv.org [Internet]. OpenCV library c2018 [cited 2018 March 8]. Available from: https://opencv.org/.
23. Bland JM, Altman DG. Measuring agreement in method com-parison studies. Stat Methods Med Res. 1999; 8(2):135–60. [DOI: 10.1177/096228029900800204] [PMID: 10501650]
24. Quimby ML, Vig KW, Rashid RG, Firestone AR. The accuracy and reliability of measurements made on computer-based digital mod-els. Angle Orthod. 2004; 74(3):298–303. [DOI: 10.1043/0003-3219(2004)074<0298:TAAROM>2.0.CO;2] [PMID: 15264638]
25. Leifert MF, Leifert MM, Efstratiadis SS, Cangialosi TJ. Comparison of space analysis evaluations with digital models and plaster den-tal casts. Am J Orthod Dentofacial Orthop. 2009; 136(1):16–e1. [PMID: 19577140] [DOI: 10.1016/j.ajodo.2008.11.019]
26. Yoon JH, Yu HS, Choi Y, Choi TH, Choi SH, Cha JY. Model Analysis of Digital Models in Moderate to Severe Crowding: In Vivo Valida-tion and Clinical Application. Biomed Res Int. 2018; 2018:8414605. [DOI: 10.1155/2018/8414605] [PMID: 29568766]
27. Liang YM, Rutchakitprakarn L, Kuang SH, Wu TY. Compar-ing the reliability and accuracy of clinical measurements using plaster model and the digital model system based on crowding severity. J Chin Med Assoc. 2018; pii: S1726-4901(17)30380-5. [DOI: 10.1016/j.jcma.2017.11.011] [PMID: 29395944]
Received: 08.02.2018 • Accepted: Prihvaćen 16.05.2018
Arapović-Savić M. et al. Photogrammetry based space analysis measurements in orthodontic diagnosis
85Stomatološki glasnik Srbije. 2018;65(2):78-88
Primena fotogrametrije za prostorne analize u ortodontskoj dijagnostici
Marijana Arapović-Savić1, Mihajlo Savić2, Mirjana Umićević-Davidović1, Adriana Arbutina1, Nenad Nedeljković3, Branislav Glišić3
1Univerzitet u Banjoj Luci, Medicinski fakultet, Katedra za ortopediju vilica, Banja Luka, Republika Srpska, Bosna i Hercegovina;2Univerzitet u Banjoj Luci, Elektrotehnički fakultet, Banja Luka, Republika Srpska, Bosna i Hercegovina;3Univerzitet u Beogradu, Stomatološki fakultet, Katedra za ortopediju vilica, Beograd, Srbija
KRATAK SADRŽAJUvod Najčešća prostorna analiza koja se koristi u ortodontskoj dijagnostici je Lundstromova segmentna analiza. Na osnovu dobijenih rezultata merenja upoređuje se potreban i raspoloživ prostor u zubnom nizu i dobijaju informacije o višku ili manjku prostora za pravilan smeštaj zuba. Merenja se tradicionalno vrše na gipsanim studijskim modelima, ali je usled razvoja računarskih sistema sve prisutnija upotreba digitalnih reprezentacija modela u procesu merenja. Cilj ovog rada je bio da se predstavi fotogrametrijski pristup merenjima koji ne zahteva specijalizovan i skup hardver i dobijeni rezultati uporede sa merenjima na skeniranim 3D modelima.Metod Na 50 studijskih modela su merene meziodistalne širine 24 zuba, te širine 12 segmenata i izvršena je Lundstromova prostorna analiza. Merenja su vršena na 3D skeniranom modelu studijskim modelima i u fotogrametrijskom programu OrthoPhoto4D na osnovu četiri fotografije modela u namenski projektovanom držaču modela. Program uzima u obzir konačnu udaljenost kamere od modela i vrši korekcije grešaka nastalih usled perspektivne distorzije.Rezultati Provedena statistička analiza na prikupljenim merenjima i priloženi Bland–Altman grafici snažno sugerišu da postoji visok stepen saglasnosti između dva metoda merenja. Odstupanja za maksilu za pojedinačne segmente su iznosila do 0,25 mm sa standardnom devijacijom od 0,16 mm, za celu vilicu manje od 1 mm uz devijaciju od 0,4 mm, za mandibulu odstupanja za segmente iznose ispod 0,27 mm uz devijaciju od 0,15 mm, te za celu vilicu do 0,6 mm uz devijaciju od 0,24 mm. Koeficijenti korelacije su preko 0,985 u svim slučajevima.Zaključak Fotogrametrijski metod se može opravdano koristiti u kliničkoj praksi za dijagnostiku ortodontskih nepravilnosti.Ključne reči: ortodoncija; digitalni modeli; fotogrametrija; dijagnoza; terapija
UVOD
Ortodontski studijski modeli imaju više namena i predstavljaju neophodan deo ortodontske dokumentacije. Pored kliničkog ispitivanja, intraoralnih i ekstraoralnih radiografskih snimaka, studijski modeli predstavljaju nezamenjivo dijagnostičko sred-stvo u ortodontskoj dijagnostici.
Direktno merenje na studijskim modelima, pored prednosti, nosi sa sobom i ograničavajuće faktore jer idealno postavljanje mernih instrumenata na modele zahteva dosta vremena, greš-ke nastale zbog slučajnih pokreta rukom rezultiraju greškama u rezultatima, upotreba mernih instrumenata (npr. šestara po Korkhausu) vrlo je komplikovana, a problem su i nedostaci u pogledu skladištenja, izdržljivosti i prenosivosti [1, 2].
Za postavljanje pravilne ortodontske i dentofacijalne dija-gnostike i planiranje lečenja koriste se RTG snimci i funkci-onalne analize. Ove tehnike treba tačno da replikuju ili opišu anatomske i fiziološke činjenice i da trodimenzionalnu (3D) anatomiju prikažu precizno. Fotografija je jedan od pomoćnih dijagnostičkih metoda. Ortodonti rutinski koriste 2D statičke tehnike snimanja kraniofacijalne anatomije. Dubine struktura se ne mogu dobiti i lokalizovati sa 2D slikama i to predstavlja njihov glavni nedostatak. Razvoj informacionih tehnologija i sve šira upotreba generisanja dvodimenzionalnih i trodimen-zionalnih modela koji verno opisuju realne objekte doveli su do upotrebe navedenih tehnologija u stomatologiji pa tako i u ortodontskoj praksi [3, 4].
3D modeliranje nalazi sve veću primenu u ortodontskoj praksi i definisanju određenih ortodontskih parametara [5]. Savremene tehnologije i sve češća upotreba računara u ortodonciji omoguća-vaju i simulacije ortodontsko-hirurških intervencija, što olakšava pacijentima odluke oko prihvatanja hirurškog zahvata [6, 7].
Razvijen je veliki broj dijagnostičkih metoda za prikaz struktura lica i zuba. Najčešće korišćene aktuelne metode su tehnike 3D snimanja – kompjuterizovana tomografija CT, kom-pjuterizovana tomografija Cone Beam CBCT, 3D laser, te 3D morfometrija lica 3DDFM. 3D tehnike omogućavaju detaljne i problematične informacije o mekim i tvrdim tkivima [8–12].
Digitalni modeli imaju brojne prednosti, od jednostavnijeg čuvanja, preko efikasnije razmene podataka do automatizaci-je određenih procesa. Međutim, postavlja se pitanje da li tako dobijeni modeli dobro opisuju realne studijske modele na ko-jima se bazira ortodontska terapija. Osim navedenog problema, realna prepreka široj upotrebi u ortodontskoj dijagnostici su i relativno visoki troškovi kvalitetnih trodimenzionalnih skenera i pratećeg softvera neophodnih za kvalitetan rad [13, 14, 15].
Osim 3D skeniranja, u procesima merenja studijskih or-todontskih modela moguća je i upotreba digitalne fotografije pristupom koji se zove fotogrametrija. Danas se pod fotograme-trijom podrazumeva modelovanje na osnovu više slika, iako je termin fotogrametrija složenica koja je izvedena iz sintagme „merenje sa slike“ [16].
Modeliranje zasnovano na slikama korišćenjem fotograme-trije smatra se jednom od najboljih tehnika obrada podataka o slici, koja pruža tačne podatke i detaljne 3D informacije. Ova tehnika dozvoljava određivanje preciznosti i pouzdanosti poda-taka, a parametri iz merenih tačaka vezanih za sliku i kontrolne tačke (CP), koje predstavljaju lokaciju odgovarajuće / korespon-dentne tačke u dva ili više susednih digitalnih slika, mogu se koristiti za povezivanje slike. Zbog toga su potrebne dve slike, a zatim 3D informacije mogu biti izvedene primenom projektivne i perspektivne geometrije [17].
Da bi niz fotografija mogao da bude baza za fotogrametrijsko modelovanje, neophodno je da postoji „preklapanje fotografija“.
86
To znači da svaki geometrijski element čiji se položaj želi da odredi mora da bude vidljiv bar na dve fotografije [16, 17].
Cilj ovog rada je bio da se prikaže alternativni pristup u me-renju prostornih analiza, zasnovan na upotrebi fotogrametrije u namenski razvijenom sofveru OrthoPhoto4D, gde program izračunava greške nastale kao posledica perspektivne distorzije.
MATERIJAL I METODE
Za potrebe ovog istraživanja korišćeno je 50 studijskih gipsanih modela. Svi gipsani studijski modeli su bili sa stalnom denti-cijom, a zubi bez karijesa i sa adekvatno urađenim ispunima.
U prvoj fazi studijski modeli su skenirani industrijskim Ste-inbichler L3D 5M skenerom. Kreiran je programski paket OP4D (Slika 1). Osnovna karakteristika ovog sistema je da je veb ba-ziran i da nije potrebna instalacija nikakvog posebnog softvera na računaru, osim jednog od savremenih programa za pristup vebu (Google Chrome, Mozilla Firefox i slični). Zasnovan je na 3DHOP paketu, a podržan je rad sa digitalnim modelima u PLY (Polygon File Format / Stanford Triangle Format) [18] i NXS (Nexus) [19] formatima. Sam proces merenja podrazumeva odabir objekta na kojem se vrše merenja. Sistem ja napravljen tako da je moguće izvršiti proizvoljan broj merenja na svakom od objekata (istih ili različitih vrsta). Sprovođenje različitih vrsta merenja omogućava da se na istom modelu uradi više analiza, dok višestruka merenja iste vrste omogućavaju buduću obradu rezultata, bilo u vidu srednje dobijenih vrednosti (npr. ukoliko merenja vrši isti korisnik) ili analize merenja od različi-tih operatera. Posle izvršenog merenja modela podaci se čuvaju u bazi podataka i kodirani su upotrebom JSON formata [20]. Ovaj format omogućava veliku fleksibilnost jer ima dinamičnu strukturu i podržava predstavljanje podataka u obliku skalara, vektora, mapa, te drugih hijerarhijski organizovanih struktura.
U drugoj fazi israživanja gipsani studijski modeli su foto-grafisani sa anteriorne, leve i desne bukalne strane, te gornje, odnosno donje okluzalne strane u pozicioneru koji je omogu-ćavao jednostavno fiksiranje modela u potrebnim položajima.
Kamera je postavljena na čvrst i stabilan stativ i aktivira se putem bežičnog daljinskog upravljača u cilju sprečavanja slu-čajnog kretanja fotoaparata u radu. Da bi se obezbedila dovoljna dubina polja, otvor objektiva je podešen na vrednost f/22, a zum objektiva je postavljen na maksimalnih 200 mm. Osvetljenje obezbeđuje 30 × 30 cm LED izvor svetlosti postavljen na levoj strani i mat bela reflektujuća površina postavljena na suprot-noj strani. Izvori svetlosti postavljeni su na takav način da se obezbedi mekano i prilično jednoobrazno osvetljenje objekta, uz obezbeđivanje dovoljno senke da bi se mogli raspoznati de-talji modela.
Posebne probleme u upotrebi fotografija u merenjima pred-stavljaju perspektivna distorzija te problem pri merenju dužina koje su normalne na ravan slike.
Sa ciljem povećanja tačnosti merenja, napravljen je merni uređaj koji se sastoji od postolja i nosača modela, a merenja su vršena na osnovu skupa od četiri fotografije za svaki mo-del. Postolje je fiksirano na stabilnu površinu i ne može da se kreće u odnosu na fotoaparat tokom fotografisanja. Sastoji se od osnovne ploče, zadnje ploče i prednje ploče. Osnovna ploča sadrži niz ureza i vodilja koji omogućavaju fleksibilno pozici-oniranje zadnje i prednje ploče, kao i stabilno pozicioniranje
držača modela. I zadnja i prednja ploča sadrže i linije vodilje koje omogućavaju pravilno pozicioniranje kamere. Modeli su fiksirani na nosač modela pomoću jednog zavrtnja sa mekanom gumenom podlogom kako bi se izbeglo oštećenje modela. Nosač modela poseduje QR kod i oznaku slova na svakoj od četiri strane namenjene fotografisanju: T –gornja, F – frontalna, R – desna i L – leva. Važno je napomenuti i da svaki model sadr-ži i QR marker koji sadrži identifikaciju modela i omogućava jednostavnu automatizovanu proceduru obrade i klasifikacije u procesu obrade fotografija.
Kada su model ili više modela fotografisani, fotografije se obrađuju i parametri fotoaparata se izračunavaju automatski pomoću namenski razvijenog softvera. Obrada fotografija uključuje sledeći niz koraka:
1. Pretvaranje boje u sivu skalu i uklanjanje hromatskih abe-racija korišćenjem zelenog kanala kao osnove.
2. Identifikovanje QR markera i tumačenje njihovog sadr-žaja korišćenjem Zbar biblioteke [21]. Ovaj korak pruža informacije o rastojanjima markera, fotografisanoj strani i identifikaciji modela.
3. Pronalaženje mernih markera korišćenjem OpenCV bi-blioteke [22].
4. Izračunavanje rastojanja fotoaparata i perspektivnih pa-rametara od detektovanih lokacija markera na zadnjoj i prednjoj ploči. Ovaj korak je ključan jer omogućava ispravke grešaka usled perspektivne distorzije prisutne na fotografijama.
5. Na kraju, slika se iseca na upotrebljivu površinu koja je definisana centrima markera prednje ploče i snima se pod definisanim imenom u odgovarajući direktorijum sluča-ja. Svi izračunati parametri se čuvaju kao JSON kodirani dokument unutar datoteke u EXIF polju. Ovo omogućava jednostavniji i efikasniji prenos i razmenu dokumenata. Direktorijum slučaja se određuje na osnovu podataka iz QR kodova i u našem slučaju je numerička identifikacija modela povezana sa slovom „L“ za mandibulu ili „U“ za maksilu; na primer, fajl naziva „cases/001U/T.jpg“ sadrži obrađenu fotografiju gornje projekcije maksile modela broj 001.
Glavni ekran OrthoPhoto4D je podeljen na šest glavnih komponenti postavljenih u mrežu sa tri kolone i dva reda. Prvi red sadrži slike koje prikazuju prednji i bočne prikaze, dok je gornji prikaz u srednjem delu drugog reda. Donja leva sekcija sadrži listu mogućih mernih veličina, omogućavajući operateru odabir merenja individualne širine zuba, širine segmenta dva zuba, kao i interkanine i intermolarne širine. Pošto se u jednom trenutku može prikazati samo maksila ili mandibula, slike mo-dela će se ažurirati kada korisnik izabere željeno merenje. U ovom odeljku nalazi se padajuća lista koja omogućava odabir modela koji se meri, kao i dugmad za snimanje ili ponovno učitavanje podataka merenja. Donji desni deo sadrži izračunate merne vrednosti u tri kolone.
Za svaku merenu dužinu korisnik mora da odabere veličinu za merenje i jedan od dva kraja, na primer 14–13 i tačku 14. Korisnik može da pomera i uvećava prikaze, koji se pomeraju sinhronizovano, dok željena tačka nije vidljiva bar u dva prikaza. Na primer, korisnik može odabrati tačku u „gornjem“ i „levom“ prikazu. Ovo je neophodno jer programu potrebna 3D pozicija tačke i izbor u samo jednoj slici neće proizvesti dovoljno poda-taka. Važno je napomenuti da se prva odabrana tačka koristi kao
Arapović-Savić M. et al. Photogrammetry based space analysis measurements in orthodontic diagnosis
87Stomatološki glasnik Srbije. 2018;65(2):78-88
osnova za izračunavanje tako da korisnik mora samo odabrati odgovarajuću poziciju po nedostajućoj osi na drugoj slici (u našem slučaju samo Z osa). Kada se proces završi na oba kraja linije, softver izračunava rastojanje u 3D prostoru i popunjava odgovarajuće polje u odeljku merenih veličina. Sve završene mere imaju zelenu boju pozadine, dok je trenutno izabrana tačka crvena ili narandžasta, u zavisnosti od faze merenja.
Vrednosti dobijene merenjima na 3D modelima i na fotogra-fijama modela su posle toga statistički obrađene i izračunate su srednje vrednosti i standardne devijacije, te faktori korelacije, a nakon toga je proveden i upareni dvostrani T-test.
REZULTATI
U Tabeli 1 su prikazani rezultati statističke obrade podataka za maksilu. Kao što se iz vrednosti može videti, srednja greška za pojedinačne segmente ne prelazi 0,25 mm sa standardnom de-vijacijom manjom od 0,16 mm, dok je sumarna srednja greška za celu vilicu ispod 1 mm sa standardnom devijacijom manjom od 0,4 mm. Koeficijent korelacije je preko 0,98 za svaki segment i veći od 0,99 za celu vilicu, dok je p vrednost t-testa ispod za-danih 0,05 u svim slučajevima.
U Tabeli 2 su dati rezultati statističke analize za mandibulu. I u ovom slučaju su srednja odstupanja po segmentima manja od 0,27 mm sa standardnom devijacijom manjom od 0,15 mm, dok je srednje odstupanje za celu vilicu manje od 0,6 mm sa standardnom devijacijom manjom od 0,24 mm. Koeficijent ko-relacije je u svim posmatranim slučajevima veći od 0,98, dok je na nivou cele mandibule veći od 0,99. Osim u slučaju segmenta 43–44, p vrednosti su ispod 0,05, dok je u slučaju segmenta 43–44 odstupanje u merenjima manje od 0,1 mm i nema značaj u kliničkoj praksi.
Na slikama (slike 3–6) prikazani su Bland–Altman grafici za vrednosti dobijene upotrebom oba ispitivana metoda [23]. Na apscisi se nalaze srednje vrednosti oba merenja, dok je na ordinati predstavljeno odstupanje između dva metoda mere-nja. Crna linija predstavlja srednju vrednost odstupanja za sva obuhvaćena merenja, dok crvene linije označavaju odstupanje od po dve standardne devijacije u odnosu na srednje odstupa-nje. Odstupanje od 1,96 standardnih devijacija podrazumeva interval koji obuhvata 95% ispitivanih uzoraka.
Sa slika je vidljivo da većina merenja pripada intervalu iz-među crvenih linija standardnih devijacija i da su vrednosti grupisane oko srednje vrednosti odstupanja, bez obzira na iznos merene veličine. Ovakav izgled Bland–Altman grafika sugeriše visok stepen saglasnosti između dva metoda merenja.
DISKUSIJA
Zahvaljujući prednostima digitalizacije studijskih modela, po-slednjih godina zabeležen je porast primene računara u stoma-tološkoj praksi. U brojnim dostupnim radovima poređeni su rezultati merenja meziodistalnih širina zuba i segmenata zuba na gipsanim studijskim modelima i na digitalnim reprezentaci-jama modela. Dve najčešće korišćene digitalne reprezentacije su 3D skenirani modeli i digitalne fotografije modela. U literaturi su prisutna poređenja i analize vršene na direktnim merenjima na gipasnim modelima i njihovim digitalnim reprezentacijama,
ali je primetan manjak analiza vršenih na indirektnim vredno-stima računatim na osnovu merenja. Jedna od takvih analiza je i Lundstromova analiza, koja je obrađena u ovom radu. Usled upotrebe tri pojedinačna merenja za svaki segment od dva zuba, širina segmenta i dve zasebne širine zuba, neophodno je pored analiza pojedinačnih merenja izvršiti i analize na indirektnim računatim vrednostima. Ovaj značaj je naročito izražen kod ra-čunanja nedostatka prostora za pravilan smeštaj zuba za celu vilicu jer se u tom slučaju koristi 18 pojedinačnih merenja.
Cilj studije koju su radili Quimby i saradnici bio je da se utvrdi tačnost, ponovljivost i efikasnost merenja izvedenih na digitalnim modelima. Dentoform i gipsani studijski modeli po-služili su kao zlatni standard. Merene parametre su podelili u sedam grupa, od kojih su dve grupe bile raspoloživa i potrebna širina zubnog segmenta. Za merenja na gipsanim modelima korišćen je digitalni šestar, a standardnim kompjuterskim mi-šem tačke su označene na digitalnim modelima. Merenja su ponovljena i posle dve sedmice. Ponovljivost je bila visoka za merenja izvedena na i gipsanim i digitalnim modelima. Efika-snost je takođe bila slična bez obzira na način merenja. Merna odstupanja između digitalnih i gipsanih modela za celu vilicu su iznosila 0,54 mm za raspoloživi i 2,23 mm za potrebni prostor u maksili, te 2,88 mm za raspoloživi i 0,21 mm za potrebni prostor u mandibuli. Statistički značajna razlika je pronađena samo u slučaju potrebnog prostora u mandibuli. Zaključak studije je da se digitalni modeli mogu koristiti kao klinički prihvatljiva alternativa konvencionalnim gipsanim modelima [24]. Iako au-tori nisu sproveli analize na razlici potrebne i dostupne širine, iz objavljenih vrednosti je vidljivo da metod merenja predstavljen u našem radu ima uporediva ili bitno manja merna odstupanja, te da nisu pronađene statistički značajne razlike na nivou celih vilica.
U studiji koji su radili Leifert i saradnici poređena su me-renja izvršena od strane dva ortodonta na meziodistalnim širinama zuba i dužinama zubnih lukova na gipsanim mode-lima i trodimenzionalnim virtuelnim 3D modelima. Razlike u merenjima na gipsanim i digitalnim modelima za nedostatak prostora je iznosio do 0,424 mm u maksili i 0,384 mm u man-dibuli. Upareni t-test je pokazao statistički značajnu razliku za merenja u maksili. Vredi napomenuti da su razlike u merenjima između dva ortodonta iznosila do 0,408 mm i uporediva su sa razlikama između dva načina merenja, te su zaključci studije da su ova odstupanja prihvatljiva u kliničkoj praksi [25]. I u ovom slučaju naš metod merenja ima uporediva ili manja odstupa-nja uz odstustvo statistički značajnih razlika na analiziranim vrednostima. Pronađene razlike po segmentima su manje od 0,3 mm i nisu klinički značajne, dok odstupanje na nivou cele vilice od 0,8 mm takođe nije značajno u praksi.
Yoon i saradnici su ispitivali upotrebljivost intraoralnih skenera za vršenje merenja poredeći dobijene rezultate sa re-zultatima dobijenim ručnim merenjima na gipsanim studij-skim modelima, te merenjem 3D skeniranih studijskih modela. Dobijeni rezultati su statistički obrađeni, a izvršen je i upareni t-test. Jedna od merenih veličina je bila nedostatak prostora za celu vilicu i dobijena prosečna odstupanja između merenja na gipsanom modelu i skeniranom modelu su za maksilu iznosila do 0,58 mm uz statistički značajnu razliku, a za mandibulu do 0,63 mm, takođe uz statistički značajnu razliku. Pri poređenju merenja na gipsanom modelu i intraoralno skeniranom modelu dobijena prosečna odstupanja su iznosila do 0,86 mm za mak-
88
silu i 0,55 mm za mandibulu, uz pronađene statistički značajne razlike. Autori zaključuju da razlike u merenjima nisu klinički značajne i da je moguća upotreba sva tri metoda u kliničkoj praksi bez obzira na stepen teskobe [26]. Poredeći navedene re-zultate sa rezultatima prezentovanim u ovom radu, vidljivo je da su odstupanja približno istih vrednosti, uz razliku da u našem slučaju nije pronađena statistički značajna razlika za cele vilice.
Liang i saradnici su ispitivali upotrebljivost 3ShapeTM D800 skenera u kliničkoj praksi poredeći rezultate merenja na digital-nom modelu sa merenjima na gipsanim studijskim modelima. Modeli su bili podeljeni u tri grupe prema stepenu teskobe. Prezentovani rezultati snažno sugerišu da je opravdana klinič-ka upotreba 3D skeniranih modela jer su prosečna odstupanja merenja za dostupan i potreban prostor bila ispod 0,3 mm, bez pronađene statistički značajne razlike. Statistički značajna razli-ka je pronađena pri poređenju dobijenih rezultata po stepenima
teskobe [27]. Navedeni zaključci autora su u skladu sa nalazima ove studije, jer su naša odstupanja po segmentima u istim okvi-rima, dok je odstupanje na nivou vilice nešto većih vrednosti ali i dalje u okviru klinički prihvatljivih odstupanja.
ZAKLJUČAK
Merenja izvršena opisanim fotogrametrijskim metodom su uporediva sa merenjima izvršenim na 3D skeniranim gipsanim studijskim modelima. Pronađena odstupanja u merenjima su u okvirima prihvatljivim u kliničkoj praksi uz vrlo visok stepen korelacije i bez pronađenih statistički značajnih razlika u Lun-dstromovoj prostornoj analizi vilica. Navedeni rezultati snažno sugerišu opravdanost upotrebe opisanog modela u dijagnostici ortodontskih nepravilnosti.
Arapović-Savić M. et al. Photogrammetry based space analysis measurements in orthodontic diagnosis