Embed Size (px)
Citation preview

A pplications of m icrofabrication in
biosensor technology
A thesis for the degree of
Doctor o f Philosophy
submitted to the Faculty of Engineering
University of Glasgow
by
Alun w yn Griffith
September 1996

ProQuest Number: 11007682
All rights reserved
INFORMATION TO ALL USERS The quality of this reproduction is dependent upon the quality of the copy submitted.
In the unlikely event that the author did not send a com plete manuscript and there are missing pages, these will be noted. Also, if material had to be removed,
a note will indicate the deletion.
uestProQuest 11007682
Published by ProQuest LLC(2018). Copyright of the Dissertation is held by the Author.
All rights reserved.This work is protected against unauthorized copying under Title 17, United States Code
Microform Edition © ProQuest LLC.
ProQuest LLC.789 East Eisenhower Parkway
P.O. Box 1346 Ann Arbor, Ml 48106- 1346

I o & w
0 > M )
reiAssow. | u n iv e r s it y
l ib r a r y .

to my mother
ii

Something mysteriously deep and meaningful
Abstract
This thesis investigates the application of microfabrication techniques in biotechnology,
embracing two major methodologies: biosensing and dielectrophoresis.
In the first instance, the miniaturisation of biosensors for use in aqueous solutions was
explored, focusing on the issues of insulator deposition and metal multilayer adhesion. Two
different immobilisation strategies were used. The first involved the binding of the
electroactive protein, cytochrome c, to a self-assembled monolayer in order to measure the
cellular production of superoxide. The second was the entrapment of an enzyme, glucose
oxidase (EC 1.1.3.4), within a polypyrrole film as the core of an amperometric sensor for
glucose. In the latter case, a novel analytical technique was developed for characterising the
sensor interface involving the use of XPS and FTIR. The technique was used to demonstrate
the efficiency with the which enzyme could be bound within the film, and indicated a non-linear
relationship between the concentration of entrapped enzyme and the its concentration in the
polymerisation solution.
To complement these studies, work in dielectrophoresis centred on methods for trapping and
measuring single cell function within microfabricated electrode arrays. Although it was
possible to hold a cell in close proximity to a biosensor array, difficulties concerning the
sensitising of the electrochemical devices precluded measurements on single cells. However, by
using a related technique it was possible, for the first time, to observe the dynamic activation of
a single human neutrophil. The electrorotation technique was used to monitor changes in the
physical character of the cell in order to identify the effects of chemotactic stimulation. Studies
involving electrochemical and chemiluminescent measurements were performed to corroborate
these findings.

A cknow ledgem ents
My last words at our first meeting were; “Do you think you can sort out funding for a PhD in a
month?”. Well, he did, and this is it. It is Dr. Jon Cooper, my supervisor, that I must first
thank for his resourcefulness, support and encouragement throughout my time at Glasgow
University.
Now for the unacknowledged stars of the biolab: Bill Monaghan and Mary Robertson. Bill was
a mine of information on microfabrication and Mary gave me invaluable training and advice on
the cell culture work. The project work involved assistance and advice from a large number of
technicians in the cleanrooms, dry etch, and in fact, most of the department, and I would like to
take this opportunity to thank them all.
I would also like to thank: Pam Foreman, Dr. Hywel Morgan and Dr. Steffi Krause for their
advice on thesis content; Andrew Gliddle for being seriously knowledgeable; John Young,
Manus Maclean and many others in the Cell Biology department for their help with the
neutrophil work; Philip Manning and Dr. Calum McNeil at Newcastle University for their help
with the superoxide sensor; Chris Cotton, Paul Coyle, Jorg Papendick, Brendan Casey, Dr. Li
Jiang, Dr. Li Li Ciu, Dr. Tom Flynn, Dr. Marcus Swann, Steffan Archer, Nick Green, Dr. Mike
Hughes, Dr. Steve Britland, Dr. Simon Hicks, Dr. Karl Ryder, Dave Pritchard and Mary
McGoldrick for their help, advice, drinks and good company.
To my family - my thanks for their support and encouragement; and finally, to Steph, for her
love and tolerance, and for correcting my writing even when she would much rather be reading
a good book.
v

C ontents
ABSTRACT............................................................................................................IV
ACKNOWLEDGEMENTS........................................................................................V
CONTENTS............................................................................................................VI
1. INTRODUCTION............................................................................................... 1
1.1 Biosensors....................................................................................................................................................1
1.2 Biosensor Fabrication............................................................................................................................... 2
1.3 Biosensors Investigated in the Project....................................................................................................3
1.3.1 Superoxide Biosensor..........................................................................................................................3
1.3.2 Glucose Biosensor...............................................................................................................................5
1.4 Dielectrophoresis........................................................................................................................................8
1.4.1 Particle Positioning.............................................................................................................................9
1.4.2 Electrorotation...................................................................................................................................10
1.5 Thesis Structure.......................................................................................................................................10
2. MICROFABRICATION..................................................................................... 12
2.1 Methods & Materials: Microfabrication.............................................................................................12
2.1.1 Substrate Cleaning............................................................................................................................. 12
2.1.2 Photolithography............................................................................................................................... 14
2.1.3 E-Beam Lithography.........................................................................................................................14
2.1.4 Metal Evaporation and Lift-Off........................................................................................................ 15
2.1.4.1.......... Gold Metallisation....................................................................................................................... 15
2.1.5 Electrode Insulation....................................................................................................................... 16
2.1.5.1 Polyimide.......................................................................................................................................16
2.1.5.1.1 Titanium and Chromium Wet Etching..................................................................................16
2.1.5.2 Silicon Nitride...............................................................................................................................16
2.2 Results and Discussion............................................................................................................................ 17
2.2.1 Sensor Metallisation.......................................................................................................................... 17
2.2.1.1 Gold Metallisation......................................................................................................................... 19
2.2.1.2 Multilayer Structure Metallisation................................................................................................19
2.2.2 Sensor Insulation...............................................................................................................................22
2.2.2.1 Patterning of Insulator Layers......................................................................................................23
2.2.2.1.1 Polyimide - RIE Etching........................................................................................................ 23
2.2.2.1.2 Silicon Nitride - RIE Etching.................................................................................................24
2.2.2.2 Insulator Adhesion........................................................................................................................24
2.3 Summary................................................................................................................................................... 25
3. MICROFABRICATED BIOSENSORS............................................................. 27
3.1 Electrochemistry......................................................................................................................................27
3.1.1 Theory: Electrochemistry................................................................................................................. 27
3.1.1.1 Chronoamperometry..................................................................................................................... 27
3.1.1.2 Cyclic Voltammetry..................................................................................................................... 28
3.1.1.3 Microelectrodes.............................................................................................................................30
3.1.1.3.1 Mass Transport at Microelectrodes....................................................................................... 30
3.1.2 Methods & Materials: Electrochemistry...........................................................................................32
3.1.3 Results and Discussion: Electrochemistry........................................................................................33
3.1.3.1 Cleaning of Microfabricated Electrodes......................................................................................33
3.1.3.1.1 Potential Cycling in Acid Solutions...................................................................................... 34
3.1.3.1.2 Plasma Cleaning......................................................................................................................36
3.1.3.2 Microelectrode Sensors................................................................................................................ 37
3.1.3.3 Cytochrome c Electrochemistry.................................................................................................. 39
3.1.3.4 Superoxide Sensing...................................................................................................................... 40
3.1.3.4.1 Immobilisation of Cytochrome c ........................................................................................... 41
3.1.3.4.2 Superoxide Measurement: Hypoxanthine/Xanthine Oxidase.............................................. 43
3.1.3.4.3 Superoxide Measurement: Stimulated Human Neutrophils................................................ 46
3.2 Chemiluminescence..................................................................................................................................47
3.2.1 Theory: Chemiluminescence............................................................................................................ 47
3.2.2 Methods & Materials: Chemiluminescence......................................................................................47
3.2.3 Results and Discussion: Chemiluminescence.................................................................................. 48
3.3 Summary....................................................................................................................................................51
4. DIELECTROPHORESIS.................................................................................. 53
4.1 Theory:.......................................................................................................................................................53
4.1.1 Particle Confinement.........................................................................................................................53

4.1.2 Electrorotation......................................................................................................................................... 54
4.2 Methods & Materials.............................................................................................................................. 56
4.2.1 Suspension Media............................................................................................................................. 56
4.2.2 Electrodes and Instrumentation........................................................................................................ 57
4.2.3 Bead Preparation............................................................................................................................... 58
4.2.4 Cell Preparation................................................................................................................................. 58
4.2.4.1 BHK Preparation........................................................................................................................... 58
4.2.4.2 Blood Purification......................................................................................................................... 58
4.2.5 Collection of Electrorotational Spectra........................................................................................... 60
4.2.5.1 Activation of Neutrophils..............................................................................................................60
4.3 Results and Discussion............................................................................................................................ 61
4.3.1 Medium Conductivity and Permittivity........................................................................................... 61
4.3.2 Particle Confinement.........................................................................................................................62
4.3.2.1 Polystyrene Beads......................................................................................................................... 62
4.3.2.2 Cells............................................................................................................................................... 63
4.3.2.3 Further Observations on Particle Confinement............................................................................ 66
4.3.2.3.1 Insulator Layers.......................................................................................................................66
4.3.2.3.2 Electrode Geometry............................................................................................................... 66
4.3.3 Electrorotation................................................................................................................................... 67
4.3.3.1 Polystyrene Beads......................................................................................................................... 67
4.3.3.2 Human Neutrophils.......................................................................................................................68
4.4 Summary................................................................................................................................................... 73
4.4.1 Potential for Further Work............................................................................................................... 73
4.4.1.1 Travelling-Wave Dielectrophoresis............................................................................................. 73
5. BIOSENSOR INTERFACES............................................................................ 74
5.1 Growth of Biosensor films......................................................................................................................74
5.1.1 Theory: Polymer Growth.................................................................................................................. 74
5.1.2 Methods & Materials: Polymer growth........................................................................................... 74
5.1.3 Results and Discussion..................................................................................................................... 75
5.1.3.1 Effect of pH................................................................................................................................... 75
5.1.3.2 Film Thickness.............................................................................................................................. 77
5.1.3.3 Selection of Electrolyte............................................................................................................... 79
5.2 Electrochemical Analysis.......................................................................................................................79
5.2.1 Methods & Materials: Electrochemical Analysis........................................................................... 79
5.2.2 Results and Discussion......................................................................................................................81

5.2.2.1 Why Use Over-oxidised PPy Films?........................................................................................... 81
5.2.2.2 Assay Results................................................................................................................................84
5.3 XPS Analysis.............................................................................................................................................87
5.3.1 Theory: XPS Analysis...................................................................................................................... 87
5.3.2 Methods & Materials: XPS Analysis............................................................................................... 88
5.3.2.1 Curve Fitting Methodology..........................................................................................................88
5.3.2.2 Elemental Quantification- an example........................................................................................89
5.3.3 Results and Discussion..................................................................................................................... 90
5.3.3.1 Contamination...............................................................................................................................91
5.3.4 Gaussian Fitting Technique..............................................................................................................92
5.3.4.1.1 Deconvoluted Analysis Technique....................................................................................... 94
5.3.4.1.2 Data Analysis and Discussion...............................................................................................96
5.4 FTIR Analysis.........................................................................................................................................101
5.4.1 Theory: FTIR Analysis................................................................................................................... 101
5.4.2 Methods & Materials: FTIR Analysis........................................................................................... 104
5.4.3 Results and Discussion................................................................................................................... 104
5.5 Summary................................................................................................................................................ 109
6. CONCLUSION............................................................................................... 111
6.1 Recommendations for Future Work...................................................................................................112
6.2 Publications and Conference Contributions Arising from this Work...........................................113
APPENDIX A ....................................................................................................... 114
APPENDIX B....................................................................................................... 117
REFERENCES.................................................................................................... 119
LIST OF ABBREVIATIONS................................................................................. 132

1. Introduction
The rapid expansion of the biotechnology sector has generated significant cost reductions in the
biological components of biosensors. Increasingly, microfabrication is regarded as another
avenue to financial savings in biosensor manufacture. The sector is attem pting to exploit the
economies of scale and technological developments used so effectively in the electronics
industry. Importantly, microfabrication can offer the possibility of dramatically increased
functionality at little added cost. For example, in the use of ‘on-chip’ signal processing1 and
remote sensing/telemetry.2
The potential for exploiting the benefits offered by microfabrication is particularly apparent in
the field of electrochemical biosensors. The basic electrochemical requirem ents, such as
external connection and conductive tracking, are easily provided using standard
microfabrication techniques. The increased performance offered by additional developments
such as microelectrode arrays3 and micromachining4 present exciting opportunities for the
future. Nonetheless, the successful integration of microfabrication techniques and
electrochemical analysis using these novel sensor structures will present many new challenges.
This thesis addresses the issues associated with the fabrication and use of microfabricated
biosensors. A variety of sensor arrays have been fabricated and investigated using a range of
analytical techniques.
1.1 Biosensors
A biosensor is an analytical device which uses biomaterials to directly detect biological or
chemical species without the need for complex signal processing. A more general definition
would categorise a biosensor as a sensing device tha t contains a biological component. The key
function of the biological component is to provide selectivity and sensitivity. The term
biosensing encompasses a wide variety of sensing mechanisms including: electrochemical,
acoustic, optical and immunological techniques. The biological component of a biosensor can
take many forms. Enzymes and antibodies are commonly used, although other elements such
as membranes, whole cells and the use of mammalian tissue have been reported in the
literature.5'7
1

1. Introduction
The majority of the work in this thesis has concentrated on the use of amperometric biosensors
and their basic function is described in figure 1.1. Signal transduction is accomplished by the
use of mediators which are small electroactive molecules that shuttle electrons between the
biological component and the electrode. An important consideration, omitted from figure 1.1, is
the mechanism by which the sensor components are fixed relative to the electrode. For
example, the components can be held by a covalent bond to the electrode surface,8 entrapped in
a polymer matrix,9 mixed into a dried layer,10 or enclosed by a membrane.11 The nature of the
matrix will have a dramatic effect on the characteristics and performance of the biosensor.
Analyter \
Analyte ! Signal ! SignalRecognition !L......................... J
Transduction I---- .............. . v Interpretation
Analyte
> %■ ̂£
Biomolecule
—̂ — o
t
O utput
Figure 1.1: A schematic diagram illustrating the operation of an amperometric biosensor.
1.2 Biosensor Fabrication
The commercial manufacture of biosensors exploits a wide range of techniques. Many are based
upon techniques modified from those developed within the electronics industry, for example,
screen printing, lithographic methods and silicon micromachining. However, some have been
developed specifically for biosensors, for example, the biomaterial spray-deposition unit
marketed by Biospot Inc. and novel large-scale manufacturing methods for enzyme-linked
immunosorbent assays (ELISA).12
Factors such as biocompatability and stability in aqueous solution are issues specific to
biosensor design and fabrication. For example, the mediator ferrocene has been used for ‘in
vitro’ glucose biosensors, however, this mediator could present a toxic hazard for ‘in vivo’
applications. The issue directly addressed in this thesis was the reliability of microbiosensors in
aqueous media. Figure 2.2 in chapter 2 shows a sample of the microfabricated biosensors
developed during the project. The devices were all designed for electrochemical sensing and
were fabricated on inert substrates using lithographic techniques. The planar nature of the
devices necessitates the use of insulating layers to define active electrode area. The adhesion of
the component layers is a crucial factor in sensor reliability and performance.
2

1. Introduction
1.3 Biosensors Investigated in the Project
Investigations of superoxide and glucose biosensors formed the core of the experimental work
and are described in detail in chapters 3 and 5. The sensors were fabricated using different
immobilisation techniques, these provide illustrations of the range of methods available for the
microfabrication of biosensors.
1.3.1 Superoxide B iosensor
The superoxide free radical ( 0'2) has been shown to have a principal role as a bacterial killing
agent in the mammalian immune defence system13 and is strongly implicated in the pathology
of rheumatoid arthritis.14 In addition, research has been conducted on its activity in various
cancers15 and recently novel work has been conducted into its role in cell signalling.16-17 An
initial target for the project was the development of a microfabricated sensor for the
measurement of superoxide release from a single human neutrophil. The superoxide radical
has a short lifetime in aqueous media and the ability to measure its release close to the cell
would provide valuable data on both the mechanism of release and the nature of its activity.
The concept of the microfabricated superoxide biosensor is demonstrated in figure 1.2. The
electrode array has two separate elements. The four outer (circular) electrodes exploit the
phenomenon of dielectrophoresis (see section 4.3.2) to generate a force that directs the particle
(in this case, a polystyrene bead) towards the centre of the electrode array. The central ring
electrodes surrounding the particle can be activated in order to detect the release of superoxide.
By the use of multiple ring electrodes, measurements at an increasing radius from the
superoxide source could permit the accurate determination of parameters such as diffusion and
dismutation rates.
Superoxide can be measured using a variety of techniques, such as: luminol
chemiluminescence,18 nitroblue tetrazolium reduction,19 EPR spin-trapping20 and spectrometric
measurement of the reduction of the protein cytochrome c.21 Whilst these methods are well
characterised, they remain limited to macroscopic applications and cannot be used in the
analysis of the release of superoxide from single cells. The use of an electrochemical method in
combination with precise control of cell position can potentially overcome this limitation. The
principle of the electrochemical detection of superoxide is outlined in figure 1.3.
3

1. Introduction
Figure 1.2: A microfabricated sensor array that demonstrates the principle of detecting the release of superoxide from a single cell. The disc electrode separation is 40|im.
The detection of superoxide ions is achieved using the direct electron transfer reaction of
covalently immobilised cytochrome c:
cytochrome c (III) + 0 2 —■> cytochrome c (II) + 0 2 (cytochromec reduction) (1.1)
cytochrome c (II)—M()dil,ed Elearodv )cytochrome c(III) + e~ (cytochromec oxidation) (1.2)
The m ain competing reaction in aqueous solution is the dism utation of superoxide according to
the following reaction
0 2 + 0 2— >H20 2 + 0 2 (1.3)
The cytochrome c th a t is reduced by superoxide is re-oxidised by m aintaining a working
electrode a t potential of +100mV (vs. Ag/AgCl).22 The quality of the immobilisation (and hence
oxidising current measured) is highly dependent on immobilisation method and the natu re of
the gold surface. Developing an efficient electrochemical couple for detecting the superoxide ion
on a microfabricated electrode was one of the most challenging aspects of the project.
4

1. Introduction
GoldElectrode
Modifier
Cytochrome c
Figure 1.3: An electrochemical superoxide sensor. The operation is based upon the reduction of the cytochrome c protein immobilised at a modified gold electrode. The subsequent re-oxidation of the cytochrome c generates an electrical current related to the concentration of superoxide in solution.
1.3.2 G lu co se B io sen so r
The glucose biosensor has received much attention since the principle of an enzyme-electrode
was first described by Clark and Lyons in 1962.23 The basic sensing elem ent is based on the
oxidation of the hydrogen peroxide a t ca. +0.65V (vs. Ag/AgCl) produced as a product of the
reaction of the glucose oxidase (GOx) w ith the glucose substrate.24
Much of the subsequent work focused on the optimisation of the sensor for use in whole blood
and in vitro m easurem ents. The major problems encountered include: biocompatability,
durability, oxygen sensitivity and the elimination of interferent effects. Numerous approaches
have been investigated such as the use of polymer films, m embrane coatings and mediators.
For example, the use of cellulose acetate film provides a good biocompatible surface which can
also minimises the effects of specific electrochemical interferents. Mediators such a ferrocene or
ferricyanide allow the assay potential to be lowered, further reducing the current contribution
from interferents.
Progressing from the early “enzyme sandwich” methodology of Clark and Lyons, much work has
been conducted into novel methods of enzyme entrapm ent. It is desirable to achieve maximal
enzyme loading as close as possible to the electrochemical surface. This reduces diffusional
loses and maximises the current response. The function of some commercially available screen-
printed glucose sensors is based on the crude, but effective, immobilisation of GOx in a carbon
5
534853534823482348482389

1. Introduction
paste, in contrast, much recent academic work has concentrated on enzyme entrapment in
polymers.
2e-
Electrode (2n-1)e-
c i-or
CounterGOxIon
Figure 1.4: The entrapment of enzyme by the electrolytic oxidation of the pyrrole monomer.M odified from H all. 12
Successful entrapment of GOx within a variety of polymer films is classically demonstrated
using an electrochemical assay. However, determination of the amount of active enzyme in the
film requires a more complex analysis. The work on glucose biosensors presented in this thesis
has concentrated on the physical characterisation of the biosensor interface, with the aim of
characterising the distribution of enzyme within the film. An original technique has been
developed based on the determination of the relative ratios of enzyme to binding matrix. The
model system employed was a polypyrrole (PPy)/GOx based sensor, the enzyme being entrapped
within the polymer matrix during its electropolymerisation in an aqueous solution of monomer
and enzyme (figure 1.4).
6

1. Introduction
The catalytic oxidation of glucose is a two stage compulsory ordered mechanism. First, glucose
reacts with the enzyme, followed by the oxidation of the flavin adenine dinucleotide (FAD)
redox centre by dissolved molecular oxygen, as shown below (equations 1.4 and 1.5):
GOx (pad) + /5 - D-Glucose —» GOX(FAdh2) + ^ ' Gluconolactone (1.4)
^ x (FADH2 ) + ^ 2 ^ X(FAD) + ^ 2 ^ 2 (1-5)
Mediators compete with the molecular oxygen reaction, but when they are not used, the H2O2
generated provides an intrinsic mediator that can be oxidised at the electrode surface
(equation 1.6):
H20 2 -> 0 2 + 2H+ + 2e" (1.6)
Keilin and Hartree25 demonstrated that GOx is highly specific for the 3-anomer of glucose. The
other product, gluconolactone, is a weak competitive inhibitor which rapidly hydrolyses to
gluconic acid.
When the polymer film is thin, it can be assumed that there is no substrate concentration
polarisation within the film,26 and the electrochemical response can be analysed accordingly,
using a simple mathematical model. The original motivation for this research was to try to
determine total enzyme concentration (e£ ) at the biosensor interface, as used in the expression
below (equation 1.7):
nFAa K M 1 1 = ------ + ---------+ ------------- (1.7)h b s k catK sS ~ e Zl K a t e 4 k K A a j > z l
For the example where GOx is entrapped in a polymer film, the terms used in this model
represent the following: i 0bs is the current response, n is the number of electrons transferred
(two), F is the Faraday constant, A is the area of the electrode, and I is the thickness of the
polymer film. KM and kcat are the enzyme kinetic parameters and k is the rate constant for the
reaction of dioxygen with GOx. KA and Ks are the partition coefficients into the polymer film
for oxygen and glucose, respectively - with a „ , and s„ representing the bulk concentrations.
The parameter a describes the balance between the detection of H2O2 at the electrode surface
and its loss to the bulk solution, previously it has been estimated as O.5.26 27
7

1. Introduction
Of the variables used in this model, the terms for I and ex are determined by the polymerisation
conditions chosen during biosensor construction. So, for example, at a given film thickness, it
would seem to be possible to vary ez at the biosensor surface by altering the ratio of enzyme to
monomer in solution prior to polymerisation. To date, however, it has not been possible to
measure ex . It has therefore only been practicable to infer that the concentration in the film has
changed by measuring the sensor’s response and correlating this to the polymerisation
conditions (pre-supposing that all of the enzyme present is equally active). As a consequence,
further detailed kinetic analysis of enzyme-polymer films using equation 1.7 has proved
difficult.
Of the many of the interfacial techniques available in biosensor surface characterisation (e.g.
ellipsometry,28 surface plasmon resonance29 or quartz crystal microbalance30), none can be
readily used to measure ez , as they do not apportion the relative amounts of polymer and
protein. Two studies based upon labelled enzymes have attempted to determine ex entrapped
in non-conducting polymers. In the first instance, Bartlett et al. have used "hot" GOx entrapped
in poly(N-methylpyrrole) to show, through competition studies, that different amounts of
enzyme can be entrapped in films under different polymerisation conditions.27 More recently,
Wang et al. have entrapped fluorescently labelled proteins in non-conducting polymers and
have measured intensity as a function of distribution at the electrode surface.31 However, in the
latter case, if the enzyme is not orientated within the film there may be quenching of the
fluoroprobe at the metal electrode.
In this project, X-ray photoelectron spectroscopy (XPS) was used to provide elemental analysis
and quantification of the enzyme concentration at the interface of the polymer film.
Electrochemical assays were performed in parallel to assess the response of the active enzyme
in the film. Further parallel studies using Fourier transform infra-red (FTIR) spectroscopy
were performed as a bulk sensitive means of monitoring the total enzyme concentration
throughout the thickness of the biosensor film.
1.4 Dielectrophoresis
The phenomenon of dielectrophoresis was used in this project for positioning and rotating
micrometer-sized particles. The applications of dielectrophoresis included: cell sorting and
guidance,32-33 the measurement of fundamental electrical properties of cells,34-35 the creation of
bio-repellent surfaces36 and the analysis of bacterial contamination.37 The fundamental
advantage of dielectrophoresis is the non-invasive manner by which it exploits subtle electrical
differences to discriminate between similar particles, without the need for chemical
modification or labelling. Microfabrication is ideally suited to the manufacture of a variety of
8
1. Introduction
electrode geometries required for the generation of the non-uniform electric fields necessary for
dielectrophoretic particle manipulation.
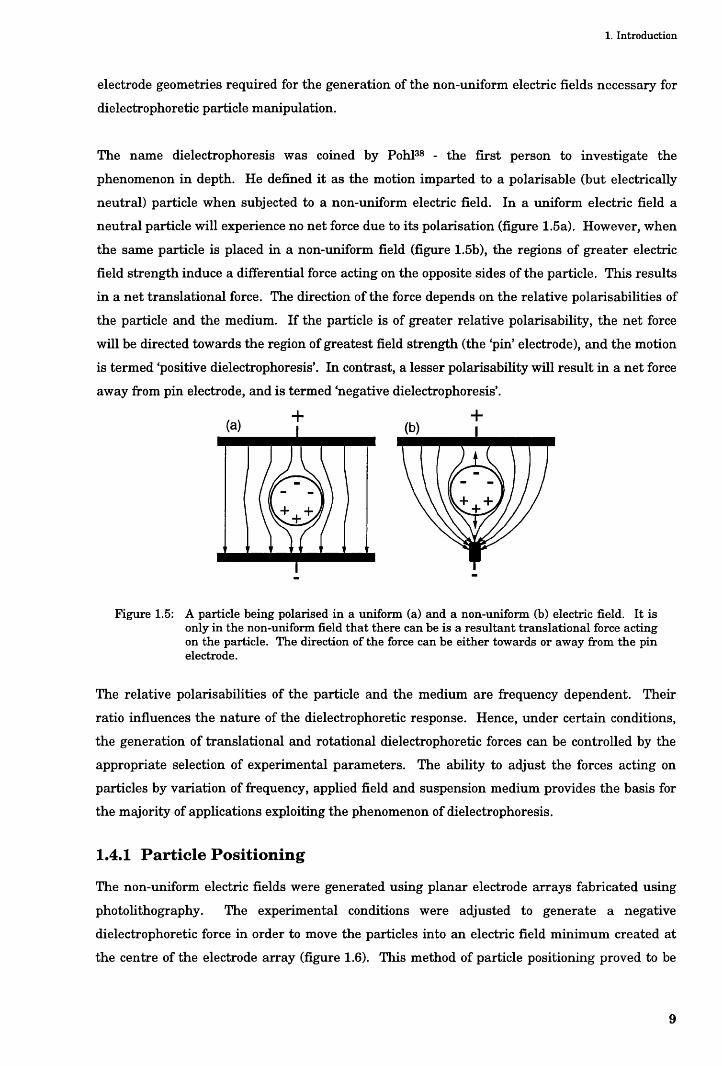
The name dielectrophoresis was coined by Pohl38 - the first person to investigate the
phenomenon in depth. He defined it as the motion imparted to a polarisable (but electrically
neutral) particle when subjected to a non-uniform electric field. In a uniform electric field a
neutral particle will experience no net force due to its polarisation (figure 1.5a). However, when
the same particle is placed in a non-uniform field (figure 1.5b), the regions of greater electric
field strength induce a differential force acting on the opposite sides of the particle. This results
in a net translational force. The direction of the force depends on the relative polarisabilities of
the particle and the medium. If the particle is of greater relative polarisability, the net force
will be directed towards the region of greatest field strength (the ‘pin’ electrode), and the motion
is termed ‘positive dielectrophoresis’. In contrast, a lesser polarisability will result in a net force
away from pin electrode, and is termed ‘negative dielectrophoresis’.
Figure 1.5: A particle being polarised in a uniform (a) and a non-uniform (b) electric field. It is only in the non-uniform field that there can be is a resultant translational force acting on the particle. The direction of the force can be either towards or away from the pin electrode.
The relative polarisabilities of the particle and the medium are frequency dependent. Their
ratio influences the nature of the dielectrophoretic response. Hence, under certain conditions,
the generation of translational and rotational dielectrophoretic forces can be controlled by the
appropriate selection of experimental parameters. The ability to adjust the forces acting on
particles by variation of frequency, applied field and suspension medium provides the basis for
the majority of applications exploiting the phenomenon of dielectrophoresis.
1.4.1 P article P osition in g
The non-uniform electric fields were generated using planar electrode arrays fabricated using
photolithography. The experimental conditions were adjusted to generate a negative
dielectrophoretic force in order to move the particles into an electric field minimum created at
the centre of the electrode array (figure 1.6). This method of particle positioning proved to be
9

1. Introduction
both convenient and accurate and has been previously demonstrated in figure 1.2. Little
particle pre-treatm ent was required and positional tolerances reflected the precision of
photolithographic process.
z |
x \
Figure 1.6: A simulated quadropole electric field trap for a single particle. The parameters have been set to model the experimental conditions necessary for negative dielectrophoresis. Particles initially within the ‘funnel’ of the electric field will eventually come to rest at the field minimum located at the centre of the electrode array. Reproduced from the work o/’Fuhr et al.39
The use of dielectrophoresis provides an excellent method for particle confinement and will
readily indicate dramatic differences in cellular properties. An excellent example is the
m easurem ent of the differences in membrane conductivity between live and dead yeast cells.40
1.4.2 E lectro ro ta tio n
Electrorotation occurs as a result of the induced torque exerted on particles in rotating electric
fields. The use of the technique has gained recent popularity as a means of observing more
subtle changes in both external and internal cellular properties. For example, physiological
changes in oocytes41 upon fertilisation.
In this study, electrorotation was also used to analyse the changes in the electrical properties of
hum an neutrophils upon activation by chemotactic reagents. Neutrophils are cells in the
bloodstream th a t play a crucial role in the function of the immune system. They are responsible
for processes such as phagocytosis42 and free radical release.43-44 Upon activation, the cells
undergo rapid physiological changes as part of the ‘respiratory burst’.45 The changes were
characterised by the variation in the electrorotational response of individual cells.
1.5 Thesis Structure
The work has been sub-divided into four main chapters, these are: microfabrication,
microbiosensors, dielectrophoresis and biosensor interfaces. Due to the scope of the work and
10

1. Introduction
the range of techniques, ‘methods’ and ‘theory’ sections have not been given separate chapters
but immediately precede the work for which they were employed.
Chapter 2 provides a summary of the microfabrication techniques developed during the project,
and elaborates upon the issues specific to the manufacture of reliable multilayer sensor
structures.
Chapter 3 describes the range of electrochemical techniques used in the project and
concentrates on the preparation and performance of the cytochrome c based superoxide
biosensor. In addition, there is the description of the use of chemiluminescence as a companion
technique for superoxide detection.
Chapter 4 is concerned with the use of dielectrophoresis for particle positioning and rotation.
The dielectrophoretic properties of human neutrophils are investigated and physical changes in
the cell wall during chemotactic stimulation are identified and discussed.
Chapter 5 presents the analysis of the interface of a PPy/GOx glucose biosensor using
amperometry, FTIR and XPS. The three techniques are used in parallel to determine the
activity and relative ratios of polymer and enzyme in the sensor matrix.
The conclusions and recommendations for further work are found in Chapter 6. References,
appendices and a list of abbreviations appears at the end of the thesis.
11

2. Microfabrication
2. Microfabrication
This chapter provides a brief summary of the fabrication methods used in this project. The
results presented provide a detailed analysis of the dominant issues identified in the successful
manufacture of microfabricated biosensors. The particular focus is on the development of
durable microbiosensors, hence factors such as metallisation and insulator adhesion have been
investigated in greater depth.
2.1 Methods & Materials: Microfabrication
The basic lithographic process for the fabrication of an insulated planar electrode structure is
shown in figure 2.1. Both photolithography and electron-beam (e-beam) lithography were used
during the course of the project; the practical resolution limit of photolithography is 2pm, for
smaller features e-beam lithography was necessary. When a choice was available, the
photolithographic process was the preferred fabrication method since it has a higher yield and a
shorter turnaround time. Etch depths and resist/insulator thickness were determined using a
Dektak ST3 (Veeco Instrum ents Inc.) surface profiler
2.1.1 S u b stra te C lean in g
All the work presented in this thesis was performed on either glass or polished quartz
substrates. The standard cleaning procedure is as follows:
1) Sonicate the substrate for 20 min in Decon 90 (Decon Labs Ltd.), mixed in a 1:1 ratio
with reverse osmosis (RO) water.
2) Thoroughly rinse in RO water.
3) Sonicate the substrate in RO water for 10 min.
4) Blow dry using nitrogen.
If the substrates are visibly coated with contamination, step 1 (above) should be preceded by a
10 minute sonication in Opticlear(G&S Inc.). Any residual resist remaining from previous
lithographic steps is best removed by sonication in acetone, again, if required, this should
precede step 1 in the above procedure.
12

2. Micro fabrication
(1) Spin Resist (2) Mask and UV Expose or e-beam direct write
-
(3) Develop Resist (undercut profile)
(4) Metal Evaporation
(5) Lift Off (6) Deposit Insulator
(7) Pattern Etch Mask (UV or e-beam expose) (8) Process Etch Mask
(9) Etch Insulator
EZZZajy.̂ y . .l g :
(10) Remove Etch Mask to give the Final Structure
Figure 2.1: The fabrication sequence for an insulated electrode structure manufactured using either photo and/or e-beam lithography.
13

2. Microfabrication
2.1.2 P hotolithography
The standard photoresist used in the project was S1818 (Shipley Inc.). It was purified by
filtering through a 0.25|im particle filter. Spinning parameters of 4000rpm for 30s produce a
resist layer of ca. 1.85|im thickness. Spin speed is the dominant parameter that controls resist
thickness, spin time has a less significant effect. It is important to fully coat the upper surface
of the substrate with resist before spinning. A slightly thicker rim of resist will always form at
the edges of the substrate, hence for reproducible lithography the pattern should be placed in
the central portion of the substrate. For the very smallest features (close to the practical limit
of 2p.m) a thinner resist layer is recommended. Thin resist coverage can be achieved using
faster spin speeds or a low viscosity resist such as Shipley ‘1400-17’ (ca. 0.45(im thick spun at
4000rpm for 30s). The full photolithographic procedure is as follows:
1) Spin S1818 resist (typically 4000rpm, 30s; to give a thickness of ca. 1.85fim).
2) Bake for 15 min at 90°C.
3) Soak in chlorobenzene for 10 min.
4) Blow dry and bake at 90°C for a further 15 min.
5) UV Expose for 14s (Hybrid Technology mask aligner, 32J cm'2, 364nm)
6) Develop in Microposit developer (1:1 mix with RO water) for ca. 80s.
7) Wash in RO water and blow dry.
The undercut resist profile desirable for an effective lift-off step (see section 2.1.4) is illustrated
in figure 2.1 (step 3). If this profile is not required step 3 above can be omitted and the resist
should be baked for 30 min. The chlorobenzene soak46 hardens the upper portion of the resist
causing it to develop at a slower rate, thus allowing an undercut resist profile to be formed.
2.1.3 E-Beam Lithography
The majority of e-beam lithography requires a bi-layer resist structure. This is created by the
spinning of two separate layers of resist of different sensitivity to e-beam exposure. The resists
are made by dissolving poly(methyl methacrylate) (PMMA) in o-xylene. The upper layer is a
higher molecular weight (MM > 400,000) version of the polymer, which when exposed to an e-
beam is degraded at a slower rate that the low molecular weight variety (MM ca. 90,000). As a
result, it will develop at a slower rate. As for the chlorobenzene soak procedure described in
section 2.1.2, the resultant undercut profile is tailored for use in the metal lift-off process. The
full procedure is as follows:
1) Spin lower molecular weight resist (5000rpm, 60s are typical spinning parameters).
2) Bake at 180°C for 60 min.
14

2. Microfabrication
3) Spin higher molecular weight resist (5000rpm, 60s).
4) Bake at 180°C for 120 min.
5) Evaporate a 50nm layer of Cr onto the sample (necessary for charge dissipation).
6) E-beam expose (Leica EBPG-5, HR).
7) Remove the Cr layer using a wet etch (see section 2.1.5.1.1).
8)Develop in methyl isobutyl ketone (MIBK)/isopropyl alcohol (IPA) solution for ca. 35s.
9) Wash in RO water and blow dry.
The higher the concentration of dissolved polymer, the more viscous the resist layers produced.
High resolution patterns require thinner layers of resist. The ratio of MIBK:IPA required for
resist development (step 8 above) is determined by the thickness of the bi-layer resist structure.
2.1.4 M etal Evaporation and Lift-Off
The majority of metal evaporation in this project was performed on the Plasyss QD1 automated
e-beam evaporation system. The low pressure (3xl0'7Torr) and reduced chamber contamination
of this system are important factors in guaranteeing both the quality and reproducibility of the
resultant metal layer. The most common metal layer used was Ti/Pd/Au (10/10/100nm)
although solitary layers of Ti and Cr were required at certain stages of the fabrication
procedure.
The lift-off procedure is performed following metal evaporation and involves the dissolving of
the resist pattern in acetone to leave the metal in the regions defined by the lithographic
process. An undercut profile is necessary to provide a good break between the metal layer
deposited on the resist and the layer deposited on the substrate (see figure 2.1, step 4-5). Poor
lift-off can be caused by a non-ideal resist profile and will result in rough electrode edges and
short-circuits between closely spaced features. It is important to carefully wash the substrate
as it is removed from the lift-off solution so as to ensure that none of the metal particle re-
adhere to the substrate.
2.1.4.1 G old M eta llisa tion
Work was performed on the deposition of gold electrodes, i.e. without the need for a Ti/Cr based
underlayer.47>48 This procedure required the deposition of a [3-mercaptopropyl]
trimethoxysilane (MPS) underlayer prior to metallisation. The procedure used is as follows:
1) Clean the substrates
2) In a fume hood, reflux the substrate in a solution of 400ml IPA, 10ml RO water and
lOg MPS.
3) Wash the substrates in IPA and blow dry in nitrogen.
15

2. Microfabrication
4) Bake at 105°C for 10 min.
5) Repeat steps 2-4 above a total of three times.
2.1.5 E lectrode Insu lation
Insulating layers on planar structures can be created by the deposition of an insulator followed
by its patterning using either wet or dry etch techniques. The two insulators investigated were
polyimide and silicon nitride. Manual insulation of large features (e.g. contact wires) was
performed using silicone adhesive (Dow Coming, RTV 3140) or epoxy adhesive.
2.1.5.1 P oly im ide
The standard procedure for the deposition and patterning of polyimide (Hitachi, PIQ 13) is as
follows:
1) Clean the substrates.
2) Spin PIQ 13 primer layer at 5000rpm for 30s.
3) Bake at 350°C for 30 min.
4) Spin on PIQ 13 polyimide, typical film thickness was 1.35(j.m (5000rpm, 30s).
5) Bake at 350°C in a N2 atmosphere for 60 min.
6) Spin resist layer and pattern (see section 2.1.2).
6) Evaporate a 30nm layer of Ti or Cr as the etch mask.
7) Perform lift-off to provide a photo-negative mask.
8) Reactive ion etch (RIE) etch the polyimide in O2/CF4 (see section 2.2.2.1.1).
9) Remove the etch mask using a wet etch (see section 2.1.5.1.1).
2.1.5.1.1 Titanium and Chromium Wet Etching
The Ti etch is composed of 0.1M ethylenediamine tetraacetic acid (EDTA) dissolved 30% H2O2
solution.49 The etch should be stored in the refrigerator when not in use, it will maintain a
consistent etch rate for about one week. The etch is highly specific for Ti (at least 20 times
faster than with Ni or Cr) and the etch rate is lOnm min'1.
The Cr etch (100ml) is made from 3.5ml glacial acetic, and 20g ammonium eerie nitrate
dissolved in 100ml of RO water. The etch rate is ca. 20nm min'1 and the etch will last for up to
three months when stored at room temperature.
2.1.5.2 S ilicon N itr id e
The procedure for patterning of silicon nitride deposited by plasma enhanced chemical vapour
deposition (PECVD) is as follows:
1) Clean the substrates.
16

2. Microfabrication
2) Deposit silicon nitride using an Oxford Plasma Technology |nP-80, the routine
deposition rate is ca. lOnm min'1.
3) Spin resist layer and pattern (see section 2.1.2), the etch mask is a photo-positive.
4) RIE etch the silicon nitride in C2F6 (see section 2.2.2.1.2), the standard etch rate is
50nm min'1 at 100W (Oxford Plasma Technology BP-80, 30sccm flow rate, lOmT).
5) Remove residual etch mask using acetone.
2.2 Results and Discussion
In this section, aspects of microbiosensor metallisation and insulator patterning will be
discussed. Effective metallisation of sensor structures must satisfy a number of requirements
such as: adhesion, durability and electrochemical stability. The work also addresses the issues
of gold metallisation and the fabrication of multilayer structures. Polyimide and silicon nitride
were the insulators used in the project, and results are presented on the influence of factors
such as adhesion, etching method and insulator integrity. Samples of the sensor structures
fabricated using the range of techniques described in this chapter are shown in figure 2.2.
2.2.1 Sensor M etallisation
The main goal of the work on sensor metallisation was the formation of an electrochemically
stable and adherent structure. The need for a gold electrochemical surface presented the first
limiting factor since evaporated gold alone does not adhere well to the majority of substrates.
Limited success has been observed by gold evaporation onto heated mica,50 however, in general,
an underlayer of Ti or Cr is necessary to promote gold adhesion.
Due to the need for an underlayer, most sensor structures were fabricated using a recipe of first
lOnm Ti followed by lOOnm gold. Providing the evaporation was performed at low pressure in a
low contamination chamber (an advantage afforded by the automated Plasyss evaporation
system), the adhesion of the metal film using this recipe was good. The adhesion was tested
using the ‘Scotch’ tape test. While this metallisation method was suitable for most
electrochemical experiments conducted at low positive potentials, the Ti/Au structure
demonstrated poor long term stability at voltages >0.9V (vs. Ag/AgCl) necessary for procedures
such as acid cycling (see section 3.1.3.1.1) and polymer oxidation (see section 5.1). The failure
mechanism was the de-lamination of the metal layer due to the oxidation of the Ti underlayer.
17

2. Micro fabrication
(a) (b )
Figure 2.2: Samples of the microfabricated electrode structures produced during the course of theproject, (a) A ring array fabricated using e-beam lithography (200nm wide rings), (b) A ring electrode array fabricated using photolithography, (10pm wide rings); the insulator has been patterned so as to only cover the tracking to the array. The <Y-shaped’ TWD electrode structure (c). The electrode has three channels and can be used for cell sorting applications (see section 4.4.1); The individual gold finger electrodes are 120nm tall, 10pm wide and on a 10pm pitch, there is a 50pm gap across the channel. The close-up photograph (d) highlights the thru-holes etched in the silicon nitride insulator (200nm thick).
18

2. Microfabrication
In an attempt to improve the stability of the metallisation, a Pd intermediary layer (lOnm) was
introduced between the Ti and the Au following the method of Lambrechets et al.1 This method
was successful, and the electrode structure provided a stable electrochemical response during
repetitive cycling for up to 60 min in 1M HClCMlOOmV s'1, 0 to +1.5V vs. Ag/AgCl). The precise
mechanism by which the Pd improves the stability of Ti/Pd/Au structure is not clear, although
according to Sharp51 the Pd forms an diffusion barrier to oxygen that reduces the rate of
underlayer oxidation. An additional benefit gained from the use of the Pd layer is the
minimisation of the undesirable electrochemical currents caused by Ti or Cr diffusion along
grain boundaries to the surface of the gold layer.48
2.2.1.1 G old M eta llisa tion
Exploratory work was performed on the use of the method of Goss et al.52 to form an gold-only
metallisation layer to eliminate any potential effects from underlayer metal contamination.
The procedure relied on the use of MPS, which contains siloxane and thiol terminating groups.
The siloxane group bonds to the glass/quartz substrate and the thiol group bonds to the
evaporated gold layer. The procedure was very successful, and while a quantitative
measurement of adhesion could not be made, due to the lack of suitable equipment, the
metallisation did survive the benchmark ‘Scotch’ tape test.
It was not necessary to immediately evaporate the gold layer, and excellent adhesion was
achieved on substrates metallised within three days of formation of the MPS adhesion layer
(samples were kept in a sealed container). It was also possible to perform photolithography on
a treated substrate before evaporation of the gold layer. This result provides a simple way to
fabricate gold-only structures while maintaining excellent metal adhesion. A similar
experiment using e-beam lithography was unsuccessful, suggesting that the high energy
electrons destroy the integrity of the MPS layer while the UV energy used in photolithography
does not have a similar effect.
The final test of the MPS/Au structure was to determine its electrochemical stability during
acid cycling at high positive potentials (1M HCIO4, lOOmV s'1, 0 to +1.5V vs. Ag/AgCl). Stability
was better than observed for the Ti/Au metallisation method (ca. 5-10 cycles), however, the
gold-only structure did eventually begin to de-laminate after about 30 cycles. The adhesion
failure was most likely caused by the oxidation of the thiol underlayer..
2.2.1.2 M u ltilayer S tru c tu re M eta llisa tion
The need for a multilayer metallisation was driven by the work on the fabrication of the
travelling-wave dielectrophoresis (TWD) electrode design shown in figure 2.2c. However, the
procedures described could be applicable to the fabrication of any multilayer microbiosensor
structure. The TWD electrode required two layers of metallisation that were connected by
19

2. Microfabrication
‘thru-holes5 in the first layer of insulator. The first base metal layer was Ti/Pd/Au, the second
layers investigated were either Ti alone, Ti/NiCr or Ti/Pd/Au. The insulator layer was PECVD
silicon nitride (200nm) patterned using photoresist masking and C2F6 etching (see
section 2.2.2.1.2).
There are two standard methods of ‘thru-holing5 used in microfabrication, either electroplating
(be it electrochemical53 or electroless54) or profiled metal-layer evaporation.55 Electroplating
methods deposit metals such as Ni, Cu or Au on regions exposed in the base metal layer
following the etching of thru-holes in the insulator layer. The procedure completely fills the
etch holes and subsequent thru-hole interconnection is achieved by evaporated/sputtered
deposition of a metal layer. Work on the mechanism of gold electroplating was investigated and
figure 2.3a illustrates the porous nature of the surface produced. Whilst electroplating can be a
reliable and well characterised process53-56 within the electronic industry, it was found to be
difficult to control in the laboratory. The main difficulties were the poor electrochemical surface
produced, solution degradation, and the variation in deposition rates associated with different
shapes and areas in the exposed base metal layer. Further work is required on this topic to
develop a consistent process. Electroplating is very cost effective in relation to metal
evaporation/sputtering and an excellent method for the metallisation of high aspect ratio
structures.
The key to successful ‘thru-holing5 by metal evaporation is the etching of thru-holes with walls
at an angle of ca. 60°,54 which is a compromise between a high hole density and reliability. The
shallower the angle the more space each thru-hole feature occupies on the substrate. In
comparison, steep angle thru-holes occupy less space but promote track breaks. The thru-holes
produced using a C2F6 etch in the silicon nitride had an angle of ca. 80°, as measured by the
observation of scribed substrate using a scanning electron microscope. This angle was rather
higher than optimal and the available methods for reducing the angle, such as lowering etch
power or increasing gas flow rate had little significant effect. A thorough analysis57-58 concludes
that thru-holes are best formed using either an isotropic wet etching or by using a low power
RIE etching mechanism that is highly ‘chemical5 in nature (i.e. less anisotropic). Unfortunately,
wet etching using HF acid was unreliable and the facilities for alternative RIE procedures were
not available during this project. Nevertheless, for the TWD electrodes, the 80° angle
thru-holed samples (Ti/Ni metallisation) resulted in a 66% (n=6) success rate as measured by
using a simple continuity test.
20

2. Microfabrication
(a) (b)
(c) (d)
1 \ V,
l lo
R esidue EThickness \ t l
80nm f u y ....... .......t—1—1—1—1—I—1—'—1—1—I—1—1—1—1—r
F 0.8 -=1nC l 0.4 -0)Q
0.0 -
0 500 1000 1500 2000Scan Length (pm)
Figure 2.3: (a) An electroplated gold electrode, the photograph illustrates the rough nature of the plated surface, (b) A ‘burnt out’ ring electrode, the failure was caused by seepage of electrolyte between the poorly adhered insulator and substrate layers, (c) A dramatic example of the RIE etch residue (‘polyimide grass’), photograph courtesy of F. Pottier. (d) An instance where the etch residue/resistant area (severely over-etched sample) has formed a uniform covering. A small region of residue (arrowed) in the centre of the sample has broken free, the surface profile (vertical line) provides an indication of thickness.
21

2. Microfabrication
In addition, the choice of evaporated metal and its thickness had a significant effect on
fabrication success. The initial method used was the e-beam evaporation of a 240nm thick layer
of metal so as to fill the thru-holes etched in the 200nm thick insulator layer. The alternative
method of evaporating a thinner layer (i.e. 50nm), to metallise the profile of the thru-hole was
unreliable, probably due to track breaks caused by the high 80° thru-hole angle (see figure 2.4).
Using a 240nm Ti layer alone was unsuccessful, due to the stress th a t existed within the
evaporated metal film. This caused the metallisation to de-laminate during the lift-off process.
This prompted the investigation of alternative ‘low stress’ metal films, such as, Ti/Pd/Au
(20/20/200nm) and a mixed layer of Ti/Ni (60/20 in three consecutive layers). Both methods
produced working thru-hole structures. The Ti/Ni option being preferred due to the prohibitive
cost of evaporating 200nm of gold. The Ti/Ni mixed layer is thought to be successful for thick
evaporated metallisation due to the counteracting effect59 of the opposing stresses in the
individual metals, this results in an combined film th a t is low stress in nature.
W hilst a satisfactory yield could be obtained using the above metallisation procedure, the
performance of the TWD electrode structures was poor when used in solution. In a saline
solution under the application of high AC potentials, the structure rapidly disintegrated.
Failure was ascribed to the de-lamination of the silicon nitride from the substrate, a process
seen previously in similar non-multilayer structures used in work on neural networks.60 The
failure mechanism of the silicon nitride has been identified as poor adhesion and latent stress
within the insulator film. This problem is discussed in greater detail in section 2.2.2.2.
(a) (b)
mmmmmmsmammmmedmm. wwwrmiwnwriiwMywir2nd M etal
Insulator ' m m1st M etal
Substrate
Figure 2.4: An illustration of the alternative ‘thru-holing’ methods investigated in the project.(a) A thin layer of metal coating the top surface of the insulator and the wall of the thru-hole. Probable location of track breaks are indicated by arrows, (b) A thick layer of metal that completely fills up the thru-hole
2.2.2 S en sor In su la tio n
The work on planar deposition and patterning of insulator layers focused on two materials:
polyimide and silicon nitride. Polyimide is an organic polymer deposited by spin coating
followed by curing at 350°C. Silicon nitride is deposited as an amorphous m aterial using
chemical vapour deposition (CVD). In this project PECVD was used, since the alternative CVD
2 2

2. Microfabrication
method is a high temperature method56 conducted at 900°C which is above the melting point of
the gold used in the sensor metallisation. Polyimide can be deposited at a thickness from 0.5-
20|im by adjustment of viscosity and/or spin speed. In contrast, silicon nitride is deposited as a
thinner layer due to the slower rate of deposition (ca. lOnm min"1) - standard film thickness
ranged from 50-1000nm.
2.2.2.1 P a tte rn in g o f In su la to r Layers
Polyimide and silicon nitride can be patterned using both wet and dry etching techniques. The
wet etch for polyimide is high temperature KOH61 but this method was discovered late in the
project, and was not investigated. The wet etch for silicon nitride is Hydrofluoric acid. This
etching mechanism is inconsistent and was little used, since it would also etch the glass or
quartz used as substrates for the electrode structures. For both insulators, the dominant
patterning technique is RIE, using an O2/CF4 mixture for polyimide and either C2F6 , CHF3 or
SFe for silicon nitride.
2.2.2.1.1 Polyimide - RIE Etching
Figure 2.5 provides details of the etch rate of PIQ13 polyimide using O2 at a range of powers.
The variation of etch rate with power is linear over the range 25-100W. Photoresist is an
unsuitable etch mask, since it etches at a faster rate than polyimide.62 The etch mask used was
a 30nm layer of Ti that was subsequently removed using the procedure described in
section 2.1.5.1.1. To promote a more isotropic etch for applications such as the shallower wall
profiles required for thru-holes, the use of CF4 has been recommended.63 Whilst the structures
fabricated in this project using polyimide did not require specific aspect ratios, the use of 5%
CF4 increased the etch rate by ca. 10% and improved the quality of the etching process by
reducing the amount of deposited etch residue (termed 'polyimide grass’ in the literature54).
1.6
10 min 0.81.2
0.8CL
R ate = 5 6 .8 n m minq 0.45 min
lu 0 .40.2
0.00.00 25 50 75 100 0 5 10 15 20
E tching P o w er (W) E tching T im e @ 25W (min)
Figure 2.5: A comparison of the PIQ 13 polyimide etch rate (25W) at a range of powers (a), and the variation of etch depth with time (b). The polyimide was prepared as described in section 2.1.5.1 and was etched with oxygen (20sccm, 22mT) using an Oxford Plasma Technology BP-80 RIE machine.
23

2. Microfabrication
The deposition of etch residue was a persistent and intractable problem encountered
throughout the studies on polyimide and examples are shown in figure 2.3c&d Any residue
remaining on the etched surface severely inhibited subsequent electrochemical studies due to
fouling of the electrode surface. Over-etching the polyimide, in an attempt to remove the
residue, only compounded the problem. It is suggested64 that residue formation is based on the
formation of metallo-organic compounds from reactions of RIE products with metal sputtered
from the electrode structures. The residue components are resistant to the etching gases and
form a permanent coating on the substrate. Hence, successful RIE etching is a very sensitive
process requiring the minimal degree of over-etching necessary to form a viable electrode
structure.
The methods used to reduce the amount of etch residue produced include: the reduction of
etching power (to minimise metal sputtering) and the careful control of etch depth to ensure
only a 2-5% over-etch. Whilst attempts were successful, the majority of electrodes were
scrapped due to either excessive residue or under-etching. A interactive step-wise approach to
the etching procedure was difficult to implement since the optimal etch-stop point was
impossible to determine without an electrochemical test.
Polyimide is a flexible insulator with many advantages over silicon nitride. For example, it has
a greater thickness range, excellent planarisation properties and improved adhesion. However,
the difficulties with etch residue deposition need to be overcome before it can be used as a
reliable element in electrochemical microbiosensors. Attempts in the literature at minimising
the residue deposition have focused on the use of complex process control,65 minimal etch
power66 and partial ‘de-grassing* using a dilute HF acid wet etch.67 Alternative methods include
the use of photosensitive polyimide,65 hence avoiding the need for RIE. Furthermore, the use of
a thick hardened photoresist etch mask (instead of the standard Ti, Ni or Cr mask) is an option,
the reduced surface area of exposed metal will limit the amount of sputtered metal particles
within the RIE chamber atmosphere.
2.2.2.1.2 Silicon Nitride - RIE Etching
Silicon nitride etching using a photoresist mask was less sensitive to the residue deposition
problems encountered during the patterning of polyimide (see section 2.2.2.1.1). However,
excessive over-etching can result in similarly poor electrochemical surfaces. Etching in C2F6
was preferred to CHF3 purely in terms of speed: 50nm min'1 in comparison to 30nm min'1. The
dominating difficulty encountered using silicon nitride was poor adhesion.
2.2.2.2 In su la to r A dhesion
Insulator adhesion is a crucial factor in the stability of an aqueous biosensors. For devices such
as integrated circuits, manufactured using standard microfabrication techniques, insulator
24
2. Microfabrication
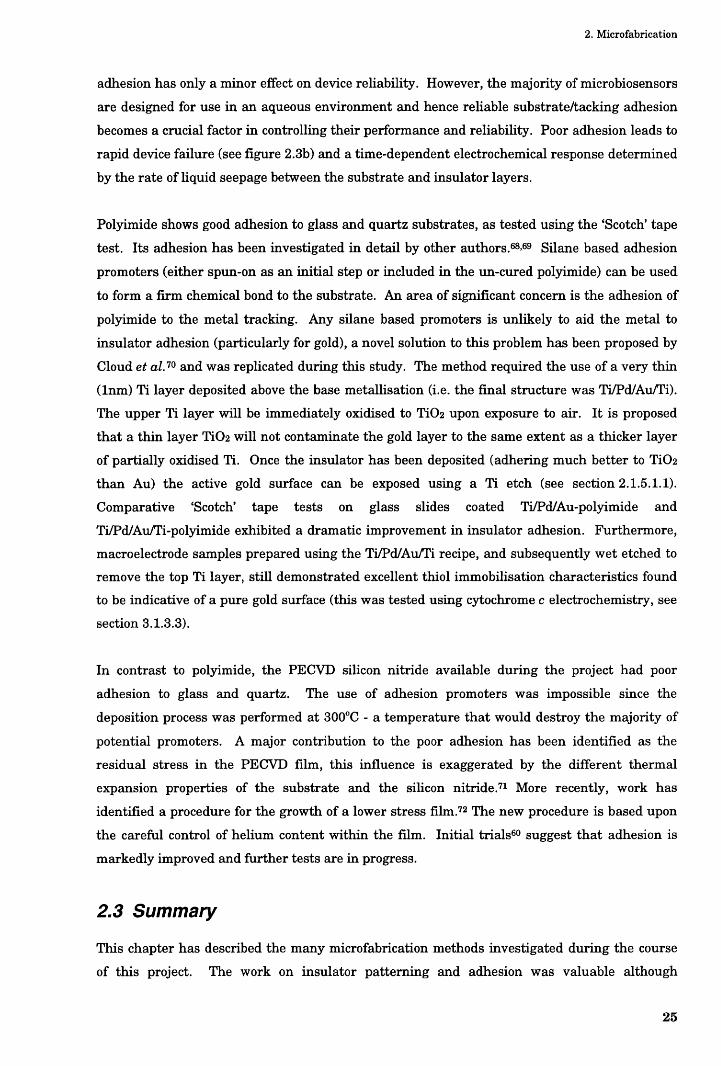
adhesion has only a minor effect on device reliability. However, the majority of microbiosensors
are designed for use in an aqueous environment and hence reliable substrate/tacking adhesion
becomes a crucial factor in controlling their performance and reliability. Poor adhesion leads to
rapid device failure (see figure 2.3b) and a time-dependent electrochemical response determined
by the rate of liquid seepage between the substrate and insulator layers.
Polyimide shows good adhesion to glass and quartz substrates, as tested using the ‘Scotch’ tape
test. Its adhesion has been investigated in detail by other authors.68-69 Silane based adhesion
promoters (either spun-on as an initial step or included in the un-cured polyimide) can be used
to form a firm chemical bond to the substrate. An area of significant concern is the adhesion of
polyimide to the metal tracking. Any silane based promoters is unlikely to aid the metal to
insulator adhesion (particularly for gold), a novel solution to this problem has been proposed by
Cloud et a/.70 and was replicated during this study. The method required the use of a very thin
(lnm) Ti layer deposited above the base metallisation (i.e. the final structure was Ti/Pd/Au/Ti).
The upper Ti layer will be immediately oxidised to TiC>2 upon exposure to air. It is proposed
that a thin layer Ti0 2 will not contaminate the gold layer to the same extent as a thicker layer
of partially oxidised Ti. Once the insulator has been deposited (adhering much better to Ti02
than Au) the active gold surface can be exposed using a Ti etch (see section 2.1.5.1.1).
Comparative ‘Scotch’ tape tests on glass slides coated Ti/Pd/Au-polyimide and
Ti/Pd/Au/Ti-polyimide exhibited a dramatic improvement in insulator adhesion. Furthermore,
macroelectrode samples prepared using the Ti/Pd/Au/Ti recipe, and subsequently wet etched to
remove the top Ti layer, still demonstrated excellent thiol immobilisation characteristics found
to be indicative of a pure gold surface (this was tested using cytochrome c electrochemistry, see
section 3.1.3.3).
In contrast to polyimide, the PECVD silicon nitride available during the project had poor
adhesion to glass and quartz. The use of adhesion promoters was impossible since the
deposition process was performed at 300°C - a temperature that would destroy the majority of
potential promoters. A major contribution to the poor adhesion has been identified as the
residual stress in the PECVD film, this influence is exaggerated by the different thermal
expansion properties of the substrate and the silicon nitride.71 More recently, work has
identified a procedure for the growth of a lower stress film.72 The new procedure is based upon
the careful control of helium content within the film. Initial trials60 suggest that adhesion is
markedly improved and further tests are in progress.
2.3 Summary
This chapter has described the many microfabrication methods investigated during the course
of this project. The work on insulator patterning and adhesion was valuable although
25

2. Microfabrication
problematic and the limitations of the process hindered the successful fabrication of functioning
microbiosensor structures. A potential method for overcoming the formation of polyimide etch
residue is the use of a combination of dry and wet etching. The insulator could be first etched
using RIE to 90-95% of the desired depth and then the residual 5-10% could be removed using a
brief wet etch. Once the process has been proven, the use of ‘low stress’ silicon nitride will
present a improved method for sensor insulation
The further development of the MPS based system for the metallisation of gold-only structures
presents exciting possibilities for precision electrochemistry using microbiosensors. The
demonstrated use of a Ti ‘top-layer’ to improve metal to insulator adhesion will aid the
fabrication of stable and durable microfabricated microbiosensors.
26

3. Microfabricated Biosensors
3. Microfabricated Biosensors
This chapter provides an insight into the response of sensors manufactured using previously
described microfabrication techniques (see section 2.1). An electrochemical superoxide sensor
(see figure 1.3, chapter 1) was chosen as the basis for the research. The sensor used the
phenomenon of dielectrophoresis (see chapter 4) as a method of trapping a single human
neutrophil th a t could act as a localised source of superoxide. The results are compared to those
provided by using the alternative technique of chemiluminescence. Other factors such as sensor
pre-treatm ent and durability have been characterised. The performance of a glucose biosensor
was also investigated but the results are presented later in chapter 5, nonetheless, the
background electrochemical theory presented in this chapter is applicable to both types of
sensor.
3.1 Electrochemistry
A change in oxidation state or charge transfer are processes common to many chemical or
biochemical reactions. The associated transfer of charge can be analysed using a variety of
electrochemical techniques73'74 to determine factors such as reaction kinetics and/or
concentrations. The need for minimal signal transduction and the availability of accurate
electronic instrum entation makes electrochemical measurem ent a popular approach in
biosensor development. Electrochemistry was used extensively in this project for the analysis of
surface cleanliness and for monitoring the response of a variety of sensor structures.
3.1.1 Theory: E lectro ch em istry
The standard techniques of chronoamperometry and cyclic voltammetry provided the backbone
of the amperometric electrochemical analysis used in this study. The techniques were applied
using both macro- and micro- sized electrodes and the effects of different electrode sizes is
discussed below.
3.1.1.1 C hronoam perom etry
This is a technique frequently used for the recording the response of voltammetric
biosensors.75'76 The technique relies on the measurement of the time course of a redox current
at a constant potential. The working electrode of a three electrode configuration is maintained
at a constant potential necessary to oxidise or reduce the analyte, the magnitude of redox
current being related to the concentration of analyte in the reactant solution. The technique
27

3. Microfabricated Biosensors
provides a rapid method of quantitative analysis, however, calibration against known standards
is necessary. A disadvantage of the technique is that only one point of the voltage/current curve
is recorded. Variations in responses associated with sensor deterioration or contamination
cannot be distinguished from changes in analyte concentration. An example current vs. time
curve for a PPy/GOx glucose sensor is shown in figure 3.1.
80
60 -
<c
40 -c<D*_
O 2 0 -
0 -
Figure 3.1: An example of the chronoamperometric response of a PPy/GOx sensor. Repetitive additions of the substrate (glucose) are indicated by arrows. The working electrode is maintained at a constant potential (+0.65V vs. Ag/AgCl). At this potential, oxidation of the product (hydrogen peroxide) produces a concentration dependent electrochemical current.
3.1.1.2 Cyclic V oltam m etry
The technique involves the cycling of working electrode voltage between potential limits (see
figure 3.2a), which are defined by the redox couple(s) of interest. This allows the fate of the
electrochemical species created in the forward potential sweep to be probed during the return
sweep. The technique is a popular method for the analysis of redox couples77-79 and quickly
provides information on the kinetics of the system.80-81 The observed current is made up of two
components. The first is a background (non-Faradaic) current component, associated with
double-layer charging and adsorption effects at the electrode surface, whilst the second
(Faradaic) current, provides information regarding the electrochemistry of the redox couple(s).
Sample experimental voltammograms for ferricyanide (K3Fe(CN)6) are shown in figure 3.2b.
The peaks in the current response are observed due to the combined effect of a decreasing
surface concentration and an expansion of the diffusion layer with time. The key parameters in
a cyclic voltammogram are the anodic and cathodic peak currents, peak separation (AEP), and
400 800 1200Time (s)
1600
28

3. Microfabricated Biosensors
the half-wave potential. The half-wave potential is usually within a few mV of the formal
potential of the redox couple. The peak separation provides information of the reversibility and
number of electrons involved in the electrode reaction. Theoretically, the difference should be
59mV for a reversible one electrode redox couple at room temperature.
10OmV s30
20First C ycle- - 0.2
O)<■fcO.0 5mV s'
s 0.2-10
■a 0.4-20
0.6-30
0.8-4020 40 60 80 100
Tim e (s)o
-50■0.1 0.0 0.1 0.2 0.3 0.4 0.5 0.6 0.7
Potential (V) vs. Ag/AgCl
Figure 3.2: (a) One of the ramp potential profiles used in the above experiment (scan rate=10mV s'1), (b) Cyclic voltammograms of ferricyanide (2mM) at a range of scan rates recorded using a 2mm diameter macroscopic gold electrode.
When the electroactive species Eire all in solution, the peak current (ip) in a reversible system is
proportional to the square root of s c e u i rate (v) as described by the REmdles-Sevcik equation:74
ip = 0.4463nFADln Cc( nF ^/2vV2 (3.1)
where n is electron stoichiometry, F is the Faraday constant, R is the gas constant, T is absolute
temperature, A is electrode Eirea, C0 is the concentration and D0 is the diffusion coefficient of the
oxidised species. When the redox species is surface bound and the response is not influenced by
mass transport, there is a linear relationship with scan rate, given by:
n2F 2i n = A T v (3.2)p 4:RT
where T is the surface coverage of immobilised species on the electrode.
29

3. Microfabricated Biosensors
3.1.1.3 M icroelectrodes
The small size of microelectrodes has been exploited in neuroscience research since the early
1960s. However, it was only in the early 1980s that the field was given a firm theoretical
foundation by the pioneering work of researchers such as Wightman, Pons and
Fleischmann.82-84 A microelectrode has been defined as an electrode with at least one
dimensions of <20(im in size.85 The definition takes into consideration the properties of band
microelectrodes which exhibit microelectrode properties while possibly having a relatively large
total area. In this study, electrodes both ‘macro’ and ‘micro’ by definition were used in a range
of different geometries.
Microfabrication presents many options for the manufacture of novel microelectrode
structures86-87 and arrays.56-88-89 Smaller size, measurements in small volumes, batch
production, on-chip signal processing are only some of the advantages that have been
highlighted in the development of microbiosensors. With the improved current sensitivity of
electrochemical equipment, microelectrodes offer a number fundamental practical advantages
not offered by macroelectrode designs. These advantages can be summarised as follows:
1. Mass transport rate to an active surface is greatly enhanced, and steady-state
(diffusion controlled) behaviour is easier to attain. For example, such behaviour
makes a microelectrode particularly resistant to the effects of convection, so
improving current stability and permitting stable measurements in flow-through
systems.
2. Reduced influence of double-layer charging currents. Permits analysis of rapid
electrochemical kinetics using faster scan rates.
3. Reduced ‘iR ’ potential drop across the electrolyte. Measurements can be made in low
conductivity electrolytes.
4.
3.1.1.3.1 Mass Transport at Microelectrodes
Mass transport is the fundamental property that defines the nature of microelectrode response.
The topic has been examined in standard electrochemical texts.73-73 The change in the nature of
the diffusion to a microelectrode in comparison to a macroelectrode is shown in figure 3.3
30

3. Microfabricated Biosensors
\J/ \ k \k \ l/ \k M/
MACROELECTRODE
(Linear Diffusion)
\ i
B
nL nL nLMACRO/MICRO ELECTRODE
(Mixture)
MICROELECTRODE
(Hemispherical Diffusion)
Figure 3.3: A comparison of diffusion profiles at macro and micro electrodes
As a basis for a theoretical analysis, consider the analysis of semi-infinite diffusion at a
spherical electrode, where Fick’s second law becomes:
dC0{r,t) \ d 2C„(r,t) 2 dC„(r,t)3t 0 d
(3.3)
Where t represents time, r is the radial distance from the electrode centre, Co is the
concentration and Do is the diffusion coefficient of the oxidised species. Using Laplace
transformation, a modified form of the Cottrell equation for diffusion current (id(t) ) is obtained:
id(t) = nF 1 1r + 7
( x D j J i 0
(3.4)
where ro is the radius of the electrode and Co is the concentration of solution in the bulk
solution. The first component on the right hand side of equation 3.4 represents linear diffusion
present a t both macro and micro sized electrodes. However, the second spherical diffusion
component dominates the response of small radius microelectrodes particularly at longer
diffusion time scales. Under these conditions the microelectrode response is independent of
time and steady state diffusion control is easily established. Steady state currents can be
determined for a variety of microelectrode geometries using simulation,90 theoretical91 and
experimental92 methods. Of particular relevance to this study was the micro-ring geometry.
From a similar analysis of a ring capacitor,93 the steady state diffusion current (iss) can be
expressed as:
31

3. Microfabricated Biosensors
where a is the inner radius and d is the outer radius of the micro-ring structure.
3.1.2 M ethods & M aterials: E lectrochem istry
All chemicals were obtained from Sigma/Aldrich, apart from
3,3’-dithiobis(sulfosuccinimidylpropionate) (DTSSP) which was obtained from Pierce. All
solutions were prepared using RO water. Reactant concentrations and the pH of solutions will
be quoted adjacent to the relevant results. The standard buffer was phosphate (KH2PO4
(113mM)/Na2HP04 (296mM)) prepared to give a constant ionic strength (1=0.1)94 at pH 7.4. In
some instances, 300mM NaC104 was added to the buffer solution to reduce any ‘iR loss’ that
might affect the observed electrochemistry. To aid the solvation of hypoxanthine, a higher pH
buffer (pH 8.0, KH2P04(31mM)/Na2HP04(323mM)) was necessary. Neutrophil suspensions
were prepared in phosphate buffered saline (PBS; Sigma ref. no.: P-4417, pH 7.4) according to
the method described in section 4.2.4.2, used over a period of up to four hours, and stored on ice
between experiments. The neutrophils were activated using the chemotactic stimulant phorbol
12-myrsitate 13-acetate (PMA). The enzymes xanthine oxidase (XOx) (EC 1.1.3.22, Sigma ref.
no.: X4376, from buttermilk; activity 0.75unit mg'1) and superoxide dismutase (SOD)
(EC 1.15.1.1, Sigma ref. no.: S2515, from bovine erythrocytes; activity: 5000unit mg'1) were
prepared in the buffer solutions used for each specific experiment.
Electrochemical responses were recorded either using an IBM PC controlled EG&G 273A
potentiostat, or for low current measurements, a CV-100 potentiostat (Bioanalytical
Instruments Inc. (BAS)) connected to a Lineseis LY1600 x-y-t chart recorder. Analog recordings
were digitised using ‘Digitize’ software (©Danon Software, Israel). The electrochemical cell
contained either a platinum gauze (2cm2 area), or for microelectrode experiments a wire counter
electrode (1mm diameter). All experiments were performed using a Ag/AgCl (3M NaCl)
reference electrode (BAS) against which all potentials in this section are quoted.
Both macroscopic (BAS) and lithographically patterned evaporated gold electrodes (both 2mm
discs) were used in the electrochemical analysis. The fabrication of the lithographic electrodes
(10/10/100nm Ti/Pd/Au) is described in section 2.1, bonding pads and inactive areas of the
planar structure were insulated using silicon adhesive (Dow Coming, RTV 3140). The
macroscopic gold electrodes were cleaned by polishing in an alumina slurry of decreasing grain
32

3. Microfabricated Biosensors
size (3|im, 0.3pm, and 0.05gm) followed by ultrasonic cleaning in RO water. The evaporated
gold electrodes were RIE cleaned in an 0 2 /Ar plasma, see section 3.1.3.1.2 for full details.
The immobilisation of cytochrome c was performed using either
l-ethyl-3-(3-dimethylaminopropyl) carbodiimide (EDC) or DTSSP protein coupling chemistry
(see table 3.1). The experimental protocols are based upon those described by McNeil et a l 95'96
All solutions described in table 3.1 were prepared in phosphate buffer (1=0.1, pH 7).
Step No. EDC Based Immobilisation DTSSP Based Immobilisation
1 Clean electrode Clean electrode
2 Immediately immerse electrode in lOmM
N-acetyl cysteine (NAC) for 1 hour
Immediately immerse electrode in
lOOmM DTSSP for 2 min
3 Wash in RO water Wash in RO water
4 Place modified electrode in 25mM EDC for
1 hour
Place activated electrode in 5mg ml 1
cytochrome c at 4°C for 12 hours
5 Wash in RO water
6 Place activated electrode in 5mg ml'1
cytochrome c at 4'’C for 12 hours
Table 3.1: The experimental protocols for the EDC and DTSSP based protein immobilisationprocedures.
3.1.3 R esu lts and D iscu ssion : E lectroch em istry
This section will focus on the use and response of microfabricated electrochemical sensors.
Microelectrode properties will be discussed and considerations of electrode preparation will be
addressed. The protein electrochemistry that forms the heart of the superoxide sensor has been
investigated in detail. Sensor response based upon two immobilisation techniques are
discussed, and the different responses of macroscopic and microfabricated electrodes are
highlighted.
3.1.3.1 C lean ing o f M icro fa b rica ted E lectrodes
A clean working electrode surface is a crucial factor in the recording of accurate and
reproducible electrochemical results. Preparation of clean electrochemical surfaces on
microfabricated electrode structures presents further challenges when compared to the methods
used in standard electrochemical experiments. Polishing using alumina or diamond pastes is
not a practical option due to the thin planar nature of the microfabricated electrode arrays. In
addition, the option of using strong oxidants (e.g. piranha (H2SO4/H 2O2) solution) is undesirable,
since they can attack the substrate and insulator layers. The alternative cleaning methods,
33

3. Microfabricated Biosensors
described in the literature, focus on potential cycling97’98 and plasma cleaning.8999 Both
methods were investigated in this project and the results are presented below.
3.1.3.1.1 Potential Cycling in Acid Solutions
Potential cycling/cleaning, usually in sulphuric or perchloric acid, until a consistent response is
recorded is a popular method that relies on either hydrogen evolution at negative potentials100
or electrode oxidation at positive potentials.101 The use of negative potentials proved
unsatisfactory for two reasons. Firstly, the hydrogen evolution resulted in the accelerated
delamination of any insulator layer. Secondly, in the analysis of cleaning at ‘non-insulated’
areas it proved to be less effective than the use of positive oxidative potentials. Successful
cleaning using oxidative potentials required a carefully controlled procedure. Excessive cycling
will result in the rapid deterioration of the thin electrode surface (lOOnm gold) This was most
notable at the electrode edges, which experience the highest current densities. Whilst it should
be noted that the use of adherent metal structures (see section 2.2.1) will improve durability,
deterioration at the electrode edges can nonetheless have a dramatic effect on the performance
of these microelectrode structures.56
In the optimisation of cleaning methodologies, analytical work was performed at macro-sized
(2mm diameter) evaporated gold disc electrodes prepared using lithographic techniques.
Typical responses during cycling are shown in figure 3.4a, the gold surface is first oxidised
(>1.1V) and then reduced (at ca. 0.85V) with the aim of removing any surface contamination.
This method is satisfactory for removing a thin layer of surface contamination, for example an
adsorbed monolayer, however, thicker deposits of contamination hinder diffusion to the
electrode surface and impede the oxidation mechanism (i.e. the formation of gold oxide). An
alternative approach, is the addition of chloride ions into the solution to permit the formation of
gold chloride complex. In contrast to insoluble gold oxide, the chloride complex is soluble and
its solvation will result in etching of the gold electrode. Careful selection of experimental
parameters can allow the surface to be etched in a controlled manner to reveal a fresh gold
surface. Figure 3.4b, provides an illustration of the chloride etching procedure, under these
experimental conditions the etch rate is ca. 2nm/cycle.
The cleaning procedure proved successful and was tested by observing the response of standard
electrochemical couples such as ferricyanide or ferrocene - a AEP close to the theoretical value of
59mV being a good guide of efficient electrochemistry. Care is required with the above
procedure to ensure that the entire gold surface is not removed (e.g. after the 50-60 cycles, as
seen figure 3.4). Furthermore, the procedure increases the microscopic roughness1 of the
electrode, as demonstrated by the increasing current with successive cycles seen in figure 3.4.
toughness is defined as real area/geometric area. Typically, values range from 1.1 to 3.0102
34

3. Microfabricated Biosensors
A potential disadvantage suggested by Creager et al.50 concerns the poor quality of thiol
monolayers that are formed on gold surfaces cleaned by cycling in chloride solutions.
1st20thO -1 0 -
-15 -
15050th
30th100 -
10th1st
60th
-50 -
0.2 0.4 0.6 0.8 1.0 1.2- 0.2 0.0 1.4 1.6
Potential (V) vs. Ag/AgCl
Figure 3.4: Potential cycling cleaning mechanisms on evaporated gold disc electrodes (2mm diameter, lOOnm thick) at a scan rate of lOOmV s'1, (a) Illustrates the potential profile of successive cycles in 1M H2SO4. (b) The potential profile of successive cycles in 1M H2SO4 + lOmM KC1. In this case, the presence of chloride permits the formation of soluble gold chloride complex which etches the gold surface. The etching process on successive cycles increases the roughness of the gold surface, hence the increasing oxidative current. When all the gold is removed (ca. 60th scan), a insubstantial current is recorded
In summary, the careful use of cycling in chloride solutions is one of the better methods (from a
limited choice) of cleaning microfabricated electrode structures. Great care is required in the
selection of experimental parameters and it is suggested that only a few nm of the gold surface
be removed (e.g. 2 cycles using the parameters described in figure 3.4b). Furthermore, it is
important that the surface is first cleaned of particulate matter using a standard lithographic
cleaning techniques (see section 2.1.1), otherwise uneven gold etching will occur. These
cautionary comments are particularly important when the technique is applied to
microelectrode structures as the effect of hemispherical diffusion will result in even faster etch
rates.
35

3. Microfabricated Biosensors
3.1.3.1.2 Plasma Cleaning
The technique of plasma cleaning is common in the semiconductor industry as a means of
cleaning substrates.55-64 Argon or oxygen are the gases most frequently used. Argon is effective
at the removal of adsorbed water, while oxygen is excellent for the removal of organic
contamination. The ion plasmas are created using radio frequency energy at low pressures and
the ions can be directed towards the substrate using a biasing voltage between the electrodes
within the chamber. The energy of the ions is closely related to the bias voltage, and too high
an energy can result in excessive sputter removal of a metals from the microfabricated
structure. Gold was the predominant electrode surface used in this study and is a particularly
‘soft’ metal in respect of plasma sputtering. Hence, the selection of an appropriate bias voltage
is an im portant param eter in the RIE cleaning protocol.
The RIE param eters tha t determine the nature of the etching/cleaning procedure include:
machine, pressure, gas, gas flow rate, etch time and bias voltage. Only bias voltage was varied,
all other param eters remained constant and the standard values are given in table 3.2. Using
the PlasmaFab ET340 RIE machine, the minimum bias voltage was -160V, hence a slightly
higher value of -180V was selected to ensure that a plasma could be ‘struck’. The bias voltage
could be increased up to -250V and a similarly successful cleaning procedure would result. Bias
voltages above -250V resulted the in onset of significant gold sputtering, for example, at -350V,
a lOOnm layer of evaporated gold would be removed in 8 minutes.
Etch Param eter Value
Machine PlasmaFab ET340
Etch Pressure (O2) 50mT
Etch Pressure (Ar) llm T
O2 Flow Rate 50sccm
Ar Flow Rate 20sccm
Bias Voltage
(O2 and Ar)
-180V
(equivalent power ~2W)
Etch Time 3 min (per gas)
Table 3.2: RIE parameters for the plasma cleaning of evaporated gold electrodes.
Any over-etching was evident by the obvious removal of the gold, so th a t the
titanium /palladium underlayer was exposed. An effective method used to test the cleaning
procedure was the investigation of cytochrome c electrochemistry. This redox couple is
described in detail in section 3.1.3.3. The electrochemistry relies on the preparation of a clean
gold surface for the immobilisation of a thiol-mediator tha t promotes efficient electron transfer
36

3. Microfabricated Biosensors
from the adsorbed protein. A contaminated electrode surface will result in poor
electrochemistry. Figure 3.5 illustrates the effectiveness of plasma cleaning in the preparation
of an evaporated gold surface for thiol immobilisation and subsequent recording of good
cytochrome c electrochemistry (AEp=72mV). To further illustrate the effectiveness of the
deeming procedure, the same electrode was RIE etched and the electrochemical procedure
repeated. A similar voltammogram was recorded, but this time with a higher background and
slightly increased peak separation (AEp=85mV). This result demonstrates the effectiveness of
the RIE cleaning method and its potential use in repeated cleaning of the same electrode
structure.
0.6
0.4
0.2
Backgroud
R epeat Background- 0.2
Cyt c
R epeat Cyt c-0.4
-125 -75 -25 25 75 125 175 225
Potential vs. Ag/AgCl (mV)
Figure 3.5: Cyclic voltammograms of a 2mm diameter evaporated gold disc electrode in a solution of 5mg ml'1 cytochrome c + 300mM NaC104 at a scan rate of 50mV s'1. The electrode has been plasma cleaned using the RIE parameters detailed in table 3.2. Following each plasma clean the gold electrode is modified with lOmMNAC (1=0.1, pH 7.4 buffer) for 1 hour. The background scans of the NAC modified electrode in 300mM NaC104 are included for comparison. The voltammogram illustrates the effectiveness of the RIE cleaning method and its potential use in repeated cleaning procedures.
It is recommended that the structure is first cleaned of particulate matter using a standard
lithographic cleaning techniques (see section 2.1.1). Furthermore, once RIE etched, the
electrodes should be immediately used or stored in RO water to minimise the contamination
from the atmosphere.
3.1.3.2 M icroelectrode Sensors
Some of initial research concentrated on the fabrication and characterisation of micro-ring
electrodes. It was envisaged that these would provide the sensing element of the single cell
superoxide sensor described in section 1.3.1. The first fabrication step proved successful, and
37

3. Microfabricated Biosensors
examples of micro-ring structures have been shown earlier (see figure 2.3). The performance of
the structure was analysed using ferricyanide electrochemistry and the response at low scan-
rates demonstrates the classic steady-state sigmoidal response expected for a microelectrode
(see figure 3.6a). At the higher scan rates (figures 3.6b and 3.6c), the mechanism of the
microelectrode response changes and the shape of the cyclic voltammogram is influenced by the
depletion of reactants at the electrode surface. The magnitude of the recorded steady state
current was 3.6nA, significantly higher than the 0.45nA predicted using theory (see
equation 3.5; using Do=6.3xlO"6cm2s'1,81 d=25pm and a=23pm).
1
o
<cca>L_L_
cQ)5 -2 O
3o
•3 -3 -
10mV s' 100mV s 500mV s-4
0.8 -0.2 0.0 0.2 0.4 0.6 0.8 ■0.2 0.0 0.2 0.4 0.6 0.8
Potential (mV) vs. Ag/AgCl Potential (mV) vs. Ag/AgCl Potential (mV) vs. Ag/AgCl
Figure 3.6: Cyclic voltammograms for the outer ring of the gold micro-ring electrode shown in figure 2.2 at a range of scan rates. The electrochemical response of the structure has been recorded in ImM K3Fe(CN)e + 300mM NaC104 solution using a Pt wire counter electrode. The electrode structure was cleaned using a RIE plasma. Note the steady- state response at low scan rates (a), that ceases to be diffusion limited at higher scan rates (b & c).
The response of the microfabricated micro-ring electrode was initially stable. However,
repeated use led to an inconsistent response and eventual failure. The cause of the failure was
ascribed to two processes. Firstly, the dominant process was poor adhesion of the insulating
(silicon nitride) layer to the substrate. This permitted seepage of electrolyte into the
intervening space, leading to a time dependent rise in exposed electrode area. The associated
increase in current helps to account for the difference between the measured and theoretical
steady-state current values. In some cases, the increased electrochemical current resulted in a
‘burn-out’ of the structure at a location originally isolated from the aqueous solution (see
figure 2.3). Secondly, in some instances, delamination of the micro-ring structure was observed.
This was particularly evident when the structure was exposed to high oxidative potentials
(>0.5V). This failure mechanism is most likely the oxidation of the titanium underlayer used to
promote the adhesion of the evaporated gold to the substrate.51 Furthermore, it is suspected
that the small unexplained reducing current arrowed in figure 3.6a may be a component of this
titanium electrochemistry.
38

3. Microfabricated Biosensors
An exhaustive investigation of these failure processes is described in detail in section 2.2.2.2. In
summary, the difficulties with insulator adhesion were addressed by investigating adhesion
promoters, reducing the stress in the insulator layer, and the use of alternative insulators. The
delamination effect of Ti underlayer oxidation was successfully reduced by the use of a Pd
intermediary layer (i.e. Ti/Pd/Au) and minimising the use of high oxidative potentials. These
aspects presented numerous challenges, moreover, until they were overcome only a limited
amount of worthwhile electrochemical analysis could be performed at similar microfabricated
microelectrodes.
3.1.3.3 Cytochrom e c E lectrochem istry
The investigation of the solution electrochemistry of cytochrome c was the first step in the
development of the superoxide sensor described in section 1.3.1. Eddowes & Hill103 were the
first to demonstrate the quasi-reversible electrochemistry of the protein on gold electrodes using
l,2-Bis(4-pyridyl)ethylene as an electron transfer promoter. Since then there have been many
publications analysing the electrochemistry at a variety of different metal surfaces104106 and
using a range of different promoters.107 109 Figure 3.7 presents a similar experimental
comparison of cytochrome c electrochemistry recorded using the range of thiol-promoters.
0.6
0.4
0.2
(UA) 0Key
2-mercapto-propanoic acid
— N-acetyl-cysteine- 0.2
L-cysteine
3-mercapto-propanoic acid-0.4
Background- 0.6
150 200 250-150 -100 -50 0 50 100
Potential vs. Ag/AgCl (mV)
Figure 3.7: Cyclic voltammograms of 2mm diameter evaporated gold disc electrodes in a solution of 5mg ml'1 cytochrome c + 300mM NaC104 at a scan rate of 50mV s '1. The electrodes have been RIE plasma cleaned and modified using a range of promoters at concentrations of lOmM (1=0.1, pH 7.4 buffer) for 1 hour. The background scan in 300mM NaClCh (50mV s'1) for the NAC modified electrode has been included for comparison. The voltammogram compares the relative ability of each modifier to successfully promote the redox electrochemistry of cytochrome c.
39

3. Microfabricated Biosensors
A good indication of efficient electron transfer is the reversibility of the redox process, as
indicated by a value of AEp close to the ideal of 59mV. All the modifiers in figure 3.7, except
3-mercapto-propanoic acid, exhibited good electron transfer properties with AEp in the range
65-80mV. NAC was selected as the thiol for subsequent work since it is believed that its acetyl
group can aid the steric co-ordination of the electroactive haem centre of the protein.110
Figure 3.8 illustrates the electrochemistry of cytochrome c at a range of scan rates. The linear
variation of ip vs. \ in confirms that the redox process is controlled by the diffusion of
electroactive species in solution. Analysis of the variation of scan rate and AEp using the
method of Nicholson80 provided a ks of 4.9xl03cm s'1 (Do=9.4xl0'7cm2 s'1103 and assuming an
a=0.5). This value is close to the 2.3xl03cm s'1 reported in a similar study using NAC.110
3 0.9 -
0.5 -
<=1 o.o
Scan Rate1/2 (mV1c o . o -
o
-0.5 -
-100-200 0 100 200
Potential (mV) vs. Ag/AgCI
Figure 3.8: The variation of AEp with scan rate (5, 10, 20, 50, 100 and 200mV s '1) for a 2mm diameter evaporated gold disc electrodes in a solution of 5mg ml"1 cytochrome c + 300mM NaC104. The electrode had been RIE plasma cleaned and modified using lOmM NAC (1=0.1, pH 7.4 buffer) for 1 hour. The linear variation of iP vs. v1/2 shown in the inset graph demonstrates that the redox process is controlled by the diffusion of the electroactive species in solution.
3.1.3.4 Superoxide Sensing
The first step in the preparation of a superoxide sensor based on cytochrome c electrochemistry
is the immobilisation of protein on the electrode surface. The results of this procedure are
described below, along with measurements of superoxide production generated using two
40

3. Microfabricated Biosensors
different mechanisms. The first mechanism is based on the enzymatic breakdown of
hypoxanthine by XOx, the second is the chemotactic stimulation of human neutrophils by PMA.
3.1.3.4.1 Immobilisation of Cytochrome c
Previous work on the immobilisation of redox proteins such as cytochrome c, has been based on
the formation of a peptide linkage to the protein shell. For example, Bowden et a l.lu used long
chain carboxyl group terminated thiols (SH-((CH)2))n-COOH, n=6,ll,16) immobilised on gold,
followed by covalent linkage to the protein amino groups using EDC chemistry. A similar
approach was used by Cooper et al.,95 but using NAC to form the thiol monolayer. An
alternative approach was demonstrated by Lotzbeyer et al.,112 where and amino terminated
thiol (cystamine) was coupled using EDC chemistry to carboxylate residues on the protein shell.
In each of the above examples, successful protein immobilisation was demonstrated by
monitoring the protein redox electrochemistry (direct electron transfer) in fresh buffer solution.
A similar approach of using thiol monolayers was adopted in this study, but the observed
protein electrochemistry at microfabricated surfaces was both inconsistent and short-lived.
However, as the results presented in section 3.1.3.4.2 will demonstrate, some protein has been
immobilised on the electrode surface, but most likely not in a sufficient quantity to generate a
significant redox response in comparison to the background current. In the attempt to improve
the observable direct electrochemistry, a wide variety of experimental parameters were
adjusted according to recommendations made in the literature. These included adjustments in
supporting buffer composition,112 gold surface (sputtered or evaporated gold8), electrode
cleaning methods,50 and protein purification.95 None of the parameter changes was dramatically
successful, a quantitative comparison being difficult due to the lack redox electrochemistry or
inconsistency of response.
An alternative approach to a three-step2 coupling procedure is to use a two-step procedure
where the immobilised thiol contains an active group capable of directly forming a peptide bond
to the protein. DTSSP can be used for this purpose, forming a peptide bond with the protein
and resulting in a succinimidyl leaving group (see figure 3.9). Again, clear direct
electrochemistry was not evident. However, a comparison of the two immobilisation methods in
terms of an amperometric assay (of the form shown in figure 3.12) for superoxide suggests that
the DTSSP method is superior - coupling an estimated four times more protein to the
electrode.96 Subsequent work focused solely on the use of the DTSSP immobilisation
mechanism.
2 i.e. 1) thiol immobilisation, 2) EDC linkage, and 3) protein coupling
41

3. Microfabricated Biosensors
n (DTSSP) ° w x 4II j? Y V SOaNa NaOaS /
NaOaS NaOaS NaOaS 0H
0 =
,SOaNa _'N^ 0 J * ^ 0 (Pratein) _»N^ 0 ,R\ n = ^ 7 °v °v R. °v H" NK-/' f r\ i / ► S S *" s *" s s |s ___________ J_______ L_______ I__ _ J ____
Au electrode Au electrode Au electrode Au electrode
Figure 3.9: The chemistry associated with the DTSSP/protein immobilisation procedure.
The formation of the DTSSP/protein bond is a pH dependent reaction. Extreme pH values are
undesirable since the protein will become de-natured and values in the literature remain within
the range pH 6 to 8. A pH in the range 6.5 to 7.5 was used, since it aided the forming of the
peptide linkage by protonating the amine residues on the protein, while not leading to excessive
hydrolysis of the DTSSP. Figure 3.10 presents the electrochemistry of immobilised DTSSP.
Initially, it was believed that cytochrome c was responsible for the redox wave, however, the E1/2
of +170mV was significantly higher than previously reported (Ei/2=20mV).95 Control
experiments using DTSSP alone generated the same results and the linear variation of peak
current vs. scan rate indicated that the redox species was surface bound (see figure 3.10). It can
thus be concluded that the DTSSP or a decomposition derivative is responsible for the
electrochemistry.
This response is surprising for a thiol bonded to a gold surface, since previous reports have
concentrated on adsorption/desorption electrochemistry at high (>0.8V) positive potentials113
and their use as modifiers in forming insulating surfaces.114 Some suggested mechanisms for
the observed behaviour include the charge transfer between the gold and sulphur atoms, or the
reversible formation of thiol/di-thiol bonds at the gold surface. A comprehensive understanding
of the behaviour will require further work, and it is notable that similar thiol behaviour has
been observed by another research group.115 The electrochemistry of DTSSP is curious, but it
does not affect the specificity of the superoxide sensor (see section 3.1.3.4.2). Nonetheless, a
better understanding of the mechanism can only contribute to the future sensor developments.
42

3. Microfabricated Biosensors
4
0.8 -
3
0.2 -
2 0.0SO 100 150S c a n R a te (mV s-1)
200
1
0
1
2
200.0 0 .0 200.0 400.0-400.0Potential (mV) vs. Ag/AgCI
Figure 3.10: The electrochemical response of immobilised DTSSP (2mm diameter evaporated gold disc electrode) in a solution of 1=0.1 (pH 7.4) buffer + 300mM NaClCh at a range of scan rates (10, 20, 50, 100 and 200mV s'1). The monolayer was formed by immobilisation from a solution of lOOmM DTSSP in 1=0.1 (pH 7.4) buffer for 10 minutes. The electrode was cleaned by cycling in 1M HCIO4 until a consistent response was recorded. The linear variation of iP vs. v shown in the inset graph demonstrates that the observed redox process is determined by a surface bound species.
3.1.3.4.2 Superoxide Measurement: Hypoxanthine/Xanthine Oxidase
The use of hypoxanthine/XOx is a standard enzymatic method of generating superoxide and
other reactive oxygen species (see figure 3.11). It provided a rapid method of assessing the
performance of the DTSSP/cytochrome c superoxide sensor (no cell purification required) and
provided a convenient method for recording the reference response of each electrode.
43

Curr
ent
(nA
)
3. Microfabricated Biosensors
XOx
C—H
H ypoxanthine
X anthine
C— H
XOx O 2 ’ , H 2^2
H
O II
n n'<:C^'c^ 'nn\I II c=oCo, /
o ' 'N 'N.V
H
Uric Acid
Figure 3.11: The mechanism of superoxide generation using hypoxanthine/XOx chemistry.
7Key
= XOx (50pg ml'1) = Buffer (P 0 4I pH 8)
6
= XOx (250pg ml'1) I = H20 2 (3%)
5= SoD (500pg ml'1)
4
3
2
1
0
250 500 750Time (s)
1000 1250 1500
Figure 3.12: Amperometric assay for superoxide using a RIE cleaned 2mm diameter evaporated gold disc electrode activated using the DTSSP/cytochrome c chemistry described in section 3.1.2. The working electrode was poised at +100mV vs. Ag/AgCl, a potential capable of oxidising the immobilised cytochrome c that has been reduced by its reaction with superoxide. The stock solution is 1.5mM hypoxanthine prepared in 1=0.1 (pH 8.0) phosphate buffer. The timing and concentration (final value) of the additions (50pl) are indicated using labelled arrows that correspond to the key in the figure.
44

3. Microfabricated Biosensors
Figure 3.12 illustrates an amperometric assay for superoxide, the additions of enzyme produced
a concentration dependent response while the substrate remained in excess (1.5mM).
Specificity is demonstrated by the lack of significant response to additions of buffer or hydrogen
peroxide. In contrast, the addition of the enzyme SOD, a highly specific scavenger of
superoxide ions, rapidly reduces the current to the baseline level.
An alternative method of analysing the amperometric response is to monitor the rate of
superoxide release.95 Figure 3.13 provides a comparison between superoxide measurement
using both macroscopic and evaporated gold electrodes. The response is significantly reduced
(ca. 5 times less) at the evaporated gold electrode even though both electrodes have the same
area and were prepared simultaneously using the same solutions. The only difference in the
preparation of the electrode surfaces was in the cleaning procedure (polishing or RIE cleaning).
However, this would appear to make little difference, since the two types of gold surfaces have
already been compared using the homogeneous electrochemistry of cytochrome c (see
section 3.1.3.3), and little or no difference was apparent. In contrast, during the comparison of
superoxide response, the evaporated gold electrode response was consistently lower. This
observation suggests that the nature of the gold surface has a significant effect on the quantity
of immobilised protein, or more precisely, the quantity of protein in electronic communication
with the electrode.
1.00Mixing / Stimulation
Period Current0.75 - Time
Bulk Gold<c Rate = Current/Time (nA s )
0.50 -4—»cCD
0.25 -=jO Evaporated Gold
0.00 -
1000 200 300 400 500Time (s)
Figure 3.13: A current vs. time plot comparing the response of macroscopic and an 2mm diameter evaporated gold disc electrodes activated using the procedure described in section 3.1.2. The working electrode was poised at +100mV vs. Ag/AgCl in lOOmM hypoxanthine prepared in 1=0.1 (pH 8.0) phosphate buffer. Superoxide generation was initiated by the addition of XOx to a final concentration of 125mg ml"1. The short delay associated with mixing and the neutrophil activation process has been indicated.
It is difficult to find a concise explanation for the difference in response, although it is likely
that surface roughness or gold domain orientation have a role in determining the characteristic
45

3. Microfabricated Biosensors
response of each surface. In similar work, Bowden et al.m strongly recommend the use of
sputtered (in preference to evaporated) gold; while careful substrate annealing50 is a
recommended procedure in the preparation of high quality thiol monolayers. It is apparent that
a better understanding of all aspects involved in sensor fabrication, ranging from preparation of
the gold surface to protein immobilisation, is required to support the further development of
this class of superoxide sensor.
3.1.3.4.3 Superoxide Measurement: Stimulated Human Neutrophils
Figure 3.14 presents the response of both macroscopic and evaporated gold to superoxide
generated by activated human neutrophils. After allowing for the initial mixing process, the
dependence on cell concentration is evident. A similar and more comprehensive study96 has
demonstrated a linear relationship between cell concentration and rate of superoxide
production down to cell concentrations as low as 500cell ml"1. Again, as discussed in
section 3.1.3.4.2, the response of the evaporated gold electrode is significantly lower than that
seen for the macroscopic gold electrode.
1.505x10 cell mlPMA
1.25 -2x10⁶ cell ml
5 * 1 .0 0 -
cc0
0.75 -5x10 cell ml
O 0.50 -
0.25 - 2x10® cell ml"1 (evap. gold)
0.00 -*
0 50 100 150 200 250 300 350 400Time (s)
Figure 3.14: A current vs. time plot comparing the superoxide response at range of neutrophil concentrations for both macroscopic and an evaporated gold 2mm diameter disc electrodes activated using the procedure described in section 3.1.2. The working electrode was poised at +100mV vs. Ag/AgCl in PBS (pH 7.4). Superoxide generation was initiated by the addition of PMA to a final concentration of 0.5(lM. N.B. the time axes of all the plots in the above figure have been adjusted so that the PMA additions coincide for all four traces.
The result in figure 3.14 demonstrates the use of the sensor for detecting the release of
superoxide from human neutrophils. The durability of the sensor was poor (ca. 6 hours), the
major determinant being the time spent in cellular solution, a factor almost certainly related to
the blocking of the working electrode by the adsorption of cells and cellular proteins. In
comparison, an equivalent sensor used solely in hypoxanthine/XOx solutions had a lifetime of
46

3. Microfabricated Biosensors
over 24 hours. Sensor storage at 4°C between measurements is recommended to preserve the
integrity of the immobilised protein.
3.2 Chemiluminescence
The simplicity and speed of the chemiluminescent assay provided a valuable technique for the
rapid analysis of superoxide release from human neutrophils. The technique was not only used
as a control, demonstrating that stimulated neutrophils produced superoxide, but also provided
a valuable tool for comparing experimental parameters such as: cell concentration, chemotactic
stimulant and buffer type.
3.2.1 Theory: C hem ilum inescence
Luminescence is the emission of light from atoms or molecules as a result of a transition from
an electronically excited state to a lower energy state.12 In chemiluminescence, the excited
states are created by a chemical reaction. A familiar example is the luciferase enzyme based
chemiluminescence exhibited by the firefly.116 A number of synthetic compounds including
luminol, luminol derivatives, and lucigenin exist which chemiluminesce in an oxidising
environment.
A chemiluminescent assay is a common method for detecting the release of superoxide and
other reactive oxygen species3 (ROS). While not specific for superoxide, chemiluminescent
assays have been shown to correlate well with more specific photometric assays for superoxide
release based upon the reduction of cytochrome c in solution117 A luminol based
chemiluminescent assay is described by the following reaction:
Luminol + ROS > Aminophthalate+ N 2 + h v (3.6)
The reaction has a low quantum yield in comparison to the ‘firefly’ reaction but the yield can be
improved in alkaline conditions.
3.2.2 M ethods & M aterials: C hem ilum inescence
Superoxide release was assessed by luminol enhanced chemiluminescence using a LKB 1251
Luminescence Photometer (Luminometry; LKB). The luminometer was controlled by a BBC
Archimedes computer. Superoxide was generated by the metabolic activation of neutrophils or
as a component ROS generated from the xanthine or hypoxanthine/XDx reaction. Neutrophils
were prepared in PBS according to the procedure described in section 4.2.4.2, used over a period
3 Other ROS include hydrogen peroxide, peroxide radicals and singlet oxygen.16
47

3. Microfabricated Biosensors
of up to four hours, and stored on ice between experiments. Neutrophils and luminol were used
at a range of concentrations and the values are quoted adjacent to the corresponding results.
The chemotactic factors PMA and N-formylmethionyl-leucyl-phenylalanine (FMLP) were used
to initiate neutrophil activation. These stimulants were used at a range of concentrations.
They were initially dissolved in dimethyl sulfoxide (DMSO) at a concentration of ImM, and
then diluted to the appropriate concentration using PBS. The xanthine or hypoxanthine (both
1.5mM) based mechanism was initiated by the addition of XOx at a concentration of 500pg ml'1.
For both superoxide generating mechanisms, the control experiments represent the recorded
response of the un-activated system. SOD was used at a concentration of 500(ig ml'1. All
samples were held in UV transparent plastic cuvettes. Sample volume were fixed at 1ml, the
final volume was maintained by the addition of PBS. Chemicals were obtained from
Sigma/Aldrich and all solutions were dissolved in a PBS stock solution prepared using RO
water.
3.2.3 R esu lts and D iscussion: C hem ilum inescence
The initial experiments were performed with the aim of optimising experimental conditions and
characterising the system under study. Both luminol and cell concentration showed a dose
dependent response (figure 3.15), as can be assessed from the relative peak response values.
While it was possible to obtain a saturated luminol response at close to 20|iM, no effort was
made to observe a similar saturation with cell concentration. Based upon these initial
experiments, a luminol concentration of 10|iM and a cell concentration of 5xl05cell ml'1 was
chosen for subsequent experiments. These values primarily reflect the sensitivity constraints of
the luminometer; i.e. a significant, but not saturated, response is desirable.
The final component of an electrorotation experiment was the mechanism for stimulating the
neutrophils into superoxide production. The pioneering work of Babior118 developed the use of
IgG coated latex beads and subsequent research has identified a range of alternative
mechanisms and chemicals.119121 In this study, only the chemotactic stimulants PMA and
FMLP (a bacterial peptide residue) were investigated. Figure 3.16 provides a comparison of
superoxide response of these two stimultants.
From figure 3.16, the durability of the PMA induced response in comparison to that of FMLP is
apparent. The ‘kink’ visible in the FMLP but not the PMA response in frequently observed and
has been ascribed to the different mechanism of neutrophil activation. Whilst the FMLP
response can be broken down into a physiologically based multi-stage process initiated by its
contact with the cell membrane, PMA needs to be transported into the cytoplasm where it
directly activates the protein-kinase-C receptor.44 In recent literature, both stimulants are used
48

3. Microfabricated Biosensors
although FMLP is gaining preference, probably due to the improved speed of response and
better characterised stimulating mechanism. Although generating a slower response, the
durability of the PMA response was a definite asset in subsequent electrorotation experiments
(see section 4.3.3.2) and it was adopted as the preferred stimulating mechanism.
(a) 16|xM Luminol8x10 cell ml'
30 -
« 2 0 -
o 4 0 -
4x10 cell ml
10 -
1|xM Luminol2x10 cell ml' sz
C ontrol C ontrol~T~
2515 20 0 5 10 15 20 25100 5Time (min) Time (min)
Figure 3.15: The results of control experiments to determine suitable cell (a) and luminol (b) concentrations for subsequent experiments. The luminol concentrations used were 1, 2, 4, 8, 16pM. Neutrophil stimulation for both experiments was with l|iM PMA, see section 3.2.2 for the full experimental protocol.
Analysis of PMA response over a range of concentrations (figure 3.17) indicated a more complex
behaviour than seen in the earlier luminol and cell concentration experiments (see figure 3.15).
At very low concentrations PMA demonstrated a dose dependent response but obvious
mechanistic effects were apparent at higher concentrations. A comparison of peak response
magnitude for lpM and lOfiM would suggest that the response remains dose dependent.
However, a more rigorous comparison of total areas indicated the responses to be of a similar
magnitude. These two concentrations are saturated responses, the nature of the response is
almost certainly determined by the rate at which the PMA is transported across the cell
membrane into the cytoplasm.44 Furthermore, a very high concentration (lOOpM) of PMA
produced a reduced response, probably related to the known physiological toxicity of the
chemical.119
49

3. Microfabricated Biosensors
60
50n+>•!5k.
P M A
S 40ao
§ 30wa>_cFM LP| 20
I<D§ 10Control
0 5 10 15 20 25 30Time (min)
Figure 3.16: A comparison of the chemiluminescence intensity vs. time recorded from neutrophils stimulated by PMA(lpM) and FMLP (0.1|iM). The cell and luminol concentrations were 5xlOscell ml'1 and 10(xM, respectively.
The specificity of the chemiluminescent assay for superoxide is demonstrated in figure 3.18. If
the enzyme SOD is included with the stimulated neutrophils, the response is reduced to a
negligible level in comparison to the control (figure 3.18a). From this result it can be concluded
that the dominant ROS contributing to the luminol based chemiluminescence is superoxide.
This result agrees well with the broad base of research on the mechanisms of neutrophil
activation.
PM A Conc ent ra t i on
Co n t r o l
Figure 3.17: A comparison of the superoxide response of stimulated neutrophils at a range of PMA concentrations. The cell and luminol concentrations were 5xl05cell ml'1 and 10pM, respectively.
50

3. Microfabricated Biosensors
Also shown in figure 3.18a is the response for neutrophils prepared in an isotonic sucrose
solution (260mM). For comparison, figure 3.18a includes the response of the same cell sample
at a similar concentration but in this case prepared in PBS. No significant difference in
superoxide generating activity is observed, again, this is a result of relevance to the
electrorotation experiments described in section 4.3.3.
80 -
co 60 -
© 40 -.E 20 -
© 20 -10 -
40 -
® 3 0 -
^ Control ^ C ells(sucrose) + PMA + SoD
Cells(sucrose) + PMA
Cells(PBS) + PMA
1.5mM Xanthine + XOx
1.5mM Hypoxanthine + XOx
■1.5mM Hypoxanthine + XOx + SoD
0 5 10 15 20 0 2 4 6 8 10Time (min) Time (min)
Figure 3.18: (a) The chemiluminescence response for PMA (1|J.M) stimulated neutrophils in both PBS and isotonic sucrose (260mM) - the use of different buffer solutions produced no significant change in response. The cell and luminol concentrations were 5xlOscell m l'1 and 10pM respectively, (b) A similar experiment but this time comparing the response of xanthine and hypoxanthine (both 1.5mM) following the addition of 500|ig ml'1 XOx - hypoxanthine has a more durable response. The luminol concentration was 5pM.
The experimental results presented in figure 3.18b provided corroborative evidence for the
differing mechanisms of superoxide generation that can occur using the xanthine or
hypoxanthine/XOx systems. The chemistry of this system has been described earlier (see
figure 3.11) and from the chemiluminescence data it is suggested that the hypoxanthine
reaction is both more durable (i.e. of a slower rate) and generates significantly more superoxide
at equivalent molar concentrations. This conclusion cannot be confirmed by chemiluminescence
since the rapid initial rate of the xanthine/XOx reaction cannot be accurately recorded and one
cannot exclude the possibility of a rapid saturated luminol response at the onset of the
xanthine/XOx reaction. However, this result does recommend the preferential use of the
hypoxanthine/XOx system in similar superoxide assay experiments.
3.3 Summary
The major topic of this chapter has been the preparation and characterisation of an
electrochemical superoxide sensor. In addition, unique aspects applicable to the cleaning and
51

3. Microfabricated Biosensors
activating of lithographic electrode structures have been addressed and proven methods
described. The procedures associated with the fabrication and testing of microelectrode
structures have also been discussed. The scope for further work in this field is rapidly
expanding and it is hoped that this work has presented some indication of the many challenges
ahead.
To conclude, it is worthwhile to asses the progress toward the project goal of sensing superoxide
release form a single cell using cytochrome c electrochemistry. Consider the maximal response
(ca. 5fiA, 2mm evaporated gold disc) recorded using the hypoxanthine/XOx superoxide
generating mechanism (see figure 3.12). This current magnitude can be compared to the
expected current at a micro-ring electrode to be used for detecting the release of superoxide
from a single cell (see figure 1.2). For example, assuming a ring width of 10pm and diameter
50pm and similar protein immobilisation conditions, the estimated maximum current using a
relative area comparison is ca. 3pA. Even accounting for the ‘current amplification’122 effect
associated with hemispherical diffusion to microelectrode structures, and the reduction of
superoxide dismutation by making measurements close to the source - the maximal current will
still be in the low pA range. This estimation is made in relation to a saturated response, the
actual currents are likely to be orders of magnitude lower.123 Hence, to make successful
measurements of chemicals released from single cells it is recommended that three specific
aspects of the sensor design are improved, these are:
1) P ro te in Im m o b ilisa tio n : Based on the methodology described in section 3.1.2, the
protein immobilisation procedure could be enhanced by improved thiol immobilisation
and gain a better understanding of the protein coupling chemistry.
2) Low vo lum e struc tures: An example would be the fabrication of the ring
microelectrodes on the bottom of ‘pits’ in the substrate. The limited volume would
improve the sensor sensitivity by confining the diffusion of superoxide.124
3) Low C urren t m easurem ent: - If currents in the pA range need to be measured, a
sensitive multi-potentiostat will be required. The new generation of low input bias
current operational amplifiers are exciting developments in this area.
52

4. Dielectrophoresis
4. Dielectrophoresis
In this project, the aim was to explore the use of dielectrophoresis as a means of non-invasive
particle positioning and confinement. The dielectrophoretic response of both polystyrene beads
and viable cells were studied, the beads providing ‘cell-shaped’ models for the initial studies.
4.1 Theory:
Particle confinement and electrorotation are related aspects of the dielectrophoretic
phenomenon. Each is described theoretically in the following sections.
4.1.1 P a r tic le C on finem en t
The dielectrophoretic phenomenon is associated with the field-induced dipole moment of a
particle in its surrounding medium. Using the following vectored param eters, it can be shown
th a t for a homogeneous spherical particle in an electric field of strength E, the effective dipole
moment m{(o ) and dielectrophoretic force F(co ) are related as follows:125-126
m(co) = 4 7cej[ep ,em )R:iE (4.1)
V ' 2 E
where R is the radius of the particle, V is the del vector operator, and f(e*p ,e*m j is the Clausius-
Mossotti factor,127 represented by:
/ f o . 4 ) = - ^ r r (4-3)£ — 2 e
The param eters e*p and em represent the complex permittivities of the particle and the
medium respectively, and take the form:
£plm =£plm -JO plm/v (4-4)
where a is conductivity and j is V - T .
53

4. Dielectrophoresis
Further analysis of equations 4.1, 4.2 and 4.3 yields the Real (Re) and Imaginary (Im)
components as follows:
X£p - em)A - ~T 'a Y o V , ) (4-5)* (l + 6)2T2)(cTp + 2am) (l + w2T2)(ep +2£m)
3 an(Epom-£mop)( l + co2x2 \ a p + 2crm f e p + 2em)
T -*M_\vm\e e ji . y . (4.6)rv (l + o; r Mcr„+2cr„ )(£„+2f„ )
with t representing the characteristic time constant for a Maxwell-Wagner type dielectric
dispersion128 at the interface of the particle and its surrounding medium.
This theory provides the basis for an analysis of the dielectrophoretic phenomenon. A more
detailed model for biological applications would consider the reality that a cell is not a
homogenous medium, being typically composed of a cell membrane, cytoplasm, nucleus and
vacuoles. However, this simple model does allow one to make some useful initial observations
on the phenomenon. From equation 4.2 it can be seen that F(co ) is primarily dependent on
the real component of the Clausius-Mossotti factor {f(e*p ,E*m)) , and is independent of electrode
polarity due to the dependence on E^RMS ̂ and hence will be apparent in both d.c. and a.c. fields.
It can be seen from equation 4.5 that the dielectrophoretic force is sensitive to frequency
( f = a) 12n ). At low frequencies (where to > 0), the most significant parameters are the relative
conductivities of the particle and its surrounding medium. However, at high frequencies (where
cd approaches «=), the influence of the relative permittivities becomes dominant. Hence the
polarisability of a particle in the particular medium determines the nature, be it positive or
negative, of the dielectrophoretic force acting upon it.
In the use of dielectrophoresis for the manipulation of cells, the variation of frequency provides
the most flexible means of control. As a broad guide, at frequencies below 1kHz the response is
dominated by membrane surface charge effects. In the range up to 100kHz the effective
conductivity of the cell membrane has a controlling influence. Whilst at higher frequencies the
dielectric properties of the cell interior Eire most apparent.129
4.1.2 E lectrorotation
Electrorotation occurs as a result of the induced torque exerted on particles in rotating electric
fields. The vectored frequency dependent torque (r(co)) is related to effective dipole moment
(see equation 4.1) as follows:125-126
54

4. Dielectrophoresis
T(ftj) = -lm(m(a>))E (4.7)
The nature of the observed electrorotation is determined by the Imaginary component of the
Clausius-Mossotti factor (see equation 4.6). It is dependent on the relative conductivities and
perm ittivities of the suspension medium and particle, the applied field, and frequency. When
the Im (fie*, ,e*m)) >0, the induced dipole lags behind the applied field by less than half a period
and an anti-field rotational torque is exerted on the particle. Conversely, when Im (f(e*p ,£m)) <0
the induced dipole moment lags by greater than half a period and co-field torque is exerted (see
figure 4.1).
Figure 4.1: The induced dipole moment of a particle is out of phase with the direction of the electric field. The angle between the two (0) reflects the time taken for the dipole to form. The phase difference will generate a variable torque ( r ) acting on the particle causing it to rotate. Co-field rotation will occur if the angle is less than 180", antifield rotation will occur if the angle is greater than 180°.
The nature of observed rotation rate (R(w )) is the resultant force balance between the torque
and the viscous forces acting on the particle in a particular medium, defined as:129
R(co) = - ^ - I m ( f ( e ' p ,e 'J) (4.8)2 T j
55

4. Dielectrophoresis
where r) is the dynamic medium viscosity. Since the field is applied by a phase shifted voltage,
R(t» ) can be also be expressed as:
Rta)) = - gm̂ V 2 1m(f(ep,e'm)) (4.9)
where k is a constant relating the applied RMS voltage, electrode geometry and particle
position.
In practice, the electrorotation of viable cells follows a characteristic pattern. At low
frequencies (clMHz), the majority of the electric field voltage is distributed across the cell
membrane and the cell behaves as a poorly conducting sphere, and anti-field rotation is
observed. At higher frequencies (>lMHz), the applied field permeates the membrane and the
rotational response is dominated by the dielectric properties of the conductive cellular interior,
and co-field rotation is observed. Changes in cell physiology and the influence of cell organelles
will be reflected in the speed and sense of the electrorotation.130 Data on the frequency
dependent changes in response (i.e. an electrorotational spectrum) can be interpreted to provide
values for specific cellular parameters, for example, in determining the membrane capacitance
and the cytoplasm conductivity of lymphocytes.131 The models used in this study for the
interpretation of electrorotational spectra are discussed in Appendix A.
4.2 Methods & Materials
This section describes the procedures used in the particle confinement and electrorotational
experiments. In addition, the methods of media preparation, particle purification and electrode
fabrication are described.
4.2.1 Suspension M edia
All aqueous media used in this study were prepared using RO water, the conductivity being
adjusted using additions of PBS. Solution conductivity was measured at 20°C on a Hewlett
Packard (HP) 4192A Impedance Analyser using a platinum black electrode. Conductivity
measurements were made at 100kHz, a frequency high enough to avoid any effects of electrode
polarisation.132 A stock solution of a sucrose (260mM) was used for all cell suspensions. This
medium has the equivalent osmotic pressure (osmolarity) to physiological saline (300mosmol kg'
'). Use of sucrose, or similar sugars, provides a means of maintaining cell viability over a range
of solution conductivities.
56

4. Dielectrophoresis
A im portant consideration for the electrorotational work was to ensure th a t the media selected
did not contribute to the activation mechanism of neutrophils. Alternative media such as
glucose133 and m annitol18 solutions were avoided for this reason. Furtherm ore, a salt solution
free of divalent ions was chosen in preference to a simple culture media, as it has been shown
th a t Ca2+ and Mg2+ ions can contribute to the undesirable aggregation of neutrophils during the
purification procedure.134
4.2.2 E lectro d es and In stru m en ta tion
Electrodes were designed using the Wavemaker (Barnard Microsystems Ltd., UK) circuit design
package and fabricated using photolithography and lift-off (see section 2.1). Circular and
polynomial electrode arrays (figure 4.2) of varying tip-to-tip distance were used in this study.
The simple circular array was satisfactory for generating the non-uniform field necessary for
particle confinement. The polynomial electrode design of Huang et al.135 is best suited to the
work on particle electrorotation.136 Glass was selected as a good flat substrate m aterial that
also provided the transparency necessary for inverted light microscopy.
(a)
f f
Figure 4.2: The circular (a) and polynomial (b) electrode geometries of varying tip-to-tip separation (x) used in this study. Both geometries were suitable for particle trapping experiments (x=15-100|im). A wider polynomial array was best for the electrorotation studies (x=360pm).
The electrodes were made by e-beam evaporation of a Ti/Pd/Au (10/10/10nm) m ultilayer metal
structure, which provided both an adherent and inert electrode structure (see section 2.2.1).
Noble metal electrode are preferred as they exhibit a higher oxidation potential in aqueous
solutions. Care is required when working at low frequencies because the time averaged d.c.
component of the voltage signal can lead to electrolysis at the electrodes. The likelihood of
electrolysis, and subsequent damage of the electrode structure, is enhanced by higher
conductivity media and high field strengths (i.e. high potential and/or small electrode
separation).
57
4. Dielectrophoresis
Observations of the dielectrophoresis phenomenon were made on a Nikon Microspot light
microscope using both reflected and transmitted light. Phase contrast imaging helped to
highlight particle profiles. The sinusoidal electric fields (lHz-20MHz, 0-12V) were generated
using a direct digital synthesis generator designed in the department (design no.: GUED 1101)
and controlled by a software written in Borland Turbo Pascal running on an IBM PC.
4.2.3 Bead P reparation
Polystyrene beads of average diameter 6pm were obtained form Polyscience Inc., USA. The
beads were thoroughly washed before use to remove any contaminants in the original bead
suspension (3 centrifugal washes in RO water). The washed beads were then re-suspended in
sucrose (260mM). A 100 times dilution of the original suspension provided a suitable
concentration (2xl05beads ml'1) for particle confinement, a lower concentration (5xl04beads m l 1)
was used in the electrorotational experiments.
4.2.4 Cell Preparation
Numerous cell types were used in this study, including: Baby Hamster Kidney (BHK) cells and
a range of blood cells (neutrophils, lymphocytes and erythrocytes) separated from both human
and rabbit blood. All cells were suspended in isotonic sucrose solutions of adjusted conductivity.
4.2.4.1 BH K P rep a ra tio n
The BHK cell line is immortal and can be maintained by ‘passaging’ at 3-4 day intervals. In
suspension, these cells have are spherical shape with a radius of 4-5pm. In preparation for
dielectrophoretic experiments, the cells were detached from the base of the culture flask using
trypsin-versin (a digester of the adherent proteins) and thoroughly washed in sucrose.
4.2.4.2 B lood P u rifica tio n
This section describes the procedure for the separation of neutrophils and lymphocytes from a
sample of whole blood. The procedure is based on that of Chettibi et al.131 Human blood was
obtained from the Glasgow Royal Infirmary Hospital, and rabbit blood was obtained form
Sapu(Carluke, UK). In some cases, ‘buffy coat’ was obtained from the Blood Transfusion
Service (Glasgow) and diluted in a 1:1 ratio with PBS before separation. Buffy coat is the
residual component following the centrufugation of whole blood to remove the plasma and
erythrocytes fractions required for hospital use. All samples were screened for HIV and
hepatitis B and all separation procedures were conducted in a Class 2 biological grade fume
hood.
An erythrocyte sample was prepared by the simple dilution of whole blood. This sample was of
satisfactory purity, since 99% of blood cells are erythrocytes. However, separation of
58

4. Dielectrophoresis
neutrophils and lymphocytes first required the removal of the erythrocytes using dextran
sedimentation. The first step of the procedure is to mix a dextran solution (5% in PBS) with the
blood at a 1:10 ratio. The dextran dramatically increases the sedimentation rate of erythrocytes
by selectively bonding to the cell walls. This step takes approximately 30 minutes and leaves a
supernatant rich in neutrophils and lymphocytes.
The next step is the centrifugal separation of the remaining components using a Ficoll
(Histopaque 1077, Sigma) density gradient. The details of the procedure are illustrated in
figure 4.3. The residual plasma and supernatant fractions can be discarded. The lymphocyte
fraction is of high purity, and following the appropriate washing and conductivity adjustments,
is ready for use in dielectrophoretic experiments. However, the neutrophils fraction is
frequently contaminated with residual erythrocytes. These can be removed by rapid (20s)
hypotonic lysis in RO water, which generates enough osmotic pressure to rupture the cell
membrane of the erythrocytes. The stronger membrane of neutrophils rem ains intact during
this procedure, although it has been suggested th a t this procedure does partially activate or
‘prim e’ the neutrophils120 and may initiate a degree of neutrophil aggregation.138 The cell lysis
step is halted by excess (>10 times) dilution with PBS and the residual neutrophils can be
removed by centrifugal washing.
7 5 0 rpm
15 min
Blood
Histopaque
Plasm a
Lymphocytes
Erythrocytes & Neutrophils
Figure 4.3: A summary of the procedure used to separate lymphocytes and neutrophils. Initially, the supernatant of the dextran sedimentation step is carefully layered onto the Histopaque. Under centrifugation the denser neutrophils and erythrocytes pass through the Histopaque and collect at the bottom of the tube. The lymphocytes remain above the Histopaque layer.
Cell viability was determined using the ‘trypan blue’ exclusion test,139 typical values were in the
range 95-98%. Cell concentrations were measured using a haemocytometer. A concentration of
5xl04cells m l'1 was suitable for electrorotation experiments, while the higher concentration of
2xl(Pcells ml 1 was optimal for the cell confinement experiments.
59

4. Dielectrophoresis
4.2.5 C ollection o f E lectrorotational Spectra
In preparation for collection of spectra, the electrode structure was soaked in casein solution
(lm g ml'1) for 15 minutes. The adsorbed milk protein provides a layer that reduces the rate of
particle adhesion to the electrode structure. The mechanism of cellular adhesion is particularly
apparent in neutrophils and is associated with the high motility and subsequent activation of
these cells.119 A sample of cell suspension (ca. 800pl) was contained above the electrodes in a
2mm tall and 20mm diameter glass ring attached to the substrate using a thin layer of silicon
grease. Increases in conductivity due to evaporation were reduced to a negligible level by
covering the glass ring with a cover slip.
Electrorotational spectra were collected by observing the rotation rate and sense at 4 points per
frequency decade. In addition, a greater amount of rotation data was collected near the
inflexion and cross-over frequencies within the spectra. The experimental observations were
made by recording the rotation of the cells on video followed by later analysis of determine the
rotation speed (co) in rad s'1. Each of the recorded spectral points represent the average of six
measurements on particles of similar diameter.
Induced dipoles in nearby rotating particles can affect the rotational response. To minimise
this influence, recordings were made from particles separated by at least three cell diameters.129
In addition, recordings were only made of particles positioned in a area defined by a circle
located at the centre of the electrode array. This ‘virtual’ circle had a width of 0.3*, where *
represents the separation between the electrode tips. For the polynomial electrode design used
in these electrorotational experiments, Hughes et al.136 have shown that particles in this region
experience a consistent (95% confidence) rotational torque and minimal positive
dielectrophoretic forces.
4.2.5,1 A c tiva tio n o f N eu troph ils
Neutrophils were activated by the addition of chemotactic factors136 such as PMA or the
bacterial peptide FMLP. Both stimulants were first dissolved in DMSO and then diluted to a
concentration of 500pg ml'1 in sucrose/PBS solution of the same conductivity and osmolarity as
the cell suspension. Once the spectrum of the resting neutrophils had been collected a 40|il
aliquot (i.e. a ca. 20 times dilution) of chemotactic factor was added to the cell suspension. The
suspension was left for 60 seconds before collection of the spectrum of the activated neutrophils.
Neutrophils are extremely sensitive to both these chemotactic stimulants, concentrations as low
at lOnM can generate a response.44 In the central concentration range (i.e. 50nM to lpM) a dose
dependent response has been observed, as demonstrated by the generation of free radicals (see
section 3.2.3). These can be measured by techniques such as chemiluminescence140 and
60

4. Dielectrophoresis
cytochrome c reduction.117 The final chemotactic factor concentration (25fiM) used in this study
was chosen specifically to give a rapid saturated response. PMA was preferred to FMLP since
PMA is known to provide a more consistent and durable chemotactic response in neutrophils.140
Control experiments ensured that the addition of DMSO alone did not contribute to the
observed response.
4.3 Results and Discussion
The results of the particle confinement and electrorotation experiments will be discussed
separately in this section. The electrical properties of the medium are of relevant to both
aspects of the dielectrophoretic phenomenon and the results will be detailed below.
4.3.1 M edium C onductivity and P erm ittiv ity
Medium conductivity and permittivity are crucial parameters in experiments exploiting the
phenomenon of dielectrophoresis. Aqueous salt (0-200mM PBS) and sucrose (0-270mM)
solutions were used in this study. At these concentrations, the solution permittivity remains
constant (79eo)141 over the available frequency ranges (100Hz-20MHz). However, the same is
not true for ionic conductivity. The movement of aqueous ions is the mechanism of charge
transfer in solutions, and is very sensitive to changes in concentration.
100% PBS = 15.60mS cm '1
0% PBS = 6.51 pS cm '1 (sucrose only @ 270mM'E 1 2o 1 COE,£ 0.8>
100% RO W ater = 2.22pS cm'
o3TJCoO
0 .4
0 .0
0 2 4 6 8 10PBS (%) in 9% Sucrose
Figure 4.4: The variation in conductivity of mixed PBS/sucrose solutions used as suspension media in the dielectrophoresis experiments. Conductivity was measured with a HP 4192A Impedance Analyser using a platinum black electrode (cell constant=0.96cm'') a t 100kHz. The linear variation demonstrates the predominant effect of PBS concentration on the conductivity of the medium.
Figure 4.4 demonstrates the predominant effect of PBS on the conductivity of mixed
PBS/sucrose solutions. This data provided a guide to the preparation of stock solutions. The
conductivity values quoted in the text represent those values measured after the addition of
cells at the required concentration.
61

4. Dielectrophoresis
4.3.2 P article C onfinem ent
The work on particle confinement concentrated on the use of the dielectrophoretic phenomenon
to generate electric field traps for single particles. The procedure relies on the use of negative
dielectrophoresis to induce a translational force on the particle. This moves and retains it at
the position of minimum potential energy (see figure 1.6).
The results presented below provide a guide to the experimental conditions necessary to trap
polystyrene beads and cells. It is primarily a qualitative analysis to see if the particle was
successfully trapped and to identify the experimental conditions. Quantitative studies to
measure the dielectrophoretic force include: the measurement of average velocity of yeast cells40
and the use of particle levitation.39 In this study, under microscopic observation, it was evident
when a single particle was trapped, as it ceased to be sensitive to the characteristic convection
current drift and Brownian motion of other particles in solution. However, an indication of the
quality of the field trap could be deduced from the speed with which the particles were confined.
Any particle levitation was indicated by the de-focusing of the microscope image.
4.3.2.1 P olystyrene B eads
Successful confinement of polystyrene beads was particularly dependent on the conductivity of
the suspending medium. At a medium conductivity of 200-2000p.S cm'1 (1.2-12.5% PBS), it
proved simple to trap a single bead (figure 4.5a) over a broad range of frequencies (10kHz-
20MHz). At lower conductivities (e.g. clOOpS cm'1, <0.6% PBS), successful trapping proved
impossible, since the positive dielectrophoretic force (i.e. attraction of beads to the electrode
edges) was dominant. However, at higher frequencies (>lMHz) and higher conductivities (i.e.
ca. lOOpS cm'1), a weak negative dielectrophoretic force was apparent. When using very high
conductivity solutions (>2000|iS cm'1), the negative dielectrophoretic force was acting over the
entire frequency range. The action of this force was evident from the obvious repulsion of beads
from the electrode edges. Nevertheless, stable particle confinement was difficult to control,
most probably due to ohmic heating of the solution (see section 4.3.2.3 for further discussion).
One difficulty encountered in similar studies has been sedimentation and adhesion of particles
to the substrate. The increase in medium viscosity by the use of sucrose (9%) provided a
satisfactory solution but also reduced the responsiveness of beads to changes in the
dielectrophoretic force. Other possible compromises, such as substrate silanisation,127 use of
even higher solution concentrations and the inversion of the measurement chamber39 failed to
provide a comprehensive solution to this dilemma. Stubbornly adherent beads could be
62
4. Dielectrophoresis
released by washing in concentrated detergent (Decon 90). However, the best method to
maintain a clean substrate was to prevent it from drying-out.
4.3.2.2 Cells
In contrast to polystyrene beads, the response of cells is more complex due to the influence of
the cell membrane and cytoplasm contents (see appendix A). For particle trapping, all cell
types behaved in a broadly similar manner and will be treated as a one group in the following
analysis.
A minor experimental change was recommended for work with erythrocytes.142 The
concentration of the stock sucrose solution was adjusted to 220mM in order to reduce the
solution osmolarity (see also section 4.2.1). The concentration change generated the necessary
osmotic pressure to force the naturally biconcave erythrocytes into a more suitable spherical
shape.
In some respects, the response of cells is similar to that of beads. For example, cell or bead
trapping was less successful at high conductivities (>1000|liS cm'1, 6.5% PBS). At low
conductivities (6pS cm'1 (0% PBS)), a positive dielectrophoretic force was dominant at all
frequencies (1kHz- 20MHz), which attracted cells to the electrode edges. To generate a
satisfactory negative dielectrophoretic force to confine the particle, the medium conductivity
needed to be adjusted into the range lOO-lOOOpS cm'1. A conductivity of 400pS cm'1 (2.4% PBS)
provided a value suitable for all the cell types used in this study.
Even when using a medium of optimal conductivity, the nature of the dielectrophoretic force
was still highly frequency dependent. A strong negative trapping force was apparent at low
frequencies (5kHz-150kHz). However, at higher frequencies (150kHz-20MHz) the positive
dielectrophoretic became dominant. A similar response for pollen cells has been observed by
Fuhr et al.39 at a conductivity of 250pS cm'1.
The positive dielectrophoretic force at high frequency was theoretically predicted by Foster et
al.,126 in addition, the modelling also indicates another region of negative dielectrophoretic force
at very high frequency. Interestingly, Fuhr et a l 39 have managed to demonstrate the use of this
high frequency region and have investigated its advantages. They claim that it is superior for
particle trapping since the higher frequency voltage will reduce any electric field induced
physiological stress generated across the cell membrane.
63

4. Dielectrophoresis
(a)
(b)
(c)
Figure 4.5: Confinement of single particles using negative dielectrophoresis. The polystyrene bead (a)is trapped at the centre of a polynomial electrode array (20pm tip separation), the experimental conditions are 10MHz, 5V p-p, 260mM sucrose/PBS medium (1.2% PBS, 200gScm'1). The BHK cell (b) is trapped in the same electrode array, the experimental conditions are 50kHz, IV p-p voltage in an isotonic sucrose/PBS medium (2.4% PBS, 400gS cm'1), (c) Bleb formation and membrane roughening on the surface of activatedhuman neutrophils. Reproduced from the work of Watts et al,,149 see section 4.3.3.2.
64

4. Dielectrophoresis
The highest frequency available in this study was 20MHz and at this frequency a positive
dielectrophoretic force was still apparent. For the human neutrophil, these experimental
observations concur with the theoretical predictions provided by the double-shell model
described in appendix A. Figure 4.6 illustrates the variation in the real component of the
Clausius Mossotti factor with frequency for a neutrophil over a broad range of medium
conductivities (see table 4.1 for details of the modelling parameters).
0.4mS m0.8 4mS m
£ 0.6 oQ.E 0.4oo
40mS nrf’
0.24-*+-•OwU)o2
400mS m'10.0
I(/)
• - - 0.2 UicoJ -0.4
1500mS m
<§ -0.6 DC
- 0.8
Frequency (Hz)
Figure 4.6: The application of the double shell model to the simulation of the dielectrophoretic response of human neutrophils in a range of medium conductivities. The variation in the real element of the Clausius-Mossotti factor provides a guide to the nature of the dielectrophoretic force. A negative value, for a particular frequency, indicates a repulsive force away from the electrodes and the possibility of particle confinement.
From equation 4.2 it can be seen that Re(/"(£* ,£*m)) is the dominant factor in determining the
direction of the dielectrophoretic force. The double-shell model predicts the observed variation
in the nature of the dielectrophoretic force at low and medium conductivities. However, at high
conductivities (e.g. 1500mS m'1 in figure 4.6), theory predicts a negative dielectrophoretic force
over the entire frequency range, but this result could not be exploited experimentally. In this
study, only poor quality cell trapping was possible at high conductivities. Cells were seen to be
repelled away from the electrode edges by a negative dielectrophoretic force. However, it was
65

4. Dielectrophoresis
difficult to retain any cells within the electric field minimum. Occasionally, a single cell
remained in unstable motion within the field trap, but after a short period (l-60sec), the cell
escaped into the bulk solution.
A probable explanation for this anomalous behaviour (also seen for polystyrene beads) is ohmic
heating of the suspension medium - an effect associated with high conductivity media. Heating
effects are created as electrical power is dissipated between the electrodes in the array. It has
been shown144 that the associated temperature rise is linearly related to medium conductivity
and can in some cases lead to dramatic local temperature increases. The changes to solution
dielectric parameters and the convection currents generated by this local heating account for
the unstable motion and poor retention of cells within field traps created in high conductivity
media.145 Fuhr et al,144 use a three dimensional electrode array to create an enclosed field trap.
This method overcomes the weakness of two dimensional traps that rely on sedimentation
forces to retain the particle. However, the fabrication of three dimensional structures
dramatically increase the complexity of any particle trapping application.
4.3.2.3 F u rth er O bservations on P a rtic le Confinem ent
At this point, it is worthwhile to make additional observations on the experimental subtleties of
using the phenomenon and it scope for use in similar applications.
4.3.2.3.1 Insulator Layers
Since the phenomenon is based on generation of electric fields, the electrode arrays can be
covered in a limited thickness of insulator and still generate the necessary field traps. Under
similar experimental conditions as described above, cells and beads were trapped successfully in
the array shown in figure 4.5. However, in this instance, the arrays were coated in silicon
nitride (see section 2.1.5.2 for details) at a thickness of 50, 110, 240, or 520nm. At a thickness of
520nm, the electrical shielding provided by the silicon nitride was enough to disrupt the field
pattern to prevent successful particle confinement at any frequency, even when potentials were
increased to the maximum of 12V. This is a valuable result in terms of the design of
microfabricated sensors exploiting dielectrophoresis. The use of a thin insulating layer provides
the option of multilayer fabrication and will also reduce the magnitude of electrical noise that
reaches additional electrodes included with sensor structure. In addition, use of an insulator
will reduce the solution heating effects prevalent in high conductivity media.
4.3.2.3.2 Electrode Geometry
For particle trapping, no obvious advantage was seen by use of either the circular or polynomial
electrode geometries. However, the electrode tip to tip separation in relation to cell diameter
was identified as an important factor. This was particularly apparent if the separation was too
narrow and the cell was unable to rest firmly within the electric field trap. It is recommended
that the trap should be no smaller than 2 times the cell diameter. The maximum separation is
66

4. Dielectrophoresis
a more flexible parameter and will depend on a range of factors, such as the required position
accuracy, cell viability, and available instrumentation.
If positional accuracy is of paramount importance, a separation of ca. 3 times the cell diameter
is recommended. This relative geometry provides a suitable steep sided field trap ideal for the
confinement of single particles.
The influence of electric fields on cell viability is a difficult matter to assess. However, it would
be prudent to minimise the field strength whenever possible so as to minimise the perturbations
induced in the intrinsic membrane potential of the confined cells.39 One of the simplest ways to
achieve this aim is to increase electrode separation. Using the method of Wang et aZ.,129 a
reasonable estimation of the typical field strength used in this study was 500V cm'1.
Significantly, and of related interest, is the work by Fuhr et aZ.146 which indicates the negligible
effect of even higher field strengths (1000V cm'1) on the life-cycle of mouse fibroblasts.
An obvious constraint of electrode geometries is the instrumentation available. This was
demonstrated in this study by the inability to observe any satisfactory high frequency
(i.e. >20MHz) negative dielectrophoresis. From equation 4.2 it is clear that the applied voltage
will have a dramatic effect (squared relationship) on the nature of the dielectrophoretic force.
Similar particle trapping conditions can be generated at two electrode arrays of the same basic
design. For example, if the voltage is doubled, a similar dielectrophoretic force can be
generated in an array of four times the tip-to-tip separation.
4.3.3 E lectrorotation
Detailed electrorotational studies were performed on polystyrene beads and human neutrophils.
These particles demonstrated markedly different rotational characteristics. The aim of the
work with the beads was to provide a grounding to the subsequent novel work on neutrophils.
From the range of cell types available, neutrophils were selected because they are known to
have a rapid and dramatic physical and chemical responses to chemotactic stimulation. Human
rather than rabbit neutrophils were chosen for their greater availability, increased activity,
larger size, and more extensive background literature.
4.3,3,1 P olystyrene B eads
The rotational spectra for the beads was collected in a 260mM sucrose solution (6.5 lpS cm'1).
The spectrum is shown in figure 4.7. There is the suggestion of a co-field rotation peak at low
frequency (clkHz) and there is complete peak centred at 400kHz. This spectrum is similar to
previous work on inanimate particles.37-127 However, in those studies, spectra were collected
from particles suspended in salt solutions not containing sucrose. As discussed earlier (see
67

4. Dielectrophoresis
section 4.3.2.1), use of sucrose helped in collection of the spectra by reducing sedimentation
rate, but it also slightly reduced the rotation rate.
I I 1 M i l l | " 1” I - | " | I I I 11 I I ' 11 I I I I 11 I I I I I I I 11 I I I I I I I I
103 104 105 106 107 108Frequency (Hz)
Figure 4.7: The electrorotation spectrum of a polystyrene beads suspended in 260mM sucrose (6.51|iS cm-1). The spectrum was collected between 5kHz and 20MHz at a voltage of 3V using polynomial electrodes of 360pm separation. Only co-field rotation (i.e. positive rotation rates) peaks can be seen, these are located at clkHz and 400kHz.
The co-field rotation peak at 400kHz is predicted by the theory summarised in appendix A. The
source of the co-field rotation peak occurring at a frequency below 1kHz has yet to be fully
explained. Further detailed analysis at these low frequencies is hampered by electrolysis at the
electrodes (see section 4.2.2), electrophoresis,128 and an attenuated response due the effects of
electrode polarisation.132 The nature of the low frequency peak is suspected to be based on
changes occurring within the ionic double layer surrounding the bead.37
4.3.3.2 H um an N eu troph ils
The electrorotational work on neutrophils provided a more complex spectrum having both a co
field and an anti-field rotational peak (see figure 4.8). Upon neutrophil activation, subtle
changes in the physical properties of the cell were reflected in the changing nature of the
spectrum.
68

4. Dielectrophoresis
In contrast to similar studies on human lymphocytes,147 a relatively high medium conductivity
(400|iS cm'1) was used in this study. A low conductivity was not used was for three reasons.
Firstly, the increased centrifugal washing necessary to lower medium conductivity initiated
neutrophil activation. This mechanism was caused by the cellular compression and was
indicated by cell aggregation.134 Secondly, a previous study has shown that leakage of cytoplasm
contents makes it difficult to maintain a consistently low medium conductivity.35 When a higher
conductivity media is used, the suspension media is much less sensitive to the effects of ionic
leakage. Thirdly, at a low conductivity, the positive dielectrophoretic force attracting rotating
particles towards the electrodes is apparent over a broader range of frequencies (see
section 4.3.1). Experimentally, this leaves less time to collect the spectrum of a single cell.
The recorded spectra are shown in figure 4.8. The spectrum of the resting neutrophil was
subsequently simulated to provide the best fit spectrum using the double shell model
(appendix A).
*o(0i—
CD■4—>cODCco
+ - >
CO-4—'oDC
■4 -
Frequency (Hz)
Figure 4.8: The electrorotation spectra of resting (O) and activated (□) human neutrophils. The spectra were collected using polynomial electrodes (360pm separation) a t a field strength of ca. 56V cm'1 (2V p-p) in a sucrose/PBS medium (2.4% PBS, 400pS cm'1). The neutrophils were activated using PMA at a final concentration of 25pM. The spectrum of the resting neutrophils has been simulated (solid line) using the doubleshell model, parameters are given in table 4.1.
69

4. Dielectrophoresis
The model is based on tha t described by Asami et al,131 for mouse lymphocytes. The param eters
used for the neutrophil model are summarised in table 4.1. Values for cell and nucleus radii
were measured using light microscopy. Other values were gathered from similar work on
lym phocytes130-131 or found in the literature.141-142
P aram eter S ou rceCell radius (R) 6pm Measured
Cell membrane thickness (dm) 8nm Asami et a l.131
Nucleus radius (rn) 3.5pm Davis et al.143
Nuclear membrane thickness (dn) 20nm Asami et a l.131
Medium Conductivity (amed) 0.4mS cm'1 Measured
Medium Permittivity (emed) 79eo Arnold et al.141
Cell membrane conductivity (am) lxlO'8pS cm'1 Ziervogel et al.130
Cell membrane permittivity (em) 6.2eo Ziervogel et al.130
Cytoplasm conductivity(0Cp) 3mS cm'1 Ziervogel et al.130
Cytoplasm permittivity (e c P) 60eo Asami et a l.131
Nuclear membrane conductivity (an) 60pS cm'1 Asami et a l.131
Nuclear membrane permittivity (en) 28eo Asami et a l.131
Nucleoplasm conductivity (0np) 13.5mS cm 1 Asami et a l.131
Nucleoplasm permittivity (enp) 52eo Asami et al. 131
Permittivity of free space (eo) 8.854x10'12F m'1 CRC Handbook
Table 4.1: The parameter values and literature sources used in the double-shell model of aneutrophil
Key changes in the spectrum of the neutrophil upon activation are the shifts of the anti-field
rotation (fp) and cross-over (fc) peak frequencies. The lack of an additional obvious dispersion in
the 500kHz-5MHz range suggests tha t nucleus is not contributing significantly to the nature of
the anti-field rotation peak.130-131 For this reason, the discussion of differences in these spectra
will focus on physical changes in the cellular membrane and cytoplasm. Relying solely on the
electrorotational spectrum, it is difficult to precisely identify which physical change or
combination of physical changes is occurring in an activated neutrophil. Param eter values
within the model were varied in an attem pt to explain the observed changes in the neutrophil
spectra.
Previous work148 has found tha t cell volume increases by an average by 21.7% upon neutrophil
activation. This would be apparent as a 4.5% increase in cell radius. Furthermore, activation is
known to induce physical changes in the structure of the cell membrane, as illustrated in
figure 4.5c. An activated neutrophil initially forms blebs on the membrane surface,
subsequently, it undergoes shape changes associated with actin polymerisation and de
70

4. Dielectrophoresis
polymerisation.149-150 Other associated physical factors such as changes in membrane
capacitance (common in other studies on cell differentiation129-147) may also contribute to the
nature of the electrorotational spectra.
The model was used to investigate the effects of varying four dominant cellular parameters (R,
dm, £m and acp). The effect of increasing cell radius is shown by the appropriate downward shift
in fc and fP (figure 4.9a). However, an unrealistic (i.e. not seen by light microscopy) volume
increase of 337% would be required to provide an acceptable fit (i.e. R=9pm) to the activated
neutrophil spectrum. The model also predicts that a decrease in membrane thickness to
ca. 5nm would provide a simulated spectrum with an appropriate fc (figure 4.9b). An increase
in membrane capacitance (shown by an increase in em (figure 4.9d)) is a likely possibility since
membrane roughness increases during bleb formation. Finally, decreased cytoplasm
conductivity is another possible explanation (figure 4.9d).
The increase in volume after neutrophil activation has been predicted elsewhere using a
different technique. This would concur with a combination of the changes predicted by the
model. For example, the expulsion of ions during cell activation44 and subsequent uptake of
water would reduce the cytoplasm conductivity and increase cell volume. In addition,
membrane stretching associated with increased volume and bleb formation, is a suspected
process leading to a reduction in the thickness of the cell membranes.151 An increase in
membrane capacitance is not unexpected, since it has been also measured in the differentiation
of DS19 leukaemia cells,35 and following the mitogenic stimulation of human T and B
lymphocytes.147
The electrorotation spectra of the resting and activated neutrophil do indicate significant
changes in the electrical properties of the cell. However, it is not possible to de-convolute the
measured changes into specific physical changes in the cellular structure and physiology - only
an indication of likely changes is possible (figure 4.9). To allow a precise interpretation of the
data, a more accurate electrorotational spectrum is necessary. In contrast to the spectra of
resting neutrophils there were broader errors and a reduced number of data points (see
figure 4.8) collected for the activated neutrophils. This makes it unrealistic to attempt to model
the data and assign specific parameter values. These difficulties are associated with the
inevitable adhesion and motility mechanisms characteristic of activated neutrophils.
Experimentally, this was demonstrated by cell adhesion to the substrate and a non-spherical
shape. For resting neutrophils, coating the substrate in milk protein (see section 4.2.5.1) was
effective in limiting the effects of the activation mechanisms, however, the addition of PMA
always accelerated cell adhesion. A reduced time window of only 5 minutes was available to
collect the spectrum of the activated neutrophil.
71

Rota
tion
Rate
(ra
d s'
1) Ro
tatio
n Ra
te
(rad
s'1)
Rota
tion
Rate
(ra
d s'
1) Ro
tatio
n Ra
te
(rad
s'1)
4. Dielectrophoresis
4
2Cell Radius (R)
06pm
9pm
4
Membrane Thickness (dm)
2
08nm
5nm
Membrane Permittivity (e,
6.2e,
4
Cytoplasm Conductivity (acp)
2
00.6mScm
■2
3.0mScm
104 105 106 107 108Frequency (Hz)
Figure 4.9: The effect of the variation of four cellular parameters (R, d m , Em and aCp) on the nature of the modelled electrorotational response of human neutrophils. The modelled response of resting neutrophils (solid line) can be compared to the measured (see figure 4.8) changes. Conceivable physical changes in cellular properties upon cell activation are indicated by dotted lines.
72

4. Dielectrophoresis
4.4 Summary
This work has demonstrated the successful use of dielectrophoresis for particle confinement and
for the analysis of subtle physical changes in living cells. Particle confinement was
straightforward following the selection of a suitable medium conductivity and signal frequency.
The technique of electrorotation was a sensitive means of detecting changes in the physical
properties of human neutrophils when activated by chemotactic reagents. Subsequently,
analysis using the double-shell model provided an indication of the changes in specific cellular
parameters. The results agree with the observations of other studies on neutrophil activation,
and the nature of the dielectrophoretic response is similar to that seen in studies on other blood
cells.
4.4.1 P oten tia l for Further Work
The fabrication of novel electrode structures using microfabrication techniques presents an
excellent opportunity for the exploitation of dielectrophoresis within biotechnology.
Applications such as the separation of breast cancer cells from erythrocytes152 have already
been demonstrated. The use of electrorotation in water purity analysis has already generated
significant industrial interest.37 Further electrode miniaturisation and a better understanding
of associated theory presents exciting possibilities for the future. For example, the use of
dielectrophoresis to control the movement, and measure the electrical properties, of sub-jim
particles such as viruses and macromolecules.56 One novel application of dielectrophoresis is
travelling-wave dielectrophoresis.
4.4.1.1 T ravelling-W ave D ielectrophoresis
Masuda et al. 152 were the first to note the potential use of phase-shifted voltage applied in a
linear electrode array to move cells. The resultant electrokinetic force on particles within the
electrode array could be used to move and/or sort particles with different electrical
properties.32-154’155 Figure 2.2c (chapter 2) shows a structure built during this project to separate
two particles of similar but not identical electrical properties. The device needed three signal
generators, each providing a voltage to the three channels of the Y-shaped electrode. In theory,
one channel would be used to move both particle types towards the centre of the Y, while
specific signal frequencies would be applied to the remaining fingers in order to differentially
guide each particle type into a separate channel. Although the theory of the technique has been
proposed,156 the experimental analysis of the technique was impeded due to the difficulties in
the fabrication of the complex electrode array. The principal difficulties were both poor
insulator adhesion and formation of reliable thru-holes (see section 2.2.1.2). Further work to
overcome these problems is in progress.
73

5. Biosensor Interfaces
5. Biosensor Interfaces
This chapter describes the analysis of enzyme content within a polymer m atrix using three
different techniques, focusing on the quantification of the amount of GOx entrapped within a
PPy film. As discussed in the Introduction, much work has been done on this system, primarily
concentrating on its use as a glucose biosensor. However, this work focuses on two a particular
aspects of this biosensor interface: the relationship between enzyme concentration in the
polymerisation solution and its concentration in the as-grown PPy/GOx film, and the analysis of
the amount of active enzyme in the film.
5.1 Growth of Biosensor films
PPy was first prepared chemically as a powder in 1916 as described by Chandler and
Pletcher,157 but first produced electrochemically in 1968158 and as a free standing film by Diaz et
al. in 1979.159 Work by Foulds et a /.160 in 1986 demonstrated its use as a m atrix for GOx
entrapm ent leading due to its application as a glucose biosensor.
5.1.1 Theory: P o lym er G row th
The electro-oxidation of the monomer is believed to occur via a reactive 7i-radical cation
mechanism (see figure 1.4, in chapter 1) which reacts with a neighbouring pyrrole species either
in solution or in the polymer backbone.12 The resulting polymer incorporates anions from the
supporting electrolyte and has a net positive charge. Although the enzyme is entrapped as a
poly-anion in an active form, its viability is dependent on storage conditions and usage,161 and
in one instance its stability at pH extremes was improved by the entrapm ent process.162
The following sections review the variety of polymerisation conditions th a t were investigated
and optimised during the course of this study.
5.1.2 M ethods & M aterials: P o lym er grow th
The biosensor films were electrodeposited onto a gold surface evaporated onto a scribed glass
substrate. The electrodes were prepared by electron-beam evaporation of Ti/Pd/Au
(10/10/100nm) multilayer structure, providing excellent adhesion of the metal to the glass
substrate, and good electrochemical stability, even at high oxidative potentials in aqueous
solutions. Immediately prior to bio-polymer deposition the gold surface was cleaned by a RIE
74

5. Biosensor Interfaces
etch for 5 minutes (50mT, 20sccm and 10W) in first oxygen and then argon using a PlasmaFab
ET340.
Biosensor films were grown from a solution of 150mM pyrrole in 50mM NaCl with a varying
concentration of GOx (Aspergillus niger (E.C. 1.1.3.4), Medisense UK, with an activity of
165U mg'1) in the range 6 to 420|ig ml'1. The pH of the polymerisation solution was adjusted to
4.5 by drop-wise addition of HC1. Polymer deposition was carried out by cyclic voltammetry
using an EG&G 273A potentiostat, scanning the working electrode (area ca. 90mm2) between 0
and +0.8V (scan rate=50mV sec*1) with a platinum gauze counter electrode of area of 2cm2.
Film growth using this technique produced a consistent film thickness of ca. 75nm, as measured
using a Dektak ST3 (Veeco Instruments Inc.) surface profiler. Electrochemical experiments
were conducted using an Ag/AgCl (3M NaCl) reference electrode (BAS), against which all the
potentials in this section are quoted.
The glass electrodes were scribed prior to evaporation but only broken in two after growth of
the polymer film. The lower part of the electrode was used for the XPS and FTIR analysis,
while the upper half was used for the electrochemical assay. This ensured that exactly the
same film was used in all three analysis techniques used in this study. All electrochemical
assays were completed within 24 hours of film growth. The films for XPS and FTIR analysis
were stored overnight in a solution of 50mM NaCl thus minimising the effects of adventitiously
adsorbed contamination during transport.
5.1.3 R esu lts and D iscussion
Use of methods adapted from the work of various groups provided background information to
guide the selection of the above polymerisation conditions.163 162 The following sections focus on
elements of the biosensor preparation of specific note in this study.
5.1.3.1 Effect o f p H
Work by Gros166 has previously shown that films grown at pH 5-6 can have an enhanced
response. Whilst maximising the response was certainly desirable, other parameters such as
film uniformity and "quality" are examples of additional important factors taken into
consideration during the optimisation of the growth procedure.
It was important that the films grew uniformly across the whole electrode since pinholes or
defects lowered the sensitivity of the electrochemical assay due to the resultant higher baseline
current. Furthermore, uniform films held a significant advantage in the spectroscopic analysis,
particularly in FTIR analysis,167 as a ‘smooth’ film would reduce quantification errors from
diffuse reflections. The observation of higher quality PPy films is related to maintaining a low
75

5. Biosensor Interfaces
pH close to the site of electropolymerisation,168 thus promoting the progress of the nucleated
growth mechanism.169
The benefit of lower pH is evident in the range pH 2 to 7, however, films grown at pH <2 had a
poor glucose response due to reduced enzyme entrapment within the film. This observation
highlights the mechanism by which the enzyme is incorporated into polymer matrix. Since GOx
has an isoelectric point of 4.2,170 in a pH 2 solution the enzyme will have a positive charge
whereas at a >pH 4.2 the enzyme will have a negative charge aiding its incorporation into the
polymer film.
A solution of pH 4.5 was found to be the best compromise. Films grown as this pH deposited
both easily and uniformly at all utilised GOx concentrations producing noticeably ‘smoother*
defect free films. Figure 5.1 provides an illustration of the galvanostatic profiles for PPy/GOx
films grown in solutions of increasing pH. The increased difficulty of polymerisation in higher
pH solutions is apparent because the potentials are being forced to higher values, and
subsequently staying at these values for a longer time, before returning to the characteristic
growth process at ca. +0.7V. Maintaining the potential below +0.8V helped to prevent both the
over-oxidation of the PPy and formation of over-oxidation related groups171 (e.g. C=0) in the
polymer backbone. This factor was of significant value during the quantitative analysis of the
XPS data (see section 5.3.4).
1.0 -
0.8 -
>rr o.6 -<3
I 0 . 4 -Q_
0.2 -
0.0 -
- 5 0 0 5 0 1 0 0 1 5 0 2 0 0
Time (s)
Figure 5.1: The galvanostatic growth profiles of a PPy/GOx films prepared from a solution of 150mM pyrrole and 120(ig ml'1 GOx in 50mM NaCl adjusted to pH 5,6 and 7 by dropwise addition of HC1. The polymer films were grown on RIE cleaned evaporated gold electrodes (area ca. 90mm2) at a current density of 500|iA cm'2, the potentials are quoted vs. Ag/AgCl. The speed with which the response reaches a stable value (ca. 0.7V) provides a guide to the ease of film growth.
f X
-------- pH 5
--------pH 6
— --------------- H 1
......... pH 7
1 1
76

5. Biosensor Interfaces
5.1,3.2 F ilm Thickness
Routine measurement of the polymer film thickness is a persistent difficulty encountered in the
study of conducting polymer films. It is commonly estimated by the measurement of total
polymerisation charge.165 However, it is difficult to apportion the recorded charge to that solely
used in the growth of the polymer membrane. Precision techniques, such as ellipsometry28 or
atomic force microscopy (AFM)172 can be used for detailed analysis, although they are not
suitable for routine thickness measurements. In this study, measurement of film thickness was
investigated using all the above techniques, excluding ellipsometry. However, none was found
to be ideal in terms of both accuracy and convenience. In consequence, a further method was
developed based on the observation of the in-situ current amplitude at OV correlated against
thickness measurements made using a surface profiler. This correlation is shown in figure 5.2.
180
160
^ 140
S 120 (08 100
o 80 IE
60
40
20200 300 400 5 0 0100
Current at OV (|nA cm-2)
Figure 5.2: The variation of film thickness with current amplitude at OV. The graph shows thickness measurements for films grown at three different enzyme concentrations (6,30 and 240pg ml'1). The PPy/GOx films were prepared from a solution of 150mM pyrrole and GOx in 50mM NaCl (pH 4.5). The polymer films were grown on RIE cleaned evaporated gold electrodes (area ca. 90mm2) by successive scans between 0 and +0.8V vs. Ag/AgCl at a scan rate of 50mV s'1.
A current of -250|iA cm'2 measured at 0V was found to provide the required film thickness of
ca. 75nm. The number of potential cycles required to reach this current marker increased with
solution enzyme concentration. The range varied from 5 sweeps (ejigm l1) to 11 sweeps
(420|ig ml'1). An example of the stepwise variation of current is illustrated in figure 5.3. To
confirm the validity of the measurement at 0V, cyclic voltammograms were recorded for
PPy/GOx films grown at a range of enzyme concentrations. The responses indicated no
difference in the nature of the observed response that could be ascribed to enzyme dependent
redox activity at OV. This concurred with the previous work by Belanger et a l.173 that
77

5. Biosensor Interfaces
demonstrated no difference at OV between the cyclic voltammograms of PPy and PPy/GOx films
grown using similar polymerisation conditions.
Surface profilometry measurements for a range of PPy/GOx films confirmed the correlation
between the OV current marker and film thickness. Since the only variable in the
polymerisation solution was enzyme concentration, it is reasonable to assume that the rise in
the negative value of the current marker is a reflection of the increase in polymer thickness and
subsequent rise in non-Faradaic charging current. This assumes a mostly passive
electrochemical role for GOx during PPy growth, which agrees with the conclusions of similar
work.162*174 As the polymer growth mechanism is inhibited by increased enzyme
concentration,175 at increased concentration a greater number of potential sweeps are required
to grow the same film thickness.
3.0S c a n No.
0.26th2. 5 -
4tho.o -2.0 -
Eo< 1.5 -
E
CM
-0.1 -
2n d-0.2 -
-0.34-»cQ)v_=3O
1.0 - 1st
0.5 -
0.0 -
-0.5- 0.1 0.0 0.1 0.2 0.3 0.4 0.5 0.6 0.7 0.8 0.9
Potential vs Ag/AgCI (V)
Figure 5.3: A sequence of voltammograms recorded during the growth of a PPy/GOx film prepared from a solution of 150mM pyrrole and 30jxg ml'1 GOx in 50mM NaCl (pH 4.5). The polymer films were grown on RIE cleaned evaporated gold electrodes (area ca. 90mm2) by successive scans between 0 and +0.8V vs. Ag/AgCI at a scan rate of 50mV s'1. A current of -250|iA cm'2 at OV after the 6th scan corresponds to a film thickness of ca. 75nm.
The current at 0V was easily monitored using the potentiostat software used to control the
cyclic polymerisation procedure. This thickness measurement technique is limited to a range of
enzyme concentrations in a particular solution. However, it provides a very convenient method
of in-situ measurement of polymer thickness and minimised the possibility of contamination
associated with ex-situ techniques. Furthermore, the use of a cyclic growth procedure aided the
78
5. Biosensor Interfaces
consistent preparation of uniform high-quality polymer films, an observation noted by other
groups investigating the mechanism of conducting polymer growth.176*177
Film thickness studies using both AFM and surface profilometry also provided information on
film morphology. These are illustrated by the typical film thickness profile (figure 5.4a) and the
textured surface of PPy (figure 5.4b) associated with its nucleated growth mechanism. A film
thickness of 75nm was chosen since is provided a satisfactory electrode coverage and the
consistent electrochemical response. A thicker film was undesirable due to the loss of peak
definition in the FTIR spectra (see section 5.4.3).
5.1.3.3 S election o f E lectro lyte
A range of polymerisation counterions were examined including NO32', Cl', PO 42' and CIO4 ', at a
variety of concentrations (5-500mM). The Cl' ion was judged to be the best, the use of PO 42'
resulted in poor quality films even at reduced pH. No advantage was gained by variation of
electrolyte concentration. These results agree with observations of other groups.165*174
Interestingly, the choice of cation also had a role to play in the selection of electrolyte. Residual
K+ cations within the PPy/GOx films produced a small but interfering signal in the Carbon(ls)
XPS signal (figure 5.5) which made baseline subtraction more difficult. This prompted the use
of NaCl (50mM) in preference to commonly used KC1.
5.2 Electrochemical Analysis
This section describes the electrochemical analysis of the active enzyme response within the
polymer films grown by the procedure described in section 5.1.
5.2.1 M ethods & M aterials: E lectrochem ical A nalysis
The as-grown biosensor films were first washed in lOOmM phosphate buffer (pH 7.4). Then, the
PPy component of the biosensor films was over-oxidised in the same buffer by successive cyclic
voltammograms. The over-oxidation potential cycle was carried out using cyclic voltammetry
on an EG&G 273A potentiostat, scanning the working electrode potential between -0.25 and
+1.25V (scan rate=50mV sec'1) with a platinum gauze counter electrode of area of 2cm2. Cycles
were repeated until a consistent voltammogram was observed. This procedure took up to
20 minutes, resulting in a non-conducting polymer matrix containing the entrapped enzyme.
The electrochemical assay for H2O2 was conducted at +0.65V in unstirred buffer using additions
of 2 or 20mM glucose prepared in the same buffer. Electrochemical experiments were
conducted using an Ag/AgCI reference electrode (BAS), against which all the potentials in this
section are quoted.
79

Heig
ht (
nm)
5. Biosensor Interfaces
400
300
200 195
120100 -
0 625 1250 1875 2500Scan Length (um)
11 a no Scope tm hFH3 '.: an i i 2 . 0 0 0
0 . 000Coon r a t e 5 , U'2 tWuHlicr o f so N pl c - r 0 5 0
Figure 5.4: (a) A film surface profile for a PPy/GOx film recorded using a Dektak’ST surfaceprofiler. The polymer film thickness is ca. 75nm after subtraction of the metal film thickness (120nm). The plateau in the scan length region from 250 to 450pm is due to an aberration associated with the relative compliance of the polymer (i.e. the relative stiffness of measuring cantilever versus that of the polymer), (b) An AFM image (4pm2 area) showing the surface morphology of the film measured above. The image agrees well with the suggested nucleated growth mechanism for PPy, the surface appears to be composed of a series of nucleation sites that have merged into a continuous film. The image was recorded using a Nanoscope 3 AFM scanning at 5Hz.
80

5. Biosensor Interfaces
coO
<n +—> coO
10
8
6
4
2
0
295300 290 285 280Binding Energy (eV)
Figure 5.5: A Carbon (Is) XPS spectrum for a PPy film grown using 150mM pyrrole in 50mM KC1 (pH 4.5). The spectrum demonstrates that some potassium ions, indicated by peaks at 294 and 296eV, still remain in the sample even after washing in RO water and drying using a nitrogen gun. The potassium peaks are a hindrance in the fitting process used in the analysis of XPS spectra, in consequence, a NaCl electrolyte was used in subsequent experiments. Details of the procedure used for recording the XPS spectra are given in section 5.3.2.1.
5.2.2 R esu lts and D iscussion
The amperometric assay technique for glucose is a familiar tool used by many groups178 180 in
the field since the first data on PPy/GOx based biosensor was published in 1986.160 However,
the use of deliberately over-oxidised polymer films as an entrapment matrix has only been
investigated in recent years.166-181 This section will highlight the electrochemical advantages of
using an over-oxidised PPy (PPy-oox) film as a matrix for GOx entrapment.
5,2,2.1 Why Use O ver-oxidised PPy Films?
A PPy-oox film was chosen because of the larger baseline current associated with the charging
current of solely oxidised PPy (PPy+).181 The magnitude of non-Faradaic baseline current was
considerably reduced from co. 20|iA cm'2 to 90nA cm'2. In addition, the time taken to reach a
satisfactory stable baseline response was reduced from 60+ to 5 min. However, the dominant
advantage was the increased sensitivity and reproducibility of electrochemical assays. PPy+
films are known to degrade (i.e. over-oxidise) with time, particularly when exposed to the high
positive potentials182 necessary for the standard H2O2 assay. Furthermore, chemical
over-oxidation of PPy+ by H2O2 is another factor that can alter the reproducibility of
measurements that rely on the conductivity of PPy+ based films.183 In fact, it has been
suggested that the long baseline settling time required for PPy+/GOx films, at potentials
81

5. Biosensor Interfaces
necessary for H2O2 detection, is responsible for a significant amount of PPy over-oxidation.173
Using PPy-oox films from the outset eliminates any errors that might be introduced by the
uncharacterised effects of polymer degradation.
There has been much recent interest in the application of PPy-oox in biosensor applications,
primarily for its permiselective properties.184 The permiselective properties of PPy-oox have
been shown to significantly hinder the transport of common anionic interferents (e.g. dopamine
or ascorbate). Neither, the transport properties of H2O2 or O2 within the film is significantly
affected, nor is the activity of the entrapped GOx.166 Various methods of over-oxidation are
used, including both constant and scanned potential methods. The mechanism has been shown
to depend on electrolyte with Em over-oxidation process involving the smaller and more
nucleophillic OH' ions in NaOH proceeding at twice the rate of an equivsQent concentration of
phosphate buffer.185
Standsird voltammograms for the over-oxidation of a PPy/GOx film following the procedure
used in this study are shown in figure 5.6.
700
600 -
500 -C\J
§ 400 - <3 300 -
200 -
13o 100 -
0 -
-100
- 0.2 0.0 0.2 0.4 0.6 0.8 1.0 1.2
Potential vs Ag/AgCI (V)
Figure 5.6: The over-oxidation of a PPy/GOx film (enzyme concentration 30|Jg ml'1 ) grown on RIE cleaned evaporated gold electrodes (area ca. 90mm2) in lOOmM potassium phosphate buffer (pH 7.4). The potential is being cycled between -0.25 and +1.25V vs. Ag/AgCI at a scan rate of 50mV s '1. The first cycle results in a massive current due to the over-oxidation of the conducting PPy, whilst by the 20th cycle all the PPy has been over-oxidised and the voltammogram represents that of a non-conducting film.
82

Curr
ent
ftiA
cm'2
) Cu
rren
t (MA
cm
5. Biosensor Interfaces
0 100 200 300 400Enzyme Concentration (jxg ml'1)
10
8
6
4
2
0
0 1 2 3 4Glucose Concentration (mM)
Figure 5.7: The electrochemical response of the range of PPy/GOx films analysed in this study.The polymer films were grown on RIE cleaned evaporated gold electrodes (area ca. 90mm2) from solutions of 150mM pyrrole and GOx (6-420pg m l1) in 50mM NaCl (pH 4.5). The amperometric response from H2O2 was measured at +0.65V (us. Ag/AgCI) in lOOmM phosphate buffer (pH 7.4) following two additions of both 2 and 20mM glucose. Note the non-linear variation of current response (i.e. active enzyme within the biosensor film) with increasing enzyme concentration in the polymerisation solution.
0 — 0 420 ng ml'1
o - - o 240 |Lig ml'1
v— v 1 2 0 jug ml
30 |ig ml
D 12 Lig ml
6 tig ml
6
5
4G lucose Concentration
3 0.18mM
1.8mM2
1-o
0
83

5. Biosensor Interfaces
5.2.2.2 A ssay R esu lts
Electrochemical assays for all the samples were performed at four different glucose
concentrations. The results for the range of enzyme concentrations in the polymerisation
solution are shown in figure 5.7. The assays have a linear response to a range of low glucose
concentrations. However, the corresponding variation of response with solution enzyme
concentration is non-linear. For example, comparing the response of the 420ja.gmr1 and
30|ig ml'1 films, the 14 fold increase in solution enzyme concentration results in only a 3 fold
increase in electrochemical response.
Similar non-linear responses in the literature are ascribed to a combination of mass transport
(i.e. diffusion of glucose, oxygen and hydrogen peroxide), enzyme turnover rate constants or
enzyme activity effects.
Use of thin polymer films (i.e. <~100nm) in preference to thicker films provides faster response
times, but at the expense of reduced magnitude of total current response (i.e. sensitivity).
Response times are improved due to the reduction of substrate and product mass transport
effects within the polymer matrix. Sensitivity is affected by the reduced total amount of
enzyme in the polymer matrix of thinner films. In practice, the selection for optimal film
thickness is a compromise is between these two factors and this subject has received thorough
investigation in two previous studies.165*166
In this study, thin biosensor films (ca. 75nm) were used, since it was desirable to minimise the
attenuation in sensor response due to mass transport effects. The use of thin films provided a
clearer indication of active enzyme content within the biosensor film. The sensitivity of the
biosensor films response was not a matter of significant concern even at less than micromolar
glucose concentrations, due to excellent assay responses afforded by the large electrode surface
area and low PPy-oox/GOx baseline currents. Low glucose concentrations were used in the
assay, so that the electrochemical response would accurately reflect the enzyme loading and
activity within the film, and not be determined by a saturated response. The logic used in the
selection of film thickness and substrate concentrations is demonstrated by the linearity of
responses (figure 5.7) for all the PPy/GOx films used in this study.
Nevertheless, the effects of non-linear response could be seen at higher glucose concentrations.
Figure 5.9 presents the detailed electrochemical assay of the 120|ig ml'1 biosensor film over a
broader range of glucose concentrations. The response is linear at low concentrations (up to
2.5mM) while a non-linear response is apparent at higher glucose concentrations. The
Michaelis-Menten kinetic parameter (KM) for the enzyme in the biosensor film can be
84

5. Biosensor Interfaces
determined when the assay was performed over a broader range of glucose concentrations. For
example, the Km value for the 120pg ml'1 film was measured as 24mM, as determined from the
x-axis intercept of a Lineweaver-Burk plot186 (see figure 5.8). Similar values of between 10 and
30mM were obtained for the range PPy/GOx films. These values agree with those reported in
the literature,160-162 so excluding the possibility that the entrapment mechanism has a
significant concentration dependent effect on enzyme activity.
In conclusion, analysis of the results suggests that enzyme concentration in solution is a poor
guide to active enzyme concentration in the biosensor film. This is in contrast to the earlier
reports160-178 of a linear a variation with GOx concentration. However, the earlier analyses were
performed on thicker films under different polymerisation conditions. This non-linear variation
was also noted by Fortier e t a l . ,162 and was explained in terms of thickness variations and the
non-linear distribution of H2O2, and hence current response, in the polymer film as the glucose
is more rapidly consumed at the biosensor/solution interface. This is certainly a valid argument
and will affect the electrochemical response, and helps to explain the small variation response
between the 120, 240 and 420pg ml'1 films (see figure 5.7). However, it does not provide a
complete explanation, since the XPS and FTIR results in the next sections will demonstrate a
similar non-linear variation in the enzyme loading of polymer films. Finally, these results
suggest that there is a maximum concentration of enzyme that can be entrapped in the polymer
matrix, although, from comparison with similar studies, this concentration is likely to depend
on a variety of polymerisation conditions. Further work is necessary to separate the influences
of enzyme concentration, enzyme activity and polymerisation conditions on biosensor response.
4.0 -
^ 3 .0 -H—1C<D 2.0 -
x a x i s intercept (-1/KM = -0.042)
0.0-0.5 0.0 0.5 1.0 1.5 2.0 2.5 3.0 3.5 4.0 4.5
1 / Glucose Concentration (mM'1)
Figure 5.8: A Lineweaver-Burk plot for the 120|ig ml'1 film used this study (ref. figure 5.9). The value of Km is 24mM, as determined by the x axis intercept of the least squares fit straight line (r2=0.9998). This result indicates that the entrapment procedure has not altered the activity of the enzyme within the polymer film.
85

Cur
rent
(jiA
cm
2) C
urre
nt
(|iA
cm
5. Biosensor Interfaces
5
4
2.5
32.0 -
2
0.5 -
10.0
[Glucose] (mM)0
0 1 2 3 4 5 6 7G lu co se Concentration (mM)
5 20mM20mM
20mM
420mM
20mM3
2mM2 2mMSucrose
2mM2mM
Buffer 2mM2mM1
0
0 500 1000 1500 2000
Time (s)
Figure 5.9: The amperometric response of a PPy/GOx film grown from a solution of 150mM pyrrole and 120(ig ml"1 GOx in 50mM NaCl (pH 4.5). The amperometric response from H2O2 was measured at +0.65V (vs. Ag/AgCI) in lOOmM phosphate buffer (pH 7.4) following additions of either 2 or 20mM glucose at the points marked. The polymer films were grown on RIE cleaned evaporated gold electrodes (area ca. 90mm2). (a) Note the linear response at low glucose concentration (i.e. below 2.5mM), which becomes non-linear at higher concentrations, (b) The original i vs. t response is included to illustrate the good speed of response to glucose additions, and the lack of response to control additions of buffer and 20mM sucrose (same buffer), thus demonstrating the specificity and stability of the biosensor response.
86

5. Biosensor Interfaces
5.3 XPS Analysis
This section concentrates on the XPS analysis of the GOx content in PPy/GOx films. Whilst an
electrochemical assay can provide data on concentration of active enzyme, XPS can provide data
on the total enzyme in the film (es ). The knowledge of e£ would be of particular value in
kinetic analysis of the electrochemical processes occurring at biosensor interfaces. Data is
presented demonstrating how the GOx content can be deconvoluted from the mixed film XPS
spectrum, in a manner similar to used for two non-interacting polymers. This provides a simple
method of apportioning the true e£ vs. PPy ratios in a variety of films grown from solutions of
different enzyme concentrations.
There have been a range of XPS analyses of protein composition and structure,187 189 however,
there has only been a single study which has used XPS for studying the interaction of GOx at a
biosensor interface.190 In that work, the authors correlated the ratios of the amide (C=0)
carbons and the carbohydrate carbon (C-O) environments for GOx adsorbed directly onto bare
gold for different lengths of time (with no polymer present). This information was subsequently
used to infer that the biomolecular interfacial structure was ordered, such that the polypeptide
portion of the enzyme, in contact with the metal, was covered by its carbohydrate shell.
5.3.1 Theory: XPS A nalysis
When a solid sample in a vacuum is irradiated with photons emitted from an X-ray source, the
photon energy (E=hi>) can be absorbed by an electron in an atom of the target. This can result
in the ejection of a photoelectron with energy Ek, as illustrated in figure 5.10. The kinetic
energy of the emitted photoelectron will be conserved provided that it suffers no further
inelastic collisions within the solid. The energy of the emitted photoelectron can be measured to
high precision, and using the energy balance relation of equation 5.1, it is possible to determine
the photoelectron binding energy (Eb) within the solid.
Eb = hu - Ek - 5<J) (5.1)
Where 5<j> represents the contact potential difference between the sample and the spectrometer.
The detector counts the number of photoelectrons at each binding energy. The energy
resolution is usually between 0.1-0.5eV and multiple scans together with signal averaging is
used to improve signal-to-noise ratio (SNR). Particular binding energies provide a fingerprint
associated with specific elements and all elements from the periodic table can be detected
except hydrogen. In addition, Ek is dependent on the chemical environment of the ionised atom,
87

5. Biosensor Interfaces
hence, charge delocalisation associated with specific bonds can also be identified. Depth
profiling is another option available with XPS analysis. This technique can provide information
on the variation of elemental composition up to the maximum depth of 3A. (ca. 8nm using an
AlKa source), where X represents the electron mean free path. The principle of the technique is
illustrated in figure 5.10, where sampled depth (d or d’) varies according to a sine function.
DetectorSource
huX-rayBeam Photoelectrons
Sample
Detector
Figure 5.10: The principle of XPS and its use in the depth profiling of surfaces.
5.3.2 M ethods & M aterials: XPS A nalysis
All spectra were collected using the high resolution Scienta ESCA300 spectrometer located at
RUSTI, Daresbury Laboratories, UK. The rotating anode source provides AlKa radiation
(1486.7eV), which after passing through a monochromator, is focused on the sample. C(ls),
N (ls) and O(ls) spectra of the samples were collected with a take off angle (TOA) of 90°. The
slit width (0.8mm) and the TOA was kept constant for all of the samples measured, to enable
the analysis of the same surface area of polymer, to the same depth. Some of the data
presented has been adjusted for the offset due to the floodgun charging effect on non-conducting
substrates, using the first component of the C(ls) envelope (binding energy=285.0eV) as a
reference.
Polymer films were prepared as described in section 5.1.2, one half of the electrode was used for
the XPS analysis and the other half was used in the electrochemical assay. To minimise
contamination, the films were stored in the growth buffer (50mM NaCl) during transport.
Before analysis, the films were washed in buffer, blown dry and immediately loaded into the
spectrometer. GOx reference films on virgin RIE cleaned evaporated gold were prepared by
spin coating (2000rpm, 30s) a film from a concentrated solution of enzyme (40000|xg ml'1) from
50mM NaCl (pH 4.5)
5.3.2.1 Curve F ittin g M ethodology
Both the raw data and reference spectra data were prepared by first applying a x-axis shift to
compensate for flood-gun charging effects, followed by a linear baseline subtraction. The fitting
88

5. Biosensor Interfaces
of the spectra using the prepared reference PPy and GOx reference spectra was based on a least
squares method. The curve fitting was performed using application routines written within
MATLAB (Mathworks Inc.), which provided the environment for a stand-alone program
incorporating all the necessary data processing functions.
When calculating the sum of the errors (Id2) most weight was given to the high energy region of
the C(ls) spectrum, containing the shake-up (291.OeV) and amide regions, and to the
characteristic PPy N (ls) peak at 398.0eV.171 The low energy side of the C(ls) spectrum,
corresponding to hydrocarbon centres characteristic of contaminants, received a minimal
weighting. The Gaussian weighting function used in the fitting of the PPy/GOx C(ls) spectra is
included in figure 5.16. In order to show that this scheme was valid, the proportion assigned to
GOx or PPy used in the composite spectrum was varied by +1-2% and significantly worse fits
were obtained.
5.3,2.2 E lem en ta l Q u an tifica tion - an exam ple
Elements are distinguishable by their different core electron binding energies. The analysis of
silicone adhesive, a common substrate in biomaterial research,191 provides an excellent example
of the use of XPS for elemental quantification. The experimental spectrum shown in figure 5.11
has five main peaks associated with its elemental composition (C, Si and O). The adhesive
monomer (SiO(CH3)2)* has a simple structure with no major binding energy shifts associated
with different chemical environments. Table 5.1 relates the various ratios of C(ls), Si(2p) and
O(ls), calculated by analysing the relative areas of the strongest elemental peaks, in addition to
adjustments to compensate for detector sensitivity.192 The measured elemental ratios
correspond well to the expected basic ratio of SinOnC2n. This illustrates the method by which
XPS can be used to determine both elemental composition and their relative ratios.
Element Sensitivity Area(counts) [Atom]/% Sample Window (eV)
C(ls) 1.0 10769 48.7 (2n) 286.25-275.15
O(ls) 2.8 16418 26.7 (n) 533.35 - 523.30
Si(2p) 1.0 5394 24.6 (n) 104.15-93.25
Table 5.1: The elemental breakdown of the XPS analysis of silicon adhesive. Comparison of theatom/% ratios suggests a composition ratio of the form SinOnC2n, this is in agreement with expected values.
Examples of quantification for variations in binding energy associated with different chemical
environments are provided later in section 5.3.4.
89

5. Biosensor Interfaces
8
6 -
^ 4 --4—»c3
2 -
01000 800 600 400 200 0
Binding Energy (eV )
Figure 5.11: An XPS spectrum of silicon adhesive (Dow Coming RTV 3145) for a broad range of Binding Energies between 1150 and OeV (1 sweep), TOA=90°, slit width=0.8mm, AlKa source. The C(ls), O(ls) and Si(2p) elemental peaks used for quantification are clearly visible. The inset for the O (Is) peak is an example of a high resolution analysis (10 sweeps) used for quantitative analysis, in addition, it provides an example of the linear background subtraction method used in this study. The known structure of the silicon-based monomer is also shown in inset and the quantification results (see table 5.1) correspond well with the expected SinOnC2n ratio.
5.3.3 R esu lts and D iscussion
This section has been split into three part dealing with each of the specific aspects analysed during
the course of the XPS studies: these are:
1) Surface C ontam ination - the use of XPS to monitor its contribution to recorded
spectra, and also as technique to provide indication of the success in new experimental
procedures developed to minimise its influence on recorded response.
2) G aussian F ittin g T echnique - Although not used for the analysis of the PPy/GOx
spectra in this study, the Gaussian fitting method is one of the standard techniques
used in quantitative XPS. In this study it was used for comparing the C(ls) spectra of
as-grown and over-oxidised PPy as a means of assessing the degree and nature of
polymer oxidation.
80
60 -
40 -
20 -
Oxygen (1s)
■ i , ^Baseline
I I I
C (1s)
0(1 s)
540 535 530 525 520
0(Auger)(H Si(2s)
Si(2p)
A M onom er
T
90

5. Biosensor Interfaces
3) D econvoluted A nalysis T echnique - The analysis of the relative enzyme and
polymer components of a range of PPy/GOx films grown at different solution enzyme
concentrations.
5.3.3.1 C on tam ination
XPS is very surface sensitive and the effects of contamination can have a dramatic affect on the
analytical accuracy of the technique. For example, figure 5.12a clearly demonstrates the effect
of the most pernicious contamination, adsorption of adventitious hydrocarbons. The low C(ls)
signal of the sputter cleaned gold sample is significantly increased by only a momentary
exposure (l-2s) to the atmosphere, while acid-cleaned (cycled in 1M HCIO4) or RO water treated
samples show similar contamination related responses. Sample storage in liquid media and
minimum air-exposure-time were the practical methods adopted to reduce the effects of
contamination
(a) (b)
Au(4p)24 -13 - RO Water
22 -
oE 20 -Electrochemical
Air.
0 (1 s)O 10 -
Sputter
550 500 450 400280 275 270 600290 285Binding Energy (eV) Binding Energy (eV)
Figure 5.12: (a) The C(ls) XPS spectrum of virgin evaporated gold following the use of four different sample cleaning techniques. Various degrees of adventicious hydrocarbon contamination (spectra not compensated for sample charging) are responsible for the recorded spectra. It is apparent that spectra are very sensitive to such contamination and any exposure to the ambient laboratory environment, even for a few seconds, is likely to produce such a signal. The sputter cleaned sample maintained at a pressure of <10'5Torr is the only sample that shows little contamination signal above the background response, (b) The fingerprint of Sn contamination on a thiol treated evaporated gold sample cleaned using RIE etching with an un-encapsulated bonding wire.
A further source of contamination was highlighted by XPS and forced the modification of the
experimental procedure. Figure 5.12b also presents the spectrum of an absorbed thiol
monolayer on gold, the O and Au signals are as expected, however, the two peaks at 491eV and
483eV were both unexpected. These elemental peaks were eventually identified as tin, the
source being metal sputtered from the contact wires during the Reactive Ion Etch (RIE)
91

5. Biosensor Interfaces
cleaning of the bare gold electrodes. This instance was both useful in improving experimental
technique and served as an excellent illustration of the surface sensitivity of XPS spectroscopy.
Subsequently, the wires used to connect the electrodes were sheathed in glass capillary, the
glass being resistant to the rigours of the RIE cleaning procedure.
5.3.4 G aussian F ittin g T echnique
Quantification in XPS is routinely performed by deconvolving the data spectrum into a
combination Gaussian or Voigt shaped peaks associated with individual bond moieties within
the sample.193 This option was not used in the analysis of the PPy/GOx films for two reasons.
Firstly, GOx is composed of 583 amino acids of 21 different types, providing a wide variety of
atomic environments whose deconvolution into individual peaks would prove an unreasonably
difficult task, prone to error. Secondly, such a deconvolution approach would detract from the
overall simplicity of this method of analysis of the biosensor composition.
However, the Gaussian deconvolution technique was found useful in some initial studies on PPy
only films, comparing the spectra of as-grown and over-oxidised PPy. Although the
electrochemical analysis was performed on PPy-oox/GOx films, it was better to perform the XPS
analysis on PPy+ films. A key amide marker point in the GOx occurred at close to the same
binding energy as the C=0 peak (288.2eV) prominent in the Carbon(ls) spectrum of PPy-oox, its
use would have made the fitting procedure less precise.
The characterisation and mechanism of PPy over-oxidation has been a topic of intensive
study.182-194 In addition, its potential as a permiselective biosensor interface has received much
recent attention.183-195 The general conclusions from the literature are that the over-oxidation
process is based on the formation of carbonyl pendant groups along the conducting polymer
backbone. The over-oxidation process results in a dramatic decrease in film conductivity and
expulsion of counterions. The changes in polymer morphology and the charged pendant groups
are believed to be give PPy-oox its permiselective properties. Use of XPS and FTIR for accurate
elemental analysis of PPy-oox has proved problematic due to the complex mechanism by which
oxygen is incorporated into the film, and its dependence on the size and charge of the
counterion.196
This aspect of the study focused on the differences between the Carbon(ls) spectrum of PPy+
and PPy-oox. The quantification procedure was initiated by a second derivative analysis of
C(ls) spectrum to assign initial peak positions. Peaks of fixed width197 were introduced one at a
time until a good fit was obtained. At this point, the constraints on peak widths were relaxed to
produce the final fit. The results suggest the existence of six peaks, the suspected sources of
these peaks and associated quantification results are illustrated in figure 5.13.
92

Area
(%
) Co
unts
C
ount
s
5. Biosensor Interfaces
Peak Positions (eV)1 = 283.72 = 284.53 = 285.64 = 287.35 = 288.96 = 290.2
292 2 9 0 288 286 28 4 282
Peak Positions (eV)As Above
I I I , . . . . . . . . . . . . . . . . . . . . . . . . . . . . . . . . . . . . . . . . . . . . . . . . . . . . .
292 290 288 286 284
Binding Energy (eV)
PPy-O x
1 2 3 4 5 6
Peak Number
282
DefectiveBranching
Peak Assignment1: Cpp . p . pe— ^contam ination
3: C -0 + C =N + C N + + C 4: C = 0 + C = N +5: C O O H + C O O '6: Shakeup
Defective
Figure 5.13: The Gaussian deconvolution fitting technique as applied to the analysis of the C (ls) spectrum ofas-grown (a) and over-oxidised (b) PPy samples. The samples contained no enzyme component and were prepared as described in section 5.1.2, spectra were recorded at a TOA=90° and slit width=0.8mm using an AlKa source. Gaussian peak positions are the same for both spectra, peak assignments and comparative areas apply to the specified chemical groupings. The structural diagram o f PPy highlights the J3 site, suspected as being the location of any defective branching during polymerisation.
93

5. Biosensor Interfaces
There are three factors apparent from the comparison of peak areas. Firstly, the doubling in
peak area 4, primarily related to the increase in C=0 species in the PPy-oox. Secondly, the
greater decrease in the area ratio of peak area 1 to 2, indicates that the over-oxidation
mechanism is more likely to occur at the Cp location in preference to Ca. location (see the
structure diagram in figure 5.13). Thirdly, the size and similarity of the magnitudes of peak
area 3 in both films, suggests that a significant contribution to this particular peak area is due
to defective branching during polymerisation at the p-carbon position instead of the
characteristic a-carbon position. If the area of peak 3 was solely a reflection of the contribution
of C-O, C=N and CN+ groups to the Carbon(ls) signal, it should have been of a lower relative
magnitude to peaks 1 & 2 and should show a more substantial increase due to the addition of
oxidation products following over-oxidation.
These results agree in some part with the analysis of Palmisano et a/.183 who observed a similar
but more dramatic decrease in the Cp content of the over-oxidised PPy but a broader increase in
a range of oxidation products such as C-O, COOH and COO". The difference is most likely to be
associated with their use of alternative over-oxidation procedure. That is, the slow
over-oxidation at 0.7V for five hours, in comparison to rapid over-oxidation by repeated scanned
potential of up to 1.2V used in this study. The appearance of a large number of defective
branching sites within the polymer matrix agrees with the work of Pfluger et oZ.,171>198 where
they ascribe the defective sites to the locations of cross-linking and bending in the polymer
chains.
Further work on the analysis of the differences between the two types of film was not performed
due to limited access time to the XPS spectrometer at Daresbury. However, it is hoped that this
section has provided an example of where XPS can be used to provided insight into both the
elemental and chemical structure of biosensor interfaces.
5.3.4.1.1 Deconvoluted Analysis Technique
In the analysis of the XPS results, the PPy/GOx films were modelled as non-interacting co
polymers, where the two constituent components were the enzyme and the polymer. To
illustrate these differences, figure 5.14 shows the C(ls), N (ls) and O(ls) XPS reference spectra
for a thick film of GOx and PPy on evaporated gold, the spectrum of a GOx/PPy (420pg ml'1)
film is included for comparison. It was found that fit results based on spectra obtained using
spin coated GOx reference films were highly reproducible, in contrast to those obtained from
GOx physisorbed onto clean gold substrates. The latter spectra, although broadly similar in
character, show surface contamination, particularly in the hydrocarbon region of the C(ls)
spectrum (285eV).
94

5. Biosensor Interfaces
Carbon (1s)12 - G O D /P P y Mix
— PPy only
G O D only
COoxCOc
oO
295 290 285 280Binding Energy (eV)
Key as above Nitrogen (1s)
T V (b)■ / \ '
7 / u
c o ~
8 -
o1—X , 6 -
CO+-■cZ3 4 -o
O
2 -
404 402 400 398 396Binding Energy (eV)
20
Oxygen (1s)Key as above
1 5 -CO
o
CO 1 0 -
540 535 530 525Binding Energy (eV)
Figure 5.14: The C(ls) (a), N(ls) (b), and Oxygen(ls) (c) XPS spectra of the reference PPy and GOx films used in the deconvoluted analysis technique, the spectrum for a 420|ig ml' 1 PPy/GOx film are included for comparison. All films were prepared on RIE cleaned evaporated gold, the PPy and PPy/GOx films were grown as described in section 5.1.2, the GOx film was prepared by spin coating (2000rpm, 30s) a film of concentrated enzyme solution (40000pg m l1). Spectra were recorded at a TOA=90° and slit width=0.8mm using an AlKa source.
95
5. Biosensor Interfaces
Comparison of the spectra in figure 5.14 suggests that the C(ls), N (ls) and O(ls) spectral
components of the biosensor film may be deconvoluted into a linear combination of both GOx
and PPy spectra. This provides a technique for estimating the composition and surface
coverage of GOx in the polymer based biosensor. The simple apportionment of the C(ls)
spectrum is aided by the characteristic amide peaks in the C(ls) spectrum of GOx at 288.2eV
and 286.4eV, corresponding to the C=0 (carbonyl) and N-C-CO- groups respectively. These
groups are mostly absent in the C(ls) spectrum of carefully grown PPy films. However, it was
noted that if the polymer film was prepared by oxidation at potentials greater than 0.8V vs.
SCE in aqueous solution, then the spectrum showed evidence of CO or COOH moieties
associated with over-oxidation of the PPy (see section 5.1).
Other valuable spectroscopic markers in reference spectra that were helpful for deconvoluting
the spectra of the biosensor films include:
1. The high energy tail of the C(ls) spectrum, which corresponds to the shake-up region
associated with aromatic hydrocarbons.
2. The small peak in the N(ls) spectrum at 398.OeV, which is related to charged
nitrogen species in the PPy,171 and is completely absent in the GOx spectrum.
3. The O(ls) peak at 531.7eV primarily associated with additional signal from
entrapped GOx.
These spectroscopic markers along with their variation in a range of PPy/GOx films used in this
study are shown in figure 5.15.
5.3.4.1.2 Data Analysis and Discussion
Figure 5.16 shows an example fit result for the C(ls) spectrum of the PPy/GOx biosensor film
prepared from a solution containing 120pg ml'1 enzyme. Both the weighted and un-weighted fit
are shown, and it can be seen how the weighting provides a better fit to the two amide peaks
and the shake-up region. Furthermore, the reduced magnitude of the fit spectrum at 285.OeV
suggests that the weighted fit is a superior fit with relation to hydrocarbon contamination,
while not significantly altering the overall shape of the spectrum. Figure 5.16 also provides
similar examples of the fit curves for the N (ls) and O(ls) spectra of the same 120^ig ml'1
PPy/GOx film.
A summary of the respective C(ls), N(ls) and O(ls) fit parameters of all the films analysed in
this study are given in Table 5.2.
96

5. Biosensor Interfaces
16
12 -
o
c/)cZ3oO
4 -
6 |ag ml"
12 |ag ml'1
30 jag ml"1
120 |ag ml"
240 |ag ml"
420 jag ml"
Carbon (1s) (a)
6 ug ml
420 ug ml
420 ug mT1
420 ug ml'1 6 ug ml
6 ug ml'1
295 290 285Binding Energy (eV)
280
o
t/>c3oO
10
Nitrogen (1s)Key as above
8
6420 ug ml
4
2420 ug ml'
404 402 400 398 396Binding Energy (eV)
420 ug ml
Oxygen (1s)Key as above12 -
COo
</>"c=3oO
540 535 530 525Binding Energy (eV)
Figure 5.15: The C(ls) (a), N(ls) (b), and O(ls) (c) XPS spectra of PPy/GOx films grown from a range of solution enzyme concentrations (6-420pg m l'). Films were prepared as described in section 5.1.2, spectra were recorded at a TOA=90° and slit width=0.8mm using an AlKa source. Note the variation of the key markers (arrows) used in the fitting procedure and their change with increased enzyme concentration.
97
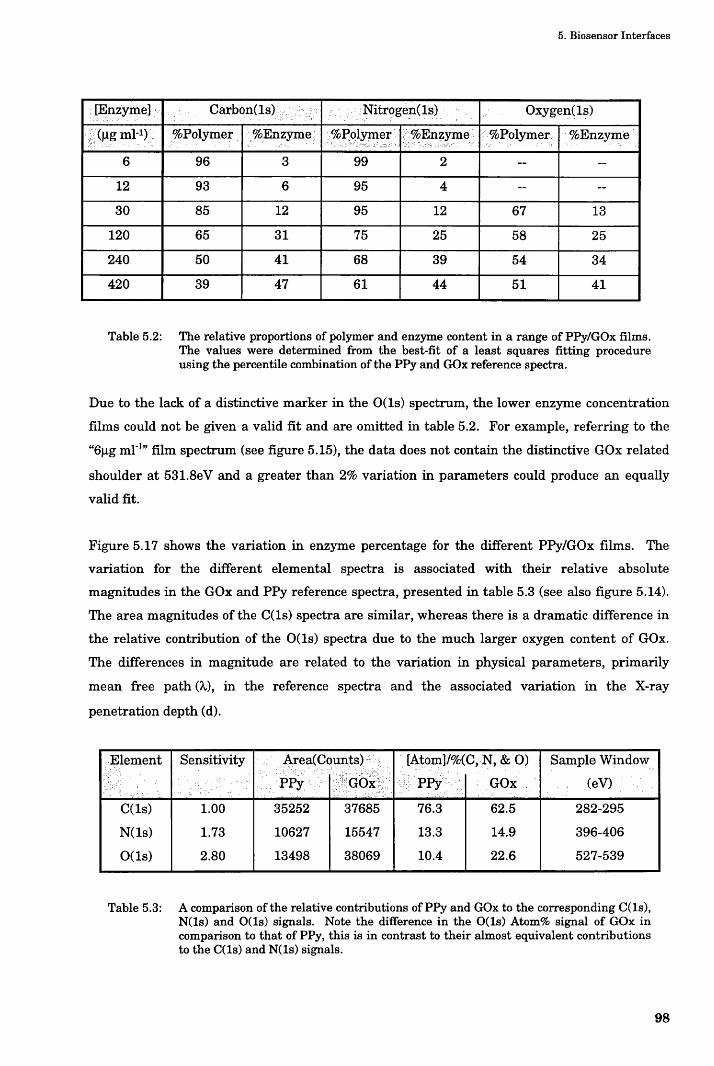
5. Biosensor Interfaces
[Enzyme] Carbon(ls) Nitrogen(ls) Oxygen(ls)
|<pg m l1) %Polymer %Enzyme %Polymer %Enzyme %Polymer %Enzyme
6 96 3 99 2 -- -
12 93 6 95 4 - -
30 85 12 95 12 67 13
120 65 31 75 25 58 25
240 50 41 68 39 54 34
420 39 47 61 44 51 41
Table 5.2: The relative proportions of polymer and enzyme content in a range of PPy/GOx films.The values were determined from the best-fit of a least squares fitting procedure using the percentile combination of the PPy and GOx reference spectra.
Due to the lack of a distinctive marker in the O(ls) spectrum, the lower enzyme concentration
films could not be given a valid fit and are omitted in table 5.2. For example, referring to the
“6|ig ml'1” film spectrum (see figure 5.15), the data does not contain the distinctive GOx related
shoulder at 531.8eV and a greater than 2% variation in parameters could produce an equally
valid fit.
Figure 5.17 shows the variation in enzyme percentage for the different PPy/GOx films. The
variation for the different elemental spectra is associated with their relative absolute
magnitudes in the GOx and PPy reference spectra, presented in table 5.3 (see also figure 5.14).
The area magnitudes of the C(ls) spectra are similar, whereas there is a dramatic difference in
the relative contribution of the O(ls) spectra due to the much larger oxygen content of GOx.
The differences in magnitude are related to the variation in physical parameters, primarily
mean free path (X), in the reference spectra and the associated variation in the X-ray
penetration depth (d).
Element Sensitivity Area(Counts) [Atom]/%(C, N, & O) Sample Window
PPy GOx % 'p p f r : , GOx : (eV)
C(ls) 1.00 35252 37685 76.3 62.5 282-295
N(ls) 1.73 10627 15547 13.3 14.9 396-406
O(ls) 2.80 13498 38069 10.4 22.6 527-539
Table 5.3: A comparison of the relative contributions of PPy and GOx to the corresponding C(ls),N(ls) and O(ls) signals. Note the difference in the O(ls) Atom% signal of GOx in comparison to that of PPy, this is in contrast to their almost equivalent contributions to the C(ls) and N(ls) signals.
98

5. Biosensor Interfaces
10 - Data
Weighted Fit
Un-Weigthed Fit
Weighting Function
COO
292 290 288 286 284 282Binding Energy (eV)
o
</>c3oO
7
DataFit
6
5o
4
3
2
1
0404 402 400 398 396
7
Data6
5
4
3
2
1
0528 526 524532 530
Binding Energy (eV) Binding Energy (eV)
Figure 5.16: A comparison of the C(ls) (a), N(ls) (b), and 0 (ls ) (c) data and fitted XPS spectra for a 120pg m l1 PPy/GOx film. The film was prepared as described in section 5.1.2, spectra were recorded at a TOA=90° and slit width=0.8mm using an AlKa source. The C(ls) spectrum (a) includes an illustration of the weighting function used in the fitting procedure. Note the better fit to the amide markers (288.2eV and 286.4eV) provided by the weighted fit in comparison to that of the unweighted fit.
99

5. Biosensor Interfaces
Comparison of the two reference spectra suggests that the penetration depth in GOx is greater
than in PPy. Hence, the measured elemental contributions would be biased towards any signal
from the enzyme. This bias would be magnified by any differences in absolute area magnitudes
between the PPy and GOx reference spectra, the O(ls) spectrum would be the worst case in this
instance. For this assessment, the equivalent areas, in addition to the greater number of
marker points available, suggests that the fit of the C(ls) spectrum in the most reliable.
Further work is required to account for the variation of penetration depth with enzyme
concentration. This would add a third parameter into the above fitting mechanism that could
potentially improve the accuracy of using this technique for the estimation of ez .. Furthermore,
the effects of path length variations go some way to explaining why the total percentages in
table 5.2 (i.e. polymer + enzyme) do not always add up to 100%.
Finally, a degree of empirical analysis can be performed on the XPS data. It is apparent that a
linear variation in enzyme concentration will not produce a linear variation in enzyme content
within the film. As an illustration, consider the comparison of the fit data for the C(ls)
spectrum of the 420fig ml'1 and the 30pg ml'1 PPy/GOx films. The results (table 5.2) indicate
that the surface concentration of the 420[ig ml'1 film is 47%, and the 5[ig ml'1 film corresponds to
12%, of that in the spun cast film of GOx.
Given the diameter of GOx to be ca. lOnm,199 then this would suggest that the surface coverage
of enzyme within the 420|ig ml'1 polymer film is ca. 7.8xl0'13mol cm'2 and 2.0xl0'13mol cm 2 in
the 30fig m l1 film. Although this method of estimating the amount of GOx at the surface may
seem to be crude, the value which we use for coverage in the spun GOx film (1.66x10 12mol cm-2)
corresponds very closely to that experimentally obtained.200 Interestingly, whilst the
concentration of GOx in the deposition solution was decreased 14 fold between the 420^-g ml'1
and 30|xg ml"1 films, there was only a concomitant 4 fold decrease in the enzyme composition
within the biosensor films.
100

5. Biosensor Interfaces
--a.A40
—o— Carbon (1s)
—o~ Nitrogen (1s)
- - a - Oxygen (1s)
a>En 20
LU
0 50 100 150 200 250 300 350 400 450Enzyme Concentration (|ng ml'1)
Figure 5.17: A comparison of the XPS derived enzyme content within the film vs. enzyme concentration in the polymerisation solution. Solution enzyme concentration was varied between 6-420pg ml'1 and the films were prepared as described in section 5.1.2. Note the similar non-linear variation of C, N and O data in enzyme concentration between biosensor film and growth solution.
5.4 FTIR Analysis
FTIR was the third analytical technique used in this study to investigate the loading of GOx in
the PPy biosensor films. Whereas XPS is a surface analysis technique providing data primarily
on elemental composition, FTIR is a bulk analysis technique providing data primarily on
molecular bond composition. Both techniques, when used in conjunction with the
electrochemical analysis of active GOx, provide a comprehensive picture of the concentration
and activity of GOx within the PPy matrix
5.4.1 Theory: FTIR A nalysis
Chemical bonds undergo a variety of perpetual movements such as stretching, twisting and
rotating. The energy of most molecular vibrations corresponds to that of the infrared (IR)
region of the electromagnetic spectrum. IR spectroscopy is sensitive to the vibrations that lead
to changes of dipole moment within molecule.
A gas phase species has 3N degrees of freedom corresponding to three degrees of kinetic
freedom, where N represents the number of atoms in the species. For a non-linear molecule, six
of these vibration modes can be discounted, for they represent purely translational and
101

5. Biosensor Interfaces
rotational motions (three of each). This leaves a possible 3N-6 modes of vibration, or 3N-5 for a
linear molecule where the rotational mode along its molecular axis cannot occur. As an
illustration, consider a water molecule, it will have three fundamental modes of vibration and
these are shown in figure 5.18.
IR spectroscopy relies on the fact that if a rotation or vibration gives rise to a change in dipole,
the electromagnetic radiation can interact with this dipole through a resonance process.
Resonance with incoming radiation results in an absorbance of radiation, usually recorded as a
percentage transmission. In an attempt to avoid the high frequencies (typically 1012-1014Hz)
associated with molecular absorptions, IR spectrum absorbances are recorded relative to the
associated wavenumber in the units of cm'1.
SYMMETRIC ASYMMETRICSTRETCH f STRETCH(3652 cm'1) (3756 cm'1)/ \W . BEND
(1595 cm'1)
Figure 5.18: The three fundamental modes of vibration for a water molecule and their corresponding absorption wavenumber.
The advent of computerised Fourier-transform spectroscopy has led to many improvements to
the original techniques of IR spectroscopy. In comparison to the dispersive IR apparatus and
the stepwise collection of data, interferometric techniques permit data from the entire spectrum
to be recorded simultaneously. Advantages offered by the FTIR technique include: improved
resolution, sensitivity and frequency accuracy.167-201 Practically, these are observed in the
reduced experimentation time and improved SNR.
A larger molecule, such as a protein, will have many more modes of vibration than the simple
water molecule shown above. Fortunately, however, many of the vibrations can be localised to
specific bonds or groups. Characteristic groups of interest when analysing proteins include
C=0, -COOH, C00-, O-H and S-H. Protein analysis using FTIR tends to concentrate on the
modes associated with the groups of the peptide bond.202 204 These can be grouped into three
bands the amide I, II and III. The amide I (IGOO-lTOOcm'1) band is principally associated with
the vibration of peptide C=0 group. The amide II (1400-1500cm1) band is primarily N-H
bending with a contribution from C-N stretching vibrations. The amide III (1200-1300cm'1)
band is very weak in the vibrational IR, arising from N-H bending. The incidence of these
102

5. Biosensor Interfaces
amide bands in GOx (experimental data) is shown in figure 5.19. The amide peak positions
correspond well with those observed by Fiol et al.205 during their FTIR analysis of behenic
acid/GOx Langmuir-Blodgett films.
25amide I
20
COOX
amide0occtiJD1—
amide III
1400 12001700 1600 1500 1300
Wavenumber (cm'1)
Figure 5.19: The FTIR spectrum of GOx physisorbed onto an RIE cleaned evaporated gold from a solution of 40000pg ml'1 enzyme in 50mM NaCl. Note the characteristic amide I, II and III regions in the spectrum associated with peptide bond absorptions within the enzyme.
The majority of FTIR research in related fields has investigated polymers and proteins
separately. FTIR is used as a standard technique in polymer analysis,206-207 and with particular
relevance to this study, has been used as a means of in-situ analysis of conducting polymer
growth mechanisms.28-194 The use of FTIR in protein analysis has received much attention in
the past ten years, primarily as a means of protein secondary structure analysis.208 210 To a
lesser degree, it is being used as a method of quantifying protein absorption rates.211 There is
little work on the simultaneous analysis of both polymers and protein constituents, although
FTIR has found a role in biomaterial research as a means of analysing the nature and speed of
protein fouling of implant materials.212 In this study, the variation in magnitude of the amide
bands in the various ratio PPy/GOx film were compared to the individual component spectra.
Deconvolution of the mixed spectra provided a means of quantifying the relative amounts of
enzyme in each film.
103

5. Biosensor Interfaces
5.4.2 M ethods & M aterials: FTIR A nalysis
The films were grown as described in section 5.1. Exactly the same PPy/GOx films were used in
the FTIR experiments has been used in the XPS analysis described earlier (see section 5.3).
Following the removal of the film from the XPS spectrometer, the films were immediately
stored in a sealed container. Control experiments were performed to ensure that the XPS
analysis resulted in no significant damage or encouraged degradation processes in the polymer
films.212
The FTIR experiments were conducted within 48 hours of the films being analysed by XPS. A
Bomem MB-102 FTIR spectrometer with a mercury cadmium telluride (MCT) detector was used
to collect the spectra. The spectrometer was used in grazing-incident reflectance (GIR)213>214
mode using p-polarised light at an incident angle of 80°. Spectra were recorded at 4cm'1
resolution with an iris aperture of 8mm. The data was processed and analysed using a PC-AT
computer running Bomem-Easy (v. 1.41) software. A reference spectrum from RIE cleaned
evaporated gold was collected for each sample to minimise the possible errors from contaminant
(particularly water) adsorption. The data was initially recorded as transmission spectra and
then numerically converted into absorption values.
In addition to the spectrum of ‘spun GOx’ used in the XPS analysis (see section 5.3.2), a
physisorbed enzyme spectrum was also collected. The spun GOx sample was too thick (ca. 1pm)
and provided a poor definition spectrum, due to its low transmission. The physisorbed
spectrum was used for comparative work since it provided greater peak accuracy and
resolution. The spectrum (see figure 5.19) was recorded from the enzyme physisorbed onto RIE
cleaned evaporated gold that had been coated with GOx (40000pg ml'1) from 50mM NaCl buffer,
left to absorb for 30 minutes, and then washed in buffer and blown dry with nitrogen.
5.4.3 R esu lts and D iscussion
For the reasons highlighted earlier (section 5.4.1), it was decided to analyse the enzyme loading
in the sensor films by focusing on the changes in the amide component of the films. Figure 5.20
shows the raw FTIR transmission data obtained for a range of these films as well as the
spectrum for PPy alone. It is apparent that the enzyme containing films have additional
absorbances corresponding to amide I and II bands. However, the amide III band is both weak
(as expected) and concealed by the more dominant PPy absorptions in the range 1200-I300cm"1.
These absorptions have been previously assigned to ring and C-N stretches in PPy.194
104

5. Biosensor Interfaces
420 |ng ml
120 jag ml
EwcCOI -
30 jxg ml
PPy Only
2000 1800 1600 1400 1200 1000Wavenumber (cm'1)
Figure 5.20: The raw FTIR transmission data covering the range of PPy/GOx films used in this study, the spectrum of solely PPy is included for comparison. Spectra were recorded using GIR FTIR on films prepared on gold substrates at an incident angle of 80°, further details on sample preparation and data acquisition are provided in sections 5.1.2 and 5.4.2, respectively. Note the reducing transmission at the amide I (1600- 1700cm'1) and II (1400-1500cm'1) markers bands in films grown at increasing solution enzyme concentration.
To compare the relative amide absorptions, a degree of data processing was performed in three
steps. The first step was data normalisation for all the transmission spectra at a non-energy-
absorbing point - 2000cm'1 was chosen as a suitable wavenumber. The second step involved
conversion of the spectra into the standard representation as logarithmic absorption values.
The third and final step was the data fitting of the PPy/GOx film spectra using the separate
reference spectra. This analysis produced a relative ratio of GOx component vs. PPy component
absorption in the sensor films
The above data processing is similar to the baseline correction procedures used in many
analytical techniques and used in quantitative FTIR.215 For example, in protein absorption
analysis, the background substrate signal is recorded first, and then subtracted from the
combined signal once the protein has been absorbed to the substrate. The final absorption can
thus be assigned to the protein and is called a ‘difference spectrum’.
105

5. Biosensor Interfaces
A similar procedure could be used for the analysis of PPy/GOx films, for instance, by treating
the PPy signal as the background signal. Unfortunately, this approach is not satisfactory since
the PPy component of the PPy/GOx films is a not constant and will vary with polymer
thickness, surface roughness and density differences in the sensor films. Taking these
differences into consideration, a direct film by film comparison of enzyme concentration could
not be made. However, using the data fitting technique similar to that used in the XPS analysis
(see section 5.3.2.1), a ratio of GOx/PPy content in each film could be determined that would
provide a guide to the relative enzyme component in each film.
A full mathematical treatment of this data fitting procedure is given in appendix B. In
summary, the ratio required for the best fit spectrum was determined by the division of the
relative proportion of the reference GOx spectrum vs. the relative proportion of the reference
PPy reference spectrum. The value of the ratio is an indicator of the relative GOx/PPy
component in each film. This fitting procedure is illustrated in figure 5.21 for the 240jig ml'1
film and the numeric data is shown in table 5.4.
7 0
6 0
5 0 Fit spec trumCOOi—X
4 00Oc(0
_Q 3 0 o wJQ < 20
PPy/G O x spec trum
PPy com ponen t
GOx com ponen t
1 8 0 0 1 7 0 0 1 6 0 0 1 5 0 0 1 4 0 0 1 3 0 0 1200
Wavenumber (cm*1)
Figure 5.21: An illustration of the fitting procedure for the 240pg ml'1 film. The figure includes the experimental data, the fit spectrum, and the individual components of the GOx and PPy reference spectra.
106

5. Biosensor Interfaces
[Enzyme] Normalisation Data Fitting Results
/pg ml"1 Factor GOx component PPy component GOx/PPy ratio
6 0.97
12 1.02 -.-
30 0.96 0.31 0.99 0.31
120 0.87 0.81 0.88 0.92
240 0.97 1.10 0.83 1.33
420 1.19 1.40 0.79 1.77
PPy ref. 0.90 0.0 1.0 -.-
GOx ref. 1.06 1.0 0.0
Table 5.4: The data fitting results for the FTIR analysis of the PPy/GOx films. The increasingGOx/PPy ratio reflects the increasing enzyme content in the sensor films. The variation of the ratio with solution enzyme concentration is illustrated in figure 5.22.
There is a clear non-linear variation between enzyme concentration in the preparation solution
and bulk enzyme concentration within the film (see figure 5.22). However, unlike the XPS
analysis (see section 5.3.3), a comparison of enzyme content in each of sensor films is more
difficult as the technique does not provide a direct measure of the GOx or PPy content. Only
the GOx/PPy ratio can be determined, so providing an indicator of the relative enzyme
composition of each film.
OCO
£Z0C0CL
1 1 - 0 -0 >CL
1 ° - 5 "o0
0.00 100 200 300 400
Enzyme Concentration (jig ml'1)
Figure 5.22: A comparison of the GIR FTIR derived GOx/PPy ratio within the film vs. enzyme concentration in the polymerisation solution. Further details on sample preparation and data acquisition are provided in sections 5.1.2 and 5.4.2 , respectively. Note the non-linear variation of enzyme concentration within the sensor film with increasing enzyme concentration in the polymerisation solution.
107

5. Biosensor Interfaces
Satisfactory data analysis on the low enzyme concentration films was not possible since a
greater than +/-2% variation in PPy or GOx components produced equally valid fits. The fitting
of the higher enzyme concentration films focused on the region between 1400-1800cm1, the
region that included the distinctive enzyme amide I and II bands not apparent in PPy only
films. The removal of the non-linear MCT detector function would undoubtedly aid the analysis
process. It has also been suggested that the collection and analysis of a s-polarised light
spectrum could be used to eliminated the non-linear background.201 Unlike the p-polarised
radiation used in this study, s-polarised radiation would not be absorbed by the film, the signal
providing data solely on the reflective properties of the sample.
Increasing the SNR of the recorded signal would also improve the sensitivity of the analysis
technique. A common method of improving SNR used in IR protein studies is attenuated total
reflection (ATR) FTIR, which uses the accumulation of response from multiple reflections to
significantly improve the SNR. Unfortunately, the technique is not easily applicable to
conducting polymer studies due the need for a transmitting non-metallic substrate. Further
studies are recommended to concentrate on improving the experimental technique and reducing
experimental error. For example, theoretical work has demonstrated that SNR is dependent on
grazing angle, substrate metal and accurate focusing of the IR beam.213 In addition,
experimental apparatus to maintain a fixed path length would reduce any errors associated
with the normalisation procedure. A larger sample size would also be an advantage in reducing
alignment errors. Measurements in an evacuated inert atmosphere would reduce the effect of
contaminate absorptions, to this end, a glove box to enclose the sample chamber is under
construction.
For reducing experimental errors, the control of film morphology is the chief concern. For each
film, the nature of the nucleated PPy growth mechanism169 makes the film thickness and
topography dependent on both current density and chemical conditions.158-216 As a result, films
can become thicker at the electrode edges due to field non-uniformity, and rougher as
increasing enzyme concentrations foul/block the polymerisation electrochemistry.175 Edge
effects could be reduced by enclosing the electrode edges in an inert compound such as silicone
rubber. Whilst novel methods of growing “smoother” PPy by the use thiol-pyrrole monolayers217
provide interesting pathways for further research. Finally, apart from the minimisation of
experimental errors, a greater depth of mathematical analysis to compensate for the errors
associated with Specular/Fresnel reflection (i.e. Krammers-Kronnig correction218) and diffuse
reflection (i.e. Kubelka-Monk correction201) are likely to prove worthwhile.
108

5. Biosensor Interfaces
5.5 Summary
While XPS has been used to study the interaction of biological molecules at bare and at polymer
surfaces, the result of a literature search suggests that this is the first time that it has been
used to investigate the interaction between entrapped proteins and polymers at a biosensor
interface. The use of a parallel electrochemical assays to determine active enzyme
concentration and FTIR analysis of the enzyme concentration in the bulk of the film provides
further corroborative evidence to the major conclusion of this study - that the concentration of
enzyme in the polymerisation solution is a poor guide to the concentration of enzyme entrapped
in the polymer matrix.
All three techniques demonstrated a similar non-linear variation of enzyme concentration, and
a comparison of the results is shown in figure 5.23. Other studies have observed similar
variations in enzyme concentration,166*173 based solely on electrochemical assay results, but have
either failed to fully address the issue or have explained the non-linear response in terms of
diffusion limitation within the biosensor film. It is hoped that this study has provided
conclusive evidence that any assumptions made regarding the enzyme content of PPy/GOx
biosensor films and solution enzyme concentration should be treated with great caution.
100 -
o 80 w c oo 6 0 - ccT303CO
40 -
or
E/C Assay
- a — XPS0)£oz
20 -
50 100 150 200 250 300 350 400 4500Solution Enzyme Concentration (pg ml'1)
Figure 5.23: A comparison of the non-linear variations of the measured enzyme concentration within the PPy/GOx films vs. the variation of enzyme concentration (6-420pg m l1) in the polymerisation solution for the three analysis techniques used in this study. The y axis values have been normalised to the response of the highest enzyme concentration (420pg ml'1).
109

5. Biosensor Interfaces
The results from this study provides significant scope for further similar work on biosensor
interfaces, both on alternative polymer/enzyme systems and in terms of improving the accuracy
of the current methods. For example, the use of this methodology is currently under
investigation as a means of analysing enzyme content in poly(o-phenylenediamine)/GOx films.
Whilst, further investigation into the characterisation of PPy/GOx films and reduction of noise
in the FTIR spectra provide two clear examples of areas where any improvements would benefit
the accuracy of this analysis methodology.
110

6. Conclusion
6. Conclusion
This project has explored a variety of aspects within biosensor technology. Initially, the issues
of biosensor fabrication were investigated, and in the later stages, the work progressed towards
the issues of biosensor sensitisation and characterisation. The investigation of the phenomenon
of dielectrophoresis to position cells for electrochemical analysis provided an opportunity to
explore the dual function of the two markedly different techniques. It was disappointing tha t
the detection of the superoxide release from single cells was hindered by factors such as
insulator adhesion and the preparation of an effective electrochemical surface. However, the
three components of the superoxide sensor (dielectrophoretic particle positioning,
electrochemical superoxide assay, and microfabrication) were successfully demonstrated in
their own right, the difficulties only becoming apparent when the components were combined.
The techniques of photolithography and e-beam lithography for biosensor fabrication were
developed during the project. The problem of poor sensor reliability due to poor adhesion was
identified and methods are suggested for overcoming this problem. For example, the use of a
titanium ‘overlayer’ to improve metal to insulator adhesion presents significant promise for
future work. Fabrication of ‘gold-only’ structures using MPS as an adhesion promoter will
perm it the elimination of interfering currents caused by the diffusion of underlayer m etals (e.g.
Ti or Cr) into gold working electrodes. The success of this fabrication protocol using photoresist
treated substrates makes the procedure even more inviting for use in biosensor fabrication
An unachieved goal of the project was the development of an effective procedure for the
covalent immobilisation cytochrome c on a microfabricated electrode for superoxide detection.
The procedure was successful for macro-sized electrode prepared using standard polishing
techniques. Unfortunately, these techniques are not feasible for planar microfabricated
biosensors. However, the effectiveness of the Ar/02 RIE cleaning protocol, developed during the
project, was demonstrated as an alternative preparation procedure for the observation of
solution-phase cytochrome c electrochemistry. Furthermore, the cleaning protocol proved
invaluable during the preparation of clean gold surfaces necessary for the uniform
electopolymerisation of pyrrole in the work on PPy/GOx biosensor interfaces.
The use of dielectrophoresis for particle positioning and manipulation proved very successful.
Electrode designs and experimental procedures for confining a range of particles were
developed and tested. This work was able to integrate effectively with the sensing procedures,
111
6. Conclusion
not only as a means of particle positioning but also as a method for detecting the physical
processes that occur following the chemotactic stimulation of human neutrophils. The
electrorotation experiments highlighted physical changes occurring within the cell wall and
cytoplasm. Potential mechanisms were identified and modelled in terms of the changing
electrical parameters of the cellular elements. The choice of neutrophils for the electrorotation
work presented a unique opportunity to observe the dynamic physical changes (over a period of
ca. 30 min) within the cell and their rapid variation upon activation. Related work in this field
has only focused on longer term effects, such as the chemically induced differentiation of breast
cancer cells over a period of days.152
Finally, following the work on the analysis of biosensor interfaces, a successful procedure has
been developed for the analysis of enzyme content entrapped within biosensor films. The use of
the three analytical techniques (amperometry, XPS and FTIR) provided comparable results -
each demonstrating the non-linear relationship between enzyme concentration in solution and
its concentration within the polymerised film. This technique has applications in other fields of
biotechnology, for example, the characterisation of biomaterials for medical implantation.219’220
6.1 Recommendations for Future Work
Solving the problems of insulator adhesion would be of immense benefit in the future
development of reliable biosensors. When successful, complex structures such as the Y-
electrode fabricated for TWD will have the opportunity to be fully tested in aqueous solution.
The most promising method of tackling this issue is the proposed use of a combination of first
anisotropic dry etching to define the insulator pattern, followed by a brief isotropic wet etch to
eliminate the possibility of etch residue deposition. If successful, this method would provide a
clear way forward for the fabrication of a range of novel microelectrode structures.
The work on biosensor interfaces has demonstrated the application of parallel amperometric,
XPS and FTIR techniques to the characterisation of biosensor interfaces. Whilst the fitting
routines used were successful, it was felt that in future studies the quality of the XPS analysis
could be further improved in a number of ways, including: (i) increasing counting times to
reduce the noise level on the low level features of the poly(pyrrole) C(ls) and N (ls) spectra and
(ii) by using non-linear baselines (e.g. Shirley baselines, to compensate for inelastic scattering
effects). Further work is necessary to better characterise the distribution of the enzyme with
respect to the z-axis (normal to the electrode surface) and to accurately determine the influence
of adsorption effects. The accuracy of the FTIR study could be improved by developing a precise
method to account for the non-linear background of the MCT detector. Any improvement in
SNR can only aid the accuracy of the data analysis. Furthermore, future work on polymer
matrices will require more precise data on film thickness, roughness and porosity.
112

6. Conclusion
6.2 Publications and Conference Contributions Arising from this
Work
• Probing enzyme polymer biosensors using X-ray photoelectron spectroscopy: Determination
of glucose oxidase in electropolymerised films. A. Griffith et al, Biosensors & Bioelectronics,
Vol. 11, No. 6/7, 625-631, 1996.
• Two and three dimensional characterisation of the biomolecular composition of an enzyme-
polymer biosensing electrode. A. Griffith et al, Journal of Physical Chemistry, submitted
Sept. 1996.
• Characterisation of electron transfer reactions of redox peptides assembled at thiol
monolayers on gold. L. Jiang et al., Biosensors & Bioelectronics, submitted July 1996.
• An electrorotation study of activated human neutrophils. Biochimica et Biophysica Acta, in
preparation.
• Immobilisation of microperoxidase (MP-11) through self-assembly at modified gold surfaces.
Conference, American Vacuum Society, Minneapolis, Oct. 1995.
• The characterisation of biomolecular constructs at self-assembled monolayers using XPS, J.
Cooper et al; p.27-29 The Research Unit for Surface Transforms and Interfaces Annual
Report 1994-95.
• A microfabricated superoxide sensor. Conference, American Engineering Foundation:
Nanofabrication and Biosystems - frontiers and challenges, Hawaii, May 1994.
• Nanostructures for bioelectronics and their application in cell signalling. Conference,
Nanotechnology in medicine and the biosciencies, London, March 1993.
113

Appendix A
A ppendix A
A l . l E lec tro ro ta tio n a l M odels
The electrical modelling of cells was initiated by Hober221 and later enhanced by Fricke.222
Concentrating on erythrocytes, a single shell model was developed th a t was used to deduce a
value of 0.81|iF cm 2 for the membrane capacitance and 3.3nm for membrane thickness.
Subsequent papers have proposed alternatives such as the double shell223 and smeared-out
shell224 models. These new models could explain the nature of the electrorotational spectra for
a wider range of cell types. At high frequencies, it is easier for the electric field to penetrate
into the non-homogeneous cellular interior and influence the recorded spectra.
A l.1 .1 N eu tro p h ils
The analysis of the electrorotational spectra the of neutrophils provide an opportunity to
compare the double and single shell models defined by Asami et a lm .
Figure A l The components of the single (a) and double (b) shell models of a cell.
The analysis is based upon determining the effective complex perm ittivity of the whole cell ( e*).
From the double-shelled structure of figure A l, e*c can be determined from:
* _ » 2 ( l - r 1) + ( l+ 2 r1)E (2 + r1) + ( l - r 1)E1
(A.l)
114

Appendix A
with rx = ( l - d m/R )s , em is the complex membrane permittivity, d m is the membrane
thickness, R is the cell radius and Ex is an intermediate parameter, given by:
p _ £cp 2(1—r2) + ( l + 2r2)E2 .. o\1 em ' (2 + r2) + ( l - r 2)E2
with r2 = (rn/ ( R - d m )3. ecp is the complex permittivity of the cytoplasm and rn is the radius of
the nucleus. Similarly, the parameter E2 is given by:
p £np 2(1 — r3) + (1 + 2r3 )E32 e\ ' (2 + r3) + ( l - r 3)E3
with r3 = ( l - d n/rn )3. f* and e*np are the complex permittivities of the nuclear membrane and
nuceoplasm, respectively; dn is thickness of the nuclear membrane. Finally, the parameter E3
is given by:
£E = - 2E-‘- ‘3 • (A.4)
Simulations using this model were made using a MATLAB (Mathworks Inc.) subroutine. The
modelling output defined the frequency dependent variation of real and imaginary components
of the Clausius-Mossotti factor. The single shell discussed above is a simpler version of the
theory which does not take into consideration the possible influence of the cytoplasm contents.
A l.1 .2 P olystyrene Beads
The theoretical analysis of the bead rotation has been described previously37-126-127 and this
section provides a summary of that work. In contrast to a cell, a polystyrene bead has a
homogeneous solid interior, and the nature of electrorotation is dominated by the effects of its
surface conductance ( K s ), such that:
a = a b +1— (A.5)r
where o and o b are the effective and bulk material conductivities of the polystyrene bead, and
r is the bead radius. A previous analysis37 has shown that K s is about l-2nS. Using a typical
bead radius of 3pm and assuming a negligible polystyrene conductivity, the effective
115

Appendix A
conductivity of approximately 10(iS cm 1. Examination of equation A.5 provides a guide for the
frequency dependent torque (T(o) )) acting on the particle in a particular medium.
T{co) = -12nr3Q3£.(tf„+2£7m)+6>2(£p +2 £m)'
E ‘ (A.6)
Where o m and em are the medium conductivity and permittivity, with respective values of
500p.S cm*1 and 79eo. £p is the particle permittivity having an estimated value of 3.5eo. Using
the above estimate for o p and inserting these values into equation A.6, it is concluded that the
beads will only exhibit co-field rotation since the numerator term ( e po m - £mo p ) will always be
negative for the experimental conditions used in this study.
116

Appendix B
Appendix B
B l. l Determination ofFTIR PPy/GOx Ratio
The Beer-Lamberts law206 states that sample incident radiation:
E = E {R AuA exp( - k A tp ) (B.l)
where E is the energy at the detector and E i is the incident energy, R a u is the reflectivity of the
gold slide, k is the molar absorption coefficient (mol1), A and t are the sample areas and
thickness respectively, and p is the number of moles of chromophores per unit volume. The
similar subscript identification is used throughout this analysis, for example, Ar, A gox, Appy and
Acomp represent the areas of the reference gold, PPy, GOx and composite sample slides
respectively
Considering the energy of each component of the sample in turn:
&AU = E [ R auA-Au (B -2)
Egox = ^ i B AuA GOx e x p ( - k GOxA GOxtGOxp GOx) (B.3)E p p y = E ^ R ^ A PPy 6Xp(— kp P yA pP ytpP yP pP y ) (B.4)
and assuming that PPy and GOx absorptions are non-interacting, which is valid if we are
examining the amide I and II bands. The equation for the composite sample can be determined:
^ comp ~ ^ i ^ A u ^ c o m p ^G O x^com p^ comp PCtOx pomp ) ^PPy^comp^comp P PPy pomp ̂ (B.5)
We wish to find the value of the p GOx, complp PPy, comp factor in order to determine the relative
ratios of GOx and PPy in the composite samples.
By normalising the spectra at a wavenumber where no absorbances occur (2000cm1 in this
study) the molar absorbance coefficient is the same for all samples. Then, by using logarithms,
equations B.2, B.3 and B.4 can be combined using
compcomp
117

Appendix B
where acsox, appy, and acomp are the respective normalised absorbance values. The respective
absorption responses can be equated as follows:
A b GOx ~ a GOx ~ ^GOxa GOx^GOxP GOx
Abppy = dppy — kpPyClpPytpPyPpPy (B.8)
comp ~ ^comp ~ ^G O x^com p^AuPcom pPPPy pomp ~ ^PPy ® comp^AuPcomp P PPy pomp (B.9)
Analysis of the composite sample can be described as follows:
a (A b Gox ~ a GOx) + Abppy - a PPy) = (A b comp - a comp) (B. 10)
where a and P represent the respective enzyme and polymer components of the composite
sample.
Comparing equations B.7, B.8 and B.9 to B.10; the following equations for the a and P
components are apparent:
Q^Q'GOx'^-AuPgOxP gOx ) — comp^ AuPcomp P GOx ,comp ( B l l )
fi{.CLppyA-AupppyPppy ) — CLcomp^-AuPcompPPPy,comp (B.12)
The determination of a and P directly is not possible due to the large number of unknowns,
however, determination of the ratio ot/p does provide information on the relative proportions of
GOx and PPy in the films:
P GOx,comp r C lppytPPy P PPy >
PpPy ,comp V a GOx ̂ GOx PGOx >(B.13)
In equation B.13, the term in curved brackets is constant providing that the same reference
GOx and PPy spectra are used. Hence, the ot/p ratio represents a measure of the relative
number of GOx vs. PPy chromophores in each composite sample.
118

References
References
(1) Lambrechts M.; Sansen W . "Biosensors: M icroelectrochem ical devices", Institute o f Physics Publishing Ltd. N ew York, 1992.
(2) W ilkins E.; Atanasov P.; Muggenburg B . A . "Integrated implantable device for long-term glucose monitoring". Biosensors & Bioelectronics 1 9 9 5 ,10, 485-494.
(3) Strohben W . E.; Smith D. K.; Evans D. H. "Characterisation o f arrays o f m icroelectrodes for fast voltammetry". A n al Chem. 1 9 9 0 ,6 2 , 1709-1712.
(4) K ovacs G. T. A.; Peterson K.; A lbin M. "Silicon micromachining: sensors to systems". Anal. Chem. 1 9 9 6 ,68, 13, 407A -412A .
(5) G opel W . "Controlled signal-transduction across interfaces o f intelligent molecular-systems". Biosensors & Bioelectronics 1 9 9 5 ,10, 35-59.
(6) Arquint P.; Koudelkahep M.; Derooij N . F.; Buhler H.; M orf W. E. "Organic membranes for miniaturized electrochemical sensors - fabrication o f a combined p [0 2 ] , p [C 02] and pH sensor". J.
Electroanal. Chem. 1994 ,378 , 177-183.
(7) Rojas E.; Stokes C. L.; Mears D.; Atwater I. "Single-microelectrode voltage-clam p measurements o f pancreatic beta-cell membrane ionic currents in-situ". J. Membrane Biol. 1 9 9 5 ,143, 65-77.
(8) Collinson M.; B ow den E. F.; Tarlov M. J. "Voltammetry o f covalently im m obilized cytochrom e-c on self-assem bled monolayer electrodes". Langmuir 1 9 9 2 ,8, 1247-1250.
(9) Schuhmann W . "Electron-transfer pathways in amperometric biosensors -ferrocene-m odified enzym es entrapped in conducting-polymer layers". Biosensors & Bioelectronics 1 9 9 5 ,10, 181-193.
(10) Koopal C. G. J.; B os A. A. C. M.; N olte R. J. M. "Third-generation glucose biosensor incorporated in a conducting printing ink". Sensors and Actuators B. 1 9 9 4 ,18, 166-170.
(11) Ballarin B.; Brumlik C. J.; Lawson D. R.; Liang W . B.; Vandyke L. S.; Martin C. R. "Chemical sensors based on ultrathin-film com posite membranes - a new concept in sensor design". Anal. Chem. 1992, 64, 2647-2651.
(12) Hall E. A. H. "Biosensors", Open University Press: M ilton Keynes, UK, 1990.
(13 ) K lebanoff S. F. "Iodation o f Bacteria. A bactericidal mechanism.". J. Exp. Med. 1967 , 126, 1063-1029.
(14 ) Lunec J. "Free radicals: Their involvement in disease processes". Ann. Clin. Biochem. 1990, 27, 173-182.
(15) M aly F. E. "The B lymphocyte: A newly recognized source o f reactive oxygen species with immunoregulatory potential". Free Rad. Res. Comms. 1 9 8 9 ,8-3, 143-148.
(16 ) Saran M.; Bors W . "Oxygen radicals acting as chemical messengers - a hypothesis". Free Rad. Res. Comms. 1989, 7, 213, 220
(17 ) Hamilton T. A.; Adams D. O. "Molecular mechanisms o f signal transduction in macrophages". Immun. Today 1 9 9 4 ,8, 151-158.
119

References
(18) Takashashi R.; Edashige K.; Sato E. F.; Inoue M.; Matsuno T.; Utsumi K. "Luminol chemiluminescence and active oxygen generation by activated neutrophils". Arch. Biochem. Biophys. 1991,285, 2, 325-330.
(19) Sigma Diagnostics "Nitroblue Tetrazolium (NBT) Reduction - Histochemical demonstration in neutrophils. Procedure No. 840", 1990.
(20) Sanders S. P.; Sylvester J. T.; Harrison S. J.; Zweier J. L. "Comparison of the sensitivity of free-radical measurement by EPR spin trapping and cytochrome-c reduction techniques". Faseb J. 1993, 7, 657
(21) Sekiguchi T.; Nagamine T. "Inhibition of free radical generation by biotin". Biochem. Pharmacol. 1994,47, 594-596.
(22) McNeil C. J.; Smith K. A.; Bellavite P.; Bannister J. V. "Application of the electrochemistry of cytochrome c to the measurement of superoxide radical production". Free Rad. Res. Comms. 1989, 7, 89-96.
(23) Clark L. C.; Lyons C. L. "Electrode systems for continious monitoring in cardiovascular surgery". Ann. NY. Acad. Sci. 1962,102, 29
(24) Foulds N. C.; Lowe C. R. "Immobilisation of glucose oxidase in ferrocene-modified pyrrole polymers". Anal. Chem. 1988,60, 2473-2478.
(25) Keilin D.; Hartree E. F. "The use of glucose oxidase (notatin) for the determination of glucose in biological material and for the study of glucose-producing systems by manometric methods". Biochem. J. 1948,42, 221-231.
(26) Bartlett P. N.; Tebbutt P.; Tyrrell C. H. "Electrochemical immobilization of enzymes .3. Immobilization of glucose oxidase in thin films of electrochemically polymerized phenols". Anal. Chem. 1992, 64, 138-142.
(27) Bartlett P. N.; Ali Z.; Eastwickfield V. "Electrochemical immobilization of enzymes .4. Co-immobilization of glucose oxidase and ferro-ferricyanide in poly(normal-methylpyrrole) films". J. Chem. Soc., Faraday Trans. 1 1992, 88, 2677-2683.
(28) Higgins S. J.; Hamnett A. "In-situ ellipsometric study of the growth and electrochemical cycling of polypyrrole films on platinum". Electrochimica Acta 1991,36, 2123-2134.
(29) Daniels P. B.; Deacon J. K.; Eddowes M. J.; Pedley D. G. "Surface-plasmon resonance applied to immunosensing". Sensors and Actuators A. 1988,15, 11-18.
(30) Schneider T. W.; Buttry D. A. "Electrochemical quartz crystal microbalance studies of adsorption and desorption of self-assembled monolayers of alkyl thiols on gold". J. Am. Chem. Soc. 1993, 115, 12391-12397.
(31) Wang J. H.; Ruddock L. W.; Cass A. E. G. "Microscopic investigations of the interaction of proteins with surfaces". Biosensors & Bioelectronics 1994, 9, 647-655.
(32) Huang Y.; Wang X.; Tame J. A.; Pethig R. "Electrokinetic behavior of colloidal particles in travelling electric fields: studies using yeast cells". J. Phys. D: Appl. Phys. 1993,26, 1528-1535.
(33) Becker F. F.; Wang X. B.; Huang Y.; Pethig R.; Vykoukal J.; Gascoyne P. R. C. "The removal of human leukemia cells from blood using interdigitated microelectrodes". J. Phys. D: Appl. Phys. 1994, 27, 2659-2662.
(34) Dimitrov D. S.; Zhelev D. V. "Dielectrophoresis of individual cells experimental methods and results". Bioelectrochem. Bioenerg. 1987,17, 549-557.
120

References
(35) Gascoyne P. R. C.; Pethig R.; Burt J. P. H.; Becker F. F. "Membrane changes accompanying the induced differentiation of Friend murine erythroleukemia cells studied by dielectrophoresis". Biochim. Biophys. Acta 1993,1149, 119-126.
(36) Fuhr G.; Voigt A.; Muller T.; Wagner B.; Reimer K.; Lisec T. "Electric-field-mediated inhibition of cell and microparticle adhesion: a new way to create bio-repellent surfaces". Sensors and Actuators B. 1995,27, 468-470.
(37) Zhou X. F.; Markx G. H.; Pethig R.; Eastwood I. M. "Differentiation of viable and non-viable bacterial biofilms using electrorotation". Biochim. Biophys. Acta 1995,1245, 85-93.
(38) Pohl H. A. "The motion and precipitation of suspensions in divergent electric fields". J.Appl.Phys. 1951,22, 869-871.
(39) Fuhr G.; Arnold W. M.; Hagedorn R.; Muller T.; Benecke W.; Wagner B.; Zimmermann U. "Levitation, holding, and rotation of cells within traps made by high-frequency fields". Biochim. Biophys. Acta 1992,1108, 215-223.
(40) Huang Y.; Holzel R.; Pethig R.; Wang X. B. "Differences in the AC electrodynamics of viable and non-viable yeast cells determined through combined dielectrophoresis and electrorotation studies". Phys. Med. Biol. 1992,37, 7, 1499-1517.
(41) Arnold W. M.; Schmutzler R. K.; Alhasani S.; Krebs D.; Zimmermann U. "Differences in membrane properties between unfertilized and fertilized single rabbit oocytes demonstrated by electro-rotation. Comparison with cells from early embryos". Biochim. Biophys. Acta 1989,979, 142-146.
(42) Anderson R. "The activated neutrophil - formidable forces unleashed". South African Medical Journal 1995,85, 1024-1028.
(43) Maly F. E.; Schurermaly C. C. "How and why cells make superoxide: The "phagocytic" NADPH oxidase". News In Physiological Sciences 1995,10, 233-238.
(44) Morel F.; Doussiere J.; Vignais P. V. "The superoxide-generating oxidase of phagocytic cells - physiological, molecular and pathological aspects". Eur. J. Biochem. 1991, 201, 523-546.
(45) Hill H. A. O.; Tew D. G.; Walton N. J. "An opsonised microelectrode - Observation of the respiratory burst of a single human neutrophil". FEBS Lett. 1985,191, 257-263.
(46) Yoshaiki M. "The mechanism of overhang formation in diazide/novolak photoresist film by chlorobenzene soak process". J. Vac. Sci. Technol. B 1986,4, 1, 15-21.
(47) Makogon Y. N.; Sidorenko S. I.; Bazarnyi Y. A.; Voltovets N. S.; Litvinova T. V.; Tkachenko V. L. "Diffusion in thin-films of Au/Pd/Ti and Au/Pd/Cr/Ti on silicon". Inorganic Materials 1990, 26, 2116-2121.
(48) Munitz A.; Komem Y. "Structural and resistivity changes in heat-treated chromium-gold films". Thin Solid Films 1995,20, 171-179.
(49) Vogt K. W.; Kohl P. A.; Carter W. B.; Bell R. A.; Bottomley L. A. "Characterization of thin titanium oxide adhesion layers on gold - resistivity, morphology, and composition". Surface Science 1994, 301, 203-213.
(50) Creager S. E.; Hockett L. A.; Rowe G. K. "Consequences of microscopic surface roughness for molecular self-assembly". Langmuir 1992, 8, 854-861.
(51) Sharp D. J. "Corrosion inhibition in sputter-deposited thin-film systems using an intermediary layer of palladium". J. Vac. Sci. Technol. 1979,16:2, 204-207.
121

References
(52) Goss C. A.; Charych D. H.; Majda M. "Application of (3-Mercaptopropyl)trimethoxysilane as a molecular adhesive in the fabrication of vapor-deposited gold electrodes on glass substrates". Anal. Chem. 1991, 63, 85-88.
(53) Prasad K.; Perfecto E. "Multilevel thin-film packaging: Applications and processes for high performance systems". IEEE Trans.Comp.Packag.Man.Tech.Part B-Adv.Packag. 1994,17, 38-49.
(54) Schammler G. k. h.; Glaw V.; Chimel G. "Comparison of the metallisation of chemically ans laser-etched structures in BPDA-PDA polyimide". IEEE Trans.Comp., Hybrids, Manuf.Technol. 1993,16,1, 720-723.
(55) Isobe A.; Shinohara M.; Hiraki M.; Hoshino A. "Via hole failure study". NEC Res. & Develop. 1993, 34, 1,77-83.
(56) Reimer K.; Kohler C.; Lisec T.; Schnakenberg U.; Fuhr G.; Hintsche R.; Wagner B. "Fabrication ofelectrode arrays in the quarter micron regime for biotechnological applications". Sensors and Actuators A. 1995,46, 66-70.
(57) Shih D. Y.; Yeh H. L.; Paraszczak J.; Lewis J.; Graham W.; Nunes S.; Narayan C.; Mcgouey R.; Galligan E.; Cataldo J., et al. "Factors affecting the interconnection resistance and yield in multilayer polyimide copper structures". IEEE Trans.Comp., Hybrids, Manuf.Technol. 1993,16, 74-88.
(58) White G.; Perfecto E.; Mcherron D.; Demercurio T.; Redmond T.; Norcott M. "Large-format fabrication - a practical approach to low-cost MCM-D". IEEE Trans.Comp.Packag.Man.Tech.Part B-Adv.Packag. 1995,18, 37-41.
(59) Hicks S. "For reduced stress metal films use a Ni/Ti multilayer film. This procedure has been proven during a collaborative research project with engineers at the British Telecom research labs in Ipswich, UK",.Personal Communication, 1995.
(60) Breckenridge L. J.; Wilson R. J. A.; Connnolly P.; Curtis A. S. G.; Dow J. A. T.; Blacksaw S. E.; Wilkinson C. D. W. "Advantages of using microfabricated extracellular electrodes for in vitro neuronal recording". J. Neurosci. Research 1995,42, 266-276.
(61) Bard S. L.; Feger C.; Glenning J. J.; Hougham G. G.; Molis S. E.; Pawlowski W. P.; Ritsko J. J.;Slota P.; Snyder R. W. IBM Corporation, A., N.Y. assignee. "Wet etching of thermally or chemicallycured polyimide", New York/USA. 4846929. 1989,218384,
(62) Pang S. W.; Sung K. T.; Ko K. K. "Etching of photoresist using oxygen plasma generated by a multipolar electron-cyclotron resonance source". J. Vac. Sci. Technol. B 1992,10, 1118-1123.
(63) Wu S. Y.; Desouzamachado R.; Denton D. D. "Dielectric and chemical modifications in polyimide films etched in O2 /CF4 plasmas". J.Vac.Sci.Technol.A 1993,11, 1337-1345.
(64) Egitto F. D.; Matienzo L. J.; Blackwell K. J.; Knoll A. R. "Oxygen plasma modification of polyimide webs - effect of ion-bombardment on metal adhesion". J.Adhesion Sci.Technol. 1994,8, 411-433.
(65) Shimoto T.; Matsui K.; Utsumi K. "Cu photosensitive-BCB thin-film multilayer technology forhigh-performance multichip modules". IEEE Trans.Comp.Packag.Man.Tech.Part B-Adv.Packag.1995,18, 18-22.
(66) Joubert O.; Pelletier J.; Fiori C.; Nguyen Tan T. A. "Surface mechanisms in O2 and SFg microwaveplasma etching of polymers". J.Appl.Phys. 1990,67, 9,.4291-4296.
(67) Suzuki H.; Sekine H.; Koibuchi S.; Sato H.; Makino D. "Patterning of fine via holes in polyimide byan oxygen reactive ion etching". ACS Symposium Series 1987,547-556.
122

References
(68) Shih D. Y.; Klymko N.; Flitsch R.; Paraszczak J.; Nunes S. "Oxygen induced adhesion degradation at metal polyimide interface". J.Vac.Sci.TechnoLA 1991,9, 2963-2974.
(69) Xue G.; Wang Y. X.; Chen Y. U.; Tsai S. S.; Jiang L. H. "Adhesion promotion at high-temperature for epoxy-resin or polyimide onto metal by a 2-component coupling system of polybenzimidazole and 4-aminophenyl disulfide". J.Appl.Polym.Sci. 1995,58, 2221-2227.
(70) Cloud T. A.; Houston M. R.; Kohl P. A.; Bidstrup S. A. "Processing and performance of gold MCM’s". IEEE Trans.Comp., Hybrids, Manuf.Technol. 1993,16, 724-730.
(71) Osada K.; Zaitsu Y.; Matsumoto S.; Yoshida M.; Arai E.; Abe T. "Effect of stress in the deposited silicon-nitride films on boron-diffusion of silicon". J.Electrochem.Soc. 1995,142, 202-206.
(72) Alexandrov S. E.; Hitchman M. L.; Shamlian S. H. "Remote plasma-enhanced vapour deposition of silicon nitride films: The effect of diluting nitrogen with helium". J. Mater. Chem. 1995, 5, 3, 457-460.
(73) Kissinger P. T.; Heineman W. R. "Laboratory techniques in electroanalytical chemistry", Marcel Dekker Inc. New York, 1984.
(74) Bard A. J.; Faulkner L. R. "Electrochemical methods - fundamentals and application", John Wiley & Sons: New York, 1980.
(75) Abdelhamid I.; Atanasov P.; Wilkins E. "Needle-type glucose biosensor with an electrochemically codeposited enzyme in a platinum black matrix". Electroanalysis 1995, 7, 738-741.
(76) Frew J. E.; Foulds N. C.; Wilshere J. M.; Forrow N. J.; Green M. J. "Measurement of alkaline phosphatase activity by electrochemical detection of phosphate esters". J. Electroanal. Chem. 1989, 266, 309-316.
(77) Van Benschoten J. J.; Lewis J. Y.; Heineman W. R.; Roston D. A.; Kissinger P. T. "Cyclic voltammetry experiment". J. Chem. Educ. 1983, 60, 772-776.
(78) Kissinger P. T.; Heineman W. R. "Cyclic voltammetry". J. Chem. Educ. 1983,60, 702-706.
(79) Cooper J. M.; Greenough K. R.; McNeil C. J. "Direct electron transfer reactions between immobilized cytochrome c and modified gold electrodes". J. Electroanal. Chem. 1993,347, 267-275.
(80) Nicholson R. S. "Theory and application of cyclic voltammetry for measurement of electrode reaction kinetics". Anal. Chem. 1965,37, 1351-1355.
(81) Beriet C.; Pletcher D. "A microelectrode study of the mechanism and kinetics of the ferro/ferricyanide couple in aqueous-media: the influence of the electrolyte and its concentration". J. Electroanal. Chem. 1993,361, 93-101.
(82) Wightman R. M ."Microvoltammetric electrodes". Anal. Chem. 1981,9, 1125A-1134A.
(83) Wightman R. M.; Wipf D. O. "Voltammetry at ultramicroelectrodes". Electroanalytical Chemistry 1989,15, 267-353.
(84) Pons S.; Fleischmann M. "The behavior of microelectrodes". Anal. Chem. 1987,59,
(85) Heinze J. "Ultramicroelectrodes in electrochemistry". Angew. Chem. Int. Ed. Engl. 1993, 32, 1268-1288.
(86) Mastrototaro J. J.; Massoud H. Z.; Pilkington T. C.; Ideker R. E. "Rigid and flexible thin-film multielectrode arrays for transmural cardiac recording". IEEE Trans.Biomed.Eng. 1992,39, 271-279.
123

References
(87) Zhao G.; Giolando D. M.; Kirchhoff J. R. "Fabrication of silica-coated carbon-fiber ultramicroelectrodes by chemical-vapor-deposition". J. Electroanal. Chem. 1994,379, 505-508.
(88) Wrighton M. S.; Thackery J. W.; Natan M. J.; Smith D. K.; Lane G. A.; Belanger D. "Modification of microelectrode arrays: new microelectrochemical devices for sensor applications". Phil. Trans. R. Soc. Lond. B 1987, 316, 13-30.
(89) Paeschke M.; Wollenberger U.; Kohler C.; Lisec T.; Schnakenberg U.; Hintsche R. "Properties of interdigitated electrode arrays with different geometries". Anal. Chim. Acta. 1995,305, 126-136.
(90) Shea T. V.; Bard A. J. "Digital simulation of homogeneous chemical reactions coupled to heterogeneous electron transfer and applications at platinum/mica/platinum microelectrodes". Anal. Chem. 1987,59, 2101-2111.
(91) Aoki K.; Morita M.; Niwa O.; Tabei H. "Quantitative-analysis of reversible diffusion-controlled currents of redox soluble species at interdigitated array electrodes under steady-state conditions". J. Electroanal. Chem. 1988,256, 269-282.
(92) Moressi M. B.; Fernandez H. "The use of ultramicroelectrodes for the determination of diffusion-coefficients". J. Electroanal. Chem. 1994,369, 153-159.
(93) Aoki K. "Theory of ultramicroelectrodes". Electroanalysis 1993,5, 627-639.
(94) BIOCHEMIST’S HANDBOOK "CHEMICAL DATA: Preparation of constant ionic strength buffers", [Unpublished] 1994.
(95) McNeil C. J.; Greenough K. R.; Weeks P. A.; Self C. H.; Cooper J. M. "Electrochemical sensors for direct reagentless measurement of superoxide production by human neutrophils". Free Rad. Res. Comms. 1992,17, 399-406.
(96) Manning P. "1st Year PhD report: Superoxide detection in biological systems", Newcastle upon Tyne, Unpublished, 1995.
(97) Goldstein E. L.; VanDeMark M. R. "Electrode cleaning and anion effects on ks for K3Fe(CN)6 couple". Bioelectrochimica Acta 1982,27, 1079-1085.
(98) Chialvo A. C.; Triaca W. E.; Arvia A. J. "Changes in the polycrystalline gold electrode surface produced by square wave potential perturbations". J. Electroanal. Chem. 1984,171, 303-316.
(99) Weisshaar D. E.; Walczak M. M.; Porter M. D. "Electrochemically induced transformations of monolayers formed by self-assembly of mercaptoethanol at gold". Langmuir 1993,9, 323-329.
(100) Bard A. J.; Crayston J. A.; Kittlesen G. P.; Shea T. V.; Wrigthton M. S. "Digital simulation of the measured electrochemical response of reversible redox couples at microelectrode arrays: consequences arising from closely spaced ultramicroelectrodes". Anal. Chem. 1986,58, 2321-2331.
(101) Cha C. S.; Chen J.; Liu P. F. "Improvement of the adhesion of a Nafion(r) modifying layer on electrodes". 7. Electroanal. Chem. 1993,345, 463-467.
(102) Oesch U.; Janata J. "Electrochemical study of gold electrodes with anodic films - I. Formation and reduction behavior of anodic oxides on gold". Electrochimica Acta 1983,28, 9, 1237-1246.
(103) Eddowes M. J.; Hill H. A. O. "Electrochemistry of horse heart cytochrome c". J. Am. Chem. Soc. 1979,101, 16, 4461-4464.
(104) Willit J. L.; Bowden E. F. "Adsorption and redox thermodynamics of strongly adsorbed cytochrome c on tin oxide electrodes". J. Phys. Chem. 1990,94, 8241-8246.
124
References
(105) Daido T.; Akaike T. "Electrochemistry of cytochrome c: Influence of coulombic attraction with indium tin oxide electrode". J. Electroanal. Chem. 1993,344, 91-106.
(106) Reed D. E.; Hawkridge F. M. "Direct electron transfer reactions of cytochrome c at silver electrodes". Anal. Chem. 1987, 59, 2334-2339.
(107) Digleria K.; Hill H. A. O.; Lowe V. J.; Page D. J. "Direct electrochemistry of horse-heart cytochrome c at amino acid-modified gold electrodes". J. Electroanal. Chem. 1986,213, 333-338.
(108) Allen P. M.; Hill H. A. O.; Walton N. J. "Surface modifiers for the promotion of direct electrochemistry of cytochrome c". J. Electroanal. Chem. 1984,178, 69-86.
(109) Santucci R.; Faraoni A.; Campanella L.; Tranchida G.; Brunori M. "Use of solid-state promoters in the electrochemistry of cytochrome-c at a gold electrode". Biochem. J. 1991,273, 783-786.
(110) Santucci R.; Brunori M.; Campanella L.; Tranchida G. "Electrochemical behavior of horse heart cytochrome c and microperoxidase at a gold electrode chemically modified with sulphur-containing compounds". Bioelectrochem. Bioenerg. 1992,29, 177-184.
(111) Song S.; Clark R. A.; Bowden E. F.; Tarlov M. J. "Characterization of cytochrome-c alkanethiolate structures prepared by self-assembly on gold". J. Phys. Chem. 1993,97, 6564-6572.
(112) Lotzbeyer T.; Schuhmann W.; Katz E.; Falter J.; Schmidt H. "Direct electron transfer between the covalently immobilized enzyme microperoxidase MP-11 and a cystamine-modified gold electrode". J. Electroanal. Chem. 1994,377, 291-294.
(113) Weisshaar D. E.; Lamp B. D.; Porter M. D. "Thermodynamically controlled electrochemical formation of thiolate monolayers at gold: characterization and comparison to self-assembled analogs". J. Am. Chem. Soc. 1992,114, 5860-5862.
(114) Kim E.; Kumar A.; Whitesides G. M. "Combining patterned self-assembled monolayers of alkanethiolates on gold with anisotropic etching of silicon to generate controlled surface morphologies". J.Electrochem.Soc. 1995,142, 628-633.
(115) McLendon G. "Similar observation of thiol electrochemistry at low positive potentials (.3V)". Personal Communication, 1996.
(116) Rongen H. A. H.; Hoetelmans R. M. W.; Bult A.; Vanbennekom W. P. "Chemiluminescence and immunoassays". Journal Of Pharmaceutical And Biomedical Analysis 1994,12, 433-462.
(117) Daval J. L.; Ghersiegea J. F.; Oillet J.; Koziel V. "A simple method for evaluation of superoxide radical production in neural cells under various culture conditions - application to hypoxia". J. Cereb. Blood Flow Metab. 1995,15, 71-77.
(118) Babior B. M.; Kipnes R. S.; Curnutte J. T. "Biological Defense Mechanisms: The production of leukocytes of superoxide - a potential bactericidal agent". J. Clin. Invest. 1973,52, 741-744.
(119) Tauber A. I. "Protein kinase C and the activation of the human neutrophil NADPH-oxidase". Blood 1987,69, 3,711-720.
(120) Nathan C. F. "Neutrophil activation on biological surfaces - massive secretion of hydrogen peroxide in response to products of macrophages and lymphocytes". J. Clin. Invest. 1987,80, 1550-1560.
(121) Turgiev A.; Kubatiev A. "Rabbit-blood neutrophils are more responsive to aggregation inducers and inhibitors than their human counterparts". Int.J.Immunotherapy 1990, 6, 119-129.
(122) Fleischmann M.; Pons S. "The behaviour of microdisk and microring electrodes". J. Electroanal. Chem. 1987,222, 107-115.
125

References
(123) Green M. J.; Hill H. A. O.; Tew D. G.; Walton N. J. "An opsonised electrode: The directelectrochemical detection of superoxide generated by human neutrophils". FEBS Lett. 1984, 170,69-72.
(124) Bratten C. D. T.; Cobbold P.H.; Cooper J.M. "Micromachinig sensors for electrochemicakl measurement in sub-nanolitre volumes". In Preparation, 1996.
(125) Pethig R.; Huang Y.; Wang X. B.; Burt J. P. "Positive and negative dielectrophoretic collection of colloidal particles using interdigitated castellated microelectrodes". J. Phys. D: Appl. Phys. 1992, 25, 881-888.
(126) Foster K. R.; Sauer F. A.; Schwan H. P. "Electrorotation and levitation of cells and colloidalparticles". Biophys. J. 1992, 63, 180-190.
(127) Arnold W. M.; Schwan H. P.; Zimmermann U. "Surface conductance and other properties of latex particles measured by electrorotation". J. Phys. Chem. 1987, 91, 5093-5098.
(128) Pethig R. "Dielectric properties of biological materials", Wiley: Chichester, UK, 1979.
(129) Wang X. B.; Huang Y.; Gascoyne P. R. C.; Becker F. F.; Holzel R.; Pethig R. "Changes in friend murine erythroleukemia cell membranes during induced differentiation determined by electrorotation". Biochim. Biophys. Acta 1994,1193, 330-344.
(130) Ziervogel H.; Glaser R.; Schadow D.; Heymann S. "Electrorotation of lymphocytes - the influence of membrane events and nucleus". Biosci. Rep. 1986, 6, 973-982.
(131) Asami K.; Takahashi Y.; Takashima S. "Dielectric properties of mouse lymphocytes and erythrocytes". Biochim. Biophys. Acta 1989,1010, 49-55.
(132) Schwan H. P. "Physical techniques in biological research", Academic Press: New York, 1966.
(133) Sato N.; Kashima K.; Shimizu H.; Uehara Y.; Shimomura Y.; Mori M. "Hypertonic glucose inhibits the production of oxygen-derived free radicals by rat neutrophils". Life Sci. 1993,52, 1481-1486.
(134) OFlaherty J. T.; Dechatlet L. R.; McCall C. E.; Bass D. A. "Neutrophil aggregation: Evidence for a different mechanism of action by Phorbol Myristate Acetate (40962)". Proc.Soc.Exp.Biol.Med. 1980, 165, 225-232.
(135) Huang Y.; Pethig R. "Electrode design for negative dielectrophoresis". Meas. Sci. Technol. 1991, 2, 1142-1146.
(136) Hughes M. P.; Wang X. B.; Becker F. F.; Gascoyne P. R. C.; Pethig R. "Computer-aided analyses of electric-fields used in electrorotation studies". J. Phys. D: Appl. Phys. 1994,27, 1564-1570.
(137) Chettibi S.; Lawrence A. J.; Stevenson R. D.; Young J. D. "Effect of lysophosphatidic acid on motility, polarization and metabolic burst of human neutrophils". FEMS Immunology And Medical Microbiology 1994, 8, 271-281.
(138) Lippi U.; Bellavite P.; Schinella M.; Nicoli M.; Lippi G. "Assessment of neutrophil aggregation by coulter(r) STKR and STKS hematological analyzers". Clin. Lab. Haemat. 1994,16, 43-55.
(139) Sigma Diagnostics "Trypan blue procedure", 1996.
(140) Lundqvist H.; Kricka L. J.; Stott R. A.; Thorpe G. H. G.; Dahlgren C. "Influence of different luminols on the characteristics of the chemiluminescence reaction in human neutrophils". J.Biolumin.Chemilumin. 1995,10, 353-359.
126

References
(141) Arnold W. M.; Gessner A. G.; Zimmermann U. "Dielectric measurements on electro-manipulation media". Biochim. Biophys. Acta 1993,1157, 32-44.
(142) Gimsa J.; Schnelle T.; Zechel G.; Glaser R. "Dielectric spectroscopy of human erythrocytes: Investigations under the influence of nystatin". Biophys. J. 1994, 66, 1244-1253.
(143) Davis B. H.; Walter R. J.; Pearson C. B.; Becker E. L.; Oliver J. M. "Membrane activity and topography of F-Met-Leu-Phe-treated polymorphonuclear leukocytes -acute and sustained responses to chemotactic peptide". Am. J. Pathol. 1982,108, 206-216.
(144) Fuhr G.; Schnelle T.; Hagedorn R.; Shirley S. G. "Dielectrophoretic field cages: technique for cell, virus and macromolecule handling". Cellular Engineering 1995,1, 47-57.
(145) Muller T.; Gerardino A.; Schnelle T.; Shirley S. G.; Bordoni F.; Degasperis G.; Leoni R.; Fuhr G. "Trapping of micrometer and submicrometer particles by high-frequency electric-fields and hydrodynamic-forces". J. Phys. D: Appl. Phys. 1996,29, 340-349.
(146) Fuhr G.; Glasser H.; Muller T.; Schnelle T. "Cell manipulation and cultivation under A.C. electric field influence in highly conductive culture media". Biochim. Biophys. Acta 1994,1201, 353-360.
(147) Hu X.; Arnold W. M.; Zimmermann U. "Alterations in the electrical properties of T and B lymphocyte membranes induced by mitogenic stimulation. Activation monitored by electro-rotation of single cells". Biochim. Biophys. Acta 1990,1021, 191-200.
(148) Grinstein S.; Furuya W.; Cragoe E. J. "Volume changes in activated human-neutrophils: The role of Na+/H+ exchange". J. Cell. Physiol. 1986,128, 33-40.
(149) Watts R. G.; Crispens M. A.; Howard T. H. "A quantitative study of the role of f-actin in producing neutrophil shape". CellMotil. 1991,19, 159-168.
(150) Coates T. D.; Watts R. G.; Hartman R.; Howard T. H. "Relationship of F-actin distribution to development of polar shape in human polymorphonuclear neutrophils". J. Cell Biol. 1992, 117, 765-774.
(151) Sukhorukov V. L.; Arnold W. M.; Zimmermann U. "Hypotonically induced changes in the plasma membrane of cultured mammalian cells". J. Membrane Biol. 1993,132, 27-40.
(152) Becker F. F.; Wang X.; Huang Y.; Pethig R.; Vykoukal J.; Gascoyne P. R. C. "Separation of human breast cancer cells from blood by differential dielectric affinity". Proc.Natl.Acad.Sci.USA 1995, 92, 860-864.
(153) Masuda S.; Washizu M.; Kawabata I. "Movement of blood cells in liquid by nonuniform traveling field". IEEE Trans. Ind. Appl. 1988, 24:2, 217-222.
(154) Hagedorn R.; Fuhr G.; Muller T.; Gimsa J. "Traveling-wave dielectrophoresis of microparticles". Electrophoresis 1992,13, 49-54.
(155) Wang X. B.; Huang Y.; Hughes M. P.; Pethig R.; Gascoyne P. R. C.; Becker F. F. "Separation of biological cells using traveling electric-fields". Biophys. J. 1994, 66, 281
(156) Hughes M. P.; Pethig R.; Wang X. B. "Dielectrophoretic forces on particles in traveling electric-fields". J. Phys. D: Appl. Phys. 1996,29, 474-482.
(157) Chandler G. K.; Pletcher D. "The electrochemistry of conducting polymers". Electrochemistry 1985, 10, 117-124.
(158) Qian R.; Qiu J. "Electrochemically prepared polypyrroles from aqueous solution". Polymer J. 1987, 19, 157-172.
127

References
(159) Diaz A. F.; Kanazawa K. K.; Gardini G. P. "Electrochemical polymerisation of pyrrole". J. Chem. Soc., Chem. Commun. 1979, 635
(160) Foulds N. C.; Lowe C. R. "Enzyme entrapment in electrically conducting polymers". J. Chem. Soc. , Faraday Trans. 1 1986, 82, 1259-1264.
(161) Ammon H. P. T.; Ege W.; Oppermann M.; Gopel W.; Eisele S. "Improvement in the long-term stability of an amperometric glucose sensor system by introducing a cellulose membrane of bacterial origin". Anal. Chem. 1995,67, 466-471.
(162) Fortier G.; Belanger D. "Characterization of the biochemical behavior of glucose oxidase entrapped in a polypyrrole film". BiotechnolBioeng. 1991,37, 854-858.
(163) Chen C. C.; Bose C. S.; Rajeshwar K. "The reduction of dioxygen and the oxidation of hydrogen at polypyrrole film electrodes containing nanodispersed platinum particles". J. Electroanal. Chem. 1993,350, 161-176.
(164) Scharifker B. R.; Fermin D. J. "The role of intermediates in solution in the initial-stages of electrodeposition of polypyrrole". J. Electroanal. Chem. 1994,365, 35-39.
(165) Fortier G.; Brassard E.; Belanger D. "Optimisation of a polypyrrole glucose oxidase biosensor". Biosensors & Bioelectronics 1990,5, 473-490.
(166) Gros P.; Bergel A. "Improved model of a polypyrrole glucose-oxidase modified electrode". J. Electroanal. Chem. 1995,386, 65-73.
(167) Allara D. L. "A summary of critical issues for application of IR spectroscopy to characterization of surface processing". Critical Reviews in Surface Chemistry 1993, 2, 1.2, 91-110.
(168) Pei Q.; Qian R. "Electrochemical polymerization of pyrrole in aqueous buffer solutions". J. Electroanal. Chem. 1992,322, 153-166.
(169) Asavapiriyanont S.; Chandler G. K.; Gunawardena G. A.; Pletcher D. "The electrodeposition of polypyrrole films from aqueous solutions". J. Electroanal. Chem. 1984,177, 229-244.
(170) Wilson R.; Turner A. P. F. "Glucose oxidase: an ideal enzyme". Biosensors & Bioelectronics 1992, 7, 165-185.
(171) Pfluger P.; Krounbi M.; Street G. B.; Weiser G. "The chemical and physical properties of pyrrole-based conducting polymers: The oxidation of neutral polypyrrole". J.Chem.Phys. 1983, 78, 3212-3218.
(172) Frommer J. "Scanning tunnelling microscopy and atomic force microscopy in organic chemistry". Angew. Chem. Int. Ed. Engl. 1992,37, 1298-1328.
(173) Belanger D.; Nadreau J.; Fortier G. "Electrochemistry of the polypyrrole glucose oxidase electrode". J. Electroanal. Chem. 1989,274, 143-155.
(174) Ramanathan K.; Sundaresan N. S.; Malhotra B. D. "Ion-exchanged polypyrrole-based glucose biosensor - enhanced loading and response". Electroanalysis 1995, 7, 579-582.
(175) Rishpon J.; Gottesfeld S. "Investigation of polypyrrole glucose-oxidase electrodes by ellipsometric, microgravimetric and electrochemical measurements". Biosensors & Bioelectronics 1991,6, 143-149.
(176) Cui C. Q.; Ong L. H.; Tan T. C.; Lee J. Y. "Origin of the difference between potentiostatic and cyclic potential sweep depositions of polyaniline". J. Electroanal. Chem. 1993,346, 477-482.
128

References
(177) Sabatani E.; Redondo A.; Rishpon J.; Rudge A.; Rubinstein I.; Gottesfeld S. "Morphology control in electrochemically grown conducting polymer films .2. Effects of cathodic bias on anodically grown films studied by spectroscopic ellipsometry and quartz-crystal microbalance". J. Chem. Soc. , Faraday Trans. 1 1993, 89, 287-294.
(178) Yabuki S.; Shinohara H.; Aizawa M. "Electro-conductive enzyme membrane". J. Chem. Soc. , Chem. Commun. 1989,945-946.
(179) Rishpon J.; Gottesfeld S.; Campbell C.; Davey J.; Zawodzinski T. A. "Amperometric glucose sensors based on glucose-oxidase immobilized in nafion". Electroanalysis 1994,6, 17-21.
(180) Wang J.; Liu J.; Chen L.; Lu F. "Highly selective membrane-free, mediator-free glucose biosensor". Anal. Chem. 1994, 66, 3600-3603.
(181) Centonze D.; Guerrieri A.; Malitesta F.; Palmisano F.; Zambonin P. G. "Interference-free glucose sensor based on glucose-oxidase immobilized in an overoxidised non-conducting polypyrrole film". Fresenius J.Anal Chem. 1992,342, 729-733.
(182) Christensen P. A.; Hamnett A. "In situ spectroscopic investigations of the growth, electrochemical cycling and overoxidation of polypyrrole in aqueous solution". Electrochimica Acta 1991, 36, 1263-1286.
(183) Palmisano F.; Malitesta C.; Centonze D.; Zambonin P. G. "Correlation between permselectivity and chemical structure of overoxidized polypyrrole membranes used in electroproduced enzyme biosensors". Anal. Chem. 1995,67, 2207-2211.
(184) Palmisano F.; Guerrieri A.; Quinto M.; Zambonin P. G. "Electrosynthesized bilayer polymeric membrane for effective elimination of electroactive interferents in amperometric biosensors". Anal. Chem. 1995, 67, 1005-1009.
(185) Witkowski A.; Freund M. S.; Brajtertoth A. "Effect of electrode substrate on the morphology and selectivity of overoxidized polypyrrole films". Anal. Chem. 1991, 63, 622-626.
(186) Chang R. "Physical chemistry with applications to biological systems", Macmillan Publishing Co., Inc. New York, 1981.
(187) Subirade M.; Lebugle A. "Organization of a globular protein film on solid-surfaces: an X-ray photoelectron-spectroscopy study". Thin Solid Films 1994, 243, 442-445.
(188) Fitzpatrick H.; Luckham P. F.; Eriksen S.; Hammond K. "Use of X-ray photoelectron spectroscopy to study protein adsorption to mica surfaces". J.Colloid Interface Sci. 1992,149, 1-9.
(189) Clark D. T.; Peeling J.; Colling L. "An experimental and theoretical investigation of the core levelspectra of a series of amino acids, dipeptides and polypeptides". Biochim. Biophys. Acta 1976, 507, 533-545.
(190) De Benedetto G. E.; Malitesta C.; Zambonin C. G. "Electroanalytical/X-ray photoelectron spectroscopy investigation on glucose oxidase adsorbed on platinum". J. Chem. Soc. , Faraday Trans. 1 1994,90, 11, 1495-1499.
(191) Ratner B. D. "Advances in the analysis of surfaces of biomedical interest". Surf.Interface Anal. 1995, 23, 521-528.
(192) Beamson G.; Briggs D.; Davies S. F.; Fletcher I. W.; Clark D. T.; Howard J.; Gelius U.; WannbergB.; Balzer P. "Performance and application of the Scienta ESCA300 spectrometer". Surf.Interface Anal. 1990,15, 541-549.
(193) Ghosh P. K. "Introduction to photoelectron spectroscopy", Wiley: New York, 1983.
129

References
(194) Schlenoff J. B,; Xu H. "Evolution of physical and electrochemical properties of polypyrrole during extended oxidation". J.Electrochem.Soc. 1992,139, 2397-2401.
(195) Witkowski A.; Brajtertoth A. "Overoxidized polypyrrole films: A model for the design of permselective electrodes". Anal. Chem. 1992,64, 635-641.
(196) Chesher D. A.; Christensen P. A.; Hamnett A. "Anion movement and carrier type in polypyrrole/dodecyl-sulfate". J. Chem. Soc., Faraday Trans. 1 1993,89, 303-309.
(197) Moulder J. F.; Stickle W. F.; Sobol P. E.; Bomben K. D. "Handbook of X-ray photoelectron spectroscopy", Perkin Elmer Corp. Eden Praire, 1992.
(198) Pfluger P.; Street G. B. "Chemical, electronic, and structural properties of conducting heterocyclic polymers: A view by XPS". J.Chem.Phys. 1984,80, 544-553.
(199) Hecht H. J.; Kalisz H. M.; Hendle J.; Schmid R. D.; Schomburg D. "Crystal structure of Glucose Oxidase from Aspergillus Niger refined at 2.3 Angstrom resolution". J.Mol.Biol. 1993, 229, 153-172.
(200) Szucs A.; Hitchens G. D.; Bockris J. O. "On the adsorption of Glucose Oxidase at a gold electrode". J.Electrochem.Soc. 1989,136, 3748-3755.
(201) Hayden B. E. "Vibrational spectroscopy of molecules on surfaces", Plenum Press: New York, 1987.
(202) Haris P. I.; Chapman D. "Does Fourier-transform infrared spectroscopy provide useful information on protein structures?". TIBS 1992,17, 328-333.
(203) Susi H.; Byler D. M. "Resolution enhanced Fourier transform infrared spectroscopy of enzymes". Methods Enzymol. 1986,130, 290-311.
(204) Singh B. R.; Fuller M. P. "FT-IR in combination with the attenuated total reflectance technique: A very sensitive method for the structural analysis of polypeptides". Appl. Spectrosc. 1991, 45, 1017-1021.
(205) Fiol C.; Alexandre S.; Dubreuil N.; Valleton J. M. "Characterization of behenic acid/glucose-oxidase Langmuir-Blodgett films by spectrophotometry: a tentative model of their organization". Thin Solid Films 1995,261, 287-295.
(206) Porter M. D. "IR external reflection spectroscopy: A probe for chemically modified surfaces". Anal. Chem. 1988, 60, 20, 1143A-1155A.
(207) Surewicz W. K.; Mantsch H. H. "New insight into protein secondary structure from resolution-enhanced infrared spectra". Biochim. Biophys. Acta 1988,952, 115-130.
(208) Williams R. W. "Protein secondary structure-analysis using Raman amide I and amide III spectra". Methods Enzymol. 1986,130, 311-331.
(209) Fu F. N.; Deoliveira D. B.; Trumble W. R.; Sarkar H. K.; Singh B. R. "Secondary structure estimation of proteins using the amide III region of Fourier transform infrared spectroscopy: Application to analyse calcium binding induced structural changes in calsequestrin". Appl. Spectrosc. 1994, 48, 1432-1441.
(210) Jeon J. S.; Sperline R. P.; Raghavan S. "Quantitative analysis of adsorbed serum albumin on segmented polyurethane using FT-IR/ATR spectroscopy". Appl. Spectrosc. 1992,46, 1644-1648.
(211) Schubert M. A.; Wiggins M. J.; Schaefer M. P.; Hiltner A.; Anderson J. M. "Oxidative biodegradation mechanisms of biaxially strained poly(etherurethane urea) elastomers". J.Biomed.Mater.Res. 1995,29, 337-347.
130

References
(212) Rabolt J. F.; Jurich M.; Swalen J. D. "Infrared reflection-absorption studies of thin-films at grazing-incidence". Appl. Spectrosc. 1985,39, 269-272.
(213) Brendel R. "Quantitative infrared study of ultrathin MIS sturctures by grazing internal reflection". Appl. Phys. A 1990,50, 587-593.
(214) Singh B. R.; Fuller M. P.; Dasgupta B. R. "Botulinum neurotoxin type A: Structure and interaction with the micellar concentration of SDS determined by FT-IR spectroscopy". J.Protein Chem. 1991, 10, 637-649.
(215) Shimidzu T.; Ohtani A.; Iyoda T.; Honda K. "Charge-controllable polypyrrole/polyelectrolyte composite membranes .2. Effect of incorporated anion size on the electrochemical oxidation-reduction process"./. Electroanal. Chem. 1987,224, 123-135.
(216) Willicut R. J.; Mccarley R. L. "Surface-confined monomers on electrode surface 1. Electrochemical and microscopic characterization of omega-(n-pyrrolyl)alkanethiol self-assembled monolayers on Au". Langmuir 1995,11, 296-301.
(217) Reffner J. A.; Wihlborg W. T. "Microanalysis by reflectance FTIR microscopy". International Laboratory 1990, July/August, 19-26.
(218) Moussy F.; Harrison D. J. "Prevention of he rapid degradation ofsubcutaneously implanted Ag/AgCl reference electrodes using polymer coatings". Anal. Chem. 1994, 66, 674-679.
(219) Csoregi E.; Schmidtke D. W.; Heller A. "Design and optimization of a selective subcutaneously implantable glucose electrode based on "wired" glucose-oxidase". Anal. Chem. 1995, 67, 1240-1244.
(220) Hober R. "Messungen der inneren Leitfahigkeit von Zellen". Pfl Physiol Archiv Mensch Tiere 1913, 150, 15-45.
(221) Fricke H. "The electric capacity of suspensions of red corpuscels of a dog". Phys Rev 1925, 26, 682-687.
(222) Kakutani T.; Shibatani S.; Senda M. "Electrorotation of barley mesophyll protoplasts". Bioelectrochem. Bioenerg. 1993,31, 85-97.
(223) Huang Y.; Wang X. B.; Holzel R.; Becker F. F.; Gascoyne P. R. C. "Electrorotational studies of the cytoplasmic dielectric-properties of friend murine erythroleukemia-cells". Phys. Med. Biol. 1995, 40, 1789-1806.
(224) Porter M. D. "IR external reflection spectroscopy: A probe for chemically modified surfaces". Anal. Chem. 1988, 60, 20, 1143A-1155A.
131

List of Abbreviations
List of Abbreviations
AFM Atomic Force Microscopy
ATR Attenuated Total Reflection
BAS Bioanalytical Instruments Inc.
BHK Baby Hamster Kidney
CVD Chemical Vapour Deposition
DMSO Dimethyl Sulfoxide
DTSSP 3,3-Dithiobis(sulfosuccinimidylpropionate)
e-beam Electron-Beam
EDC l-ethyl-3-(3-dimethylaminopropyl)carbodiimide
FAD Flavin Adenine Dinucleotide
FMLP Formyl Methionine [F-Met-Leu-Phe]
FTIR Fourier Transform Infra-Red Spectroscopy
GIR Grazing Incident Reflectance
GOx Glucose Oxidase
HP Hewlett Packard
IPA Isopropyl Alcohol
IR Infra Red
MCT Mercury Cadmium Telluride
MIBK Methyl Isobutyl Ketone
MPS [3-Mercaptopropyl]trimethoxysilane
NAC N-Acetyl Cysteine
PBS Phosphate Buffered Saline
PECVD Plasma Enhanced ChemicalVapour Deposition
PMA Phorbol 12-Myrisitate 13-Acetate
PMMA Poly(methyl methacrylate)
PPy Polypyrrole
PPy+ Oxidised Polypyrrole
PPy-oox Polypyrrole - Over-oxidised
REE Reactive Ion Etch
RO Reverse Osmosis
ROS Reactive Oxygen Species
RUSTI Research Unit for SurfaceTransforms and Interfaces
seem Standard Cubic Centimeters perMinute
SNR Signal to Noise Ratio
SOD Superoxide Dismutase
TO A Take-Off Angle
TWD Travelling-WaveDielectrophoresis
XOx Xanthine Oxidase
XPS X-ray PhotoelectronSpectroscopy
fGLASGOWUNIVERSITYLIBRARY
132