Embed Size (px)
Citation preview

8/2/2019 Application of the Endurance Limit Premise-Von Quintus
http://slidepdf.com/reader/full/application-of-the-endurance-limit-premise-von-quintus 1/19
International Conference on Perpetual Pavements July 2006
Application of Endurance Limit in M-E Pavement Design
Harold L. Von Quintus, P.E.
Applied Research Associates, Inc.1
Application of the Endurance Limit Premise in
Mechanistic-Empirical Based Pavement Design
Procedures
Text Word Count: 5,409
Tables & Figures: 3,250
Total Word Count: 8,659
By:
Harold L. Von Quintus, P.E.
Applied Research Associates, Inc.102 Northwest Drive, Suite C
Round Rock, Texas 78664
Phone: 512-218-5088
Fax: 512-218-8039
Paper Prepared for Publication and PresentationInternational Conference on Perpetual Pavements
Columbus, Ohio
September 13-15, 2006
July 2006

8/2/2019 Application of the Endurance Limit Premise-Von Quintus
http://slidepdf.com/reader/full/application-of-the-endurance-limit-premise-von-quintus 2/19
International Conference on Perpetual Pavements July 2006
Application of Endurance Limit in M-E Pavement Design
Harold L. Von Quintus, P.E.
Applied Research Associates, Inc.2
Application of the Endurance Limit Premise in Mechanistic-
Empirical Based Pavement Design Procedures
By: Harold L. Von Quintus, P.E.
July 2006
Abstract
Flexible pavements have traditionally been designed to limit load-related cracking. Themore traffic – the thicker the hot mix asphalt (HMA) layer to limit the amount of load
related cracks. Industry, however, has proposed the use of an endurance limit as a
mixture property for HMA layers. The endurance limit is defined as the tensile strainbelow which no fracture or fatigue damage occurs. Values that have been used vary from
65 to over 100 micro-strains. Most all design and analysis procedures that use the
endurance limit concept assume that one value applies to all HMA mixtures andtemperatures. This purpose of this paper is to confirm or reject the concept and values
suggested for the endurance limit through the use field performance data.
Introduction
Mechanistic-empirical (M-E) based procedures are used to design flexible pavement to
limit load related cracking. All M-E based design procedures can be grouped into three
types relative to load-induced cracking, which are listed below.
1. Design procedures that use the equivalent axle load and equivalent temperatureconcepts. The equivalent temperature is determined based on an annual or
monthly basis. These procedures typically use the cumulative damage concept to
determine the amount of fracture damage over the design period for eachstructure. The Asphalt Institute’s DAMA program falls within this category.
a. The equivalent temperature concept simply defines one temperature for
which the annual or seasonal damage equals the cumulative damagedetermined at monthly intervals. The equivalent temperature is used to
estimate the dynamic modulus for calculating critical pavement responses
(tensile strain at the bottom of the hot mix asphalt [HMA] layer) on anannual or seasonal basis.
b. The equivalent axle load concept simply converts all truck traffic into an
equivalent number of a specific axle load applications. That axle load is
used to calculate the pavement responses required for design.
2. Design procedures that use the equivalent temperature concept and axle load
distribution for each axle type. These procedures also use the cumulative damageconcept to determine the amount of fracture damage for each pavement structure.
The PerRoad program falls within this category.

8/2/2019 Application of the Endurance Limit Premise-Von Quintus
http://slidepdf.com/reader/full/application-of-the-endurance-limit-premise-von-quintus 3/19
International Conference on Perpetual Pavements July 2006
Application of Endurance Limit in M-E Pavement Design
Harold L. Von Quintus, P.E.
Applied Research Associates, Inc.3
3. Design procedures that use the axle load distribution and pavement temperaturedistributions at specific depths over some time interval, generally less than a
month. These procedures typically use the incremental damage concept to
determine the amount of fracture damage within specific time and axle loadintervals at specific depths within the pavement structure. The Mechanistic-
Empirical Pavement Design Guide (M-E PDG) falls within this category.
Most M-E based design procedures, regardless of the group, use Minor’s hypothesis to
calculate fracture damage, and assume that load-related alligator cracks initiate at the
bottom of the HMA layer and propagate to the surface with continued truck loadings,
with the exception of the M-E PDG. The M-E PDG predicts both bottom and surfaceinitiated cracks. In addition, all M-E based design procedures use the maximum tensile
strain at the bottom of the HMA layer as the pavement response parameter for calculating
fracture damage and the amount of alligator cracks. Thus, the more traffic the thicker theHMA layer to limit the amount of alligator cracking.
Industry has proposed the use of an endurance limit as a mixture property. Theendurance limit is defined as the tensile strain below which no fracture damage occurs; a
fatigue resistant pavement. The purpose of this paper is to present field performance data
to confirm or reject this design premise.
Mechanistic-Empirical Design Procedures and the Endurance Limit
The M-E based design procedures that consider the endurance limit design premise
incorporate that concept into the design procedure in one of three methods, which are
summarized below.
1.
The introduction of the endurance limit design premise into those designprocedures that use the equivalent temperature and equivalent axle load concepts
is straight forward. Stated simply, the maximum tensile strain is calculated at theequivalent temperature and axle load and compared to the endurance limit. The
HMA layer thickness is simply determined for which the maximum tensile strain
equals or is less than the endurance limit. Figure 1 illustrates the use of theendurance limit within this method.
2. The introduction of the endurance limit into those design procedures that combineuse of the equivalent temperature concept and actual axle load distribution require
more computations of pavement response. The maximum tensile strain is
calculated at the equivalent temperature for each axle load within the axle loaddistribution. The axle load distribution for each axle type is used to determine theprobability of the tensile strain exceeding the endurance limit. The designer then
considers that probability of exceeding that critical value in designing an HMA
layer for which no fatigue damage would accumulate over time. Figure 2illustrates the use of the endurance limit within this method. One concern with
this method is that the higher loads result in significantly higher damage indices;an increase in axle load will result in an increase in damage to a power of about 4.

8/2/2019 Application of the Endurance Limit Premise-Von Quintus
http://slidepdf.com/reader/full/application-of-the-endurance-limit-premise-von-quintus 4/19
International Conference on Perpetual Pavements July 2006
Application of Endurance Limit in M-E Pavement Design
Harold L. Von Quintus, P.E.
Applied Research Associates, Inc.4
Thus, the probability of cracking is much higher than the probability of a specifictensile strain being exceeded.
3. Those design procedure that use the incremental damage concept establish athreshold value for the tensile strain, below which the fracture damage is assumed
to be zero. In other words, the procedure simply ignores tensile strains that equalor is less than the value set as the endurance limit for determining the incrementaldamage within a specific time period and depth. Successive runs have been made
with the M-E PDG to determine the difference in calculated fracture damage with
and without using the endurance limit as a HMA mixture property. Based on
limited runs, little difference was found between the two conditions. The reasonfor this finding is that most of the damage occurs for the higher strain levels and
higher temperatures. Figure 3 illustrates the increasing tensile strains at the
bottom of the HMA layer for increasing single axle loads applied to differentdynamic modulus values.
0
20
40
60
80
100
120
140
160
180
7 8 9 10 11 12 13 14 15 16 17 18 19
HMA Thickness, inches
T e n s i l e S t r a i n , B o t t o m o
f
H M A , m i c r o - s t r a i n s
Standard Mix; Conv. Low Modulus, Conv. High Modulus, Conv.
Standard Mix, Full-Depth Endurance Limit
Figure 1 Tensile strains calculated for an 18-kip single axle load for the
equivalent annual temperature for different HMA mixtures.
All M-E based design methods that consider the endurance limit design premise assume
that the endurance limit is independent of the mixture and temperature. The endurance
limit being the tensile strain below which no fracture damage occurs. This assumption
implies that the endurance limit is not a mixture property – one value applies to all HMAmixtures. Thus, the questions become, is the endurance limit a mixture property and
what value should be used as the endurance limit?

8/2/2019 Application of the Endurance Limit Premise-Von Quintus
http://slidepdf.com/reader/full/application-of-the-endurance-limit-premise-von-quintus 5/19
International Conference on Perpetual Pavements July 2006
Application of Endurance Limit in M-E Pavement Design
Harold L. Von Quintus, P.E.
Applied Research Associates, Inc.5
70
75
80
85
90
95
100
105
7 8 9 10 11 12 13 14 15 16 17 18 19
HMA Thickness, inches
P r o b a b i l i t y o f E x c e e d i n g
E n d u r a n c e L i m i t ( 6 5
m i c r o -
s t r a i n s ) , %
Standard Mix, Conv. Low Modulus, Conv.
High Modulus, Conv. Standard Mix , Full-Depth
Figure 2 Probability of exceeding the endurance limit for different HMA
mixtures using typical axle load distributions and seasonal
temperatures.
0
20
40
60
80
100
120
140
160
6 16 26 36
Single Axle Load, kips
T e n s i l e S t r a i n , B o t t o m o
f H M A
L a y e r , m i c r o
- s t r a i n s
Summer, 250 ksi E=450 ksi E=650 ksi Winter, 900 ksi Endurance Limit
Figure 3 Increasing tensile strains for varying single axle loads for different
seasons or dynamic modulus within those seasons (HMA thicknessequals 15 inches).
To try and answer these questions, laboratory fatigue testing programs have been
sponsored by different agencies within the past decade. The University of Illinois, the
Asphalt Institute, and NCHRP have on-gong studies. These studies are basicallylaboratory test programs to confirm and estimate the tensile strain that would result in an
unlimited number of load applications without any fatigue cracking failures of laboratory
Area with
fatigue damage.
Area without
fatigue damage.

8/2/2019 Application of the Endurance Limit Premise-Von Quintus
http://slidepdf.com/reader/full/application-of-the-endurance-limit-premise-von-quintus 6/19
International Conference on Perpetual Pavements July 2006
Application of Endurance Limit in M-E Pavement Design
Harold L. Von Quintus, P.E.
Applied Research Associates, Inc.6
prepared flexural beams. Historically, failure in the laboratory has been defined as areduction in stiffness of the beam test specimens – a 50 percent reduction in stiffness has
been used. Results from these laboratory test programs suggest that the endurance limit
is a valid design concept. No field studies, however, have been attempted to confirm orreject the endurance limit concept, nor estimate the values for the endurance limit.
Field Performance Data
The Long Term Pavement Performance (LTPP) program was initiated in 1988 to provide
pavement data for different materials and pavement performance studies. The programestablished hundreds of test sections across North America. These test sections vary
from thin HMA surfaced pavements to thick or deep-strength HMA surfaced pavements.
Many of these sections have HMA layer thicknesses in excess of 15 inches.
For these LTPP sections, distress surveys have been periodically performed to measure
the types and extents of load related distresses – including alligator area and longitudinal
cracks. As such, the LTPP database was used to evaluate the types of cracks exhibited atthe surface of thin to very thick HMA pavements and provide field performance data to
confirm or reject the endurance limit hypothesis. Specifically, the LTPP database was
used to try and answer three questions related to the endurance limit design premise, aslisted below.
1. Do field observations of alligator cracking over a range of pavements and siteconditions support the existence of an endurance limit as a HMA mixture
property?
2. If the field observations support the endurance limit hypothesis, what is the tensilestrain below which no more alligator cracking has been exhibited?
3.
Is the endurance limit independent of mixture type and dynamic modulus?
Defining the Endurance Limit – A Survivability Analysis
A survivability analysis was used to try and answer the above questions using the LTPPdatabase. This section of the paper describes the use of survival curves in determining
the thickness or level of tensile strain at which no to limited fatigue cracking has occurred
over long periods of time.
Development and Application of Survival Curves
Survival or probability of failure analyses have been used for decades in actuarial
sciences. They have also been used in the pavement industry to determine the expectedservice life of pavement structures for use in life cycle cost analysis, and to compare the
mean and standard deviation of the expected service life for different design features and
site factors in evaluating the adequacy of the design procedure (Gharaibeh and Darter,2002 and 2003). Survival curves are uniquely useful because every point on the curve
represents the probability that a given pavement section will be rehabilitated or exceed a
specific level of distress.

8/2/2019 Application of the Endurance Limit Premise-Von Quintus
http://slidepdf.com/reader/full/application-of-the-endurance-limit-premise-von-quintus 7/19
International Conference on Perpetual Pavements July 2006
Application of Endurance Limit in M-E Pavement Design
Harold L. Von Quintus, P.E.
Applied Research Associates, Inc.7
Survival analysis is a statistical method for determining the distribution of lives or “LifeExpectancy”, as well as the occurrence of a specific distress for a subset of pavements.
Since not all of the pavements included in the analysis have reached the end of their
service life or a specific level of distress, mean values cannot be used. The age oramount of alligator cracking and probability of occurrence are computed considering all
sections in the subset using statistical techniques.
Survival curves are typically based on age but can also be based on traffic loadings or the
probability of exceeding a specific level of distress. In either case, the condition at
failure must be based on a clearly defined condition. The definition of failure for
confirming the endurance limit premise is no alligator cracks. The M-E PDG and otherM-E based procedures assume that longitudinal cracks in the wheel path initiate at the
surface, while alligator cracks initiate at the bottom of the HMA layer (NCHRP, 2004).
This assumption was adopted for this paper.
Mathematical models are best fitted to the points in the survival curves to predict the
probability of survival or failure as a function of age, thickness, cumulative traffic, orpavement responses – like tensile strain at the bottom of the HMA layer. A survival
analysis can also be completed using a specific level of distress and pavement response
value. In other words, the survival curves can be used to define the probability that aspecific area of alligator cracking will be less than some specified amount for different
HMA thicknesses or tensile strains at the bottom of the HMA layer.
The reliability of a pavement depends on the length of time it has been in service, as wellas design features and site factors not properly accounted for in a thickness design
procedure. Thus, the distribution of the time to failure of a pavement type or thicknesslevel is important in reliability studies. A method used to characterize this distribution is
the failure rate or rate of occurrence for a specific level of distress. The failure rate is
discussed and mathematically defined within the remainder of this section.
If f(t) is the probability density of the time to failure of a given pavement type and
thickness, that is, the probability that the pavement will fail between times t and t+∆t is
given by f(t)* ∆t , then the probability that the pavement will fail on the interval from 0 tot is give by:
( ) ( )∫=t
dxt f t F 0
(1)
The probability of survival, R(t), is simply 1 minus the probability of failure. Thereliability function, expressing the probability that it survives to time t , is given by:
( ) ( )t F t R −=1 (2)

8/2/2019 Application of the Endurance Limit Premise-Von Quintus
http://slidepdf.com/reader/full/application-of-the-endurance-limit-premise-von-quintus 8/19
International Conference on Perpetual Pavements July 2006
Application of Endurance Limit in M-E Pavement Design
Harold L. Von Quintus, P.E.
Applied Research Associates, Inc.8
Thus, the probability that the pavement will fail in the interval from t to t+∆t is F(t+∆t)-
F(t), and the conditional probability of failure in this interval, given that the pavement
survived to time t , is expressed by:
( ) ( )
( )t R
t F t t F −∆+(3)
Dividing by ∆t , one can obtain the average rate of failure in the interval from t to t+∆t ,given that the pavement survived to time t :
( ) ( )( )⎥⎦
⎤⎢⎣
⎡
∆
−∆+
t Rt
t F t t F 1(4)
For small ∆t , one can get the failure rate, Z(t), which is:
( ) ( )( ) ( )( )t F t f
t Rt f t Z
−==
1(5)
The failure rate can be determined by organizing the performance data in terms of the
distribution of pavement age exceeding a critical level (failure) versus the distribution of
age for those pavement exhibiting a value lower than the critical value. The critical value
for perpetual pavements is nil alligator cracks.
Establish Baseline Survival Curve
A survivability analysis was completed by Von Quintus, et al. for the Asphalt Institute todetermine the expected age to an amount of fatigue cracking that would result in
rehabilitation of the roadway (Von Quintus, et al., 2004). The test sections used in thesurvival analysis were from the General Pavement Study (GPS) 1 and 2 experiments.Figure 4 shows the baseline probability of failure relationship from that data for different
levels of alligator or fatigue cracking measured on flexible pavements in the GPS-1 and 2
and Special Pavement Study (SPS) 1 experiments. The average life to crack initiation
and a low cracking amount (less than 10 percent of wheel path area) is 19 and 23 years,respectively.
Establish Endurance Limit Concept and Value
A similar survivability analysis was previously completed by Von Quintus in 1995 for a
subset of the test sections included in the GPS-1 and 2 experiments. The test sections
were randomly selected from the LTPP program with the thicker HMA layers. Thissurvivability analysis was completed to try and estimate a value for the endurance limit
based on alligator cracking observations, rather than just use values estimated fromlimited laboratory test programs. That survival analysis has not been formally
documented in the literature. The following summarizes the hypotheses and points that
were considered in that survivability analysis and in developing the survival curve.

8/2/2019 Application of the Endurance Limit Premise-Von Quintus
http://slidepdf.com/reader/full/application-of-the-endurance-limit-premise-von-quintus 9/19
International Conference on Perpetual Pavements July 2006
Application of Endurance Limit in M-E Pavement Design
Harold L. Von Quintus, P.E.
Applied Research Associates, Inc.9
Fatigue Cracking: Probability of Exceeding Specified Value
0
20
40
60
80
100
120
0 10 20 30 40
Age, years
P r o b a b i l i t y o f C r a c k i n g L e v e l , %
Crack Initiations
Low Cracking, >10%
Moderate Cracking,>20%
Excessive Cracking,>50%
Figure 4 Graphical illustration of the probability of failure or exceeding a
specified area of alligator cracking (Von Quintus, el al., 2004).
1. First, it is hypothesized that the slope of the survival curve for conventional-neat
HMA mixtures is relatively flat in the range of tensile strains that cause fracture
damage. This assumes that the HMA thickness has been designed to prevent
alligator cracking within the design period. In other words, the chance of failurefor a HMA layer designed for a lower traffic volume or higher tensile strain
(thinner HMA layer) should be the same as the HMA layer designed for a higher
traffic volume or lower tensile strain (thicker HMA layer).2. As the tensile strain approaches the endurance limit, it is hypothesized that the
slope of the survival curve will start to significantly increase. This range of
tensile strains is where the probability of projects exhibiting higher levels of alligator cracking significantly decrease.
3. At and below the endurance limit for conventional-neat HMA mixtures, it is
hypothesized that the slope of the survival curve is relatively flat. In other words,the chance of exhibiting alligator cracking at small tensile strains (within the
range of no fracture damage) is the same and dependent on other factors notrelated to wheel loads.
The LTPP data was used to determine the probability of occurrence of alligator cracking
for different HMA thicknesses and tensile strains. The EVERSTRESS program was used
to calculate the maximum tensile strain at the bottom of the HMA layer for each testsection using the equivalent temperature and equivalent single axle load concepts. The
equivalent annual modulus for the HMA layer was determined in accordance with the
8/2/2019 Application of the Endurance Limit Premise-Von Quintus
http://slidepdf.com/reader/full/application-of-the-endurance-limit-premise-von-quintus 10/19
International Conference on Perpetual Pavements July 2006
Application of Endurance Limit in M-E Pavement Design
Harold L. Von Quintus, P.E.
Applied Research Associates, Inc.10
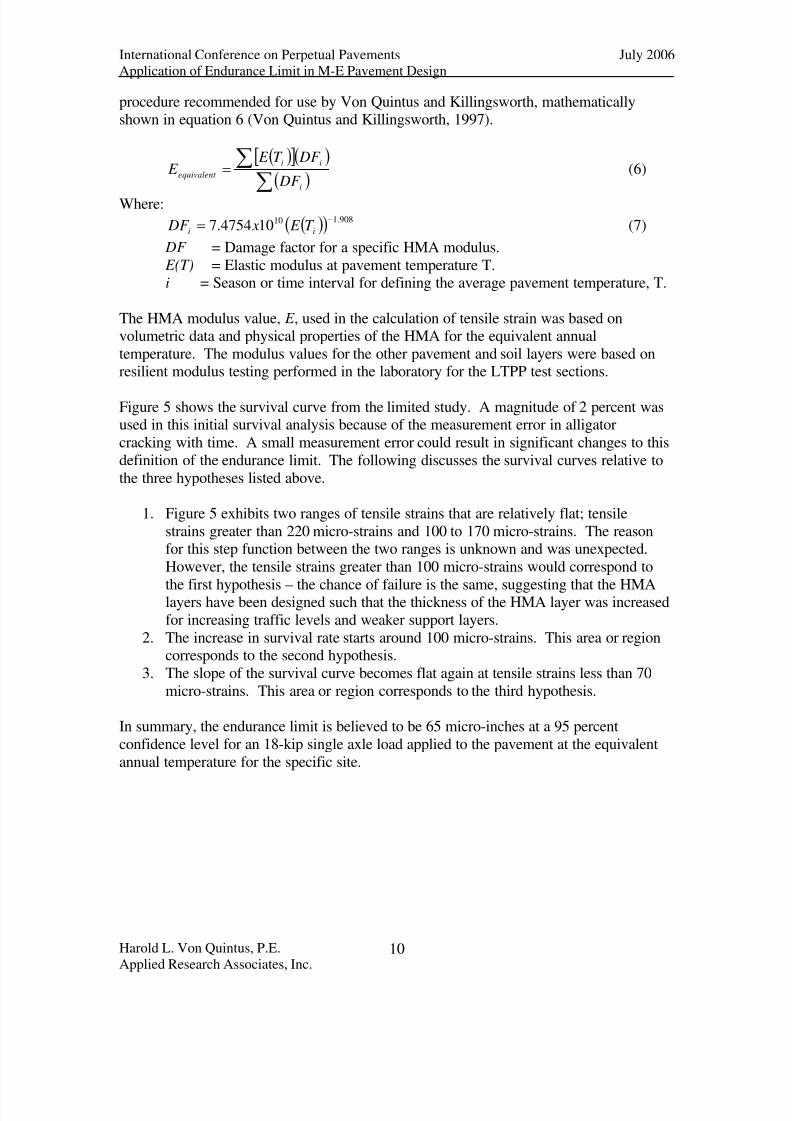
procedure recommended for use by Von Quintus and Killingsworth, mathematicallyshown in equation 6 (Von Quintus and Killingsworth, 1997).
( )[ ]( )
( )∑∑
=i
ii
equivalent DF
DF T E E (6)
Where:
( )( ) 908.110104754.7−= ii T E x DF (7)
DF = Damage factor for a specific HMA modulus. E(T) = Elastic modulus at pavement temperature T.i = Season or time interval for defining the average pavement temperature, T.
The HMA modulus value, E , used in the calculation of tensile strain was based onvolumetric data and physical properties of the HMA for the equivalent annual
temperature. The modulus values for the other pavement and soil layers were based onresilient modulus testing performed in the laboratory for the LTPP test sections.
Figure 5 shows the survival curve from the limited study. A magnitude of 2 percent wasused in this initial survival analysis because of the measurement error in alligator
cracking with time. A small measurement error could result in significant changes to this
definition of the endurance limit. The following discusses the survival curves relative to
the three hypotheses listed above.
1. Figure 5 exhibits two ranges of tensile strains that are relatively flat; tensile
strains greater than 220 micro-strains and 100 to 170 micro-strains. The reasonfor this step function between the two ranges is unknown and was unexpected.
However, the tensile strains greater than 100 micro-strains would correspond to
the first hypothesis – the chance of failure is the same, suggesting that the HMAlayers have been designed such that the thickness of the HMA layer was increased
for increasing traffic levels and weaker support layers.
2. The increase in survival rate starts around 100 micro-strains. This area or regioncorresponds to the second hypothesis.
3. The slope of the survival curve becomes flat again at tensile strains less than 70
micro-strains. This area or region corresponds to the third hypothesis.
In summary, the endurance limit is believed to be 65 micro-inches at a 95 percent
confidence level for an 18-kip single axle load applied to the pavement at the equivalent
annual temperature for the specific site.

8/2/2019 Application of the Endurance Limit Premise-Von Quintus
http://slidepdf.com/reader/full/application-of-the-endurance-limit-premise-von-quintus 11/19
International Conference on Perpetual Pavements July 2006
Application of Endurance Limit in M-E Pavement Design
Harold L. Von Quintus, P.E.
Applied Research Associates, Inc.11
50.00
55.0060.00
65.0070.00
75.00
80.0085.00
90.0095.00
100.00
40 60 80 100 120 140 160 180 200 220 240 260 280 300
Tensile Strain, micro-strains
P e r c e n t S u r v i v a l , %
Fatigue Cracking <2%
Figure 5 Survival curve for flexible pavements developed from data included inthe LTPP GPS-1 and 2 experiments (undocumented study, 1995).
Preliminary Definition of the Endurance Limit as a HMA Mixture Property
The AAMAS project sponsored by NCHRP recommended use of the indirect tensilestrength and modulus tests to estimate the fatigue strength of specific HMA mixtures
(Von Quintus, et al., 1991). Figure 6 illustrates that relationship between HMA modulus
and tensile strain at failure. Points below the line in Figure 6 are assumed to have inferiorfatigue properties, and those above the line exceed the fatigue strength of the “standard”
mixture. Laboratory tests and field observations of alligator cracking have been used to
check the validity of this relationship over time. Accelerate alligator cracking has been
observed where the tensile strain at failure is less than that value from Figure 6 for aspecific HMA modulus value based on the equivalent temperature concept. In other
words, the concept has not been fully validated but field observations of fatigue cracking
and mixture test results do support the hypothesis.
Figure 6 was developed long before the endurance limit concept was introduced and is
independent of Figure 5. However, a micro-strain of 65 (one percent of the tensile strainat failure) corresponds to an equivalent annual modulus value of 450 ksi – a typical value
used for many neat or conventional (unmodified) HMA mixtures. Von Quintus used this
relationship to estimate or define the endurance limit for different HMA mixtures as 1
percent of the tensile strain at failure measured in accordance with the test protocol from
the AAMAS study (Von Quintus, 2001). This definition and Figures 5 and 6 wouldsuggest that the endurance limit is a mixture property. Insufficient test data exists within
the LTPP database to estimate the endurance limit for the HMA mixtures included inFigure 5. As such, that definition has yet to be confirmed and validated.

8/2/2019 Application of the Endurance Limit Premise-Von Quintus
http://slidepdf.com/reader/full/application-of-the-endurance-limit-premise-von-quintus 12/19
International Conference on Perpetual Pavements July 2006
Application of Endurance Limit in M-E Pavement Design
Harold L. Von Quintus, P.E.
Applied Research Associates, Inc.12
1
10
100
10 100 1000 10000
Total Resilient Modulus, ksi
T e n s i l e S t r a i n a t F a i l u r e , m i l s / i n .
Figure 6 Relationship between modulus and tensile strain at failure to estimate
the fatigue strength of HMA mixtures (Von Quintus, et al., 2001).
Updated Survivability Analysis Using LTPP Data
Expanded Data Set
The survivability analysis completed for this project included the same test sections from
the 1995 study, plus additional test sections within the GPS 1 and 2 and SPS-1experiments. An expanded subset of the LTPP test sections was used, which were
randomly selected to cover all environmental regions, soil types, and HMA thicknesses.
The additional test sections used in the updated survivability analysis were from the GPS-1 and 2 and SPS-1 experiments – LTPP database version VR 2004.06, release 18.0
(2004). Figure 7 shows the distribution of HMA thickness for all test sections included in
the updated survivability analysis.
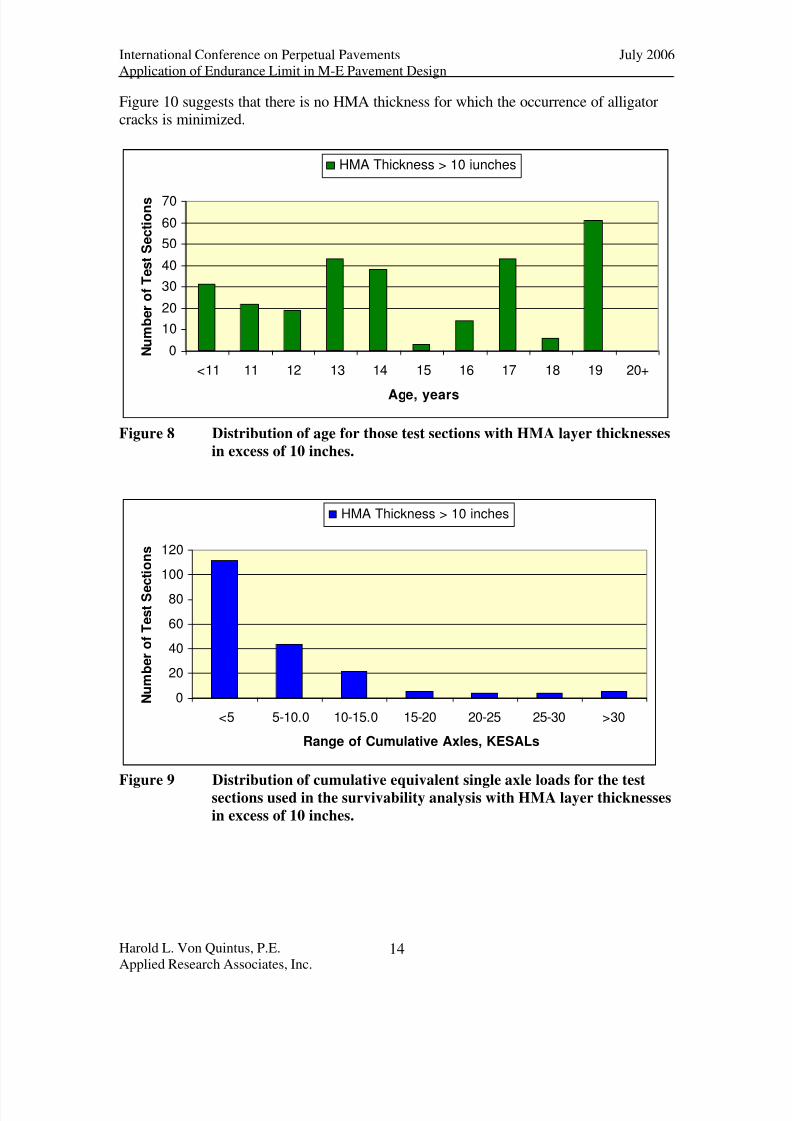
Figure 8 shows the distribution of pavement age for the test sections with more than 10
inches of HMA that were used to update the 1995 survival curve (Figure 5). As shown,the age of about half of the thicker test sections included in the updated study are greater
than 15 years but less than 20. Many of these additional test sections were from the SPS
-1 experiment that was excluded from the initial study to estimate the endurance limit.
The reason that the SPS-1 test sections were excluded from the study in 1995 is that mostof the projects within the SPS-1 experiment were new at that time.
The other important parameter in the survivability analysis is the truck traffic applied toeach of these test sections. Without significant truck traffic, defining the endurance limit
from field observations has limited meaning. Figure 9 shows the distribution of the
cumulative number of 18-kip ESALs for the test sections included in the updatedsurvivability study that have HMA thickness in excess of 10 inches. The cumulative

8/2/2019 Application of the Endurance Limit Premise-Von Quintus
http://slidepdf.com/reader/full/application-of-the-endurance-limit-premise-von-quintus 13/19
International Conference on Perpetual Pavements July 2006
Application of Endurance Limit in M-E Pavement Design
Harold L. Von Quintus, P.E.
Applied Research Associates, Inc.13
truck traffic for these thicker test sections is considered moderate traffic with most testsections having less than 15 million cumulative 18-kip ESALs.
0
10
20
30
40
50
60
70
80
90
100
110
Thickness layer of HMA Layers
N u m
b e r o f s e c t i o n s i n e a c h t h i c k n e s s l a y e
r
Series1 94 65 88 101 104 92 71 88 25
< 2 2.1-4 4.1-6 6.1-8 8.1-10 10.1-12 12.1-15 15.1-20 > 20
Figure 7 Distribution of HMA thickness for the test sections used in the
updated survivability analysis.
In summary, the test sections with the thicker HMA layers are not new pavements
(Figure 8), but do have truck traffic levels that are lower than what would be considered
heavy truck traffic (Figure 9). This level of truck traffic is a concern to the definitionestablished for the endurance limit. Much higher levels of truck traffic are needed to
validate the endurance limit design premise with field observations and data.
HMA Thickness-Based Definition
The asphalt industry has proposed some maximum HMA thicknesses that are believed to
be resistant to alligator cracking. The LTPP database was used to determine the level of HMA thickness at which none to little alligator cracking has been observed on HMA
pavement surfaces.
Figure 10 compares the amount of fatigue cracking (percent of wheel path area) from the
most recent distress survey and HMA thickness. The test sections with thinner HMA
layers generally have more fatigue cracking, as expected. However, there are anappreciable number of test sections with thicker HMA layers (15 inches or more) that
have levels of fatigue cracking exceeding 5 percent. The minimum thickness to prevent
alligator cracking is difficult to accurately define, because the strength of the foundationof the HMA layer is also important. In other words, flexible pavements with HMA
thicknesses exceeding 15 inches but with weak foundations can exhibit alligator cracking.
8/2/2019 Application of the Endurance Limit Premise-Von Quintus
http://slidepdf.com/reader/full/application-of-the-endurance-limit-premise-von-quintus 14/19
International Conference on Perpetual Pavements July 2006
Application of Endurance Limit in M-E Pavement Design
Harold L. Von Quintus, P.E.
Applied Research Associates, Inc.14
Figure 10 suggests that there is no HMA thickness for which the occurrence of alligatorcracks is minimized.
0
10
20
30
40
50
60
70
<11 11 12 13 14 15 16 17 18 19 20+
Age, years
N u m b e r o f T e s t S e c t i o n s
HMA Thickness > 10 iunches
Figure 8 Distribution of age for those test sections with HMA layer thicknesses
in excess of 10 inches.
0
20
40
60
80
100
120
<5 5-10.0 10-15.0 15-20 20-25 25-30 >30
Range of Cumulative Axles, KESALs
N u m b e r o f T e s t S e
c t i o n s
HMA Thickness > 10 inches
Figure 9 Distribution of cumulative equivalent single axle loads for the testsections used in the survivability analysis with HMA layer thicknesses
in excess of 10 inches.

8/2/2019 Application of the Endurance Limit Premise-Von Quintus
http://slidepdf.com/reader/full/application-of-the-endurance-limit-premise-von-quintus 15/19
International Conference on Perpetual Pavements July 2006
Application of Endurance Limit in M-E Pavement Design
Harold L. Von Quintus, P.E.
Applied Research Associates, Inc.15
0
10
20
30
40
50
6070
80
90
100
0 5 10 15 20 25 30
HMA Thickness, inches
A r e a F a t i g u e C r a c k i n g , %
Series1 Log. (Series1)
Figure 10 Comparison of area fatigue cracking (area alligator cracking based on
a percent of wheel path area) and HMA layer thickness.
Maximum Tensile Strain-Based Definition
Figure 11 compares the maximum tensile strain calculated for each section and HMA
thickness. The modulus of the HMA layer was determined using the equivalenttemperature concept for an 18-kip ESAL, as used in the original survivability analysis.
The tensile strains decrease with increasing HMA layer thickness, as expected.
Figure 12 compares the maximum tensile strain at the bottom of the HMA layer and the
amount of fatigue cracking observed on the LTPP test sections from the most recentdistress survey included in the LTPP database. The test sections with the lower tensile
strains have less fatigue or alligator cracking, just like the original survivability study.
An updated survival curve was developed for the additional alligator cracking data
recorded in the LTPP database. Figure 13 shows the results from the survival analysis for
a range of fatigue cracking levels. The results from the updated survival analysis aresignificantly different from the initial 1995 study. In fact, the updated survival curve for
the 1 and 2 percent alligator cracking levels would indicate that there is no endurance
limit for these sections. The relationships shown in Figure 13 for the 1 and 2 percent
cracking levels have a peak survival rate significantly less than 100 percent and thenbegin to decrease (increasing probability of exceeding the allowable value) with lower
tensile strain values.
Some of the GPS test sections without alligator cracks in 1995, now have some alligator
cracks recorded in the LTPP database for the test sections with the thickest HMA layers.
Possible reasons for the significant difference in results from the survival curvedeveloped in 1995 are summarized below.

8/2/2019 Application of the Endurance Limit Premise-Von Quintus
http://slidepdf.com/reader/full/application-of-the-endurance-limit-premise-von-quintus 16/19
International Conference on Perpetual Pavements July 2006
Application of Endurance Limit in M-E Pavement Design
Harold L. Von Quintus, P.E.
Applied Research Associates, Inc.16
10
100
1000
0 5 10 15 20 25 30
HMA Thickness, inches
T e n s i l e S t r a i n ,
M i c r o - i n c h e s
Series1 Power (Series1)
Figure 11 Comparison of the maximum tensile strain at the bottom of the HMA
layer and HMA thickness.
0
10
20
30
40
50
6070
80
90
100
10 100 1000 10000
Tensile Strain, micro-inches
F a t i g u e C r a c k i n g , %
Fatigue Cracking Log. (Fatigue Cracking)
Figure 12 Comparison of the area fatigue cracking for and maximum tensile
strain computed at the bottom of the HMA layer.

8/2/2019 Application of the Endurance Limit Premise-Von Quintus
http://slidepdf.com/reader/full/application-of-the-endurance-limit-premise-von-quintus 17/19
International Conference on Perpetual Pavements July 2006
Application of Endurance Limit in M-E Pavement Design
Harold L. Von Quintus, P.E.
Applied Research Associates, Inc.17
50.00
55.00
60.00
65.00
70.00
75.00
80.00
85.00
90.00
95.00
100.00
0 50 100 150 200 250 300 350 400 450
Tensile Strain, micro-strain
P e r c e n t S u r v i v a l ,
%
Fatigue <1% Fatigue <2% Fatigue <4% Fatigue <8%
Figure 13 Survival curves based on the maximum tensile strain at the bottom of
the HMA layers of flexible pavements included in the LTPP
program.1
• Adding the SPS-1 projects to the updated analysis. It is expected that including
the SPS-1 projects did not cause this difference in findings, unless the fatiguecracking initiated from some other design-site feature that would have a higher
probable occurrence within the SPS-1 test sections, as compared to the GPS
sections. In addition, the study completed for the Asphalt Pavement Alliance
concluded that there was a possibility that the GPS test sections selected by theindividual agencies for the LTPP program are biased towards the better
performing pavements. The SPS-1 projects were built during the LTPP program
and would not be biased towards better performing pavements. It is expected thatthis is not the reason for the difference in survival curves.
• Change in the LTPP definition of longitudinal cracking in the wheel path. The
change in definition could have affected the updated survival curve. Some of thepreviously measured longitudinal cracks that are assumed to have initiated at the
surface are now recorded as alligator cracking and are assumed to have initiated at
the bottom of the HMA layer. The cracking maps and video distress data logs can
be reviewed to segregate longitudinal cracks with crack deterioration along theedges from traditional alligator cracks. However, this evaluation process is time
consuming.
1Preliminary results from NCHRP project 9-38 ( Endurance Limit of Hot Mix Asphalt Mixtures to
Prevent Fatigue Cracking in Flexible Pavements) that is in progress; Prime Contractor – National
Center for Asphalt Technology.

8/2/2019 Application of the Endurance Limit Premise-Von Quintus
http://slidepdf.com/reader/full/application-of-the-endurance-limit-premise-von-quintus 18/19
International Conference on Perpetual Pavements July 2006
Application of Endurance Limit in M-E Pavement Design
Harold L. Von Quintus, P.E.
Applied Research Associates, Inc.18
• Assumption of where alligator cracks recorded in the LTPP database initiated. Asnoted above, alligator cracks are assumed to initiate at the bottom of the HMA
layer and propagate to the surface. The validity of this assumption would have an
effect on the survival curve. In addition, the maximum tensile strain at the bottom
of the HMA layer was based on the assumption of full-bond between all HMA
lifts. If partial bond exists between two lifts near the surface, load-related crackscan initiate at that location and propagate downward as well as upward. To
determine the location of crack initiation and whether full-bond exists between allHMA lifts requires a forensic investigation.
• The initial and updated survivability analysis was performed assuming that
stripping or moisture damage is not present within the HMA layer. Stripping andmoisture damage were adequately identified during the initial sampling and
coring program for the GPS test sections. For the SPS-1 projects, stripping or
moisture damage may have occurred on some of the projects and resulted inpremature alligator cracking for the thicker sections. This possible cause for the
difference in findings can be resolved with forensic investigations.
• An additional reason or explanation for the difference in results is that there is no
endurance limit for HMA mixtures.
Summary and Conclusions
The 1995 survival curve and test results from the Asphalt Aggregate Mixture Analysis
System (AAMAS) suggested that the endurance limit design premise has some validity.
Conversely, the survival analysis completed with the updated LTPP performance datasuggests just the opposite. Reasons for this discrepancy in results between different time
periods were provided in the paper and could support or reject the hypothesis.
Based on the results from the updated survival analysis, forensic investigations of the testsections with the thicker HMA layers are needed to confirm the location of crack
initiation and other assumptions used noted above in the survivability analysis. No
definite conclusion can be reached from the field performance data collected to date inthe LTPP database without a forensic investigation to confirm crack propagation
direction and determine which reason is correct.
In summary, however, it is still believed by the author that the endurance limit is a valid
design premise and is a HMA mixture property. As the modulus decreases, the
endurance limit increases in portion to the results presented in Figure 6.
Acknowledgement
The data used in this paper and study were extracted from the LTPP database, version VR
2004.6 release 18.0 (2004). In addition, the survival analysis using the updated LTPP
database was completed as part of NCHRP project 9-38, which is currently in progress.

8/2/2019 Application of the Endurance Limit Premise-Von Quintus
http://slidepdf.com/reader/full/application-of-the-endurance-limit-premise-von-quintus 19/19
International Conference on Perpetual Pavements July 2006
Application of Endurance Limit in M-E Pavement Design
Harold L. Von Quintus, P.E.
A li d R h A i t I19
References
1. N.G. Gharaibeh and M.I. Darter, Longevity of Highway Pavements In Illinois—2000
Update, Final Report FHWA-IL-UI-283, Illinois Department of Transportation,
Springfield, Illinois, 2002.
2. N. G. Gharaibeh and M. I. Darter, Probabilistic Analysis of Highway Pavement Life
for Illinois, Transportation Research Record 1823, Transportation Research Board,
Washington, D.C., 2003.
3. NCHRP, Guide for Mechanistic-Empirical Design of New and Rehabilitated
Pavement Structures: Part 1 – Introduction and Part 2 – Design Inputs , Final Reportfor NCHRP 1-37A, Prepared for National Cooperative Highway Research Program,
Applied Research Associates, Inc., March 2004.
4. NCHRP, Guide for Mechanistic-Empirical Design of New and Rehabilitated
Pavement Structures: Part 3 – Design Analysis and Part 4 – Low Volume Roads ,Final Report NCHRP 1-37A, Prepared for National Cooperative Highway Research
Program, Applied Research Associates, Inc., March 2004.
5. Von Quintus, H.L. and B. Killingsworth, Analyses Relating to Pavement Material
Characterizations and Their Effects on Pavement Performance, Publication Number
FHWA-RD-97-085, Federal Highway Administration, Washington, DC, August1997.
6. Von Quintus, Harold L. and Brian Killingsworth, Design Pamphlet for the
Determination of Layered Elastic Moduli for Flexible Pavement Design in Support of
the 1993 AASHTO Guide for the Design of Pavement Structures, Publication No.
FHWA-RD-097-077, Federal Highway Administration, Washington, DC, September1997.
7. Von Quintus, Harold L., Jagannath Mallela, and Jane Jiang, Expected Service Life
and Performance Characteristics of HMA Pavements in LTPP, Final Report 5672-
2/1, Applied Research Associates, Inc., prepared for the Asphalt Pavement Alliance,June 2004.
8. Von Quintus, Harold L., J.A. Scherocman, C.S. Hughes, and T.W. Kennedy, Asphalt-
Aggregate Mixture Analysis System: AAMAS, NCHRP Report No. 338, National
Cooperative Highway Research Program, National Research Council, Washington,
DC, March 1991.
9. Von Quintus, Harold L., Hot-Mix Asphalt Layer Thickness Design for Longer-Life
Bituminous Pavements, Transportation Research Circular No. 503 – Perpetual
Bituminous Pavements, Transportation Research Board, National Research Council,
Washington, DC., December 2001.