Embed Size (px)
Citation preview

WORKSHOP PROCEEDINGS:
Application of Resource Information
Technologies (GIS/GPS/RS) in Forest Land & Resources Management
October 18 - 20, 1999 Hanoi, Vietnam
Supported by: German Agency for Technical Cooperation
Sustainable Management of Resources in the Lower Me kong Basin Project (SMRP)
TABLE OF CONTENTS
SUSTAINABLE MANAGEMENT OF RESOURCES IN THE LOWER MEKONG BASIN
Selected Acronym List iii
Introduction iv
Foreword v
Opening Speech by Dr. Nguyen Hong Quan vi
PAPERS
"Appropriate Information Technology Transfer – Exam ples and Experiences from GTZ’s Technical Co-operation Projects." Berthold Hansmann (GTZ) & Herbert Christ (moderator)
1
Cambodia
"Application of GIS/GPS/RS in Environmental Data Ma nagement." Chuon Chanrithy, Department of Natural Resources Assessment and Environmental Data Management (Cambodia)
5
Page 1 of 6

"Introducing Resource Information Techniques for th e Benefit of Local Communities: The FAO ‘Tonle Sap Project’ Practical Experience (Siem Reap, Cambodia)." Etienne Delattre, FAO Siem Reap (Cambodia)
11
"GIS – What Can Go Wrong." Christoph Feldkötter, SMRP/Cambodia
20
"The Application of Geographic Information Systems (GIS) at the Land Titles Department." So Vanna, Land Titles Department (Cambodia)
32
Laos"The Use of Geographic Information Systems for Soil Survey and Land Evaluation." Inthavong Thavone, National Agriculture and Forestry Research Institute, Soil Survey and Land Classification Center (Laos)
38
"Application of Remote Sensing and GIS for Forest C over Monitoring in Lao PDR." Malychansouk Malyvanh (NPD/Laos) and Christoph Feldkötter (SMRP)
49
"Land Use Changes in the Upper Ca River Basin, Xien gkhuang Provinces, Lao PDR 1995 – 97: Effects of Roads and Rivers ." Sithong Thongmanivong, National University of Laos
67
Vietnam"GIS/GPS/RS Training for a Land Allocation Project of FAO in Quang Ninh Forest Inventory and Planning Agency: Experiences and Challenges." Pham Van Cu (VTGEO), Bart Dominicus (ADB 2852), et al. (Vietnam)
75
"Information Technologies for Forest Management in Vietnam." Nguyen Manh Cuong, Forest Inventory and Planning Institute/Hanoi
79
"Geographic Information System (GIS) as a Tool for Land Evaluation and Land Use Planning." Ho Quang Duc, National Institute for Soils and Fertilizers (NISF) (Vietnam)
85
"Land Use Changes and GIS-Database Development for Strategic Environmental Assessment in Ha Long Bay, Quang Ninh Province, Vietnam." Nguyen Dinh Duong (Institute of Geography), Eddy Nierynck (Department of Human Ecology, Free University of Brussels), et al.
92
"WWF Vietnam Experience with the Application of RS/ GPS/GIS Techniques, Results and Direction." Tran Minh Hien and Pham Hong Nguyen, WWF Indochina Programme
111
"The Need for Metadata for GIS Data Layers and Prod ucts." Stephen Leisz (CARE/Vietnam)
115
"Considerations for the Application of GIS/GPS for Land Use Planning and Land Allocation in the Son La and Lai Chau Provinces ." Pham Quoc Tuan (SFDP) (Vietnam)
121
"Potential of IRS-1 Panchromatic Satellite Image Da ta for Village- Level Land Use Planning: An Example from the Forestry Sector Project in Vietnam ." Vu Anh Tuan (VTGEO), Herbert Christ (ADB 2852),et al.
124
Europe & North America"Shifting Cultivation and Forest Cover Change in Ng he An Province, Vietnam." Jake Brunner, Siobhan Murray (WRI/Washington), et al.
135
"Remote Sensing Policies and Practicalities: Lesson s from the Past, Opportunities for the Future." Anthony C. Janetos and Jake Brunner (WRI/Washington, D.C.)
140
"Watershed Classification with GIS as an Instrument of Conflict Management in Tropical Highlands of the Lower Mekong Basin." Christine Knie and Kirsten Möller (University of Giessen/Germany)
146
WORKGROUP RESULTS 155
SUMMARY OF WORKGROUP RECOMMENDATIONS 163
LIST OF PARTICIPANTS 166
Page 2 of 6

SELECTED ACRONYMS
ADB Asian Development Bank
ADB 2852 ADB Forestry Sector Project in Vietnam
AIT Asian Institute for Training
ALES Automation Land Evaluation System
CF Community Forestry
CHIPS Copenhagen Image Processing System
CRB Ca River Basin (Laos)
FAO United National Food and Agriculture Organization
FCMP Forest Cover Monitoring Project (Lao PDR)
FIPC Forest Inventory and Planning Company (Vietnam)
FIPI Forest Inventory and Planning Institute (Vietnam)
GDCG General Department of cadastre and Geography (Cambodia)
GIS Geographic Information Systems
GPS Global Positioning System
GTZ German Technical Cooperation Agency
IRIC Integrated Resource Information Center (Cambodia)
IRS Indian Remote Sensing
LIS Land Information System
LMB Lower Mekong Basin
LTD Land Tenure Department (Cambodia)
LUP Land Use Planning
MRC Mekong River Commission
MRU Map Reporting Unit
NISF National Institute for Soils and Fertilizers
NPD National Project Director of SMRP
NUOL National University of Laos
PPMU Provincial Project Manager Unit
RMS Random Mean Square
RS Remote Sensing
SIM Satellite Image Map
SMRP Sustainable Management of Resources in the Lower Mekong Basin Project
SSLCC Soil Survey and Land Classification Center (Laos)
VTGEO Center for Remote Sensing and Geomatics (Vietnam)
WRI World Resources Institute
WWF World Wildlife Fund
Page 3 of 6

INTRODUCTION
The forest environment in southeast Asia, and in the Lower Mekong Region (LMR) in particular, is under increasing pressure from agricultural expansion, uncontrolled logging and fuelwood harvesting. Unsustainable levels of forest harvesting and increasing demands from rural populations on forest resources have already depleted large forest areas and have destroyed their productive and protective functions in the process.
Several efforts have been launched recently in the region to sustainably manage forest resources. In addition to the allocation of forest lands to local users, international and local initiatives strive to protect the forest environments judged most critical for biodiversity conservation and environmental protection. Successful implementation of the policies and programs associated with these efforts require reliable, up-to-date information on the geographic distribution and status of forest lands and resources, however.
In practice, central and local planners rely to a large extent on outdated maps at inadequate scales and unreliable statistics as the main sources for decision-making in forest land and resources management. This may lead to estimates -- of available resources, for example-- that in turn are used as the basis for government policies. All too often policies are thus based on serious misjudgments about the actual quantity, quality, location and pressure on local resources. Local conflicts that arise during implementation of land allocation or resource management programs would be largely avoidable if government planners and local decision makers had access to reliable, up-to-date resource information to:
a. correctly assess available forest lands and resources b. develop appropriate national and regional resource management policies and guidelines, c. design appropriate forest land and resource management programs and d. guide and monitor program implementation progress.
Modern resource information technologies like Geographic Information Systems (GIS), Remote Sensing (RS) and Global Positioning Systems (GPS) are already employed to collect and manage information on land use and natural resources in the countries of the Lower Mekong Region. Unfortunately, resource information management has not improved to the extent one would expect. In addition, the tools and techniques used do not seem to be regularly reviewed and updated to make the best use of available technology options and recent innovative developments.
In recognition of this situation, the German Agency for Technical Cooperation (GTZ) headquarters together with its Sustainable Management of Resources in the Lower Mekong Basin Project (SMRP) organized a regional workshop in October 1999 to provide an opportunity to exchange information and experiences, take stock of the lessons learned, and to review the potentials and constraints of modern resource information technologies in forest land and resources management in the region.
FOREWORD
The "Application of Resource Information Technologies (GIS/GPS/RS) in Forest Land and Resources Management" Workshop took place in the Thang Loi Hotel in Hanoi, Vietnam from October 18 – 20, 1999. The Workshop Staff included Mr. Herbert Christ (co-coordinator and workshop moderator), Mr. Michael Glück (co-coordinator) with backup from Pham Thi Thuy Co, Le Thanh Huong, Pham Phuong Hoa and Aylette Villemain.
Workshop Organization . The first day and a half of the workshop were devoted to the presentation of papers. The afternoon of the second day and the morning of the third were consumed by workgroup sessions, with the afternoon of the 20th dedicated to summarizing workshop recommendations. To facilitate and focus discussions, the conference was organized around the following major themes:
Technical Development. Technological options available to users today, their constraints and limitations in terms of information content, accuracy, cost-efficiency, training and institutional requirements etc.
Human Resources. Requirements in terms of number and qualification of staff for applying GIS/GPS/RS technologies, weaknesses most seriously hindering successful GIS/GPS/RS implementation and how can they be overcome, etc.
Page 4 of 6
Institutional Settings/Policy-based Constraints. Raising awareness among decision makers about the potentials of modern resource information technologies; assessing institutional setups and habits that hinder information sharing (e.g., perceived threats to existing hierarchies and power balances); improving access to and transparency of information; adapting management systems to cope with technology-based mapping and information management systems and ensure adequate budgeting for system maintenance (e.g., training, equipment upkeep and upgrades)
Workshop Participants . The workshop‘s thirty-seven participants were all professionals involved in forest resource and land management in the region who are either considering the use of or already applying modern geographic information management technologies. Regional participants (Cambodia, Laos, Thailand, Vietnam) were joined by international scientists and students working on these regional issues. In the interest of institutional diversity, any single institution was limited to two participants. A complete participant list is attached at the end of the Proceedings.
Organization of the Proceedings. The structure of the proceedings mirrors that of the workshop: The SMRP‘s Vietnamese National Project Director‘s opening statement is followed by the papers after which the reader will find documentation of the workgroups‘ sessions (including discussions). The proceedings conclude with documentation of the final session during which the workshops‘ objectives were revisited, key recommendations were summarized, and participants made a first stab at articulating what they as individuals and/or their institutions could do to advance the recommendations made.
In Closing …. It is anticipated that this is the first in an series of initiatives to improve communication among GIS users in the Mekong River Basin Region. Any reader of these Proceedings who would like to become part of this process is invited to check out the <www.mekonginfo.org> website and register their interest!
OPENING SPEECH
Dr. Nguyen Hong Quan
SMRP National Project Director/Vietnam, Deputy Director, Department For Forestry Developmen t
Ladies and Gentlemen, colleagues and friends:
Let me welcome you to Hanoi, Vietnam. I would like to express my gratitude to be able to greet you today on this event. I am especially pleased to address colleagues from the neighboring countries of the Lower Mekong Basin. Let me start by saying that this workshop will, besides exchanging experience related to our work, further improve our personal relationships amongst professionals working throughout the region.
This workshop will deal with Geographic Information Systems (GIS) and Remote Sensing (RS) as presently applied by numerous organizations and projects in many sectors throughout the region. During this event we hope to exchange our experiences and lessons learned. Over the past years, which made GIS an almost standard tool for projects and programs including spatial issues in their work, it also has become a point of criticism if applied in a pure technological centered way.
I, being a GIS novice in technical terms, see the potential of this powerful instrument. In Vietnam we are presently planning and implementing large government programs in the fields of Land use planning and forest land allocation, which depend on an effective, efficient technology to accommodate the process and results. GIS and related technologies, e.g. remote sensing, GPS, to mention a few, play a prominent role to support these new policies of Vietnam.
But let me also remind you – again viewing GIS as a non-technical person but more from an institutional point of view - that we should understand GIS/RS as a very important instrument and not as a means in itself. We all have experienced failures in the application of GIS if left to the technical purists. Enormous resources have been allocated to establish state-of-the-art technical systems but ignoring, at least partly, the human and institutional factors. Please understand me, GIS, as any IT system should be considered as a socio-technical system, in which the further development of humans running and using such systems must be undertaken.
Page 5 of 6

Education and Training aspects go hand in hand with the set up of GIS. Specialists working with GIS must not forget to transfer their analytical and visualized products to decision makers and the policy level, who need often results in a different language and do not only depend on technical perfection.
This brings me to my last point. I hope this workshop will help us to identify and clarify some of the institutional aspects of GIS. Often the technical issues, hardware, software, technical products are the focus of our activities. Often we realize, too late, that technically oriented persons ignored basic institutional aspects –intentionally or unintentionally. The question of ownership of the GIS unit, its resources and – more important - the products are often not addressed. Inter-institutional aspects to identify existing efforts and products are often ignored, justifying it by elaborating on different technical standards and packaging of the same basic data.
Dear participants, please let me summarize my points. I am sure that this event will contribute towards an exchange of experiences and lessons learned amongst your professional regional group. I am confident that this will lead to the improvement of existing and future GIS applications. Institutional and organizational issues like coordinated efforts to produce national data, jointly develop shared standards, legends and so on, could lead to a common language finally allowing to coordinate efforts on a regional level.
Let me express my gratitude to GTZ and the Sustainable Management of Resources in the Lower Mekong Basin Project for supporting our regional efforts in the field of GIS and remote sensing.
Go back the Table of Contents
Page 6 of 6

"Appropriate Information Technology Transfer - Examples and Experiences from GTZ’s Technical Co-operation Projects."
Slideshow, presented by Herbert Christ (moderator), based on materials provided by Berthold Hansmann (GTZ)
The following examples illustrate some typical examples of GTZ supported projects involved in applications of resource information technologies.
Implementation of Geographical Information System i n the Forestry Sector: ’The Sarawak Forest Department, MALAYSIA
Project Tasks:
1. To enable the Sarawak Forest Department to provide accurate and up-to-date information for forest monitoring, management and planning
2. To establish a Forest Information System
Major Results
� Capacity building � Establish a database on forest resources � Development of forest management applications � Support in institutional development
Problems
� Inter-institutional co-operation � Inter-institutional data sharing � Forest related information is considered as confidential � Inefficient intra-institutional data flow (following vertical hierarchy) � Lack of transparency of data availability � Missing quality monitoring schemes � Data are scattered, inconsistent and often duplicated � Financial constraints to update the system (hard- and software)
Implementation of GIS for Land Use Inventory and Mo nitoring, Indonesia
Background
� The National Land Agency (BPN) has the mandate to control land use and to implement land use plans.
� 200 Mio. ha have to be managed. � Modernisation of the system is required in order to secure a cost and time efficient land management
procedures.
Goal:
Institutional strengthening, assisting BPN in the development of the capability to apply modern methodology and technology to land use mapping and monitoring, while producing the land use maps required for planning and monitoring in priority areas.
Implementation of GIS for Land Use Inventory and Mo nitoring, Indonesia
Page 1 of 4
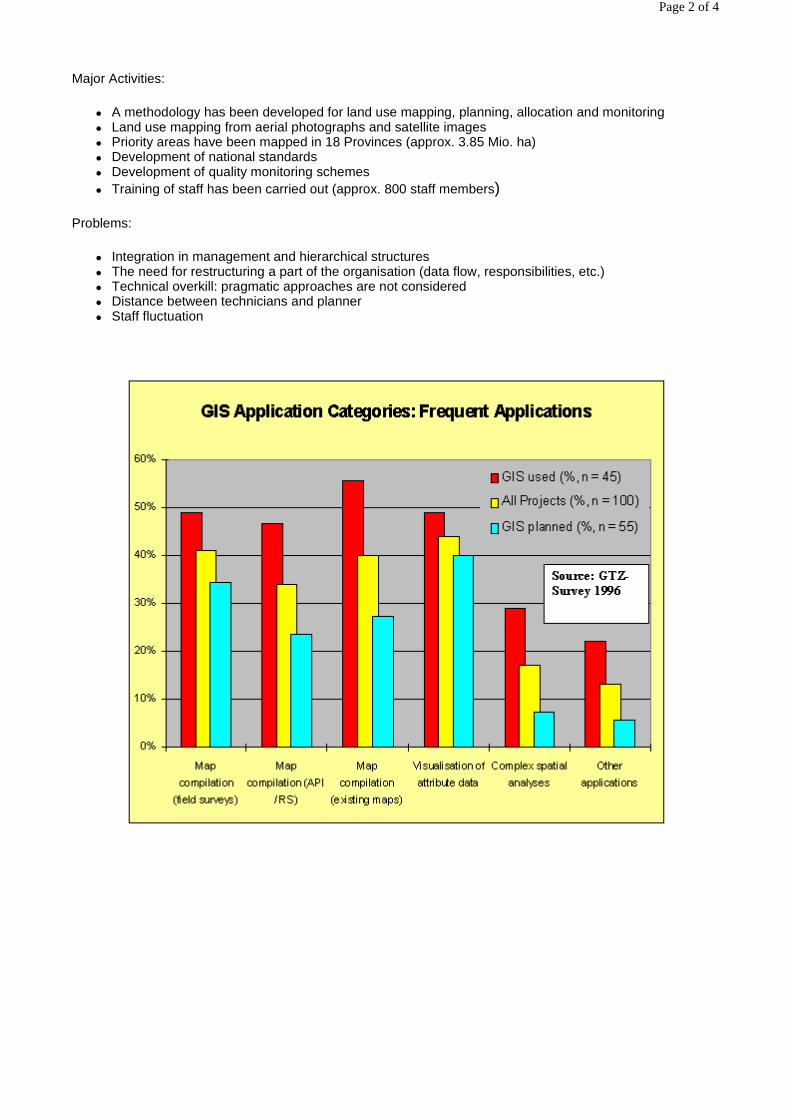
Major Activities:
� A methodology has been developed for land use mapping, planning, allocation and monitoring � Land use mapping from aerial photographs and satellite images � Priority areas have been mapped in 18 Provinces (approx. 3.85 Mio. ha) � Development of national standards � Development of quality monitoring schemes � Training of staff has been carried out (approx. 800 staff members)
Problems:
� Integration in management and hierarchical structures � The need for restructuring a part of the organisation (data flow, responsibilities, etc.) � Technical overkill: pragmatic approaches are not considered � Distance between technicians and planner � Staff fluctuation
Page 2 of 4

Typical Problems
Strategies/ Lessons learnt
� Transfer of Information has to be appropriate, considering the available human resources, motivations and cultural backgrounds of people
� Technology has to be brought to the user: Technology has to be transferred and adjusted in such a way, that the user can easily execute the given task in an efficient way
� Information systems should be introduced in phases: (Initiation, Implementation, Institutionalisation)
Organisational Aspects:
� Information Systems bring changes: � Ownership of the information
DATA
� lack of data � inconsistent data � wrong data � origin of data unclear � lack of meta data
ORGANIZATION
� qualification � fluctuation of Personnel � financial problems � donor dependency � no clear „GIS-concept"
Page 3 of 4

� Distribution of power within an organisation � Accessibility of data � An organisational setting has to be adopted according to the need of information flow and the decision
process � Hierarchical information flows are challenged by information networks
Need for Strategic Planning
� Identify objectives why the organisation wants to use GIS � Assess manner in which information is currently used in decision making in the organisation � Identify organisational constraints � Develop a vision for the information system’s use in the organisation � Estimate cost, risk and organisational impact of the vision � Determine feasibility of the vision.
Concluding Quotation: Globalisation and the information revolution present no threats, but hopes and opportunities. They give the developing world a dramatic chance to leapfrog into the future, breaking out of decades of stagnation and decline.' [after A. Fatoyinbo, D+C 2/1999]’
Go back the Table of Contents
Page 4 of 4

Application of GIS/GPS/RS in Environmental Data management
Chuon Chanrithy, Department of Natural Resources Assessment and Environmental Data Management (Cambodia)
GOAL/OBJECTIVE
� The goal is to allow resource allocation and environmental management decisions to be based on up-to-date/accurate information.
� The objective of our department will be to provide the mechanisms that will allow sharing of information in a timely manner among other departments of the Ministry of Environment as well as government institutions concerned with environmental and natural resources issues.
It is expected in the future that:
� Staff capacity will be increased and institutions strengthened in order to make informed decisions regarding sustainable development;
� Information sharing and exchanging promotion policies will be established for concerned institutions; � The availability and accessibility of environmental and natural resources data to national government
agencies and international community will be enhanced.
Environmental Data/Information
� Bio-physical data
� Socio-economic data
Core Dataset Preparation Requirement
� Infrastructure;
� Soil Class;
� Vegetation Cover;
� Air quality Measurement;
� Demography;
� Climate Zonation;
� Administrative Boundaries;
� Topography;
� Land Use;
� Geology;
� Major Harvesting Activities;
� Water Quality Measurements;
Page 1 of 6

� Soil Analysis Samples.
Meta-Database Preparation
Metadata refers to "data which describes data," including, data catalogues, data dictionaries, indexes and the like.
Each map should contain the reference year for the data types used, and the source of the data. There are two forms of data representation: i) State of Data that shows the state of a resource at one point in time, ii) Change in State that shows the change in state between two different times.
As data sets for different time periods are acquired, Change of State mapping should be used to enable the user to more readily assess environmental changes.
On-going activities are concentrated in:
� Preparation, storage, maintenance, and updating of data/information, including data catalogues, data dictionaries, indexes and the like;
� Capacity building in GIS and database management (including training, institutional strengthening and training of trainers); and
� Developing a national GIS database for Environmental Assessment and State of the Environment (SoE) Reporting.
APPLICATION OF GIS IN SUPPORT OF THE COASTAL AND MARINE ENVIRONMENTAL PLANNING AND MANAGEMENT
Summary of Key Issues for Coastal and Marine Waters
� Seven major issues in the coastal and marine areas of Cambodia were identified: � An almost complete lack of basic infrastructure for coastal and marine environmental management; � The absence of reliable data and base information from which to prepare and implement plans and
projects; � Severely degraded physical infrastructure: roads; irrigation systems; coastal protection dikes, etc. � Continuing lack of security in some of the coastal areas; � A severely inadequate legal and policy framework for coastal and marine environmental management
in particular, and for government and public administration in general; � Pervasive poverty; and � Degradation of productive natural resources, primarily fisheries and forestry resources (including those
contained in protected areas) that results primarily from poverty, a lack of physical infrastructure; and lack of security.
Changes in Condition and Protection of Existing Coastal and Marine Protected Areas
Status of Coastal Environment
Name Area (ha) Province
National Parks
Phnom Bokor 140,000 Kampot
Kep 5,000 Kep
Ream 15,000 Kg. Som
Botum Sakor 171,250 Koh Kong
Wildlife Sanctuaries
Peam Krasaop 23,750 Koh Kong
Multiple Use Management Areas
Dong Peng 27,700 Koh Kong
Page 2 of 6
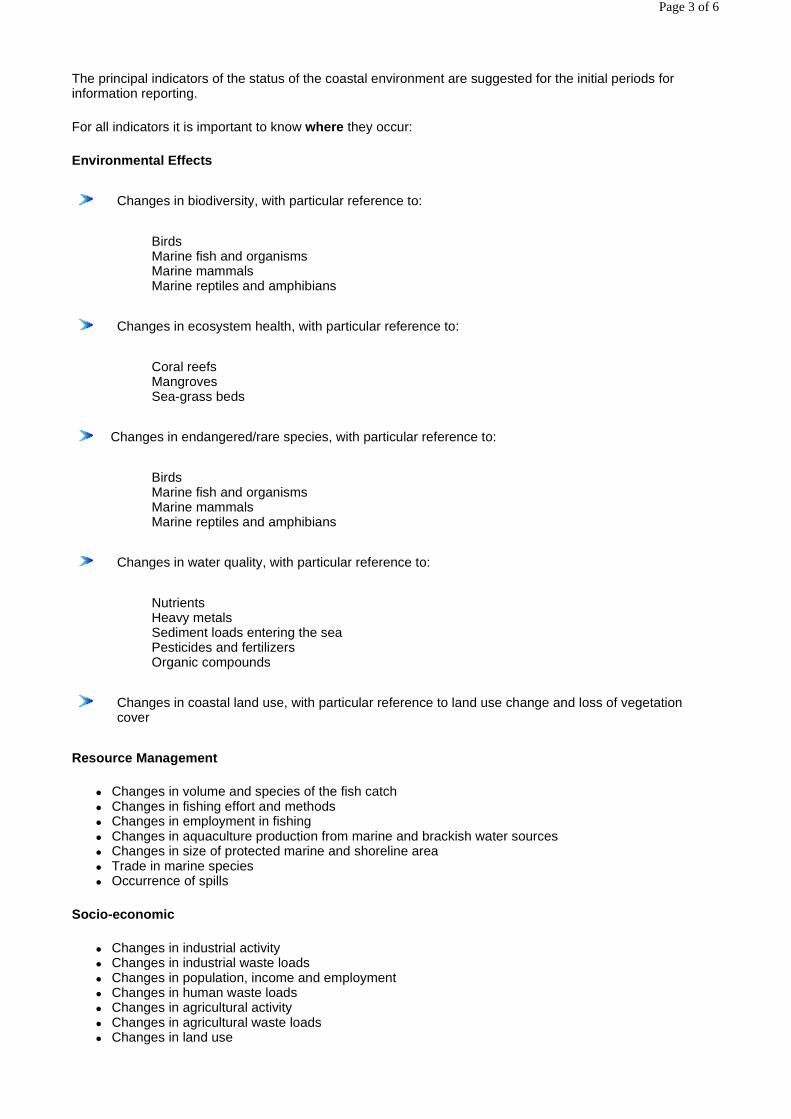
The principal indicators of the status of the coastal environment are suggested for the initial periods for information reporting.
For all indicators it is important to know where they occur:
Environmental Effects
Birds Marine fish and organisms Marine mammals Marine reptiles and amphibians
Coral reefs Mangroves Sea-grass beds
Birds Marine fish and organisms Marine mammals Marine reptiles and amphibians
Nutrients Heavy metals Sediment loads entering the sea Pesticides and fertilizers Organic compounds
Resource Management
� Changes in volume and species of the fish catch � Changes in fishing effort and methods � Changes in employment in fishing � Changes in aquaculture production from marine and brackish water sources � Changes in size of protected marine and shoreline area � Trade in marine species � Occurrence of spills
Socio-economic
� Changes in industrial activity � Changes in industrial waste loads � Changes in population, income and employment � Changes in human waste loads � Changes in agricultural activity � Changes in agricultural waste loads � Changes in land use
Changes in biodiversity, with particular reference to:
Changes in ecosystem health, with particular reference to:
Changes in endangered/rare species, with particular reference to:
Changes in water quality, with particular reference to:
Changes in coastal land use, with particular reference to land use change and loss of vegetation cover
Page 3 of 6

Coastal Map Development
� When considering developing a GIS-based macro scale reporting system, one must take into account the following:
� Costs associated with data acquisition, data preparation, and geo-referencing, not to mention updating of that data on a periodic basis;
� Data available or available in a format that meets geographical reporting are not considered all important;
� A single agency never has all data that would be needed in a geo-referenced coastal and marine environmental information management system; and
� Presentation of information in map form requires a basis for locating the information in the map. Concepts used in a textural document do not readily transfer to a map in a GIS.
Base Map Units
Where specific boundaries or locations for data are not known the data or the data concerns input to the coastal zone from inland (e.g. Sediment loads of rivers) the data should be referenced to the smallest coastal administrative unit (e.g. district, county, province).
The preferred "Map Reporting Unit" or MRU is for the district level. However, recognizing the practicality of scale and the logistical implications to establish a uniform level of data for reporting, it is recommended that the initial mapping system focus at the provincial level.
This map unit structure will allow a convenient way to provide a local, provincial and national level of reporting with defined geographic referencing.
Reference Data
Below is a guide to attribute data reporting.
Based Attribute Data Reference List Sample
Stream-flow: Where possible list as many of the following parameters as feasible:
� Name of monitoring station (more than one station may be entered) � Year or record � Drainage area (km²) � Mean monthly flows (cubic meters per second) � Peak flow (cubic meters per second) � Date of peak flow � Lowest flow in record (cubic meters per second) � Date of lowest flow
Employment structure
Numbers or percentage of people employed in main sectors (e.g. Tourism, Manufacturing, Agriculture, Forestry, Commerce, Retail, Oil industry, Fishing, Aquaculture, others) for the MRU
Endangered/rare species: List marine species for the MRU (as far as this is known):
� mammals � birds � fish � shellfish � amphibians/reptiles � Note endangered or rare species found in map unit (if none state none)
Waste handling facilities:
- For solid waste - For sewerage
Page 4 of 6
- For industrial waste, etc.
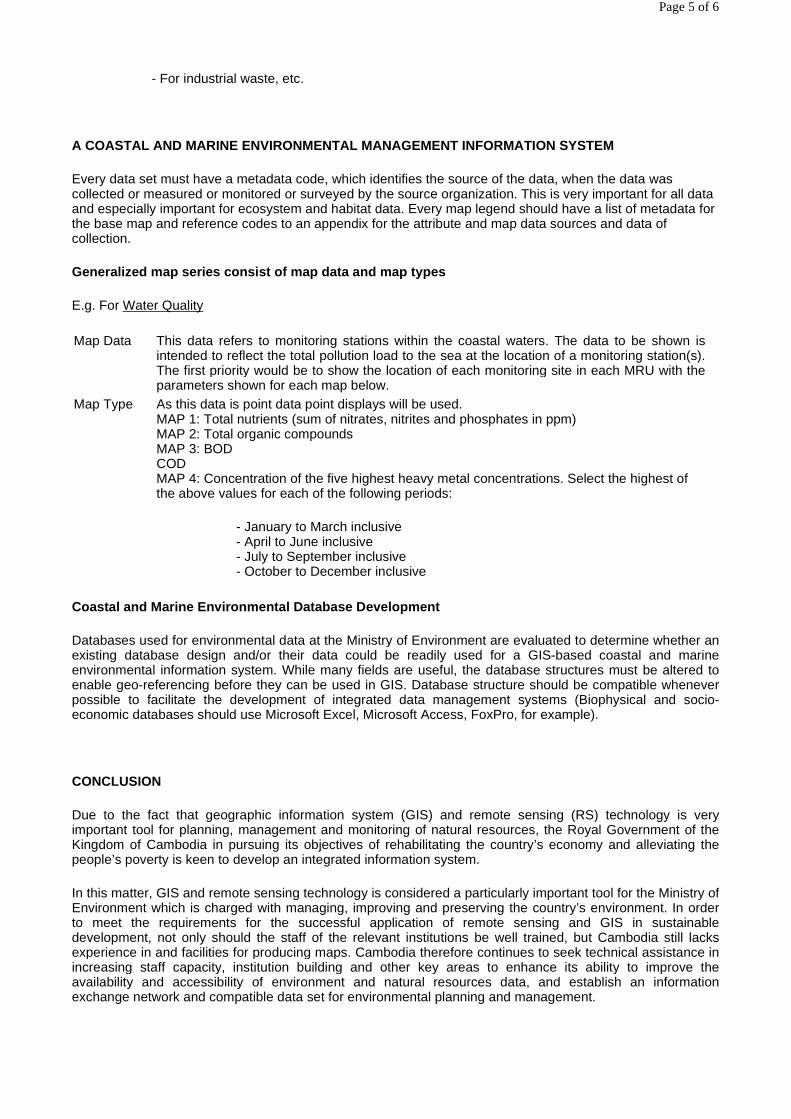
A COASTAL AND MARINE ENVIRONMENTAL MANAGEMENT INFORMATION SYSTEM
Every data set must have a metadata code, which identifies the source of the data, when the data was collected or measured or monitored or surveyed by the source organization. This is very important for all data and especially important for ecosystem and habitat data. Every map legend should have a list of metadata for the base map and reference codes to an appendix for the attribute and map data sources and data of collection.
Generalized map series consist of map data and map types
E.g. For Water Quality
Coastal and Marine Environmental Database Development
Databases used for environmental data at the Ministry of Environment are evaluated to determine whether an existing database design and/or their data could be readily used for a GIS-based coastal and marine environmental information system. While many fields are useful, the database structures must be altered to enable geo-referencing before they can be used in GIS. Database structure should be compatible whenever possible to facilitate the development of integrated data management systems (Biophysical and socio-economic databases should use Microsoft Excel, Microsoft Access, FoxPro, for example).
CONCLUSION
Due to the fact that geographic information system (GIS) and remote sensing (RS) technology is very important tool for planning, management and monitoring of natural resources, the Royal Government of the Kingdom of Cambodia in pursuing its objectives of rehabilitating the country’s economy and alleviating the people’s poverty is keen to develop an integrated information system.
In this matter, GIS and remote sensing technology is considered a particularly important tool for the Ministry of Environment which is charged with managing, improving and preserving the country’s environment. In order to meet the requirements for the successful application of remote sensing and GIS in sustainable development, not only should the staff of the relevant institutions be well trained, but Cambodia still lacks experience in and facilities for producing maps. Cambodia therefore continues to seek technical assistance in increasing staff capacity, institution building and other key areas to enhance its ability to improve the availability and accessibility of environment and natural resources data, and establish an information exchange network and compatible data set for environmental planning and management.
Map Data This data refers to monitoring stations within the coastal waters. The data to be shown is intended to reflect the total pollution load to the sea at the location of a monitoring station(s). The first priority would be to show the location of each monitoring site in each MRU with the parameters shown for each map below.
Map Type As this data is point data point displays will be used. MAP 1: Total nutrients (sum of nitrates, nitrites and phosphates in ppm) MAP 2: Total organic compounds MAP 3: BOD COD MAP 4: Concentration of the five highest heavy metal concentrations. Select the highest of the above values for each of the following periods:
- January to March inclusive - April to June inclusive - July to September inclusive - October to December inclusive
Page 5 of 6

REFERENCES:
Coastal and Marine Environment Management Information System, UNEP/EAP-AP (’96);
Sub-Regional Environmental Monitoring and Information System, ADB & Roche Int’l (’96);
GIS/RS Office, the Ministry of Environment.
Go back the Table of Contents
Page 6 of 6
Introducing Resource Information Techniques for the benefit of local communities: the FAO "Tonle Sap Project"
practical experience (Siem Reap, Cambodia)
Etienne Delattre, FAO Siem Reap (Cambodia)
ABSTRACT
The FAO "Tonle Sap" Project, based in Siem Reap (Angkor), Cambodia, is designed to address natural resources management issues around the Tonle Sap Lake, with a special concern for the degradation and loss of forest habitat. Since the potential usefulness of resource information technologies had been recognized by the project team, these tools have been introduced in the project to facilitate integrated forest resources management by local communities. This paper strives to present the Tonle Sap Project's GIS background, current status, ongoing activities, and the prospects for the future. It aims to show how such tools can be used in a predominantly field-oriented project based at the provincial level. It will discuss the potential use of existing data sets, including applications such as ranking of current forest productivity, identification of target sites for community forestry activities, or detailed mapping of community forestry sites. It will elaborate further on the main objective of the GIS work: the establishment of Natural Resource Data Bases. Finally, considering GIS as a tool and not an objective in itself, it will elaborate on the future GIS strategy as the main challenge, i.e. the establishment of a GIS based planning procedure, which can be adopted by the provincial departments; which is seen as the only possible way to ensure the sustainability of GIS and related resources assessment work beyond the duration of the project.
CONTENTS
Introduction
Project overview
GIS background and current status
Applications
GIS Unit strategies
Present focus : community forestry process Future objective : natural resource database
Conclusion
Bibliography
INTRODUCTION
The Food and Agriculture Organization of the United Nations’ (FAO) "Tonle Sap Project" based in Siem Reap (Angkor), Cambodia, is one of the few organizations in Cambodia involved in introducing and applying resource information technologies at all, and perhaps the only one doing so outside the capital, Phnom Penh. Having introduced RS/GPS/GIS tools step-by-step into its participatory forest resource use planning and management, FAO has learned valuable lessons on how best to integrate such technologies in a predominantly field-oriented project strictly located at the provincial level.
Page 1 of 8

PROJECT OVERVIEW
The "Participatory Natural Resources Management for the Tonle Sap Region" Project of the FAO was formulated in 1994 to address natural resources management issues around the Tonle Sap Lake. It intended to focus on the degradation and loss of the inundated forest habitat, which is believed to be of essential importance for the maintenance of productive fisheries within the lake. The Siem Reap province was selected, and activities were implemented in one target district, Sotr Nikum.
Project activities focus on the forestry and fisheries sectors. A considerable amount of ecological and socioeconomic data has been gathered during implementation of the project's various activities over the last three years. Trials and experiments on forestry, fisheries and other income generating activities yielded additional information, and laid the foundation for further development of an approach to sustainable management of the natural resources. A second phase began in September 1998, with thirty months of Belgian Government funding. The project's team is now implementing activities built upon the lessons of Phase 1 to focus on improving natural resources management by local communities.
The Phase 2 goal is therefore : "Sustainable management of natural resources within the Tonle Sap Basin through local community participation for the benefit of rural people and communities". The project has now expanded its activities to three additional districts along the lake shore of Siem Reap province, i.e. Siem Reap, Prasat Bakong and Puok districts; the project's target area now covers 262,300 hectares and has a population of over 340,000.
The project's team concentrates its activities on helping communities to assume responsible, productive and sustainable management of local forest resources, both in the upland areas as well as in the inundated forest zone. Trained counterpart staff provided by the Provincial Departments of Forestry, Fisheries, Agronomy, Rural Development and Environment undertakes fieldwork. In addition to community resource management, the project implements supporting activities which include: seedling production, agroforestry development, horticulture nursery development, on-farm aquaculture development, wood energy conservation program, micro-irrigation systems for vegetable production, environmental education and extension, and a rural credit program to support local development and income generating activities primarily among community forestry management groups.
GIS BACKGROUND AND CURRENT STATUS
Although the original project design had not foreseen a GIS component, GIS eventually became part of the activities and development of Phase 1, even though the important and preliminary step of assessing the relevance of installing and using GIS for the project was never really made.
Several GIS-related activities took place during Phase 1, albeit without a compelling strategy. In 1996, the designated Cambodian GIS counterpart received extensive GIS training in AIT/Bangkok, and some additional hands-on remote sensing practice in Phnom Penh, but was unfortunately never in a position to make use of this training. In 1997, Arc/Information software was purchased and installed, and a one-month GIS consultancy resulted in setting up a GIS database. This consultant’s end-of-mission report strongly recommended establishing a competent GIS unit within the project. Subsequent mapping exercises using GIS during Phase 1 were nonetheless contracted out to an external agency based in Phnom Penh (IRIC). The main data produced were land use/land cover data sets based on aerial photos (1/25,000 and 1/15,000 scale of 1992, 1996) for the project's target area.
The design of Phase 2 finally included a GIS component., including specific GIS-related expected outputs, recruitment of a GIS associate professional officer (APO), and an option for another GIS consultancy. As a consequence, GIS capacities improved significantly during Phase 2. First, computer availability and capacity, which was one among many key problems to develop GIS properly during Phase 1, has improved significantly. An appropriate computer was purchased and is now restricted to GIS and mapping purposes only. A CD writerhas been added to the hardware in order to make the converted GIS maps into formats which can be read by non-GIS software available to other project computers. An A3-size printer has been purchased as well, in order to produce final print maps of larger size. The project has decided to switch to ArcView, which is more user-friendly but still allows use of the existing GIS database without much difficulty. The GIS APO and his counterpart have both acquired skills in Arc/Info and ArcView, including intensive training. A second GIS consultancy provided the conceptual framework critical to reshaping the entire work of the GIS Unit. GIS staff is now able to extensively manage the GIS data base and the directory structure layout and to perform to a fair extent various analytical operations, such as calculate statistics for administrative or community forestry units or perform overlay procedures.
Page 2 of 8
Finally, a separate Cartography/GIS Unit has been established, and the GIS associate professional officer and his Cambodian counterpart are now in the process of applying their new technical skills to ensure that the GIS Unit’s work is tailored to serve project activities’ needs. The GIS database has been greatly expanded, and maps produced by the GIS Unit are exclusively made using a computer-based approach.
As with the project's Training and Documentation Center, the Cartography/GIS Unit intends to be accessible and helpful to everyone from the project staff as well as non-project provincial-level staff (e.g. provincial departments, other UN agencies or other organizations based in Siem Reap).
OVERVIEW: CURRENT STATUS OF GIS AND MAPPING MATERIALS
GIS Data
The GIS Unit has gathered GIS data gathered from outside agencies. These data sets include :
� administrative data (province, district, commune, village, protected areas) � land cover data � rivers and roads � elevation data � soils data
The GIS Unit has also created its own data, including
� Fishing lots boundaries � Community forestry sites boundaries � Dikes location
Maps
A large number of maps were collected or purchased from other agencies in Cambodia. The majority of these maps are at small scales (1:250,000 and smaller), potentially useful only for macro level planning. Nearly all these maps are based on data sets that have also been included in the GIS data base. In addition to these key reference maps, the GIS Unit also has a set of the US toposheets (1/50,000) made in the 1970's.
Aerial Photos
The GIS unit owns black and white aerial photos at 1:25,000 (1992 and 1996) and at 1:15,000 (1996) which cover parts of or the entire area where field activities are being implemented.
GPS
Two non-differential GPS navigation units linked to GPS software are extensively used in the field.
GIS UNIT STRATEGIES
Beside the day-to-day work undertaken by the GIS Unit in various fields of activities, efforts are to be concentrated into applications directly usable for the project's main focus, community forestry ("CF").
Present focus - Community Forestry process
The short-term strategy of the GIS Unit at present is to make the existing GIS data sets and other resource information techniques as useful as possible while implementing the Community Forestry process.
Overview: Community Forestry development strategy
Page 3 of 8

The goal of community forestry is to reduce natural resource degradation and loss by placing resource control and responsibility under local communities who have traditionally utilized the resources, and to assist these communities to achieve productive and sustainable resource management which meets local needs while stimulating community development.
The project assists interested communities to obtain recognized rights for management and utilization of locally accessible resources. Land tenure does not change, but resource tenure is transferred to the local community upon approval of their community forest management regulations. All products and revenue from the resource belong to the community for their utilization / distribution as defined in their regulations.
The approach adopted is one of facilitation to assist local community members to articulate what they want, what they see as their problems, what options and opportunities exist, and to help them reach a consensus on how to proceed.
The process now follows specific steps:
Site identification
Case Study
Observation/Assessment
Discussion
Workshop
Mapping
Identification of interest group
Selection of representatives of interest group/ Membership registration/Forest committee set up
Regulation / Boundary demarcation
Community forest management plan
Implementation of management plan
It should be mentioned that the project is keen to strictly follow a participatory approach in the entire process. Any GIS output is a considerable plus to implement this process, but should not be seen as an alternative to management. The GIS Unit prepares technical maps using remote sensing data, GPS, ground checking and GIS, to be discussed with the local people. Whenever needed, participatory sketch maps are still made on the spot, often using the materials prepared by the GIS Unit as a base map. The participatory sketch map tool is mostly left to the project's community forestry staff experienced with this kind of technique.
Present GIS Unit involvement
Two operations performed by the GIS Unit have a direct impact on implementing the CF process.
1- Process aerial photo
GIS Unit staff are trained in processing existing aerial photos, i.e. scanning, importing into GIS and geo-referencing them. This is of great benefit to the project’s community forestry activities, since the original photos can be enlarged from the 1:25,000 to the 1:5,000 scale with simple and inexpensive means. The enlargements can be taken to the field and be used in discussions with villagers, e.g. when identifying boundaries of potential community forestry sites. These enlargements have proven to be the best tool to help local populations to visualize the area -- topographic sheet and land cover map have been found to be rather meaningless for them.
Page 4 of 8
2- Import data from GPS surveys into GIS
Data from the GPS receivers used by the project field staff can be downloaded into the computer and then imported into the project’s GIS. This has already been widely practiced for numerous community forestry sites, as well as for other features such as roughly one hundred illegal dikes, which were surveyed earlier.
As any position on the ground read from a GPS receiver can be identified on the photo, the combination of these two tools (aerial photos and GPS) in a GIS is of great benefit for the project. By developing their use, the GIS Unit is directly involved in detailed mapping of Community Forestry Sites. Once an area has been identified and confirmed as a potential community forestry site, draft maps showing the CF area boundaries are prepared. It basically consists of spotting the different features which might serve as physical boundaries (such as rivers or roads), and collecting GPS points all along parts where no physical boundaries can be identified. A draft of the potential area limits is presented to the user group representatives during the discussion and workshop steps. When it is all agreed, the map is finalized and printed to be incorporated in the official CF agreement to be signed.
CF area limits demarcation is made by using inexpensive means, such as affixing wooden poles to the tallest trees in the flooded forest, or planting recognizable tree species seedlings in the upland area. Field check is made by the GIS Unit using GPS to detect any change in the limits of the CF area. Demarcation poles positioned on the ground are read from a GPS receiver; later the GPS navigation tool will help relocate them if needed.
For the more advanced CF sites, the project is now reaching the step of developing a community forest management plan. Additional large-scale maps dividing the CF area into compartments for different forest management strategies are required as well. These maps, based on scanned aerial photos, bring into discussion the forest management options, often enhancing the traditional knowledge of the local communities on the CF area. The locals make the final decisions, in a fully participatory approach; the area is then divided accordingly into different blocks (per forest product) and sub-blocks (per village). GPS measurements are made during demarcation when requested by the CF staff..
Future GIS involvement
In 1998, it was decided to target new community forestry sites based on the degree of utilization, and to work first with those sites which are under the heaviest pressure, i.e., those which may be lost unless immediate action is taken. To this end, the project conducted a resource assessment in all districts for long-term natural resource management planning.
However in reality, communities are approaching the project for assistance and demand is exceeding current staffing levels. Demand was easily created first by holding discussions with commune chiefs at district meetings which feeds back to the villages and starts the whole process. The project is now receiving direct requests from villages asking for assistance.
The CF process starts by the site identification step, which so far considers only the following criteria for selecting suitable sites to initiate community forestry:
� interest and assistance request from a local community ;
� idealistically, area with an existing local forest management system ;
� area with no serious disputes (land ownership claims, encroachment, military presence) ;
� forest resource users belonging to the same community.
The GIS Unit could provide a valuable input in this early stage as well, in the near future. It would consist in two main tasks:
1- Ranking of Current Forest Productivity
One could use the land cover data sets mapped from the 1:25,000 scale aerial photos (1992, 1996) in order to get a better overall picture of available forest resources at the district level. The classification scheme of these data sets in its original form does not provide this picture. However, one could re-group the various interpretation classes according to their current productivity (e.g. (simplified) Evergreen Forest > Deciduous
Page 5 of 8
Forest > Woodland > Shrubland). This may require some field activities in order to get a better idea of how classes (say, Woodland or Shrubland) actually look on the ground. The forest inventory information previously collected during Phase 1 may also be used in this context. The output would be maps showing the current forest productivity rather than the land cover with intangible classes like Bushland and Trees of Low Density. A map simply showing a productivity ranking (e.g. very high – high – medium – low – very low) would provide valuable insights compared to what is available at present.
2- Identification of Potential Target Sites for Community Forestry Activities
The information on current forest productivity generated in the previous step could next be used to help identify potential target sites for community forestry activities. Considering the project’s life span, one would therefore logically focus on activities in those areas that can be expected to provide maximum benefit to the target population, and which would serve as pilot sites for further action. Such areas would have to be identified through a structured selection procedure, combining information on areas of current forest productivity with information on population density and population distribution, which is available in the commune and village data sets (1998). Other valuable information such as forest products demand and supply have to be considered as well; the project-made natural resource assessment at the commune level (1998) would be a primary source of information.
Note: This procedure can of course only be used to help identifying potential target sites, at the first step of the CF process. It has to be followed by thorough case studies by the Community Forestry team, checking on the ground whether an area is available for community forestry management at all.
That step leads naturally towards the GIS Unit broader objective: building the Natural Resources Database.
FUTURE OBJECTIVE - NATURAL RESOURCE DB
One of the key final outputs of the project is to produce District action plans. Logically, the main objective of the GIS work stated in the Phase 2 Project Document, is to establish natural resource data bases. This is further specified by the Objective Verifiable Indicator Detailed natural resource data bases compiled for each district and accessible under GIS. Moreover, other Objective Verifiable Indicators are directly or indirectly related to GIS, including:
Number of communes and villages mapped for resource supply / demand
Environmental profiles prepared and accessible under GIS for the project’s four districts
GIS data base for six districts
Data base on fuelwood consumption for the various consumptive activities and options to decrease consumption evaluated
Data on Fish Pond Location and Characteristics
In order to achieve this objective, the preliminary step is for the project team together with staff from the provincial Forestry and Fisheries Departments to refine the information requirements for planning and implementing of forestry and fisheries activities at the district or commune level.
The main task of the GIS Unit will be then to further elaborate the components and contents of the Natural Resource Data Bases. This data base has to be built comprehensively, considering the following information layers :
� land cover � forest productivity (growth rates, timber production, fuelwood production) � land utilization (private, through communes, others) � land status (protected) � soils � hydrography and irrigation � transportation and accessibility � population
Page 6 of 8
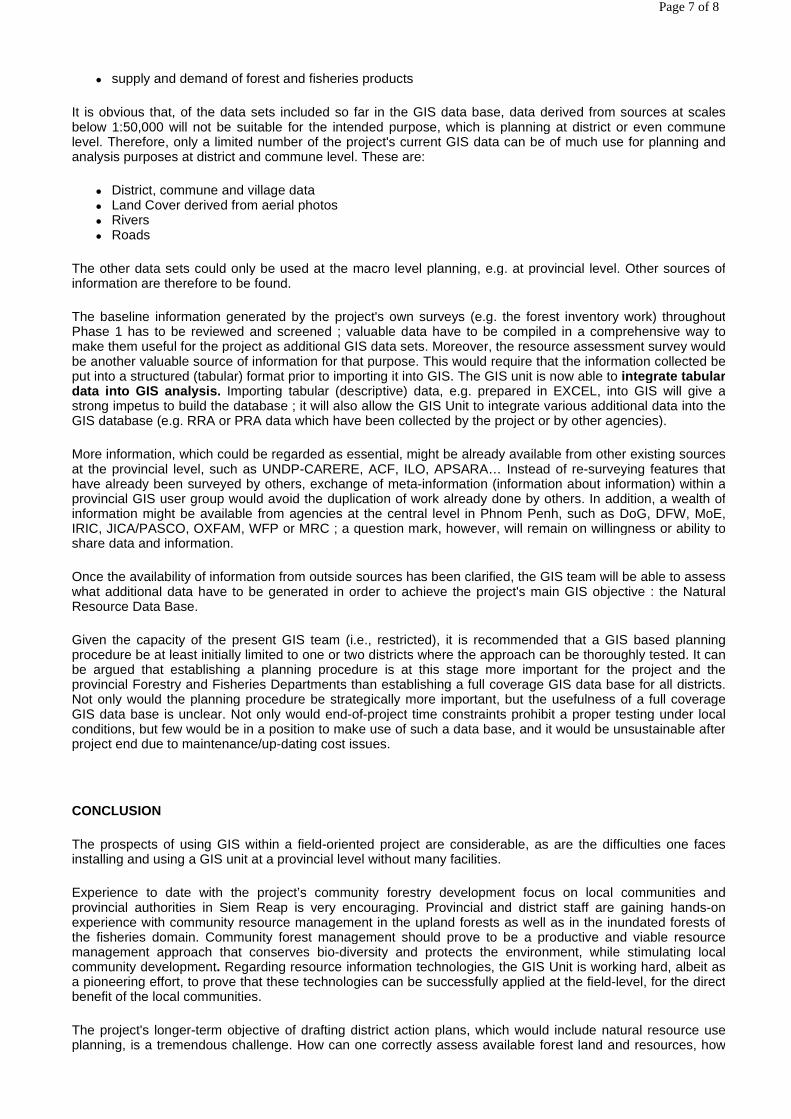
� supply and demand of forest and fisheries products
It is obvious that, of the data sets included so far in the GIS data base, data derived from sources at scales below 1:50,000 will not be suitable for the intended purpose, which is planning at district or even commune level. Therefore, only a limited number of the project's current GIS data can be of much use for planning and analysis purposes at district and commune level. These are:
� District, commune and village data � Land Cover derived from aerial photos � Rivers � Roads
The other data sets could only be used at the macro level planning, e.g. at provincial level. Other sources of information are therefore to be found.
The baseline information generated by the project's own surveys (e.g. the forest inventory work) throughout Phase 1 has to be reviewed and screened ; valuable data have to be compiled in a comprehensive way to make them useful for the project as additional GIS data sets. Moreover, the resource assessment survey would be another valuable source of information for that purpose. This would require that the information collected be put into a structured (tabular) format prior to importing it into GIS. The GIS unit is now able to integrate tabular data into GIS analysis. Importing tabular (descriptive) data, e.g. prepared in EXCEL, into GIS will give a strong impetus to build the database ; it will also allow the GIS Unit to integrate various additional data into the GIS database (e.g. RRA or PRA data which have been collected by the project or by other agencies).
More information, which could be regarded as essential, might be already available from other existing sources at the provincial level, such as UNDP-CARERE, ACF, ILO, APSARA… Instead of re-surveying features that have already been surveyed by others, exchange of meta-information (information about information) within a provincial GIS user group would avoid the duplication of work already done by others. In addition, a wealth of information might be available from agencies at the central level in Phnom Penh, such as DoG, DFW, MoE, IRIC, JICA/PASCO, OXFAM, WFP or MRC ; a question mark, however, will remain on willingness or ability to share data and information.
Once the availability of information from outside sources has been clarified, the GIS team will be able to assess what additional data have to be generated in order to achieve the project's main GIS objective : the Natural Resource Data Base.
Given the capacity of the present GIS team (i.e., restricted), it is recommended that a GIS based planning procedure be at least initially limited to one or two districts where the approach can be thoroughly tested. It can be argued that establishing a planning procedure is at this stage more important for the project and the provincial Forestry and Fisheries Departments than establishing a full coverage GIS data base for all districts. Not only would the planning procedure be strategically more important, but the usefulness of a full coverage GIS data base is unclear. Not only would end-of-project time constraints prohibit a proper testing under local conditions, but few would be in a position to make use of such a data base, and it would be unsustainable after project end due to maintenance/up-dating cost issues.
CONCLUSION
The prospects of using GIS within a field-oriented project are considerable, as are the difficulties one faces installing and using a GIS unit at a provincial level without many facilities.
Experience to date with the project’s community forestry development focus on local communities and provincial authorities in Siem Reap is very encouraging. Provincial and district staff are gaining hands-on experience with community resource management in the upland forests as well as in the inundated forests of the fisheries domain. Community forest management should prove to be a productive and viable resource management approach that conserves bio-diversity and protects the environment, while stimulating local community development. Regarding resource information technologies, the GIS Unit is working hard, albeit as a pioneering effort, to prove that these technologies can be successfully applied at the field-level, for the direct benefit of the local communities.
The project's longer-term objective of drafting district action plans, which would include natural resource use planning, is a tremendous challenge. How can one correctly assess available forest land and resources, how
Page 7 of 8

can one best design appropriate forest land and resource management program? The GIS Unit should naturally take the lead in attempting to answer these questions. Surprisingly perhaps, the main difficulty facing the GIS Unit in contributing to achieve this objective might not be technical constraints, such as the lack of reliable, up-to-date, adequate or accurate geographic information, or human resources limitation. The GIS Unit can be deemed fully successful only at that point where its clients (i.e., various project components, non-project staffs at the provincial level such as Forestry or Fisheries Departments officials) are truly convinced that resource information techniques are useful for their ground level activities planning and implementation.
Idealistically, the GIS Unit has to run as a two-person component with a GIS specialist to handle information availability and lead the procedure, and a map theme specialist, with his own specific knowledge of information. With such a team, the GIS Unit would finally be a position to give definitive technical advice on (a) which information requirements can be satisfied based on the existing information, and (b) what additional information would have to be compiled before needs can be met. The very existence and sustainability of the GIS Unit will depend on its being perceived as a responsive technical service unit for province-level clients, as opposed to a project activity that operates in isolation. Being able to succeed in these objectives would mean that the GIS Unit would be truly established as an efficient and tool for facilitating integrated natural resources management by communities at the local level, and be in a position to contribute to developing natural resources use planning options for decision-makers at higher level. That is the project's GIS Unit’s goal for the year 2001, admittedly not a long way away!
BIBLIOGRAPHY
DELATTRE, E. (1998), "GIS Status Update from the FAO Tonle Sap Project", Food and Agriculture Organization of the United Nations (FAO Siem Reap), paper presented at the Seminar on "Environmental Data and Information Management", ADB, Phnom Penh, December 1998
FELDKÖTTER, C. (1999), "Report on Geographic Information Systems Consultancy", Food and Agriculture Organization of the United Nations (FAO Siem Reap), Siem Reap, July 1999
PRAK, M. & EVANS, P. (1999), "Community Forestry Development", Food and Agriculture Organization of the United Nations (FAO Siem Reap), paper presented at the Workshop on "Participatory Land Use Planning in Cambodia", GTZ/MRC/ADB, Phnom Penh, September 1999
Go back the Table of Contents
Page 8 of 8

GIS – WHAT CAN GO WRONG?
Christoph Feldkötter, SMRP/Cambodia
ABSTRACT
This presentation discusses experiences and especially problems faced with GIS operations in the region. The author has been working as a GIS and Remote Sensing consultant to the Forest Cover Monitoring Project (FCMP), to the Sustainable Management of Resources in the Lower Mekong Basin Project (SMRP), and to a number of other GIS related projects in the region operating at various levels and scales.
The first part of this presentation deals with technical aspects, i.e. scale issues, geo-referencing, data generation, quality control, data base maintenance, and system configurations
The second part of this presentation discusses human resources aspects, i.e. staff selection, qualification requirements, introductory training, and upgrading of knowledge.
The third part of this presentation deals with data use and institutional aspects, i.e. data ownership, data distribution, metadata bases, data pools, and research and practice.
The main problems encountered are highlighted .
Since the problems faced with GIS are numerous, the issues reported here can not be discussed in great detail. This presentation does not provide readily made solutions. It merely intends to focus attention and to encourage discussions on the issues reported, which may eventually help finding better solutions.
WHAT IS GIS USED FOR?
In Theory …
There are several definitions of what GIS is and what it should be used for. The following two definitions are probably the most common ones:
The IMAP Model
� Input � Management � Analysis � Presentation
"A GIS is a system composed of hardware, software and procedures for the
� capture � storage � manipulation � analysis � modeling � output
of spatial data to solve complex planning and management problems."
… And In Practice
Looking at what remains of these definitions in practice in the region, one often finds the following situation:
Page 1 of 9

The ImP Model
(++ much used, + used, - little used, -- rarely (or not at all) used)
"A GIS is a system composed of hardware, software and procedures for the
of spatial data to solve complex planning and management problems."
WHAT IS GIS USED FOR?
Conclusions
Looking at what GIS is used for in practice in the region, one arrives at the following conclusions and questions:
� Not only data input or capture (from existing sources), but DATA GENERATION probably constitutes the most important component of GIS applications.
� Using GIS for Data Generation is perfectly justifiable given the lack of accurate and / or up-to-date base data. The analytical capacities of GIS can not be used unless one has the necessary base data in place, or, as Sherlock Holmes put it: "It is grave mistake to draw conclusions before one has data."
� A frequently read GIS guidline states: "In the 1970s, one could, with reason, have argued that GIS was essentially an extension of cartography with other tools."
INTRODUCTION: WHAT DO WE EXPECT FROM GIS DATA?
Accuracy
GIS data should reflect the situation on the ground.
� Positional : the location of objects on GIS should depict their location on the ground as accurately as possible.
� Thematical : the classification of objects on GIS should depict their character on the ground as accurately as possible.
Up-To-Dateness:
� input ++
� management +
� analysis --
� presentation ++
� capture ++
� storage +
� manipulation -
� analysis --
� modeling --
� output ++
Page 2 of 9

GIS data should be recent.
Availability
GIS data should be available
TECHNICAL: PIXEL SIZE AND INFORMATION CONTENT
PIXEL = smallest unit of an image
(Information Content is to be understood as the theoretical maximum given infinite object detail.)
One should keep in mind:
� The maximum scale depends on the pixel size. � The information content does not grow proportionally, but with the square of the resolution (or scale)
ratio.
TECHNICAL: DIGITIZING TIMES AT VARIOUS SCALES
Source scale 250,000 100,000 50,000 25,000 10,000 5,000
Page 3 of 9
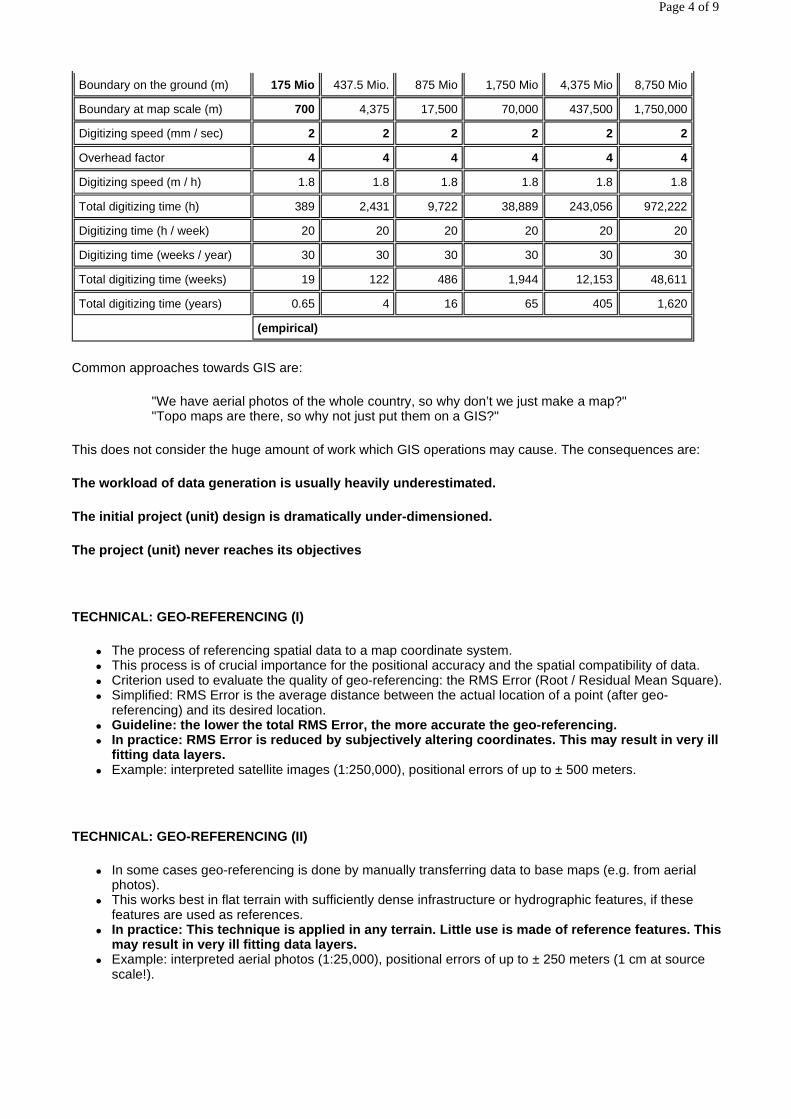
Common approaches towards GIS are:
"We have aerial photos of the whole country, so why don’t we just make a map?" "Topo maps are there, so why not just put them on a GIS?"
This does not consider the huge amount of work which GIS operations may cause. The consequences are:
The workload of data generation is usually heavily underestimated.
The initial project (unit) design is dramatically u nder-dimensioned.
The project (unit) never reaches its objectives
TECHNICAL: GEO-REFERENCING (I)
� The process of referencing spatial data to a map coordinate system. � This process is of crucial importance for the positional accuracy and the spatial compatibility of data. � Criterion used to evaluate the quality of geo-referencing: the RMS Error (Root / Residual Mean Square). � Simplified: RMS Error is the average distance between the actual location of a point (after geo-
referencing) and its desired location. � Guideline: the lower the total RMS Error, the more accurate the geo-referencing. � In practice: RMS Error is reduced by subjectively a ltering coordinates. This may result in very ill
fitting data layers. � Example: interpreted satellite images (1:250,000), positional errors of up to ± 500 meters.
TECHNICAL: GEO-REFERENCING (II)
� In some cases geo-referencing is done by manually transferring data to base maps (e.g. from aerial photos).
� This works best in flat terrain with sufficiently dense infrastructure or hydrographic features, if these features are used as references.
� In practice: This technique is applied in any terra in. Little use is made of reference features. This may result in very ill fitting data layers.
� Example: interpreted aerial photos (1:25,000), positional errors of up to ± 250 meters (1 cm at source scale!).
Boundary on the ground (m) 175 Mio 437.5 Mio. 875 Mio 1,750 Mio 4,375 Mio 8,750 Mio
Boundary at map scale (m) 700 4,375 17,500 70,000 437,500 1,750,000
Digitizing speed (mm / sec) 2 2 2 2 2 2
Overhead factor 4 4 4 4 4 4
Digitizing speed (m / h) 1.8 1.8 1.8 1.8 1.8 1.8
Total digitizing time (h) 389 2,431 9,722 38,889 243,056 972,222
Digitizing time (h / week) 20 20 20 20 20 20
Digitizing time (weeks / year) 30 30 30 30 30 30
Total digitizing time (weeks) 19 122 486 1,944 12,153 48,611
Total digitizing time (years) 0.65 4 16 65 405 1,620
(empirical)
Page 4 of 9

TECHNICAL: DATA GENERATION / INTERPRETATION
� GIS data generation is time-consuming, strenuous and often tedious work. � "Some people feel their qualifications render the routine work to be beneath their dignity (of
interpretation). In these instances, such work is given to newcomers or less-qualified staff."
Page 5 of 9

� Supervision is not done properly. � Disastrous effects on data quality in terms of both positional and thematic accuracy. � Example I: Satellite image interpretation (1:100,000).
In a full coverage repetition experiment only 64 % of the area was assigned to the same class in both rounds. Even if the interpretation was simplified to only two classes (Forest and Non-Forest), only 88 % of the area were assigned to the same class in both rounds.
� Example II: Satellite image interpretation (1:100,000). In a sample repetition experiment simplified to only 2 classes (Forest and Non-Forest) only 52 % of the area was assigned to the same class in both rounds. This almost amounts to random assignment!
TECHNICAL: DATA BASE MAINTENANCE
� GIS data bases can be huge (thousands of files, several gigabytes). � GIS data bases are commonly used and updated by various operators simultaneously. � Operators tend to keep the data sets they are currently working on in a rather unorganized way. � Data sets are not named after their content, but after the operator (or his daughter …). � Different updates are simultaneously applied to copies of the same data sets. � Data sets are split for map printing purposes. � Insufficient or no documentation is kept. � It becomes extremely difficult to retrieve informat ion. Enormous time has to be spent on
organizing data before the fabled analytical capaci ties of GIS can be put to any use.
TECHNICAL: SYSTEM SETUP
Over-Dimensioned Systems
� Example: UNIX based Systems, ArcInfo Systems � Expensive Hardware & Software � Complicated System Maintenance � Local Support often not available � Too much time is spent learning, understanding (and playing with) system & software -> less
time spent on production � High risk of individuals gaining hidden executive p ower due to their system management
abilities
Under-Dimensioned Systems
� Example: Slow (Standard Office) Computers, Insufficient Storage Space, Outdated Software (PC ArcInfo), No Networks
� Frequent Mistake: Cheapest Computers are purchased. Education-oriented systems (IDRISI) are used in a production environment.
� Too much time is spent on routine tasks and data sw apping ® less time is spent on production
HUMAN RESOURCES: STAFF SELECTION
� It is a frequently told (and believed) myth, supported by the industry, that GIS can be used by anyone. This may be true if the objective is just running a couple of queries on a ready-made database. The situation is entirely different if the objective is data generation.
� GIS is a powerful tool. However, one can not expect that it can be operated just like any other computer software.
� Using GIS efficiently does require a certain degree of mathematical, geometrical and logical understanding plus organizational skills.
� GIS staff often are (have to be) selected from an existing pool of available staff. This may be no problem if a GIS is set up in an organization with a geographical background (such as cartography).
Page 6 of 9

The situation may be entirely different if a GIS is set up in e.g. agriculture or forestry ("the tree identification specialist turned geographer").
� Background qualifications of available staff can ma ke or break the success of a GIS installation.
HUMAN RESOURCES: INTRODUCTORY TRAINING
� Introductory training is often held in national or regional training centers. � These institutions will train people in basic operations.
They will train people in the software packages they have available on the training site. The training is normally done without regard to specific (institutional or project) requirements. Result: staff normally have to be re-trained on-the-job later. This normally happens with a considerable delay, so skills acquired during the introductory training have already been forgotten.
� People are rarely, if ever, trained to read (the Help). � Introductory training is not planned carefully. In many cases it does not produce the expected
results. Expensive follow-ups become necessary.
HUMAN RESOURCES: Skills Upgrading
� The life span of software packages is not more than 2 - 3 years. � With every (major) new software generation, productivity increases significantly (example: PC ArcInfo -
ArcView). � GIS staff, however, have a tendency to stick to procedures once established, thus giving away major
advantages that could be gained from software upgrades. � It is frequently done, but normally not sufficient to buy software upgrades without providing additional
training. � Additional training, if provided, is often held in national or regional training centers. Frequently, this is
just a repetition of the basic training. � Upgrading of skills is mandatory. It must be tailor ed to the institutions / projects specific
requirements. It should best be held in-house. � Skills upgrading is essential to increasing product ivity and maintaining technology at stat-of-the-
art levels. Training must be tailored to the instit utions’ / projects’ specific requirements. It should best be held in-house.
DATA USE: OWNERSHIP / DISTRIBUTION
� The regional agency? � The national agency? � The producing (consulting) company? � The donor who supported their generation? � We may all have our private answers to these questions. However, quite often, there are no written and
binding regulations.
Regulations do not exist.
If they exist, there are no legal instruments to enforce them, or existing legal instruments are not used.
Donors funding data generation fail to tie their funding to clear commitments that the data sets will be
Who owns data?
Copyright
Conceptual Mistakes
Page 7 of 9

put to public use.
Consulting companies producing data and officials in charge of data distribution are quite aware of the fact that public distribution may reduce their private profits.
� Data sets that were produced for public use are dis tributed hesitantly or not at all. � Agencies are extremely cautious about releasing dat a sets officially. � However: data sets are traded unofficially. The pro fit goes to individuals rather than institutions. � Data obtained unofficially can not be used in publi c documents. � Distribution becomes almost impossible to monitor. � Institutions become even more cautious about releas ing data sets. � DATA PRODUCED AT HIGH COSTS ARE NOT USED.
DATA USE: META DATA BASES
Data descriptions including scale, content, format, completeness, quality, producing agency, availability, price
Data availability situation becomes more transparent.
Information gaps are easier to identify.
Time and money is saved because repeated (project) investigations of data availability become unnecessary.
Even more time and money is saved because the redundancy of data generation can be reduced.
Selective inputs in data generation can be made.
Common Problems
� The workload of establishing a meta data base is un derestimated. � The person(s) in charge of establishing the meta da ta base have little GIS experience. They are
not qualified to judge the information provided. � Statements of producing agencies on data quality an d availability are accepted without
evaluation. � Agencies list everything they have, including copie s of data sets obtained from other agencies.
This leads to high redundancy. � Agencies make misleading statements on the complete ness of data sets. � Agencies fail to provide information because their own internal documentation is incomplete. � Agencies withhold information. � The establishment of the meta data base is a one ti me exercise without proper establishment of
update procedures.
DATA USE: DATA BASES
Commercial Interests
Consequences
Metadata: Data about Data.
Advantages
Page 8 of 9
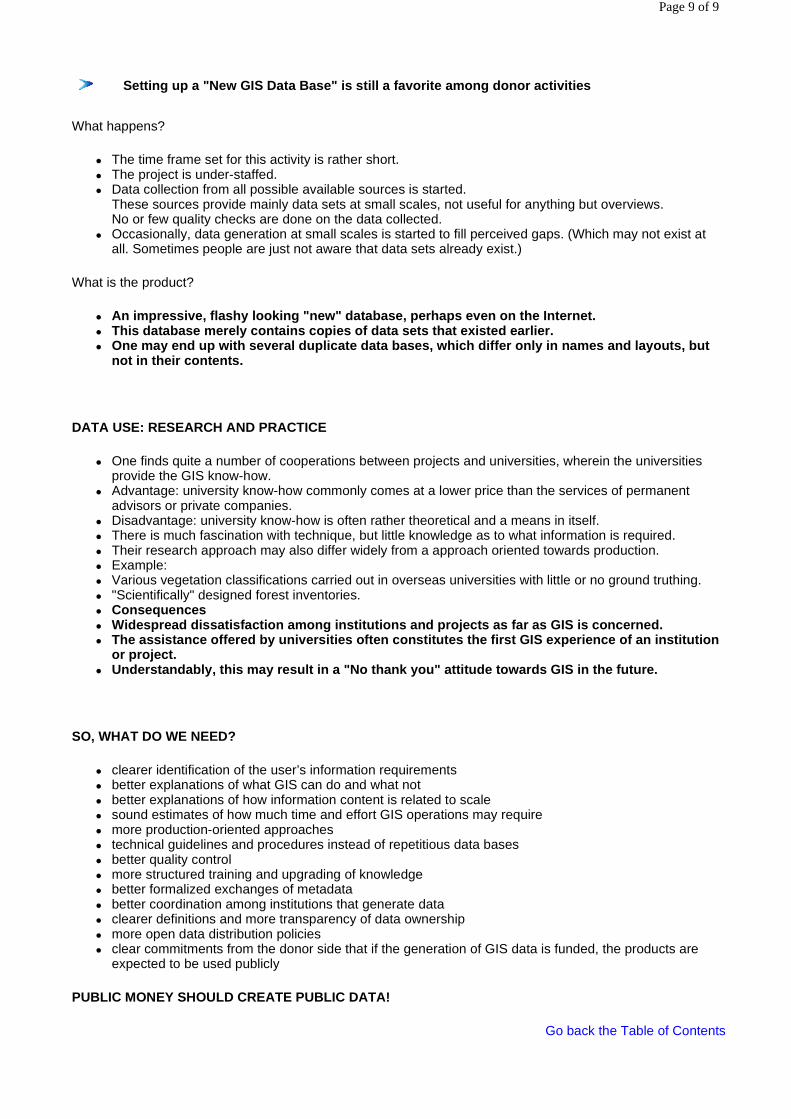
What happens?
� The time frame set for this activity is rather short. � The project is under-staffed. � Data collection from all possible available sources is started.
These sources provide mainly data sets at small scales, not useful for anything but overviews. No or few quality checks are done on the data collected.
� Occasionally, data generation at small scales is started to fill perceived gaps. (Which may not exist at all. Sometimes people are just not aware that data sets already exist.)
What is the product?
� An impressive, flashy looking "new" database, perha ps even on the Internet. � This database merely contains copies of data sets t hat existed earlier. � One may end up with several duplicate data bases, w hich differ only in names and layouts, but
not in their contents.
DATA USE: RESEARCH AND PRACTICE
� One finds quite a number of cooperations between projects and universities, wherein the universities provide the GIS know-how.
� Advantage: university know-how commonly comes at a lower price than the services of permanent advisors or private companies.
� Disadvantage: university know-how is often rather theoretical and a means in itself. � There is much fascination with technique, but little knowledge as to what information is required. � Their research approach may also differ widely from a approach oriented towards production. � Example: � Various vegetation classifications carried out in overseas universities with little or no ground truthing. � "Scientifically" designed forest inventories. � Consequences � Widespread dissatisfaction among institutions and p rojects as far as GIS is concerned. � The assistance offered by universities often consti tutes the first GIS experience of an institution
or project. � Understandably, this may result in a "No thank you" attitude towards GIS in the future.
SO, WHAT DO WE NEED?
� clearer identification of the user’s information requirements � better explanations of what GIS can do and what not � better explanations of how information content is related to scale � sound estimates of how much time and effort GIS operations may require � more production-oriented approaches � technical guidelines and procedures instead of repetitious data bases � better quality control � more structured training and upgrading of knowledge � better formalized exchanges of metadata � better coordination among institutions that generate data � clearer definitions and more transparency of data ownership � more open data distribution policies � clear commitments from the donor side that if the generation of GIS data is funded, the products are
expected to be used publicly
PUBLIC MONEY SHOULD CREATE PUBLIC DATA!
Go back the Table of Contents
Setting up a "New GIS Data Base" is still a favorit e among donor activities
Page 9 of 9

THE APPLICATION OF GEOGRAPHIC INFORMATION SYSTEMS (GIS) AT THE LAND TITLES DEPARTMENT
So Vanna, Land Titles Department (Cambodia)
ABSTRACT
This paper briefly presents the application of geographic information systems (GIS) in Cambodia and the GIS for a cadastral system at the Cambodian Land Titles Department (LTD). The LTD plays an important role in the GIS field. This paper will describe how to collect land registration data using modern technology such as computers and software, surveying equipment (GPS, Total Station) and aerial photographs (enlarged photos, orthophotos); how to manage data and analyze it; and how to produce graphic parts (cadastral maps) and textual parts (land ownership reports) in LTD.
The GIS is used to improve cadastral systems and guarantee the security of land tenure in Cambodia. It is necessary to use GIS properly, choose proper hardware and software, train staff with appropriate technology, and have sufficient financial support. In the long run, the applications of GIS will help planners and decision makers in land use planning and developing land resources in Cambodia. A large scale GIS will be required, as well as integrated GIS databases and good co-operation with other agencies in the future.
BRIEF DESCRIPTION OF GIS OFFICES IN CAMBODIA
GIS applications were first introduced at the Land Use Mapping Office, Ministry of Agriculture in 1993. Later, there were several national and/or international institutions involved with GIS applications in Cambodia. Several ministries or departments have been involved in establishing GIS, including the National Mekong Committee, General Department of cadastre and Geography, Land Use Mapping Office, Ministry of Environment, etc.
The NMC was involved in some primary data acquisition for the aerial photographs, scale 1: 25000 covering the whole area of Cambodia (1992-1994).
In July, 1999, the Land Titles Department and the Geographic Department were merged to form the GDCG. The GDCG has five departments: Land Administration, Land Inspection, Technical, Land Registration, and Geography, (see organigram, below). The GDCG is under the Ministry of Land Management, Urban Planning and Construction.
ORGANISATION OF GENERAL DEPARTMENT OF CADASTRE AND GEOGRAPHY
National Mekong Committee (NMC)
General Department of Cadastre and Geography (GDCG)
Page 1 of 6
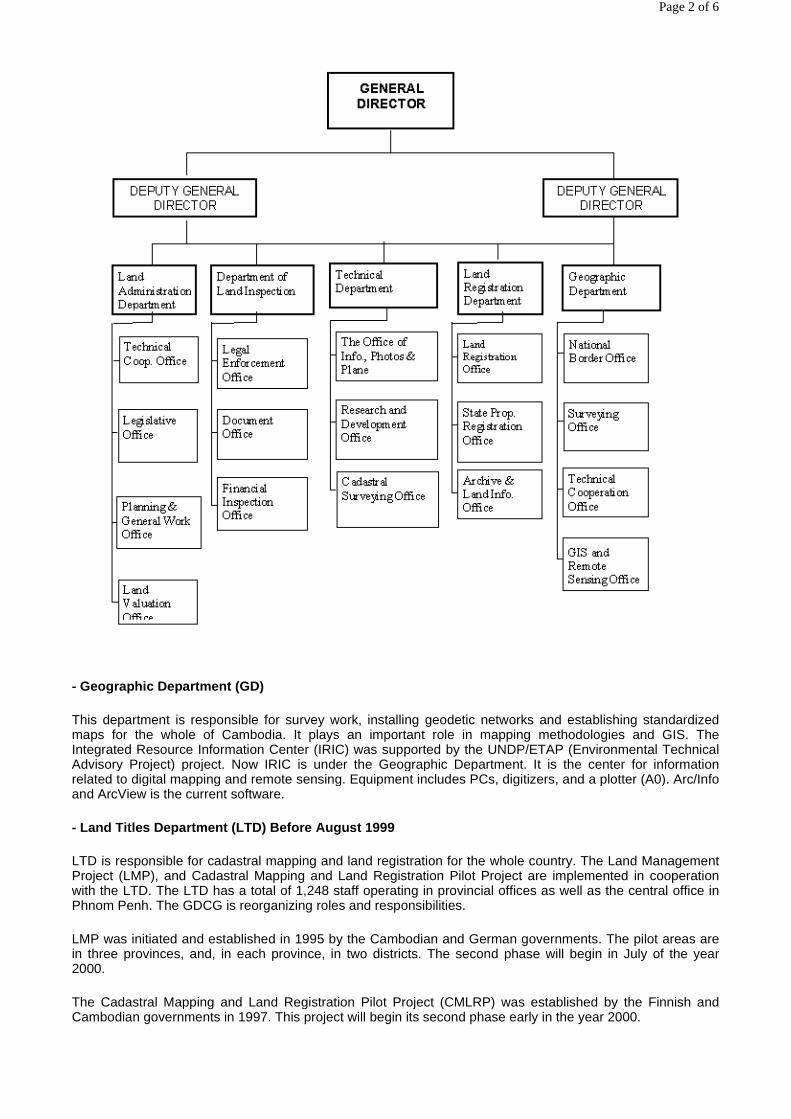
- Geographic Department (GD)
This department is responsible for survey work, installing geodetic networks and establishing standardized maps for the whole of Cambodia. It plays an important role in mapping methodologies and GIS. The Integrated Resource Information Center (IRIC) was supported by the UNDP/ETAP (Environmental Technical Advisory Project) project. Now IRIC is under the Geographic Department. It is the center for information related to digital mapping and remote sensing. Equipment includes PCs, digitizers, and a plotter (A0). Arc/Info and ArcView is the current software.
- Land Titles Department (LTD) Before August 1999
LTD is responsible for cadastral mapping and land registration for the whole country. The Land Management Project (LMP), and Cadastral Mapping and Land Registration Pilot Project are implemented in cooperation with the LTD. The LTD has a total of 1,248 staff operating in provincial offices as well as the central office in Phnom Penh. The GDCG is reorganizing roles and responsibilities.
LMP was initiated and established in 1995 by the Cambodian and German governments. The pilot areas are in three provinces, and, in each province, in two districts. The second phase will begin in July of the year 2000.
The Cadastral Mapping and Land Registration Pilot Project (CMLRP) was established by the Finnish and Cambodian governments in 1997. This project will begin its second phase early in the year 2000.
Page 2 of 6
Each of these projects cooperates closely with the other.
THE GIS UNIT OF THE LAND TENURE DEPARTMENT (LTD)
A Geographic Information System can be described as a special type of information system, which deals with geographic data and information. A GIS is most commonly described as a specialized conglomeration of computer hardware, software, graphical data and personnel, designed to efficiently collect, manage, analyze and display all forms of geographically referenced data and information.
A GIS was introduced at the LTD in 1997 as a means to effectively and efficiently facilitate land registration and transfers, and to support land use planning in the future. A large scale project will produce digital land registration, digital cadastral maps and cadastral index maps for the whole country in the long run.
Hardware
The selection of hardware must be chosen taking into account user requirements, cost and time constraints, and desired products. At the LTD, personal computers were chosen. The Cadastral Mapping and Land Registration Project installed a computer network to facilitate for transferring data and backup it at LTD.
The computer and environmental hardware at LTD currently includes:
- 15 PCs - 14-24" Monitors - 1 Digitizer A0 - 1 Plotter A0 - 1 Plotter A1 - 2 color printers A3 - 6 Laser printers A4 - 1 Scanner A4 - 2 Colorado (Tapes) - 1 HP CD Writer - 1 PD/CD Writer
Software
MS Access, GIS Geo Concept, SDR Mapping and Design (DOS version), SKI (GPS software) are the software programs used at LTD.
The GIS Geo Concept software is made by French company. It is used for on-screen digitizing from orthophotos. It can download raw data from the electronic field books (Total Station).
SDR Mapping and Design software is used for manual digitizing and downloading raw data from electronic field books.
SKI software is used for downloading GPS software and post processing of coordinates.
MS Access version MS Office 97 was used as a textual data base which was developed for the use of both the LMP and CMLRP Projects to facilitate land registration data entry and manipulation.
DATA ACQUISITION
The tests of methods and development of the GIS for implementation of the both projects at LTD appear below:
Photogrammetric methods
Page 3 of 6
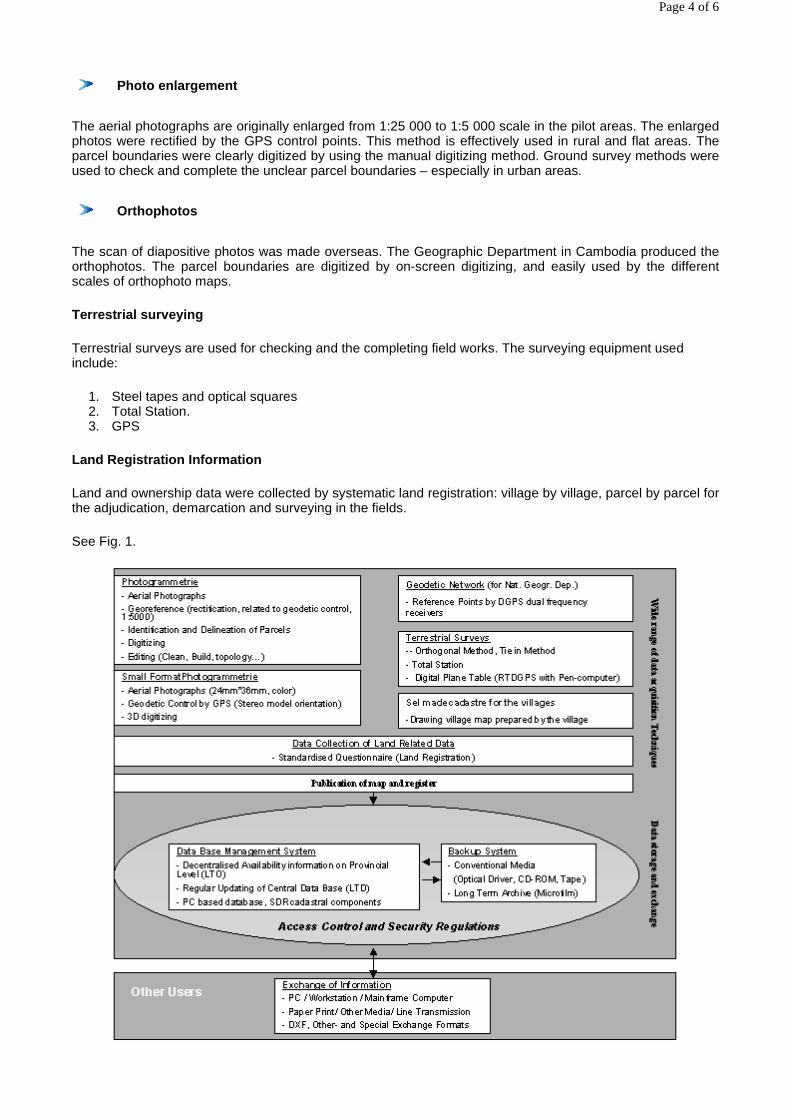
The aerial photographs are originally enlarged from 1:25 000 to 1:5 000 scale in the pilot areas. The enlarged photos were rectified by the GPS control points. This method is effectively used in rural and flat areas. The parcel boundaries were clearly digitized by using the manual digitizing method. Ground survey methods were used to check and complete the unclear parcel boundaries – especially in urban areas.
The scan of diapositive photos was made overseas. The Geographic Department in Cambodia produced the orthophotos. The parcel boundaries are digitized by on-screen digitizing, and easily used by the different scales of orthophoto maps.
Terrestrial surveying
Terrestrial surveys are used for checking and the completing field works. The surveying equipment used include:
1. Steel tapes and optical squares 2. Total Station. 3. GPS
Land Registration Information
Land and ownership data were collected by systematic land registration: village by village, parcel by parcel for the adjudication, demarcation and surveying in the fields.
See Fig. 1.
Photo enlargement
Orthophotos
Page 4 of 6
Fig. 1: The concept of the technical implementation and maintenance for the proposed multi-purpose cadastre/GIS/LIS (adapted from the Land Management Project)
DATA MANAGEMENT
The data were managed and stored in different directories to make it easy for users to find and retrieve. These directories include:
1. Vector data/ graphic data (parcel map, administration boundaries,….) 2. Raster data (Orthophotos,…) 3. Textual data (land registration data,…) 4. Working data (data are digitized and edited)
OUTPUT
The results of the GIS for Cadastral Applications will include cadastral index maps and land registration data in a digital format. Automation linkages will be created and developed between textual data (legal land registration data) and parcel maps. The final goal is to generate digital maps which will facilitate land management and planning and, in particular, land registration and the issuance of land titles in order to promote security of land tenure and reduce land disputes.
The products to be developed for the target group of forty-six villages in four provinces (Kandal, Takeo, Kampong Thom, Shihanouk Ville) include:
- Digital parcel maps, scale 1:1000 to 1:2000
- Digital cadastral index maps, scale 1:3000 to 1:5000
- List of ownership for public information
- Information sheets (parcel and owner information)
- Certificates of Title (currently in process: a sub-decree to issue the Certificate of Titles is under development for application first in the pilot areas with the expectation of extending it throughout the country).
MAINTENANCE
A system of data maintenance must be in place from the start to ensure that data is kept up-to-date. A security system will ensure copies of the data are kept in different locations to avoid loss due to fire, etc.
TRAINING
The concept of GIS was first introduced to about 50 staff at the LTD at the end of 1998 and in 1999. There are on the job training and refresher courses on the GIS/ cadastral fields conducted at LTD. The first round of training in the development of GIS/ cadastral system targeted leaders from the central and provincial Land Title Offices. It is expected that trainers will train trainees to extend works in the provinces.
CONCLUSIONS AND RECOMMENDATION
� The GDCG faces a big challenge in the task of GIS development, because this system is new for their staff and only a few possess the required skills.
� Training cadastral and geographic staff with appropriated technological equipment is required for the future development of GISes.
� Budget support is limited. The GDCG needs to augment its budget. � There is not enough legislation on land taxation and valuation to generate income for the government
to develop and maintain the system. � There is not enough coordination and cooperation among institutions to avoid duplication of work. The
GIS database should be shared with other organizations.
Page 5 of 6

Go back the Table of Contents
Page 6 of 6

THE USE OF GEOGRAPHIC INFORMATION SYSTEMS FOR SOIL SURVEY AND LAND EVALUATION
Inthavong Thavone, National Agriculture and Forestry Research Institute, Soil Survey and Land Classification Center (Laos)
ABSTRACT
Geographic Information Systems (GIS) play an important role in soil survey and land evaluation for land use planning in the Lao PDR nowadays. This paper addresses in particular the use of Geographic Information Systems to help determine which areas in the Central Part of the Lao PDR are most suitable for rainfed lowland rice, cash crops and fruit trees.
The study at hand concentrates on establishing suitability ratings for different types of crops in different parts of the country given different soil, physical and other factors. The methodology proceeds by converting land characteristics into a set of land qualities that are relevant for the land utilization type.
The Geographic Information Systems provides the digital soil map, comprised of digitized polygons of soil units linked to an attribute table of quantitative soil properties. Each land quality is determined by assessing the appropriate land characteristics. The user specifies the criteria for assessing suitability and matches the land quality with the land use requirements for specific crops to be evaluated (based on bio-physical considerations) by using Automation Land Evaluation System (ALES) and map results using GIS.
The results of land suitability assessment from this study area indicate that the most areas evaluated are moderately (S3) to slightly limited (S2) for rainfed lowland rice, cash crops and fruit crops. This is due to the limited available nutrient content and soil reaction. Consistent yield improvements can be expected by a proper choice of crops or alternative land uses and/or by concentrating on an appropriate management on liming and fertilizer application.
INTRODUCTION
The Lao PDR has abundant natural resources, i.e. forest, land and water. In the period 1950-1960, the forest cover of Laos covered about 70% of territory. Since then, however deforestation has increasingly become a problem. Deforestation in Laos is attributable to several factors. In upland areas, the shifting cultivation practices of ethnic groups (253.000 families or 1.5 million) destroys forest at a rate of roughly 250.000-300.000 hectares per annum. In addition, increasing pressure from agricultural expansion, illegal logging as well as traditional land clearing practices where large areas are burning for hunting and /or for other purposes contribute heavily to deforestation.
In order to solve this problem, Party and Lao Government have developed a land use policy, which aims to protect, conserve, and rehabilitate land and forest resources.
Forest and Soil resources inventory and the assessment of land suitability classification is one of the main strategies of land use policy thus, the Soil Survey and Land Classification Center accordingly concentrates it work on soil survey and land evaluation of the physical environment.
At present, the soil survey at a reconnaissance scale has been completed throughout the country. However, most of the survey areas were concentrated on the areas of low-relief, which normally have slopes less than 55 percent. At the same time, a number of semi-detailed and detailed soil surveys were also made to serve the needs of soil interpretation for agriculture planning by various government agencies.
To date, the Soil Survey and Land Classification Center has identified about 16 soil groups and more than 20 soil units in the Lao PDR Unfortunately, these are many soils defined in such a way that users lacking a soil science background find it difficult to understand them. Therefore one of the main priorities of SSLCC has been the establishment of soil interpretation for agriculture use, which can help other agencies in make more meaningful use of soil and land resource management.
OBJECTIVE:
The objective of this study is to present an approach to establishing GIS techniques in conjunction with other computerized land evaluation tools to generate land suitability maps from soil-crop suitability maps and their integration for land resource management.
Page 1 of 8
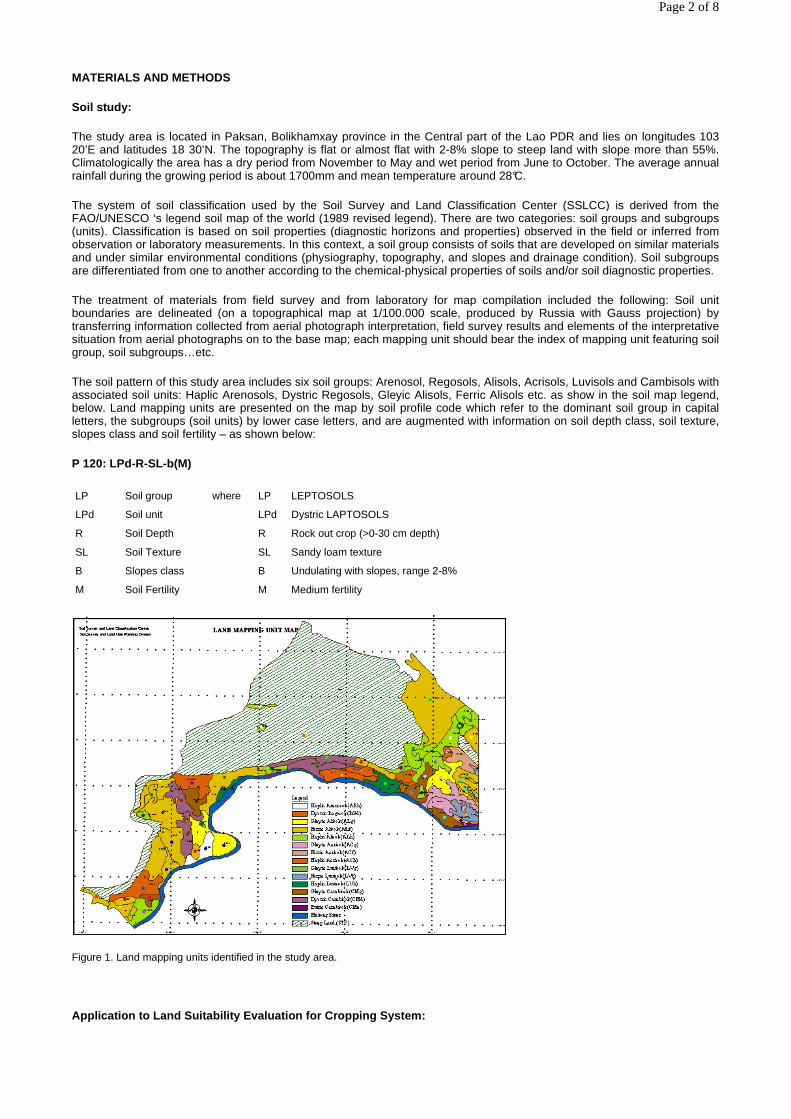
MATERIALS AND METHODS
Soil study:
The study area is located in Paksan, Bolikhamxay province in the Central part of the Lao PDR and lies on longitudes 103 20’E and latitudes 18 30’N. The topography is flat or almost flat with 2-8% slope to steep land with slope more than 55%. Climatologically the area has a dry period from November to May and wet period from June to October. The average annual rainfall during the growing period is about 1700mm and mean temperature around 28°C.
The system of soil classification used by the Soil Survey and Land Classification Center (SSLCC) is derived from the FAO/UNESCO ‘s legend soil map of the world (1989 revised legend). There are two categories: soil groups and subgroups (units). Classification is based on soil properties (diagnostic horizons and properties) observed in the field or inferred from observation or laboratory measurements. In this context, a soil group consists of soils that are developed on similar materials and under similar environmental conditions (physiography, topography, and slopes and drainage condition). Soil subgroups are differentiated from one to another according to the chemical-physical properties of soils and/or soil diagnostic properties.
The treatment of materials from field survey and from laboratory for map compilation included the following: Soil unit boundaries are delineated (on a topographical map at 1/100.000 scale, produced by Russia with Gauss projection) by transferring information collected from aerial photograph interpretation, field survey results and elements of the interpretative situation from aerial photographs on to the base map; each mapping unit should bear the index of mapping unit featuring soil group, soil subgroups…etc.
The soil pattern of this study area includes six soil groups: Arenosol, Regosols, Alisols, Acrisols, Luvisols and Cambisols with associated soil units: Haplic Arenosols, Dystric Regosols, Gleyic Alisols, Ferric Alisols etc. as show in the soil map legend, below. Land mapping units are presented on the map by soil profile code which refer to the dominant soil group in capital letters, the subgroups (soil units) by lower case letters, and are augmented with information on soil depth class, soil texture, slopes class and soil fertility – as shown below:
P 120: LPd-R-SL-b(M)
Figure 1. Land mapping units identified in the study area.
Application to Land Suitability Evaluation for Cropping System:
LP Soil group where LP LEPTOSOLS
LPd Soil unit LPd Dystric LAPTOSOLS
R Soil Depth R Rock out crop (>0-30 cm depth)
SL Soil Texture SL Sandy loam texture
B Slopes class B Undulating with slopes, range 2-8%
M Soil Fertility M Medium fertility
Page 2 of 8
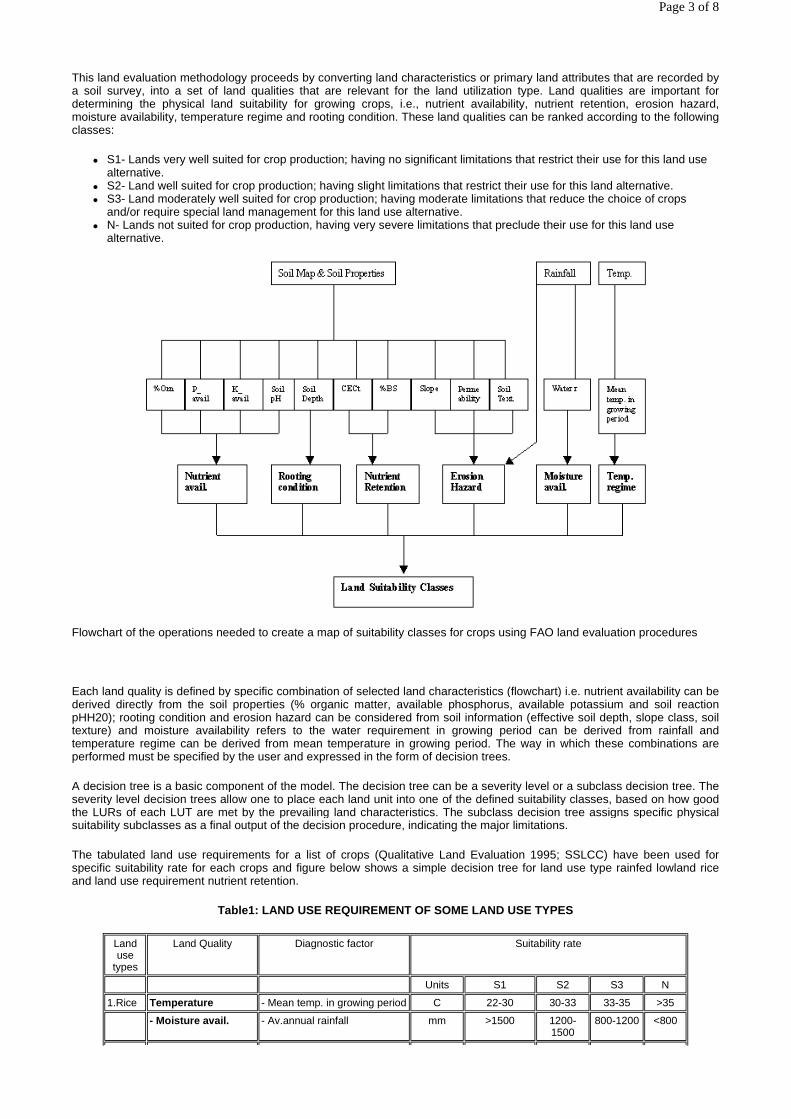
This land evaluation methodology proceeds by converting land characteristics or primary land attributes that are recorded by a soil survey, into a set of land qualities that are relevant for the land utilization type. Land qualities are important for determining the physical land suitability for growing crops, i.e., nutrient availability, nutrient retention, erosion hazard, moisture availability, temperature regime and rooting condition. These land qualities can be ranked according to the following classes:
� S1- Lands very well suited for crop production; having no significant limitations that restrict their use for this land use alternative.
� S2- Land well suited for crop production; having slight limitations that restrict their use for this land alternative. � S3- Land moderately well suited for crop production; having moderate limitations that reduce the choice of crops
and/or require special land management for this land use alternative. � N- Lands not suited for crop production, having very severe limitations that preclude their use for this land use
alternative.
Flowchart of the operations needed to create a map of suitability classes for crops using FAO land evaluation procedures
Each land quality is defined by specific combination of selected land characteristics (flowchart) i.e. nutrient availability can be derived directly from the soil properties (% organic matter, available phosphorus, available potassium and soil reaction pHH20); rooting condition and erosion hazard can be considered from soil information (effective soil depth, slope class, soil texture) and moisture availability refers to the water requirement in growing period can be derived from rainfall and temperature regime can be derived from mean temperature in growing period. The way in which these combinations are performed must be specified by the user and expressed in the form of decision trees.
A decision tree is a basic component of the model. The decision tree can be a severity level or a subclass decision tree. The severity level decision trees allow one to place each land unit into one of the defined suitability classes, based on how good the LURs of each LUT are met by the prevailing land characteristics. The subclass decision tree assigns specific physical suitability subclasses as a final output of the decision procedure, indicating the major limitations.
The tabulated land use requirements for a list of crops (Qualitative Land Evaluation 1995; SSLCC) have been used for specific suitability rate for each crops and figure below shows a simple decision tree for land use type rainfed lowland rice and land use requirement nutrient retention.
Table1: LAND USE REQUIREMENT OF SOME LAND USE TYPES
Land use
types
Land Quality Diagnostic factor Suitability rate
Units S1 S2 S3 N
1.Rice Temperature - Mean temp. in growing period C 22-30 30-33 33-35 >35
- Moisture avail. - Av.annual rainfall mm >1500 1200-1500
800-1200 <800
Page 3 of 8
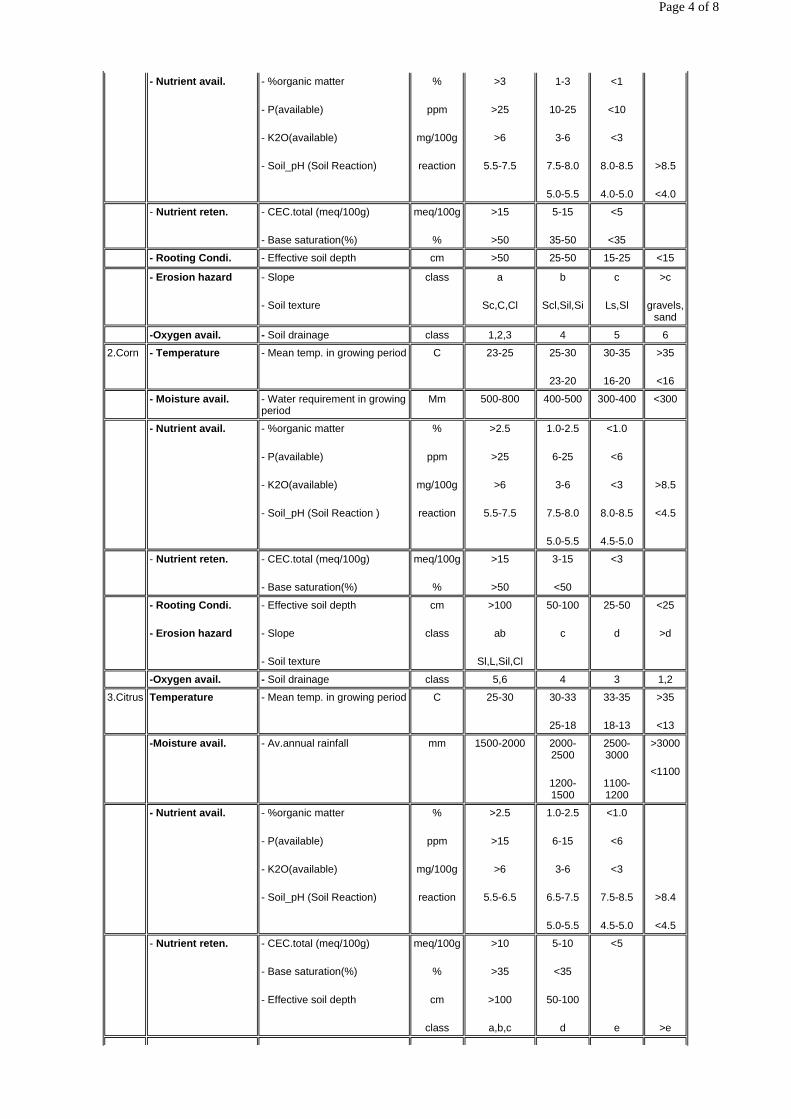
- Nutrient avail. - %organic matter
- P(available)
- K2O(available)
- Soil_pH (Soil Reaction)
%
ppm
mg/100g
reaction
>3
>25
>6
5.5-7.5
1-3
10-25
3-6
7.5-8.0
5.0-5.5
<1
<10
<3
8.0-8.5
4.0-5.0
>8.5
<4.0
- Nutrient reten. - CEC.total (meq/100g)
- Base saturation(%)
meq/100g
%
>15
>50
5-15
35-50
<5
<35
- Rooting Condi. - Effective soil depth cm >50 25-50 15-25 <15
- Erosion hazard - Slope
- Soil texture
class a
Sc,C,Cl
b
Scl,Sil,Si
c
Ls,Sl
>c
gravels, sand
-Oxygen avail. - Soil drainage class 1,2,3 4 5 6
2.Corn - Temperature - Mean temp. in growing period C 23-25 25-30
23-20
30-35
16-20
>35
<16
- Moisture avail. - Water requirement in growing period
Mm 500-800 400-500 300-400 <300
- Nutrient avail. - %organic matter
- P(available)
- K2O(available)
- Soil_pH (Soil Reaction )
%
ppm
mg/100g
reaction
>2.5
>25
>6
5.5-7.5
1.0-2.5
6-25
3-6
7.5-8.0
5.0-5.5
<1.0
<6
<3
8.0-8.5
4.5-5.0
>8.5
<4.5
- Nutrient reten. - CEC.total (meq/100g)
- Base saturation(%)
meq/100g
%
>15
>50
3-15
<50
<3
- Rooting Condi.
- Erosion hazard
- Effective soil depth
- Slope
- Soil texture
cm
class
>100
ab
Sl,L,Sil,Cl
50-100
c
25-50
d
<25
>d
-Oxygen avail. - Soil drainage class 5,6 4 3 1,2
3.Citrus Temperature - Mean temp. in growing period C 25-30 30-33
25-18
33-35
18-13
>35
<13
-Moisture avail. - Av.annual rainfall mm 1500-2000 2000-2500
1200-1500
2500-3000
1100-1200
>3000
<1100
- Nutrient avail. - %organic matter
- P(available)
- K2O(available)
- Soil_pH (Soil Reaction)
%
ppm
mg/100g
reaction
>2.5
>15
>6
5.5-6.5
1.0-2.5
6-15
3-6
6.5-7.5
5.0-5.5
<1.0
<6
<3
7.5-8.5
4.5-5.0
>8.4
<4.5
- Nutrient reten. - CEC.total (meq/100g)
- Base saturation(%)
- Effective soil depth
meq/100g
%
cm
class
>10
>35
>100
a,b,c
5-10
<35
50-100
d
<5
e
>e
Page 4 of 8

Nutrient Retention (nr)
> CECe-c (CEC by sum of basses+extr.acidity,topsoil)
1.0-4 meq/100g]........ : 3 (Moderate)
2.4-5 meq/100g]........ : =1
3.5-10 meq/100g] > Bases/c(Basaturation)----------1.vl (Very Low) [0-25 %]...: 3(Moderate)
2.sl [25-35 %]............ : =1
3.l (Low) [35-50 %]....... : =2(Slightly)
4.m (Medium) [50-75 %].... : =1
5.h (High) [75-100 %]..... : =1
4.10-15 meq/100g]..... : =2(Slightly)
5.15-20 meq/100g] > Bases/c (Basaturation)-------- 1.vl (Very Low) [0-25 %]...: 3 (Moderate)
2.sl [25-35 %]............ : =1
3.l (Low) [35-50 %]....... : 2(Slightly)
4.m (Medium) [50-75 %].... : none
5.h (High) [75-100 %]..... : none
6.20-100 meq/100g] > Bases/c (Basaturation)----- --1.vl (Very Low) [0-25 %]...: 3 (Moderate)
2.sl [25-35 %]...... ......: 2(Slightly)
3.l (Low) [35-50 %]..... ..: 2(Slightly)
4.m (Medium) [50-75 %].....:none 5.h (High) [75-100 %].....: none
Figure 2. Example of a severity level decision tree for land use type rainfed low land rice and land use requirement nutrient retention
The graphs, the land use requirement " Nutrient Retention" is evaluated through an assessment of cation exchange capacity by sum of bases plus extra. Acidity (CECe) and Basaturation (Bases). A first level decision is made on the basis of the cation exchange capacity by sum of basses plus extr. acidity, with additional subdivisions related to the amount of basaturation (Bases).
RESULTS
The Automation Land Evaluation System (ALES) is used to compute and present the result of land suitability classification. The land suitability for each one of the lands mapping units of a survey area can be demonstrated in the table2 below. This table shows mapping code and approximate extent of those mapping units suitable for rainfed lowland rice, cash crops and fruit crops.
Land mapping units are grouped into classes according to degree of limitation in use or risk of damage when used. Thus, the most serious degree of limitation determines the suitability classes and classes are indicated by numeric 1 to 4 increasing order of suitability and each class is subdivided into subclass according to dominant kinds of limitations. Lower case letters following the class number indicates the dominant limitation.
The overall suitability of the study area for the Rainfed lowland rice, Cash crops and Fruit trees is illustrated in fig.2 ,3 and 4.
- Rooting Condi.
- Erosion hazard
- Slope
- Soil texture
- Soil drainage
class
Sl,L,Sil,Si,vfSl
5,6
4
3
1,2
-Oxygen avail.
Page 5 of 8

Figure 2 Suitability map of the study area for rainfed low land rice
Figure 3. Suitability map of the study area for Mung bean.
Page 6 of 8
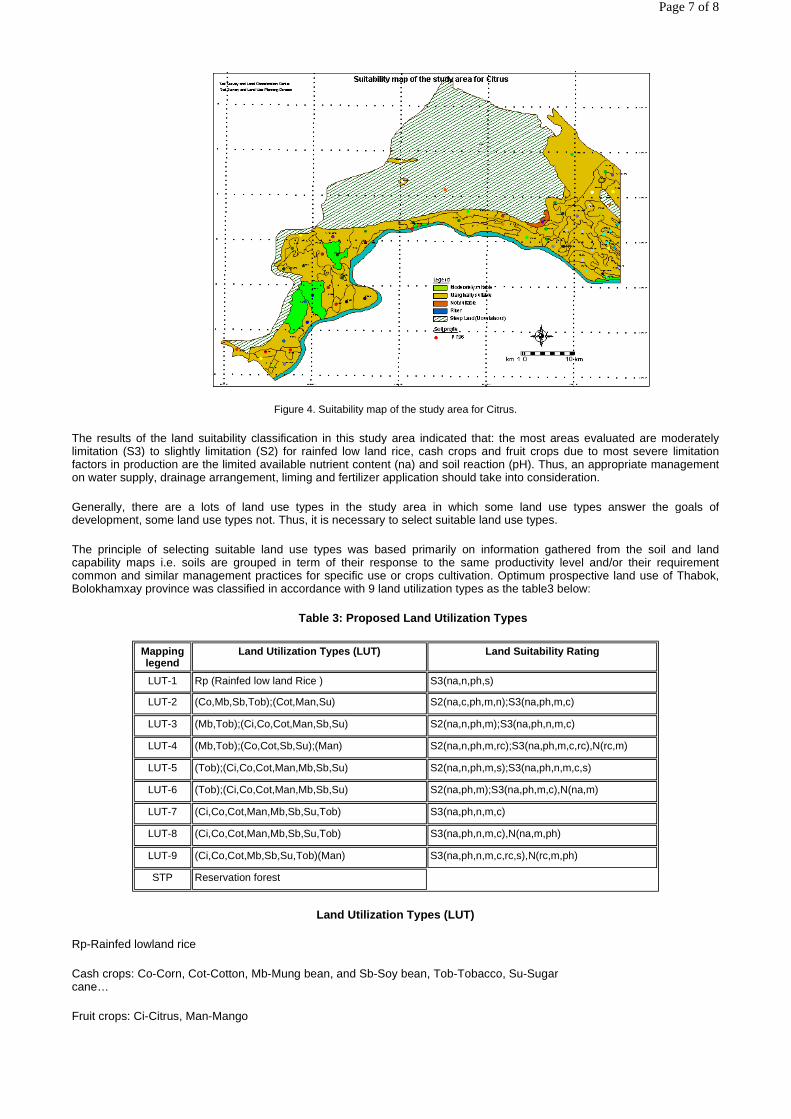
Figure 4. Suitability map of the study area for Citrus.
The results of the land suitability classification in this study area indicated that: the most areas evaluated are moderately limitation (S3) to slightly limitation (S2) for rainfed low land rice, cash crops and fruit crops due to most severe limitation factors in production are the limited available nutrient content (na) and soil reaction (pH). Thus, an appropriate management on water supply, drainage arrangement, liming and fertilizer application should take into consideration.
Generally, there are a lots of land use types in the study area in which some land use types answer the goals of development, some land use types not. Thus, it is necessary to select suitable land use types.
The principle of selecting suitable land use types was based primarily on information gathered from the soil and land capability maps i.e. soils are grouped in term of their response to the same productivity level and/or their requirement common and similar management practices for specific use or crops cultivation. Optimum prospective land use of Thabok, Bolokhamxay province was classified in accordance with 9 land utilization types as the table3 below:
Table 3: Proposed Land Utilization Types
Land Utilization Types (LUT)
Rp-Rainfed lowland rice
Cash crops: Co-Corn, Cot-Cotton, Mb-Mung bean, and Sb-Soy bean, Tob-Tobacco, Su-Sugar cane…
Fruit crops: Ci-Citrus, Man-Mango
Mapping legend
Land Utilization Types (LUT) Land Suitability Rating
LUT-1 Rp (Rainfed low land Rice ) S3(na,n,ph,s)
LUT-2 (Co,Mb,Sb,Tob);(Cot,Man,Su) S2(na,c,ph,m,n);S3(na,ph,m,c)
LUT-3 (Mb,Tob);(Ci,Co,Cot,Man,Sb,Su) S2(na,n,ph,m);S3(na,ph,n,m,c)
LUT-4 (Mb,Tob);(Co,Cot,Sb,Su);(Man) S2(na,n,ph,m,rc);S3(na,ph,m,c,rc),N(rc,m)
LUT-5 (Tob);(Ci,Co,Cot,Man,Mb,Sb,Su) S2(na,n,ph,m,s);S3(na,ph,n,m,c,s)
LUT-6 (Tob);(Ci,Co,Cot,Man,Mb,Sb,Su) S2(na,ph,m);S3(na,ph,m,c),N(na,m)
LUT-7 (Ci,Co,Cot,Man,Mb,Sb,Su,Tob) S3(na,ph,n,m,c)
LUT-8 (Ci,Co,Cot,Man,Mb,Sb,Su,Tob) S3(na,ph,n,m,c),N(na,m,ph)
LUT-9 (Ci,Co,Cot,Mb,Sb,Su,Tob)(Man) S3(na,ph,n,m,c,rc,s),N(rc,m,ph)
STP Reservation forest
Page 7 of 8
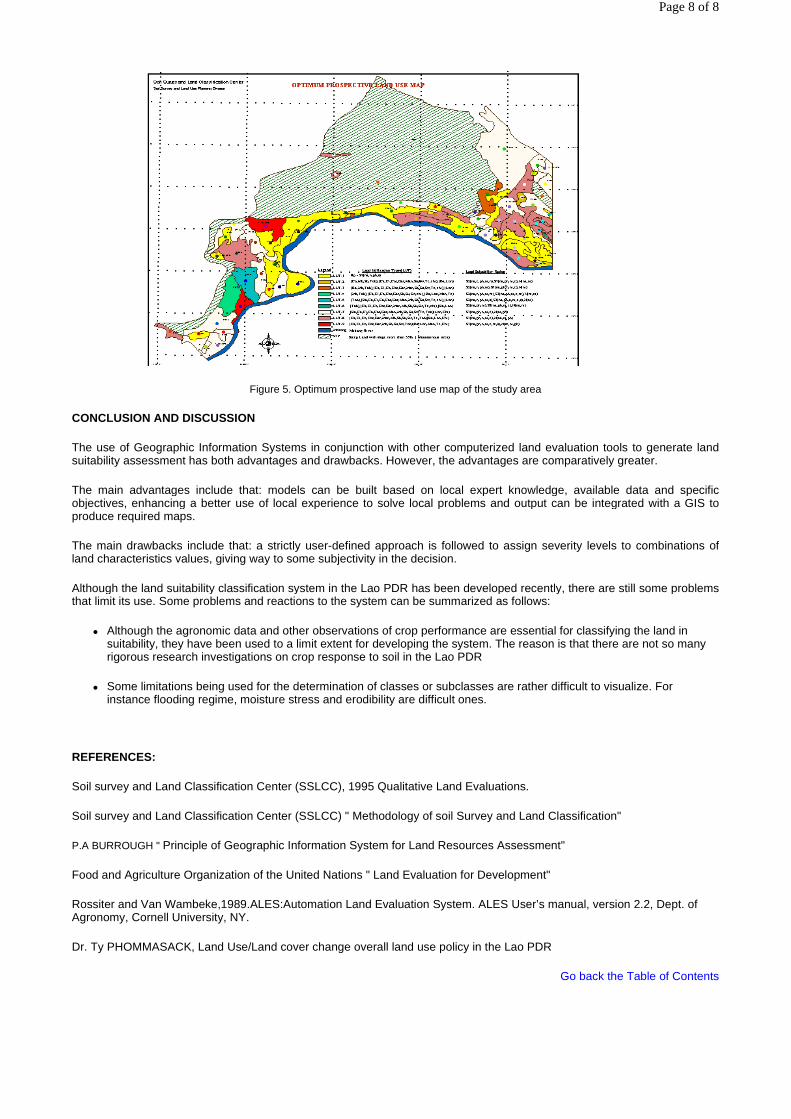
Figure 5. Optimum prospective land use map of the study area
CONCLUSION AND DISCUSSION
The use of Geographic Information Systems in conjunction with other computerized land evaluation tools to generate land suitability assessment has both advantages and drawbacks. However, the advantages are comparatively greater.
The main advantages include that: models can be built based on local expert knowledge, available data and specific objectives, enhancing a better use of local experience to solve local problems and output can be integrated with a GIS to produce required maps.
The main drawbacks include that: a strictly user-defined approach is followed to assign severity levels to combinations of land characteristics values, giving way to some subjectivity in the decision.
Although the land suitability classification system in the Lao PDR has been developed recently, there are still some problems that limit its use. Some problems and reactions to the system can be summarized as follows:
� Although the agronomic data and other observations of crop performance are essential for classifying the land in suitability, they have been used to a limit extent for developing the system. The reason is that there are not so many rigorous research investigations on crop response to soil in the Lao PDR
� Some limitations being used for the determination of classes or subclasses are rather difficult to visualize. For instance flooding regime, moisture stress and erodibility are difficult ones.
REFERENCES:
Soil survey and Land Classification Center (SSLCC), 1995 Qualitative Land Evaluations.
Soil survey and Land Classification Center (SSLCC) " Methodology of soil Survey and Land Classification"
P.A BURROUGH " Principle of Geographic Information System for Land Resources Assessment"
Food and Agriculture Organization of the United Nations " Land Evaluation for Development"
Rossiter and Van Wambeke,1989.ALES:Automation Land Evaluation System. ALES User’s manual, version 2.2, Dept. of Agronomy, Cornell University, NY.
Dr. Ty PHOMMASACK, Land Use/Land cover change overall land use policy in the Lao PDR
Go back the Table of Contents
Page 8 of 8

Application of Remote Sensing and GIS for Forest Cover Monitoring in Lao PDR
Malychansouk Malyvanh (NPD/Laos) and Christoph Feldkötter (SMRP)
EXECUTIVE SUMMARY
This report is prepared for the GIS workshop at Hanoi, Vietnam. It describes the activities of the regional Forest Cover Monitoring Project (FCMP) in Lao PDR with the main focus on the methodology of forest cover monitoring processes.
The FCMP was initiated by the Mekong River Commission (MRC), co-financed by the Government of Germany and implemented through the Mekong River Commission Secretariat (MRCS) with assistance from the German Agency for Technical Cooperation (GTZ).
All Lower Mekong Basin (LMB) countries that are members of the MRC, i.e. Cambodia, Lao PDR, Thailand and Vietnam, have been facing rapid destructions of their forests over the past decades with serious consequences for the quality and function of the entire LMB watershed and the livelihood of its rural populations.
The FCMP was initiated because the MRC became aware of the need to generate and collect recent and reliable information on the current status of forest cover and on the location and intensity of its degradation and destruction and, as far as possible, on the socio-economic conditions leading to them. This information was to be generated and collected in order to provide decision makers and planners in the national planning ministries and agencies of the MRC member countries and in the regional MRC itself with a sound decision basis to formulate adequate policies and strategies to preserve the remaining forest cover.
The visual interpretation technique is applied to extract the information on the current status of forest cover and on the location and intensity of its degradation and destruction (monitoring information) from hard copy satellite images at 1:250,000 scale acquired in 1992/93 and 1996/97. For the process of monitoring forest cover changes, the so-called interdependent interpretation technique is used. This produces much more reliable monitoring result than the comparison of two independent interpretations. The result of the interpretation was then intergrated into a computerized Geographical Information System ( GIS ), by which different products e.g. forest cover statistics, forest cover change statistics, maps, were analyzed and prepared.
To ensure the homogeneity of the forest cover information in all FCMP countries, the new forest and land cover classification system, which was relevant to the watershed management issue, was developped and used in all four FCMP countries. The threshold of 20% of crown density is used to differentiate between forest and non-forest areas.
Supplementary information on forest composition was extracted from the national forest inventories of the MRC member countries. Information on the socio-economic conditions leading to forest degradation and destruction as far as available was compiled from national census data and other statistics. These data were integrated into a computerized numerical data base which was linked to the GIS.
At present, there are two sets of forest cover data which were generated by two separate institutions e.g. the Lao National Forest Inventory ( NFI ) and the MRC Forest Cover Monitoring Project ( FCMP). Differences between the statistical results of FCMP and the Lao National Forest Inventory (NFI) could be explained and resolved through a study jointly conducted by former NFI and FCMP staff. The results of this study are also discussed in this report.
The German Ministry of Economic Cooperation and Development and the MRC have agreed to fund 2 more years of FCMP post-project support (1999-2000) through the Sustainable Management of Resources in the Lower Mekong Basin Project(SMRP). The post-project support is provided in order to facilitate the distribution and marketing of the FCMP results to a wider range of users, to promote the utilization of the FCMP results in a wider range of applications, to further develop the built up technical skills and experiences, and to introduce new technological concepts and techniques such as digital satellite image processing.
TABLE OF CONTENTS
Executive Summary
List of Abbreviations
Fcmp – Rationale, Objective
Technical Approach – Forest Cover Monitoring
Page 1 of 14
General Approach
Forest and Land Cover Classification System
Comparison of NFI and FCMP Results
Further Development of Technical Skills and Experiences
Future Technology Development
List of Abbreviations
FCMP - RATIONALE, OBJECTIVES
FCMP Rationale
In watershed management, healthy, natural forests are essential for the stabilization of the hydrological cycle during the wet and dry seasons. Through their horizontal and vertical structure, ground vegetation and subterranean root system, forests alleviate the impact of torrential rains, absorb excess quantities of rainfall and slowly feed the water into the groundwater table and river systems during the dry season. This results in the continuous flow of water for drinking, irrigation, fisheries, river transport and hydropower generation. Forests also fulfill a variety of other functions, which are of paramount importance for the livelihoods of rural populations, such as protection against soil erosion, production of timber and of numerous non-timber forest products, such as rattan, fibres, dyes, honey, fruits and medicinal plants.
The LMB has been covered by a variety of forest formations. These forests sheltered human, animal and plant communities. They have been used sustainably by the local populations for millennia. Only in the course of this century these forests have become subject to rapid and serious degradation and destruction. It has been estimated that between 1950 and 1970 nearly one half of the forest cover disappeared.
A major cause of forest degradation and destruction is the exponential population growth of recent decades resulting in socio-economic imbalances, which cause pressure from landless farmers encroaching on forest land and converting forests by unsustainable shifting cultivation practices on steep slopes. Furthermore, uncontrolled logging and lack of post-harvest management are rapidly degrading and destroying the forests. Forest degradation and destruction in turn further aggravate the problems of securing the livelihoods of the still growing rural populations.
Serious consequences of forest degradation and destruction have become manifest in all LMB countries. The reduction of forest cover has resulted in decreased water retention potential, increased frequency and intensity of flooding and landslides, loss of soil fertility and agricultural productivity, soil erosion, siltation of reservoirs and intrusion of saltwater into the Mekong delta.
Any LMB-wide policies and strategies to preserve the remaining forest cover would have to be based on recent and reliable
AIT Asian Institute of Technology, Bangkok
DoF Department of Forestry
FCMP Forest Cover Monitoring Project (MRC / GTZ)
GIS Geographic Information System
GTZ German Agency for Technical Cooperation
IRS Indian Remote Sensing Satellite
LMB Lower Mekong Basin
MAF Ministry of Agriculture
MRC Mekong River Commission (Phnom Penh)
MRCS Mekong River Commission Secretariat (Phnom Penh)
NFI National Forest Inventory
NOFIP National Office of Forest Inventory and Planning
PNRM Participatory Natural Resource Management
RS Remote Sensing
SDC Swiss Development Cooperation
SMRP Sustainable Management of Resources in the Lower Mekong Basin Project (MRC / GTZ)
TSU Technical Support Unit of MRCS
UNEP-GRID United Nations Environmental Program – Global Resources Information Data Base
WSCP Watershed Classification Project (MRC / SDC)
Page 2 of 14
information on its current status and on the location and intensity of its degradation and destruction. However, such information was not available at a LMB-wide scale in the early 90s. The last LMB-wide survey of forest cover had been done in 1972 and had only provided very general information on the status of the forest cover, but not on the location and intensity of its degradation and destruction. Some forest cover information was available in the early 90s in the LMB countries, however, this information was also partly outdated and rather inhomogeneous.
Equally, sound information on the socio-economic conditions leading to forest degradation and destruction would be required for any sound planning approach. This information, like the information on forest cover, was only partly available in the early 90s.
The Mekong River Commission, as a regional level planning agency, therefore took the decision in the early 90s to initiate the Forest Cover Monitoring Project (FCMP). This project would generate and collect information on the current status of the forest cover, on the location and intensity of its degradation and destruction, and, as far as possible, on the causes thereof.
Remote Sensing and GIS are the most modern technologies which have been widely used in the field of natural resource management and monitoring. These technologies provide very powerful tools to observe and collect information on natural resources and dynamic phenomenon on the earth surface, and ability to integrate different data and present the data in different formats. Through the use of this technology, the most recent and reliable information could be provided to decision makers and planners in the national planning ministries and agencies of the member countries and in the regional MRC itself, to help them formulate adequate policies and strategies to preserve the remaining forest cover.
FCMP Objectives
Five major outputs had been specified for phases I and II of the project:
1. Establish a Natural Resources Information System. 2. Establish a Forest Cover Monitoring and Trend Analysis System. 3. Enhance cooperation between and within the national and regional planning agencies of the riparian countries and the
MRC. 4. Provide training to national planning agencies. 5. Promote the use of project results and capabilities in forest and environmental policy and planning decisions.
It has to be kept in mind that the technical outputs (1. + 2.) were intended to be used at the macro planning level, that is at the regional, national, and at most at the provincial level. It was, during the project’s lifetime, never intended to generate results usable beyond the provincial level.
TECHNICAL APPROACH - FOREST COVER MONITORING
General Approach
Overview
The technical outputs of the FCMP were defined as follows:
1. Establish a Natural Resources Information System. 2. Establish a Forest Cover Monitoring and Trend Analysis System.
Technically, a Natural Resources Information System as well as a Forest Cover Monitoring and Trend Analysis System are computer based Geographic Information Systems (GIS) with mapping and data base components. In principle, a Natural Resources Information System contains information on the status of a natural resource (such as forest cover and composition) at a given point in time. In contrast, a Forest Cover Monitoring and Trend Analysis System contains information on the status of this natural resource at several (at least 2) given points in time. In addition, the latter contains information on external factors that influence the natural resource, such as socio-economic and bio-physical information. This said, one can combine the above 2 outputs into 1 output as follows:
Establish a Forest Cover Monitoring System, which contains information on the status and composition of forest at several points in time plus information on external factors of influence.
This output comprises 3 major layers of information:
� forest cover (e.g.: Where is forest? How many hectares?) � forest composition (e.g.: Species composition and volume within the forest?) � socio-economic / bio-physical (e.g.: What is the population density and growth?)
The most important of these 3 layers under MRC’s point of view of watershed management is the first. It is essentially a map layer. The latter 2 layers are tabular information linked to the map layer.
Page 3 of 14
Generation / Collection of Information
Given the FCMP’s regional character, it was evident for technical as well as for financial reasons that the information contents of a Forest Cover Monitoring System had to be limited in terms of data collection intensity and resolution or scale.
The first issue to be resolved was whether information should be generated or collected from existing sources. Information generation is usually more expensive than collection from existing sources. The FCMP countries together with the MRC decided to use the following approach:
� generate forest cover information � collect forest composition and socio-economic / bio-physical information
The decision to generate forest cover information was taken because the information available in the FCMP countries was rather inhomogeneous and partly outdated. The information had to be standardized to a certain degree in order to be usable for the purpose of monitoring as well as in order to make it usable for MRC’s basin development planning activities. This standardization could not be achieved using available information. It was therefore decided to spend the major part of the limited funds on the generation of forest cover information as the most important information layer.
On the other hand the FCMP could collect information on forest composition and socio-economic / bio-physical information since this information was available in the FCMP countries at least to an acceptable degree of standardisation. This information was collected and integrated in a computerised database, which was then linked to the information on forest cover. This database will not be discussed any further in this document since it is a state-of-the-art database and contains the data layers of secondary importance.
Data Sources for Generation of Forest Cover Informa tion
The second issue to be resolved was as to how to generate the forest cover information. Terrestrial mapping was out of question due to time and budget contraints, as could be expected in a regional project covering 4 countries. Mapping from aerial photos or high resolution commercial satellite images like SPOT (as used in the NFI of Lao PDR) was ruled out for the same reasons. That left only Landsat TM or IRS satellite images as mapping options. FCMP decided to use Landsat TM.
The third issue to be resolved was whether to use digital (computerized) or printed images for the generation of forest cover information. Advantages of using digital images would have been the possibility to do digital image enhancements and classifications, which are not possible with printed images. The main disadvantage of digital images were their high costs of around US$ 3,000 each as compared to US$ 1,000 for a printed image. In addition, the hard- and software required for processing of digital images came at a very high price at the time FCMP started up. Cost aspects are of paramount importance in any kind of information generation, especially when taking into consideration that monitoring requires the repeated purchase of images covering the same area. Another disadvantage of digital images is that their processing requires staff with a least basic experiences in operating computer systems which are far more demanding than normal office applications. Such experienced national counterpart staff were not available at the time the project started. FCMP therefore decided to use printed images at a scale of 1:250,000 (a similar approach as used in the NFI of Lao PDR).
Generation of Forest Cover Information
After selecting the appropriate data source for the generation of forest cover information, the FCMP country teams together with the TSU of MRCS jointly developed and agreed upon a forest and land cover classification system. The classification system as the core of the FCMP’s technical output will be discussed in greater detail below.
The classification system was designed to be used in all 4 FCMP countries to ensure standardization and homogeneity of the to-be-generated forest cover information, the importance of which has already been discussed above. The original concept was based on previous experience in the target countries, drawing particularly heavily on the NFI SPOT satellite image interpretation exercise conducted in Lao PDR During development of the classification system, numerous field trips in all four MRC project countries (especially in Lao PDR) were undertaken to carry out practical testing of its applicability.
Once the forest and land cover classification system was established, the satellite images were then accordingly visually interpreted. In Lao PDR this interpretation was done by national image interpretation specialists, who had already done SPOT image interpretation during the NFI. Field trips were undertaken repeatedly during the image interpretation to appropriately ground truth the information.
Aerial photos were used in all four countries to support and verify the satellite image interpretation. In Cambodia, Thailand and Vietnam, existing photos could be used. In Laos, however, new aerial photos were taken by the FCMP in 1993 / 94, since existing photos (early 1980s vintage) were considered seriously outdated. These photos were taken in strips distributed across the whole country and covered all major vegetation types in Lao PDR
Two satellite image interpretation rounds were carried out, the first with satellite images from 1992 / 93, the second with satellite images from 1996 / 97. The second interpretation round was designed and carried out as a so-called dependentinterpretation. A dependent interpretation means that the results of the second interpretation round are based on those of the first. In this process, corrections are applied whenever interpretation errors from the previous interpretation round are found. ‘Dependent interpretation’ produces much more reliable monitoring results than a comparison of two independent interpretations. In the latter case, the results of the first interpretation are not known during the second interpretation round so that the (usually numerous) errors made during the first interpretation round are largely overlooked.
Page 4 of 14

Image interpretation (including, in Laos a limited number of Landsat MSS satellite images from 1974/75/76 which helped provide information on forest cover development trends during the past 20 years) was followed by inputting the interpretation results into a GIS. The GIS system used was a relatively simple PC-based ArcInfo / ArcView system. This technical approach was choosen because existing technical staff in both the Forestry Departments of Lao PDR and Thailand were already using PC ArcInfo, whereas GIS technology was completely new to the Forestry Departments of Cambodia and Vietnam.
The forest cover monitoring (change) information was produced by comparing (overlaying) the computerized results of the first (1992/93) and second (1996/97) interpretation rounds. The monitoring process is outlined in the following figure.
Forest and Land Cover Classification System
The Forest and Land Cover Classification System is the core of the FCMP’s technical output and may have led to differences between previously compiled national figures and the FCMP results. Therefore it is discussed in greater detail in this chapter.
Overview
Requirements
The general user requirements and information needs to be met by the classification system as well as its limitations were defined prior to designing it as follows:
� The thematic and the spatial accuracy have to be sufficient for conclusions at a Sub-Regional Level. It is not intended to meet all requirements at the local planning level.
� The Forest and Land Cover Classes should be relevant for watershed management issues such as erosion risk, soil protection and others.
� Repetition of interpretation and mapping as part of a Monitoring System must be feasible in a timely manner at reasonable cost.
Limitations
Page 5 of 14
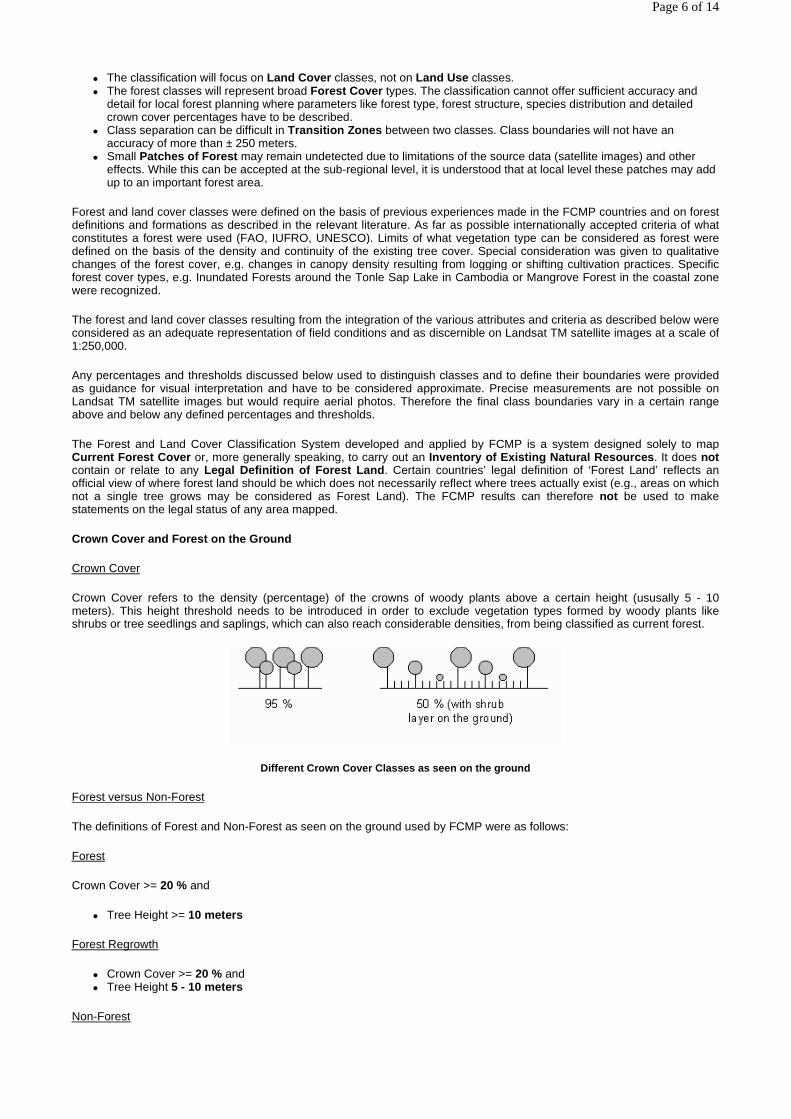
� The classification will focus on Land Cover classes, not on Land Use classes. � The forest classes will represent broad Forest Cover types. The classification cannot offer sufficient accuracy and
detail for local forest planning where parameters like forest type, forest structure, species distribution and detailed crown cover percentages have to be described.
� Class separation can be difficult in Transition Zones between two classes. Class boundaries will not have an accuracy of more than ± 250 meters.
� Small Patches of Forest may remain undetected due to limitations of the source data (satellite images) and other effects. While this can be accepted at the sub-regional level, it is understood that at local level these patches may add up to an important forest area.
Forest and land cover classes were defined on the basis of previous experiences made in the FCMP countries and on forest definitions and formations as described in the relevant literature. As far as possible internationally accepted criteria of what constitutes a forest were used (FAO, IUFRO, UNESCO). Limits of what vegetation type can be considered as forest were defined on the basis of the density and continuity of the existing tree cover. Special consideration was given to qualitative changes of the forest cover, e.g. changes in canopy density resulting from logging or shifting cultivation practices. Specific forest cover types, e.g. Inundated Forests around the Tonle Sap Lake in Cambodia or Mangrove Forest in the coastal zone were recognized.
The forest and land cover classes resulting from the integration of the various attributes and criteria as described below were considered as an adequate representation of field conditions and as discernible on Landsat TM satellite images at a scale of 1:250,000.
Any percentages and thresholds discussed below used to distinguish classes and to define their boundaries were provided as guidance for visual interpretation and have to be considered approximate. Precise measurements are not possible on Landsat TM satellite images but would require aerial photos. Therefore the final class boundaries vary in a certain range above and below any defined percentages and thresholds.
The Forest and Land Cover Classification System developed and applied by FCMP is a system designed solely to map Current Forest Cover or, more generally speaking, to carry out an Inventory of Existing Natural Resources. It does notcontain or relate to any Legal Definition of Forest Land. Certain countries’ legal definition of ‘Forest Land’ reflects an official view of where forest land should be which does not necessarily reflect where trees actually exist (e.g., areas on which not a single tree grows may be considered as Forest Land). The FCMP results can therefore not be used to make statements on the legal status of any area mapped.
Crown Cover and Forest on the Ground
Crown Cover
Crown Cover refers to the density (percentage) of the crowns of woody plants above a certain height (ususally 5 - 10 meters). This height threshold needs to be introduced in order to exclude vegetation types formed by woody plants like shrubs or tree seedlings and saplings, which can also reach considerable densities, from being classified as current forest.
Different Crown Cover Classes as seen on the ground
Forest versus Non-Forest
The definitions of Forest and Non-Forest as seen on the ground used by FCMP were as follows:
Forest
Crown Cover >= 20 % and
� Tree Height >= 10 meters
Forest Regrowth
� Crown Cover >= 20 % and � Tree Height 5 - 10 meters
Non-Forest
Page 6 of 14

� Crown Cover < 20 % or � Crown Cover >= 20 % and Tree Height < 5 meters
The 20% Crown Cover threshold was chosen in view of the Dry Dipterocarp Forests, which are abundant in the LMB and which by nature are quite open. For Evergreen and Mixed Forests a 30% threshold might be more appropriate, but would result in the exclusion of major areas of Dry Dipterocarp Forests from the class Forest if applied as a general threshold. A 10 % threshold as used by FAO and developed in view of the, by nature, very open African Woodlands appeared to be rather low for the forests in southeast Asia.
Given the still rather low threshold of 20%, the areas considered as forest by FCMP include a significant amount of severely degraded forest. Any summary statistics of forest cover produced by FCMP must be interpreted with this fact kept in mind.
The class Forest Regrowth was introduced in order to distinguish between mature and regenerating forest (e.g. after an area has been cleared during a commercial logging operation or in a slash and burn farming system).
It is essential to note that the definitions given above are for distinguishing Forest and Non-Forest as seen on the ground. They can not be directly applied to satellite image interpretation without further modification. Nevertheless, they are indispensable in order to come to an understanding of what has been classified as Forest from satellite images.
Crown Cover on Satellite Images
It is evident that single trees can not be detected on Landsat TM or comparable satellite images. Therefore neither precise Crown Cover nor tree height measurements can be obtained from these satellite images. For precise measurements aerial photos would be required. However, the color and texture of vegetation as seen on satellite images provide information about its composition and structure, which an experienced interpreter can relate to broad classes of Crown Cover and tree height.
Given these restrictions, 3 Crown Cover Classes as seen on satellite images were distinguished in the FCMP Classification System:
� 0 – 19 % (Low) � 20 – 69 % (Medium) � 70 – 100 % (High)
These thresholds are estimates rather than measurements. It should therefore be noted that
� Relative differences of Crown Cover will be detected rather than exact thresholds. � In mountainous areas the appearance of forest on satellite images is variable due to transitions in forest types and site
conditions and especially due to illumination and shadow effects. Separation of Crown Cover Classes may therefore be more difficult in these areas.
Optical satellite images such as Landsat TM can only be taken in the cloudless, that is the dry season. During the dry season different Crown Cover Classes of Deciduous Forests cannot be interpreted reliably. The crown density of most natural Deciduous Forests is in the Medium Class. The crown density of natural Dry Dipterocarp Forests even ranges at the lower end of the Medium Class. All Deciduous Forests have therefore invariably been classified as Forests with Medium Crown Cover.
Qualitative changes of the Crown Cover of forests can be mapped from Landsat TM satellite printed images if the Crown Cover changes are significant and recent, the forests and the topography of the terrain are more or less homogeneous and if the images have been digitally enhanced prior to producing the prints. Mapping of selectively logged areas is therefore almost impossible, particularly when the gaps are filled quickly by secondary vegetation.
The Canopy Density Concept – Forest on Satellite Im ages
The Canopy Density Concept has to be introduced in order to finally arrive at the definition of precisely what FCMP considered as Forest or as Non-Forest as seen on satellite images.
Minimum Mapping Unit (MMU)
In visual interpretation and mapping there is always a tradeoff between mapping accuracy and processing speed. If an interpreter has to map too much detail, he may not be able to complete his task in good time. Therefore usually a Minimum Mapping Unit (MMU) is defined as the smallest unit to be mapped by the interpreter. An internationally recognized standard for the MMU in forest and land cover mapping is 4 × 4 mm at source scale. FCMP originally intended to apply this standard. However, during practical interpretation and mapping work, it was even lowered to about 2 × 4 mm in order to not miss too many small structures.
At the scale of the Landsat TM satellite images used by the FCMP (1:250,000), 2 × 4 mm are equivalent to an area of 0.5 × 1 km or 0.5 km2. Given the heterogeneous forest and land cover, which is to be found in major parts of South-East Asia, a MMU of 0.5 km2 may contain forest and other land cover types at the same time. All features smaller than the MMU therefore have to be assigned to or grouped into an appropriate class. This makes it necessary to introduce the term Forest
Page 7 of 14
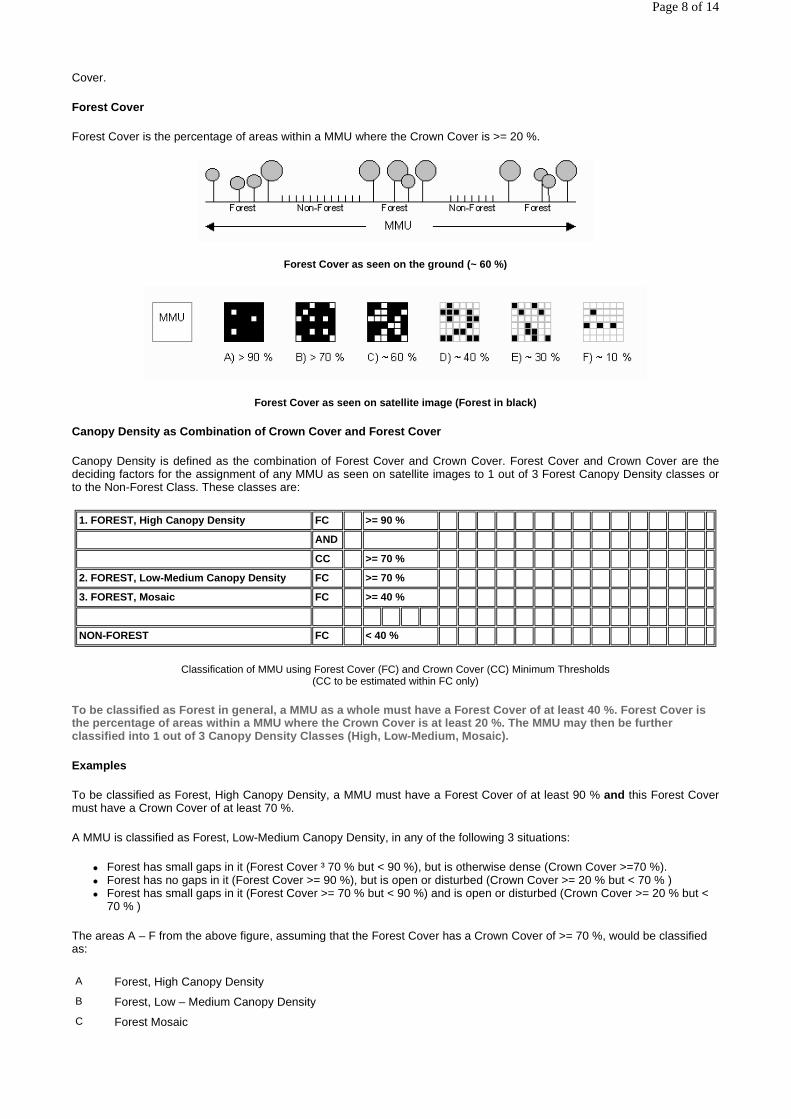
Cover.
Forest Cover
Forest Cover is the percentage of areas within a MMU where the Crown Cover is >= 20 %.
Forest Cover as seen on the ground (~ 60 %)
Forest Cover as seen on satellite image (Forest in black)
Canopy Density as Combination of Crown Cover and Forest Cover
Canopy Density is defined as the combination of Forest Cover and Crown Cover. Forest Cover and Crown Cover are the deciding factors for the assignment of any MMU as seen on satellite images to 1 out of 3 Forest Canopy Density classes or to the Non-Forest Class. These classes are:
Classification of MMU using Forest Cover (FC) and Crown Cover (CC) Minimum Thresholds (CC to be estimated within FC only)
To be classified as Forest in general, a MMU as a whole must have a Forest Cover of at least 40 %. Forest Cover is the percentage of areas within a MMU where the Crown Cover is at least 20 %. The MMU may then be further classified into 1 out of 3 Canopy Density Classes (High, Low-Medium, Mosaic).
Examples
To be classified as Forest, High Canopy Density, a MMU must have a Forest Cover of at least 90 % and this Forest Cover must have a Crown Cover of at least 70 %.
A MMU is classified as Forest, Low-Medium Canopy Density, in any of the following 3 situations:
� Forest has small gaps in it (Forest Cover ³ 70 % but < 90 %), but is otherwise dense (Crown Cover >=70 %). � Forest has no gaps in it (Forest Cover >= 90 %), but is open or disturbed (Crown Cover >= 20 % but < 70 % ) � Forest has small gaps in it (Forest Cover >= 70 % but < 90 %) and is open or disturbed (Crown Cover >= 20 % but <
70 % )
The areas A – F from the above figure, assuming that the Forest Cover has a Crown Cover of >= 70 %, would be classified as:
1. FOREST, High Canopy Density FC >= 90 %
AND
CC >= 70 %
2. FOREST, Low-Medium Canopy Density FC >= 70 %
3. FOREST, Mosaic FC >= 40 %
NON-FOREST FC < 40 %
A Forest, High Canopy Density
B Forest, Low – Medium Canopy Density
C Forest Mosaic
Page 8 of 14

Assuming that the Forest Cover has a different Crown Cover of >= 20 % but < 70 %, only 1 area would be classified differently:
These examples show that the classification system is quite conservative in assigning areas to the class Forest, High Canopy Density. On the other hand, it is rather generous in assigning areas to the class Forest Mosaic, which contains areas that have major gaps and are only about half covered by actual forest. The most common forest types of South-East Asia, i.e. the Degraded Evergreen / Mixed Forests and all Deciduous Forests (including the Dry Dipterocarp Forests), were normally - that means if there were no major gaps - classified as Forest, Low – Medium Canopy Density.
These characteristics have to be kept in mind when reading and interpreting the FCMP forest and land cover statistics. Dense evergreen forests, as many people imagine when discussing about forests in South-East Asia, can only be found in the class Forest, High Canopy Density. All other classes are more or less open or disturbed.
Vegetation Types and Other Land Cover Types
So far, only the classification of areas as Forest (of different canopy density classes) or Non-Forest by their quantitativecharacteristics has been discussed. The FCMP classification system also differentiates various Vegetation Types and Other Land Cover Types by their qualitative characteritics, like Evergreen Forest, Deciduous Forest, Wood / Shrubland, Bamboo, Agriculture, or Urban Areas. These types can be identified from Landsat TM satellite images by an experienced interpreter, mainly by their color.
Details on how to identify Vegetation Types and Other Land Cover Types will not be discussed here. The interested reader might instead refer to the FCMP Technical Notes 2, Interpretation and Delineation from Satellite Images.
FCMP Forest and Land Cover Classes
The FCMP Forest and Land Cover Classification System can finally be summarized as follows:
D Forest Mosaic
E Non-Forest
F Non-Forest
A Forest, Low – Medium Canopy Density
FOREST CLASS
CANOPY DENSITY CODE
Evergreen High 11
Low-Medium 12
Mosaic 13
Mixed (Evergreen / Deciduous) High 17
Low-Medium 18
Mosaic 19
Deciduous Low-Medium 20
Mosaic 22
Regrowth (no further differentiation) 40
Plantations (no further differentiation) 54
Others (no further differentiation) 55
NON-FOREST CLASS
SUB-CLASS CODE
Evergreen Wood / Shrubland 61
Dry Wood / Shrubland 64
Bamboo 63
Page 9 of 14
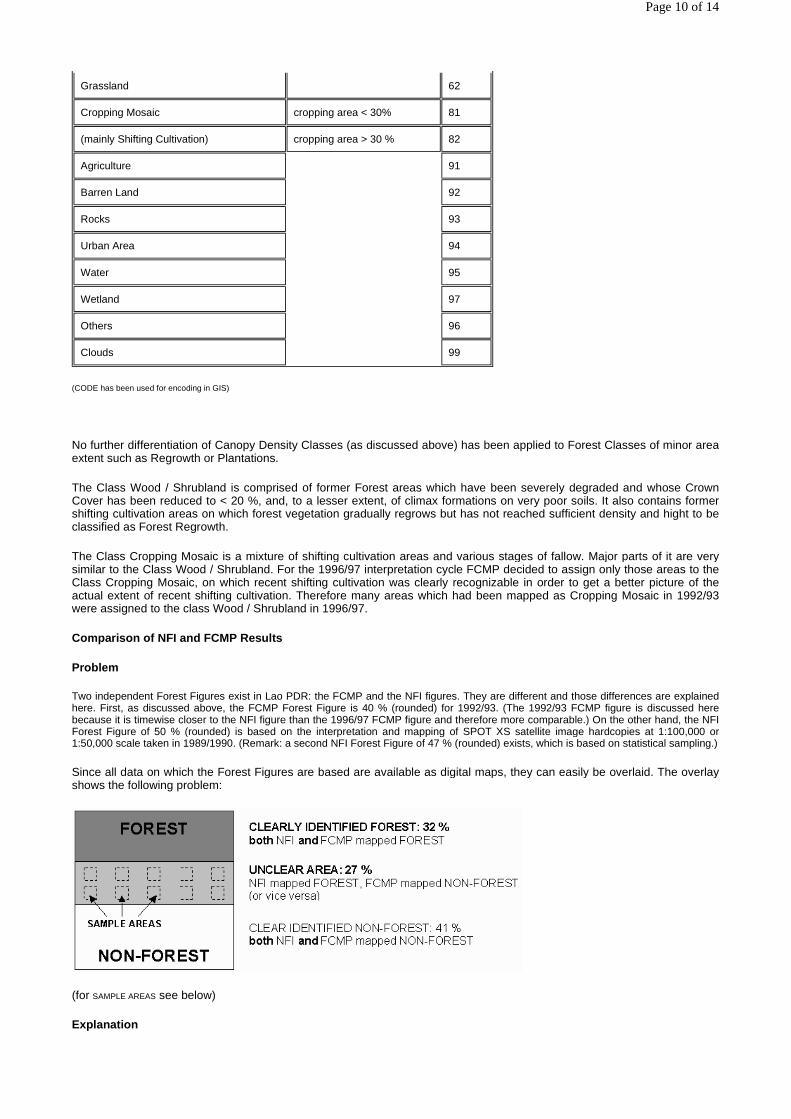
(CODE has been used for encoding in GIS)
No further differentiation of Canopy Density Classes (as discussed above) has been applied to Forest Classes of minor area extent such as Regrowth or Plantations.
The Class Wood / Shrubland is comprised of former Forest areas which have been severely degraded and whose Crown Cover has been reduced to < 20 %, and, to a lesser extent, of climax formations on very poor soils. It also contains former shifting cultivation areas on which forest vegetation gradually regrows but has not reached sufficient density and hight to be classified as Forest Regrowth.
The Class Cropping Mosaic is a mixture of shifting cultivation areas and various stages of fallow. Major parts of it are very similar to the Class Wood / Shrubland. For the 1996/97 interpretation cycle FCMP decided to assign only those areas to the Class Cropping Mosaic, on which recent shifting cultivation was clearly recognizable in order to get a better picture of the actual extent of recent shifting cultivation. Therefore many areas which had been mapped as Cropping Mosaic in 1992/93 were assigned to the class Wood / Shrubland in 1996/97.
Comparison of NFI and FCMP Results
Problem
Two independent Forest Figures exist in Lao PDR: the FCMP and the NFI figures. They are different and those differences are explained here. First, as discussed above, the FCMP Forest Figure is 40 % (rounded) for 1992/93. (The 1992/93 FCMP figure is discussed here because it is timewise closer to the NFI figure than the 1996/97 FCMP figure and therefore more comparable.) On the other hand, the NFI Forest Figure of 50 % (rounded) is based on the interpretation and mapping of SPOT XS satellite image hardcopies at 1:100,000 or 1:50,000 scale taken in 1989/1990. (Remark: a second NFI Forest Figure of 47 % (rounded) exists, which is based on statistical sampling.)
Since all data on which the Forest Figures are based are available as digital maps, they can easily be overlaid. The overlay shows the following problem:
(for SAMPLE AREAS see below)
Explanation
Grassland 62
Cropping Mosaic cropping area < 30% 81
(mainly Shifting Cultivation) cropping area > 30 % 82
Agriculture 91
Barren Land 92
Rocks 93
Urban Area 94
Water 95
Wetland 97
Others 96
Clouds 99
Page 10 of 14

The differences in the Unclear Area have the following reasons:
� Subjectivity of Interpretation: areas with relatively few trees can sometimes be mapped as either Forest or Non-Forest, depending on the subjectivity of the interpreter.
� Effects of Time: the FCMP Forest Figure was produced 3 years later than the NFI Forest Figure. In some cases Forest may have been destroyed in the meantime.
� Differences in the Classification Systems: these are not likely to account for the major differences in the Forest Figures. Both the NFI and FCMP surveys had a minimum mapping area of 0.5 km2. Both used the threshold of 20 % Crown Cover of trees of about 10 meters height for the definition of forest.
� Differences in Source Data Scales: FCMP used images at 1:250,000 scale, whereas NFI used images at 1:100,000 or 1:50,000 scale respectively. It is therefore theoretically possible that small patches of forest were mapped in the NFI survey, which remained undetected by FCMP.
Solution
A Sample Survey was conducted in the Unclear Area to help eliminate the differences between the NFI and FCMP Forest Figures and to obtain a Corrected Forest Figure. Key parameters guiding this survey are as follow:
� In the Unclear Area more than 300 Sample Areas were established. These Sample Areas were re-checked more carefully from Landsat TM digital satellite images taken in 1992/93 and in case of doubt from the aerial photos taken by FCMP in 1993/94.
� The Sample Survey covered only the Northern Part of Lao PDR (roughly 53 % of the country) due to time restrictions.
� The Sample Survey was conducted jointly by NFI and former FCMP national counterpart staff. � The Procedure involved mixed team of NFI and former FCMP national counterpart staff who examined each Sample
Area and classified it as either Forest or Non-Forest.
Result
The Sample Result Forest for the Northern Part of Lao PDR is as follows:
Post-Project Support through SMRP: Planning for the Future
The German Ministry of Economic Cooperation and Development and the MRC have agreed to fund two more years of FCMP post-project support (1999-2000) through the Sustainable Management of Resources in the Lower Mekong Basin Project (SMRP).
Page 11 of 14

The SMRP aims to support the MRC, its member states and relevant partners in the region to develop, promote and implement strategies in Participatory Natural Resource Management (PNRM). To achieve this, the project focuses on the following key areas:
1. Description and analysis of framework conditions for the uplands of the LMB. 2. Facilitation, moderation and support for regular exchange of experience in PNRM of uplands with professionals and
decision makers. 3. Establishment of pilot sites to test promising approaches in PNRM of uplands and validation by sector stakeholders. 4. Establishment of regional and national partnerships to design and jointly manage an Internet-based Information
System on Natural Resource Management. 5. Elaboration of preconditions for a continuous consolidation and further improvement of the existing database
regarding Forest Cover of the LMB and provision of demand-oriented monitoring and information products.
Key area 5. is the FCMP post-project support. The SMRP will continue its operations on the key areas 1. to 4. in Lao P.D.R even after the FCMP post-project support comes to an end in December 2000. Comprehensive information on SMRP is available on the projects Internet Site at <http://www.mekonginfo.org.>
The FCMP post-project support through SMRP is provided in order to:
� Facilitate the distribution and marketing of the FCMP results to a wider range of users. � Promote the utilization of the FCMP results in a wider range of applications. � Further develop the built up technical skills and experiences. � Introduce new technological concepts and techniques.
DISTRIBUTION AND UTILIZATION OF RESULTS
The technical result of FCMP is the GIS-based Natural Resources Information System containing
� Forest and Land Cover GIS data sets at 1:250,000 scale � Forest and Land Cover Maps at 1:250,000 scale and 1:1,000,000 scale � Forest and Land Cover Statistics
In addition, a comprehensive GIS data base containing additional information like topographical base data (hydrography, elevation) and infrastructural data (e.g. roads, populated places) has been built up.
Potential Users and Clients
The intention of the member countries of the MRC, the MRC itself, and the donors at the beginning of the FCMP was to make the FCMP results available to and usable for as many potential users and clients as possible.
The use of the FCMP results presently is limited by their scale of 1:250,000. As already pointed out above, the FCMP results were intended to be used at the macro-planning level, that is at the regional, national, and at most, provincial level. For applications below the provincial level one would need larger scales than 1:250,000.
Nevertheless, there is still a broad range of potential users involved in macro-level planning activities. The main group of potential users are, of course, the planning agencies of the FCMP countries, especially their environmental and forestry departments, as well as the MRC itself. In addition, there are numerous other potential users, e.g. private companies and donor funded projects working in the fields of forestry, natural resources management, hydroelectricity, and food security, to name only a few.
Extending the Range of Applications
This chapter describes some potential applications of FCMP results in forestry and environmental macro-planning. It should be kept in mind that identification of areas as discussed below will not produce information sufficiently accurate to implement field activities, but rather give an indication of which areas should be considered for detailed data collection and planning and which areas do not need to be investigated any further.
Identification of Areas for Reforestation and Prote ction
As FCMP’s sister project, the regional Watershed Classification Project (WSCP) was established in 1997. It has generated comprehensive data on Slope and Watershed Classes. However, these data are only of limited use in the macro-level planning process, since they describe a desirable, but not necessarily real situation: e.g. Watershed Class 1 (on steep slopes) should be under permanent forest.
The combination of these WSC data with the FCMP data on Forest and Land Cover would take forestry and environment-related macro-level planning activities a significant step further: it would enable planners to pre-assess the impact of projects and measures on watershed quality and function and thus to optimize the allocation of resources and funds.
Page 12 of 14

A prominent example are reforestation activities: by combining the WSCP Watershed Classes and the FCMP Forest and Land Cover Data one could identify areas that should be under permanent forest but are currently not forested. These areas would be priority intervention areas, where reforestation measures besides their immediate economic benefits would have the most beneficial effect on watershed quality and function.
A second example is the proper establishment of protected area networks: in this case the overlay of FCMP and WSCP data would help to identify forested areas on steep slopes, that means areas which generally need to be protected. Combining this knowledge with information on population density and pressure, one could then rank these areas by their potential endangering and thus identify areas which are in immediate need of protection. This would help to focus the generally limited resources available for protection (monetary as well as human) in a most meaningful way.
Identification of Areas for Commercial Plantations
The criteria used to identify areas suitable for the establishment of fully commercially operating forest plantations are certainly different from the criteria used to identify areas for reforestation activities under watershed protection aspects. Present Land Use and accessibility play major roles in the identification of potential plantation areas. In many cases, the present Land Cover gives a quite strong indication of the present Land Use, especially in Non-Forest areas. Combining the FCMP Forest and Land Cover data with data on road infrastructure and population distribution might therefore help to identify areas where the establishment of forest plantations would cause minimal land use conflicts and at the same time can be expected to generate sufficient economic benefits.
Further Development of Technical Skills and Experience.
The key non-technical FCMP result is the human resource capacity building. In all the 4 member countries of the MRC, especially in Lao PDR and Cambodia, technical skills and experience in satellite image interpretation, GIS application, and database processing have been significantly strengthened during the operation of FCMP. These skills and the practical experience are of paramount importance for the further development of planning capacities in forestry departments. As such, the skills and experience gained by staff are probably even more important than the technical result.
Besides facilitating the distribution of FCMP results, SMRP aims at further development of these technical skills and experiences through the post-project support. To do so, SMRP provides the opportunity of continued on-the-job-training to the national counterpart staff through an international GIS and RS consultant.
On-the-job-training is considered central to improving the technical skills of national counterpart staff. Through the reworking of existing products (e.g. the 1:250,000 maps) and the introduction of new techniques (e.g. processing of digital satellite images) for the development of new products (maps at larger scale) the technical competencies of local staff will be broadened and strengthened.
With regard to analytical skills, these will be addressed by working with national counterpart staff in the field of GIS applications to extend the range of applications of FCMP results as discussed earlier.
Through continued training of the national counterpart staff, SMRP envisages to strengthen technical skills and experiences of the respective teams to even better address the requirements of the forestry departments of the partner countries for reliable data and knowledge generation and production of relevant and accurate products in the future.
SMRPs vision is to further develop the built up GIS and RS units to a point that they can independently design new products and react to and fulfill user requirements for existing and for new products in a flexible and market-oriented manner.
FUTURE TECHNOLOGY DEVELOPMENT
As discussed above, although digital satellite images are in principle preferable to printed ones for the generation of forest cover information, in its original project design, FCMP opted for printed satellite images because at the time local technical skills were still quite minimal and the costs of digital satellite images, software, etc. quite high. In the meantime, however, not only have national technical skills significantly improved, but costs (e.g., digital satellite images, hard- and software) have dropped considerably.
SMRP and its constituent partner countries have therefore agreed to take the logical next step and move from manual interpretation of printed satellite images to computerised processing of digital satellite images. A consultant has been employed to conduct training for former FCMP national counterpart staff on the processing of digital satellite images and to produce a series of prototype maps at larger scale together with the national counterpart staff. The first digital satellite images and the processing software necessary to launch this next phase have already been purchased by SMRP.
The most striking advantage of digital satellite images compared to printed satellite images is that GIS data sets and maps at larger scales can be produced in less time. SMRP intends to employ the digital technology to produce a series of GIS data sets and forest cover maps at scales between 1:50,000 and 1:100,000, in other words, maps that could be used for planning applications below the provincial level. Since the original FCMP products could only be used for planning at the macro level (i.e., regional, national, and only occasionally the provincial level) this would represent a major advance for the project as FCMP products reach a new, critical rung on the planning ladder, providing provincial planners with the accurate,
Page 13 of 14

up-to-date information that is essential to informed decision-making.
Go back the Table of Contents
Page 14 of 14
Land Use Changes in the Upper Ca River Basin, Xiengkhuang Provinces, Lao PDR 1995 – 97:
Effects of Roads and Rivers
Sithong Thongmanivong, National University of Laos
ABSTRACT
This paper presents the results of land use and land cover change detection using Remote Sensing and Geographic Information Systems in the Northern Lao PDR. The study area was divided into 16 zones by generating buffers from roads and rivers to compare the land use and cover ratio. In general, the results show that, between 1995 and 1997, forest cover increased by 0.56 %, agriculture-residential land decreased by 0.12 % and wood-shrub land decreased by 0.4 %. It is found that there is low ratio of forest cover close to the road and rivers, where others land uses are more concentrated. The analysis shows that digital technique is very useful for investigating land use and land cover in term of time and investment.
TABLE OF CONTENTS
Introduction
Materials and Methods
Results and discussion
Conclusion
References
INTRODUCTION
Land use and land cover information have become important for land use planning and resource management, yet currently used mapping and monitoring methods cannot address the needs of forest managers and environmentalists. Using or relying on ground surveys and sampling alone requires manpower, expenditure and time. Recent developments in remote sensing technology indicate that, if these methods are carefully combined with reliable ground based data, it is possible to compile detailed inventories of, and to monitor natural resources. Such analyses include the relationships between changes in forest zones and socio-economic development factors. Remote Sensing (RS) and Geographic Information Systems (GIS) are used for more detailed analysis of collected land use information. Remotely sensed data obtained by sensors from a high altitude platform such as the Landsat satellite, would be a good alternative to the ground survey approach. These information systems compile multi-spectral data, which can form a common database for integrated resource inventories. Broad vegetation-type stratification is reported by using Landsat Multispectral Scanner (MSS) and Thematic Mapper (TM) in digital and analogue form; forest types typically have distinctive spectral reflectance patterns. Studies indicate that the technology can provide valuable information with respect to forest resources (Roy et al. 1985, Unni et al. 1985, Jadhav et al. 1987).
This study is part of an environmental assessment of the Ca River Basin, carried out by the National University of Laos (NUOL), Center for Natural Resources and Environmental Studies (CRES) of the National University of Hanoi, the University of Vinh, Vietnam. Only the results of the Lao section are given here and complement the results of a socio-economic survey carried out by NUOL. The main objective of the study is to assess the potential impact of road upgrade on land cover. This paper presents the results of land use and land cover change detection between 1995 and 1997 and to measure the changes close to roads and rivers.
Page 1 of 7

MATERIALS AND METHODS
Materials
Four raw satellite images, taken in 1989, 1992, 1995 and 1997 (Landsat TM band 234, Path 127/128, Row 46/47) were, rectified and provided by World Resources Institute (WRI) for this study. However, the first two dates were not used due to high cloud-covers.
Location of the Study Area
Auxiliary data such as topographic maps scale 1:100- 000 and land use maps from Department of Forestry were used to delineate roads, rivers and to assist image interpretation.
The computer software used to combine and analyze the images were Copenhagen Image Processing System (CHIPS), Version 4.3 and PC ARC/INFO, Version 3.5.1 for the GIS analysis.
Methods
Location
The study area is the Ca River Basin (CRB) located in the northern part of Laos. With an area of 9342 sq. km, it includes parts of Xieng-khuang and Huaphan provinces. Nam Nuen (Ca River), one of the three main rivers, flows from Laos to Vietnam and it is the main river in the watershed.
Image processing
Landsat images were processed and analyzed by
Copenhagen Image Processing System (CHIPS). The supervised maximum likelihood classifier was used to transform multispectral data into thematic maps. Training areas were selected based on visualization of false color composite (FCC), band 432. Training areas for each land cover type ware identified separately using sunshine and shadow perspective to reduce interpretation errors. The two results were then merged.
Each image was classified separately and merged into a change detection image. It was then filtered to remove single pixel artifacts caused by misregistration and system noise. The accuracy of the classification results was evaluated through comparison with the land use maps produced by the Forest Monitoring Project. Randomly selected reference pixels were inspected at the corresponding sites to verify the classification result. A ground truth survey was not carried out to confirm the final image, due to insufficient time and budget.
Change detection analysis
Page 2 of 7
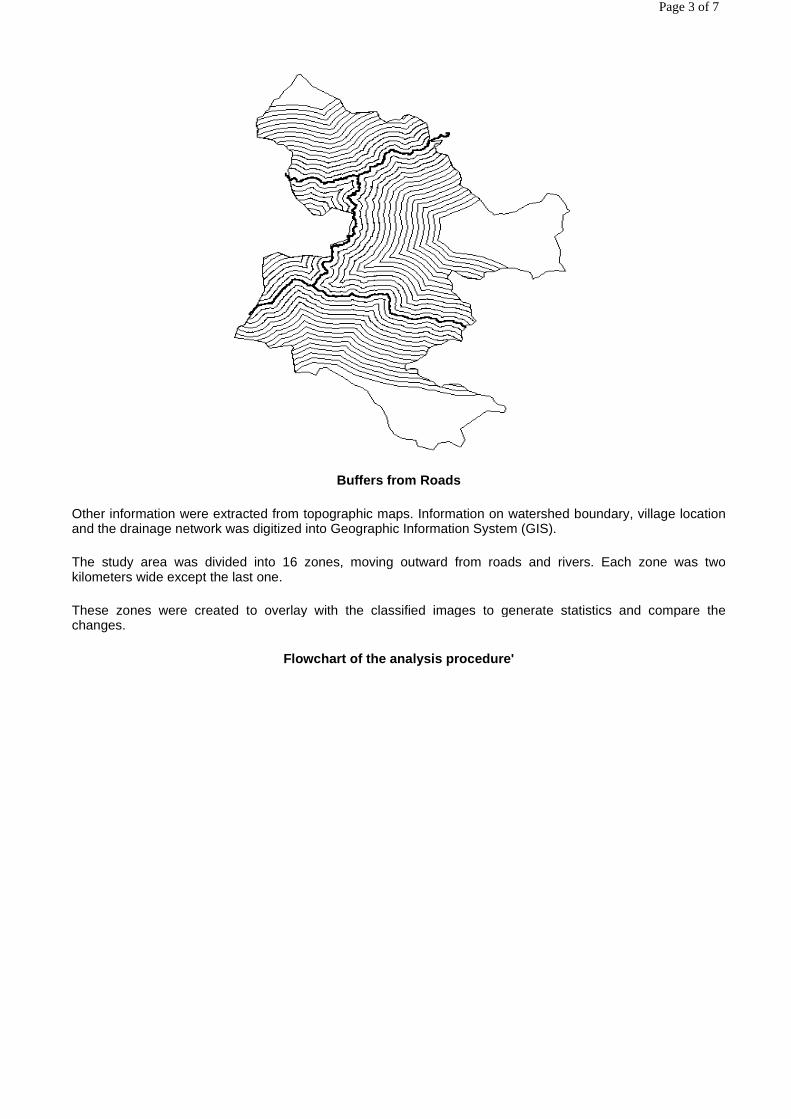
Buffers from Roads
Other information were extracted from topographic maps. Information on watershed boundary, village location and the drainage network was digitized into Geographic Information System (GIS).
The study area was divided into 16 zones, moving outward from roads and rivers. Each zone was two kilometers wide except the last one.
These zones were created to overlay with the classified images to generate statistics and compare the changes.
Flowchart of the analysis procedure'
Page 3 of 7
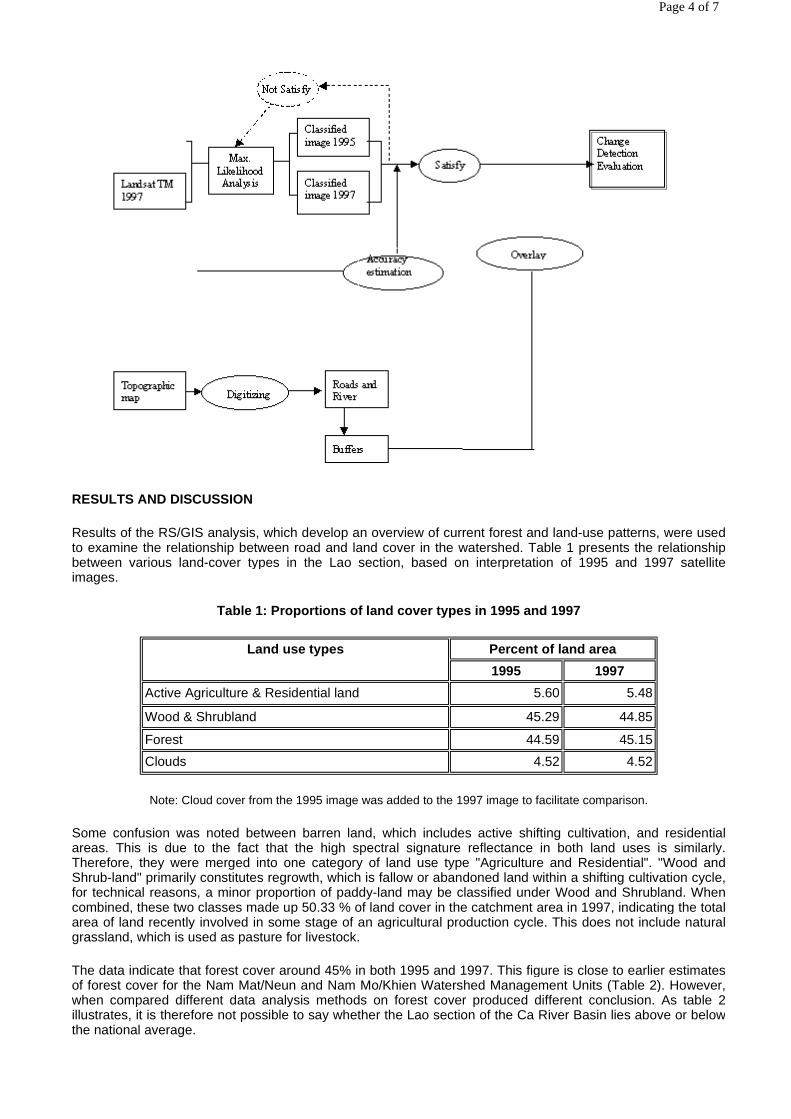
RESULTS AND DISCUSSION
Results of the RS/GIS analysis, which develop an overview of current forest and land-use patterns, were used to examine the relationship between road and land cover in the watershed. Table 1 presents the relationship between various land-cover types in the Lao section, based on interpretation of 1995 and 1997 satellite images.
Table 1: Proportions of land cover types in 1995 an d 1997
Note: Cloud cover from the 1995 image was added to the 1997 image to facilitate comparison.
Some confusion was noted between barren land, which includes active shifting cultivation, and residential areas. This is due to the fact that the high spectral signature reflectance in both land uses is similarly. Therefore, they were merged into one category of land use type "Agriculture and Residential". "Wood and Shrub-land" primarily constitutes regrowth, which is fallow or abandoned land within a shifting cultivation cycle, for technical reasons, a minor proportion of paddy-land may be classified under Wood and Shrubland. When combined, these two classes made up 50.33 % of land cover in the catchment area in 1997, indicating the total area of land recently involved in some stage of an agricultural production cycle. This does not include natural grassland, which is used as pasture for livestock.
The data indicate that forest cover around 45% in both 1995 and 1997. This figure is close to earlier estimates of forest cover for the Nam Mat/Neun and Nam Mo/Khien Watershed Management Units (Table 2). However, when compared different data analysis methods on forest cover produced different conclusion. As table 2 illustrates, it is therefore not possible to say whether the Lao section of the Ca River Basin lies above or below the national average.
Land use types Percent of land area
1995 1997
Active Agriculture & Residential land 5.60 5.48
Wood & Shrubland 45.29 44.85
Forest 44.59 45.15
Clouds 4.52 4.52
Page 4 of 7
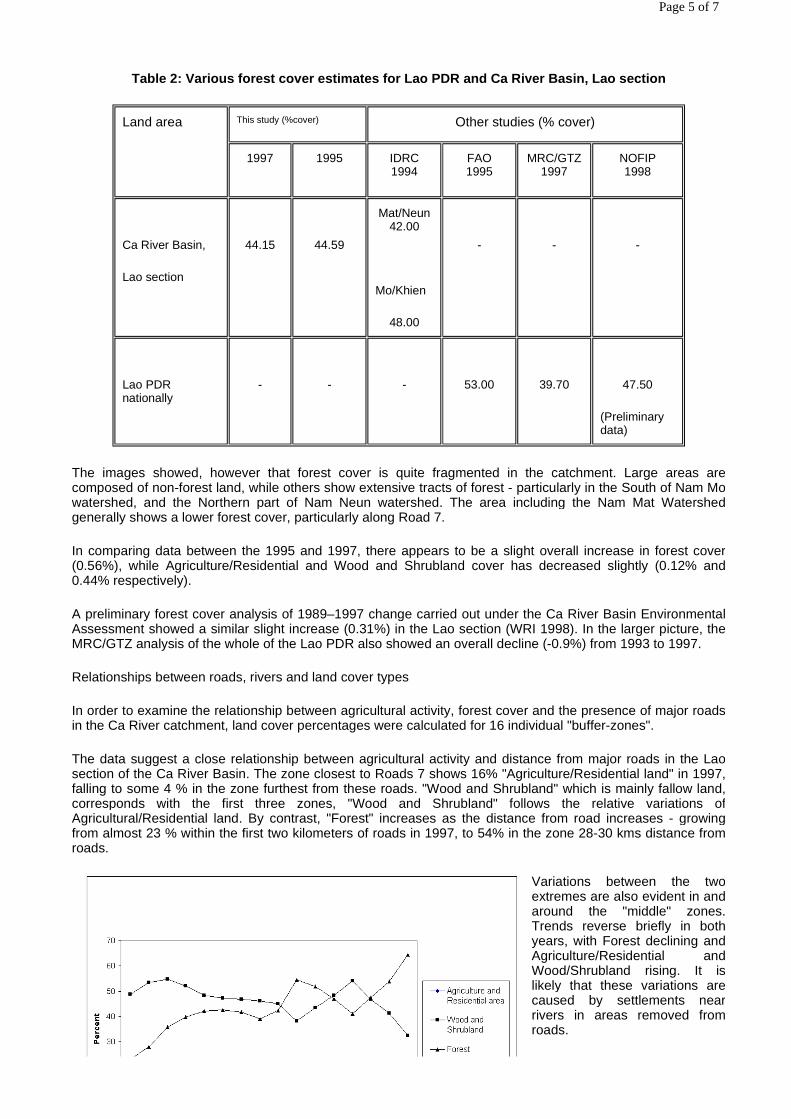
Table 2: Various forest cover estimates for Lao PDR and Ca River Basin, Lao section
The images showed, however that forest cover is quite fragmented in the catchment. Large areas are composed of non-forest land, while others show extensive tracts of forest - particularly in the South of Nam Mo watershed, and the Northern part of Nam Neun watershed. The area including the Nam Mat Watershed generally shows a lower forest cover, particularly along Road 7.
In comparing data between the 1995 and 1997, there appears to be a slight overall increase in forest cover (0.56%), while Agriculture/Residential and Wood and Shrubland cover has decreased slightly (0.12% and 0.44% respectively).
A preliminary forest cover analysis of 1989–1997 change carried out under the Ca River Basin Environmental Assessment showed a similar slight increase (0.31%) in the Lao section (WRI 1998). In the larger picture, the MRC/GTZ analysis of the whole of the Lao PDR also showed an overall decline (-0.9%) from 1993 to 1997.
Relationships between roads, rivers and land cover types
In order to examine the relationship between agricultural activity, forest cover and the presence of major roads in the Ca River catchment, land cover percentages were calculated for 16 individual "buffer-zones".
The data suggest a close relationship between agricultural activity and distance from major roads in the Lao section of the Ca River Basin. The zone closest to Roads 7 shows 16% "Agriculture/Residential land" in 1997, falling to some 4 % in the zone furthest from these roads. "Wood and Shrubland" which is mainly fallow land, corresponds with the first three zones, "Wood and Shrubland" follows the relative variations of Agricultural/Residential land. By contrast, "Forest" increases as the distance from road increases - growing from almost 23 % within the first two kilometers of roads in 1997, to 54% in the zone 28-30 kms distance from roads.
Variations between the two extremes are also evident in and around the "middle" zones. Trends reverse briefly in both years, with Forest declining and Agriculture/Residential and Wood/Shrubland rising. It is likely that these variations are caused by settlements near rivers in areas removed from roads.
Land area This study (%cover) Other studies (% cover)
1997 1995 IDRC 1994
FAO 1995
MRC/GTZ 1997
NOFIP 1998
Ca River Basin,
Lao section
44.15
44.59
Mat/Neun 42.00
Mo/Khien
48.00
-
-
-
Lao PDR nationally
-
-
-
53.00
39.70
47.50
(Preliminary data)
Page 5 of 7

In order to examine this more closely, further buffer-zone analysis was carried out on the major rivers in the catchment. The data indicate that proximity to the rivers in important for agricultural activity in the Lao section of the Ca River Basin. Agriculture/Residential and Wood/Shrubland land is highest in the two-kilometer zone closest to rivers, while Forest dominates the zones furthest away.
The overlap between roads and rivers in the Ca River Basin makes it difficult to draw conclusions from comparison between the two forms of analysis. However, compared to the road/land cover data, Agriculture/ Residential land is higher (4.77 % for 1997) in the area within two kilometers along roads than in areas within two kilometers of rivers. This suggests that the relationship between roads and active agriculture is even more pronounced than
river/agriculture relationships.
Alternatively, Wood/Shrubland covers relatively less area in zones near roads compared to zones near rivers. This could indicate a pattern of more intense cultivation near roads, with less land left as fallow in these areas. This is supported by the lower percentage of Wood and Shrubland in areas between zero and four kilometers from roads, compared to areas between four and eight kilometers from roads. This difference is not noticeable in the river/land cover data.
CONCLUSION
The Lao section of the Ca River Basin shows a clear relationship between distance from roads, forest cover and land use. It shows areas close to roads and rivers display a higher percentage of agricultural activity than other areas, while forest cover increases progressively away from roads or rivers. The forest cover is fragmented and scattered slightly along the roads and rivers. Most large and dense forest areas are located in the steep and difficult areas that are hard to access, so land use is limited.
REFERENCES
Brunner and Nielsen: Draft "Ca River Basin Forest Cover Analysis: Preliminary Results" WRI, Washington. This paper which was written in 1998 presents preliminary findings of forest cover and analysis of a time series of Landsat TM Images of the Ca River Basin.
FAO (1998): Shifting Cultivation Stabilization project. Report No. 97/097, Vientiane.
MRC/GTZ, 1997 Land cover maps from 1992 and 1997 of Xiengkhuang and Huaphan Provinces.
Prida, T., (1991): Surface Water Evaluation in Northeast Thailand: A pilot Project Using Satellite Remote Sensing, Final Report, Asian Institute of Technology, BKK, Thailand.
Roy, P. S., Kaul, R. N., Sharama Roy, M. R., and Garbyal, S. G., (1985): Forest type Stratification and delineation of Shifting Cultivation areas in Eastern Part of Amanachal Paradesh Using Landsat MSS data, International Journal Remote Sensing, Vol. 6,411-418.
Jadhave, R. N., Spivastaver, V. K., Kandya, A.K. Sarat BuBu, (1987): Large Scale Forest Type Mapping Using Satellite Data, International Journal Remote Sensing, Vol. 6, 10-17.
Page 6 of 7

Unni N. V. M., Roy P. S. and Parthasara, (1985): Evaluation of Landsat and Airborne Multispectral Data and Aerial Photos for Mapping Forest Feature and Phenomena in Part of Godavari Basin, International Journal Remote Sensing, Vol. 6, 419-431.
Go back the Table of Contents
Page 7 of 7
GIS/GPS/RS Training for a Land Allocation Project of FAO in Quang Ninh Forest Inventory and Planning Agency:
Experiences and Challenges
Pham Van Cu (VTGEO), Bart Dominicus (ADB 2852), Bui Duc Viet (VTGEO) and Nguyen Thi Thuy (Project Dep.Dir.).
ABSTRACT
The training sessions for the people from the Forest Inventory and Planning Company (FIPC) in Quang Ninh Province have been organized in the framework of an FAO Project. Objectives of this training were:
� To provide the trainees the basic knowledge on digital cartography applied to land use mapping and land allocation tasks.
� To provide basic training in data capturing, retrieving, analysis and modeling.
The training program was tailored to address the needs of the FIPC, i.e., based on an evaluation of skill levels before training compared with skills required to perform the project tasks assigned to the Company. The training was furthermore designed with an eye to building capacities in GIS/GPS and image interpretation not only in forest inventory, but in land use mapping and land allocation practice over the longer term.
This paper presents the experiences drawn from this six-month training course, focusing on the training program setting, implementation, operational data exploitation for training and, especially, with the Project Manager/Trainer/Trainee interfacing throughout these activities. This paper also deals with the problem of how to maintain and valorize the results reached in the future, particularly in circumstances which continue to pose several challenges, e.g., heterogeneity of GIS data (relative to their geometry and thematic quality), and access to data. We will furthermore analyze the awareness of the local community about the role technology plays in the decision making process with respect to the forestry sector with a focus on human resource training.
TRAINING CONTEXT
One of the tasks of the FAO Land Use Planning and Land Allocation Sub-project in Quang Ninh is to build up the capacities of the local staff (FIPC) in using GIS and Remote Sensing as a new tool for their forest inventory and planning exercises.
The Centre for Remote Sensing and Geomatics (VTGEO) of the National Centre for Natural Sciences and Technology of Vietnam (NCST) was selected to implement project training.
Training framework
The objective of this sub-project is to establish a series of thematic maps and to use this task simultaneously as an on-the-job training exercise designed to build a local GIS team within the FIPC. Using Quang Ninh as the test case, the training was conducted to insure that FIPC staff could independently conduct similar land use planning and land allocation exercises in other target areas in the future.
Four communes in the sub-project area in Hoanh Bo District were chosen as the study area. For these communes, real GIS data and air-photos were used for the training.
FIPC staff trainees represented three different levels: operator, forest engineer and enterprise manager. Two representatives from the provincial project manager unit (PPMU) were involved for the introductory module of the training program.
Training facilities:
Page 1 of 3

The VTGEO training team consisted of seven trainers: six junior and one senior (supervisor). Two GIS and Desktop Mapping software were used (ILWIS and MapInfo) both for conducting training and for compiling the Land Use Planning and Land Allocation Map. The training approach, as agreed on by the Project’s Chief Technical Advisor, PPMU, FIPC and VTGEO, featured a hands-on approach with curricula adapted to the specific needs and skill levels of the target trainees. A CKD PC (Completely Knocked Down PC) was used to familiarize participants with a computer’s physical structure.
Training Methodology:
TRAINING CONCEPT:
In our concept, the applicability of RS/GIS/GPS depends on the size of the intersection between ‘User Needs’, ‘Technology Potential’ and ‘Training Program.’ The user must always be taken as much into account as the technology in developing the right concept. In the concrete circumstance of Quang Ninh, limitations were identified as shown in figure 1. This amplification is based on a contextually developed pedagogic methodology including its basic concept, criteria for training curricula and pedagogic materials.
Fig. 1: Intersection of the three key factors influencing the applicability of RS/GIS/GPS
PEDAGOGICAL ISSUES:
Our method was developed using the following concepts:
� Simplified and transparent presentation on Basic Notes. � Objective-driven approach in teaching technical issues. � Repeated spiral know-how training. � Trainee classification: Operator, Engineer and Manager
TRAINING PROGRAM:
Due to the results of the exploratory exchanges conducted between PPMU, CTA, VTGEO and particularly FIPC, VTGEO has built up a four part Program:
1. Introduction to PC using: Hardware, Windows, Word and Excel. 2. Basic Notes on GIS data and Digital Mapping. 3. Data Analysis and Modeling 4. Map Production
This program is to be implemented over a period of six months.
RESULTS:
� A team of three operators for data capturing, data retrieving and map production, two engineers for data analysis, data modeling and photo interpretation. They are all capable of using GPS units for their
Page 2 of 3
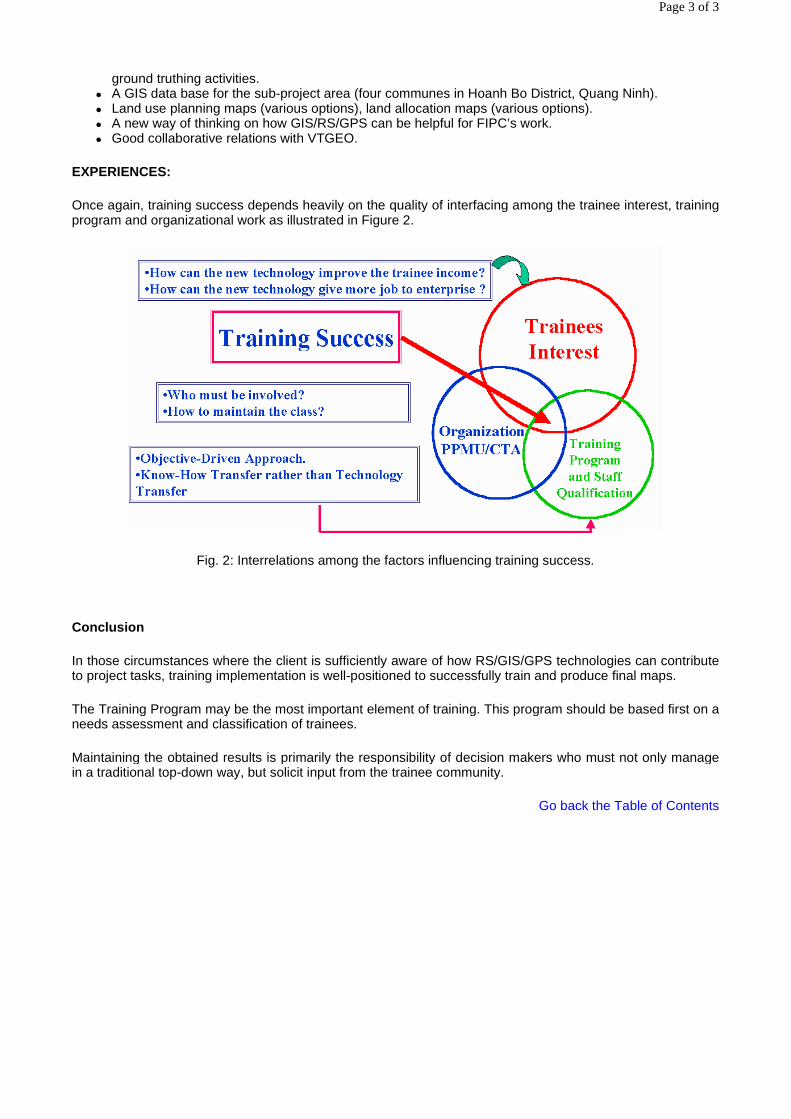
ground truthing activities. � A GIS data base for the sub-project area (four communes in Hoanh Bo District, Quang Ninh). � Land use planning maps (various options), land allocation maps (various options). � A new way of thinking on how GIS/RS/GPS can be helpful for FIPC’s work. � Good collaborative relations with VTGEO.
EXPERIENCES:
Once again, training success depends heavily on the quality of interfacing among the trainee interest, training program and organizational work as illustrated in Figure 2.
Fig. 2: Interrelations among the factors influencing training success.
Conclusion
In those circumstances where the client is sufficiently aware of how RS/GIS/GPS technologies can contribute to project tasks, training implementation is well-positioned to successfully train and produce final maps.
The Training Program may be the most important element of training. This program should be based first on a needs assessment and classification of trainees.
Maintaining the obtained results is primarily the responsibility of decision makers who must not only manage in a traditional top-down way, but solicit input from the trainee community.
Go back the Table of Contents
Page 3 of 3
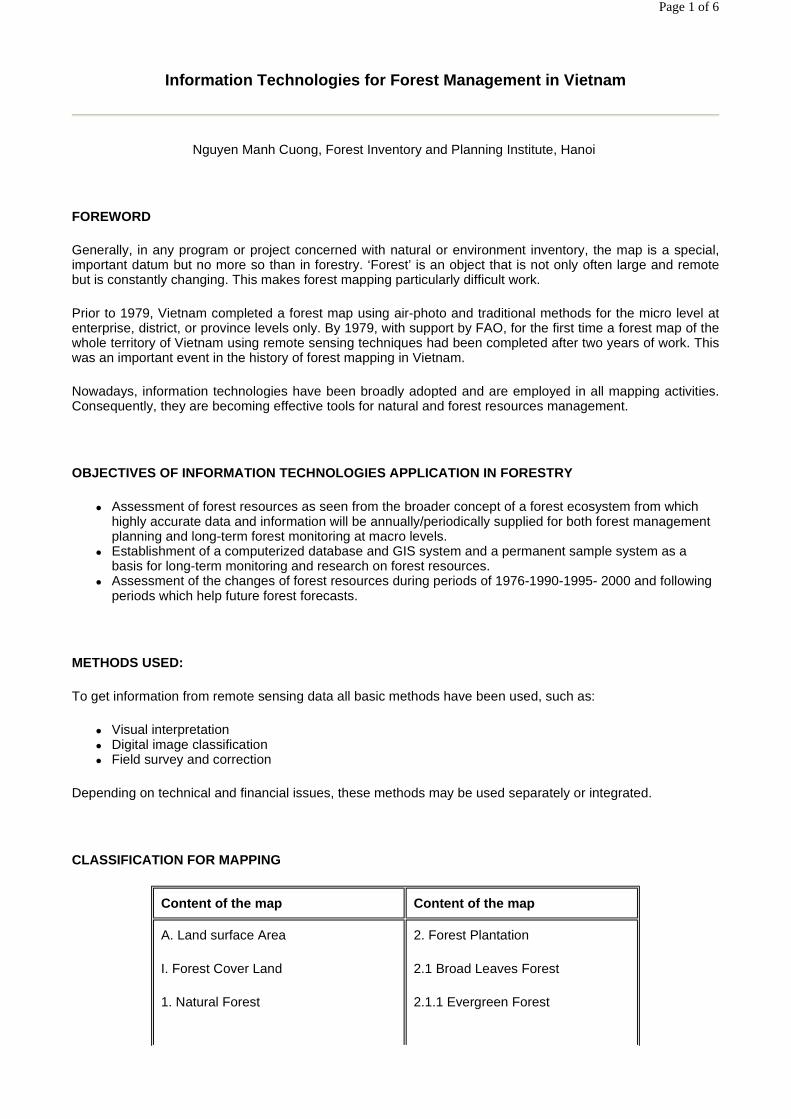
Information Technologies for Forest Management in Vietnam
Nguyen Manh Cuong, Forest Inventory and Planning Institute, Hanoi
FOREWORD
Generally, in any program or project concerned with natural or environment inventory, the map is a special, important datum but no more so than in forestry. ‘Forest’ is an object that is not only often large and remote but is constantly changing. This makes forest mapping particularly difficult work.
Prior to 1979, Vietnam completed a forest map using air-photo and traditional methods for the micro level at enterprise, district, or province levels only. By 1979, with support by FAO, for the first time a forest map of the whole territory of Vietnam using remote sensing techniques had been completed after two years of work. This was an important event in the history of forest mapping in Vietnam.
Nowadays, information technologies have been broadly adopted and are employed in all mapping activities. Consequently, they are becoming effective tools for natural and forest resources management.
OBJECTIVES OF INFORMATION TECHNOLOGIES APPLICATION IN FORESTRY
� Assessment of forest resources as seen from the broader concept of a forest ecosystem from which highly accurate data and information will be annually/periodically supplied for both forest management planning and long-term forest monitoring at macro levels.
� Establishment of a computerized database and GIS system and a permanent sample system as a basis for long-term monitoring and research on forest resources.
� Assessment of the changes of forest resources during periods of 1976-1990-1995- 2000 and following periods which help future forest forecasts.
METHODS USED:
To get information from remote sensing data all basic methods have been used, such as:
� Visual interpretation � Digital image classification � Field survey and correction
Depending on technical and financial issues, these methods may be used separately or integrated.
CLASSIFICATION FOR MAPPING
Content of the map Content of the map
A. Land surface Area
I. Forest Cover Land
1. Natural Forest
2. Forest Plantation
2.1 Broad Leaves Forest
2.1.1 Evergreen Forest
Page 1 of 6
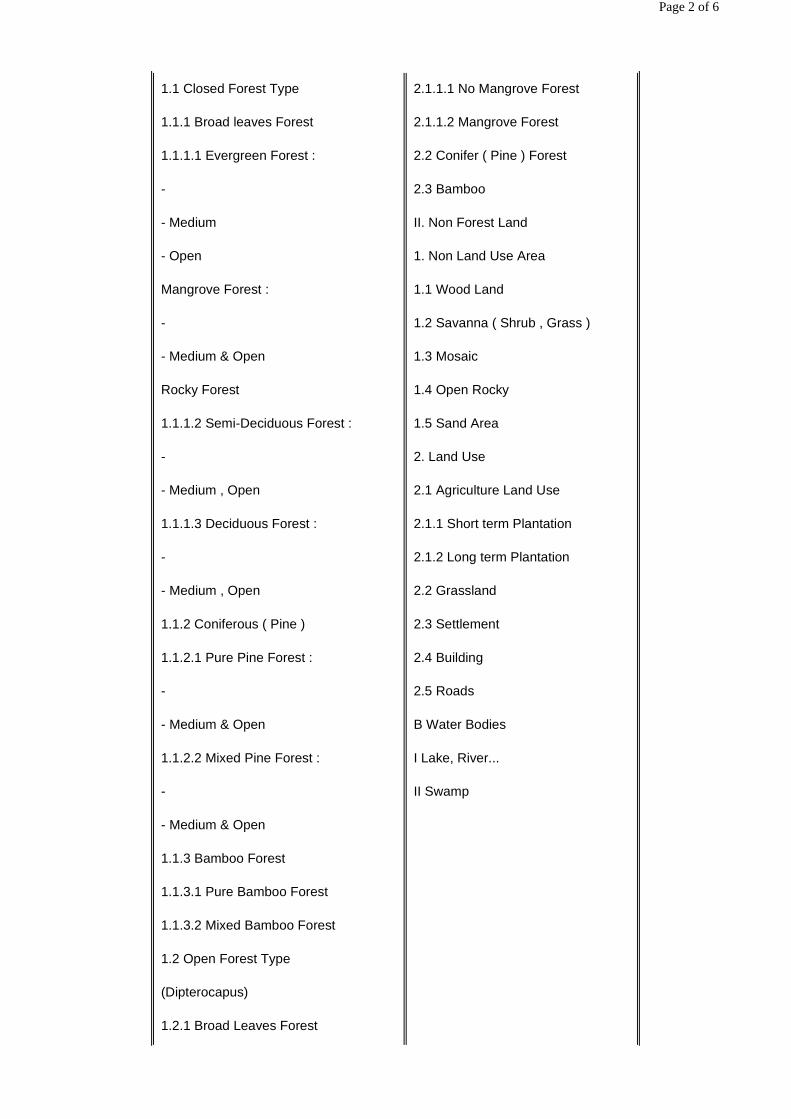
1.1 Closed Forest Type
1.1.1 Broad leaves Forest
1.1.1.1 Evergreen Forest :
-
- Medium
- Open
Mangrove Forest :
-
- Medium & Open
Rocky Forest
1.1.1.2 Semi-Deciduous Forest :
-
- Medium , Open
1.1.1.3 Deciduous Forest :
-
- Medium , Open
1.1.2 Coniferous ( Pine )
1.1.2.1 Pure Pine Forest :
-
- Medium & Open
1.1.2.2 Mixed Pine Forest :
-
- Medium & Open
1.1.3 Bamboo Forest
1.1.3.1 Pure Bamboo Forest
1.1.3.2 Mixed Bamboo Forest
1.2 Open Forest Type
(Dipterocapus)
1.2.1 Broad Leaves Forest
2.1.1.1 No Mangrove Forest
2.1.1.2 Mangrove Forest
2.2 Conifer ( Pine ) Forest
2.3 Bamboo
II. Non Forest Land
1. Non Land Use Area
1.1 Wood Land
1.2 Savanna ( Shrub , Grass )
1.3 Mosaic
1.4 Open Rocky
1.5 Sand Area
2. Land Use
2.1 Agriculture Land Use
2.1.1 Short term Plantation
2.1.2 Long term Plantation
2.2 Grassland
2.3 Settlement
2.4 Building
2.5 Roads
B Water Bodies
I Lake, River...
II Swamp
Page 2 of 6

The Classification is based on FAO Classification
TECHNICAL STEPS OF VISUAL INTERPRETATION
TECHNICAL STEPS OF DIGITAL IMAGE CLASSIFICATION
1.2.2 Conifer.
The Forest Cover Percentage as Follow: > 70 % Medium 40 - 70 % Open < 40 % .
Page 3 of 6
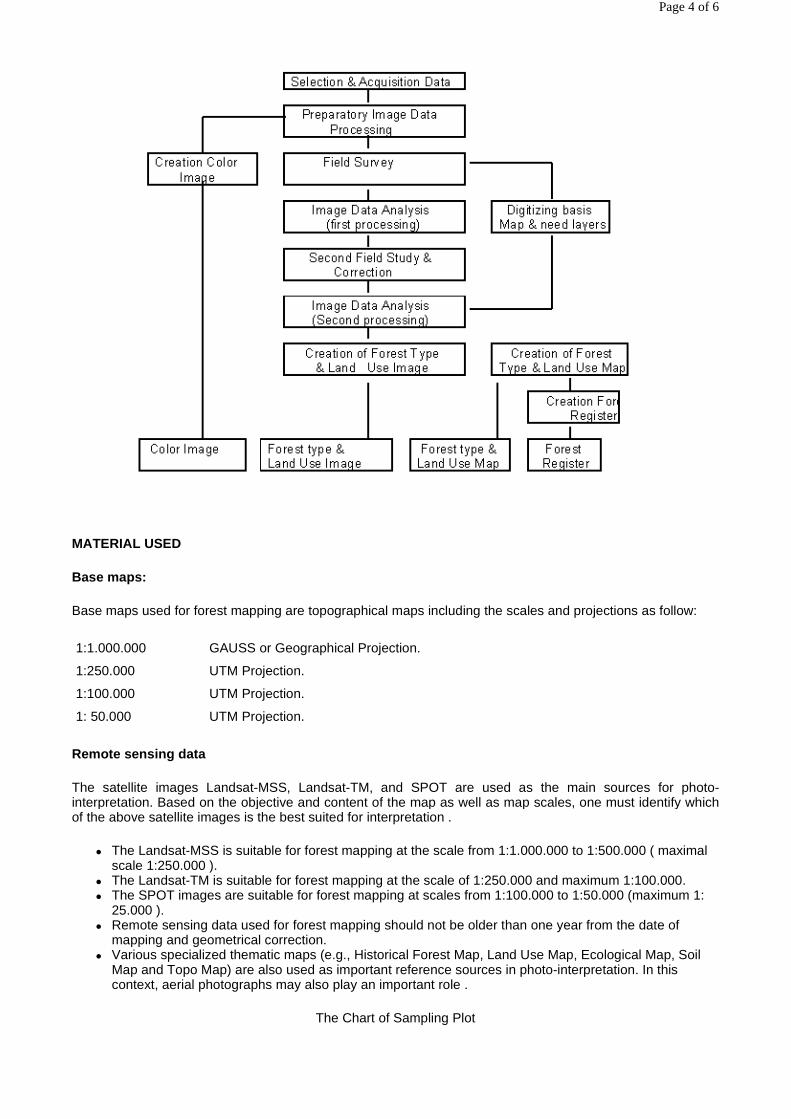
MATERIAL USED
Base maps:
Base maps used for forest mapping are topographical maps including the scales and projections as follow:
Remote sensing data
The satellite images Landsat-MSS, Landsat-TM, and SPOT are used as the main sources for photo-interpretation. Based on the objective and content of the map as well as map scales, one must identify which of the above satellite images is the best suited for interpretation .
� The Landsat-MSS is suitable for forest mapping at the scale from 1:1.000.000 to 1:500.000 ( maximal scale 1:250.000 ).
� The Landsat-TM is suitable for forest mapping at the scale of 1:250.000 and maximum 1:100.000. � The SPOT images are suitable for forest mapping at scales from 1:100.000 to 1:50.000 (maximum 1:
25.000 ). � Remote sensing data used for forest mapping should not be older than one year from the date of
mapping and geometrical correction. � Various specialized thematic maps (e.g., Historical Forest Map, Land Use Map, Ecological Map, Soil
Map and Topo Map) are also used as important reference sources in photo-interpretation. In this context, aerial photographs may also play an important role .
The Chart of Sampling Plot
1:1.000.000 GAUSS or Geographical Projection.
1:250.000 UTM Projection.
1:100.000 UTM Projection.
1: 50.000 UTM Projection.
Page 4 of 6
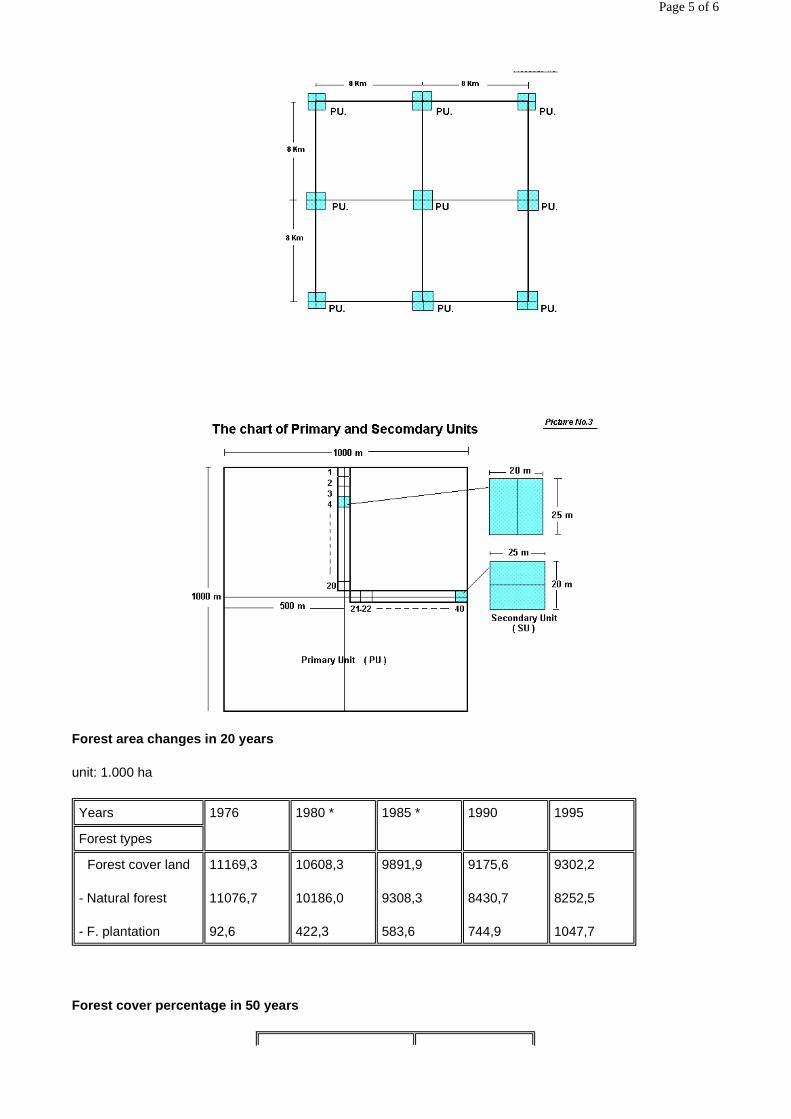
Forest area changes in 20 years
unit: 1.000 ha
Forest cover percentage in 50 years
Years 1976 1980 * 1985 * 1990 1995
Forest types
Forest cover land
- Natural forest
- F. plantation
11169,3
11076,7
92,6
10608,3
10186,0
422,3
9891,9
9308,3
583,6
9175,6
8430,7
744,9
9302,2
8252,5
1047,7
Page 5 of 6

CONCLUSION:
In tropical countries, such as Vietnam, that have multiple-forms of natural geography, natural resources and environment, their management cannot be effective without employing remote sensing applications. The improvement of natural resource and environmental management in Vietnam over the last twenty years demonstrates the importance of using new resource management technologies such as remote sensing, GIS & GPS.
Go back the Table of Contents
Years F. cover (%)
� 1943
� 1976
� 1990
� 1995
� 43,2
� 33,7
� 27,7
� 28,1
Page 6 of 6

Geographic Information System (GIS) As A Tool for Land Evaluation and Land Use Planning
Ho Quang Duc, National Institute For Soils And Fertilizers (NISF), Hanoi
ABSTRACT
The need for optimum use of land has never been greater than at present, when rapid population growth and urban expansion are turning land into a relatively scarce commodity for agriculture.
Sustainable productivity of lands in Vietnam can be only achieved by implementing soil conservation programs which will maintain soil fertility and minimize adverse environmental impacts. A determination on how to use best the lands in our country for sustainable agriculture, forestry and environmental protection is urgent. In order to solve the above mentioned problem, land evaluation and land use planning is necessary for the whole country in general, and for provinces and districts in detail. Geographic Information Systems (GIS) is one effective tool for land evaluation and land use planning.
During the last decade of this century, the land evaluation works in Vietnam have achieved significant results thanks to the advantages of GIS which have promoted sustainable agriculture production and environmental protection.
This paper presents the research results of land evaluation in the Doan Hung mountainous District, Phu Tho Province as a case study which was carried out in 1998 using GIS as an effective tool.
INTRODUCTION
The increasing demand for intensifying cultivation as well as opening up new areas of land in the Doan Hong District may be possible to meet without causing damage to the environment, but only if the land is properly classified according to its suitability for different kinds of use. It is known that Geographic Information Systems (GIS) deal with information related to spatial distribution of features on the earth’s surface, and is designed to efficiently capture, store, update, manipulate, analyze and display all forms of geographically referenced information. Thus, nowadays, GIS is used widely as an effective tool for land evaluation throughout the world –including in Vietnam.
The Doan Hung District has land that could potentially be developed for agriculture and forestry, but these lands had not been evaluated. Consequently, the need to evaluate land for the district became quite urgent. In doing so, the standard FAO methodology and approaches were broadly adopted, albeit with modifications to suit local conditions.
In order to evaluate lands of district, the following maps have been compiled: soil map, present land use map, land unit map and land suitability map. All maps at scale 1: 25,000 have been digitized and printed using computer and plotter.
USING GIS FOR LAND EVALUATION OF THE DISTRICT
Background of the District
Doan Hung is one of ten districts in Phu Tho province, situated between 21°00’ - 21°30’ N Latitudes and 105°00’ - 105°17’ E Longitudes. The total area of the district is 30,400 ha and supports a population of 99,587 which includes seven minorities. The topography of the district is commonly undulating to rolling and mountainous with narrow valleys between the hills and mountains which make the district higher from Southeast to Northwest. Main soil forming parent materials are metamorphic, clay shale and sedimentary. Two rivers flow throughout the district, Lo and Chay, as well as a number of small streams. Some meteorological features are
Page 1 of 6

as follow: Mean summer and winter temperatures are 23°7C to 24°3C and 15°2 to 16°3 C respectively. Annual rainfall is 1,641 mm, which is concentrated in June, July and August, while evaporation is 824 mm. Humidity is rather high, more than 80%; total solar radiation is around 100-110 Kcal/cm2/year.
Compiling soil map
In order to conduct a planned land evaluation in the Doan Hung district, a soil map was required. The mapping exercise that resulted was based on the FAO-UNESCO soil classification system. Soil survey and soil sample analysis were conducting following FAO methods. The completed soil map (scale 1: 25,000) divides the soils into six major groups, thirteen soil units and fifty two soil subunits and lower levels. Of the major soil groups, Acrisols cover the largest area (accounting for 20,104.17 ha), followed by Fluvisols (4,131.88 ha); Ferralsols (1,573.05 ha); Leptosols (920.34 ha); Gleysols (693.33 ha) and Arenosols (55.81 ha); the percentages of total area are: 73.16%; 15.04%; 5.72%; 3.35%; 2.52% and 0.20%, respectively. Each soil subunit and lower level has been expressed in the soil map
Soil characteristics in general can be described as follows: soil texture commonly clay (Acrisols and Ferralsols) to loamy silt (other soils); soils are acid and very acid (pH KCl varied from 3.5 to 5.0 with a central point between 4.2-4.3); decline of soil organic matter (on average, organic carbon in the cultivated soils represents only 40-60% of that found in the soils under forests); low cation exchangeable capacity (CEC) and base saturation (BS); poor in nutrients.
Present land use map
The current district level land use map was compiled using the land use map of 1995 as well as satellite images and aerial photos. The structure of main land use types, agriculture land and forestry in 1997 are expressed in tables 1 and 2.
Land unit map
The following land characteristics have been used for compiling the land use map:
- Soil Types:
There are 13 soil units have been chosen:
1. Dystric Fluvisols, 2. Dystric Leptosols (LT), 3. Eutric LT, 4. Haplic Arenosols, 5. Dystric Gleysols (GL), 6. Umbric GL, 7. Xanthic Ferralsols (FR), 8. Haplic FR, 9. Plinthic Acrisols (AC), 10. Gleyic AC, 11. Ferric AC, 12. Arenic AC and 13. Haplic AC.
- Slope angle: SL1: 00-80;
SL2: 80-150;
SL3: 150 - 250 and
SL4: >250.
- Irrigation: I1- Complete irrigated; I2- Partial irrigated and I3- Rainfed.
- Soil effective depth: D1: >100cm; D2: 100-50cm and D3: <50cm
Page 2 of 6
There are sixty nine land units have been identified and expressed in the land unit map. Some land units are expressed in table three.
Land suitability map
In accordance with the FAO Land Evaluation Framework, land suitabilities for each land use type/crop or group of crops have been identified. In order to assess suitabilities, seven land use types have been used:
1. Two rice crops; 2. Rice crops + subsidiary crops; 3. Subsidiary crops; 4. None irrigated Tea; 5. None irrigated Coffee; 6. Fruit trees and 7. Forests.
Matching of land use requirements with land qualities and further factors such as land improvement, environmental impact, economic and social analysis... the map of land suitability for the district has been compiled at the scale of 1: 25,000. At this level, land suitabilities are expressed in category Subclass. The obtained research results in land suitabilities of crops in Doan Hung district are summarized and expressed in table 4.
CONCLUSION:
In Vietnam, land evaluation for land use planning and decision making in sustainable agriculture has benefited considerably from the effective use of GIS. Together with the adoption of FAO’s methodology and approaches of land evaluation, Vietnam’s land evaluation process in Vietnam has progressively improved and developed.
The set of maps, notably the land suitability map, completed for the Doan Hung District are proving a helpful database not only for decision-makers but also for farmers to help select the best crops for their lands.
REFERENCES
Bo N.V, Duc H.Q. et al. 1998. Land Evaluation for Doanhung District (Phutho Province) Following FAO Methods. (In Vietnamese). Research results of National Institute for Soils and Fertilizers (NISF). Hanoi.
FAO. 1976. A Framework for Land Evaluation. Soils Bulletin No 32. Rome.
FAO. 1983. Guidelines: Land Evaluation for Rainfed Agriculture. Soils Bulletin No 52. Rome.
FAO. 1984. Guidelines: Land Evaluation for Forestry. Soils Bulletin No 48. Rome.
FAO. 1985. Guidelines: Land Evaluation for Irrigated Agriculture. Soils Bulletin No 42. Rome.
FAO. 1996. Guidelines for Land Use Planning. Reprinted. Rome.
National Institute for Soils and Fertilizers (NISF). 1997. Land Evaluation for Dongnai Province Following FAO Methods. (In Vietnamese). Agricultural Publishing House. Hochiminh City.
- Soil texture: ST1: Coarse; ST2: Medium and ST3: Fine.
- Rainfall (mm/yr.): R1: > 2,000; R2: 1,600-2,00 and R3: <1,600.
Page 3 of 6
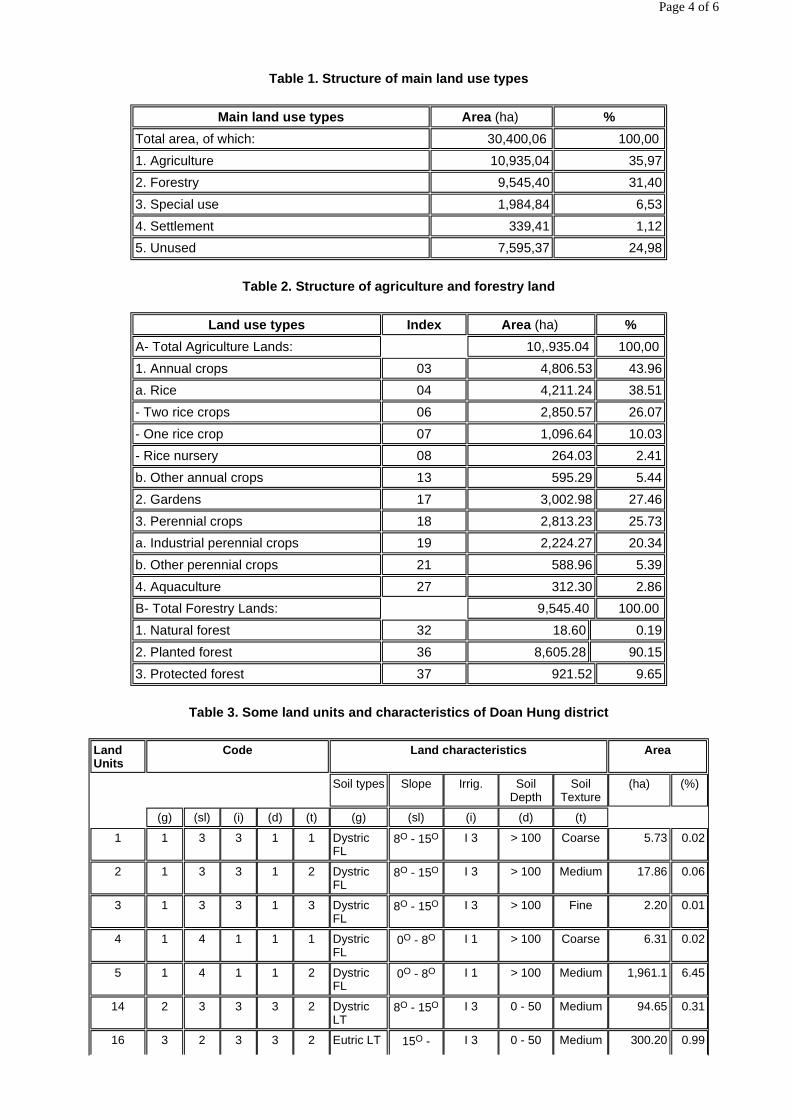
Table 1. Structure of main land use types
Table 2. Structure of agriculture and forestry land
Table 3. Some land units and characteristics of Doan Hung district
Main land use types Area (ha) %
Total area, of which: 30,400,06 100,00
1. Agriculture 10,935,04 35,97
2. Forestry 9,545,40 31,40
3. Special use 1,984,84 6,53
4. Settlement 339,41 1,12
5. Unused 7,595,37 24,98
Land use types Index Area (ha) %
A- Total Agriculture Lands: 10,.935.04 100,00
1. Annual crops 03 4,806.53 43.96
a. Rice 04 4,211.24 38.51
- Two rice crops 06 2,850.57 26.07
- One rice crop 07 1,096.64 10.03
- Rice nursery 08 264.03 2.41
b. Other annual crops 13 595.29 5.44
2. Gardens 17 3,002.98 27.46
3. Perennial crops 18 2,813.23 25.73
a. Industrial perennial crops 19 2,224.27 20.34
b. Other perennial crops 21 588.96 5.39
4. Aquaculture 27 312.30 2.86
B- Total Forestry Lands: 9,545.40 100.00
1. Natural forest 32 18.60 0.19
2. Planted forest 36 8,605.28 90.15
3. Protected forest 37 921.52 9.65
Land Units
Code Land characteristics Area
Soil types Slope Irrig. Soil Depth
Soil Texture
(ha) (%)
(g) (sl) (i) (d) (t) (g) (sl) (i) (d) (t)
1 1 3 3 1 1 Dystric FL
8O - 15O I 3 > 100 Coarse 5.73 0.02
2 1 3 3 1 2 Dystric FL
8O - 15O I 3 > 100 Medium 17.86 0.06
3 1 3 3 1 3 Dystric FL
8O - 15O I 3 > 100 Fine 2.20 0.01
4 1 4 1 1 1 Dystric FL
0O - 8O I 1 > 100 Coarse 6.31 0.02
5 1 4 1 1 2 Dystric FL
0O - 8O I 1 > 100 Medium 1,961.1 6.45
14 2 3 3 3 2 Dystric LT
8O - 15O I 3 0 - 50 Medium 94.65 0.31
16 3 2 3 3 2 Eutric LT 15O - I 3 0 - 50 Medium 300.20 0.99
Page 4 of 6
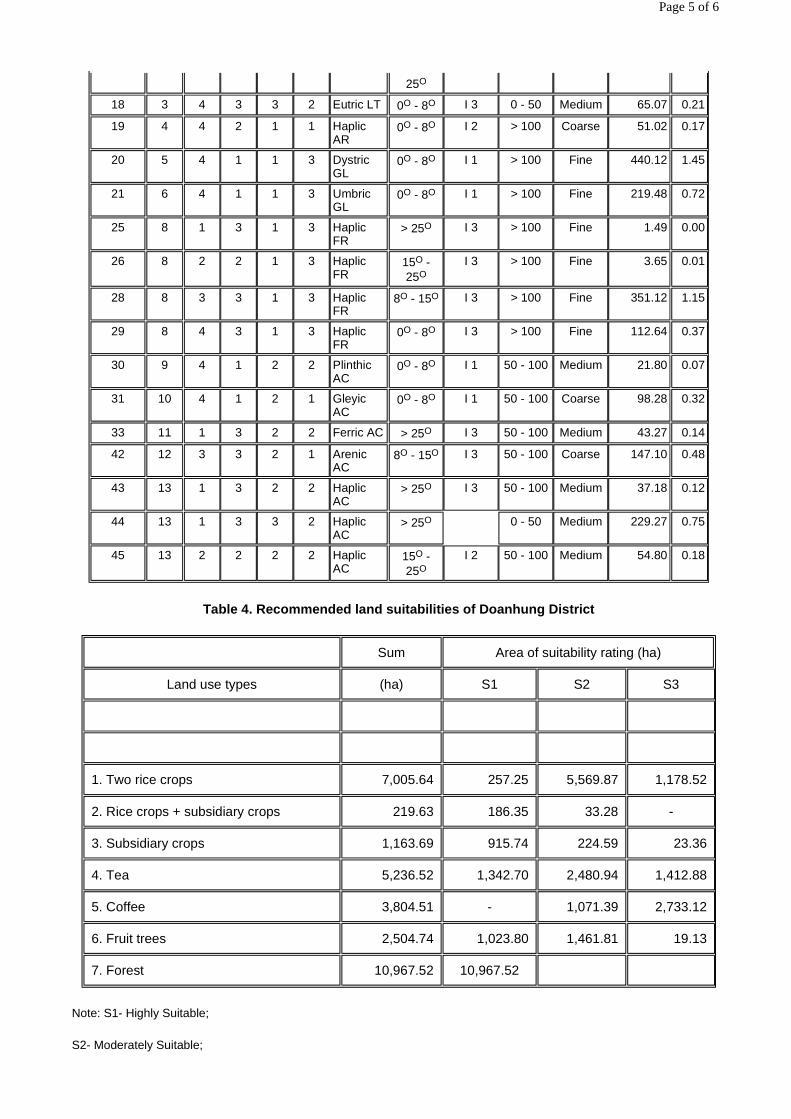
Table 4. Recommended land suitabilities of Doanhung District
Note: S1- Highly Suitable;
S2- Moderately Suitable;
25O
18 3 4 3 3 2 Eutric LT 0O - 8O I 3 0 - 50 Medium 65.07 0.21
19 4 4 2 1 1 Haplic AR
0O - 8O I 2 > 100 Coarse 51.02 0.17
20 5 4 1 1 3 Dystric GL
0O - 8O I 1 > 100 Fine 440.12 1.45
21 6 4 1 1 3 Umbric GL
0O - 8O I 1 > 100 Fine 219.48 0.72
25 8 1 3 1 3 Haplic FR
> 25O I 3 > 100 Fine 1.49 0.00
26 8 2 2 1 3 Haplic FR
15O - 25O
I 3 > 100 Fine 3.65 0.01
28 8 3 3 1 3 Haplic FR
8O - 15O I 3 > 100 Fine 351.12 1.15
29 8 4 3 1 3 Haplic FR
0O - 8O I 3 > 100 Fine 112.64 0.37
30 9 4 1 2 2 Plinthic AC
0O - 8O I 1 50 - 100 Medium 21.80 0.07
31 10 4 1 2 1 Gleyic AC
0O - 8O I 1 50 - 100 Coarse 98.28 0.32
33 11 1 3 2 2 Ferric AC > 25O I 3 50 - 100 Medium 43.27 0.14
42 12 3 3 2 1 Arenic AC
8O - 15O I 3 50 - 100 Coarse 147.10 0.48
43 13 1 3 2 2 Haplic AC
> 25O I 3 50 - 100 Medium 37.18 0.12
44 13 1 3 3 2 Haplic AC
> 25O 0 - 50 Medium 229.27 0.75
45 13 2 2 2 2 Haplic AC
15O - 25O
I 2 50 - 100 Medium 54.80 0.18
Sum Area of suitability rating (ha)
Land use types (ha) S1 S2 S3
1. Two rice crops 7,005.64 257.25 5,569.87 1,178.52
2. Rice crops + subsidiary crops 219.63 186.35 33.28 -
3. Subsidiary crops 1,163.69 915.74 224.59 23.36
4. Tea 5,236.52 1,342.70 2,480.94 1,412.88
5. Coffee 3,804.51 - 1,071.39 2,733.12
6. Fruit trees 2,504.74 1,023.80 1,461.81 19.13
7. Forest 10,967.52 10,967.52
Page 5 of 6

S3- Marginally Suitable.
Go back the Table of Contents
Page 6 of 6
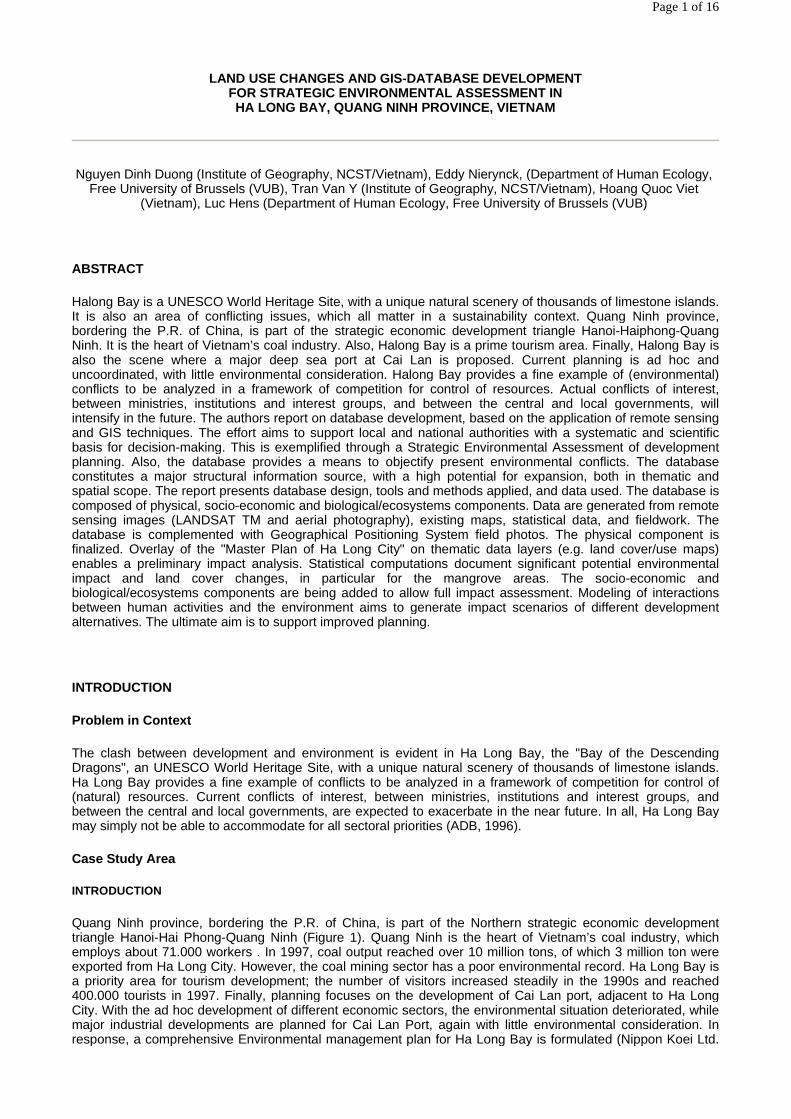
LAND USE CHANGES AND GIS -DATABASE DEVELOPMENT FOR STRATEGIC ENVIRONMENTAL ASSESSMENT IN HA LONG BAY, QUANG NINH PROVINCE, VIETNAM
Nguyen Dinh Duong (Institute of Geography, NCST/Vietnam), Eddy Nierynck, (Department of Human Ecology, Free University of Brussels (VUB), Tran Van Y (Institute of Geography, NCST/Vietnam), Hoang Quoc Viet
(Vietnam), Luc Hens (Department of Human Ecology, Free University of Brussels (VUB)
ABSTRACT
Halong Bay is a UNESCO World Heritage Site, with a unique natural scenery of thousands of limestone islands. It is also an area of conflicting issues, which all matter in a sustainability context. Quang Ninh province, bordering the P.R. of China, is part of the strategic economic development triangle Hanoi-Haiphong-Quang Ninh. It is the heart of Vietnam’s coal industry. Also, Halong Bay is a prime tourism area. Finally, Halong Bay is also the scene where a major deep sea port at Cai Lan is proposed. Current planning is ad hoc and uncoordinated, with little environmental consideration. Halong Bay provides a fine example of (environmental) conflicts to be analyzed in a framework of competition for control of resources. Actual conflicts of interest, between ministries, institutions and interest groups, and between the central and local governments, will intensify in the future. The authors report on database development, based on the application of remote sensing and GIS techniques. The effort aims to support local and national authorities with a systematic and scientific basis for decision-making. This is exemplified through a Strategic Environmental Assessment of development planning. Also, the database provides a means to objectify present environmental conflicts. The database constitutes a major structural information source, with a high potential for expansion, both in thematic and spatial scope. The report presents database design, tools and methods applied, and data used. The database is composed of physical, socio-economic and biological/ecosystems components. Data are generated from remote sensing images (LANDSAT TM and aerial photography), existing maps, statistical data, and fieldwork. The database is complemented with Geographical Positioning System field photos. The physical component is finalized. Overlay of the "Master Plan of Ha Long City" on thematic data layers (e.g. land cover/use maps) enables a preliminary impact analysis. Statistical computations document significant potential environmental impact and land cover changes, in particular for the mangrove areas. The socio-economic and biological/ecosystems components are being added to allow full impact assessment. Modeling of interactions between human activities and the environment aims to generate impact scenarios of different development alternatives. The ultimate aim is to support improved planning.
INTRODUCTION
Problem in Context
The clash between development and environment is evident in Ha Long Bay, the "Bay of the Descending Dragons", an UNESCO World Heritage Site, with a unique natural scenery of thousands of limestone islands. Ha Long Bay provides a fine example of conflicts to be analyzed in a framework of competition for control of (natural) resources. Current conflicts of interest, between ministries, institutions and interest groups, and between the central and local governments, are expected to exacerbate in the near future. In all, Ha Long Bay may simply not be able to accommodate for all sectoral priorities (ADB, 1996).
Case Study Area
INTRODUCTION
Quang Ninh province, bordering the P.R. of China, is part of the Northern strategic economic development triangle Hanoi-Hai Phong-Quang Ninh (Figure 1). Quang Ninh is the heart of Vietnam’s coal industry, which employs about 71.000 workers . In 1997, coal output reached over 10 million tons, of which 3 million ton were exported from Ha Long City. However, the coal mining sector has a poor environmental record. Ha Long Bay is a priority area for tourism development; the number of visitors increased steadily in the 1990s and reached 400.000 tourists in 1997. Finally, planning focuses on the development of Cai Lan port, adjacent to Ha Long City. With the ad hoc development of different economic sectors, the environmental situation deteriorated, while major industrial developments are planned for Cai Lan Port, again with little environmental consideration. In response, a comprehensive Environmental management plan for Ha Long Bay is formulated (Nippon Koei Ltd.
Page 1 of 16

and Metacean Ltd., 1997).
Fig.1 Location of Quang Ninh province
SOCIO- ECONOMIC DEVELOPMENT OF THE REGION
Hai Phong and Quang Ninh witnessed rapid economic growth between 1990-97. Pre crisis development patterns emphasized heavy industry, large scale infrastructure, rapid tourism development and export oriented light industry (World Bank, 1999). A number of Master and sectoral plans were developed for all or parts of the area. In general, these plans are incomplete and often incompatible (ADB, 1996):
a. they are not integrated and non co-ordinated; as such, strategies proposed in one plan do not reflect priorities proposed in others;
b. they do not incorporate environmental issues; in particular, limited attention is paid to the medium and long term implications on environmental quality or the conservation of natural resources.
c. as a result of a) and b) they do not address fundamental trade off between: a) infrastructure, transportation, industrialisation, and tourism development; b) between development and the environment.
The change in the area is structural, involving shifts from historically dominant to newer types of economic activities. Important development trade offs need to be made and many are environmental in nature. Planning is the responsibility of many different agencies, depending on whether it is municipal, spatially oriented, or focused on the setting of socio-economic targets. The capacity of local and national institutions to make these trade offs through integrated planning and management is weak and insufficient.
The impact of the East Asian crisis on Vietnam is severe. Hai Phong and Quang Ninh experience significantly lower export demand and an investment collapse: the expected growth rates have fallen dramatically. The regional crisis appears to have changed the rules of the game. There is an urgent need to revisit existing development plans and to develop a framework for strategic growth. The current options may result in excess infrastructure capacity. Careful review and selective modification of the current development plans can generate a viable alternative to the status quo (World Bank, 1999).
MASTER DEVELOPMENT PLAN OF HA LONG CITY (1994-2010)
The Master Plan for Socio-economic Development of Quang Ninh Province (1996-2010), highlights the following development goals (Vo Van Kiet, 1997):
a. to build Quang Ninh into a province of high, steady and sustainable development..., achieving the main targets in economic growth and social progress and preserving the ecological environment;
b. to transform Quang Ninh into an industrial, trade, service and tourist centre.
The Master Plan of Ha Long City (1994-2010) outlines the orientation of long term socio-economic and spatial development (NIURP, 1994). The Master plan contains no comprehensive zoning plan and whatever spatial planning was undertaken, it is too general and insufficient to ensure that development occurs with regard to the environment. Little attention has been paid to factors that influence the development process (preplanning land
Page 2 of 16
uses and constraints, external forces such as (foreign) investment and government policies). From an integrated coastal zone management perspective, a number of disfunctional characteristics have been identified in the area. These clearly stem from insufficient segregation of incompatible uses to minimize negative impacts (ADB, 1996):
a. The tourism zones containing the major hotels are adjacent to a coal and an oil port;
b. The marine transportation route runs directly through Ha Long Bay; c. Urban development is degrading the scenic views of Ha Long Bay; d. Coal mine overburden dumps are well within the view of the road and the near shore areas; e. Marine morages of coal barges exist throughout Ha Long Bay;
Also, a number of coastal and marine environmental issues have been identified, that are of consequence to current and future investment and development patterns (ADB, 1996):
a. Increased urbanization; without investments, environmental quality will further degrade; b. Environmental effects of rapid tourism development, including unplanned physical development, conflicts
with other uses, pollution and ecological impacts; c. Environmental effects of transportation; the most significant issue is the proposed Cai Lan Port; d. Constraints on development of the new economy from coal mining and transportation;
As such, it is an immediate priority to include the environment into the planning of new projects and to co-ordinate closely with efforts to incorporate environmental considerations into regional planning. As the current Master plan does not consider the threats to natural resources, it is advocated that an Environmental Assessment (EA) of the plan be conducted urgently. The recommendations of the EA report and of the environmental management plan being developed should be used in the revision of the plan (Nippon Koei Ltd. and Metacean Ltd., 1997).
Strategic Environmental Assessment
Environmental Impact Assessment (EIA) is applied mainly at the project level. Strategic Environmental Assessment (SEA) is a relatively new concept, aimed at the application of Environmental Assessment to higher levels of decision making. Basically, SEA is a pro-active process, to insure the full integration of environmental considerations into the earliest stages of policy, plan and programme (the 3P’s) development, on a par with economic and social considerations. There is a growing consensus on its need, as to realize the goals of sustainability (EPA Australia, 1996; UNEP, 1996). Worldwide, SEA is a field of intensive research and practice ( Sadler 1996; Partidario, 1996, OECD/DAC, 1997).
There is little experience with SEA in South East Asia and Vietnam in particular. In 1994, EIA was formally introduced in Vietnam with the Law on Environmental Protection. Decree GD 175/CP states that EIA should be conducted for specific projects but also for overall strategies for regional development, strategies and plans for provinces and cities and strategies for urban and population development.
There is a high interest in SEA in Vietnam and capacity building "to carry out Environmental Assessment of development activities of a higher degree of complexity and development of appropriate methods for regional planning, industrial areas, master planning, and cumulative and Strategic EA" is recommended (Le Thac Can, 1997). The Ministry of Planning and Investment (MPI) is actively supporting attempts to incorporate environmental considerations into higher levels of decision-making (DSEE, 1998)
Environmental Assessment and GIS: The Necessity of Database Establishment
Geographical Information Systems (GIS) can serve as a valuable tool for E(I)A and has a role to play in improving Environmental Assessment effectiveness. (Joao and Fonseca, 1996). Eedy stresses the advantages of the use of GIS in EIA; management of large data sets, data overlay and analysis of development and natural resources patterns, trend analysis, data sources for mathematical impact models, habitat and aesthetic analysis and public involvement (Eedy, 1995). Antunes et al., outline that attempts to utilise GIS in EIA demonstrated that GIS can have a wide application in all EIA stages, acting as an integrative framework for the whole process, from the generation, storage and display of the thematic information relative to the vulnerability/sensitivity of the affected resources to impact prediction and finally for their evaluation for decision support (Antunes et al, 1996). However, currently GIS is used in EIA practice mainly as a tool to manage baseline information and is frequently restricted to map production and report preparation. Joao concludes that the full power of GIS has not been fully explored, yet (Joao and Fonseca, 1996).
Page 3 of 16
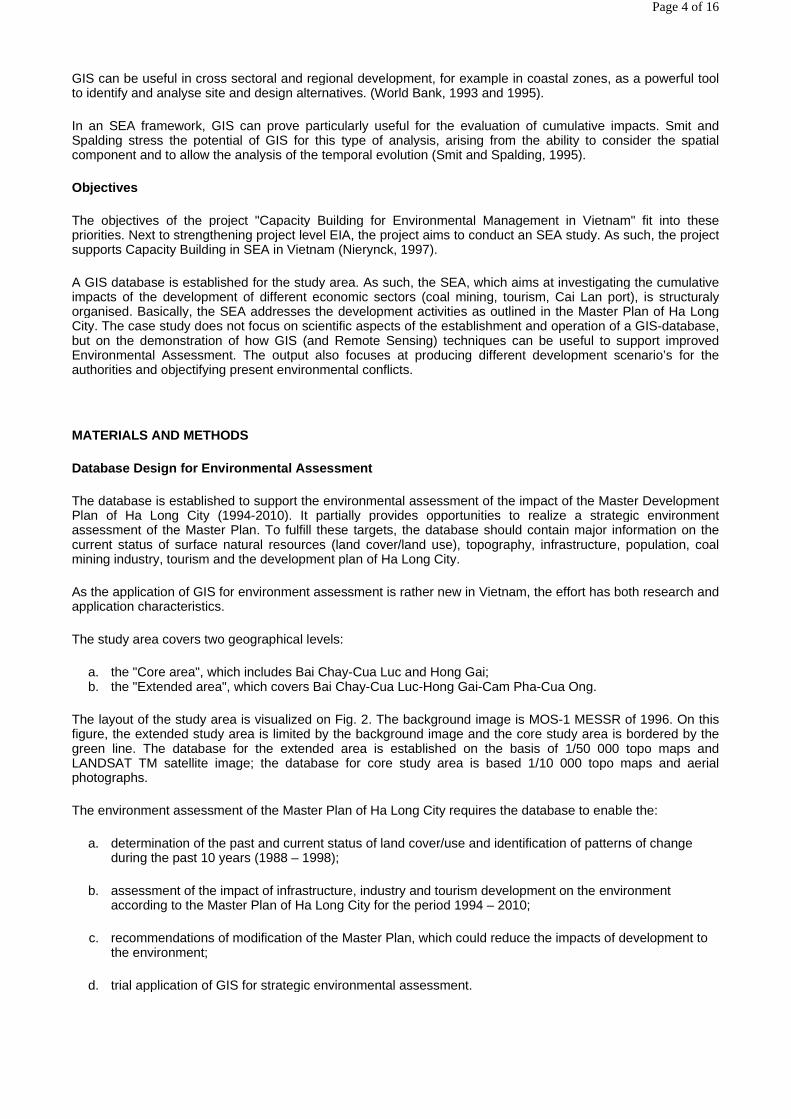
GIS can be useful in cross sectoral and regional development, for example in coastal zones, as a powerful tool to identify and analyse site and design alternatives. (World Bank, 1993 and 1995).
In an SEA framework, GIS can prove particularly useful for the evaluation of cumulative impacts. Smit and Spalding stress the potential of GIS for this type of analysis, arising from the ability to consider the spatial component and to allow the analysis of the temporal evolution (Smit and Spalding, 1995).
Objectives
The objectives of the project "Capacity Building for Environmental Management in Vietnam" fit into these priorities. Next to strengthening project level EIA, the project aims to conduct an SEA study. As such, the project supports Capacity Building in SEA in Vietnam (Nierynck, 1997).
A GIS database is established for the study area. As such, the SEA, which aims at investigating the cumulative impacts of the development of different economic sectors (coal mining, tourism, Cai Lan port), is structuraly organised. Basically, the SEA addresses the development activities as outlined in the Master Plan of Ha Long City. The case study does not focus on scientific aspects of the establishment and operation of a GIS-database, but on the demonstration of how GIS (and Remote Sensing) techniques can be useful to support improved Environmental Assessment. The output also focuses at producing different development scenario’s for the authorities and objectifying present environmental conflicts.
MATERIALS AND METHODS
Database Design for Environmental Assessment
The database is established to support the environmental assessment of the impact of the Master Development Plan of Ha Long City (1994-2010). It partially provides opportunities to realize a strategic environment assessment of the Master Plan. To fulfill these targets, the database should contain major information on the current status of surface natural resources (land cover/land use), topography, infrastructure, population, coal mining industry, tourism and the development plan of Ha Long City.
As the application of GIS for environment assessment is rather new in Vietnam, the effort has both research and application characteristics.
The study area covers two geographical levels:
a. the "Core area", which includes Bai Chay-Cua Luc and Hong Gai; b. the "Extended area", which covers Bai Chay-Cua Luc-Hong Gai-Cam Pha-Cua Ong.
The layout of the study area is visualized on Fig. 2. The background image is MOS-1 MESSR of 1996. On this figure, the extended study area is limited by the background image and the core study area is bordered by the green line. The database for the extended area is established on the basis of 1/50 000 topo maps and LANDSAT TM satellite image; the database for core study area is based 1/10 000 topo maps and aerial photographs.
The environment assessment of the Master Plan of Ha Long City requires the database to enable the:
a. determination of the past and current status of land cover/use and identification of patterns of change during the past 10 years (1988 – 1998);
b. assessment of the impact of infrastructure, industry and tourism development on the environment according to the Master Plan of Ha Long City for the period 1994 – 2010;
c. recommendations of modification of the Master Plan, which could reduce the impacts of development to the environment;
d. trial application of GIS for strategic environmental assessment.
Page 4 of 16
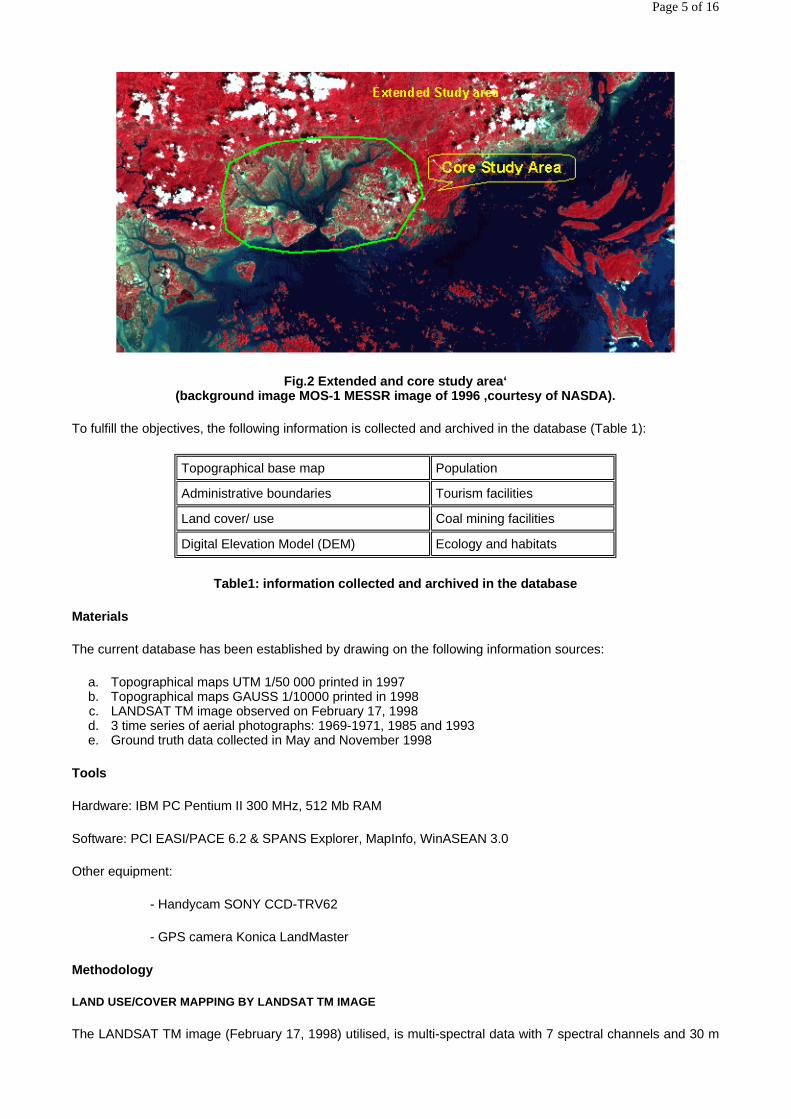
Fig.2 Extended and core study area‘ (background image MOS-1 MESSR image of 1996 ,courte sy of NASDA).
To fulfill the objectives, the following information is collected and archived in the database (Table 1):
Table1: information collected and archived in the d atabase
Materials
The current database has been established by drawing on the following information sources:
a. Topographical maps UTM 1/50 000 printed in 1997 b. Topographical maps GAUSS 1/10000 printed in 1998 c. LANDSAT TM image observed on February 17, 1998 d. 3 time series of aerial photographs: 1969-1971, 1985 and 1993 e. Ground truth data collected in May and November 1998
Tools
Hardware: IBM PC Pentium II 300 MHz, 512 Mb RAM
Software: PCI EASI/PACE 6.2 & SPANS Explorer, MapInfo, WinASEAN 3.0
Other equipment:
- Handycam SONY CCD-TRV62
- GPS camera Konica LandMaster
Methodology
LAND USE/COVER MAPPING BY LANDSAT TM IMAGE
The LANDSAT TM image (February 17, 1998) utilised, is multi-spectral data with 7 spectral channels and 30 m
Topographical base map Population
Administrative boundaries Tourism facilities
Land cover/ use Coal mining facilities
Digital Elevation Model (DEM) Ecology and habitats
Page 5 of 16
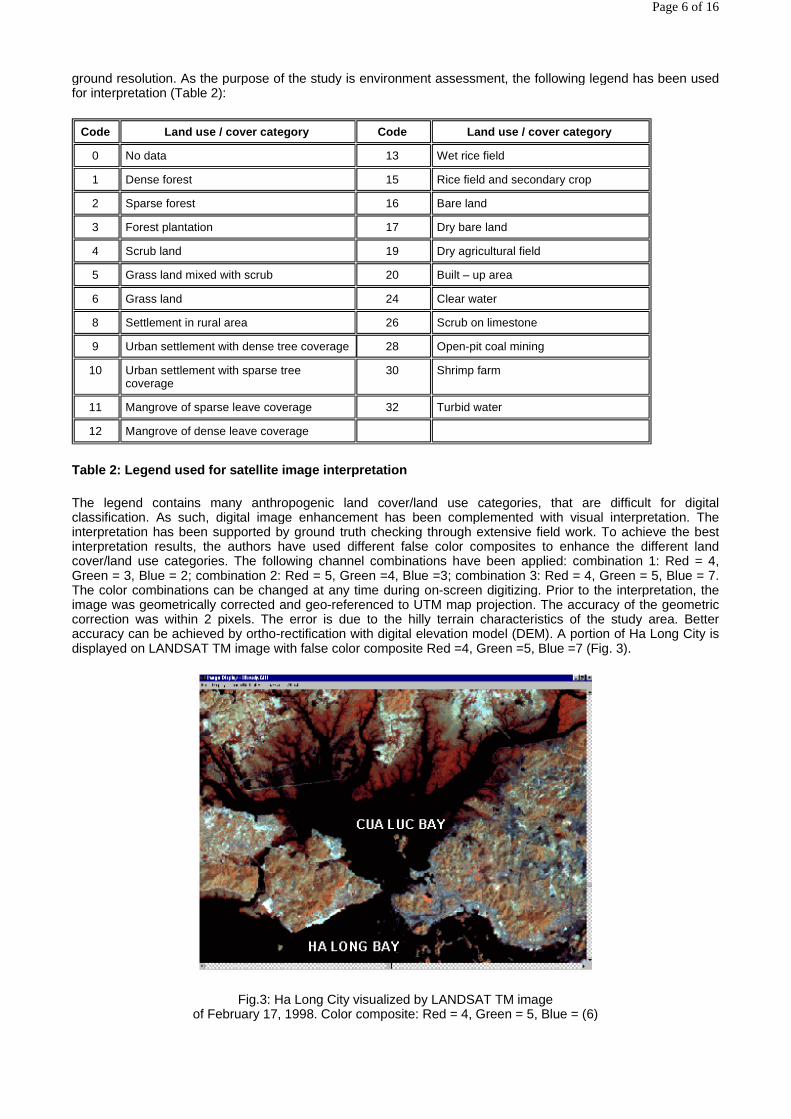
ground resolution. As the purpose of the study is environment assessment, the following legend has been used for interpretation (Table 2):
Table 2: Legend used for satellite image interpreta tion
The legend contains many anthropogenic land cover/land use categories, that are difficult for digital classification. As such, digital image enhancement has been complemented with visual interpretation. The interpretation has been supported by ground truth checking through extensive field work. To achieve the best interpretation results, the authors have used different false color composites to enhance the different land cover/land use categories. The following channel combinations have been applied: combination 1: Red = 4, Green = 3, Blue = 2; combination 2: Red = 5, Green =4, Blue =3; combination 3: Red = 4, Green = 5, Blue = 7. The color combinations can be changed at any time during on-screen digitizing. Prior to the interpretation, the image was geometrically corrected and geo-referenced to UTM map projection. The accuracy of the geometric correction was within 2 pixels. The error is due to the hilly terrain characteristics of the study area. Better accuracy can be achieved by ortho-rectification with digital elevation model (DEM). A portion of Ha Long City is displayed on LANDSAT TM image with false color composite Red =4, Green =5, Blue =7 (Fig. 3).
Fig.3: Ha Long City visualized by LANDSAT TM image of February 17, 1998. Color composite: Red = 4, Green = 5, Blue = (6)
Code Land use / cover category Code Land use / cover category
0 No data 13 Wet rice field
1 Dense forest 15 Rice field and secondary crop
2 Sparse forest 16 Bare land
3 Forest plantation 17 Dry bare land
4 Scrub land 19 Dry agricultural field
5 Grass land mixed with scrub 20 Built – up area
6 Grass land 24 Clear water
8 Settlement in rural area 26 Scrub on limestone
9 Urban settlement with dense tree coverage 28 Open-pit coal mining
10 Urban settlement with sparse tree coverage
30 Shrimp farm
11 Mangrove of sparse leave coverage 32 Turbid water
12 Mangrove of dense leave coverage
Page 6 of 16
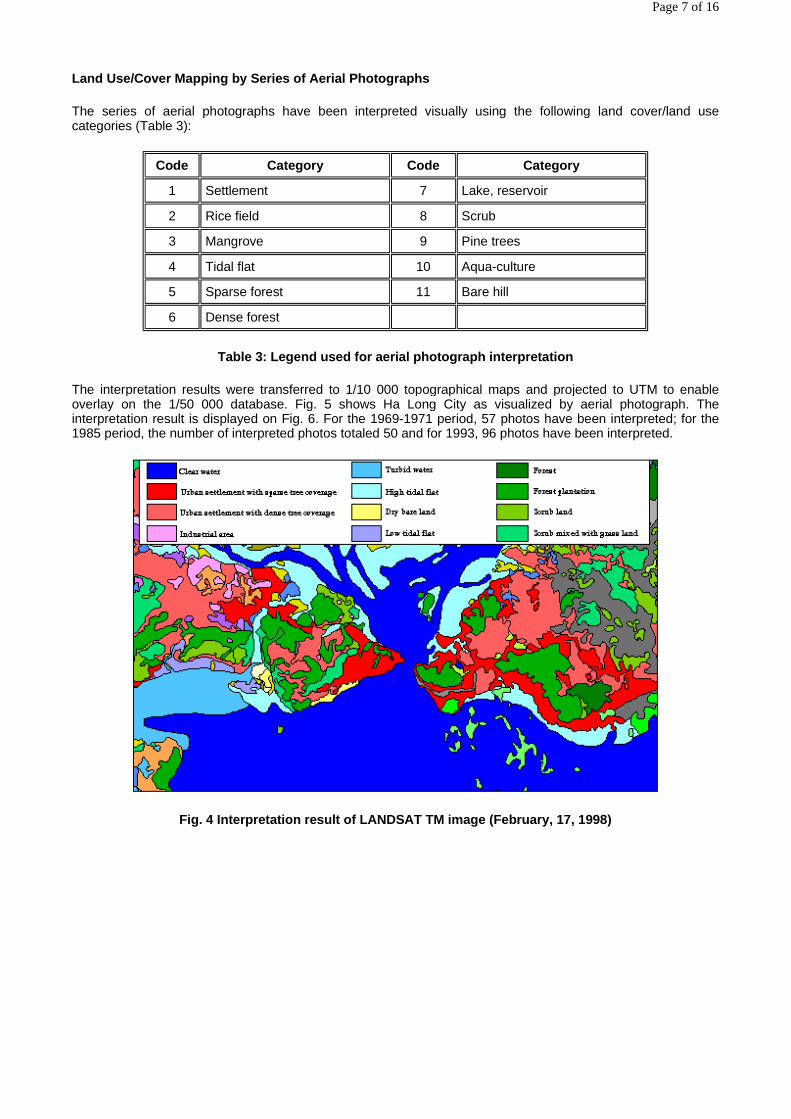
Land Use/Cover Mapping by Series of Aerial Photogra phs
The series of aerial photographs have been interpreted visually using the following land cover/land use categories (Table 3):
Table 3: Legend used for aerial photograph interpre tation
The interpretation results were transferred to 1/10 000 topographical maps and projected to UTM to enable overlay on the 1/50 000 database. Fig. 5 shows Ha Long City as visualized by aerial photograph. The interpretation result is displayed on Fig. 6. For the 1969-1971 period, 57 photos have been interpreted; for the 1985 period, the number of interpreted photos totaled 50 and for 1993, 96 photos have been interpreted.
Fig. 4 Interpretation result of LANDSAT TM image (F ebruary, 17, 1998)
Code Category Code Category
1 Settlement 7 Lake, reservoir
2 Rice field 8 Scrub
3 Mangrove 9 Pine trees
4 Tidal flat 10 Aqua-culture
5 Sparse forest 11 Bare hill
6 Dense forest
Page 7 of 16

Fig. 5 Ha Long City as seen by aerial photograph (1 993)
Page 8 of 16
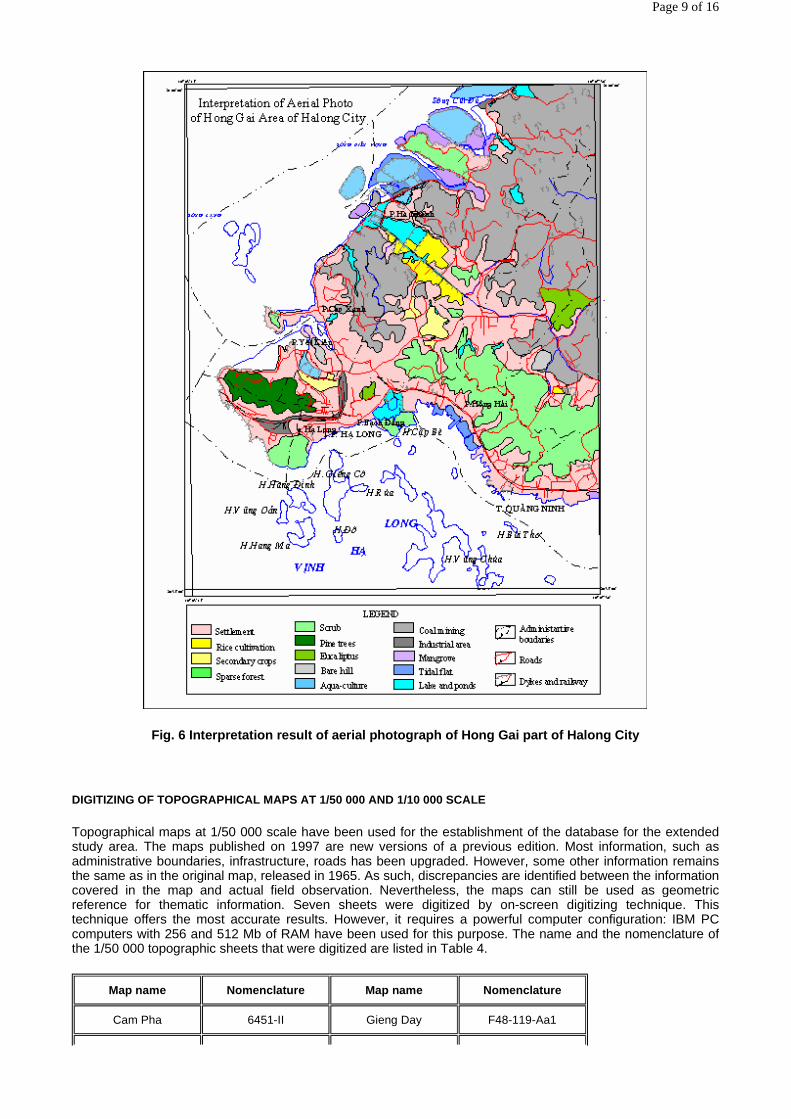
Fig. 6 Interpretation result of aerial photograph o f Hong Gai part of Halong City
DIGITIZING OF TOPOGRAPHICAL MAPS AT 1/50 000 AND 1/ 10 000 SCALE
Topographical maps at 1/50 000 scale have been used for the establishment of the database for the extended study area. The maps published on 1997 are new versions of a previous edition. Most information, such as administrative boundaries, infrastructure, roads has been upgraded. However, some other information remains the same as in the original map, released in 1965. As such, discrepancies are identified between the information covered in the map and actual field observation. Nevertheless, the maps can still be used as geometric reference for thematic information. Seven sheets were digitized by on-screen digitizing technique. This technique offers the most accurate results. However, it requires a powerful computer configuration: IBM PC computers with 256 and 512 Mb of RAM have been used for this purpose. The name and the nomenclature of the 1/50 000 topographic sheets that were digitized are listed in Table 4.
Map name Nomenclature Map name Nomenclature
Cam Pha 6451-II Gieng Day F48-119-Aa1
Page 9 of 16

Table 4: 1/50 000 topographic sheets
The same digitizing technique has been applied for topo-maps at 1/10 000 scale. These maps were compiled from aerial photography recorded in 1993. The name and the nomenclature of the 1/10 000 topographic sheets are listed in Table 5.
The digitized information, such as hydrographic features, human settlements, road and railway infrastructure, and many other information components have been organized into different layers so that further computation could be realized.
One of steps that consumes substantial time and effort is manual contour line digitizing, for both 1/50 000 and 1/10 000 scale maps. The digitized contour lines are used for digital elevation model (DEM) establishment. The DEM will be used for three dimensional perspective view generation, slope and aspect computation and drainage system generation.
To support image classification and thematic information collection, several field trips have been realized to the study area. Information on land cover and land use has been collected by using a video recorder and Konica LandMaster GPS camera. The GPS camera with a built-in GPS chip provides information such as date and time, geographical co-ordinates and bearing captured on the film media together with image. This information combination represents an excellent tool for accurate data registration and enhances the efficiency of the in-house work.
Ha Long 6450-IV Khu 2A F48-119-Aa2
Ba Sao 6451-III Bai Chay F48-119-Aa3
Quang Yen 6350-I Van Yen F48-118-Bb2
Uong Bi 6351-II Xom Cat F48-118-Bb4
Van Canh Island 6450-I Thon 1 F48-107-Cc3
Cat Ba 6450-III Thon B F48-107-Cc3
Hoanh Bo F48-106-Dd4
Quang Ninh F48-119-Aa4
Page 10 of 16
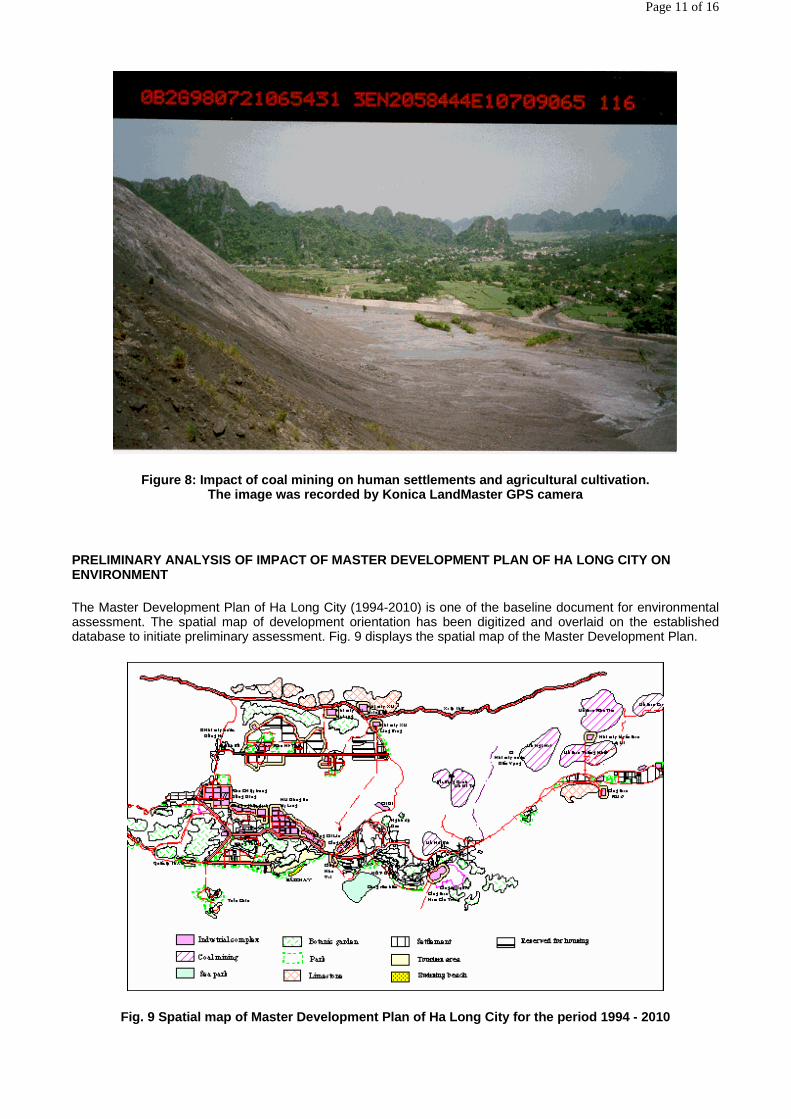
Figure 8: Impact of coal mining on human settlement s and agricultural cultivation. The image was recorded by Konica LandMaster GPS cam era
PRELIMINARY ANALYSIS OF IMPACT OF MASTER DEVELOPMEN T PLAN OF HA LONG CITY ON ENVIRONMENT
The Master Development Plan of Ha Long City (1994-2010) is one of the baseline document for environmental assessment. The spatial map of development orientation has been digitized and overlaid on the established database to initiate preliminary assessment. Fig. 9 displays the spatial map of the Master Development Plan.
Fig. 9 Spatial map of Master Development Plan of Ha Long City for the period 1994 - 2010
Page 11 of 16
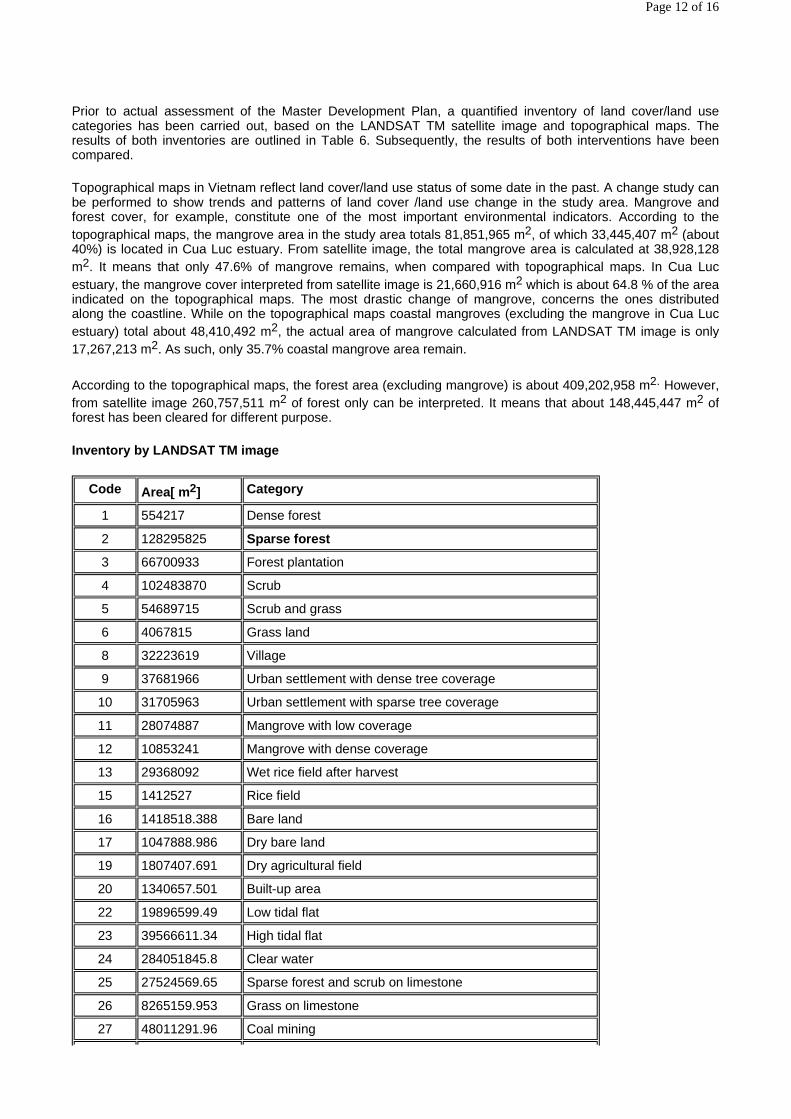
Prior to actual assessment of the Master Development Plan, a quantified inventory of land cover/land use categories has been carried out, based on the LANDSAT TM satellite image and topographical maps. The results of both inventories are outlined in Table 6. Subsequently, the results of both interventions have been compared.
Topographical maps in Vietnam reflect land cover/land use status of some date in the past. A change study can be performed to show trends and patterns of land cover /land use change in the study area. Mangrove and forest cover, for example, constitute one of the most important environmental indicators. According to the topographical maps, the mangrove area in the study area totals 81,851,965 m2, of which 33,445,407 m2 (about 40%) is located in Cua Luc estuary. From satellite image, the total mangrove area is calculated at 38,928,128 m2. It means that only 47.6% of mangrove remains, when compared with topographical maps. In Cua Luc estuary, the mangrove cover interpreted from satellite image is 21,660,916 m2 which is about 64.8 % of the area indicated on the topographical maps. The most drastic change of mangrove, concerns the ones distributed along the coastline. While on the topographical maps coastal mangroves (excluding the mangrove in Cua Luc estuary) total about 48,410,492 m2, the actual area of mangrove calculated from LANDSAT TM image is only 17,267,213 m2. As such, only 35.7% coastal mangrove area remain.
According to the topographical maps, the forest area (excluding mangrove) is about 409,202,958 m2. However, from satellite image 260,757,511 m2 of forest only can be interpreted. It means that about 148,445,447 m2 of forest has been cleared for different purpose.
Inventory by LANDSAT TM image
Code Area[ m 2] Category
1 554217 Dense forest
2 128295825 Sparse forest
3 66700933 Forest plantation
4 102483870 Scrub
5 54689715 Scrub and grass
6 4067815 Grass land
8 32223619 Village
9 37681966 Urban settlement with dense tree coverage
10 31705963 Urban settlement with sparse tree coverage
11 28074887 Mangrove with low coverage
12 10853241 Mangrove with dense coverage
13 29368092 Wet rice field after harvest
15 1412527 Rice field
16 1418518.388 Bare land
17 1047888.986 Dry bare land
19 1807407.691 Dry agricultural field
20 1340657.501 Built-up area
22 19896599.49 Low tidal flat
23 39566611.34 High tidal flat
24 284051845.8 Clear water
25 27524569.65 Sparse forest and scrub on limestone
26 8265159.953 Grass on limestone
27 48011291.96 Coal mining
Page 12 of 16
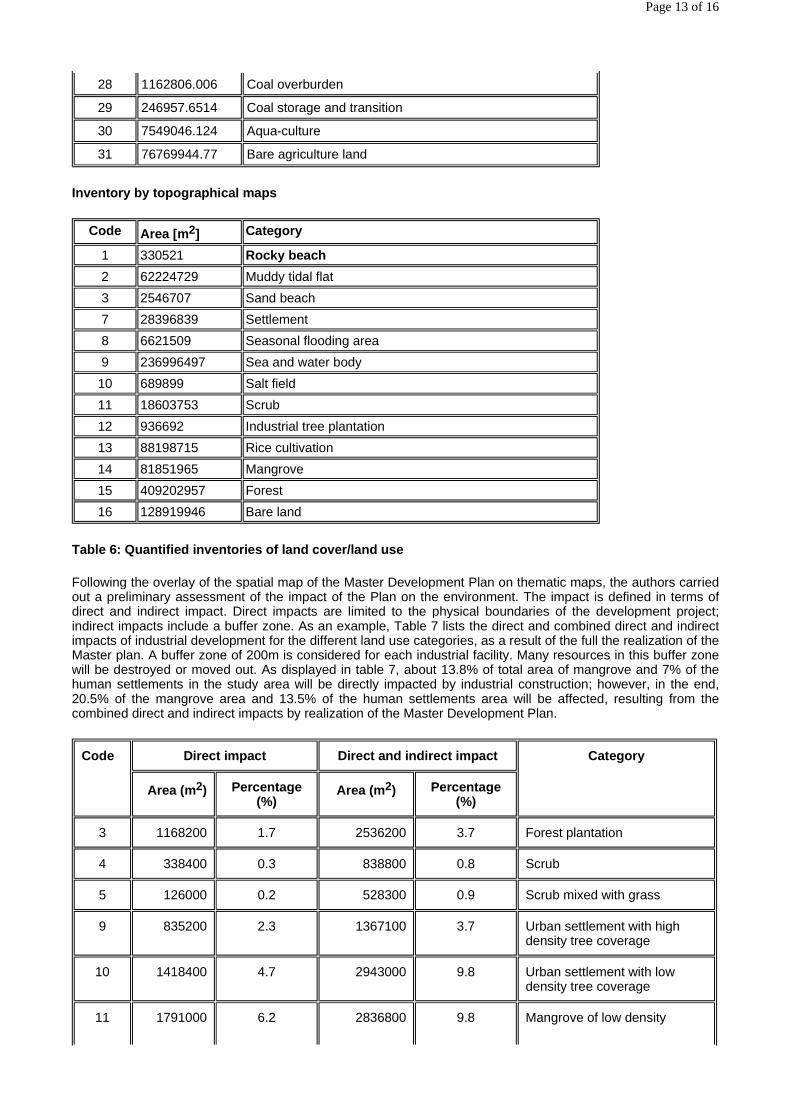
Inventory by topographical maps
Table 6: Quantified inventories of land cover/land use
Following the overlay of the spatial map of the Master Development Plan on thematic maps, the authors carried out a preliminary assessment of the impact of the Plan on the environment. The impact is defined in terms of direct and indirect impact. Direct impacts are limited to the physical boundaries of the development project; indirect impacts include a buffer zone. As an example, Table 7 lists the direct and combined direct and indirect impacts of industrial development for the different land use categories, as a result of the full the realization of the Master plan. A buffer zone of 200m is considered for each industrial facility. Many resources in this buffer zone will be destroyed or moved out. As displayed in table 7, about 13.8% of total area of mangrove and 7% of the human settlements in the study area will be directly impacted by industrial construction; however, in the end, 20.5% of the mangrove area and 13.5% of the human settlements area will be affected, resulting from the combined direct and indirect impacts by realization of the Master Development Plan.
28 1162806.006 Coal overburden
29 246957.6514 Coal storage and transition
30 7549046.124 Aqua-culture
31 76769944.77 Bare agriculture land
Code Area [m 2] Category
1 330521 Rocky beach
2 62224729 Muddy tidal flat
3 2546707 Sand beach
7 28396839 Settlement
8 6621509 Seasonal flooding area
9 236996497 Sea and water body
10 689899 Salt field
11 18603753 Scrub
12 936692 Industrial tree plantation
13 88198715 Rice cultivation
14 81851965 Mangrove
15 409202957 Forest
16 128919946 Bare land
Code Direct impact Direct and indirect impact Category
Area (m 2) Percentage
(%) Area (m 2)
Percentage (%)
3 1168200 1.7 2536200 3.7 Forest plantation
4 338400 0.3 838800 0.8 Scrub
5 126000 0.2 528300 0.9 Scrub mixed with grass
9 835200 2.3 1367100 3.7 Urban settlement with high density tree coverage
10 1418400 4.7 2943000 9.8 Urban settlement with low density tree coverage
11 1791000 6.2 2836800 9.8 Mangrove of low density
Page 13 of 16
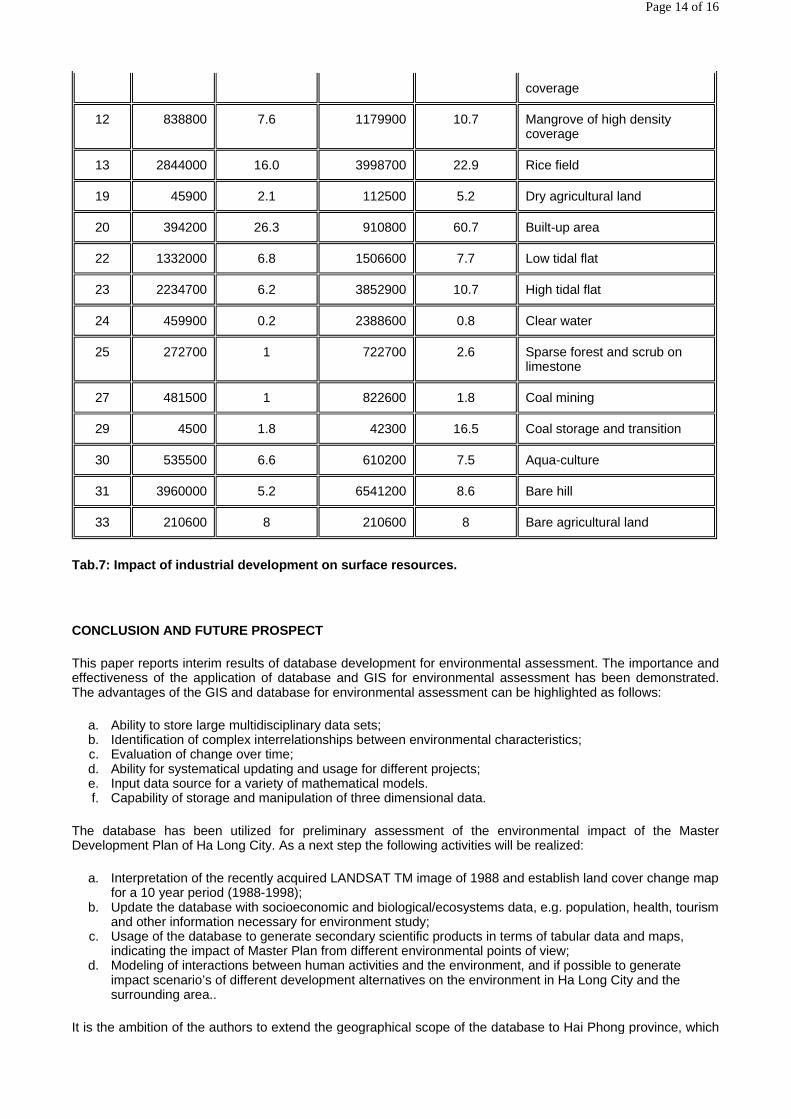
Tab.7: Impact of industrial development on surface resources.
CONCLUSION AND FUTURE PROSPECT
This paper reports interim results of database development for environmental assessment. The importance and effectiveness of the application of database and GIS for environmental assessment has been demonstrated. The advantages of the GIS and database for environmental assessment can be highlighted as follows:
a. Ability to store large multidisciplinary data sets; b. Identification of complex interrelationships between environmental characteristics; c. Evaluation of change over time; d. Ability for systematical updating and usage for different projects; e. Input data source for a variety of mathematical models. f. Capability of storage and manipulation of three dimensional data.
The database has been utilized for preliminary assessment of the environmental impact of the Master Development Plan of Ha Long City. As a next step the following activities will be realized:
a. Interpretation of the recently acquired LANDSAT TM image of 1988 and establish land cover change map for a 10 year period (1988-1998);
b. Update the database with socioeconomic and biological/ecosystems data, e.g. population, health, tourism and other information necessary for environment study;
c. Usage of the database to generate secondary scientific products in terms of tabular data and maps, indicating the impact of Master Plan from different environmental points of view;
d. Modeling of interactions between human activities and the environment, and if possible to generate impact scenario’s of different development alternatives on the environment in Ha Long City and the surrounding area..
It is the ambition of the authors to extend the geographical scope of the database to Hai Phong province, which
coverage
12 838800 7.6 1179900 10.7 Mangrove of high density coverage
13 2844000 16.0 3998700 22.9 Rice field
19 45900 2.1 112500 5.2 Dry agricultural land
20 394200 26.3 910800 60.7 Built-up area
22 1332000 6.8 1506600 7.7 Low tidal flat
23 2234700 6.2 3852900 10.7 High tidal flat
24 459900 0.2 2388600 0.8 Clear water
25 272700 1 722700 2.6 Sparse forest and scrub on limestone
27 481500 1 822600 1.8 Coal mining
29 4500 1.8 42300 16.5 Coal storage and transition
30 535500 6.6 610200 7.5 Aqua-culture
31 3960000 5.2 6541200 8.6 Bare hill
33 210600 8 210600 8 Bare agricultural land
Page 14 of 16
with Ha Noi and Quang Ninh constitutes the strategic economic development triangle in North Vietnam. This area will be experiencing economy growth in the future, as well as environment problems. Without appropriate technology, such as remote sensing, GIS and database, problems may not be controlled and managed in a proper manner. Application of GIS and well developed database will certainly bring useful results and support planners in Vietnam to chose appropriate development alternatives with respect to environment consideration.
ACKNOWLEDGEMENTS
This research is carried out in the framework of the project "Capacity Building for Environmental Management in Vietnam" (VNM/B7-6200/IB/96/05). This project is jointly executed by the Institute of Geography (Vietnam National Center for Natural Science and Technology) and the Department of Human Ecology (Free University of Brussels, VUB, Belgium). The 3 year project, which started in April 1997, is funded by the European Commission. The authors which are staff members of this international co-operation project wish to express their gratitude to the European Commission for granting this project and making this research effort possible.
Also, the authors whish to honor the Department of Education of the Ministry of the Flemish Community, Belgium, for providing additional financial means through the project "Capacity Building for Sustainable Development; GIS and Remote Sensing: Applications for Environmental Planning".
The authors also take the opportunity to thank all project staff, and in particular Ms. Le Thi Thu Hien, Ms.Nguyen Hanh Quyen , Mrs. Ho Le Thu, and Ms. Le Kim Thoa for their active work in the database development.
REFERENCE
Antunes, P, R. Santos, L. Joao, P. Goncalves, and N. Videira. (1996). "A GIS Based Decision Making System for Environmental Impact Assessment", in the Proceedings of the International IAIA Conference, 17-23 June 1996, Estoril, Portugal, pp. 451-456.
DSEE (Department of Science, Education and Environment), Ministry of Planning and Investment. (1998). "Environmental Assessment and Sustainable Development of the Coal Mining Sector in Vietnam: a Case Study in Quang Ninh Province", Summary report, Hanoi, Vietnam, 78 pp.
Eedy, W. (1995). "The Use of GIS in Environmental Assessment", Impact Assessment, Volume 13, Summer 1995, International Association for Impact Assessment, pp. 199-206.
Environmental Protection Agency Australia (EPA). (1996). "Environmental Impact Assessment Training Resource Manual", prepared for the UNEP, preliminary draft, June 1996, 700p.
Asian Development Bank (ADB). (1996). "Coastal and Marine Environmental Management for Ha Long Bay, Socialist Republic of Vietnam", Final Report prepared by EVS Environment Consultants Ltd. in the framework of the RETA 5522 project Coastal and Marine Environmental Management in the South China Sea, Asian Development Bank, Manila, August 1996.
Joao, E and A. Fonseca .(1996). "The Role of GIS in improving Environmental Assessment Effectiveness: Theory versus Practice", Impact Assessment, International Association for Impact Assessment, Volume 14, December 1996, pp. 371-385.
Le Thac Can. (1997). "The Development of EIA in Vietnam", in Environmental Policy and Management in Vietnam, eds. Mercker H. & Vu Thi Hoang, ISBN 3-931227-39-1, Berlin, pp 101-118.
Ministry of Construction of Vietnam 1994, Brief description of Master Development Plan of Ha Long City for the period 1994 – 2010, Hanoi.
National Institute for Research on Urban and Rural Planning (NIURP), Ministry of Construction (1994) "Master Plan for Ha Long City 1994-2010", Hanoi, Vietnam.
Nguyen Dinh Duong. 1998, Database Establishment for Environmental Impact Assessment in Quang Ninh, in Proceedings of the Second Workshop on EIA, organized in the framework of the Capacity Building for
Page 15 of 16
Environmental Management in Vietnam" project (VNM/B7-6200/IB/96/05)Hanoi, 23 January 1998 (in press).
Nguyen Dinh Duong et al. 1998, Database Establishment for Strategic Environment Impact Assessment of Master Development Plan in Ha Long City and Surrounding Area, Proceeding of the Third Workshop on EIA , organized in the framework of the Capacity Building for Environmental Management in Vietnam" project (VNM/B7-6200/IB/96/05)Hanoi, 25 September 1998 (in press).
Nierynck, E. (1997). "Strategic Environmental Assessment" in Proceedings of the First Workshop on Training in EIA, organized in the framework of the Capacity Building for Environmental Management in Vietnam" project (VNM/B7-6200/IB/96/05), December 1997, Hanoi.
Nippon Koei Ltd. & Metacean Ltd. (1998). " The study on Environmental Management for Ha Long Bay", Interim report, December 1998, Japan International Co-operation Agency and the Ministry of Science, Technology & Environment and the People’s Committee of Quang Ninh Province, Vietnam
OECD/DAC Working Party on Development Assistance and Environment. (1997). "Strategic Environmental Assessment (SEA) in Development Cooperation: State of the Art Review", Draft Final Report, March 1997, 77 pp.
Partidario, M. (1996). "Strategic Environmental Assessment: Key Issues Emerging from Recent Practice", Environ. Impact Asses. Review, 1996; 16: pp. 31-55.
Pham Ngoc Dang, 1997, On Environment Impact Assessment of Transportation Development Project, International Seminar on Environmental Impact Assessment 20-24 October 1997.
Sadler, B. (1996). "Environmental Assessment in a Changing World: evaluating practice to improve performance", Final report, International Study of the Effectiveness of Environmental Assessment, Ministry of Supply and Services Canada 1996, ISBN 0-662-24702-7, pp. 139-182.
Smit, b. and H. Spalding (1995). "Methods for Cumulative Effects Assessment", Environ. Impact Asses. Review, 1995; 15: pp. 81-106.
UNEP (1996). "Environmental Impact Assessment: Issues, Trends and Practice", preliminary Version, June 1996, UNEP, Nairobi, 96p.
Vo Van Kiet, (1997). Decision No. 988-TTg of December 30, 1996 of the Prime Minister approving the Master Plan for Socio-Economic Development of Quang Ninh Province in the 1996-2000 Period", Official Gazette No. 5 (15-3-1997), pp. 15-17.
World Bank (1999). "Draft Agenda for the Conference on Options for Sustainable Development in the Quang Ninh and Hai Phong Coastal Area", April 6-8, 1999, Ha Long City and Ha Noi, World Bank.
World Bank (1995). "Implementing GIS for Environmental Assessment ", Source book update, Environmental Department, the World Bank, April 1993, number 3.
World Bank (1993). "GIS for Environmental Assessment and Review", Source book update, Environmental Department, the World Bank, January 1995, number 9.
Go back the Table of Contents
Page 16 of 16

WWF Vietnam EXPERIENCE with the application of RS/GPS/GIS techniques, Results and Direction
Tran Minh Hien & Pham Hong Nguyen, WWF Indochina Programme
ABSTRACT
An important part of nature and biodiversity conservation work is good management and monitoring of both natural resources and surrounding humankind infrastructures and activities. Being aware that GIS/GPS/RS techniques could be the ideal support tools for achieving our organization’s goals - biodiversity conservation and development of buffer zone communities in remote areas of Vietnam where the biodiversity and conservation values are very high - we are trying to apply these new techniques to the best advantage.
The activities that have been carried out by WWF Indochina Programme include:
� Creating GIS data at different management levels. At national management level, we are building a system of biodiversity information management that include GIS and other relative data and we still seek for the advanced software for this purpose. These technologies are more encouraged to use at protected area level. Our target areas include those of the most famous protected areas of Vietnam such as Vu Quang Nature Reserve where Sao La, Pseudoryx nghetinhensis was discovered; Phong Nha NR where there is a vast unique limestone mountain, a cave system and the most abundant primate fauna in Vietnam; Cat Tien Nature Reserve where the last population of Vietnamese rhinoceros, Rhinoceros sondaicus is being protected; and Con Dao NP where the high value of marine biodiversity as well as island forest ecosystem are being conserved. For these areas, we have undertaken many different activities using GIS/GPS/RS techniques in the frame of our projects there. GIS products are used for our project documents, project proposals, management plans, and technical research. We aim to use our own GPS equipment and GIS products, but in case we cooperate with other professional organizations in surveys and researching target areas, the use of those techniques by themselves is encouraged and very welcomed.
� Building capacities of WWF office and Government counterparts so that these tools can be used for the conservation purposes. We bought the equipment such as computer, GPS and also soft wares. A number of GIS software have been installed in WWF Hanoi office and some project areas such as Vu Quang Nature Reserve and Phong Nha Nature Reserve. We are now using ArcView , ArcInfo, MapInfo.
Beside the improvement of equipment, we also organized the training courses on this technique for nature reserves’ staffs and WWF project teams who work in the field. For instance, a three day training in Phong Nha Nature Reserve was held in May 1999 in cooperation with Department of Science and Technology and Environment (DOSTE) and Forest Inventory and Planning Institute (FIPI) and hands-on experiences were being transferred to Vu Quang Nature Reserve’s staff during project time. Vu Quang project team members attended a hands-on training course on ArcView mapping software at the WWF office in Hanoi in 1998 conducted by GIS Research Associate from WWF-US. A GIS survey on status of application of Remote sensing and GIS in the field of biodiversity conservation was conducted the October 1998 by American Museum of Natural History (AMNH) and WWF then we succeeded to get funding from NASA to undertake a training course on using GIS techniques for conservation work in the near future. The trainees will be staff of conservation organizations such as management agencies, institutes, nature reserves, national parks country wide and WWF ourselves.
The training on using GPS is also required. In Vu Quang the staff of the reserve and project team were trained in 1998 on using the equipment with the help of a trainer from WWF Thailand. In Phong Nha, training for local participants of Bo Trach District, staff of the reserve, and WWF staff in using GPS equipment for primate monitoring was held in June 1999. This activity is now continued with the local trainees from Minh Hoa District and Forest Protection Department there. GPS equipment which is used by WWF at present, doesn’t work well under hard conditions such as dense forest canopy or rainy or cloudy weather, however, its advantages to our purposes are obvious.
As for Remote Sensing technique, Vu Quang Nature Reserve is an example, where satellite image Landsat TM was combined to produce landuse and vegetation maps of the reserve.
Page 1 of 4

Application of GPS/RS/GIS technologies is growing in WWF project sites.
What we have gained so far in this field is still limited. We are just taking first steps in a long way . For better results in the future we look forward to learning and cooperating from all of you.
TABLE 1 Some Activities of WWF Indochina using GIS/GPS/RS techniques
TABLE 2. Some results of training and using GIS/GPS/RS techniques by WWF Indochina
Name of Area Area (ha) Technique used
Usage Note
VU QUANG 56,000 ha GIS
GPS
RS
Base map of NR
Boundary demarcation, vegetation sample plots
Vegetation cover map &
Landuse map for the Nature Reserve
PHONG NHA 41,000 ha GIS
GPS
CRUM (Community Resources Use Mapping)
Primate monitoring,
NTFP survey
LINC project, June 1999
CAT TIEN 80,000 ha GPS Rhino survey Cat Tien Project 1999
CON DAO 60,000 ha GIS Project Document
Other GPS/GIS
GIS
Saola survey
Wildlife trade
Done by Thua Thien - Hue FPD May 98
WWF - Traffic
ADB 5712-REG
Coastal and Marine Environmental Management in the South China Sea
GIS Project document
Target Area Item of work Tool Result Time
VU QUANG Train on using GPS/ GIS
20 trainees/2 trainees
Nov. 97/1998
Page 2 of 4
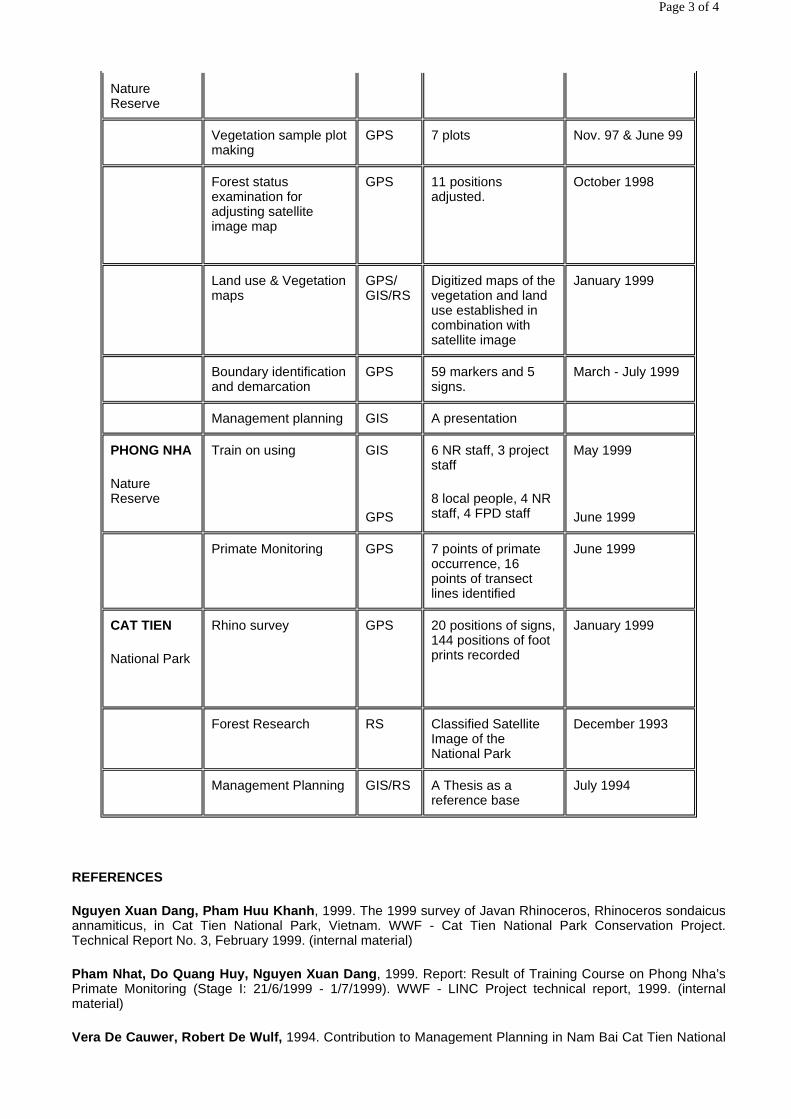
REFERENCES
Nguyen Xuan Dang, Pham Huu Khanh, 1999. The 1999 survey of Javan Rhinoceros, Rhinoceros sondaicus annamiticus, in Cat Tien National Park, Vietnam. WWF - Cat Tien National Park Conservation Project. Technical Report No. 3, February 1999. (internal material)
Pham Nhat, Do Quang Huy, Nguyen Xuan Dang, 1999. Report: Result of Training Course on Phong Nha’s Primate Monitoring (Stage I: 21/6/1999 - 1/7/1999). WWF - LINC Project technical report, 1999. (internal material)
Vera De Cauwer, Robert De Wulf, 1994. Contribution to Management Planning in Nam Bai Cat Tien National
Nature Reserve
Vegetation sample plot making
GPS 7 plots Nov. 97 & June 99
Forest status examination for adjusting satellite image map
GPS 11 positions adjusted.
October 1998
Land use & Vegetation maps
GPS/ GIS/RS
Digitized maps of the vegetation and land use established in combination with satellite image
January 1999
Boundary identification and demarcation
GPS 59 markers and 5 signs.
March - July 1999
Management planning GIS A presentation
PHONG NHA
Nature Reserve
Train on using GIS
GPS
6 NR staff, 3 project staff
8 local people, 4 NR staff, 4 FPD staff
May 1999
June 1999
Primate Monitoring GPS 7 points of primate occurrence, 16 points of transect lines identified
June 1999
CAT TIEN
National Park
Rhino survey GPS 20 positions of signs, 144 positions of foot prints recorded
January 1999
Forest Research RS Classified Satellite Image of the National Park
December 1993
Management Planning GIS/RS A Thesis as a reference base
July 1994
Page 3 of 4
Park, Vietnam, using Spatial Information Techniques. WWF International - Asia and Pacific Programme -VN0007, July 1994. (internal material)
Kris Vandekerkhove, Robert De Wulf, Nguyen Ngoc Chinh, 1993. Dendrology and Forest Structure of Nam Bai Cat Tien National Park, Vietnam, WWF International - Asia and Pacific Programme - VN0007, December 1993. (internal material)
Ajay Desai, Lic Vuthy, 1996. Status and distribution of Large Mammals in Eastern Cambodia. The Results of the first foot surveys in Mondulkiri and Rattanakiri provinces. A collaborative project between IUCN, FFI & WWF.
Forest Protection Department of Thua Thien - Hue Province, 1998. Report: Result of Field Survey on Sao La (Pseudoryx nghetinhensis) in Thua Thien - Hue province. A WWF-funded research, May 1998. (internal material)
Eric D. Wikramanayake, Vu Van Dung, Pham Mong Giao, 1997. A Biological and Socio-economic survey of west Quang Nam province with recommendation for a Nature Reserve, June 1997. A Cooperative work of UNDP, WWF, FIPI, FPD, and FPD of Quang Nam province funded by WWF-UNDP Project - RAS 93/102.
WWF Team of Vu Quang Project, 1999. Vu Quang Nature Reserve Conservation Project. Progress Report No 8 (October 1998 - March 1999). DGIS Activity No VN 003301 & WWF Project No VN0021, April 1999. (internal material)
WWF Team of Vu Quang Project, 1998. Vu Quang Nature Reserve Conservation Project. Progress Report No 7 (April 1998 - September 1998). DGIS Activity No VN 003301 & WWF Project No VN0021, October 1998. (internal material)
Center for Forestry Information Consultancies, 1997. Applying Geographical Information System in managing data and maps for National Parks. Hanoi 4-1997. (internal material)
Roland Eve, Tran Minh Hien, Pham Hong Nguyen, 1998. Vu Quang Nature Reserve - A Link in the Annamite Chain. Volume I: Presentation and Maps. (internal material)
Go back the Table of Contents
Page 4 of 4

The Need for Metadata for GIS Data Layers and Products
Stephen Leisz (Care/Vietnam)
ABSTRACT
This paper focuses on the need for metadata for products derived from geographic information systems (GIS). As GIS technology is increasingly integrated into Agriculture and Natural Resource projects and programs in southeast Asia, there is a growing need for products derived from these technologies to have metadata attached to them so that users can determine the quality of the products and the products’ appropriate uses. This is especially the case when the products are used as "scientific" support for proposed policy changes or interventions. It is also important that the conclusions drawn from the analysis used to create these products is not overstated. In other words product’s metadata should have information stating the limitations encountered in making the product and the limitations of interpretations that may be derived from the product. Without these caveats there is the danger that the products will be looked at uncritically as infallible "scientific" data, by users who do not understand the limitations of the different resource information technologies, and the products may be used to influence policies that they should not be applied to.
INTRODUCTION
The first class I had relating to Resource Information Technologies was a class at The University of Wisconsin – Madison called "Principles of Land Information Systems" taught by Professor Jim Clapp, a Civil Engineer who spent his life working with GIS, LIS, GPS, and Remote Sensing. On the first day of class Professor Clapp made two important points. First, he suggested that GIS’s and LIS’s are not new. Rather they have been around since the first cartographer drew a map and kept files related to the information found on the maps. Professor Clapp suggested that the only new aspect of a GIS or an LIS was the introduction of the computer and the increased speed with which the information that is mapped and attributed can be accessed and used. The second point was that even with the introduction of the computer, the system can still fail if the user does not understand the quality of the map product. Furthermore, with the GIS/LIS in digital form those failures can be on a scale not dreamed of previously.
To illustrate the second point, Professor Clapp told an anecdotal story about a large irrigation project that was being constructed in the State of Arizona in the U.S.A. The engineers working on the project had very carefully laid out their plans and referenced them to all the pertinent maps and data which were stored on an LIS. Construction had begun. Then one of them happened to check some of the data and realized that if they continued as the work had been specified the project would be built so that the water would flow in the opposite direction from the desired flow direction. Why? Because even though the maps that had been digitized and put into the LIS the project was using were in the same UTM coordinate system, they were based on two different datums. At that time in the U.S.A. a new datum, NAD83 was being adopted to replace NAD27 and some of the maps put into the LIS were based on NAD83, while others were based on NAD27. No one had caught the mistake earlier, because the data’s metadata was not properly recorded.
Since that day I’ve tried to be aware of errors that can be caused by reliance on maps that are of poor quality or do not have the proper metadata, so that use of the maps is made more difficult. As I’ve been aware of this I’ve recognized some tragedies that have occurred because of these types of errors. Examples that I’ve catalogued include: the recent shooting of an Indonesian border guard by International troops near the East Timor (some reports indicate that the two sides may have misinterpreted where the border was because of poor quality or contradictory maps); the death of a New York City construction worker in 1995 who was digging up a sewer line, his map located a gas line a few meters from where it really was and when he hit it he was incinerated; and countless border conflicts caused by people’s land boundaries being either mis-mapped or misrepresented on maps.
These examples, and Professor Clapp’s dictum, suggest that in this day of the computerized GIS there is still a need for basic quality control in how maps are made and attribute data recorded. Furthermore, given the ease with which digital map data is combined to form new information products, there is an even greater need
Page 1 of 5
for accurate metadata being attached to each of the digital layers and attached to the "new information product" so that users understand the limitations of the product, i.e. of the computer generated map, they are using.
Metadata and Quality Control within a GIS
There are two aspects of the data within a GIS that need to be "quality controlled" and have metadata attached to them. The first is the actual data put into the GIS (the individual map and attribute layers) and the second is the information products that are made by carrying out spatial analysis on the GIS map and attribute layers.
Data Input into GIS
One reason why the types of errors that are mentioned above happen is that, although paper maps have always been looked at as authoritative renderings of "reality," people who use and consult digital data often implicitly expect it to be of higher quality than conventional map data. The reason for this is that there seems to be an inherent belief that if something is in a computer it is superior, due to a certain technological advantage, over earlier, paper maps (Bernhardsen 1992). It is because of this belief that producers of digital data, and those who "use" this digital data, have to pay extra attention to documenting the lineage of the data, e.g. publishing metadata for the data within a GIS.
A traditional way of thinking about quality in mapping is to suggest that it has several properties, which include positional accuracy, attribute accuracy, logical consistency, and completeness (Schmidley 1997). Positional accuracy refers to how closely a feature’s position on a map represents its position on the earth’s surface. For example, the U.S. national map accuracy standard states that not more than 10% of well-defined points tested shall be in error by more than 1/30th of an inch (0.85 mm) measured on the publication scale map for maps larger than 1:20000 scale, and for maps with a scale smaller than 1:20000, the measurable error is 1/50th of an inch [0.51 mm] (USGS). Attribute accuracy refers to how accurate the descriptive information that is associated with the map is. Logical consistency refers to whether the position of the geographic data represented on the map makes sense (e.g. rivers are in the correct location and do not appear to flow uphill). Completeness refers to whether the map actually contains all the features that it should. This last is often defined by the type of map it is (e.g. a land-cover map can be complete, yet not have soil information for the area that it covers). Many of these measures of map quality reflect the methods used to collect data for inclusion in the map and the care with which the map was made.
GIS Products
The conception of map quality described above is appropriate for hard-copy paper maps, since those maps are tied to the scale at which they are made. However, when one moves the data into a GIS the concept of quality needs to change. In a GIS metadata needs to be attached to each layer in order to help ensure the quality of the products that may be produced using the stored information. This is the case as users need to know about each layer so they can choose the correct layers for the analysis that they wish to do and for the products they wish to produce.
In a GIS, maps are stored in digital form. Therefore, their display scale can change. However, the accuracy of the maps does not change, as scale restricts type, quantity and quality of data (Star and Estes 1990). Therefore, when using data to analyze a problem, it is necessary to match the appropriate scale to the level of detail of the problem being investigated or the project being carried out (Burrough 1996). Enlarging a small-scale map does not increase its level of accuracy and using this enlarged map for analytical purposes may lead to misanalysis and false results.
This last point touches on the fact that within a GIS maps are usually used in conjunction with other maps (e.g. they are represented as layers of data that can be overlain, intersected, buffered, etc.). Each of the layers comes with error attached to it. Because of this there is the danger of cascading error and propagation of error through the GIS analytical process. Any new layers created from the original layers will have all the errors from the previous layers within it (propagated error) and possibly these errors will be compounded in the final product (cascading error). Due to these errors, solutions derived to a GIS problem may be inaccurate, imprecise or erroneous. This raises the point that inaccuracies, imprecision and error may be compounded within a GIS that employs many data sources (Foote and Huebner 1995). Furthermore, a new form of error, the spurious polygon, may enter into the data product (Burrough 1996).
In a GIS analysis, error can only be guarded against, or minimized, and quality of the product controlled, if
Page 2 of 5
each data layer is documented with information about it (e.g. its source, accuracy, the methods used to collect the data in it, etc.). This information allows the user to make informed decisions regarding what data they should use within their analysis in order to get the best quality results at the scale they need. Such information, or metadata, may include: map source, its original scale, methods used to gather the data, the accuracy standards it meets, its projection, datum, ellipsoid, etc. Thus, for quality control within a GIS, it is necessary not only to know the accuracy of the individual data layers, but also to make sure that the layers are used for analysis in a fashion that produces accurate results (Foote and Huebner 1995).
METADATA IN VIETNAM AND QUALITY CONTROL OF GIS PRODUCTS
Data within GIS
With these issues in mind, what is the current situation in Vietnam? Geographic data in hard copy and digital form comes in variable quality. In hard-copy form, the largest scale topographic maps that are available for the whole country are at a scale of 1:50000 (Christ and Kloss 1998). It is hard to assess the quality of the data represented in these map sheets, because methods used to collect the data are not readily known and the presence of metadata for the maps vary in quality from sheet to sheet. On some of the map sheets metadata is present, but there is no display of estimated map accuracy. On others, there is nothing other than the title of the map sheet. In the latter case, if the user wishes to integrate the map sheets into a GIS for use with other data, they must make a best guess regarding the map’s metadata. At the least, this means determining the projection of the map (there are at least two, UTM or Gauss) and the datum the map is based on (at last count I could determine four datums used at different times in Vietnam: Indian 1960, Pulkovo 1942[?], Hanoi 1972, and WGS 1984).
For digital data, the situation is the same. Almost all the digital data in Vietnam originates from the aforementioned maps or comes from analysis of satellite imagery (in the case of vegetation and land use maps). In almost all cases complete metadata is not distributed with the data and no estimates of the accuracy of the data are done. For digital topographic maps, this means that the lineage of the map is unknown and that there is no estimate of positional accuracy. For thematic maps derived from satellite imagery, this means that there are no accuracy assessments provided of the analysis that has been done (vegetation cover, land-use patterns, etc.). Another shortcoming to the digital data is that in the cases I have examined there are digitizing errors (undershoots, overshoots, erroneous nodes, etc.) that add another dimension to the error already found within the original hard-copy maps.
Data Products
Products derived from these data layers also often do not have metadata. Therefore, it is difficult to estimate the accuracy of the products and also difficult to place a confidence factor on the use of these products. Another result is that often the results of GIS analysis are used at a scale for which they were not intended and inappropriately applied to policy questions. This misapplication is carried out equally by international organizations and by national organizations and is not a phenomenon unique to Vietnam.
While international organizations do not produce large-scale topographic maps of Vietnam, they often do produce interpretations of satellite imagery (such as SPOT and Landsat) for estimating vegetation coverage and land-cover change and this analysis of geographic data has the capacity to influence project design and government policies. In these areas international organizations often have not done a very good job of providing accuracy assessments of their work, and in some cases, they have not done a good job of providing metadata.
In most cases, image interpretations are at small-scale and use either unsupervised classification techniques, or interpretations of NDVI as surrogates for different types of land-cover, in their vegetation or land-cover analysis (see, for example the Pathfinder project www.bsrsi.msu.edu). These methods and the fact that international groups usually do not have ground data to work with, make it hard for them to provide accuracy assessments of their results. This provides the rationale for their products lacking complete metadata. To further complicate matters, some organizations and researchers have used these derived products to analyze phenomena at scales which are inappropriate given the data sets. Fox et al. (1999) give an explanation of how this happens with regards to land-cover in Southeast Asia. First, it is noted that most of the land-cover analysis done using satellite imagery for the area classify around 30% of the land-cover as an "other" or "shrub" class. This is done because the researchers doing the classification do not necessarily understand the landscape dynamics and farming systems in use and the scale of the classification (1:250000) is to small to permit an analysis of the mosaic of land-cover types found within this class. Other researchers then use this
Page 3 of 5
data and analyze it at a larger scale to suggest that large amounts of deforestation are taking place, an argument that might not be supported if the land-cover were analyzed at a scale appropriate to the scale of the data or if a land-cover analysis that captured the dynamics of the landscape at large scale were done.
Another example is found by examining a presentation on forest cover change given at a workshop in Vinh in 1998. This presentation used small scale land-cover data derived from the Pathfinder project. Pathfinder separates land-cover into four classes: forest, non-forest, water and cloud. Using this data Brunner and Nielsen (1998) suggested that the fallow system in the Ca River area is a 1-2 year cycle. However, field studies in the area suggest that this is not the case. Rather, field sizes are probably too small to be adequately analyzed using 1:250000 data derived from Landsat images and the land-cover is in a mosaic that is much more complicated than forest and non-forest. What may have been seen by the analysis is a cycle that has swidden rice for one-year, maize for one-year, then a longer-term cover of cassava. Since cassava provides a full ground cover after a few months, analysis of the type used by Pathfinder would classify the cassava areas as "forest." After two to five years of growing, the cassava is harvested and the Pathfinder analysis would interpret it as "non-forest" again, thus providing the estimate of 1-2 years of fallow.
These two examples show how data products can be derived inappropriately from the analysis of data within a GIS and in both cases, the products could be entered back into a GIS. If this is the case, then, unless the process by which the analysis is done and the products are made is appropriately documented, there is a danger that the products could be unquestionably used in policy making decisions.
Why does this matter?
A very basic reason why the inclusion of metadata within a GIS matters is that maps, and the GIS itself, are supposed to be used, they are not end results of a project, rather they are tools that are supposed to be used after the project implementing them has ended. The systems that are set up are supposed to be used for planning and managing a multitude of projects ranging from economic development projects to environmental projects. If there are questions regarding the quality of the data that can not be resolved because metadata is not present, then either questionable quality maps will be used or new maps will need to be made each time a new project is started. In either case, the money spent collecting and inputting the original data and building the GIS will have been wasted. Thus, the inclusion of metadata within a GIS becomes an economic consideration.
Burrough (1996) gives a second reason. He suggests that, "it is implicit in the whole business of geographical resource information processing that the collection and processing of environmental data leads to improvements in environmental management and control. This can only be so if the data that are collected, entered, stored, and processed are sufficiently reliable and error-free for the purposes for which they are required." If the data and data products are not error free or do not have metadata attached to them to inform the user about their relative degree of error, scale, etc., there is the danger that the data and products will be applied to problems for which they are poorly suited. This can lead to poor analysis being done, inappropriate solutions being proposed, and poor management decisions being made.
A third reason is that products from a GIS can be, and are, used to influence policy decisions. If the GIS products have errors in them, the resulting policies may be flawed. Also, if the product’s limitations are not explained in attached metadata, the analysis may be misapplied, also resulting in flawed policy decisions. Flawed policy decisions have the potential to cause a large amount of harm and waste large amounts of money.
DISCUSSION AND SUGGESTIONS
This paper is an attempt to move the discussion of quality control beyond the data that goes into a GIS and towards the question of how to understand the quality of the products derived from the analysis of data within a GIS. It appears that a fundamental aspect to solving this problem is the inclusion of metadata for each layer of data within the GIS and also for the analytical products produced using the GIS. The centrality of metadata to quality control reflects a change in the concept of quality control for geographic data. This shift in the way of thinking about map quality reflects what Cartwright (1993) suggests with regards to spreading GIS technology into developing countries. He suggests that users have to internalize newly acquired technical knowledge to the point where it begins to shape their conception of their job and how to do it. In this new view, maps are no longer the central concept, rather the GIS database is the central concept and information products are spun off as maps or as analysis of data to fit special needs. In either case, if the products are going to be useful, then attaching metadata to the data that goes into a GIS and to the analysis and products produced from it is
Page 4 of 5
central to the GIS function. Otherwise the result could reflect the famous computer dictum: GIGO – garbage in, garbage out, and nobody would know the difference.
Given that metadata should be an integral part of all GIS data and products produced in Vietnam, how can the geographic information users start to address this need? Following are three suggested steps:
Publicize current map accuracy and quality standards already in place and encourage their use for any mapping projects undertaken.
Agree to metadata standards for GIS information (both for digitized vector maps and for land-cover / land-use products derived from remotely sensed information)
Develop and use metadata forms and require that the metadata is distributed with data when it is transferred from one user to the next (including international groups who produce geographic information and analytical products for use in Vietnam)
In order to encourage the adoption of these types of practices, other groups of geographic information users in areas where I have worked have formed users groups whose main task is to encourage the recording and distribution of metadata for geographical data and analytical products derived from GIS. This could also be done within the context of Vietnam and would start the geographic data user community on the road towards increasing the quality of geographic data used throughout the country
REFERENCES
Bernhardsen, T. Geographic Information Systems. 1992. VIAK IT. Arendal, Norway.
Brunner, J. and Nielsen, D. 1998. "Ca River Basin Forest Cover Analysis: Preliminary Results." World Resources Institute.
Burrough, P.A. Principles of Geographic Information Systems for Land Resources Assessment. 1996. Oxford University Press. New York.
Cartwright, T. "Geographic Information Technology as Appropriate Technology for Development," in Diffusion and use of Geographic Information Technology. 1993. Klumer Academic Publishers. Boston.
Christ, H. and Kloss, D. 1998. "Land Use Planning & Land Allocation in Vietnam with Particular Reference to Improvement of its Process in the Social Forestry Development Project Song Da (SFDP)." Consultancy Report No. 16. April/May 1998. ADB Forestry Sector Project. Hanoi, Vietnam.
Foote, K. and Huebner, D. 1995. "The Geographer’s Craft Project, Department of Geography, University of Texas at Austin."
Fox, J., Dao Minh Truong, Rambo, A. T., Nghiem Phuong Tuyen, Le Trong Cuc, and Leisz, S. 1999 (in press). Shifting Cultivation without Deforestation: A Case Study in the Mountains of Northwestern Vietnam.
Schmidley, R. "Quality Control in Mapping: Some Fundamental Concepts." Surveying and Land Information Systems. Vol. 57, No. 1, 1997, pages 31 –36.
Star, J. and Estes, J. 1990. Geographic Information Systems: an Introduction. Prentice Hall. Englewood Cliff
Go back the Table of Contents
Page 5 of 5
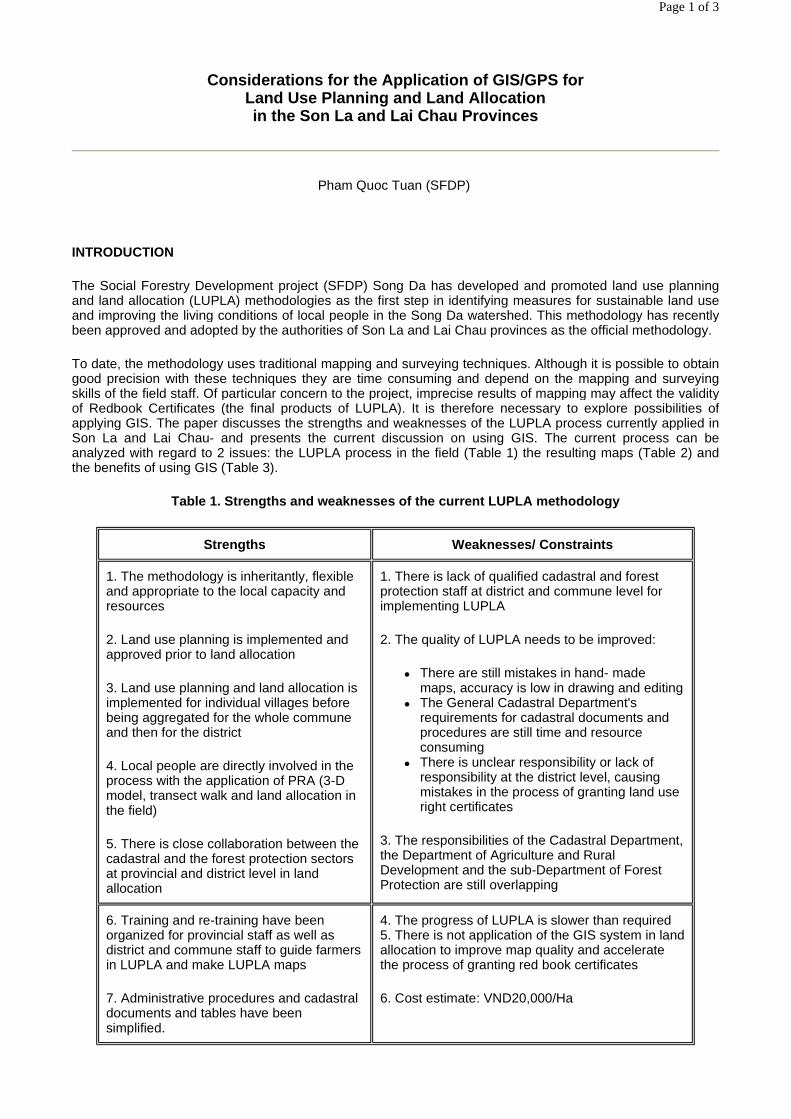
Considerations for the Application of GIS/GPS for Land Use Planning and Land Allocation in the Son La and Lai Chau Provinces
Pham Quoc Tuan (SFDP)
INTRODUCTION
The Social Forestry Development project (SFDP) Song Da has developed and promoted land use planning and land allocation (LUPLA) methodologies as the first step in identifying measures for sustainable land use and improving the living conditions of local people in the Song Da watershed. This methodology has recently been approved and adopted by the authorities of Son La and Lai Chau provinces as the official methodology.
To date, the methodology uses traditional mapping and surveying techniques. Although it is possible to obtain good precision with these techniques they are time consuming and depend on the mapping and surveying skills of the field staff. Of particular concern to the project, imprecise results of mapping may affect the validity of Redbook Certificates (the final products of LUPLA). It is therefore necessary to explore possibilities of applying GIS. The paper discusses the strengths and weaknesses of the LUPLA process currently applied in Son La and Lai Chau- and presents the current discussion on using GIS. The current process can be analyzed with regard to 2 issues: the LUPLA process in the field (Table 1) the resulting maps (Table 2) and the benefits of using GIS (Table 3).
Table 1. Strengths and weaknesses of the current LUPLA methodology
Strengths Weaknesses/ Constraints
1. The methodology is inheritantly, flexible and appropriate to the local capacity and resources
2. Land use planning is implemented and approved prior to land allocation
3. Land use planning and land allocation is implemented for individual villages before being aggregated for the whole commune and then for the district
4. Local people are directly involved in the process with the application of PRA (3-D model, transect walk and land allocation in the field)
5. There is close collaboration between the cadastral and the forest protection sectors at provincial and district level in land allocation
1. There is lack of qualified cadastral and forest protection staff at district and commune level for implementing LUPLA
2. The quality of LUPLA needs to be improved:
� There are still mistakes in hand- made maps, accuracy is low in drawing and editing
� The General Cadastral Department's requirements for cadastral documents and procedures are still time and resource consuming
� There is unclear responsibility or lack of responsibility at the district level, causing mistakes in the process of granting land use right certificates
3. The responsibilities of the Cadastral Department, the Department of Agriculture and Rural Development and the sub-Department of Forest Protection are still overlapping
6. Training and re-training have been organized for provincial staff as well as district and commune staff to guide farmers in LUPLA and make LUPLA maps
7. Administrative procedures and cadastral documents and tables have been simplified.
4. The progress of LUPLA is slower than required 5. There is not application of the GIS system in land allocation to improve map quality and accelerate the process of granting red book certificates
6. Cost estimate: VND20,000/Ha
Page 1 of 3
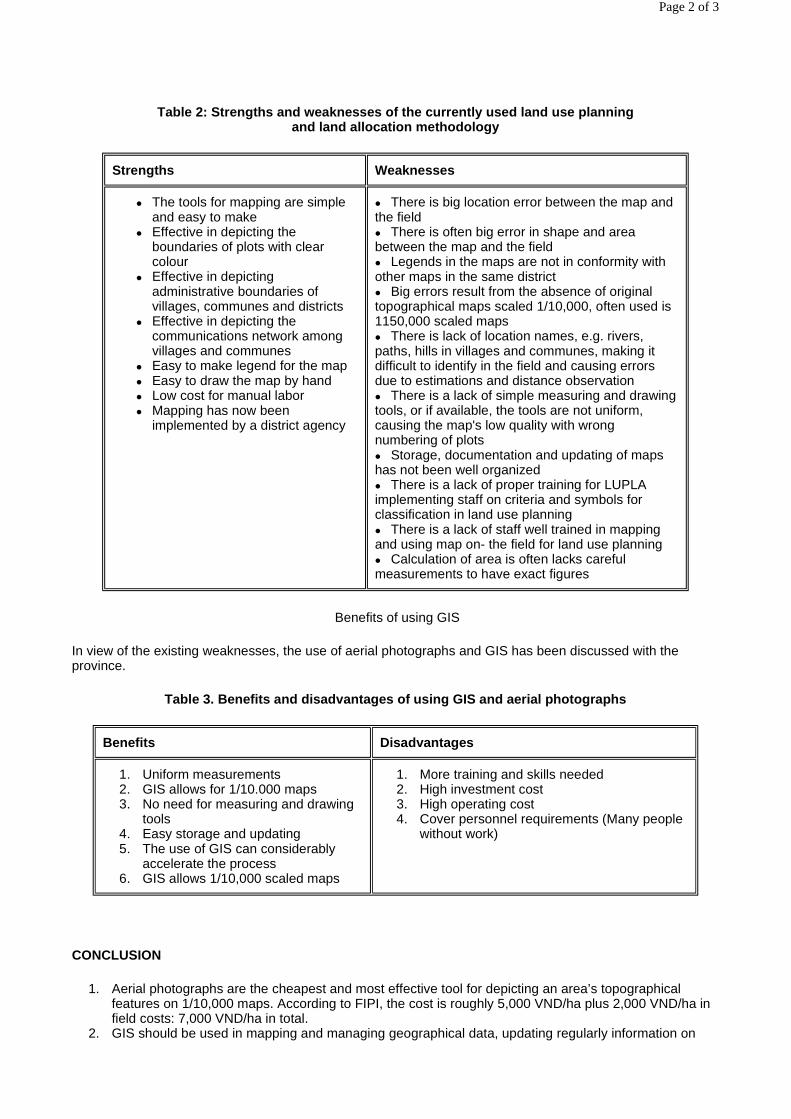
Table 2: Strengths and weaknesses of the currently used land use planning and land allocation methodology
Benefits of using GIS
In view of the existing weaknesses, the use of aerial photographs and GIS has been discussed with the province.
Table 3. Benefits and disadvantages of using GIS and aerial photographs
CONCLUSION
1. Aerial photographs are the cheapest and most effective tool for depicting an area’s topographical features on 1/10,000 maps. According to FIPI, the cost is roughly 5,000 VND/ha plus 2,000 VND/ha in field costs: 7,000 VND/ha in total.
2. GIS should be used in mapping and managing geographical data, updating regularly information on
Strengths Weaknesses
� The tools for mapping are simple and easy to make
� Effective in depicting the boundaries of plots with clear colour
� Effective in depicting administrative boundaries of villages, communes and districts
� Effective in depicting the communications network among villages and communes
� Easy to make legend for the map � Easy to draw the map by hand � Low cost for manual labor � Mapping has now been
implemented by a district agency
� There is big location error between the map and the field � There is often big error in shape and area between the map and the field � Legends in the maps are not in conformity with other maps in the same district � Big errors result from the absence of original topographical maps scaled 1/10,000, often used is 1150,000 scaled maps � There is lack of location names, e.g. rivers, paths, hills in villages and communes, making it difficult to identify in the field and causing errors due to estimations and distance observation � There is a lack of simple measuring and drawing tools, or if available, the tools are not uniform, causing the map's low quality with wrong numbering of plots � Storage, documentation and updating of maps has not been well organized � There is a lack of proper training for LUPLA implementing staff on criteria and symbols for classification in land use planning � There is a lack of staff well trained in mapping and using map on- the field for land use planning � Calculation of area is often lacks careful measurements to have exact figures
Benefits Disadvantages
1. Uniform measurements 2. GIS allows for 1/10.000 maps 3. No need for measuring and drawing
tools 4. Easy storage and updating 5. The use of GIS can considerably
accelerate the process 6. GIS allows 1/10,000 scaled maps
1. More training and skills needed 2. High investment cost 3. High operating cost 4. Cover personnel requirements (Many people
without work)
Page 2 of 3

LUPLA and forest status. With this system, there is no need to redraw maps by hand, thereby minimizing associated labor costs and office work, saving both cost and time. In SFDP's experience, 40% of the time for LUPLA is spent on mapping and office work. So the use of GIS can help to considerably accelerate the process.
3. Regardless of methodology, however, in-the-field training of local cadres in LUPLA is essential. Only by building capacity among district and commune cadastral and forest protection staff, can the process, especially the application of red book certificates, be accelerated. Therefore, with or without GIS, more training is needed.
4. In view of the strengths and weaknesses of applying GIS, the provinces of Son La and Lai Chau have come to the conclusion not to use GIS at the moment. The main reasons for this decision are lacking of high investment cost and quality staff,
5. In the near future, although the application of GIS has clear advantages, investment will almost be concentrated in densely populated areas. In remote areas, such as the Northern Mountains, the "second best" option may well be the best first alternative, focusing on upgrading existing personnel resources before taking the step in the direction of a GIS.
Go back the Table of Contents
Page 3 of 3

Potential of IRS-1 Panchromatic Satellite Image Data for Village-level Land Use Planning: An Example from
the Forestry Sector Project in Vietnam
Vu Anh Tuan (VTGEO), Herbert Christ (ADB2852), Günther Mayer (ADB2852), Nguyen Tien Cong (VTGEO), Tran Quoc Cuong (VTGEO), Luu Van Nang (ADB2852)
ABSTRACT
In land use planning, mapping the current land use or land cover situation is an indispensable tool for determining the status quo and for identifying land use trends. Land use maps provide the basis for legal documents and create an entry point for discussions with local land users and stakeholders on improving land management practices in order to achieve sustainability. Unfortunately, land use is notorious for changing rapidly and existing maps are quickly outdated. In many cases, land use planners have to prepare new land use maps or update existing ones before actual planning can start. Using remote sensing data sources like Landsat TM and SPOT data have long been established as an effective means to prepare land use maps at scales ranging from 1:100.000 to 1:50.000. These data sources are however not suitable for the preparation of village-level maps, requiring scales of 1:25.000 to 1:10.000.
This paper illustrates the potential of the Indian panchromatic IRS-1 satellite data with a spatial resolution of 5.8 m for the purpose of large scale village-level land use planning. The technical approach applied consisted of using geometrically corrected IRS-1 image data acquired for a test area in Thanh Hoa Province. The data were enlarged and printed at a suitable scale (1:12.500), using a high quality color printer and photo quality paper. Printed satellite image maps were taken to the field and present land use/cover was mapped on transparent overlays using a simplified land use classification. The field maps were later digitized and converted into a GIS dataset.
INTRODUCTION
In many areas in southeast Asia, large-scale topographic maps and aerial photography are not available or are too old and outdated to be considered useful for the mapping of present land use. Mapping based exclusively on field surveys, on the other hand, is very time consuming and error-prone without the use of adequate base maps .
In the Forestry Sector Project in Vietnam, village-level land use maps have to be prepared at scales ranging from 1:25.000 to 1:10.000 for project areas comprising approximately 600.000 ha, located in 53 communes in four provinces. Neither Landsat TM with a spatial resolution of 30m nor SPOT Panchromatic data (10m) can be used to produce acceptable maps at these scales.
The key question facing the project team therefore was: how can village-level land use maps be prepared in large numbers (approx. 500 villages), within a reasonably short time period and at acceptable levels of accuracy and cost. The use of the recently available, high-resolution, Indian IRS-1 satellite data with a spatial resolution of 5.8 m was considered an option worth while investigating.
IRS-1 VS. LANDSAT TM AND SPOT
Satellite image data such as Landsat TM or SPOT XS have valuable characteristics due to their multi-spectral characteristics (7 bands with TM and 4 bands with SPOT), which can be used to provide a lot of quantitative information on land use and vegetation cover. On the other hand, the spatial resolution of these sensors is limited to 30m with Landsat TM and 20m with SPOT XS) which restricts their use for large scale mapping. Panchromatic (black and white) SPOT imagery has a spatial resolution of 10m, but the IRS-1 panchromatic sensor provides even higher resolution at 5.8 m (Table 1).
The higher spatial resolution of the panchromatic data permits users to distinguish details like road networks, irrigation channels and field boundaries and even individual buildings or fish ponds. The monospectral character of the data, however, restricts the possibilities to distinguish different vegetation types directly on the image. Using panchromatic image data therefore requires extensive ground surveys to determine different land use and
Page 1 of 8

vegetation cover classes (Figure 1).
In terms of spatial resolution, aerial photograph can prove to be better map data sources than commercial optical satellites. However, availability and access to recent aerial photographs is often limited and new aerial surveys are time consuming, costly and difficult to arrange. Another disadvantage is the limited area coverage of individual aerial photographs. While satellite image scenes cover more than 60 x 60 km, an aerial photograph at a scale of 1:25.000 covers an area of only 5 x 5 km. Thus, large area coverage need to be mosaicked from geometrically corrected and mosaicked aerial photographs, a task far more time consuming than correcting a single satellite image scene (Figure 2).
Table 1: Characteristics of Satellite Image Data Sources for Land Cover Mapping
Table 2: Cost Comparison for Satellite Image Data Sources
Note: Older imagery and multi-temporal data can often be obtained at discounted rates.
METHODOLOGY
The technical approach chosen combined a number of computer-assisted tasks with field surveys to determine the current land cover in one commune in Thanh Hoa Province. Raw IRS-1C image data were obtained and geometrically corrected using topographic map references and, at a later point, differential GPS data collected in the field. The Satellite image data were enlarged and set in a map layout at a suitable scale (1:12.500 and 1:25.000) and size (A2, 60 x 40 cm). Printing was done on photo quality paper using a high quality color inkjet printer with a resolution of 1440 x 720 dpi. Printed satellite image maps were mounted on thin plywood boards and taken to the field for present land use/cover mapping on transparent overlays. Draft maps produced in the field were finalized on location and digitized upon return to the office. Commune and village boundaries, roads, rivers and land cover classes were then converted into a GIS database.
Image manipulation and SIM preparation included the following tasks:
� Geometric correction GCPs were collected on the topographic maps. Verification of reference points with DGPS showed that better corrections can be obtained using DGPS.
� Mosaic
Landsat 4,5 TM
SPOT XS SPOT P IRS- 1C/D
Start of Operation 1982 1986 1986 1995
Period of Revisit 16 days 26 days 26 days 24 days
Spectral channels 7 3 1 1
Pixel size (m) 30 x 30 20 x 20 10 x 10 5.8 x 5.8
Data quantity per km2 (KB) 8,6 7,5 10 30
Scene dimension (km) 180 x 180 60 x 60 60 x 60 70 x 70
Scene coverage (km2) 32.000 3.600 3.600 4.900
Recommended Map Scales 1:250.000 to 1:100.000
1 :250.000 to 1:75.000
1 :100.000 to 1 :25.000
1 :100.000 to 1 :10.000
Landsat 4,5 TM
SPOT XS SPOT P IRS- 1C/D
Scene dimension (km) 180 x 180 60 x 60 60 x 60 70 x 70
Scene coverage (km2) 32.000 3.600 3.600 4.900
Data cost per scene (US-$) 4.400 1.870 2.090 2.500
Data cost per 100 km2 (US-$) 0.14 0.52 0.58 0.51
Page 2 of 8
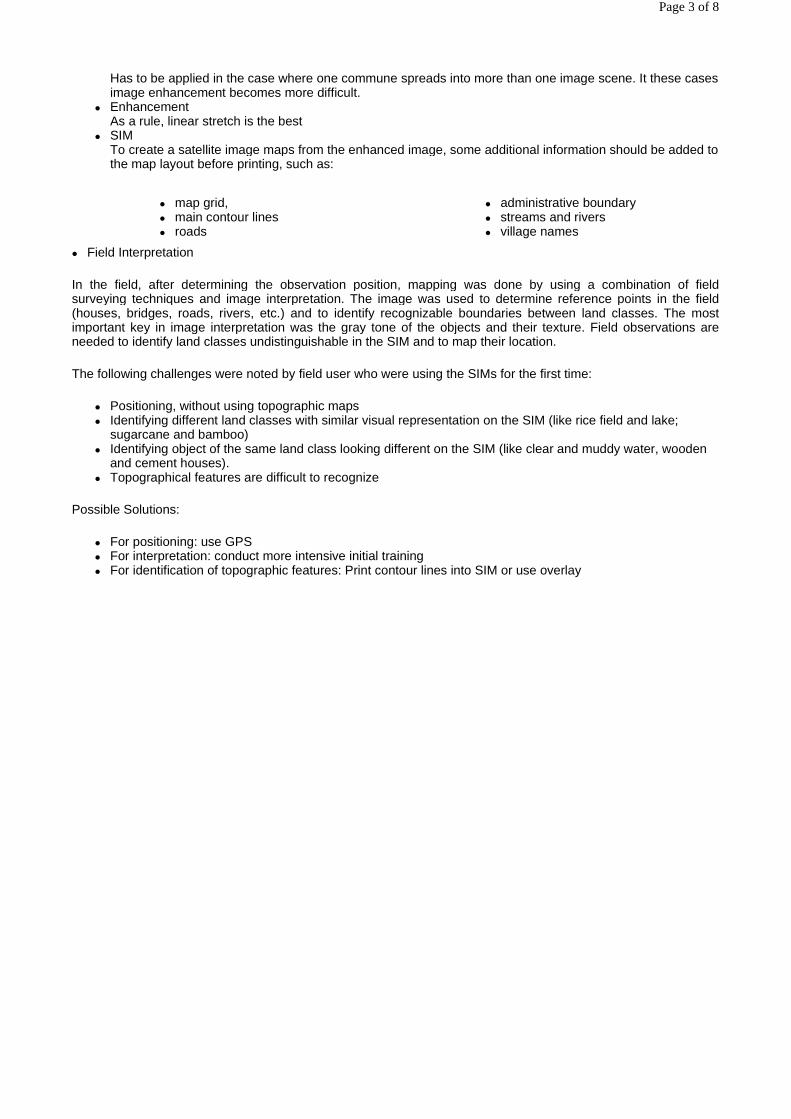
Has to be applied in the case where one commune spreads into more than one image scene. It these cases image enhancement becomes more difficult.
� Enhancement As a rule, linear stretch is the best
� SIM To create a satellite image maps from the enhanced image, some additional information should be added to the map layout before printing, such as:
� Field Interpretation
In the field, after determining the observation position, mapping was done by using a combination of field surveying techniques and image interpretation. The image was used to determine reference points in the field (houses, bridges, roads, rivers, etc.) and to identify recognizable boundaries between land classes. The most important key in image interpretation was the gray tone of the objects and their texture. Field observations are needed to identify land classes undistinguishable in the SIM and to map their location.
The following challenges were noted by field user who were using the SIMs for the first time:
� Positioning, without using topographic maps � Identifying different land classes with similar visual representation on the SIM (like rice field and lake;
sugarcane and bamboo) � Identifying object of the same land class looking different on the SIM (like clear and muddy water, wooden
and cement houses). � Topographical features are difficult to recognize
Possible Solutions:
� For positioning: use GPS � For interpretation: conduct more intensive initial training � For identification of topographic features: Print contour lines into SIM or use overlay
� map grid, � main contour lines � roads
� administrative boundary � streams and rivers � village names
Page 3 of 8

Figure 3: Flow chart of work methodology
RESULT AND DISCUSSION
As result of the methodology applied, a detailed land cover map of the commune and villages of Xuan Cao was produced and area totals per land class and village were calculated. In addition, the SIM can be used as base maps for other project activities, like infrastructure planning, site matching for forestry activities etc. The field work needed to map present land cover and demarcate village boundaries amounted to approximately one week, implying two field teams and some additional time requirements for explanations and limited initial training.
At present, we do not feel confident to make a judgment about the time requirements for this type of land cover mapping in comparison with traditional mapping methods practiced in Vietnam using (enlarged) topographic maps. Most people involved, however, were convinced that the mapping accuracy was considerably better using the SIMs. We will conduct further studies to come to a clearer understanding of the time required for both methods and the quality that can be achieved respectively.
The question that remains to be answered is the cost involved in preparing and using SIM maps. The cost of using SIMs depends to a large extent on the size of the area to be mapped within a satellite image scene. Provided that approx. 50% of a full scene are used, the cost data cost will not exceed one US dollar per km², or one cent per ha at 10% use the cost is 0.1 US-$ per ha. Additional cost for data processing and map printing depend to a large extent on the level of in-house data processing and manipulation possible versus the amount of services that would need to be contracted out. Total data processing and SIM preparation can be estimated to cost roughly the same as raw satellite data. For the purpose of orientation, one can estimate costs at approximately two US dollars per km² for using 50% of a satellite scene.
Page 4 of 8

CONCLUSION AND RECOMMENDATIONS
IRS 1-C data can be applied successfully for village-level land use planning at scales ranging from 1:10,000 to 1:25.000, due to their high spatial resolution. However, land cover mapping with IRS1-C SIMs requires extensive field surveys and cannot be understood as an image-based interpretation. The SIM provide a highly accurate base map which can be used to identify important features like roads, rivers, building and field boundaries. The land units identified on the image provide a reference system for the field work and can prove a cost-efficient option that yields accurate map results.
Using IRS-1C data successfully for field mapping of village land use and vegetation cover would yield better results if field staff are trained to understand the specific characteristics of the panchromatic image data and have access to additional data sources from GPS and topographic maps to facilitate field orientation.
Figure 1. Comparison of IRS-1 with Landsat TM
a c
Page 5 of 8
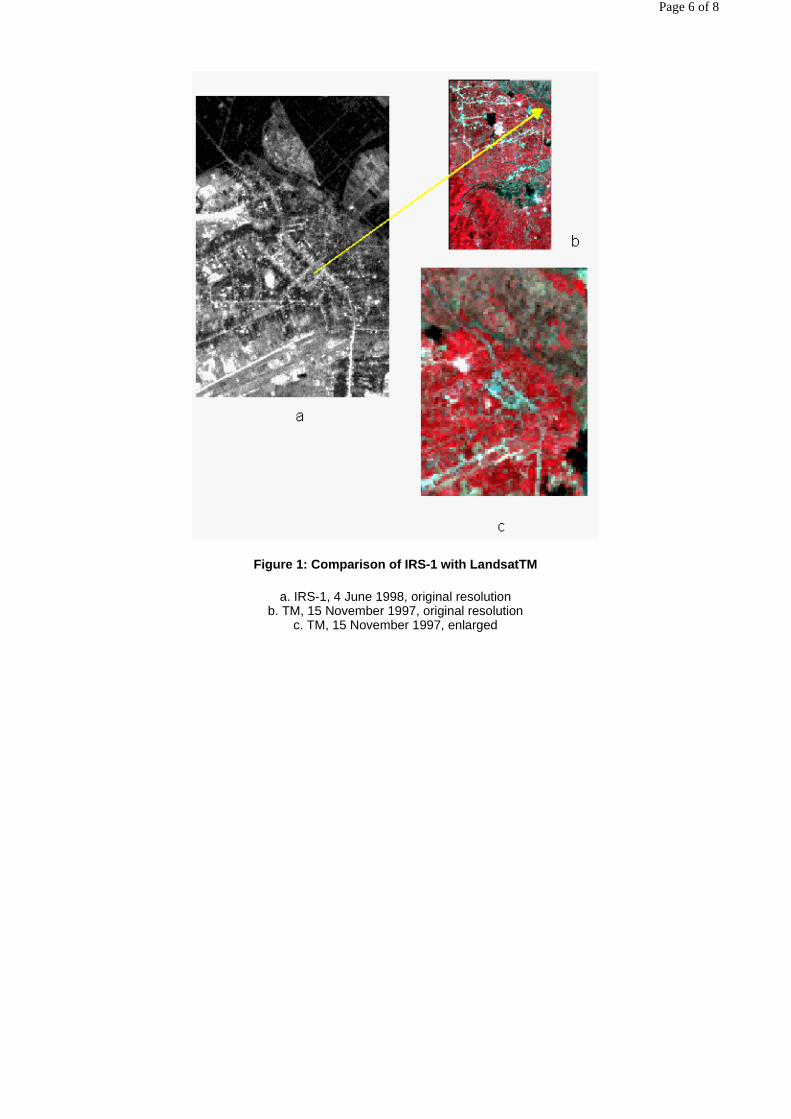
Figure 1: Comparison of IRS-1 with LandsatTM
a. IRS-1, 4 June 1998, original resolution b. TM, 15 November 1997, original resolution
c. TM, 15 November 1997, enlarged
Page 6 of 8
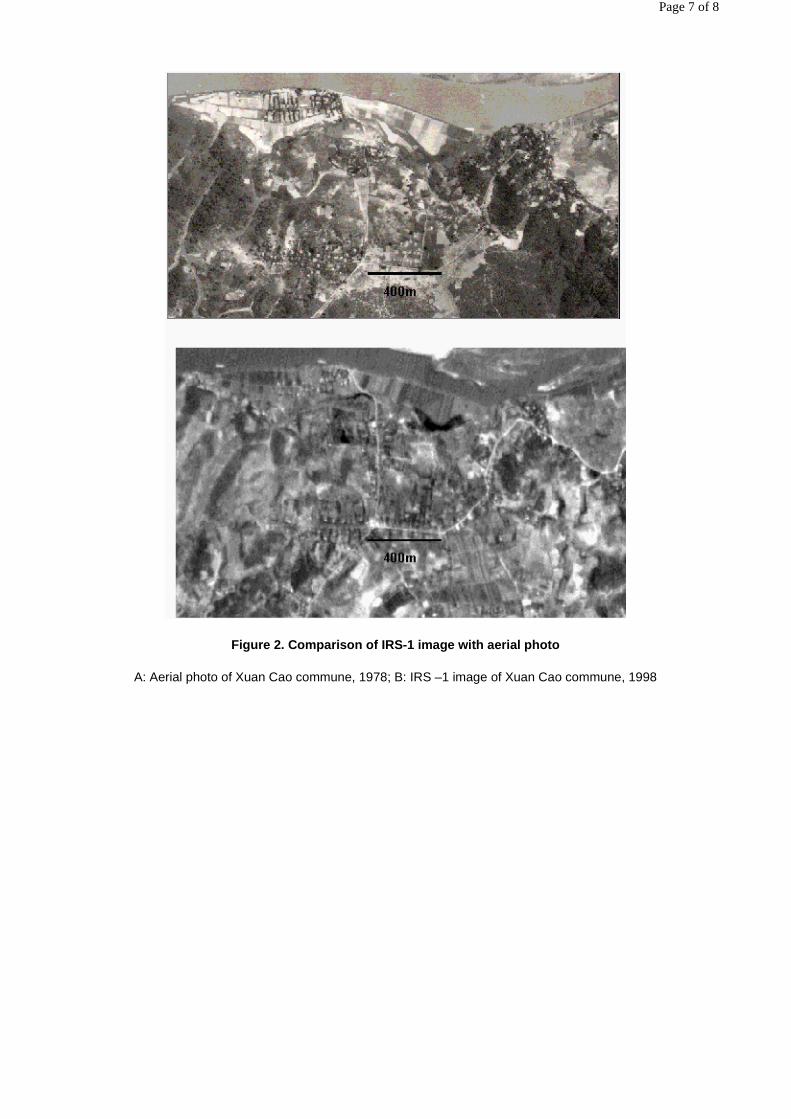
Figure 2. Comparison of IRS-1 image with aerial photo
A: Aerial photo of Xuan Cao commune, 1978; B: IRS –1 image of Xuan Cao commune, 1998
Page 7 of 8

Figure 4. SIM of Xuan Cao commune
Figure 5. Land Use map of Xuan Cao
Go back the Table of Contents
Page 8 of 8
SHIFTING CULTIVATION AND FOREST COVER CHANGE IN NGHE AN PROVINCE, VIETNAM
Jake Brunner, Siobhan Murray, and Nate Badenoch, World Resources Institute, Bill Salas, University of New Hampshire
INTRODUCTION
This paper describes the results of an analysis of the impact of shifting cultivation on forest cover change since 1973 in the uplands of Nghe An Province, Vietnam. The analysis was performed on a 110,000 ha transect located near the border with Laos at elevations between 1,000 and 1,800 m (see map). The transect covers an area with a high incidence of shifting cultivation. Shifting cultivation is a form of agriculture adapted to the uplands where slopes are steep and soils poor, whereby the forest is cut and burned to release nutrients from the forest biomass to the soil. Within a few seasons this temporary fertility is exhausted and new fields are cut. When the population density is low and the area of forest relatively large, shifting cultivation may be environmentally benign. But as population expands and the available forest area shrinks, this process can lead to a high level of habitat fragmentation and an insufficient time for cleared fields to recover before being cut again. In some areas in Nghe An, the fallow length has fallen from 10-15 to 4-5 years and the forest has become increasingly dominated by bamboo and other secondary species (CRES, 1999).
Government officials tend to blame shifting cultivation for most of the deforestation in Vietnam, an attitude that is prevalent in other countries in the region (Brown and Schreckenberg, 1998; Thrupp et al., 1997). However, empirical studies show that government-sponsored forest clearing for cash crops and settlement of migrants, and unrestricted logging by state-owned forestry enterprises, have caused more permanent deforestation than shifting cultivation (Do Dinh Sam, 1994; GOL, 1998). These conclusions are consistent with a study of forest cover change between 1952 and 1995 in a village in Hoa Binh province, which shows low levels of deforestation, but a significant change in forest composition, and a high degree of forest fragmentation (Fox, et al., 1998). Contrary to common perception, the result is not a lunar landscape devoid of all vegetation, but a heterogeneous mosaic of fields, pasture, and forest patches in various stages of secondary succession. This paper aims to complement this site-specific study (740 ha) by analyzing the impact of shifting cultivation on deforestation and forest fragmentation over a much larger area and using more frequent observations.
DATA PROCESSING
Changes in forest cover over time were analyzed using data and methods developed by the Landsat Pathfinder, which is a U.S. multi-agency project that uses Landsat images to map the world’s tropical moist forests. Pathfinder has developed image processing techniques that are generally applicable to the analysis of forest conversion and reforestation in Southeast Asia. This region, which is characterized by a complex mix of deciduous and evergreen forests, and moderate to steep topography, presents a challenge for mapping forest cover using Landsat data. Primary forest, secondary forest, and scrub fallow are difficult to distinguish for the following reasons: forest succession in the tropics can be rapid (young stands can have complete canopy closure with dense green biomass within a few years of abandonment), near-infrared and visible bands saturate rapidly due to the greenness of the regrowth and density of the vegetation canopy, and differences in slope and aspect impact the solar illumination angle and sensor viewing angle.
When analyzing forest cover change over time, low classification accuracies are compounded and reduce the reliability of the change analysis. To improve the accuracy of change detection, high accuracies of the input classifications are needed. This is achieved by using a broad classification scheme whereby the forest class contains areas of primary forest, secondary forest, and scrub fallow. The non-forest class contains areas of barren lands, grasslands, rock, and agricultural areas. Areas that were classified as non-forest in an earlier image and classified as "forest" in a later image are known to be areas of regrowth or forest fallow. New forest fallow and secondary growth are thus inferred from the change detection process, rather than being observed directly.
Change detection is performed using post-classification change detection. Since the images and, therefore, classifications are co-registered, changes in land cover can be tracked on a pixel by pixel basis by combining the individual classifications of forest and non-forest areas. By overlaying these classifications, changes in
Page 1 of 4
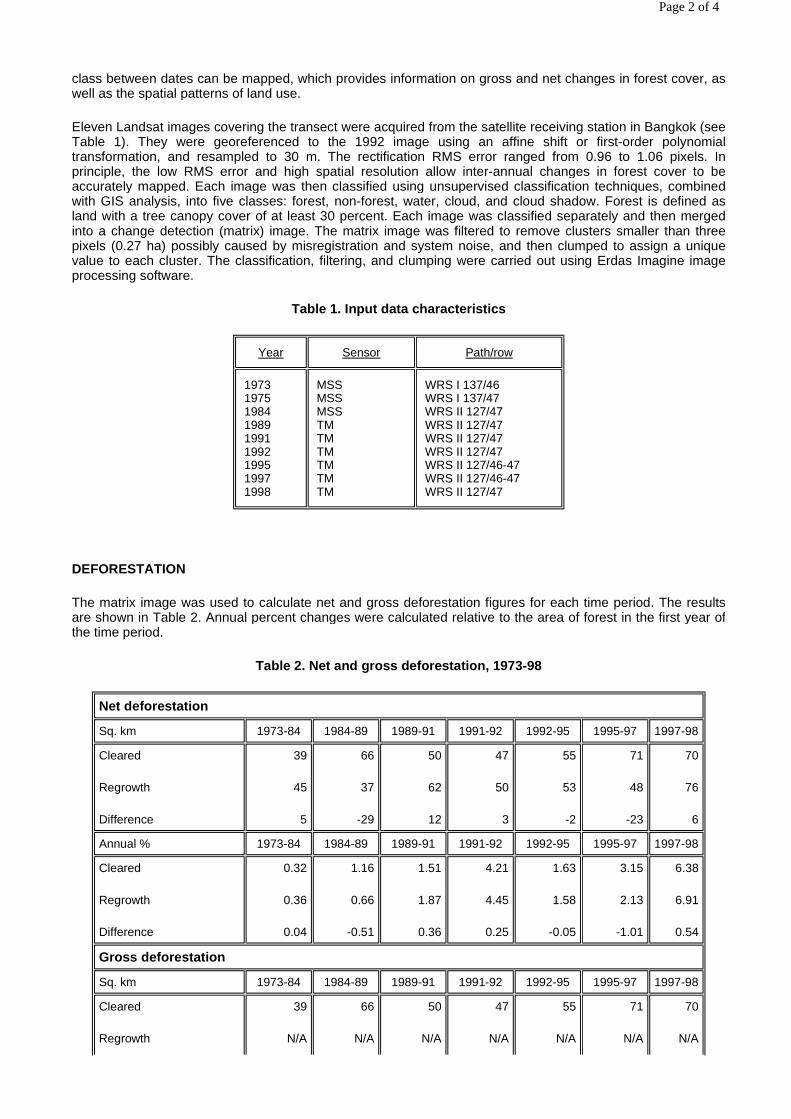
class between dates can be mapped, which provides information on gross and net changes in forest cover, as well as the spatial patterns of land use.
Eleven Landsat images covering the transect were acquired from the satellite receiving station in Bangkok (see Table 1). They were georeferenced to the 1992 image using an affine shift or first-order polynomial transformation, and resampled to 30 m. The rectification RMS error ranged from 0.96 to 1.06 pixels. In principle, the low RMS error and high spatial resolution allow inter-annual changes in forest cover to be accurately mapped. Each image was then classified using unsupervised classification techniques, combined with GIS analysis, into five classes: forest, non-forest, water, cloud, and cloud shadow. Forest is defined as land with a tree canopy cover of at least 30 percent. Each image was classified separately and then merged into a change detection (matrix) image. The matrix image was filtered to remove clusters smaller than three pixels (0.27 ha) possibly caused by misregistration and system noise, and then clumped to assign a unique value to each cluster. The classification, filtering, and clumping were carried out using Erdas Imagine image processing software.
Table 1. Input data characteristics
DEFORESTATION
The matrix image was used to calculate net and gross deforestation figures for each time period. The results are shown in Table 2. Annual percent changes were calculated relative to the area of forest in the first year of the time period.
Table 2. Net and gross deforestation, 1973-98
Year Sensor Path/row
1973 1975 1984 1989 1991 1992 1995 1997 1998
MSS MSS MSS TM TM TM TM TM TM
WRS I 137/46 WRS I 137/47 WRS II 127/47 WRS II 127/47 WRS II 127/47 WRS II 127/47 WRS II 127/46-47 WRS II 127/46-47 WRS II 127/47
Net deforestation
Sq. km 1973-84 1984-89 1989-91 1991-92 1992-95 1995-97 1997-98
Cleared
Regrowth
Difference
39
45
5
66
37
-29
50
62
12
47
50
3
55
53
-2
71
48
-23
70
76
6
Annual % 1973-84 1984-89 1989-91 1991-92 1992-95 1995-97 1997-98
Cleared
Regrowth
Difference
0.32
0.36
0.04
1.16
0.66
-0.51
1.51
1.87
0.36
4.21
4.45
0.25
1.63
1.58
-0.05
3.15
2.13
-1.01
6.38
6.91
0.54
Gross deforestation
Sq. km 1973-84 1984-89 1989-91 1991-92 1992-95 1995-97 1997-98
Cleared
Regrowth
39
N/A
66
N/A
50
N/A
47
N/A
55
N/A
71
N/A
70
N/A
Page 2 of 4

These results show periods of net increase and net decrease in forest cover since 1973, with no clear trend emerging. The low levels of net deforestation are due to rapid forest regrowth after fields have been abandoned into fallow. However, the results show high levels of gross deforestation, and a general increase in the rate of gross deforestation since 1973, particularly since 1989. This trend may be explained by policies introduced in the late 1980s, which transferred land management from the communes to households and allowed farmers to expand cropland by clearing previously intact forest. These policies, which were aimed at increasing food self-sufficiency, appear to have triggered a wave of deforestation.
The impact of these policy shifts may be inferred from Table 3, which shows a doubling in the average annual rate of net deforestation and a 4-fold increase in the average annual rate of gross deforestation between 1973-89 and 1989-98.
Table 3. Net and gross deforestation rates, 1973-89 and 1989-98
FOREST FRAGMENTATION
The number and size of forest patches were calculated for 1973, 1984, 1989, 1995, and 1998. In order to focus on the fragmentation of undisturbed forest, the analysis was only applied to pixels that were classified as forest throughout the study period up to the date in question. The fragmentation analysis was thus applied to a steadily decreasing area of forest. The patch size distribution was calculated using ESRI GRID GIS software. The results are given in Table 4.
Table 4. Forest patch size distribution, 1973-98
The table shows a steady increase in the number of patches and decline in the average patch size between 1973 and 1998. Again, these changes were most pronounced after 1989.
CONCLUSIONS
Difference -39 -66 -50 -47 -55 -71 -70
Annual % 1973-84 1984-89 1989-91 1991-92 1992-95 1995-97 1997-98
Cleared
Regrowth
Difference
0.32
N/A
-0.32
1.16
N/A
-1.16
1.51
N/A
-1.51
4.21
N/A
-4.21
1.63
N/A
-1.63
3.15
N/A
-3.15
6.38
N/A
-6.38
Net deforestation Gross deforestation
1973-89 1989-98 1973-89 1989-98
Sq. km 66 70 Sq. km 99 230
Annual % -0.36 -0.73 Annual % -0.55 -2.47
1973 1984 1989 1995 1998
Intact forest (ha)
No. patches
Average size (ha)
113,263
242
468
109,336
304
360
103,342
425
243
90,791
716
127
80,353
1,222
66
Page 3 of 4
The application of the Pathfinder forest cover classification and analysis methods to a transect of shifting cultivation shows low levels of net deforestation, but high levels of forest fragmentation. This finding, which is consistent with Fox, et al. (1998), suggests that shifting cultivation may be highly sustainable in terms of its impact on forest cover and associated biological and hydrological systems, and that government effort to stabilize or resettle shifting cultivators may be misguided. Low levels of net deforestation suggest that more attention should be paid to improved fallow management and its role in crop diversification and food security. The study also shows a strong correlation between rates of deforestation and forest fragmentation and changes in government policy. From a technical standpoint, the Pathfinder approach permits the rapid analysis of forest cover change over large areas, albeit using a very simplified classification scheme. As such, it may be suitable as the basis of an operational forest monitoring system.
REFERENCES
Brown, David and Kathrin Schreckenberg (1998) Shifting Cultivation as an Agent of Deforestation: Assessing the Evidence, ODI Natural Resources Perspectives, available from http://www.oneworld.org/odi/nrp/29.html
Do Dinh Sam (1994) Shifting Cultivation in Vietnam: its Economic and Environmental Values Relative to Alternative land Uses, IIED, London.
Fox, Jeff, Dao Minh Truong, Terry Rambo, Nghiem Phuong Tuyen, Le Trong Cuc, and Stephen Leisz (1998) Shifting Cultivation with Deforestation: a Case Study in the Mountains of Northwestern Vietnam, mimeo, East-West Center, Honolulu, HI.
GOL (1998) Report to the 4th Meeting of the GMS Working Group on Environment, Hanoi, November 1998.
Thrupp, Ann, Susanna Hecht, and John Browder (1997) The Diversity and Dynamics of Shifting Cultivation: Myths, Realities, and Policy Implications, World Resources Institute, Washington, DC.
CRES (1999) Ca River Basin Environmental Assessment, Center for Natural Resources and Environmental Studies and Vinh University, World Resources Institute, Washington, DC.
Go back the Table of Contents
Page 4 of 4

Remote Sensing Policies and Practicalities: Lessons from the Past, Opportunities for the Future
Anthony C. Janetos and Jake Brunner (World Resources Institute, Washington, DC)
INTRODUCTION
There is general agreement about the issues for which the twin technologies of remote sensing and geographic information systems are well suited. Applications of these technologies for understanding the extent and location of natural resources and human infrastructure, and the change in these resources over time are among the best examples. Remote sensing and GIS are currently being used in some countries to augment more traditional methods of determining forest and agricultural areas, understanding patterns of geomorphology, and tracking changes in urban areas, the location of concessions, etc.
Remote sensing developed primarily from a scientific basis, rather than a strict resource management basis, and scientific applications of these technologies remain a vibrant area of progress. The international scientific community has made enormous strides in the past decade in producing a variety of global and regional datasets on the distribution of land-cover types, forest resources, the identification of human settlements, fire occurrence, etc. In addition, there is beginning to be scientific capacity for using remote sensing to parameterize models of ecosystem processes, such as net primary productivity, that are of both fundamental scientific interest and of practical importance for resource management.
Government and private agencies which have responsibilities for emergency response have also found value in the use of remote sensing and GIS. The rapid notification of ephemeral, but potentially catastrophic environmental events such as large wildfires and severe storms, can be extremely useful in terms of warning the general populace about impending danger, and also can assist relief agencies in targeting areas for special attention when disaster strikes.
In this paper, we examine some of the policy, pricing, and institutional issues that have hampered the use of remote sensing and GIS, and draw from our experience some recommendations for moving forward. In particular, we use the US experience with the Landsat system, and how it has evolved over time, as a model for the potential role of government, universities, and the private sector in the further dissemination of these technologies.
WHAT WOULD A SUCCESSFUL SYSTEM LOOK LIKE?
One way to think about the roles that policies and institutions might play to be successful in enhancing the use of remote sensing and GIS for managing natural resources is to define the characteristics of a successful system. This is relatively easy to do, even in the absence of specifying all the technical details of implementation.
The most important management goal for effective natural resource management is to build in feedback loops about the extent and condition of the natural resources themselves to those actors who are responsible for managing the resources. If the management agent in question is a government ministry, or a private landowner, the principle remains the same. Accurate information about the status, extent, and condition of the resource itself is enormously valuable. The information’s value increases if it is comparable to information about the same resource in other places, e.g. if data about forests in one region are comparable to data about forests in another region, and if it is comparable over time, e.g. measurements of forest extent in 1980 are directly comparable to measurements of forest extent today.
In general, we can identify five characteristics of a successful system for using remote sensing and GIS data for natural resource management:
The system should be rapid. This may seem obvious, but has been difficult to achieve in many places for technical reasons. Standard forest inventory practices in many countries, for example in the US, require a decade to do a complete national inventory. Some portions of that inventory, in particular the determination of
Page 1 of 5
forest area in particular regions, can be accomplished much more rapidly with the use of remotely sensed information. Changes in year-to-year status of the resource cannot be reliably detected and understood unless the monitoring methods can keep up with the actual management practices on the ground. Even the use of remote sensing has proven problematic in this respect because of the difficulty in acquiring reasonable data quickly enough, and then the subsequent difficulties in analyzing data rapidly enough. However, this is an area in which the use of remotely sensed data has enormous potential for some, but not all aspects of natural resource management.
The system should be spatially informative. Monitoring systems that provide single national numbers for resources, such as the total amount of forest cover, can be useful for some scientific applications. However, they are of extremely limited utility for resource management. Practical resource management requires information about specific places, with reasonable resolution. Obviously, the use of remotely sensed data and GIS have important advantages in this regard. However, it is clear that resource management typically requires fairly high spatial resolution, on order of a few tens of meters. Of current remote sensing systems, Landsat and SPOT are those that are typically the most useful for management applications. These satellite systems also have the advantage of having had years of operations and large communities of users familiar with the potential uses of the data. While synthetic aperture radar systems have great potential for monitoring some aspects of ecosystems, many of the analytical algorithms are still highly experimental.
The system should have clear and transparent methods. There is enormous public benefit for resource management agencies, and even private landowners, from having clear and transparent monitoring methods. Transparency enables comparison of results from different regions, and can have the effect of enhancing the public support for the agencies providing information. Achieving transparency of methods is all the more important because of the technical nature of using remote sensing imagery; it is unrealistic to think that all research institutes, or all natural resource decision makers, are going to understand the details of all the steps in the analysis. However, it is not unrealistic for them to understand the broad design of a monitoring system that can identify land-cover of different types, show that the remote sensing data can be validated in a sufficient number of places with in situ observations, and then be used to monitor change over time.
The system should have replicable analyses. Quantifying changes over time are a crucial element of any resource management system. The analyses that are done with remote sensing data must be replicable, so that a consistently produced time series of data can be produced as easily as possible. It is only through the analysis of time series data that the actual performance of natural resource management policies and practices can be understood and changed if need be.
The system should be inexpensive. The differences between the initial capital costs of initiating a monitoring system using remote sensing and GIS technologies and the ongoing operational costs of maintaining it are important to differentiate. There are very few nations that are capable of bearing the cost of developing, launching and operating remote sensing systems. However, the costs of acquiring and interpreting data can be relatively modest, and these are the costs to consider for new national efforts.
WHAT ARE THE OBSTACLES TO OVERCOME?
There are a number of basic reasons for the continued difficulty in using remote sensing and GIS technologies in basic resource management. In this section of the paper, we identify the main challenges, and how the experience with the Landsat system provides useful models.
Science. The use of digital remotely sensed data still does not have much more than a 30 year history, even in the US. The first Landsat mission was launched in 1972, and even though there was scientific research with aircraft instruments and meteorological satellites before that, there has still been only a few "generations" of scientists and resource managers with direct experience with these measurements. So in many ways, the basic physics of the instrumentation, the basic biology, ecology, chemistry, and geology of the Earth’s surface have all required lots of investment within the research community to develop tools and applications for broader use. However, much of this investment has occurred. There is always a need for more and better science, to be sure. But much of the scientific understanding that is needed for the application of these technologies to natural resource management now has a fairly strong foundation. While we should expect that the science will continue to progress, there is certainly now enough understanding of the basics to feel comfortable with extending the practical applications of the technologies into management arenas. The Landsat 7 mission emphasizes within its own science team the development of new methods for land-cover change research and resource management.
Acquisition of Data. In the early stages of the Landsat program, the main challenges to the actual acquisition of
Page 2 of 5

the data were technological. The sensor design was novel, communications technology with ground receiving stations was untested, and the experimental nature of the mission did not result in a scientifically grounded acquisition policy. Rather, there was a notion that the primary mission of the system was to map the surface of the Earth in an exploratory mode. With the decision by the US to commercialize the Landsat system in 1980, the problems of data acquisition quickly became economic. Essentially the business model became, pay for the data and it will be acquired. One of the problems with this model is that it assumes that the data are of immediate value. In fact, the value of these data for natural resource management increases over time as a time series accumulates. The potential uses of the data also accumulate as scientific knowledge advances. It is difficult for the operators of a satellite system to incorporate these features into a purely commercial model. These constraints have changed dramatically with the Landsat 7 system, which returns Landsat to the public domain for the first time in nearly 20 years. In particular, the acquisition policy has been designed with a fundamentally scientific basis of understanding the changes in the surface cover of the Earth at seasonal to annual time scales. The acquisition policy and design of the Landsat 7 system are meant to provide for a refreshed global archive of data held in the US, supplemented with holdings in the international ground receiving stations. The global archive is meant to be refreshed seasonally. The acquisition strategy is further optimized to ensure that difficult-to-obtain scenes, such as those over often cloud-covered tropical forest, are given priority in the queue. These characteristics of the Landsat 7 acquisition strategy are immediately commensurate with the needs of the natural resource management community.
Information Policy. The primary issues about information policy are who owns the information, who controls access to it, and what are the rules governing its use. In the US, there are several operating philosophies that have governed the use of remotely sensed data. One is a general scientific philosophy, common throughout the world. Information and analyses should be published, and data shared broadly. This enables peers to review each other’s work for quality, other research groups to reproduce results and gain confidence in them, and improvements to occur in a largely open forum. The second philosophy is the appropriate role of the government. In the US, there is a strong tradition that the government should avoid activities that compete with the private sector in markets in which a viable private sector exists. There is also an accompanying corollary that the government should take steps to promote the development of a viable private sector where one does not exist. The role of the university community in this respect is both interesting and important, since they operate mid-way between government institutions and corporate institutions. The third operative philosophy in the US system is that information collected at public expense should in general be made available to the public at no additional cost, or at a small marginal cost (sufficient to cover expenses). The experience within the US is that adherence to these policies as general operating principles greatly expands the use of remotely sensed data, providing other obstacles aren’t too great. The changeover of Landsat 7 from a privately operated system to a publicly operated system has resulted in policies that do not discriminate between for-profit and not-for-profit users. They also allow the free copying and redistribution of data that have already been purchased by any party. In fact, since the US government only produces Level 1R data, its data policy creates space for other institutions that use Landsat data, both within and outside of government agencies to tailor products for their particular applications. In particular, the policies of basically unrestricted access and redistribution rights have had the effect of creating additional demand for data. There is no evidence of saturation of demand over the past five years or so.
Technological Hurdles. The availability of the technology to access, read, process, and interpret Landsat imagery is still somewhat limited, but this hurdle is certainly lower than even ten years ago. Within the US, Landsat imagery is now processed on commonly available workstation technology. Several US universities have developed simple processing software for interpretation that runs on PC’s, and is available free over the Internet. Even more sophisticated software is relatively common commercially. We have not yet reached the day when Landsat data are easily delivered to every laboratory that wants them and has an Internet connection, but from a strictly technological perspective, we probably aren’t too far off. Even though the specifics can’t be predicted, the computer and information industry is currently so dynamic that it is safe to predict that these hurdles will continue to decline.
Access and Interpretability. These are still problems, but they are declining. One problem is simply knowing what is available in archival holdings around the world. The commercialization of the US Landsat system in 1980 had the undesirable effect of making it more and more difficult for any user to know what the holdings were in different receiving stations around the world. The current policy of holding a global archive in the US, but also of enhancing the knowledge of international holdings through shared metadata catalogues has the potential for spurring international demand. There is an enormous gap to be overcome in the area of interpretability for natural resource management, however. The simple classifications that the scientific community has used for global datasets, or that have been used for scientific studies such as the Landsat Pathfinder project are useful for their own purposes; they are generally not adequate for resource management. Nations will require some standardization of terminology and classification for their own purposes, and to ensure that national stakeholders are able to communicate with one another. However, at the same time, it is important to remember that all classifications are useful for the specific purposes for which they were originally intended and may not be for others. Therefore, there is a premium on establishing a set of
Page 3 of 5

standards for archiving and documenting the original data on which any classification system depends, for potential future use. Within the US, the federal government has proposed standards for the development and archiving of all geographic data, and has created an open process among its own agencies, and with other scientific and commercial institutions to promote voluntary adoption of those standards. In addition, within the federal land management agencies, there are important national efforts to standardize the national classification systems that are used to identify biological resources, so as to harmonize often conflicting policy demands.
Price. This is of course one of the main hurdles, and has three components. One is the capital cost of designing, developing, and launching satellite systems. These capital costs are large and risky. They are obviously beyond the capability of most nations, and beyond the capabilities of even very large corporations (because of the risk) to bear. Operating costs of satellite systems, while still in the millions of US dollars per year range, are smaller in comparison to the development costs, and have relatively smaller risks. The size and nature of the costs of development and operations, however, are such that for most remote sensing systems they will and should remain in the public domain. They are likely to remain primarily in the hands of the technologically advanced nations with a strong industrial base for some time to come, although that does not mean that they will be exclusively the province of the US, western Europe and Russia, as the experience of the India and soon Brazil and China demonstrates.
The cost of the data themselves are the third component, and the one most relevant to this workshop. The return of Landsat 7 to the public sector has resulted in an enormous decrease in prices for data; from over $4000 (US) for a single level 1 Landsat scene to about $600, and a hope that prices could decline further in the future. And yet neither the commercialized system nor the current system is attempting to amortize the costs of designing, building, and launching the satellite and sensor. Why then, are the costs so different? One perspective is, of course, that the commercial business was in the business of making a profit, and the US government is not. This is true, but seems insufficient to explain the entire difference, since the Landsat 7 ground system is attempting to be self-sufficient with respect to its yearly operational costs.
We believe that there is a more fundamental policy difference, which is reflected in the underlying business model. If you believe that you are in the business of selling data, and the sale of the bits must be used to cover other costs, then the typical pattern is to charge as much as possible for each sale, attempt to restrict the redistribution of the data so that you can sell it again should another customer want it, and generally set the prices fairly high. This is clearly the model that drove the enormous increase in prices that followed the commercialization of the Landsat system in 1980. However, there is another model. If you believe that what you are really selling is the information that the data enable the user to acquire, then one tends to invest in methods and technologies for extracting information, sell those, and reduce the costs and constraints on the data themselves. This tends to enhance the tendency of data users to return to the provider for future purchases, enhance their ability to make larger purchases, and enhance the number of users who are capable of purchasing data. The general direction of US policy with respect to Landsat data is clearly in the latter direction, although there is still progress to be made. There is no reason in principle why the data from a publicly funded remote sensing system in which such large investments have been made should not be made nearly freely available, in much the same way that many meteorological data are made available.
CONCLUSIONS AND RECOMMENDATIONS
Remote sensing and GIS technologies by themselves cannot hope to provide everything that is necessary for natural resource management systems. Some information will always be required that can only be collected through in situ observation, measurements, and through tracking economic activity. However, the main hurdles of the past in using remote sensing, science, data acquisition, information policy, technological capacity, and price, are changing rapidly. In nearly all cases, these changes are in a direction that would enhance the use of these technologies. Thus, there is a clear opportunity for progress and expanded use of these technologies in natural resource management.
What then, might governments do to take advantage of these opportunities? We believe that there are five main lessons from the Landsat experience that provide some guidance.
Take immediate advantage of the dramatic drop in the price of data from the Landsat system, and ensure that there is complete coverage of Vietnam for the year 2000, and on nearly annual time steps after that. The cost of simply purchasing up-to-date coverage for the entire country (about 30 scenes) should on the order of $20,000, a sum for which sufficient financing should be achievable.
Promote a data policy that would make the raw data, once purchased, freely and openly available for all
Page 4 of 5

capable institutions. Ensure that different research and resource management ministries and institutes can acquire copies of the national data set as easily as possible. Collaborations among research and resource management institutions can reduce the overall cost of ensuring nationally important analyses to be done by reducing overlap and unnecessary competition for limited resources.
Promote standards for documentation, archiving, distribution of information, geographic control, and accuracy of analysis. These standards could be developed in collaborative processes with research and resource management institutions. They need not be mandatory, but should be widely known so that all institutes have a reasonable idea for what is expected of them.
Promote the development and use of semi-automated methods of classification to ensure adequate accuracy and precision for natural resource management. As these methods continue to be improved, they have the potential to lower costs substantially.
Promote information sharing, validation procedures, and the public release of information to ensure that there are broadly recognized gains in knowledge, but also in accountability and transparency of the institutions doing remote sensing analysis. In the long run, the public sharing of information allows the development of a strong base of public support for the increased use of these technologies by public institutions.
Go back the Table of Contents
Page 5 of 5

Watershed Classification with GIS as an Instrument of Conflict Management in Tropical Highl ands
of the Lower Mekong Basin
Christine Knie and Kirsten Möller (University of Giessen/Germany)
The University of Giessen is currently planning a research project on Watershed Management in the Tropical Highlands of the Lower Mekong Basin. Research focus is on the analysis of land use conflicts in watershed areas, different approaches of Watershed Management in general, and, in particular, the application of new technologies in this context. The project goal is to develop a data base concept and operation framework which can serve –within certain limits-- as a turnkey package for other mountain watersheds in southeast Asia.
PROBLEM BACKGROUND
The watersheds of southeast Asia’s mountain regions are characterized by the permanent conflict between the need for conservation of natural resources on one hand and constantly growing population and land use pressure on the other.
Past experience has proved that environmental protection and conservation concepts can only be successful if socio-cultural and economic aspects are given equal weight to ecological considerations. The mountainous regions of southeast Asia are fragile regional ecosystems in which increasing deforestation and forest degradation directly impact on the entire ecological infrastructure (e.g., hydrological and soil resources, not to mention the local climate). At the same time, the mountain areas of southeast Asia are home to various, often competing groups. A conflict-prone frontier is formed between the traditional home of various hill tribes (characterized by a great variety of ethno-specific land use systems) and the fast-expanding population of the lowland areas. Further complicating the situation, the (governmental) forest administrations pursue their own particular interests in the mountain areas.
These problems are typical for the regions’ tropical mountain areas, in other words, they are not country specific. For example, in Thailand the process of deforestation and watershed degradation and the resulting land use conflicts has progressed particularly far, but the same trends can be observed in its neighbors --Laos, Vietnam, Myanmar and even in Southern China.
Modern technologies and, in particular, state-of-the-art geographical information systems (GIS) offer the potential for efficient compilation and evaluation of already existing data in order to identify generally valid, location-independent problem solving strategies. The planned project is designed to supply a region-specific conflict management framework which would be generally applicable in southeast Asia’s tropical mountain areas. It is anticipated that such a framework would be generally valuable, and particularly interesting for technical cooperation projects dealing with land use, forestry, regional planning or natural resource management aspects in the region.
EXPECTED RESULTS
Data are compiled electronically, prepared and inte grated.
Tasks to achieve this objective would include the following: (a) comprehensive data compilation, (b) the installation of a geographic information system (GIS), (c). preparation of a digital data base (information preparation including conversion from analogous to digital format where necessary), (d) information from existing topographical maps will be complemented by multi-temporal analyses of suitable satellite images and aerial photos. The required attribute data will be integrated into the GIS by means of a task- and project-adapted relational database.
An Information System is established.
Page 1 of 8

The ecological- and socio-cultural development as well as the conflict potential of the selected study areas will be analyzed and assessed with regard to the land capability and its development potential vis-à-vis natural resource management. Potential land use conflicts are to be illustrated with various land use scenarios. An improved classification framework is to be developed that will be thoroughly tested for practical feasibility. The new Information System is to be carefully checked on transferability and user friendliness.
A digital 'atlas' of a pilot area is established.
Thematic layers to be established in the GIS-database include the following: base map information about settlements, roads, administrative boundaries, drainage network, watershed and sub-watershed boundaries -the ecological, socio-economical and socio-cultural development - land capability and watershed conservation classifications as well as selected land use scenarios
Presentation of the results
The data compilation and processing will be clearly documented and recommendations for future data compilation activities detailed. The study results are expected to be presented at various decision-maker levels. Based on these results, training packages will be prepared and tested.
APPLICATION RELEVANCE AND APPLICATION POTENTIAL
Traditional approaches have seen watershed management primarily as a physiogeographical and ecological problem. In contrast to this 'traditional' perspective, the proposed project plans an interdisciplinary approach which takes into account not only ecological but also socio-cultural and economic factors. The advantage of such a 'broader' approach is a much more comprehensive information foundation for the development of concepts for conserving natural resources. The integrated consideration of ecological and socio-economical factors allows a more effective and more 'holistic' analysis and evaluation of the present land use pattern and land use systems, including their specific conflicts, potentials and risks.
The GIS will be used to illustrate the mutual impacts and feedback processes of the various factors and the structure of conflicts which determine watershed management. An important aim of the project will be to illustrate the potential of "sustainable information use". This term basically refers to an improved exploitation of currently underutilized existing data by data integration and improved data exchange.
The main objective and hence also a major justification of the proposed project is to compile results which are (largely) transferable to other, comparable watersheds elsewhere in the mountain areas of the whole project region. It is anticipated that the analysis process as well as the resulting evaluation and classification models developed for selected pilot areas will in principle be transferable to any other mountain watershed. For this reason the project will document in detail not only the actual study results but also the implementation of the various steps of the data compilation and data processing procedures. The final project objective is to establish a data base concept and operation framework which can be taken – within certain limits - as a turnkey package for other mountain watershed in southeast Asia. Hence, the final documentation will be compiled in such a way that it can be used as a sort of 'watershed management manual'. Based on this manual, training packages can be established for specific aspects.
WATERSHED MANAGEMENT APPROACHES IN TROPICAL HIGHLAN DS
In the context of watershed management, the application of GIS/GPS/RS and land use management is one of the research focuses of the GIS-Department at the Institute of Geography at the University of Giessen.
In order to prevent further degradation of the natural resources of the tropical highlands of the lower Mekong Basin, a well-functioning system of land use planning is required. During the last years, new approaches for watershed management focused on the integration of new technologies like GIS/GPS/RS into management concepts. These new technologies by themselves cannot solve existing problems, but they are certainly effective tools to compile, analyze and update land use planning relevant information.
Topics of Research Approach
Page 2 of 8

� Which kind of project approaches exist in the Lower Mekong Region? � What exactly are their functions for the region as a whole? � Which problems occur? � Which experiences were made with new technologies? � How can we use these experiences to provide a watershed management framework which may
possibly be generally applicable for other Southeast Asian tropical mountain areas as well? � How should data be analyzed and stored in a way, that sensible, consistent, and decision-relevant
information is produced.
Basic Analysis of the existing Watershed Classi./,fication of Thailand, established 1983, and of two new approaches which applied modern technologies (Kasetsart University Bangkok 1990 and Cranfield University 1992)
Key Questions:
� What is the aim of the classification? � What are the essential basic data for watershed planning? � Which data are actually available and how � and from where can they be acquired? � Which factors were taken into consideration and how are they compiled? � Which criteria’s have been used for the assignment of classes?
1. Existing Watershed Classification Developed by N ational Environment Board of the Kasetsart University in Bangkok Thailand (1983)
Example: BASIC ANALYSIS OF WATERSHED CLASSIFICATION OF THAILAND
Aim of the Classification
Prevention of Environmental Degradation
Basic Data
Topographical Map 1:50.000 (TM 50) 1967
Soil Map 1:100.000
Geology Map 1:250.000
Smallest Grid Size of Data Analysis: 1km²
Factors
Slope, Elevation
Landform
Soil, Geology
Forest Cover
Data Processing
Manual Analysis and Interpretation of Analogous Maps
Statistical Factor Analysis
CLASSIFICATION SCHEME
Class 1 very high elevation and very steep slopes
=> Protected or conservation forest and headwater source
Class 1A: Permanent Forest Cover
very high elevation and very steep slopes
=> Protection
Class 1B: Permanent Forest with already cleared areas
very high elevation and very steep slopes
=> Should be reforested or maintain in permanent agroforestry
Class 2 high elevation and steep => Commercial forest
Page 3 of 8
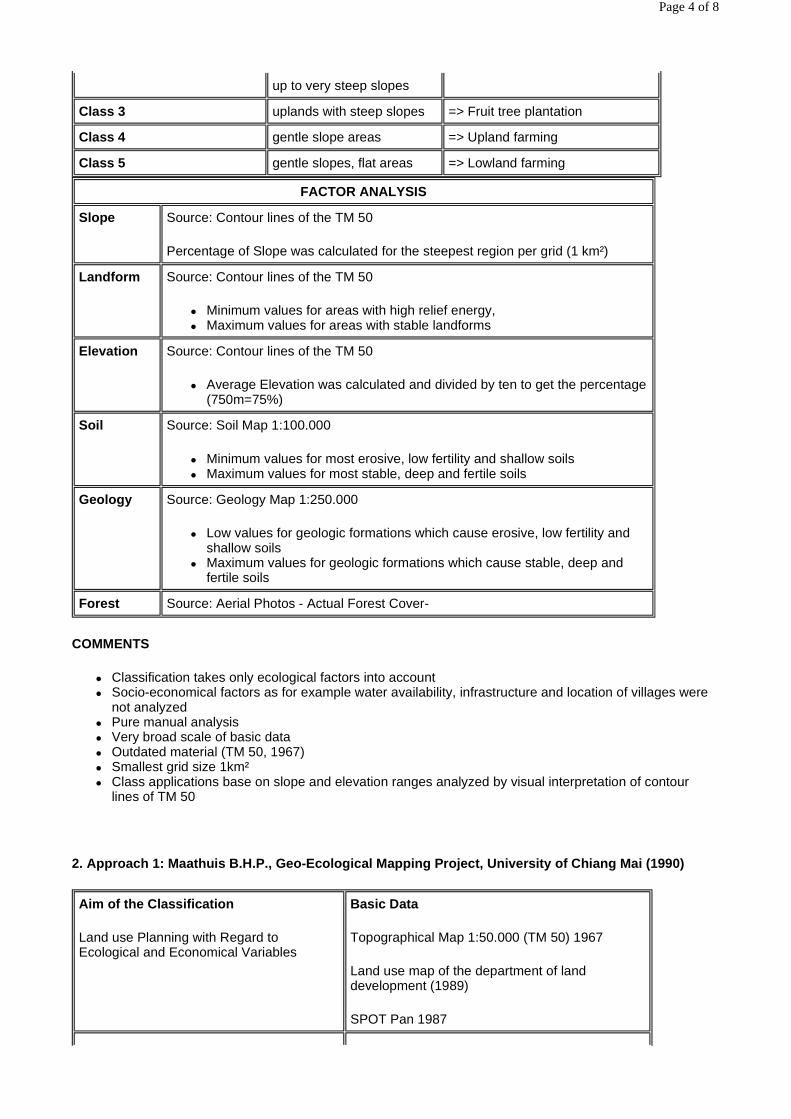
COMMENTS
� Classification takes only ecological factors into account � Socio-economical factors as for example water availability, infrastructure and location of villages were
not analyzed � Pure manual analysis � Very broad scale of basic data � Outdated material (TM 50, 1967) � Smallest grid size 1km² � Class applications base on slope and elevation ranges analyzed by visual interpretation of contour
lines of TM 50
2. Approach 1: Maathuis B.H.P., Geo-Ecological Mapp ing Project, University of Chiang Mai (1990)
up to very steep slopes
Class 3 uplands with steep slopes => Fruit tree plantation
Class 4 gentle slope areas => Upland farming
Class 5 gentle slopes, flat areas => Lowland farming
FACTOR ANALYSIS
Slope Source: Contour lines of the TM 50
Percentage of Slope was calculated for the steepest region per grid (1 km²)
Landform Source: Contour lines of the TM 50
� Minimum values for areas with high relief energy, � Maximum values for areas with stable landforms
Elevation Source: Contour lines of the TM 50
� Average Elevation was calculated and divided by ten to get the percentage (750m=75%)
Soil Source: Soil Map 1:100.000
� Minimum values for most erosive, low fertility and shallow soils � Maximum values for most stable, deep and fertile soils
Geology Source: Geology Map 1:250.000
� Low values for geologic formations which cause erosive, low fertility and shallow soils
� Maximum values for geologic formations which cause stable, deep and fertile soils
Forest Source: Aerial Photos - Actual Forest Cover-
Aim of the Classification
Land use Planning with Regard to Ecological and Economical Variables
Basic Data
Topographical Map 1:50.000 (TM 50) 1967
Land use map of the department of land development (1989)
SPOT Pan 1987
Page 4 of 8

Factors
Slope, Elevation
Water Availability, Infrastructure
Location of Villages, Forest Cover
Soil and Geology is not analyzed
Data Processing
Updating Land use Map by Map and Satellite Analysis with GIS
Digital Terrain Model (DTM)
Slope Values from DTM
Final Analysis and Classification using Overlay-Functions of GIS
CLASSIFICATION SCHEME
Classes Proposed Land Use
Class 6 >50% Slope Forest
Class 5 25-50% Slope and 800-1600 m Elevation Coffee, tea and cattle farming
Class 4 25-50% Slope and <800 m Elevation Fruit trees and cattle farming
Class 3 10-25% Slope and <1600 m Elevation Food crops using conservation practices
Class 2 <10% Slope and 800-1600 m Elevation Short growing rice, mixed with temperate food crops
Class 1 <10% Slope and <800 m Elevation Rice mixed with food crops
FACTOR ANALYSIS
Slope Source: Digital Terrain Model (DTM) based on 100 m contour lines of TM 50
4 Slope Classes ( 0-10; 10-25; 25-50; >50% Slope)
Elevation Source: TM 50
3 Elevation Classes (<800; 800-1600; >1600m)
Forest Cover Source: Land Use Map 1:50.000 from Department of Land Development
-updated by interpretation of SPOT Pan Images-
Water Availability
Source: TM 50
high suitable => perennial drainage: 0 - 500m medium suitable => perennial drainage: 500 - 1000m periodical drainage: 0 - 250m
Location of Villages
Source: TM 50 – Distance (of potential fields) from villages - -updated by interpretation of SPOT Pan Images-
high suitable: 0 - 1000m medium suitable: 1000 - 2000m
Infra-structure
Source: TM 50 – Distance (of potential fields) from roads -
-Updated by interpretation of SPOT Pan Images-
high suitable: distance from main road: 0 - 1500m medium suitable: distance from main road: 1500 - 3000m and/or distance from tracks: 0 - 1000m
Page 5 of 8

COMMENTS
� Proposed land use takes ecological as well as socio-economical factors into account (see table entitled "factor analysis")
� Geology and soil maps were not analyzed because it was not possible to get relevant information by the available maps with their broad scale
� Relatively high data actuality by updating outdated TM 50 and Land Use Map with SPOT Pan (1987) � Smallest grid size: 67 m² � Classification classes base on slope and elevation ranges � Slope Values were derived from DTM (elaborated with GIS)
3. Approach 2: Dr. H. Weyerhaeuser (1994): Revised land capability classification for a Watershed in Northern Thailand, MSC Thesis, Cranfield University
Aim of the Classification
Natural Resource Management - Land Capability Study (in order to support the environment as well as the people)
Basic Data
Topographical Map 1:50.000 (TM 50)
Landuse Map (Classified with Landsat TM Satellite Image, 1992)
Factors
Slope, Elevation
Water Availability
Infrastructure, Location of villages
Forest Cover
Soil and Geology is not analyzed
Data Processing
Map and Satellite Analysis with RS/GIS
Digital Elevation Model (DEM)
Slope Values from DEM
Data Overlays, Buffers,
Various Scenarios of Potential Landuse,
Final Analysis and Classifications with GIS
CLASSIFICATION SCHEME
Classes Proposed Land Use
Class 1 Conservation /
Permanent Forest Cover
Thinning and selective harvesting of hard and soft wood and minor forest products
Promotion of tourism (soft tourism)
Class 2 Low Potential Diversified reforestation and forest plantations on larger scale
Village woodlots for construction timber on smaller scale
Permanent agroforestry, Fruit trees and Orchards,
Promotion of tourism (soft tourism)
Class 3 Moderate Potential
Forest plantations of soft wood with shorter rotation,
Fruit trees, Flower and Mushroom production,
Agroforestry (coffee, tea, miang),
Cut and carry for livestock
Page 6 of 8

COMMENTS
� proposed land use takes ecological as well as socio-economical factors into account (see table entitled "Factor Analysis")
� Geology and soil maps were not analyzed because it was not possible to get relevant information by the available maps with their broad scale
� Satellite Image from Landsat TM (1992) was used for actual data base � application of classes based on potential land capability � slope values were derived from DEM � Data Overlays, Buffers, and Various Scenarios of Potential Landuse by GIS
Maintain: permanent ground cover
Class 4 High Potential Vegetables, Maize, Sugar Cane, Cassava, Tobacco, Soybean, Potatoes, Beans, Strawberries, etc.
Main objective: maintenance of permanent ground cover
Class 5 Highest Potential Rice paddy and vegetables for cash crops
Intensive cultivation
FACTOR ANALYSIS
Slope Source: Two different Slope Maps derived from Digital Elevation Model (DEM)
Contour lines: 100 elevation points per square kilometer from TM50 were digitized and SPANS was used for processing
Slope Map1 - 5 Classes: 0-10; 11-25; 26-50; 51-100; >100%
Slope Map2 - 5 Classes: 0-10; 11-20; 21-45; 46-100; >100%
Elevation Source: Elevation Map derived from DEM
(similar procedure as for slope maps)
4 Classes: 600-800; 800-1000; 1000-1200; > 1200m
Forest Cover Forest Cover
Source: TM 50 and actual Land Use Map
Water Water Availability
Source: TM 50 and actual Land Use Map
2 Buffer Zones: 300; 500m
Infrastructure Distance from roads and tracks
Source: TM 50 and actual Land Use Map
4 Buffer Zones: 0-0,5; 0,5-1; 1-1,5; 1,5-2,5 km
Location of Villages
Distance to the (potential) fields
Source: TM 50, actual Land Use Map
4 Buffer Zones: 0,5; 1,5; 2,5; 5 km
Page 7 of 8

Go back the Table of Contents
Page 8 of 8
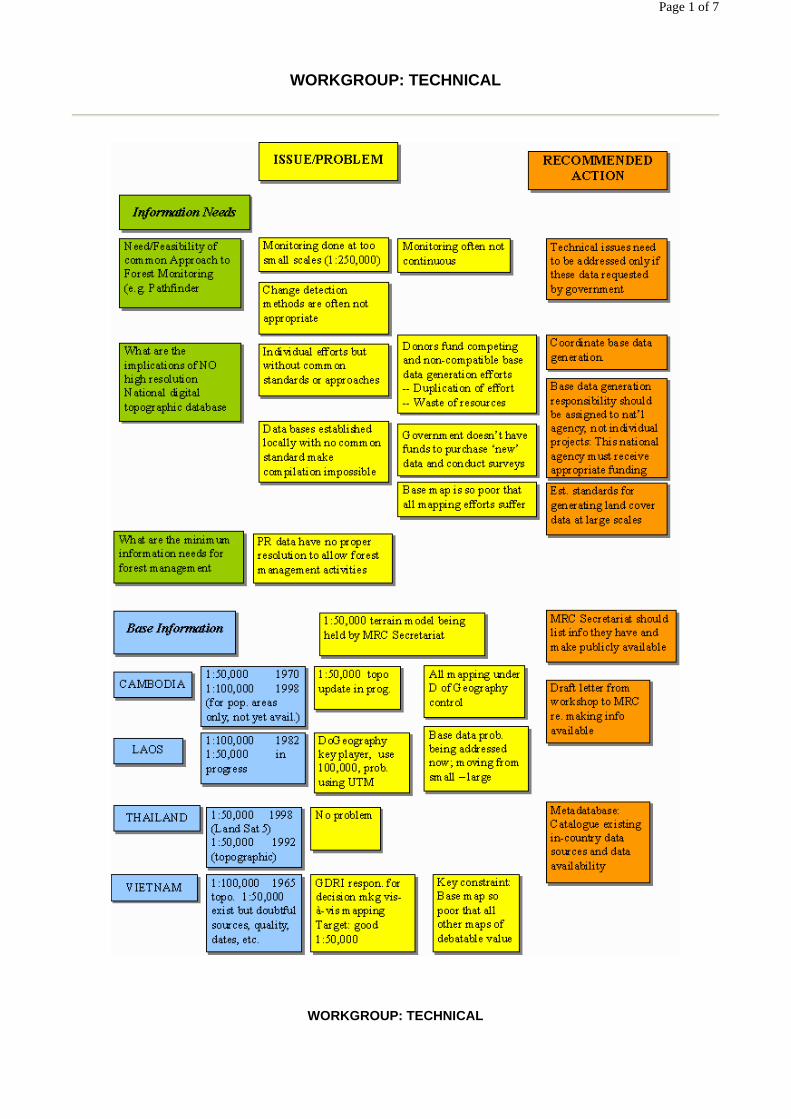
WORKGROUP: TECHNICAL
WORKGROUP: TECHNICAL
Page 1 of 7

Summarized Recommendations for "Quality & Documentation" Issue:
� Provide open forum for promoting standards � Provide technical guidelines on data management � Catalogue and make available base datasets
Page 2 of 7

� Provide annual forum for technical exchanges, case studies, etc.
DISCUSSION (Technical Workgroup)
The Workgroup was unable to address the issue of mapping on the provincial level. Not yet the right forum for discussing in detail.
Maps at 1:250,000 and above insufficient. In principle, need for more quality control – many existing maps cannot be used because they were never ground-truthed.
There are on-going activities that may produce such maps in the near future
Important to trigger greater interaction between the (1) Donor supported track and (2) science or research track.
Possibility of national inventory? No clear institutional mandate, thus no ideal base for locating such a database. Would have to be a process-oriented effort, not a one time exercise.
In a number of cases, the recommendations refer to SMRP or GTZ, in others, no reference to someone to take action
Should send a letter to MRC Secretariat, SMRP is in a position support and to offer assistance – to find resources to assist this process, but has to be carried by other institutions present as well.
CATALOGUE:
Concerning a catalogue: do representatives present see a problem making information available? SMRP could, in principle, collect and transmit the information. But do local institutions HAVE a data catalogue, and would they be willing to make them available?
In Laos, have already initiated a process of communication, including data sharing, among Laotian institutions. Monthly meetings are being held. Very hopeful that such data sharing is possible.
In Vietnam, there is no knowledge of a similar effort to either collect or distribute such information. Information is there, but often hard to locate. In addition, willingness is uneven, and relatively complicated. MoSTE, GDLA and FIPI compiling a base data set at the 1:50,000 to 1:100,000 scale that should be published in the near future. It is still unclear if this is an ‘official’ data set, or simply ‘another’ data set.
In Cambodia, an information has already been established under the UNDP to collect information. It should be available on the Internet in the near future. A printed catalogue already exists, but was unfortunately not brought to the meeting.
WORKGROUP: HUMAN RESOURCES
Page 3 of 7

WORKGROUP: HUMAN RESOURCES (Page 2)
Page 4 of 7

DISCUSSION
What happens if you don’t have this ideal team? In many cases, one individual is tasked with all these assignments. To ensure sufficient personnel and budget support, need to have institutional acceptance which begins with an appropriate process of needs assessment.
A GIS forum could help with skills upgrading, keeping people up-to-date.
If YOU are willing to spend time/resources on setting up a network THEN do the first steps of a network NOW!
WORKGROUP: INSTITUTIONAL
Page 5 of 7

Issues and problems were clustered under three themes: (1) data management policy, (2) cooperation with institutions, and (3) institutional mandates.
Detailing the meaning of ‘data sharing’, the following points were made:
� need to change information flow and access, unofficial data trade, � ownership of data exchange policy in running projects, � need for donor conditionalities to ensure data dissemination, � lack of transparency of what is available, � who is really interested in sharing information, � data sensitivity for government.
Additional definition to ‘cooperation within institutions’ included:
� effects of information systems on hierarchical structure, � distance/communication between technicians and planners, � institutional fragmentation, � sectoral responsibilities
Page 6 of 7

� donor dependency, � absence of national/regional data base (institution?) & guidelines (input/retrieval)
The following points were also made to further define ‘Cooperation (or lack thereof) among institutions’: inter-institutional competition
Findings were in turn clustered, and yielded two main recommendations.
Recommendation 1: Support/organize national-level networking and communication (First column can be considered as a terms of reference for the meeting)
a. On-going user group (national, provincial, etc. as appropriate) meetings (informal process). Series of informal meetings, say, monthly, to discuss issues of common interest. Such a discussion could lead to, for example, a motion towards a data clearing house/certifier (see card a)
b. Follow up National-level meeting, or series of meetings (more of a formal process). Organize national level meetings to agree to an action agenda for solving these problems (see column 1: Institutional Mandates) (see cards b-g)
Recommendation 2: Develop manual for setting up a GIS and producing products in (a) regional/National context (b) national languages (Table of Contents is column No. 2: Data management policy). In the interim: consider the lessons learned as a ‘check list’ for your GIS products!
DISCUSSION:
Are the results going to be accepted at the end of the day? Agree up front about methodologies and willingness to accept a new paradigm.
Uncertainty should be made clear, so that people don’t take products as a ‘bible.’
If you are user oriented, and you have assessed their needs well, many other problems will resolve themselves.
When using data sets from different sources, have an agreement, name the sources.
Even if you agree on everything in a project environment, you need to consider the packaging so that high level (non-science) decision makers appreciate the ‘science’ behind the product, without overwhelming the audience.
Establishing separate GIS units should be carefully considered for they can actually obstruct information flow when they are ‘boxed in’, physically separated from other professionals, in ‘better equipped’ offices, and on a different (‘higher’) pay scale. This can provoke resentment and in-house resistance.
Go back the Table of Contents
Page 7 of 7

SUMMARY OF WORKGROUP RECOMMENDATIONS
TECHNICAL
First, each GIS unit should try to address their own problems, before moving on into a larger arena.
TRAINING
It is difficult to do an in-house training assessment that is perceived as objective. A training network could provide 'outsiders' to assist in producing training assessments.
What training is going on now?
This year, one participant from Cambodia has participated in a GIS training sponsored by Finnish project, a second one participated in an in-house, project –specific training. Last year, Swiss Land Classification Project in Laos conducted training for Lao participants from different institutions to use ArcView.
MRC Project: During last year, MRC conducted two project-oriented training events in Laos, AIT, Cambodia, with regional participation.
How do we bring the recommendations to life? What c an each of our institutions do to contribute to this process?
TECHNICAL HUMAN RESOURCES INSTITUTIONS
Provide open forum for promoting standards
Identify the role and need of GIS in the organization
Support/organize user groups as means of moving forward toward a data clearing house/certifier
Provide annual forum for technical exchanges, case studies, etc.
Analyze organizational, technical and human resources
Organize national level meetings to agree to an action agenda for solving the identified problems
Catalogue datasets, their availability/cost
Design GIS development plan, identify training needs, design training strategies and curricula
Develop ‚manual‘ (using national experiences) with focus on institutional issues for GIS and GIS products
Prepare standards for cataloging data
Implement training, training in-house with local trainers
Provide technical guidelines on data management
Train staff (incl. Managers!) according to their specific needs
Coordinate base data generation, support agencies that have the mandate for base data generation
Build up a training network and exchange work experiences in work group
Promote technical GIS user groups (to develop standards)
Projects/Institutions should coordinate training events
Allocate appropriate budget for introduction and upgrading of GIS training
CAMBODIA
FAO/SR GIS users group foreseen in the very near future at (our) provincial level Publish our experiences Preliminary support to revive a GIS user group (CEIN) that is dysfunctional at the moment Preliminary support for a Meta database
Page 1 of 3

MOE Try and revive a RS/GIS users group (CEIN) originally est. by UNDP/ETAP Try to make sure data sets are made available once they are compiled
LAOS
NAWACOP Establish and provide standards of LUP- Data collection and analysis Conduct training regarding LUP Coordinate with other institutions on LUP Participate in all relevant GIS-workshop/meetings etc Provide technical support Provide LUP-Data (on our project area) Support provinces with Internet Access
SSLCC Can cooperate and provide some information
Nat‘l Univ. of Laos
Provide short training courses but need support on tech. and curriculum development Participate in GIS users group
NAFRI Will work on cataloging data and making them available Provide GIS training
VIETNAM
CNRES Share experience Encourage colleagues to raise standards Share excess capacities at facilities with other institutions
VTGEO Build up a ‚draft‘ standard for discussion among other organizations Provide consulting and short term training in field of RS and GIS application and management Put the training course documentation on Internet for everyone Could contribute to building a national GIS center to set standards and manage data and metadata for Vietnam
WWF/FIPI Link GIS and database Conduct GIS training course Conduct forest monitoring and assessment
NISF Assist to establish national society of resource information technologies that can set data standards, establish guidelines, etc.
THAILAND
RECOFTC Training of Trainers: Process/Methods Method for Organizational assessment: Training needs-design process Advice/Share on training materials development
OTHERS
WRI/USA Support a regional GIS forum through: 1. Funding 2. Support participation of scientists/researchers from outside the region Help to develop methods/standards for land use cover change monitoring (Pathfinder) Carry out/Share GIS-based policy research
SMRP SMRP‘s GIS units in Laos & Cambodia can: 1. Exchange trainees 2. Provide conceptual advice on: Data base management, data documentation, quality control, GIS implementation Provide examples of user-oriented GIS products (how to assess needs, design, assign costs, etc.) Make available support and infrastructure for the establishment of forum and workgroups Facilitate information exchange for forum, workgroups, information system
C. Knie (GIS Consultant)
Assist in assessing GIS needs and analyzing system capabilities Conduct GIS training courses, assist in developing training curricula Assist in compiling databases, - data documentation, - GIS implementation
H. Christ (GIS Consultant)
Participate in user groups and forums Assist in training/guidelines/manual development
Page 2 of 3

FINAL REVIEW OF WORKSHOP OBJECTIVES
� Exchange information � Exchange experiences � Take stock of lessons learned � Identify potentials/constraints for the practical application of GIS/RS in the region � Map out new directions for technologies in forest land and resources management
Go back the Table of Contents
Help organize workshops Provide information on case studies and experiences Assist in raising awareness within GTZ regarding WS recommendations
Page 3 of 3
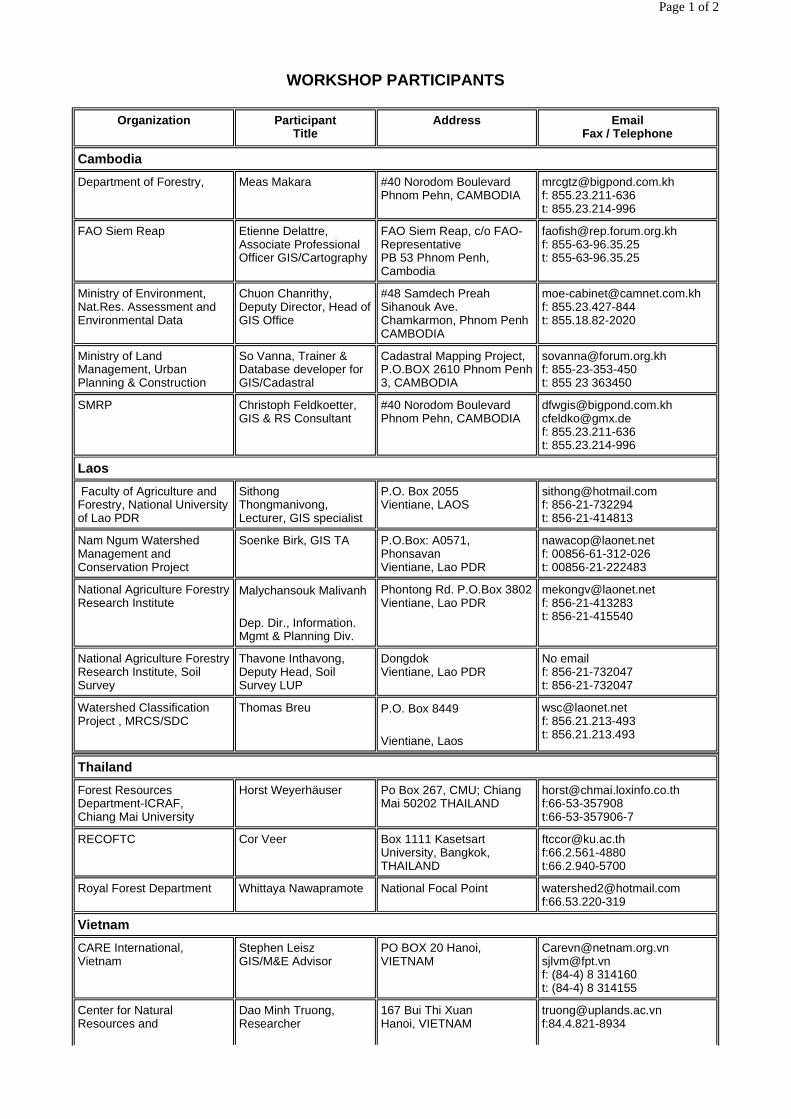
WORKSHOP PARTICIPANTS
Organization Participant Title
Address Email Fax / Telephone
Cambodia
Department of Forestry, Meas Makara #40 Norodom Boulevard Phnom Pehn, CAMBODIA
[email protected] f: 855.23.211-636 t: 855.23.214-996
FAO Siem Reap Etienne Delattre, Associate Professional Officer GIS/Cartography
FAO Siem Reap, c/o FAO-Representative PB 53 Phnom Penh, Cambodia
[email protected] f: 855-63-96.35.25 t: 855-63-96.35.25
Ministry of Environment, Nat.Res. Assessment and Environmental Data
Chuon Chanrithy, Deputy Director, Head of GIS Office
#48 Samdech Preah Sihanouk Ave. Chamkarmon, Phnom Penh CAMBODIA
[email protected] f: 855.23.427-844 t: 855.18.82-2020
Ministry of Land Management, Urban Planning & Construction
So Vanna, Trainer & Database developer for GIS/Cadastral
Cadastral Mapping Project, P.O.BOX 2610 Phnom Penh 3, CAMBODIA
[email protected] f: 855-23-353-450 t: 855 23 363450
SMRP Christoph Feldkoetter, GIS & RS Consultant
#40 Norodom Boulevard Phnom Pehn, CAMBODIA
[email protected] [email protected] f: 855.23.211-636 t: 855.23.214-996
Laos
Faculty of Agriculture and Forestry, National University of Lao PDR
Sithong Thongmanivong, Lecturer, GIS specialist
P.O. Box 2055 Vientiane, LAOS
[email protected] f: 856-21-732294 t: 856-21-414813
Nam Ngum Watershed Management and Conservation Project
Soenke Birk, GIS TA P.O.Box: A0571, Phonsavan Vientiane, Lao PDR
[email protected] f: 00856-61-312-026 t: 00856-21-222483
National Agriculture Forestry Research Institute
Malychansouk Malivanh
Dep. Dir., Information. Mgmt & Planning Div.
Phontong Rd. P.O.Box 3802 Vientiane, Lao PDR
[email protected] f: 856-21-413283 t: 856-21-415540
National Agriculture Forestry Research Institute, Soil Survey
Thavone Inthavong, Deputy Head, Soil Survey LUP
Dongdok Vientiane, Lao PDR
No email f: 856-21-732047 t: 856-21-732047
Watershed Classification Project , MRCS/SDC
Thomas Breu P.O. Box 8449
Vientiane, Laos
[email protected] f: 856.21.213-493 t: 856.21.213.493
Thailand
Forest Resources Department-ICRAF, Chiang Mai University
Horst Weyerhäuser Po Box 267, CMU; Chiang Mai 50202 THAILAND
[email protected] f:66-53-357908 t:66-53-357906-7
RECOFTC Cor Veer Box 1111 Kasetsart University, Bangkok, THAILAND
[email protected] f:66.2.561-4880 t:66.2.940-5700
Royal Forest Department Whittaya Nawapramote National Focal Point [email protected] f:66.53.220-319
Vietnam
CARE International, Vietnam
Stephen Leisz GIS/M&E Advisor
PO BOX 20 Hanoi, VIETNAM
[email protected] [email protected] f: (84-4) 8 314160 t: (84-4) 8 314155
Center for Natural Resources and
Dao Minh Truong, Researcher
167 Bui Thi Xuan Hanoi, VIETNAM
[email protected] f:84.4.821-8934
Page 1 of 2

Go back the Table of Contents
Environmental Studies t:84.4.976-0975
Centre for Remote Sensing and Geomatics, VTGEO
Pham Van Cu, Director
Vu Anh Tuan, Researcher
340 Bach Dang Street
Hanoi, VIETNAM
[email protected] f:84 49 32 0745 t:84 49 32 0746
Forestry Inventory and Planning Institute
Nguyen Manh Cuong, Information Systems Developer
Van Dien, Thanh Tri Hanoi, VIETNAM
No email f:84.4.8612881 t:84.4.8615513
Inst. of Geography, VNCST, Capacity Bldg for Env. Mgt in VN
Eddy. Nierynck, Project Co-Director
Nghia Do, Tu Liem Hanoi, VIETNAM
[email protected] f:84.4.756-3806 t:84.4.756-1427
Institute for Tropical Biology Phu Thanh Do, Researcher Le Buu Thach, Researcher
85 Tran Quoc Toan st., quan 3 Ho Chi Minh City, VIETNAM
f:84-8-9320355 t: 84-8-8202831
Institute of Geography, Vietnam National Centre
Nguyen Dinh Duong, Head, Department of RemoteSensing
Nghi Do, Tu Liem
Hanoi, VIETNAM
No Email f: 84.4.352-483 t: 84.4.358-333
National Institute for Soils and Fertilisers
Ho Quang Duc
Department Head
Tu Liem
Hanoi, VIETNAM
none f:84.4.834-3924 t: 84.4.836-2381
REFAS Project Jörg Balsiger, Consultant
1A Nguyen Cong Tru St. Hanoi, VIETNAM
[email protected] f84.4.821-4766 t:84.4.821-4770
Social Forestry Development Project
Quoc Pham Tuan, Regional Coordinator Phan Minh SangForester
1A Nguyen Cong Tru Hanoi, Vietnam
[email protected] f:84.4.821-4765 t: 84.4.821-4768
WWF Indochina Program Pham Hong Nguyen, Research Officer
Tran Minh Hien Conservation Science& Development Mgr
International P.O. Box 151 7 Yet Kieu street, Hanoi, Vietnam
[email protected] [email protected]
f: 84.4.822-0642 t: 84.4 822-0640
Other
University of Giessen,
Geography Department
Christine Knie, GIS Specialist
Kirsten Möller, Geographer
Senckenbergstr.1
D-35390 Giessen GERMANY
[email protected] [email protected] f:49.641.993-6209 t:49.641.993-6203
WRI, USA Anthony Janetos, Senior Vice President Jake Brunner, Senior Associate
Suite 800, 10 G St, NE Washington, DC 20002
[email protected] [email protected] f:1.202.724-7775 t:1.202.729-7773
Conference Organizers
Workshop Moderator and Coordinator
Herbert Christ Independent Consultant
Liebigstrasse 7 35037 Marburg, GERMANY
[email protected]; [email protected] f: 49.6421.924809 t: 49.6421.22415
Coordinator Michael Glück Technical Advisor
SMRP Tung Shing Square No. 1 Ngo Quyen Hanoi, VIETNAM
[email protected] f: 84.4.829-4885 t: 84.4.829-4885
Page 2 of 2

![USTA TrafficAnalysisBriefing V7 0 20150530 FINAL[1] · PDF file1."Executive"Summary" ... In2014thethreemajorGulfcarriers" –"Emirates,"Qatar"Airways"and"Etihad" Airways"–"carried"some"4.3"million"passengers"intoandout"of"the](https://img.dokumen.tips/doc/110x75/5aa125967f8b9a46238b5bf2/usta-trafficanalysisbriefing-v7-0-20150530-final1-in2014thethreemajorgulfcarriers.jpg)