Embed Size (px)
Citation preview


Application Document Informance System Administration Guide
ii
Disclaimer This document is for informational purposes only and is subject to change without notice. This document and
its contents, including the viewpoints, dates and functional content expressed herein are believed to be
accurate as of its date of publication. However, Epicor Software Corporation makes no guarantee,
representations or warranties with regard to the enclosed information and specifically disclaims any applicable
implied warranties, such as fitness for a particular purpose, merchantability, satisfactory quality or reasonable
skill and care. As each user of Epicor software is likely to be unique in their requirements in the use of such
software and their business processes, users of this document are always advised to discuss the content of
this document with their Epicor account manager. All information contained herein is subject to change without
notice and changes to this document since printing and other important information about the software product
are made or published in release notes, and you are urged to obtain the current release notes for the software
product. We welcome user comments and reserve the right to revise this publication and/or make
improvements or changes to the products or programs described in this publication at any time, without notice.
The usage of any Epicor software shall be pursuant to an Epicor end user license agreement and the
performance of any consulting services by Epicor personnel shall be pursuant to Epicor's standard services
terms and conditions. Usage of the solution(s) described in this document with other Epicor software or third
party products may require the purchase of licenses for such other products. Where any software is expressed
to be compliant with local laws or requirements in this document, such compliance is not a warranty and is
based solely on Epicor's current understanding of such laws and requirements. All laws and requirements are
subject to varying interpretations as well as to change and accordingly Epicor cannot guarantee that the
software will be compliant and up to date with such changes. All statements of platform and product
compatibility in this document shall be considered individually in relation to the products referred to in the
relevant statement, i.e., where any Epicor software is stated to be compatible with one product and also stated
to be compatible with another product, it should not be interpreted that such Epicor software is compatible with
both of the products running at the same time on the same platform or environment. Additionally platform or
product compatibility may require the application of Epicor or third-party updates, patches and/or service packs
and Epicor has no responsibility for compatibility issues which may be caused by updates, patches and/or
service packs released by third parties after the date of publication of this document. Epicor®
is a registered
trademark and/or trademark of Epicor Software Corporation in the United States, certain other countries and/or
the EU. All other trademarks mentioned are the property of their respective owners. Copyright ©
Epicor
Software Corporation 2013. All rights reserved. No part of this publication may be reproduced in any form
without the prior written consent of Epicor Software Corporation.

Application Document Informance System Administration Guide
iii
Informance System Overview ............................................................................................................ 5
What is in this User Guide? ...................................................................................................................... 5
Configuration Features ......................................................................................................................... 6
System Administration Basics ............................................................................................................ 7
Logging In .................................................................................................................................................. 7
Hub vs. Plant Administration .................................................................................................................... 8
The Administration Environment ............................................................................................................. 9
Administration Tabs ........................................................................................................................... 10
Additional Fields ................................................................................................................................. 12
Saving Changes ................................................................................................................................... 13
Reporting Units................................................................................................................................... 14
Hub Administration .......................................................................................................................... 15
Security ................................................................................................................................................... 15
Adding a New System User ................................................................................................................ 16
Editing an Existing System User.......................................................................................................... 17
Deleting a System User ...................................................................................................................... 17
Configuration Features ........................................................................................................................... 18
Plant Administration ........................................................................................................................ 19
Downtime Reasons ................................................................................................................................. 19
Adding a New Downtime Reason / Subreason .................................................................................. 21
Editing an Existing Downtime Reason / Subreason ............................................................................ 25
Deleting an Existing Downtime Reason / Subreason ......................................................................... 25
Defining Standard Downtime Reason Costs ....................................................................................... 26
Products .................................................................................................................................................. 27

Application Document Informance System Administration Guide
iv
Adding a Product ................................................................................................................................ 29
Editing an Existing Product ................................................................................................................. 31
Deleting an Existing Product .............................................................................................................. 31
Defining Standard Part Costs.............................................................................................................. 32
Users ....................................................................................................................................................... 33
Adding a New User ............................................................................................................................. 34
Editing an Existing User ...................................................................................................................... 35
Deleting an Existing User .................................................................................................................... 35
Defect Reasons ....................................................................................................................................... 36
Adding a New Defect Reason / Subreason ......................................................................................... 37
Editing an Existing Defect Reason / Subreason .................................................................................. 40
Deleting an Existing Defect Reason / Subreason ............................................................................... 40
Additional Fields ................................................................................................................................. 41
Configuration Features ....................................................................................................................... 41
Data Management Console .............................................................................................................. 42
The DMC Environment ........................................................................................................................... 43
Data Selection .................................................................................................................................... 46
Editing Data ............................................................................................................................................ 47
Splitting Data ...................................................................................................................................... 48
Merging Data ...................................................................................................................................... 49
Editing Within the Grid ....................................................................................................................... 51
Adding and Updating Notes ............................................................................................................... 51
Notifications and Validation ............................................................................................................... 52

Application Document Informance System Administration Guide
5
The Informance Plant Solution – Discrete Edition is a suite of products focusing on performance
tracking of discrete applications within a plant. The System Administration service is one of several
modules that make up the overall solution. It provides access to all of the basic system settings and
lists that drive operator entry and plant reporting.
The System Administration service is web-based allowing configuration of the Informance system
throughout the plant and the enterprise. It includes a standard user / role / privilege scheme that
provides security and limits access to sensitive features if needed.
This guide begins by covering the basics of System Administration – Logging in, Hub and Plant
features and the Administrative Environment. It introduces you to the core concepts of System
Administration and the basic navigation of the application.
The second chapter discusses Hub Administration which includes features affecting all plants within
your Informance system. You will use the Hub features primarily to manage the list of reporting
and admin users and their levels of access within the Informance applications.
The next chapter, Plant Administration, covers the most heavily used portion of the System
Administration service. These are the features that allow you to edit the lists of downtime reasons,
defect reasons, products, etc for every asset within a plant.

Application Document Informance System Administration Guide
6
As you review the chapters on Hub and Plant Administration, you will find that both of these
sections close with a review of Configuration Features. Configuration Features represent additional
tabs within the System Administration site that are used during initial setup and installation of
Informance, but are not exposed for general customer access. These include features such as New
Plant and New Asset creation and the definition of new Tagging Fields and new Reason Sets.
These settings tend to be fixed after installation and can cause significant system errors if they are
improperly adjusted. In order to protect the integrity of your Informance system, these features are
typically suppressed for the customer. Similarly, you will find that this user guide provides
awareness of these features but does not give any detailed instruction on their use.

Application Document Informance System Administration Guide
7
The first step in accessing the System Administration service is logging in to your Administration
Web Site. To log in, you must first obtain the following information from your Informance system
owner.
The URL or web address for your Informance Log In screen
The unique username that has been setup for you in the system
The password that has been setup for you in the system
If your site has implemented the web Single Sign On feature of System
Administration, then logging in will be handled automatically. Single Sign on passes
your credentials from the Windows Domain to Informance and authenticates your access
with that information. Therefore, you will bypass the login screen and be taken directly
into the application.
Once you have this information, open Internet Explorer and navigate to the address you were
provided for logging in. The following screen will appear:
Figure 1: Informance Logon Screen

Application Document Informance System Administration Guide
8
Enter your Username and Password in the boxes provided and click the Log In button. If your
entries match a valid user profile in the system, you will be taken to the Plant Selection page. Your
plant list will include the Hub as well as each plant in your system. Select one and click the GO
button to enter the System Administration site.
If your access has been limited to only the Hub or a specific Plant, then you will bypass
the Plant Selection page and be taken directly into the System Administration site.
If you are the only Informance user that will access System Administration from a specific computer,
you can check the box labeled Remember Me on this Computer. If this box is checked and your
username and password are approved, they will be saved as the default profile for this computer.
On subsequent logins, you will bypass this screen and be taken directly to the Plant Selection page.
If you wish to ‘undo’ the Remember Me on this Computer setting to allow the log in
screen to appear, you must delete the cookie for this site. Within Internet Explorer, cookies
can be deleted by selecting ‘Internet Options’ from the ‘Tools’ drop-down menu. Under the
‘General’ tab of ‘Internet Options’ you will find a button labeled ‘Delete Cookies’.
There are two primary areas of system administration: Hub and Plant. Hub administration covers
those settings that are global to all plants in the system. For the customer, these features focus on
management of the system users that can access Plant Reporting and System Administration. At the
Hub you will be able to create new system logins, set their passwords and assign each user a role
that determines their level of access within the software. The configuration features for the Hub
include the definition of system databases and the creation of additional fields.
Plant administration focuses on those settings that are specific to each plant. This primarily involves
the management of all tagging sets (Downtime Reasons, Products, etc). When selecting a plant,
you will be provided an interface to add, edit or delete any entry in the tagging sets for that plant.
The configuration features for the Plant include the definition of new assets and new tagging sets
as well as the management of the Super Reason list and all shift schedules.
If you have access to the Hub and one or more plants within your Informance system, you will be
prompted to select from this list after logging in to System Administration. If your login has access
to the Hub, it will be the first selection in the drop-down list, followed by each plant that your login
can access. If your access has been limited to a single plant or the hub only, you will bypass this
selection and be taken directly to that administration interface.

Application Document Informance System Administration Guide
9
Figure 2: Informance Plant Selection
The System Administration interface has a similar look and feel to the other Informance application
components. Features are organized into tabs and you can navigate the interface by clicking on
any option in the navigation panel to bring its tab to the foreground. The active tab can always be
identified as it will have a dark blue background and the tab title will be at the top of the page.
The remaining inactive tabs will be light gray with the tab titles listed in normal text.

Application Document Informance System Administration Guide
10
Figure 3: Administrative Interface when the Defect Reasons Tab is Active
Within each tab, the presentation of tagging sets and the various tools to manage that set is fairly
consistent. You will find a Bread Crumb above the currently displayed list which indicates your
current level in a set. Some lists are flat but others like the downtime and defect reasons are multi-
level hierarchies, so the bread crumb is an important reference as you drill into any set. Each
segment in the bread crumb is clickable as a way of navigating back to that level in the hierarchy.
The Save and New buttons are common to all tabs. You will always find these located in the upper
left corner above the displayed list of entries.
The far right colum labeled Actions will contain Edit ( ) and Delete ( ) buttons for each entry.
Remember that edits and deletions are not permanent until you click the Save button ( ) in
the upper left corner.

Application Document Informance System Administration Guide
11
Figure 4: Components of System Abdministration Screen
As described, tagging sets can be multi-level and navigation within the set structure is driven by
hyperlinks. Each set is presented as a hyperlink such that clicking on any set name will drill you into
the list of entries within that set. In the case of defect and downtime reasons, you can drill in two
and four levels deep, respectively. At each level the list is presented as hyperlinks until you reach
the lowest level. Again, the bread crumb of the list will always indicate your current position within
a set.
Figure 5: Example of Tagging Set Links

Application Document Informance System Administration Guide
12
One of the most powerful features of the Informance Plant Solution is the customizable Additional
Fields. Customers can go beyond the traditional downtime reason, part and user tags and define an
unlimited number of new tagging fields.
Unlike the 4 standard tagging fields, these additional fields can be named by you using your specific
terminology. You can define a ‘Batch’ field, for example, to tag your data according to a unique
Batch ID; or a ‘Crew Size’ field to track the number of operators on a line during different periods
of production.
If you have defined additional fields for your Informance system, they will be presented as
additional tabs within the system administration interface.
Figure 6: Standard and Additional Tabs
The example system used throughout this user guide has one additional field called ‘Batch’ which
you will see in each image of the system administration interface (see example below). Again, the
Batch field is not standard and you may not have such a tab in your system. It is used within this
guide strictly to illustrate the possible presence of additional fields and thus additional tabs within
the System Administration interface.

Application Document Informance System Administration Guide
13
Figure 7: System Administration Interface with Additional Field Called ‘Batch’
Within the Informance System Administration module, it is important to understand how changes
are saved and exactly what happens in the software whenever the save link ( ) is clicked on
any tab. When working within a tab, for example the Downtime Reasons tab, the interface allows
you to add, delete or edit any of the lists. And, although you see your changes appear within that
tab as you make them, they are not actually committed to the system until the save link is clicked.
So if you were to close your browser or log out of the system without saving, all of your changes
would be lost.
Entries that have been added but are unsaved appear in Italics. Once the Save
button is pressed and the changes have been saved, the entry appears in normal text.
Whenever a save button ( ) is clicked on any tab, both the data collection and IFA (operator
entry) services will be recycled. This allows them to pull all lists and configuration settings fresh
from the database and publish any changes you have made. Although this does not cause any loss
of data collection, it does temporarily disable some operator entry features until the recycle is
complete.
Specifically, during a recycle of the software, the asset status buttons are not updated and will be
turned gray instead of the usual red or green color reflecting the state of the line (see image
below). This is a visual indicator to the operator that system updates are in process. Also, no new
downtime events are published into the operators event history during a recycle.
Typical red/green status buttons when software is running. Status buttons turn gray during a software recycle.

Application Document Informance System Administration Guide
14
The time it takes to complete a recycle will vary depending upon the size of the system. Most
recycles take 3-4 minutes, but it can be longer if your system has many assets and/or very large
downtime reason or product lists. For this reason, it is recommended that you click save only once
after all of your changes have been made as opposed to saving after each edit. This will limit the
disruptions to the operator interface.
As you have probably learned by now, Informance’s data collection focuses on production counts
taken at various points in a manufacturing process. In many applications, the units counted at each
monitoring point are different and tend to scale up as product moves through the process.
For example, consider a manufacturing line used to package liquid laundry detergent. First the
individual bottles are filled, capped and labeled. Then multiple bottles are grouped into cartons,
the cartons are grouped into cases, and the cases are finally stacked onto pallets.
To fully monitor this application on all assets with defect tracking, Informance would need to
monitor the counts at several locations. Further, a mechanism must exist to allow these different
counts to be reconciled based on a common elementary unit. This is where Reporting Units come
in.
Reporting Units provide the means to represent production counts in different scales. Each asset in
your Informance database can have a unique set of units or multiple assets can share a set. The
reporting units can be global to the asset or vary by part depending upon the needs of the
application.
Although Reporting Units help facilitate those applications where several monitoring points are
used, they can also be applied to applications with just a single monitoring point. If your
application just uses a single cycle count with no additional sensors for defect tracking, you may still
use Reporting Units to scale those cycle counts as needed.

Application Document Informance System Administration Guide
15
When selecting the Hub in System Administration, you will be presented with a single
administration tab labeled Security. This tab provides features allowing you to add, edit and delete
system users.
Within the Security tab of the Hub Administration, you will manage the list of system users – the
active logins that are used to access the Plant Reporting and System Administration web sites. The
Security tab has two sub-tabs: Users and Roles. The Users sub-tab allows you to manage the list of
system users; the Roles tab provides information on the access of each role. It is recommended that
you not adjust role security or define new roles without first consulting your Informance services
engineer.
Figure 8: Hub Informance Users Screen

Application Document Informance System Administration Guide
16
To create a new system user, click the New User button ( ) in the upper left corner of the
Users list to open the New User dialog box.
Figure 9: Adding a New User Screen
Fill out all fields in the New User dialog box:
Login: Enter the username that will be used when logging in to Plant Reporting or System
Administration. Logins must be unique and they cannot exceed 100 characters in length.
Role: Assign this user to one of the defined roles for your system. Again, it is strongly
recommended that you use the ‘Administrator’ role as this will expose the Configuration
Features of the software.
Password / Confirm Password: Enter a password for this user and confirm it in the box below.
Passwords must be at least 6 characters in length and no more than 100 characters.
Plants: Each user must be assigned to at least one plant. Select the plants from the UnAssigned
column by clicking on them, and then use the arrow buttons in the center to move the selected
plants to the Assigned column.
After completing the form, click the OK button in the lower right corner to close the dialog box.
You will see your new user in the displayed list; however it is not yet saved. You must click the Save
button ( ) in the upper right corner of the screen to save your new entry. If you log out of
System Administration or close your web browser without first clicking save, the new entry will lost.

Application Document Informance System Administration Guide
17
To edit the properties of an existing user, click the edit button ( ) for that user in the far right
column of the list. The Edit dialog box will appear with the current settings populated in each field.
Figure 10: Edit System User Screen
Simply edit the properties as needed and click the OK button in the lower right to close the Edit
User dialog box. The same rules and restrictions described above for new users also apply to editing
an existing user; the one exception is the Login property which cannot be edited after the user is
created. Again, the edits you make are not saved until you click the Save button ( ) in the
upper right corner.
To remove a User, click the delete button ( ) for that user in the far right column. After clicking
delete, the entry will immediately be removed from the displayed list. You must confirm your
deletions by clicking the Save button ( ) in the upper left corner. If you close your browser
or log out without saving, your deletions will be restored.

Application Document Informance System Administration Guide
18
As discussed in the opening section of this user guide, the System Administration interface contains
additional Configuration Features that are used by the installing engineer to define the basic
elements of your Informance system. Following installation, these settings are rarely adjusted and
therefore they are not included in the standard customer administration role.
In the Hub administration, these configuration features include a Connections tab used to define
new databases for the system and an Additional Fields tab used to create new tagging fields.
Again, it is strongly recommended that you assign any new users to the customer role that has been
configured and not provide anyone these full administrative privileges. Improper adjustments to
these settings could have serious consequences within the Informance system.
Figure 11: Hub Administration with Configuration Features Exposed

Application Document Informance System Administration Guide
19
When selecting a plant in System Administration, you will be presented with a set of administration
tabs representing the different event tagging categories: Downtime Reasons, Defect Reasons,
Products, Users and any additional fields that may be configured within your system. Within each
tab you will find the different tagging sets that have been defined for that plant as well as the tools
to add, edit and delete the entries within any set.
Within the Downtime Reasons tab, you will manage the different sets of downtime reasons that
exist within your system. Like all event tagging categories, downtime reasons are organized into
sets. A downtime reasons set consists of a reason and subreason hierarchy that can be defined up
to four levels deep with unlimited reasons at each level. Each set also encompasses the Color
assignments, the OPC Codes that can be mapped to each reason and subreason for auto-tagging
and the Super Reason mappings. Upon navigating to the Downtime Reasons tab, the list of
downtime reasons sets within the plant will be displayed.
Figure 12: Downtime Reasons Tab
Hyperlinks provide the navigation within the Downtime Reasons tab and you will notice that each
downtime reason set is presented as a hyperlink. Clicking any Reason Set will take you into that set,
first displaying the list of top level reasons. The name of the reason set you have drilled into will
appear above the reason list. The image below shows the list of reasons within a Reason Set
labeled ‘Lines 1-2 DT Reasons’.

Application Document Informance System Administration Guide
20
Figure 13: Second Level Downtime Reasons
You will note that the downtime reasons with the set are also presented as hyperlinks. Clicking on
any downtime reason will navigate you to the list of second level subreasons beneath that reason.
Above the subreason list you will see both the Reason Set and parent Reason of the subreason list.
The image below shows the list of subreasons for a reason called ‘Capper’ within a reason set called
‘Lines 1-2 DT Reasons’.
Figure 14: Example list of Subreasons
This type of hyperlink drill-in navigation allows you to move through all four reason-subreason
levels of each reason set. At the fourth level that list will be displayed without hyperlinks indicating
that you have reached the lowest point in the hierarchy. At any level, you can click the All Sets link
above the list to drill all the way back out and return to the list of Reason Sets.
As each level of reasons or subreasons is presented, the table will also list the OPC Codes, Color, and
Super Reason that have been mapped to each item in the list. The far right column provides
buttons to edit or delete each reason. In the upper right corner above the list is a button to add a
new reason at your current level.

Application Document Informance System Administration Guide
21
As described above, each Reason Set is structured as four-level hierarchy of downtime reasons. The
New Reason button ( ) in the upper left corner of the tab allows you to add a reason to
the currently displayed level in the hierarchy. So before adding a new downtime reason or
subreason, you must first drill-in to the reason set and display the reason or subreason level where
this new reason should be placed.
For example, to add a second-level subreason to the ‘Capper’ reason, that list of subreasons must
first be displayed by clicking on the reason set and then the ‘Capper’ reason.
Upon clicking the New Reason button ( ) in the upper left corner, the New Reason
dialog box will appear.
Figure 15: New Sub Reason Screen

Application Document Informance System Administration Guide
22
To create your new reason or subreason, first enter the name of this new entry in the Reason box of
the new reason dialog. The reason name is the only required field within the New Reason dialog;
OPC Code, Color, Super Reason and Expected Event Duration are optional.
Be aware that reasons and subreasons cannot exceed 20 characters in length. If you exceed 20
characters, your entry will not be accepted and the following error message will appear prompting
you to correct it:
If you wish to assign OPC Codes for auto-tagging, those integer codes can be entered into the OPC
Code field. To assign multiple integer codes to this new reason, enter the codes as a comma-
separated list (i.e. 2, 4, and 15,138). If you will not be assigning an OPC Code, simply leave the field
blank. Do not enter an OPC Code of 0 as it is a reserved value and will not be accepted.
You can assign a color to this reason which will be used in all charts and graphs in the Plant
Reporting module. Any reason that does not have an explicit color assignment will be assigned a
color from the default palette based on its order of precedence in that specific chart. So without a
specific color assignment, the Plant Reporting module will most likely assign a different color to the
reason from day to day and chart to chart. To assign a color to your new reason, click on the paint
bucket then select a color from the pop-up color palette.
Figure 16: Downtime Reason Color Assignment
To assign a color, click on the paint bucket then select a color from the pop-up color palette.

Application Document Informance System Administration Guide
23
In the Cost per Minute field, enter the costs per minute for downtime caused by this downtime
reason. The Financial Analysis and Financial Timeline tabs use these values as part of the calculation
(downtime costs per minute * time down) to determine the financial impact downtime has on your
business.
The next field to complete for a new reason is the Super Reason assignment. Click the Super Reason
drop-down box to select the appropriate Super Reason for this entry or leave the field blank if you
do not intend to map it.
Super Reason mappings are not inherited at lower levels. In other words, if
you were to map a Level 1 Reason called ‘Capper’ to a Super Reason named ‘Mechanical
Downtime’, the Level 2, 3 and 4 subreasons beneath ‘Capper’ would not automatically be
mapped to this same Super Reason. Every reason has its own explicit mapping to a Super
Reason regardless of which level it resides in the hierarchy. The Super Reason of
‘Mechanical Downtime’ would be applied in this example to a downtime event that had
been tagged as ‘Capper’ with all subreason levels left blank.
The last parameter you can set for a new reason is the Expected Event Duration. This parameter
will define your expected duration for a downtime event that is tagged to this reason. When the
expected duration has elapsed, the operators will be notified by a color change in the operator
interface (IFA).
For example, let’s assume you created a reason called ‘Changeover’ with an expected event
duration of 20 minutes. Then assume that your production line stops and the operator selects the
new ‘Changeover’ downtime reason within the Informance operator entry screen to tag the current
downtime event. Now that the event has been tagged, the expected duration is in effect. As the
20 minute duration approaches, the buttons on the operator interface will turn yellow as a warning
to the operator. Should the event exceed 20 minutes, the buttons will turn red. Once the line
begins running again and the downtime event ends, the operator screen will return to its normal
color.

Application Document Informance System Administration Guide
24
Event duration is about to elapse (buttons turn yellow).
Event duration has elapsed (buttons turn red).
After completing the New Reason dialog, click the OK button at the bottom to close it. Your new
reason will now appear in the displayed list. However, IT IS NOT YET SAVED. You must click the
Save button ( ) in the upper left corner to save your new entry into the reason set. If you
log out of System Administration or close your web browser without clicking save first, your entry
will be lost. If you try to navigate to another tab without saving changes, you will be prompted to
save first.

Application Document Informance System Administration Guide
25
To edit the name, OPC Codes, Color, Costs per Minute or Super Reason assignment of an existing
reason, click the edit button ( ) for that reason in the far right column of the list. The Edit dialog
box will appear with the current settings populated in each field.
Figure 17: Edit Downtime Sub Reason Screen
Simply edit the fields as needed and click OK to close the edit dialog box. The same rules and
restrictions mentioned above for creating a New Reason also apply when editing a reason:
Reasons cannot exceed 20 characters
The OPC Code, Color, Super Reason and Expected Event Duration fields are optional and the OPC
Code must be greater than 0. If you need to assign multiple OPC Codes, enter them as a comma-
separated list (i.e. 2, 4, 5, 6, 23).
You must click the Save button ( ) after editing a reason in order for your changes to be
saved.
To remove a reason, click the delete button ( ) for that reason in the far right column. After
clicking delete, the entry will immediately be removed from the displayed list. You must confirm
your deletions by clicking the Save button ( ) in the upper left corner. If you close your
browser or log out without saving, your deletions will be restored.

Application Document Informance System Administration Guide
26
You can define a default standard cost for all downtime reasons. If you define standard costs, any
downtime reason without a defined cost will automatically use this cost. However, any downtime
reason with a specified cost will use the cost defined for it and not the standard cost.
You can also define standard costs for performance loss due to slow performance.
Standard downtime costs can be defined at one of the downtime reason sublevels. The link does
not appear at the top level of downtime reason.
To set standard downtime reason costs, click the Standard Costs button ( ) in the upper
left corner of the tab.
Figure 18: Downtime Reason Standard Costs Screen
To assign a default cost per minute of downtime, enter the cost in the Default Cost per Downtime
Minute field. This value will apply to all downtime reasons that do not have downtime costs
assigned to them. If a downtime reason has a defined cost, that cost will be used when calculating
the costs of the downtime.
The downtime cost is used in the Financial Analysis and Financial Timeline tabs as part of the
calculation to analyze the financial impact of downtime events.
To assign a default cost per minute caused by production slows; enter the cost in the Cost per
Performance Loss Minute field.
Performance loss is measured by comparing the actual recorded production count to the defined
ideal count for the produced part. For example, a line running Part X with an ideal rate of 1000
units per hour runs for 60 minutes but only produces 900 units. That would indicate a performance
loss of 10% or effectively 6 minutes of loss due to slow performance.
In our financial reports, these calculated lost minutes due to performance are shown along with
actual downtime minutes to show the full picture of losses.

Application Document Informance System Administration Guide
27
- The cost values in this screen must be entered with two decimal places.
After completing the Standard Costs dialog, click the OK button at the bottom to close it. However,
IT IS NOT YET SAVED. You must click the Save button in the upper left corner to save your new
entry into the reason set. If you log out of System Administration or close your web browser
without clicking save first, your entry will be lost. If you try to navigate to another tab without
saving changes, you will be prompted to save first.
Within the Products tab, you will manage the different Product sets that exist within your system.
Like all event tagging categories, Parts are organized into sets. However, the sets are flat lists of
parts not multi-level hierarchies like Downtime and Defect Reasons.
When you first navigate to the Products tab, all Product sets for the plant will be presented along
with the Number of Parts within each set and the name of its Reporting Unit Set.
Figure 19: Products Tab
Each Product Set is listed as a hyperlink and clicking on the name of any set will drill you in to the
list of Parts within that set. The image below shows the list of Parts within a product set called
‘Line1 Products’.

Application Document Informance System Administration Guide
28
Figure 20: Example of Parts list within a Part Set
Above the list of parts you will see the name of the Product Set, in this case ‘Line1 Products’, as well
as an All Sets link which will navigate you back up to the list of Product Sets when clicked.
Along with the name of each part in the product set, you will also find the values for each property
of the part. Parts are a unique tagging field within Informance in that their properties like Ideal
Rate determine key calculations within the reporting like Performance and OEE.

Application Document Informance System Administration Guide
29
When viewing the parts within a product set, the New Part button ( ) will be visible in the
upper left corner. Clicking it will open the New Part dialog box allowing you to define a new part for the
set.
Figure 21: New Part Creation Screen
To complete the New Part form, first fill out the properties section:
Name - The name of the new part as it will appear in the operator interface and the analytics.
Part names cannot exceed 50 characters.
Description - A description for that part which cannot exceed 255 characters.
Status - Status of the item. The status for a new part defaults to active. To make the part
inactive, click the Inactivate link.

Application Document Informance System Administration Guide
30
Ideal Rate - The number of elementary units of this product that would ideally be produced in
an hour of uptime. This is a required field and must be an integer representing the ideal
production rate in elementary units per hour.
Major DT - If you are using Informance’s Variable Thresholds by Part setting, then enter the
part-specific major downtime threshold in this field; otherwise enter a 0. Variable thresholds
are only used when there is a wide range of run rates on an asset. Most users will enter a 0
here.
Minor DT - If you are using Informance’s Variable Thresholds by Part setting, then enter the
part-specific minor downtime threshold in this field; otherwise enter a 0. Variable thresholds
are only used when there is a wide range of run rates on an asset. Most users will enter a 0
here.
OPC Code - If you are auto-tagging the part through the assets PLC or control system, then
enter the integer code here that will represent this part. If the PLC will use multiple OPC Codes
to auto-tag this part, then enter the codes as a comma-separated list (i.e. 2,8,37,124). If you are
not auto-tagging the part, then leave this field blank. Do not enter an OPC Code of 0 as it is a
reserved value and will not be accepted.
Cost per Elementary Unit: Enter the costs of producing one unit of this product. The part cost is
used in the Financial Analysis and Financial Timeline tabs as part of the calculation to analyze
the financial impact of product events such as defect creation.
Below the properties section you will find the Conversion Factors section for each reporting unit.
Unlike the properties section which is standard for all parts, the list of reporting units are specific to
your application and can vary by part set.
It is important to remember that the values you enter for each conversion factor represent the
number of elementary units per reporting unit for that part. For example, the image above shows
reporting units of Bottle, Carton and Case where Bottle is the elementary unit. If a specific part
within this set were packaged as 6 bottles per carton and 2 cartons (12 bottles) per case, the
conversion factors would be 1 for bottle, 6 for carton and 12 for case.
After completing the New Part dialog, click the OK button at the bottom to close it. Your new part
will now appear in the displayed list. However, IT IS NOT YET SAVED. You must click the Save
button ( ) in the upper left corner to save your new entry into the product set. If you log
out of System Administration or close your web browser without clicking save first, your entry will
be lost. If you try to navigate to another tab without saving changes, you will be prompted to save
first.

Application Document Informance System Administration Guide
31
To edit the properties or conversion factors of an existing part, click the edit button ( ) for that
part in the far right column of the list. The Edit dialog box will appear with the current settings
populated in each field.
Figure 22: Edit Part Screen
Simply edit the properties or conversion factors as needed and click OK to close the Edit Part dialog
box. The same rules and restrictions described above for new parts also apply to editing an existing
part. Again, the edits you make are not saved until you click the Save button ( ) in the
upper left corner.
To remove a part, click the delete button ( ) for that part in the far right column. After clicking
delete, the entry will immediately be removed from the displayed list. You must confirm your
deletions by clicking the Save button ( ) in the upper left corner. If you close your browser
or log out without saving, your deletions will be restored.

Application Document Informance System Administration Guide
32
You can define a default standard cost for all products. If you define standard costs, any product
without a defined cost will automatically use this cost. However, any product with a specified cost
will use the cost defined for it and not the standard cost.
To set standard product costs, click the Standard Costs button ( ) in the upper left
corner of the tab.
Figure 23: Product Standard Costs Screen
To assign a default cost per elementary unit of the product, enter the cost in the Default Cost per
Elementary Unit field. This value will apply to all products that do not have costs assigned to them.
If a product has a defined cost, that cost will be used when calculating the costs of production
events such as defects.
The product cost is used in reports such as the Financial Analysis and Financial Timeline tabs as part
of the calculation to analyze the financial impact of product defects.
- The cost values in this screen must be entered with two decimal places.
After completing the Standard Costs dialog, click the OK button at the bottom to close it. However,
IT IS NOT YET SAVED. You must click the Save button in the upper left corner to save your new
entry . If you log out of System Administration or close your web browser without clicking save
first, your entry will be lost. If you try to navigate to another tab without saving changes, you will
be prompted to save first.

Application Document Informance System Administration Guide
33
Within the Users tab, you will manage the different User sets that exists within your system. Like all
event tagging categories, Users are organized into sets, however, the sets are flat lists of users not
multi-level hierarchies like Downtime and Defect Reasons.
When you first navigate to the Users tab, all User sets for the plant will be presented along with the
Number of Users within each set.
Figure 24: Users Tab
Each User Set is listed as a hyperlink and clicking on the name of any set will drill you in to the list of
Users within that set. The image below shows the list of Users within a set called ‘All Packaging
Operators’.
Figure 25: Users List
Above the list of users you will see the name of the User Set, in this case ‘All Packaging Operators’,
as well as an All Sets link which will navigate you back up to the list of User Sets when clicked.
Along with the name of each user in the set, you will also find the values for each property of the
user. Users have two optional properties: Description and OPC Code.

Application Document Informance System Administration Guide
34
When viewing the users within a user set, the New User button ( ) will be visible in the
upper right corner. Clicking it will open the New User dialog box allowing you to define a new
entry for the set.
Figure 26: Add New User Screen
To complete the New User form, first fill out the form:
Name - The name of the new user as it will appear in the operator interface and the analytics.
User names cannot exceed 50 characters.
Description - An optional description for that user which cannot exceed 255 characters.
OPC Code - If you are auto-tagging the user through the assets PLC or control system, then
enter the integer code here that will represent this new user. If the PLC will use multiple OPC
Codes to auto-tag this user, then enter the codes as a comma-separated list (i.e. 2,8,37,124). If
you are not auto-tagging the user, then leave this field blank. Do not enter an OPC Code of 0
as it is a reserved value and will not be accepted.
After completing the New User dialog, click the OK button at the bottom to close it. Your new user
will now appear in the displayed list, however, IT IS NOT YET SAVED. You must click the Save
button ( ) in the upper left corner to save your new entry into the user set. If you log out of
System Administration or close your web browser without clicking save first, your entry will be lost.
If you try to navigate to another tab without saving changes, you will be prompted to save first.

Application Document Informance System Administration Guide
35
To edit the properties of an existing user, click the edit button ( ) for that user in the far right
column of the list. The Edit dialog box will appear with the current settings populated in each field.
Figure 27: Edit User Screen
Simply edit the properties as needed and click the OK button in the lower right to close the Edit
User dialog box. The same rules and restrictions described above for new users also apply to editing
an existing user. Again, the edits you make are not saved until you click the Save button
( ) in the upper left corner.
To remove a User, click the delete button ( ) for that user in the far right column. After clicking
delete, the entry will immediately be removed from the displayed list. You must confirm your
deletions by clicking the Save button ( ) in the upper left corner. If you close your browser
or log out without saving, your deletions will be restored.

Application Document Informance System Administration Guide
36
Within the Defect Reasons tab, you will manage the different sets of defect reasons that exist
within your system. Like all event tagging categories, defect reasons are organized into sets. A
downtime reasons set consists of a reason and subreason hierarchy that can be defined up to two
levels deep with unlimited reasons at each level. Each set also encompasses the Color assignments
and OPC Codes that can be mapped to each reason and subreason for auto-tagging. Upon
navigating to the Defect Reasons tab, the list of defect reasons sets within the plant will be
displayed.
Figure 28: Defect Reasons Tab
Hyperlinks provide the navigation within the Defect Reasons tab and you will notice that each
defect reason set is presented as a hyperlink. Clicking any Reason Set will take you into that set,
first displaying the list of top level reasons. The name of the reason set you have drilled into will
appear above the reason list. The image below shows the list of reasons within a Reason Set
labeled ‘Manual’.
Figure 29: Defect Reason List

Application Document Informance System Administration Guide
37
You will note that the defect reasons within the set are also presented as hyperlinks. Clicking on
any defect reason will navigate you to the list of subreasons beneath that reason. Subreason is the
lowest level in the defect reason hierarchy, therefore the subreasons will not be listed as hyperlinks
indicating that there is no further drill-in. At either the reason or subreason level you can drill back
out to the list of reasons sets by clicking the All Sets link above the list.
Above the subreason list you will see both the Reason Set and Reason that you have drilled into.
The image below shows the list of subreasons for a reason called ‘Operator Pick-Off’ within a reason
set called ‘Manual’.
Figure 30: Defect Subreason List
As described above, each Reason Set is structured as two-level hierarchy of defect reasons. The New
Defect Reason button ( ) in the upper right corner of the tab allows you to add a
reason to the currently displayed level in the hierarchy. So before adding a new defect reason or
subreason, you must first drill-in to the reason set and display the level where this new reason
should be placed.
For example, to add a subreason to the ‘Operator Pick-Off’ reason, that list of subreasons must first
be displayed by clicking on the reason set and then the ‘Operator Pick-Off’ reason.

Application Document Informance System Administration Guide
38
Upon clicking the New Defect Reason button ( ) in the upper right corner, the New
Reason dialog box will appear. At a minimum, you must enter the name for this new defect reason
in the Reason box provided. Remember that reasons and subreasons cannot exceed 20 characters in
length.
Figure 31: New Defect Reason Screen
The OPC Code is an optional field used to support automatic tagging of the defect reason from the
asset’s PLC or control system. In this field, enter the integer that the control system will use as an
alias for this downtime reason. To assign multiple integer codes to this new reason, enter the codes
as a comma-separated list (i.e. 2,4,15,138). If you will not be assigning an OPC Code, simply leave the
field blank. Do not enter an OPC Code of 0 as it is a reserved value and will not be accepted.
You can assign a color to this reason which will be used in all charts and graphs in the Plant
Reporting module. Any reason that does not have an explicit color assignment will be assigned a
color from the default palette based on its order of precedence in that specific chart. So without a
specific color assignment, the Plant Reporting module will most likely assign a different color to the
reason from day to day and chart to chart. To assign a color to your new reason, click on the paint
bucket then select a color from the pop-up color palette.

Application Document Informance System Administration Guide
39
Figure 32: Defect Reason Color Selection
To assign a color, click on the paint bucket then select a color from the pop-up color palette.
After completing the New Reason dialog, click the OK button at the bottom to close it. Your new
reason will now appear in the displayed list. However, IT IS NOT YET SAVED. You must click the
Save button ( ) in the upper left corner to save your new entry into the reason set. If you
log out of System Administration or close your web browser without clicking save first, your entry
will be lost. If you try to navigate to another tab without saving changes, you will be prompted to
save first.
Application Document Informance System Administration Guide
40
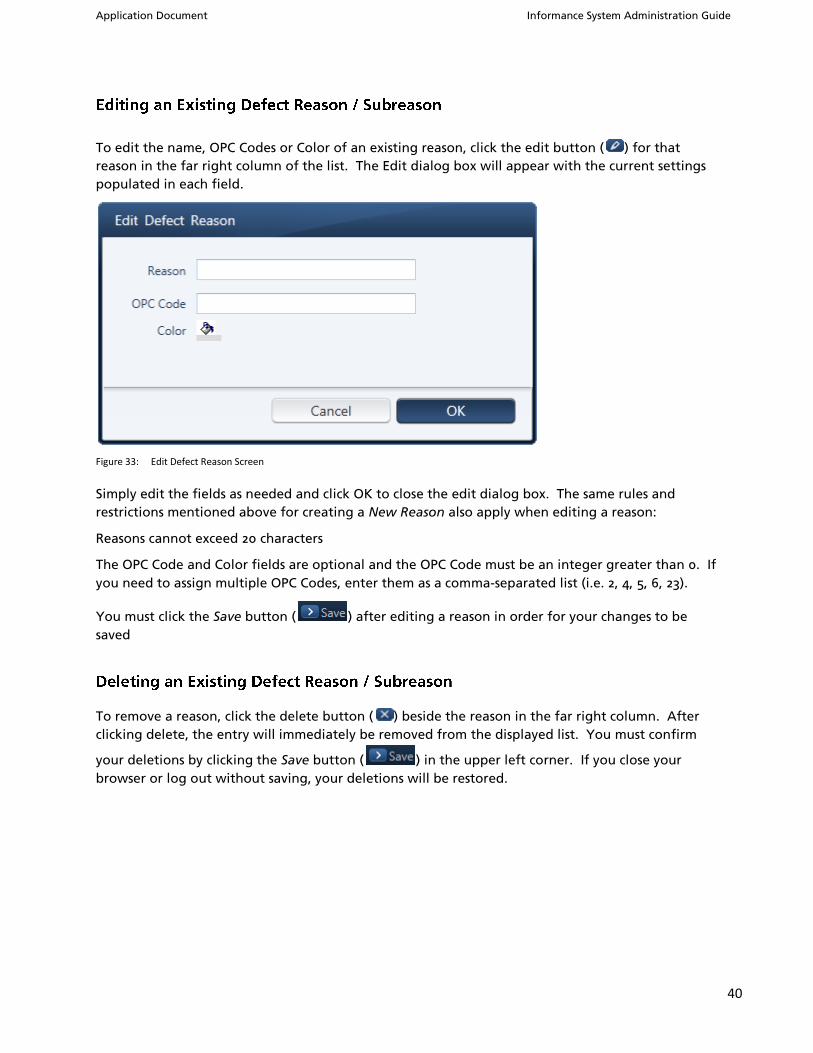
To edit the name, OPC Codes or Color of an existing reason, click the edit button ( ) for that
reason in the far right column of the list. The Edit dialog box will appear with the current settings
populated in each field.
Figure 33: Edit Defect Reason Screen
Simply edit the fields as needed and click OK to close the edit dialog box. The same rules and
restrictions mentioned above for creating a New Reason also apply when editing a reason:
Reasons cannot exceed 20 characters
The OPC Code and Color fields are optional and the OPC Code must be an integer greater than 0. If
you need to assign multiple OPC Codes, enter them as a comma-separated list (i.e. 2, 4, 5, 6, 23).
You must click the Save button ( ) after editing a reason in order for your changes to be
saved
To remove a reason, click the delete button ( ) beside the reason in the far right column. After
clicking delete, the entry will immediately be removed from the displayed list. You must confirm
your deletions by clicking the Save button ( ) in the upper left corner. If you close your
browser or log out without saving, your deletions will be restored.

Application Document Informance System Administration Guide
41
Additional field sets, regardless of their name and meaning within your system, are modeled after
the User sets described in the Users section of the document. Additional field sets contain flat lists
of entries, not hierarchies, and each entry has properties of name, description and OPC code.
The procedures described in the Users section for adding, editing and deleting entries in a User set
will also apply to any additional field set. Please refer to the Users section for guidance in
managing your additional fields.
As discussed in the opening section of this user guide, the System Administration interface contains
additional Configuration Features that are used by the installing engineer to define the basic
elements of your Informance system. Following installation, these settings are rarely adjusted and
therefore they are not included in the standard customer administration role.
In Plant administration, these configuration features include a DCE tab used to define new assets in
the plant and assign their tagging fields and shift schedule. They also include a Super Reasons tab
used to define the list of Super Reasons as well as a Units tab where the different unit sets are
defined. Again, it is strongly recommended that you assign any new users to the customer role that
has been configured and not provide anyone these full administrative privileges. Improper
adjustments to these settings could have serious consequences for your Informance system.

Application Document Informance System Administration Guide
42
The System Administration site also provides tools for changing Informance data that may have
been incorrectly recorded due to a system issue or user error. These tools are found within the Data
Management Console tab which can be hidden for all but the top level administrative roles if
necessary.
Figure 34: The Data Console Tab
Visibility of the Data Console tab, like all other tabs, is controlled by
Informance’s role-based security system. Logins that have been assigned the appropriate
administrative role within the system will have access to this tab. For all other logins, this
tab will be hidden.
This chapter begins with an overview of the Data Management Console (DMC) to explain the layout
and navigation of the DMC interface. The basics of data selection are also covered within that
section.
The next section provides detailed instructions for the three major data change actions: Split,
Combine and Replace. You will also learn how to click within the editable cells of the data grid to
change counts and other values for a specific event.
The final section of this chapter explains how the DMC validates your changes and notifies you if
your actions violate the rules and constraints of the Informance data model. For example, if your
changes result in more than 24 hours of total event time for a single day, the notification window
will alert you to this mistake and guide you to the specific records that need to be corrected.

Application Document Informance System Administration Guide
43
The user interface for the Data Management Console (DMC) is organized into 3 sections: the data
selection interface at the top, the event grid in the middle and the notification window at the
bottom.
Figure 35: The Three Sections of the Data Management Console User Interface
The data selection interface has three selection windows: Lines (i.e. Production Assets), Dates and
Shifts which are organized from left to right across the top of the screen. After using these
windows to form a data selection, press the GO button in the upper right corner to populate the
event grid below with your selected data.
Figure 36: DMC Data Selection Interface
The event grid is initially blank when the DMC interface first loads but is populated with events
after making a data selection above and clicking the GO button. The event grid is updated
whenever your data selection is changed and the GO button is pressed again.
The first column of the data grid contains a checkbox for each event which is used to select that
event for editing. Any action you initiate (i.e. Split, Combine, Replace) will only be performed on

Application Document Informance System Administration Guide
44
those events that have been checked. Clicking the checkbox in the header row will check all events
in your data selection.
By default, events within the grid are sorted in ascending order by Line, Shift and Date/Time. To
sort the events differently, simply click on a different column heading. Click the heading once for
ascending order or a second time for descending order. An up or down arrow will appear next to
the column header to confirm that events are now sorted by that column in either ascending or
descending order, respectively. For example, if you wish to sort all of the events according to their
duration, click the Event Length column heading and the shortest events will be listed first
(ascending). Click it again and the longest events will be listed first (descending).
The event grid also allows you to place additional filters on the data based on Event Length, Cycles
or Defects. For example, you may need to adjust a cycle count that is too high for one of your
uptime events. In order to easily locate these events, you can hide all events that have few cycles by
applying a filter. Click the filter icon ( ) next to the Cycles column headings to apply a filter. A
pop-up window will appear to prompt you for the filter parameters.
When a filter has been applied, a black box will appear around the filter icon for
that column to indicate that some records have been filtered out.
At the bottom left corner of the event grid section you will find the Split, Combine and Replace
buttons which are used to initiate any of the three primary editing actions on events that have been
checked. In the lower right corner you will find some key summary statistics about your data:
Prior Time - This is the total time of the events you selected before any edits were made.
Edited Time - This is the total time of the events based on all un-saved edits.
Start - This is the sum of cycles from all uptime records in your data selection. This value will
update automatically whenever a cycle value is changed.
Defective - This is the sum of defects from all defect records in your data selection. This value
will update automatically whenever a cycle value is changed.
Finished - This is simply the subtraction of the defective count from the start count.
The start, defective and finished counts will be shown in ‘Cases’ only if there
is a ‘Cases’ unit associated with every SKU found in the data selection. If one or more
events in the data selection are tagged to a SKU which does not have an associated
‘Cases’ unit, then the counts will be presented in terms of start sensor units and the count
will be labeled as ‘units’.

Application Document Informance System Administration Guide
45
Figure 37: The Event Grid of the DMC user interface.
The notifications window at the bottom of the interface will initially be empty when the Data
Management Console is first loaded. Messages will appear here following an edit or save if the
DMC detects problems with the changes you have attempted. Some notifications may be
informative only while others may be errors that require action in order for your changes to be
saved. In the case of an error the notification may be followed by a Select hyperlink which you can
click to have the DMC automatically check the events that need to be corrected.
Also within the notification window is a Data Selection hyperlink which you can click to verify the
parameters of your data selection. After reviewing the parameters of your data selection, click the
Notifications link to bring the notification messages back to the foreground.
Figure 38: Examples of the DMC’s Notification and Data Selection Section

Application Document Informance System Administration Guide
46
Before editing any data with the Data Management Console, you first need to select a series of
events using the data selection interface at the top of the screen. Start on the left by selecting the
Line(s) (i.e. Production Assets). You can select all lines by simply clicking on the ‘All’ listing at the
top. To select a single line, scroll down and find it in the list and click it. For multiple selections,
hold down the CTRL key on your keyboard while clicking each line name that you wish to select.
Within the Dates window, define the date range for your data selection. You can click Custom to
manually define the start and end dates with the pop-up calendar tool or you can choose from one
of the four pre-defined ranges: Current Week, Current Day, Previous Week or Previous Day.
The Informance ‘Week’ begins on Sunday and ends on Saturday. So when selecting
‘Current Week’ your data selection will include all events from the previous Sunday
through today. When selecting ‘Previous Week’, your data selection will include all events
starting two Sundays ago through the previous Saturday.
Lastly, use the Shifts window to select the shifts to include within your date range. Similar to the
Line selection, you have the option to choose All or to select individual shifts while holding the
CTRL key on your keyboard.
After you have defined the Lines, Dates and Shifts, click the GO button in the upper right corner to
complete your data selection. Your selected events will be presented in the event grid below for
editing.
Be aware that performance of the Data Management Console can decline
with very large data selections. Therefore, if your date range is large (one week or
more), try to select fewer Lines. Alternatively, select only a few days and edit those
events first. Then select a few more days and so on.

Application Document Informance System Administration Guide
47
Once you have selected a series of events, there are three primary editing actions that can be
initiated using the buttons in the lower left corner:
Split - The splitting of one uptime or downtime event into two separate events and assigning
unique tags and values to each.
Combine - Combining two or more uptime or downtime events into a single event and
defining the tags and values for the consolidated record.
Replace - Selecting multiple uptime, downtime and/or defect records and globally replacing
one or more tags.
In addition to these three actions, you may also edit individual values for a single record within the
event grid itself. This will allow you to change a single tag for an event or adjust the cycle and
defect counts. In addition, you can add or edit notes for a single record within the event grid.
Before initiating any of these actions, you must check the event(s) to be edited using the
checkboxes in the first (left) column of the grid. To select all events, check the box in the header
row of the grid. Also be aware that your edits are not committed to the database until you click
the Save button in the upper right corner of the screen.
Figure 39: Event Data Selection Go Button

Application Document Informance System Administration Guide
48
To split an event, check the box for the event you wish to split and then click the Split button in the
lower left corner just below the grid. The Split Event window will appear.
Figure 40: The Split Event Window
The split event window is organized with a column for each of the two events that will be created
by the split. The columns are labeled ‘Event 1’ and ‘Event 2’ to indicate the chronological order in
which they will be saved. Each row represents a different value or tag that can be edited for either
event.
The cycles value will only be applicable if you are splitting an uptime event. The original cycles
total will be shown above the row to help you assure that the cycles you enter for each event will
sum to match the original.
The duration values must also be kept consistent with the original which is shown just above the
row. Your split will not be saved if the total duration of the two events does not match the
original.
To change SKU, User or any other event tags, first check the box to indicate you wish to change that
tag for one or both events. Then use the drop-down box within either column to change the value.

Application Document Informance System Administration Guide
49
Once you have set the values for both events, click the OK button in the lower right corner to close
the Split Event window. In the event grid you will see that your two new events have replaced the
original. To commit these changes to the database, click the Save button in the upper left corner of
the DMC interface.
To merge two or more events into a single event, check a consecutive series of uptime and/or
downtime events then click the Merge button in the lower left corner. The Merge Events window
will appear.
Figure 41: The Merge Events window
The Merge Events window provides a single column for the new event that will be created and a
row for each tag value that will be assigned to the record. The cycles and duration values will be
calculated for you automatically. For the SKU, User and other event tags, first check the box for
each tag you wish to adjust then use the drop-down boxes to make your selections.

Application Document Informance System Administration Guide
50
After completing the tags for your new event, click the OK button to close the Merge Events
window and return to the event grid. You will find that your selected events have been removed
and replaced by the new event. To commit this change to the database, click the Save button in
the upper left corner of the DMC interface.
Replacing Data
To change or replace one or more tags on multiple uptime, downtime and/or defect events, first
check the boxes for the events that need to be changed then click the Replace button in the lower
left corner. The Batch Replace window will appear:
Figure 42: The Batch Replace Window
The batch replace window is organized into two columns labeled Find and Change To. In the find
column, specify the tags that the DMC should search for within the checked event records. Once
found, the DMC will replace those tags with the corresponding values you have specified in the
Change To column.
After defining all of your replacements, click the OK button in the lower right corner to close the
Batch Replace window and return to the event grid. Your replacement tags should now appear
within all of the selected events. To commit these changes to the database, click the Save button in
the upper left corner of the DMC interface.

Application Document Informance System Administration Guide
51
To make a change to specific value within a single event, first check the checkbox for the event you
wish to edit and then click anywhere within that event’s row. Each value that can be changed will
become editable either in the form of a text box or drop-down selection. Cycles, for example, will
appear within a text box that you can directly click in to type a new value. The SKU, User and other
event tags will be editable as a drop-down selection.
Figure 43: Editing Events within the Grid
Again, after making the changes on screen, you will need to click the Save button in the upper left
corner to commit your changes to the database.
You can add a note to an event by clicking the Note icon ( ) on the far right side of the Event you
wish to add the note to.
In the Edit Note window, enter or update the note text.
Figure 44: Edit Note Window
After entering or updating the note, click the OK button in the lower right corner to close the Edit
Note window and return to the event grid. To commit these changes to the database, click the Save
button in the upper left corner of the DMC interface.

Application Document Informance System Administration Guide
52
Some changes that you attempt to make may violate certain constraints or rules of the Informance
application or database scheme. For this reason, the Data Management Console will first review
and validate all of your changes when you click the Save button in the upper right corner. If any
such violations are found, you will be notified in the window at the bottom of the interface and
your changes will not be committed to the database.
Figure 45: Two Examples of the Notifications Section of the DMC Interface
By default the notification will be in the foreground as you see on the left. On the
right the data selection has been clicked and is in the foreground.
Some notifications may just be informational and not require any action. For example, if your
changes result in a certain SKU only being tagged to a single 30 second downtime event, the DMC
will notify you of this as it expects SKUs to be active for several minutes or hours at a time.
Any notification that requires action to correct will be followed by a Select or Edit hyperlink which
you can click to be taken directly to the events within the grid that need to be corrected.
The notifications window can also be a convenient place to confirm your current data selection.
When clicking the Data Selection link the data selection will move to the foreground. Although
this will usually match what you see in the data selection windows above, it is often more readable
here especially if your system has multiple Lines (datasets) that require scrolling in the windows
above.


![Henk Oosterling (Erasmus Universiteit/Rotterdam … · Informe als functie van de informatisering: informance als transimmanence [Bataille/Derrida/Nancy]) 2 Filosofie . materialiteit](https://img.dokumen.tips/doc/110x75/5b28854d7f8b9a59038b4d98/henk-oosterling-erasmus-universiteitrotterdam-informe-als-functie-van-de-informatisering.jpg)


![Project Gegoten Lood #2 Woensdag 23 november 2011 · Informe als functie van de informatisering: informance als transimmanence [Bataille/Derrida/Nancy]) 2 Filosofie . materialiteit](https://img.dokumen.tips/doc/110x75/5b28854d7f8b9a59038b4d93/project-gegoten-lood-2-woensdag-23-november-informe-als-functie-van-de-informatisering.jpg)