Embed Size (px)
Citation preview
APPENDIX A:Method for Evaluating Vehicle Performance
The Office of Technology Assessment’s (OTA’s) analysis of vehicular performance and fueleconomy hinges on examining the vehicle on the Environmental Protection Agency (EPA) drivingcycle, using average (“lumped parameter”) estimates of key variables such as motor efficiency andbattery efficiency over the urban or highway portions of the cycle. Ideally, a performance analysisof complex vehicles such as hybrids should be based on detailed engine and motor maps coupledwith models that are capable of capturing the second-by-second interactions of all of thecomponents. Such models have been developed by the auto manufacturers and others.Nevertheless, OTA believes that the approximate performance calculations described here giveresults that are adequate for our purposes. Also, the detailed models require a level of data ontechnology performance that is unavailable for all but the very near-term technologies.
ENERGY CONSUMPTION IN CONVENTIONAL AUTOMOBILES
It is relatively easy to derive a simple model of energy consumption in conventionalautomobiles that provides insight into the sources and nature of energy losses. In brief, the engineconverts fuel energy to shaft work. This shaft work is used to overcome the tractive energyrequired by the vehicle to move forward, as well as to overcome driveline losses and supplyaccessory drive energy requirements. The tractive energy can be separated into the energyrequired to overcome aerodynamic drag force, rolling resistance, and inertia force. It is useful toconsider energy consumption on the EPA urban and highway test cycles, which provide areference for comparing fuel economy.
The engineering model used in this study follows the work by GMscientists Sovran and Bohn.1 Defining the average engine brake specific fueltest cycle as bsfc, fuel consumption FC2 is given by:
Research Laboratoryconsumption over the

where
is the drive train efficiency
is the energy to overcome aerodynamic dragis the energy to overcome inertia force
is the accessory energy consumptionis idle fuel consumption per unit time
are the time spent at idle and braking.
The first term in the above equation represents the fuel consumed to overcome tractive forces.Because the Federal Test Procedure (FTP) specifies the urban and highway test cycle, ER, EA,and Ek can be readily calculated as functions of the vehicle weight, the rolling resistance, bodydrag coefficient, and frontal area. Note that weight reduction reduces both inertia force androlling resistance. It should also be noted that not all of the inertia force is lost to the brakes, as avehicle will slow down at zero input power owing to aerodynamic drag and rolling resistance,without the use of brakes. The fuel energy is used not only to supply tractive energy requirementsbut also to overcome transmission losses, which accounts for the transmission efficiency that is inthe first term.
The second term in the equation is for the fuel consumed to run the accessories. Accessorypower is needed to run the radiator cooling fan, alternator, water pump, oil pump, and power-steering pump (but the water pump and oil pump are sometimes excluded from the accessorydrive loads). The air conditioner is not included because it is not turned on during the FTP. Idleand braking fuel consumption are largely a function of engine size and idle rpm, whiletransmission losses are a function of transmission type (manual or automatic) and design. Theengine produces no power during idle and braking but consumes fuel so that factor is accountedfor by the third term.
Tables A-l(a) and (b) show the energy consumed by all of these factors in a typical midsize carwith a three litre overhead valve (OHV) engine, four-speed automatic transmission with lockup,power steering, and typical alternator size. Table A-l(a) shows the distribution of the vehicle’stractive energy and total fuel consumption for the two cycles as well as the EPA 55/45 compositecycle. Table A-l(b) indicates the absolute energy consumption and estimates the car’s engineefficiency.
The values in table A-l(a) can be easily utilized to derive sensitivity coefficients for thereduction of various loads. For example, reducing the weight by 10 percent will reduce bothrolling resistance and inertia weight forces, so that tractive energy is reduced by (30.5 + 39.6) xO. I or 7.01 percent on the composite cycle. Fuel consumption will be reduced by 7.01 percent x0.708 which is the fraction of fuel used by tractive energy, or 4.96 percent. This matches thecommon wisdom that reducing weight by 10 percent reduces fuel consumption by 5 percent.
271

However, if the engine is also downsized by 10 percent to account for the weight loss, fuelconsumption will be reduced by 6.02 percent as idle and braking fuel consumption will be reducedin proportion to engine size. Table A-1 provides a framework by which total fuelconsumption for any automobile can be analyzed for the FTP cycle.
On a total energy basis, energy can be allocated to the various losses using differentconventions on the treatment of idle and accessory power loss. One example of this allocation isprovided in a chart from the Partnership for a New Generation of Vehicles (PNGV)3 shown infigure A-1. The figure implies that the engine usefully converts 20.4 percent of fuel energy intouseful power in the city cycle, and 10.8 percent of this useful power (or 2.2 percent of fuelenergy) is used for accessory drives. The other 18.2 percent is used by the drivetrain. The PNGVchart specifies a drivetrain efficiency of 69.2 percent in the city cycle, which appears unusuallylow. Most modern transmissions with lockup converters operate at efficiencies of over 85 percentin the city cycle, and 92 to 94 percent on the highway cycle. The PNGV allocations to kineticenergy, rolling resistance, and drag force are also different born the values shown in table A-1,especially in the allocation between the rolling resistance and inertia forces, but these differencesmay be owing to the conventions followed in allocating energy to the different loads. The sourceof these numbers is not documented.
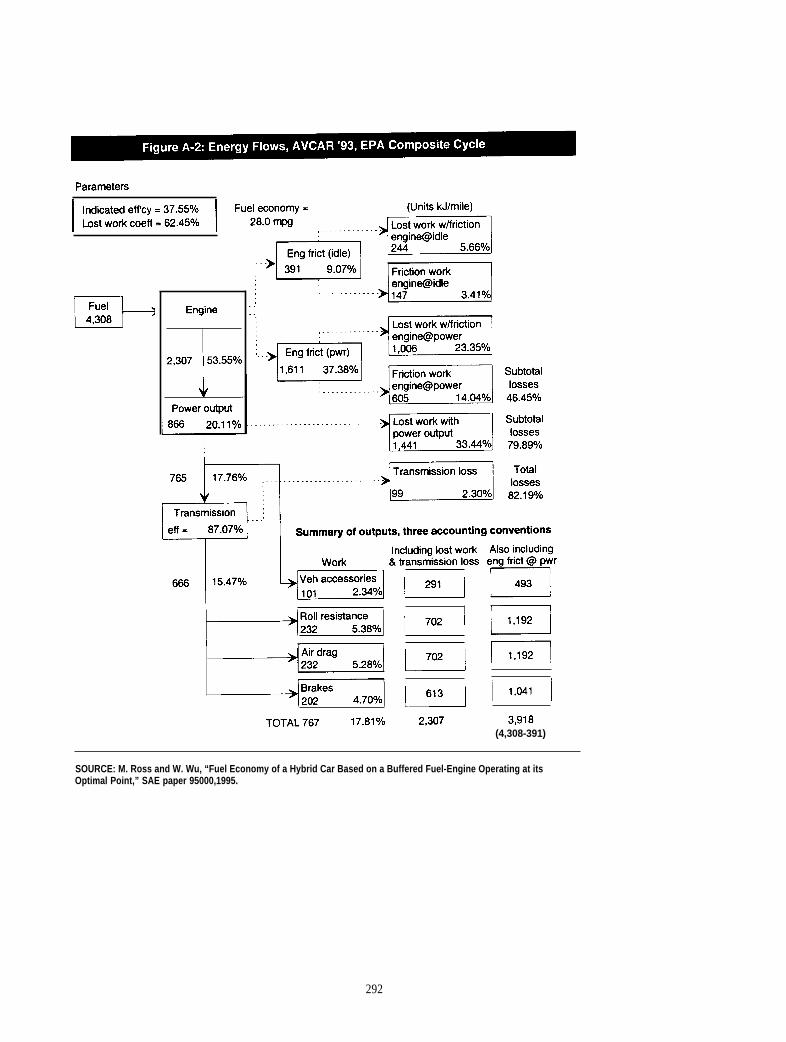
A separate analysis,4 shown in figure A-2, also differs somewhat from the tractive energyvalues calculated from Sovran and Bohn’s formula, probably because of differences in theaccounting conventions. Their estimate of overall energy efficiency appears low, as engine thermalefficiency (excluding idle loss) is shown at 20.1 percent for the composite cycle, rather than themore common 23 to 24 percent. Although these differences may seem academic, they may play asignificant part in explaining the widely different results estimated in the literature for the fueleconomy of hybrid vehicles. For example, if the PNGV value for transmission efficiency isconnect, a 30 to 35 percent fuel economy increase (or a 23 to 26 percent fuel consumptiondecrease) would be possible simply by eliminating the transmission, as is likely with electric motordrives. The resolution of these figures is one key to reconciling the widely varied findingsregarding hybrid vehicle efficiency.
The analysis of conventional vehicles in this report is based on the formulae and sensitivityindices computed using a methodology similar to the one described for weight. The weightingfactors for EK, EA and ER utilize the relationships developed by Sovran and Bohn. All of theother coefficients are computed as ratios so that the actual equation used is in the form ofFCnew/FCold. This is particularly convenient as most of the variables such as bsfc have beenanalyzed in terms of potential changes from current values. For example, engine average bsfc overthe composite cycle was forecast to be reduced by 18 percent from current values. All of theanalysis is in fuel consumption space. The same tractive energy equations also hold for electricand hybrid vehicles, although the bsfc and weight calculations for hybrid vehicles are far morecomplex.
3P.G. Pati~ “Partnerh“p fw a New Generation of Vehicles”, Automotive Technology Development Cmtractora Coordination Meeting U.S._mt of Energy, october 1994.4M R= ~d w Wu, ‘Fuel ~nOmY of a H@rjd & Baaed on a Buffkd Fuel-Engine _ing at It’s ml pO@w s~ W 95~J1995.
272

PERFORMANCE, EMISSIONS, AND FUEL ECONOMY
The previous section described energy use over a prescribed driving cycle, and treated thevariable of average engine brake specific fuel consumption, bsfc, as constant. The value of bsfc isdependent on the size of the engine, the gear ratios and final drive ratio, as well as the engine’semission calibration. The size of the engine and the transmission/axle ratios have an impact uponvehicle performance capability and affect bsfc, although the driving cycle over which fueleconomy is measured remains constant. These issues and the resultant tradeoffs with fueleconomy are discussed below.
Different levels of performance can be attained most simply be varying axle ratio, whichdetermines the engine rpm to vehicle speed ratio in any particular gear. Increased numerical valuesof axle ratio imply higher rpm at a given speed and increased performance. The tradeoff of fueleconomy with axle ratio is nonlinear, however; fuel economy increases with decreasing axle ratioup to a point, but decreases beyond this maximum level at even lower axle ratios. The reason isthat, at very low axle ratios, gear shifts must be delayed owing to insufficient torque at low speedto follow the driving cycle. Figure A-3 provides an illustration of the tradeoff between fueleconomy and performance with changing axle ratio, holding all else constants As can be seemaxle ratios below 3:1 (in this example) make both performance and fuel economy worse, andwould make no sense for a manufacturer to employ. The tradeoff between axle ratio,performance, and fuel economy is defined to the right of the fuel economy maximum point in thefigure. Statistical analysis of data from EPA tests indicates that a linear approximation of theeffect of a 10 percent increase in axle ratio is a 2.0 percent decrease in fuel economy, and a 5percent decrease in O to 60 mph time.6
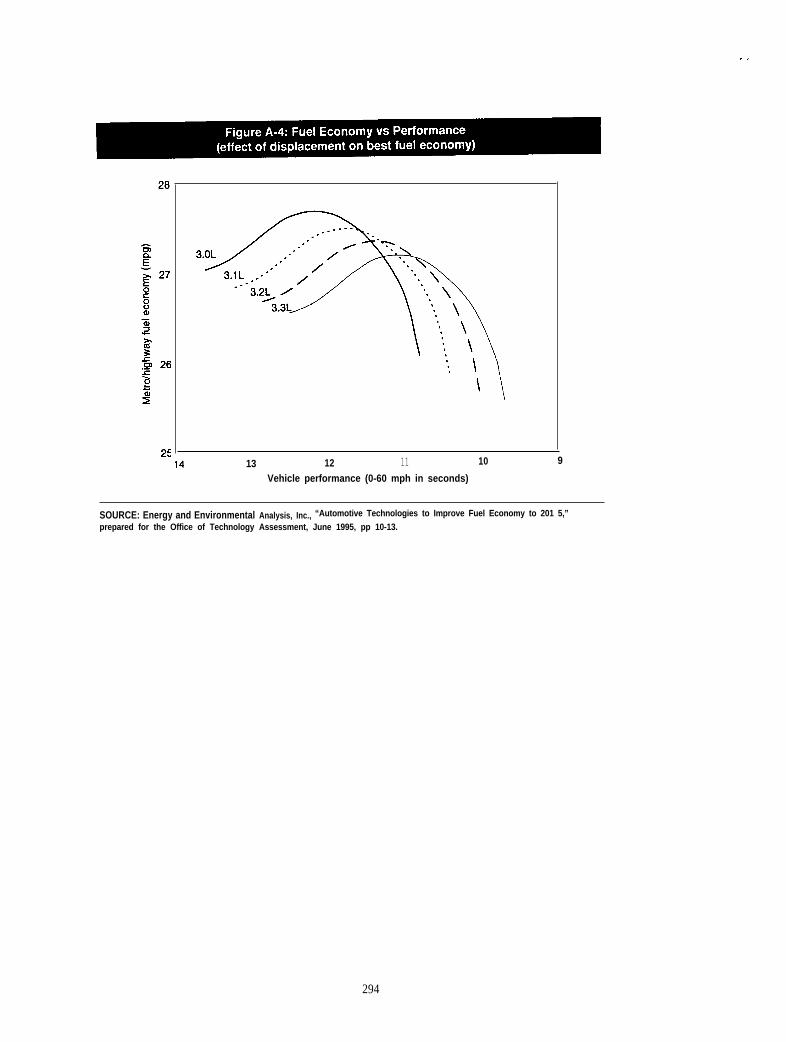
The next option is to increase engine size, and figure A-4 shows the family of tradeoff curves offuel economy and performance with axle ratio for different engine sizes.7 Larger engines obtainworse fuel economy than smaller engines for two reasons:
●
●
increased fuel consumption during braking and idling, when the fuel consumption rate is largely afiction of engine size, and
lower average load relative to the maximum which requires more throttling and higher pumping loss.
Of course, a larger engine could be utilized with a lower axle ratio that changes the performanceand fuel economy tradeoffs. As can be seen in the figure, for some combinations of axle ratios andengine size, different engine sizes have nearly identical fuel economy and only slightly differentperformance. Statistical analysis has shown that increasing engine size by 10 percent, whilekeeping all other factors constant (including weight and axle ratio), leads to approximately a 3.6percent increase in fuel consumption.
5Fwd M@w q p=~on to he Department of Energy on fiv=p=d aut~tic trammiasions, September 1992.6H.T Mck, “S~tjti~ Projection of Fuel Economy to the Year 2000,” presentation at the SAE Government Industry Meeting 1992.7FWd Mot~ &., = footnote 5.
273

With larger engines and more performance potential, however, many other vehicle factorschange. Larger engines require stronger drivetrain components and better suspension and brakes,all of which increase weight. In addition heavier “performance” tires with higher rolling resistancemay be used. Increased engine displacement could also require that the number of cylinders beincreased, leading to an even larger weight increase and increased internal engine fiction. Hence,the tradeoff leads to even larger differences in fuel economy for each increment of performance.
Manufacturers have a wide set of options to improve performance to a given level, and theactual fuel economy impact depends on the particular set of options chosen. A statistical analysisof data from the EPA test car list at constant engine technology showed a tradeoff of the form:
Percent change in F/E = -0.20 * (A HP) -0.560 *
which represents an average of all strategies representedchange in horsepowers
in the data, where A HP is percent
The impact of emission standards on fuel economy and performance is less clear, but this isprincipally because the impacts are relatively small. Most modem cars calibrated to current Tier Istandards produce very little emissions once the engine is warmed up, and the cold start phase(which lasts about two minutes after cold start) is responsible for 75 percent of all emissions onthe test.9 In this context, the ability to meet future low emission vehicle/ultralow emission vehicle(LEV/ULEV) standards is based on reducing emissions in the first two minutes of operation, andthe methods developed include the use of small “start” catalysts that light-off very quickly,electrically heated catalysts, intake air heaters, improved fuel atomization and heated fuel spraytargets. An evaluation of different methods conducted for NESCAUM1° concluded that the directeffects were small but the indirect effects, such as the increased back pressure owing to startcatalysts and increased weight associated with more components, would cause fuel economypenalties in the 2 percent range. Electrically heated catalysts could have larger penalties, butrecent data suggests that they may not be necessary in most vehicles, even at ULEV emissionlevels. For example, the 1995 Toyota Camry (California version) comes very close to meetingULEV standards with virtually no advanced aftertreatment methods, while Honda plans ll tocertify an Accord to ULEV standards for 1998, and has publicly stated that fuel economypenalties are very small.12 The impact on performance owing to increased back pressure is alsolikely to be in the same range as the impact on fuel economy--that is, about 2 percent, and Hondahopes that costs will be below $300 (as an incremental retail price effect (RPE)).
“Off-cycle” emissions are also of concern as the EPA and Air Resources Board have found thatemissions increase dramatically during hard accelerations and high speeds, which currently are notrepresented in the FTP but occur often in actual driving. These increases are associated with theengine going into enrichment mode (i.e. increased fuel-air ratio) at high loads, which increases
8-13Y~~vimnmental AM@@ Inc., “The Fuel Economy Model - Documentation report to EL%” October 1993.9Hti R&D ~. SH~ ULEV Technology,” brochure, JZUWUY 1995.1OE H ph ~d ~W ~d ~~~a~ ~@~ Inc., “Adopting the CdifOmh LEV ~~ in tie Nofi _ s~t~,” -fi _. .
fw NESCAw September 1991.1 Ills. Environmental ~“on Agency, ‘EPA CertKcation li~w 1995.12~ tie of fuel composition ia _t but not diaeuaaed here.
274

hydrocarbon and carbon monoxide emissions dramatically. EPA is now planning a separate “high-speed driving cycle” (that is, unfortunately, independent of vehicle characteristics) with newemission standards for these cycles.13 Such an approach would favor the high-performance vehicleas the engine may not reach the high load levels to require enrichment on such a vehicle during thenew EPA cycle. Low performance vehicles however will be hurt more, because the enrichmentlevels must be cut back, which will improve fuel economy but hamper performance. In sum, theeffect of this potential new regulation will not be to hurt fuel economy directly, but will indirectlyaffect it by making the trend toward higher performance more attractive.
ELECTRIC VEHICLES
The energy use of an electric vehicle (EV) is governed by the same equation shown on page A-2, except that there is no “idle” energy consumption so that:
FC =
The relative energy efficiency of electric vehicles can be discussed with reference to thisequation. First, the electric vehicle gains back the fuel consumption associated with braking andidling--a 10.8 percent savings. Second, most of the accessories used in the internal combustionengine-powered car, such as the water pump, oil pump, cooling fan, and alternator, can beeliminated if battery heat losses are not high, as motor and electronics cooling requirements donot require much power. In addition the conventional power steering must be replaced by electricpower steering, which consumes only a fraction of the power of conventional systems, andconsumes no power on an EPA dynamometer test where the steering is not used. This saves asmuch as 9.5 percent of fuel consumption on the test cycle. The EV may need power for thebrakes, however, but this requirement is probably small owing to the use of regenerative braking,as described below.
Third, some of the energy lost during braking can be recovered by electric vehicles, because themotor can act as a generator when it absorbs power from the wheels. The energy can be stored inbattery and later released to drive the motor. As noted earlier, the energy lost to the brakes in aconventional car in the FTP city cycle is about 35 percent of total tractive energy. For the motorto convert this to electricity, however, transmission loss and motor loss in generator mode mustbe considered. Typically, transmissions for electric motors are simple drive gears, and can be 95to 96 percent efficient. Motors operated in reverse generator mode typically have cycle averageefficiency in the 80 to 84 percent range. Hence, only 78 percent of the braking energy can be
13Ho~ R&D (h., see f~= 9.
275

. .
converted to electricity, which is about 27.0 percent of traction energy. The storage and retrievalof electricity in a battery causes further loss, but this is very dependent on both the battery typeand its efficiency in terms of absorbing power pulses. This efficiency is only 80 percent or lowerfor lead acid and nickel-cadmium batteries, so that regenerative braking recaptures only 0.82 x0.95 x 0.80x 0.35, or 21.8 percent of tractive energy using such batteries. This assumes that all ofthe braking can be done regeneratively, but this is not true in practice, because the motorgenerally is connected to only two wheels, leaving the other two wheels to be brakedconventionally .14 As a result, actual systems in the Toyota EV15 and the Cocconi CRX16 havebeen reported to provide range increases of about 17 to 18 percent maximum since other systemlosses prevent reaching the 21.8 percent figure. These figures quoted for the Toyota EV andCocconi CRX are the best achieved, as regenerative braking more typically extends range by only8 to 10 percent in many vehicles, such as the BMW El.
Fourth, the motor is quite efficient in converting electrical energy to shaft energy, with typicalcycle average efficiencies in the 75 to 80 percent range in the city cycle, as opposed to gasolineengines, which have an efficiency of only 20 to 23 percent on the fuel economy test cycle. Ofcourse, the production of electricity from fossil fuels has an efficiency of only 35 to 40 percent,and there are other transmission losses, so that direct efficiency comparisons are more complex.Nevertheless, electricity stored on a car can be converted to useful power almost 300 percentmore efficiently than gasoline.
Substituting these efficiency values into the fuel consumption equation, and assuming that EVaccessory power consumption is only 25 percent of the power consumed by accessories inconventional vehicles, it can easily be shown that an EV uses only 14 percent of the energy usedby a similar current conventional vehicle, if the weight of both vehicles are identical and ifbattery losses are not considered. When electricity generation efficiency, transmission loss,charger efficiency, battery storage efficiency, and battery internal self discharge are considered,however, the picture is quite different, and the EV of the same weight consumes 60 percent ormore of the energy consumed by a current conventional gasoline vehicle of equal weight. In orderto obtain sufficient range and performance, however, EV’s can be much heavier than conventionalvehicles, so that the EV can be less efficient on a primary energy basis than even a conventionalvehicle of equal size and acceleration performance.
The analysis of overall vehicle weight, and the range/performance tradeoffs are especiallyimportant for an electric vehicle. A simple analytical framework allows the calculation of thesetradeoffs. The battery energy storage capacity and the peak-power capacity affect the range andperformance capability, and the more batteries used, the greater the capacity. As battery weightincreases, however, structural weights must also increase to carry the loads, and a larger motor isrequired to maintain performance. The weight spiral effects lead to a situation where there arerapidly declining benefits to each additional battery weight increment.
14Properhandling during braking requires that all four wheels be braked fw stability.ls~ Kanamaw “Toyota EV-50: An Efkt to Realize Practical EVs paper presented at the 12th International Electric Vehicle Symposium
Deeernber 1994.1 6A me ~w of T_~i~ SW&~ u~v=i~ of California d Dam “DyIwII~* ~ R~ Tag of ~vd El~c
Vehicle,” 1995.
276

For a vehicle of a given size, there is a specific “zero weight engine” body weight that isessentially a theoretical body weight if engine weight were zero, assuming a flow through ofsecondary weight reduction. This was calculated to be 50 to 54 percent for several cars whosedetailed weight breakdowns were available, assuming a secondary weight reduction of 0.5 foreach unit of primary weight reduction. Denoting this “zero weight engine” body weight as MBZ
we have total EV weight given by:
where: MBATT is the battery (including tray and thermal management system) weight
MMOTOR is the weight of the motor and controller.
The traction energy needed to move a vehicle forward normalized by total vehicle weight is thespecific traction energy, and one analysis17 has shown that this number is relatively constant in citydriving, being a weak function of rolling resistance coefficient and the ratio of drag force to mass.Denoting specific traction energy as E, we have the range, R, given by:
R =
where SE is the battery specific energy. This equation simply balances the energy stored in thebattery to the energy demanded by the car. Of course, this range represents the maximum range, ifthe battery were discharged down to zero charge, which is not recommended for some batterytypes. This leads to a simple relationship to derive the ratio of battery to vehicle weight, asfollows:
The above equation effectively links the battery weight to vehicle range andenergy.
The size of the motor is simply determined by the output requirement as set
battery specific
by performancerequirements. Setting the performance requirement in the form of horsepower to vehicle weightratio, we have:
P ‘ H P = K ● M M O TO R/ ME V
lMEV
where k is the power to weight ratio of the motor. As discussed in chapter 4, a typical vehiclewith average performance requires 80 HP per ton (1000 kg) of weight (curb + payload), but anelectrical motor of 20 percent lower output can provide equal performance at low to mid speeds.
l’som ~ BohQ s= f~ 1“
277

Hence, an electrical motor power output of 50 kW (or 67 HP) per ton of vehicle weight providescomparable or average performance. Typically, electrical motors (and their controllers) weighabout 1.0 to 1.2 kg for each kW of output so that a MMOTOR/MEV ratio of 0.05 provides areasonable approximation of motor weight to vehicle weight.
The weight-compounding effect is best illustrated by the ratio of battery weight to “zero weightengine” body weight, which is a constant for a car of a given design and size. Using the aboverelationship, it can be shown that:
for an acceptable performance car. This relationship is very useful in illustrating the effectsdifferent specific energy storage capability and the choice of vehicle range on battery weight.
of
Table A-2 lists the actual and specific energy consumption of several recent EV models, basedon the city cycle test procedure. The energy consumption values for these EVs indicate that thespecific traction energy E is similar across most cars ranging between 0.084 to 0.151 kWh/ton-kmor 0.12 to 0.22 kWh/ton-mile. Vehicles at the high end of the spectrum were models with lowregenerative braking efficiency or with less efficient motor/electronics, but the bodycharacteristics or total weight did not have a significant impact on the specific energy efficiency.(For example, the GM Impact is slightly less efficient than the Cocconi CRX-4 using thismeasure). The Cocconi CRX stands out with an energy consumption of 0.084 kWh/mi but it hasno accessories, not even power steering. These energy consumption figures are based on federalcity cycle driving, and are often not the ones quoted in the press.
Many publications also provide inconsistent and in many instances, significantly lower estimatesof energy used for each ton-mile, based on the same cars shown in table A-2. For example, ARBtests of the Cocconi CRX were used to derive energy from the battery used as 96.5 Wh/km, butthis is based on subtracting all of the regenerative energy going into the battery from the batteryoutput18; this is incorrect because not all of the regenerative power going in can be recoveredowing to charge/discharge loss in the battery. The GM Impact is another car where city cycleenergy consumption has been reported as low as 0.065 kWh/km.19 However, GM claims a rangeof 70 miles in the city based on the discharge of a 16.3 kWh battery to 80 percent DoD.20 If 13kWh (0.8x 16.3) is required to travel 70 miles (112.6 km), it is easy to see that the quoted 0.065kWh/km cannot be correct. Finally, it should be noted that E is calculated in Wh/km per kg of

empty weight in this calculation, as opposed to Wh/km per kg of inertia weight (empty weight +300 lbs), which yields lower results.
Using a representative value of E of 0.1 kWh/ton-km for a vehicle with power steering anddeveloped from a glider body, figure A-5 shows the relationship between battery weight and “zeroengine” body weight, and its nonlinear increase with range is obvious. At an R/SE of 6, batteryweight is infinite, as the added weight of the battery does not provide enough energy to increaserange while maintaining performance. When battery weight equals zero engine body weight, thevalue Of WSE is 3.6. To place this in perspective, an advanced lead acid battery, which has an SE
of 42 Wh/kg, provides a range of 150 km (42 x 3.6) or 90 miles, when battery weight equals zeroengine body weight. For a current (1995) mid-size car such as the Taurus, the “zero engine” bodyweight is about 730 kg or 1,600 lbs. Hence, to obtain a 90-mile range even with an advancedsemi-bipolar lead acid battery, 1,600 lbs of battery are required, and the total weight of the carincreases from the current 3,100 lbs to 5,240 lbs. (In reality, usefud range is only about 70 milessince lead acid batteries should be discharged only to 20 percent of capacity). In contrast, anickel-metal hydride battery, with an SE of 72 Wh/kg, of the same weight will provide a range ofmore than 150 miles. The weight of nickel-metal hydride battery to provide a 100-mile range is957 pounds, while the car weight falls to 3,305 lbs, illustrating the importance of weightcompounding effects in an EV.
The second constraint on the battery size is that it must be large enough to provide the peak-power requirement of the motor, or else some peak-power device such as an ultracapacitor orflywheel may be necessary. To meet this requirement, we have the following:
where Sp is the specific power capability of the battery. Algebraic manipulation and substitutioncan be employed to show that:
For a value of P of 50 kW/ton, a range of 160 km, and a value of E = 0.1 kWh/ton-km (or 0.1Wh/kg-km), we have:
At a range of 100 miles or 160 km, the specific power to specific energy ratio must be at least3.125 hrl; otherwise, the power requirement becomes the limiting factor on battery size. If therange requirement is doubled to 200 miles, then the minimum ratio declines to 1.56 hrl. For a100-mile range, the advanced semi bipolar lead acid battery meets this requirement, with an S@Eratios of almost 5, while the Ni-MH battery has a ratio of about 3.1, close to the minimum. Theexisting “hot-battery” designs provide ratios of only 1.25, while more recent advanced designsprovide ratios closer to 2. The important point of this discussion is that doubling the specificenergy does not automatically lead to half the battery size, if the battery’s power capability isinadequate to provide “average performance. ” Relaxing the performance requirement reduces the
279
required ratio, illustrating that hot batteries with good specific energy but low specific power havebest application in commercial vehicles, where range is more important than performance. Onealternative is to include peak-power devices such as ultracapacitors with such batteries to provideadequate peak power.
HYBRID VEHICLES
Series Hybrids
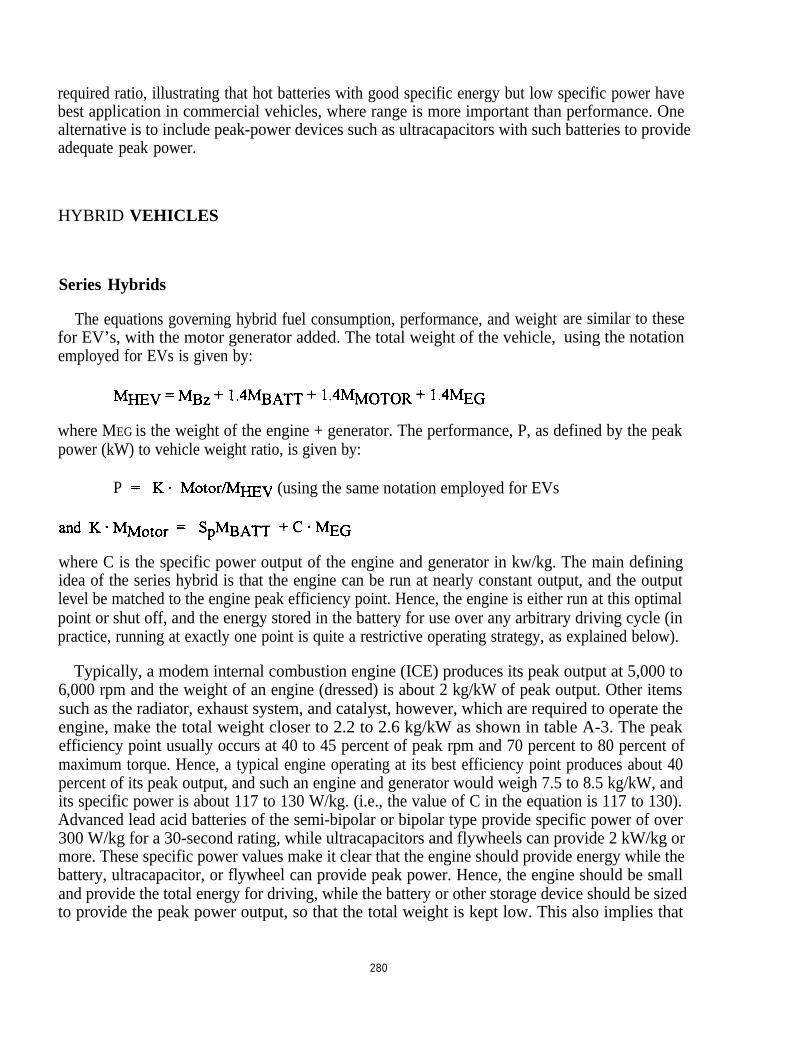
The equations governing hybrid fuel consumption, performance, and weightfor EV’s, with the motor generator added. The total weight of the vehicle,employed for EVs is given by:
are similar to theseusing the notation
where MEG is the weight of the engine + generator. The performance, P, as defined by the peakpower (kW) to vehicle weight ratio, is given by:
P (using the same notation employed for EVs
where C is the specific power output of the engine and generator in kw/kg. The main definingidea of the series hybrid is that the engine can be run at nearly constant output, and the outputlevel be matched to the engine peak efficiency point. Hence, the engine is either run at this optimalpoint or shut off, and the energy stored in the battery for use over any arbitrary driving cycle (inpractice, running at exactly one point is quite a restrictive operating strategy, as explained below).
Typically, a modem internal combustion engine (ICE) produces its peak output at 5,000 to6,000 rpm and the weight of an engine (dressed) is about 2 kg/kW of peak output. Other itemssuch as the radiator, exhaust system, and catalyst, however, which are required to operate theengine, make the total weight closer to 2.2 to 2.6 kg/kW as shown in table A-3. The peakefficiency point usually occurs at 40 to 45 percent of peak rpm and 70 percent to 80 percent ofmaximum torque. Hence, a typical engine operating at its best efficiency point produces about 40percent of its peak output, and such an engine and generator would weigh 7.5 to 8.5 kg/kW, andits specific power is about 117 to 130 W/kg. (i.e., the value of C in the equation is 117 to 130).Advanced lead acid batteries of the semi-bipolar or bipolar type provide specific power of over300 W/kg for a 30-second rating, while ultracapacitors and flywheels can provide 2 kW/kg ormore. These specific power values make it clear that the engine should provide energy while thebattery, ultracapacitor, or flywheel can provide peak power. Hence, the engine should be smalland provide the total energy for driving, while the battery or other storage device should be sizedto provide the peak power output, so that the total weight is kept low. This also implies that
280
batteries with high specific peak power are better suited for use in Hybrid Electric Vehicles(HEVs).
Because the battery is capable of providing peak power in short bursts only, the critical enginesize is limited by the maximum continuous demand under the most severe design condition.Consistent with the analysis for EVs we impose the requirement that an HEV must have acontinuous power capability of 30 kW/ton of vehicle and payload weight. This sets a lower limiton engine size. Peak-power requirement is 50 kW/ton of vehicle and payload, which permits azero to 60 mph time of about 12 seconds, so that the batteries must supply the (50-30) kW/tonfor peak accelerations. Calculations are performed to show that operating the engine at its single“best efficiency” point at all times is not an optimal solution.
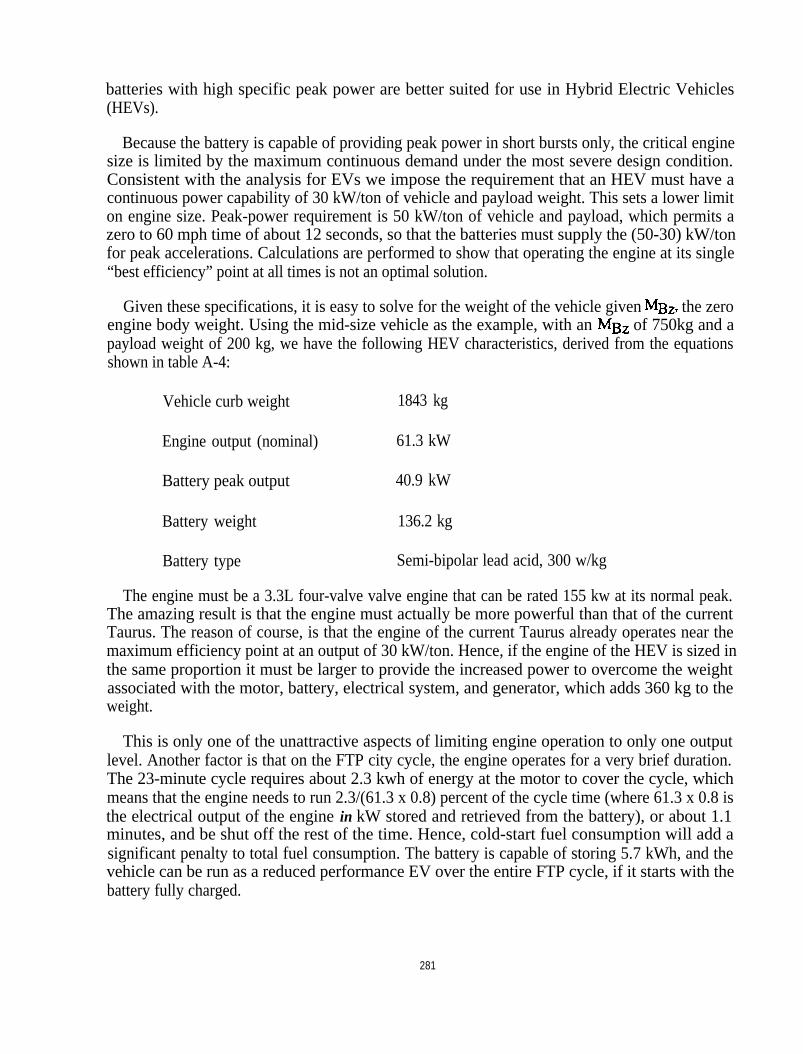
Given these specifications, it is easy to solve for the weight of the vehicle given MBZ, the zeroengine body weight. Using the mid-size vehicle as the example, with an MBZ of 750kg and apayload weight of 200 kg, we have the following HEV characteristics, derived from the equationsshown in table A-4:
Vehicle curb weight 1843 kg
Engine output (nominal) 61.3 kW
Battery peak output 40.9 kW
Battery weight 136.2 kg
Battery type Semi-bipolar lead acid, 300 w/kg
The engine must be a 3.3L four-valve valve engine that can be rated 155 kw at its normal peak.The amazing result is that the engine must actually be more powerful than that of the currentTaurus. The reason of course, is that the engine of the current Taurus already operates near themaximum efficiency point at an output of 30 kW/ton. Hence, if the engine of the HEV is sized inthe same proportion it must be larger to provide the increased power to overcome the weightassociated with the motor, battery, electrical system, and generator, which adds 360 kg to theweight.
This is only one of the unattractive aspects of limiting engine operation to only one outputlevel. Another factor is that on the FTP city cycle, the engine operates for a very brief duration.The 23-minute cycle requires about 2.3 kwh of energy at the motor to cover the cycle, whichmeans that the engine needs to run 2.3/(61.3 x 0.8) percent of the cycle time (where 61.3 x 0.8 isthe electrical output of the engine in kW stored and retrieved from the battery), or about 1.1minutes, and be shut off the rest of the time. Hence, cold-start fuel consumption will add asignificant penalty to total fuel consumption. The battery is capable of storing 5.7 kWh, and thevehicle can be run as a reduced performance EV over the entire FTP cycle, if it starts with thebattery fully charged.
281

A less restrictive scenario could allow the engine to operate at much higher peak ratings, if thecontrol logic determines that the load is not a transient one. For example, if high peak-loadspersist for more than 20 or 30 seconds, the control logic can allow the ICE to provide morepower rapidly (albeit with much lower efficiency), so that the batteries are not taxed too heavily.In addition the engine can provide a range of horsepower, if efficiency is allowed to decline towithin 10 percent of the maximum. Such an operating strategy does not require as much power tobe available from the battery with attendant charge/discharge losses, so that the 10 percentefficiency loss in the ICE is compensated by a 20 percent gain (for example) in avoiding thecharge/discharge loss.
These requirements could be achieved by a smaller engine that is capable of providing the peak-power requirement at its normal maximum RPM. Such an engine would weigh 2.3 kg/kW, andassuming the generator weighs 1.0 kg/kW, we find the value of C2 increases to 285 W/kg (i.e.1/(2.3+1)). However, the batteries must now be able to provide more power for short durationaccelerations when the engine is still providing only 140 W/kg. Again, solving for vehicle weightfor the same Taurus example, we have the following HEV specification:
Vehicle curb weight 1385 kg
Engine peak output 44.7 kW
Continuous output 19.0 kW
Engine +Battery:
Motor:
generator weight 167 kg
Peak output 59.1 kW
Energy stored 8.3 kWh
Weight 197 kg
Type Semi-bipolar lead acid
output 79.3 kW
Weight 80 kg
Here, the solution is far more reasonable, as an engine of 44.7 kW peak rating, with adisplacement of 1.0 litre would be all that is required. The total weight of this type of system isvery similar to the current intermediate size car. On the urban cycle, the engine would be on 28percent of the time, and shut off for the rest of the cycle. On the highway cycle, the engine is onfor 62 percent of the time, and the engine would be operating continuously at speeds above 70mph cruise on level ground. This is favorable for fuel efficiency as the engine would be operatingat or near its optimal bsfc point, and energy can flow directly from generator to motor withoutgoing through the battery.
Efficiency calculations shown are not as detailed as those that would be obtained from asimulation model, but a reasonably accurate picture can be established using the equationspresented earlier in this section. The major assumption here is that the engine can be operated atclose to optimal bsfc (but run occasionally at higher output when it is needed for highaccelerations or prolonged periods of hill climbing or other high vehicle loads), or else be turnedoff. Using the details provided in table A-1, one can compute the following fuel consumption
282

reduction. First, as there is no idling, the 16 percent of fuel consumed on the city cycle and 2.0percent on the highway cycle is saved. Second, accessory power demand is not likely to bereduced in a hybrid, because an engine running at or near its optimal bsfc point rejects much moreheat to the coolant, and, hence, cooling fan and water-pump requirements will increase, but theengine itself is much smaller. Accessory fuel consumption will be reduced by the improvement inbsfc or efficiency. Third, the use of regenerative braking will reduce tractive energy requirementsby an amount similar to that for an EV, but the smaller battery (relative to an EV) may not be ableto absorb the power spikes as efficiently. Fourth the use of an electric motor drive eliminates thetransmission and improves drivetrain efficiency. Finally, by operating at or near its optimalefficiency point, the engine bsfc is greatly reduced.
On the negative side, a small engine (with smaller cylinders) is inherently less efficient owing tothe higher surface/volume ratios of its combustion chamber. In the Taurus example, the enginewould be a 1.0 litre four-valve four-cylinder engine, rather than the 3. O-litre two-valve V-6currently used. Although some have discussed using one-or two cylinder engines, the noise andvibration characteristics of such engines are so poor that only a four-cylinder engine is thought tobe acceptable in a midsize car (Even the three-cylinder Geo Metro engine is considered quiterough in automotive circles). Hence, peak efficiency is sacrificed by 2 percent to 3 percent relativeto a 2.0 litre four-cylinder or 3.0 litre six-cylinder engine. The generator also must be sized forpeak continuous output of 45 kW, while operating at a nominal output of 19 kW, which makes itheavier and less efficient under the standard operating mode.
Detailed analysis of the efficiency without a comprehensive simulation model requires someassumptions regarding average generator and motor efficiency. For a “2005 best” calculation, theassumptions are as follows:
● Generator efficiency: at 19.0 kw 91 percent
at 45 kw 94 percent
. Motor Efficiency: Urban cycle 82 percent
Highway cycle 90 percent
. Drivetrain gear efficiency: Urban 94 percent
Highway 96 percent
The motor and generator efficiency values are 3 to 4 percent higher than those of the “best”current motor/generators.
Engine efficiency was assumed at a slightly off-peak value of 33 percent (in reality, this ishigher than the peak efficiency of small engines today). A cold-start related fuel economy loss of 5percent was also used on the urban cycle. A sample calculation is shown in table A-5; thecalculations assumes the 1995 mid-size car body and a 1995 “prototype” battery andmotor/generator with the 2005 production component efficiencies detailed above. Urban fueleconomy for the HEV “Taurus” is computed to be 32.74 mpg, and highway fuel economy is 41.2mpg, yielding a composite fuel economy of 36.07 mpg, about 30 percent better than the currentTaurus. Most of the improvement is in the urban cycle, with only a small (8.4 percent)improvement on the highway cycle.
283

The 30 percent value is an optimistic number for current technology, since every one of thecomponents have been selected to be at the 2005 expected values, which are higher than theactual observed range. It also assumes the availability of a semi-bipolar battery that can producehigh peak power for acceleration. It is easy to see that in the absence of such high peak-powercapability, fuel economy drops precipitously. If a normal lead acid battery with a peak-powercapability of 125 W/kg is used, composite fuel economy is only 24.5 mpg, which is almost 12percent lower than the conventional Taurus! These findings are in good agreement with theobserved fuel efficiency of some HEVS with conventional lead acid batteries. As noted, bothNissan and BMW reported lower fuel economy for their series hybrid vehicles, even though theyused nickel cadmium batteries with specific peak power of 125 to 150 W/kg.
284

TABLE A-1 (a): Energy Consumption as a Percent of
Total Energy Requirements for a Mid-size Car
Rolling resistanceAerodynamic dragInertia (weight) forceTotal
Tractive energyAccessory energyIdle + braking consumptionTransmission + driveline loss
Percentage of total tractive energy
City Highway Composite a
27.7 35.2 30.518.0 50.4 29.954.3 14.4 39.6100 100 100
Percentage of total fuel consumed
58.5 81.5 66.6
11.0 7.0 9.6
16.0 2.0 10.714.5 9.5 12.9
aAssumes that highway fuel economy = 1.5 X city fuel economy.
NOTE: Mid-size car of inertia weight= 1588 kg, CD= 0.33, A = 2.1 m2,CR=0.011, 3L OHV V-6,power steering, four-speed automatic transmission with lockup, air conditioning.
SOURCE: Derived from G. Sovran and M. Bohn, “Formulae for the Tractive Energy Requirements ofVehicles Driving the EPA Schedules,” SAE paper 810184, 1981.
285

TABLE A-1 (b): Energy Consumption for a Mid-size Car
Consumption in kWh/mile
City Highway CompositeTractive energy requirement 0.2064 0.1974 0.2024Transmission loss 0.0336 0.0160 0.0257Accessory energy 0.0314 0.0164 0.0247Total energy required 0.2714 0.2298 0.2528Total fuel energy used 1.2146 0.8469 1.0490Idle and braking loss 0.2314 0.0173 0.1348Total fuel used 1.4460 I 0.8642 1.1838
(22.7 mpg*) (38.0 mpg*) (27.72mpg*)Engine efficiency 22.34% 27. 13Y0 24. lo~o
(w/iflle) 18.77V0 26.59?40 21.35’Yo
*Fuel lower heating value of 32.8 kWh/gallon.
SOURCE: Energy and Environmental Analysis, Inc., “Automotive Technologies To Improve FuelEconomy to 2015,” report prepared for the Office of Technology Assessment, June 1995, p. 10-6.
286
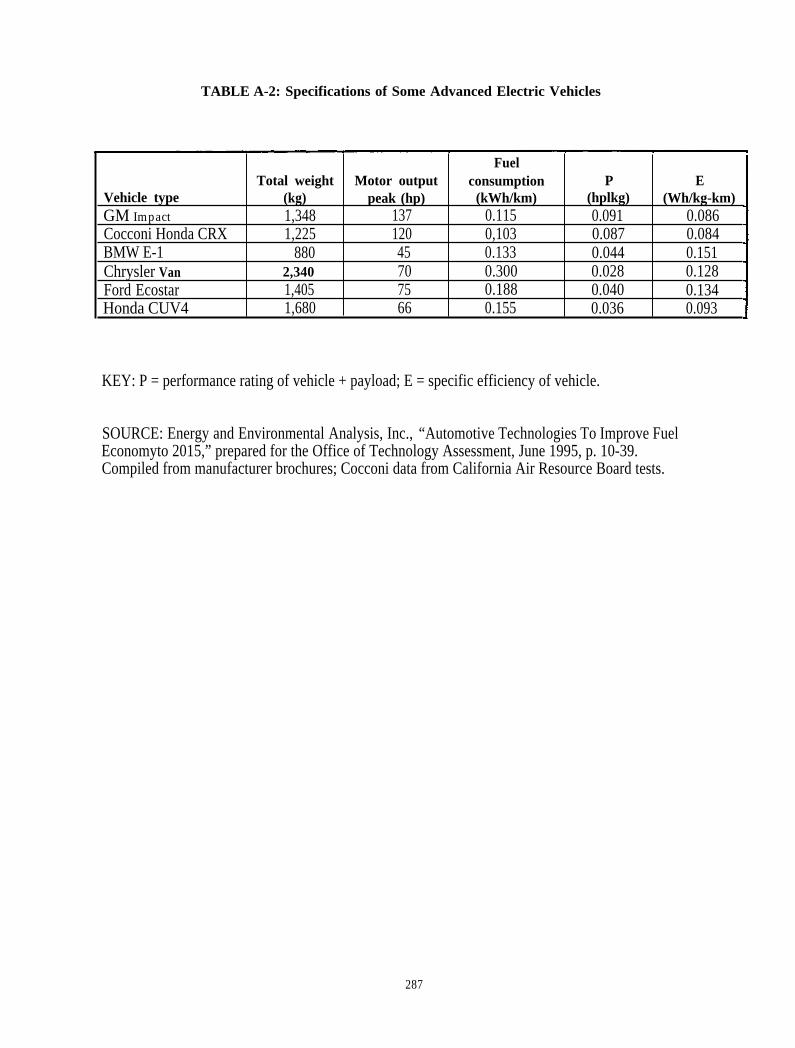
TABLE A-2: Specifications of Some Advanced Electric Vehicles
FuelTotal weight Motor output consumption P E
Vehicle type (kg) peak (hp) (kWh/km) (hplkg) (Wh/kg-km)GM Impact 1,348 137 0.115 0.091 0.086Cocconi Honda CRX 1,225 120 0,103 0.087 0.084BMW E-1 880 45 0.133 0.044 0.151Chrysler Van 2,340 70 0.300 0.028 0.128Ford Ecostar 1,405 75 0.188 0.040 0.134Honda CUV4 1,680 66 0.155 0.036 0.093
KEY: P = performance rating of vehicle + payload; E = specific efficiency of vehicle.
SOURCE: Energy and Environmental Analysis, Inc., “Automotive Technologies To Improve FuelEconomyto 2015,” prepared for the Office of Technology Assessment, June 1995, p. 10-39.Compiled from manufacturer brochures; Cocconi data from California Air Resource Board tests.
287

TABLE A-3: Engine and Accessory Weights (lbs)
I
Ford Taurus 3.OL Toyota Corolla 1.5L
Base engine 444 264
Accessoriesa 34 26
Electrical systemb 38 27
Emission controls 30 incl.
Exhaust system 33 33
Catalyst 30 24
Total 609 lbs 374 lbs(276 kg) (170 kg)
output 105 kW 78 kW
Specific output 0.3 kWlkg 0.460 kW/kg
Specific weight 2.63 kg/kW 2.17 kg/kW
aIncludes radiator, water pump, hoses, coolant.bIncludti s~rter, alternator and ignition sYstem
SOURCE: American Automobile Manufacturers Association, 1994.
288
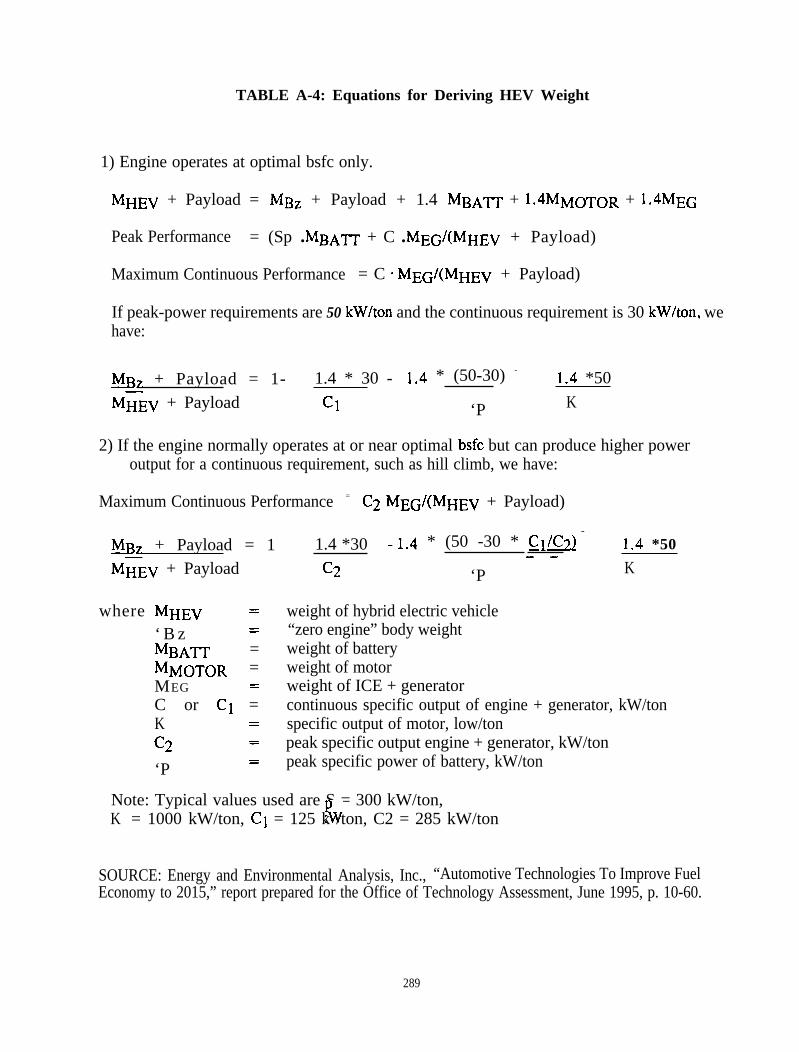
TABLE A-4: Equations for Deriving HEV Weight
1) Engine operates at optimal bsfc only.
MHEV + Payload = MBZ + Payload + 1.4 MBA~ + 1.4MM0T0R + 1.4MEG
Peak Performance = (Sp ● MBA~ + C ● MEG/(MHEV + Payload)
Maximum Continuous Performance = C s MEG/(MHEV + Payload)
If peak-power requirements are 50 kW/ton and the continuous requirement is 30 kW/ton, wehave:
~z + Payload = 1- 1.4 * 30 - 1.4 * (50-30) -
1.4 *50
M~EV + Payload c1 ‘P K
2) If the engine normally operates at or near optimal bsfc but can produce higher poweroutput for a continuous requirement, such as hill climb, we have:
Maximum Continuous Performance = C2
~z + Payload = 1M~EV + Payload
where MHEV =
‘ B z =MBA~ =MMOTOR =MEG =C or Cl =K =C2 =
‘P=
1.4 *30C2
MEG/(MHEV + Payload)
- 14 * (50 -30 * C]/c?.) -. 1.4 *50-—
‘P K
weight of hybrid electric vehicle“zero engine” body weightweight of batteryweight of motorweight of ICE + generatorcontinuous specific output of engine + generator, kW/tonspecific output of motor, low/tonpeak specific output engine + generator, kW/tonpeak specific power of battery, kW/ton
Note: Typical values used are S = 300 kW/ton,K b= 1000 kW/ton, Cl = 125 k /ton, C2 = 285 kW/ton
SOURCE: Energy and Environmental Analysis, Inc., “Automotive Technologies To Improve FuelEconomy to 2015,” report prepared for the Office of Technology Assessment, June 1995, p. 10-60.
289

TABLE A-5: Energy Use for a Current (1995)Mid-size Car Converted to an HEV
(kWh)
Urban
Tractive energy 0.201
Motor output 0.214
Regenerative braking recovery 0.045
Tractive energy input 0.216
Engine outputa 0.315
Fuel economy, mpg 32.7
Percent improvement over 1995 base 44.1
Highway
0.184
0.192
0.008
0.205
0.263
41.2
8.4
ZIAs~um~ ba~eri~ r~harged to initial state at end Of Cycle. Analysis assumes highly optimizedelectrical drivetrain components.
SOURCE: Energy and Environmental Analysis, Inc., “Automotive Technologies To Improve FuelEconomy to 2015,” report prepared for the Office of Technology Assessment, June 1995, p. 1O-64..
290

NOTE: Numbers indicate urban energy distribution. Numbers in parentheses indicate highway energy distribution.SOURCE: Partnership for a New Generation of Vehicles.
291
(4,308-391)
SOURCE: M. Ross and W. Wu, “Fuel Economy of a Hybrid Car Based on a Buffered Fuel-Engine Operating at itsOptimal Point,” SAE paper 95000,1995.
292

2.93
2.68
2.43
2.26 Finaldrive ratio
4- speed transmissionperformance vs economy
293
13 12 11 10 9
Vehicle performance (0-60 mph in seconds)
SOURCE: Energy and Environmental Analysis, Inc., “Automotive Technologies to Improve Fuel Economy to 201 5,”prepared for the Office of Technology Assessment, June 1995, pp 10-13.
294

1.0
0.5
0 1 2 3 4 5
SOURCE: Energy and Environmental Analysis, Inc., “Automotive Technologies to Improve Fuel Economy to 2015,”prepared for the Office of Technology Assessment, June 1995, p. 10-41.
295