Embed Size (px)
Citation preview

U.S. Department of Energy |December 2014
Evaluating Electric Vehicle Charging Impacts and Customer Charging Behaviors Page i

U.S. Department of Energy |December 2014
Evaluating Electric Vehicle Charging Impacts and Customer Charging Behaviors Page ii
Table of Contents
Executive Summary ......................................................................................................................... iii
1. Introduction ............................................................................................................................. 1
2. Overview of the Featured SGIG Projects ................................................................................. 5
3. Project Results and Lessons Learned..................................................................................... 11
4. Future Plans ........................................................................................................................... 18
5. Where to Find Additional Information .................................................................................. 20

U.S. Department of Energy |December 2014
Evaluating Electric Vehicle Charging Impacts and Customer Charging Behaviors Page iii
Under the American Recovery and
Reinvestment Act of 2009 (Recovery
Act), the U.S. Department of Energy
and the electricity industry have jointly
invested over $7.9 billion in 99 cost-
shared Smart Grid Investment Grant
projects to modernize the electric grid,
strengthen cybersecurity, improve
interoperability, and collect an
unprecedented level of data on smart
grid and customer operations.
Executive Summary
The electric power industry expects a 400% growth in
annual sales of plug-in electric vehicles by 2023,1 which
may substantially increase electricity usage and peak
demand in high adoption areas. Understanding
customer charging patterns can help utilities anticipate
future infrastructure changes that will be needed to
handle large vehicle charging loads. Under the U.S.
Department of Energy’s (DOE) Smart Grid Investment
Grant (SGIG) program, six utilities evaluated operations
and customer charging behaviors for in-home and
public electric vehicle charging stations:
Burbank Water and Power (BWP)
Duke Energy (Duke)
Indianapolis Power & Light Company (IPL)
Madison Gas and Electric (MGE)
Progress Energy (now part of Duke Energy as a result of a merger in 2012)
Sacramento Municipal Utility District (SMUD)
While specific project objectives varied, the utilities evaluated the technical performance of the
charging systems, the potential grid impacts of charging during peak periods, and the potential
need for distribution system upgrades and capacity additions to meet expected electricity
demand growth from rising adoption of plug-in electric vehicles. The six SGIG projects
evaluated more than 270 public charging stations in parking lots and garages and more than
700 residential charging units in customers’ homes.
Major Findings
There are relatively few plug-in electric vehicles on the road today; as a result the six SGIG
projects focused on establishing the charging infrastructure with a relatively low number of
stations and evaluated a small number of participating vehicles. As expected, project results
showed negligible grid impacts from small-scale electric vehicle charging today, but gave
utilities important insights into the demand growth and peak-period charging habits they can
anticipate if electric vehicle adoption rises as expected over the next decade. Utilities face a
challenge in determining when their customers purchase electric vehicles, and where and when
they will plug-in to satisfy charging needs.
1 Navigant Research, “Electric vehicle geographic forecasts,” http://www.navigantresearch.com/research/electric-
vehicle-geographic-forecasts.

U.S. Department of Energy |December 2014
Evaluating Electric Vehicle Charging Impacts and Customer Charging Behaviors Page iv
Given the current rate of customer electric vehicle adoption, utilities are considering plans for
electric vehicle charging programs. For example, BWP analysis showed that with a 25% per year
growth in usage at public charging stations, utility investments could have a seven-year payback,
which would be a financially attractive business case for some utilities. Table 1 provides a
summary of the key project experiences from the six projects.
Table 1. Summary of Key Project Experiences
Charging
Behaviors
i. The vast majority of in-home charging participants charged their
vehicles overnight during off-peak periods. Where offered, time-
based rates were successful in encouraging greater off-peak charging.
ii. Public charging station usage was low, but primarily took place
during business hours and thus increased the overlap with typical
peak periods. Plug-in hybrid owners frequently used the (often free)
public stations for short charging sessions to “top off their tanks.”
Grid Impacts
iii. The length of charging sessions and the power required varies based
on the vehicle model, charger type, and state of battery discharge.
iv. The average power demand to charge most vehicles was 3-6
kilowatts, which is roughly equivalent to powering a small, residential
air conditioning unit.
v. However, depending on the model, the load from one electric vehicle
model can be as much as 19 kilowatts, which is more than the load
for most large, single-family homes.
Technology
Issues
vi. Faster chargers may require more expertise to install in homes and
public stations. Installing a 240-volt charging station, which typically
charges 3-5 times as fast as a charger using a standard 120-volt outlet,
requires a licensed electrician and occasionally service upgrades.
vii. Public charging station installation had high costs and required
substantial coordination with equipment vendors, installers, and host
organizations to address construction, safety, and code requirements.
viii. Low usage at public charging stations will require longer capital cost
recovery without substantial growth in usage.
ix. Some utilities found residential interoperability problems in
communication between smart meters and charging stations. SMUD
found that the two devices only connected successfully about 50% of
the time during load reduction events.
U.S. Department of Energy |December 2014
Evaluating Electric Vehicle Charging Impacts and Customer Charging Behaviors Page 1
1. Introduction
Early adopters are now bringing plug-in electric vehicles to the roads in small numbers, while
manufacturers anticipate steadily rising growth over the next decade. Electric vehicle success
will in part depend on whether consumers can plug vehicles in and charge them when and
where they need to. Customers will need charging stations in their homes and readily available
in common public locations such as workplaces, parking garages, and parking lots.
To accommodate large electric vehicle charging loads as sales grow, utilities may need to
upgrade electric distribution systems, add capacity, and introduce pricing options that
encourage off-peak charging so that growing loads do not exacerbate peak demand. Smart grid
technologies such as advanced metering infrastructure (AMI) are key enablers of electric
vehicle adoption by allowing charging station integration with time-based rates that encourage
off-peak charging. AMI metering also allows utilities to analyze charging station usage and
charging behaviors based on time of use to inform investment decisions.
1.1 Goals and Objectives for the Six Featured SGIG Projects
Six SGIG projects evaluated electric vehicle charging station technologies and consumer use to
provide data that will help each individual utility answer two key questions:
How long will existing electric distribution infrastructure remain sufficient to
accommodate demand growth from electric vehicles, and when and what type of
capacity upgrades or additions may be needed?
When will consumers want to recharge vehicles, and to what extent can pricing and
incentives encourage consumers to charge during off-peak periods?
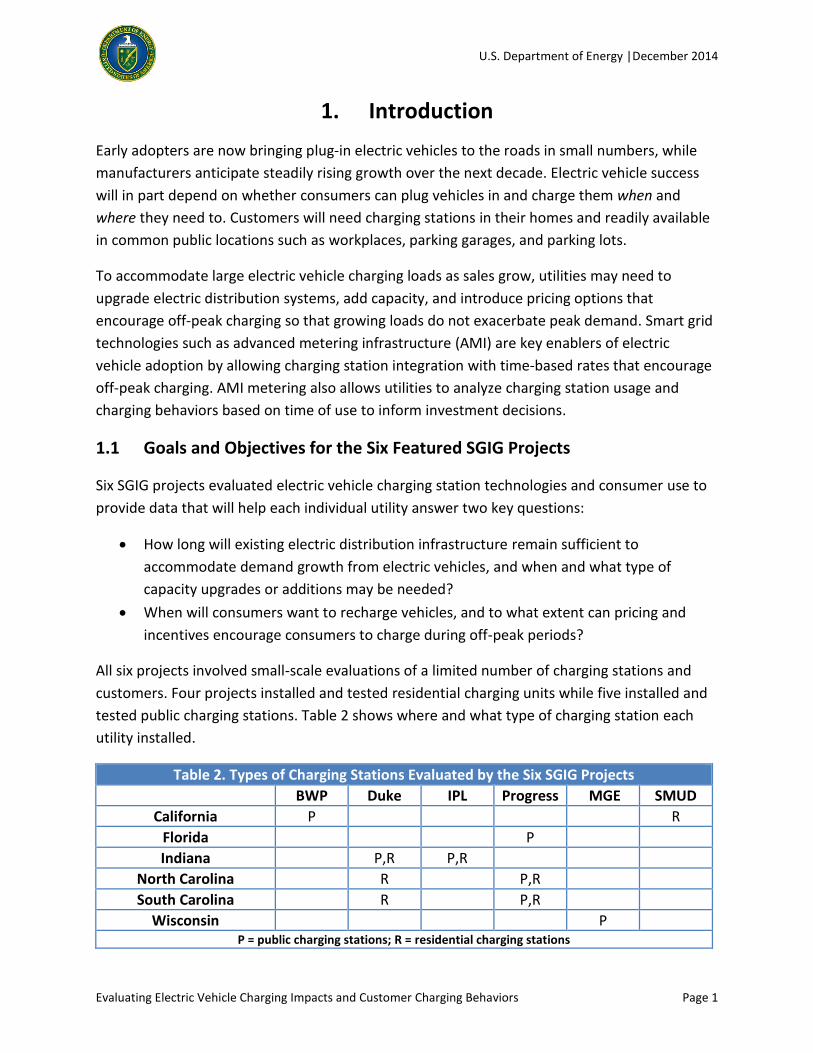
All six projects involved small-scale evaluations of a limited number of charging stations and
customers. Four projects installed and tested residential charging units while five installed and
tested public charging stations. Table 2 shows where and what type of charging station each
utility installed.
Table 2. Types of Charging Stations Evaluated by the Six SGIG Projects
BWP Duke IPL Progress MGE SMUD
California P R
Florida P
Indiana P,R P,R
North Carolina R P,R
South Carolina R P,R
Wisconsin P P = public charging stations; R = residential charging stations

U.S. Department of Energy |December 2014
Evaluating Electric Vehicle Charging Impacts and Customer Charging Behaviors Page 2
Projects also evaluated equipment performance and interoperability, operational processes
and back-office support, customer acceptance and outreach, business models (e.g., use of third
parties versus in-house operations), and pricing alternatives, including time-based rates, cost
per hour, cost per kilowatt-hour, and no-cost charging.
In addition to the six projects whose results are discussed in this report, there are several other
Recovery Act-funded projects under the Smart Grid Demonstration Program (SGDP) that are
evaluating technology, policy, and market issues with electric vehicles and charging
infrastructure. For example, AEP Ohio’s project evaluates the effects of different time-based
rate programs on customer charging behaviors and assesses residential, workplace, and public
charging locations and impacts on distribution system equipment. The Los Angeles Department
of Water and Power’s project (in which the University of California at Los Angeles was a sub-
recipient) also evaluates charging behaviors and smart charging strategies and assesses policy
options, price-based controls, and distributed intelligence between vehicles, smart chargers,
parking garage infrastructure, and cloud computing systems. Pecan Street Inc.’s project
evaluates customer charging patterns and their impacts on distribution transformers, and
assesses electric vehicle adoption and driver behaviors.
1.2 Electric Vehicle Markets Today
Utilities are closely monitoring sales for plug-in hybrid and all-electric vehicles because of their
potential impacts on electricity demand and the opportunity they provide for new business.
Figure 1 shows a steady increase in monthly sales of plug-in hybrids and all-electric vehicles
since 2011, along with a growing number of manufacturers and models that increase customer
choice. Though they represent a small portion of the more than 260 million passenger vehicles
in the U.S., electric vehicles are expected to grow from nearly 296,000 in 2014 to more than 2.7
million in 2023.2
The pace and geographic distribution of future sales are uncertain. Key drivers in some states
are new policies and incentives that favor electric vehicle adoption along with state and federal
tax credits for electric vehicle purchases. High sales growth is expected first in states like
California where policies and incentives are strongest.
2 Navigant Research, “Plug-in electric vehicles on roads in the United States will surpass 2.7 million by 2023,”
http://www.navigantresearch.com/newsroom/plug-in-electric-vehicles-on-roads-in-the-united-states-will-surpass-2-7-million-by-2023.

U.S. Department of Energy |December 2014
Evaluating Electric Vehicle Charging Impacts and Customer Charging Behaviors Page 3
Figure 2. Example of Residential
AC Level 2 Charging Station Used
by MGE Customers
1.3 Electric Vehicle Charging Equipment
Electric vehicle charging stations are available in 120-
volt, 240-volt, and 480-volt models. Many different
models are available with different power levels that
determine the speed with which they recharge vehicle
batteries. The most common type of charger is a
portable 120-volt special charging cord, referred to as
AC Level 1 charging, which typically provides 3-5 miles
of range per hour of charge. Depending on the size of
the battery, and the initial state of charge, this could
take 8 to 20 hours to fully charge a depleted battery.
Some makes and models—particularly all-electric
vehicles or those with larger battery packs—may take
about 20 to 60 hours to charge a fully depleted battery
at 120 volts. While 120-volt charging is relatively slow, it can often be accomplished with little
to no additional cost or installation work if an outlet is already available at home.
Figure 1. Monthly Sales of Electric Vehicles in the U.S., 2011 – 2014

U.S. Department of Energy |December 2014
Evaluating Electric Vehicle Charging Impacts and Customer Charging Behaviors Page 4
Figure 3. Example of AC Level 2
Public Charging Station Installed
by MGE
Users can cut charging times significantly by installing
AC Level 2, 240-volt charging stations. However, these
systems can add $600-$3,600 to the cost of in-home
charging, depending on the availability of power in the
electric panel. Typically, installations require permits
and licensed electricians. While not all residential users
opt for them, most public charging stations today use
AC Level 2 charging stations. Figure 2 and Figure 3
show examples of residential and commercial AC Level
2 charging station in the MGE project.
The six SGIG projects tested both AC Level 1 and Level
2 charging. DC fast charging, which typically use three-
phase 208 or 480 volts, can reduce charging times
significantly, but were not tested in these projects.
These units require power supplies with 25-50
kilowatts of capacity. Total costs can range from $50,000 to $100,000 per system and require
special equipment, installation procedures, and permits. Such units would be ideal for high-
throughput, public charging and may eventually become attractive in regions where electric
vehicle adoption grows substantially, and customers require fast charging in public locations.

U.S. Department of Energy |December 2014
Evaluating Electric Vehicle Charging Impacts and Customer Charging Behaviors Page 5
2. Overview of the Featured SGIG Projects
Six SGIG utilities are evaluating in-home and/or public charging equipment and consumer
charging behaviors for plug-in electric vehicles:
Burbank Water and Power (BWP)
Duke Energy (Duke)
Indianapolis Power & Light Company (IPL)
Madison Gas and Electric (MGE)
Progress Energy (Progress, now part of Duke Energy as a result of a merger in 2012)
Sacramento Municipal Utility District (SMUD)
2.1 Burbank Water and Power (BWP)
Utility and Project Overview: BWP provides electricity and water services to more than 51,000
residential, commercial, and industrial customers in the city of Burbank, California, which has a
population of more than 108,000. As of July 2013, BWP market research showed a total of
about 30,000 electric vehicles in California, including about 99 in Burbank.3
BWP’s SGIG project has a total budget of almost $51 million, including DOE funding of $20
million. The project includes system-wide deployment of advanced metering infrastructure,
communications networks, and systems for meter data management; more than 50,000 smart
meters; customer systems including in-home displays and programmable communicating
thermostats; distribution automation equipment for more than 100 feeders; systems for
integrating customer-owned ice storage systems for load management; and 11 public charging
stations.
Charging Station Evaluations: Eleven 120- and 240-volt stations were installed at six locations,
including three privately-owned and three city-owned parking lots. Nine of the stations are in
downtown locations and each draws about the same amount of power as residential central air
conditioning units. Project objectives include evaluation of charger load characteristics, pricing
options for charging and customer responses, charger demand response capabilities, and the
impacts of charging on utility infrastructure and operations.
While a relatively small part of the overall SGIG project, BWP’s charging station activities
contribute to the city’s sustainability goals and the community’s response to California’s Zero
Emission Vehicle mandate (which sets a target for zero-emission vehicle purchases and
provides incentives to increase consumer demand for electric vehicles).
3 BWP, August 2013 Status Report – Electric Vehicle Charging Demonstration Program, August 2013

U.S. Department of Energy |December 2014
Evaluating Electric Vehicle Charging Impacts and Customer Charging Behaviors Page 6
Figure 5. Example of an
AC Level 2 Commercial
Charging Station Installed
by Duke
Figure 4. Example of
an AC Level 1
Residential Charging
Station Installed by
Duke
2.2 Duke Energy
Utility and Project Overview: Duke Energy, headquartered in
Charlotte, North Carolina, provides electric service to 7.2 million
electric customers and gas services to about 500,000 customers in
the Southeast and Midwest. Duke is also an energy supplier and
operates more than 57 gigawatts of electric generating capacity
and a natural gas distribution infrastructure in Ohio and Kentucky.
Duke’s SGIG project has a total budget of almost $556 million,
including DOE funding of $200 million. The project includes
deployment of advanced metering infrastructure, communications networks, and systems for
meter data management; more than 1 million smart meters; customer systems such as in-home
displays, web portals, and time-based rate programs; distribution automation equipment such
as automated feeder switches, capacitors, and line monitors; and residential and commercial
electric vehicle charging stations in North and South Carolina and Indiana. Figure 4 and Figure 5
provide examples of Duke’s residential and public charging stations.
Charging Station Evaluations: Duke’s “Charge Carolinas”
project includes 150 residential stations North and South
Carolina, while its “Plug-IN” project includes 85 residential and
47 commercial stations in Indiana.4 Charging station evaluation
objectives include: assessing the performance and customer
acceptance of vehicle charging equipment; analyzing load
profile data to determine grid impacts; assessing installation
and maintenance costs for the utility and customers; and
achieving a better understanding of future infrastructure needs
from projected increases in demand for electric vehicles over
the long term.
2.3 Indianapolis Power and Light Company (IPL)
Utility and Project Overview: IPL provides retail electric service to more than 470,000
residential, commercial, and industrial customers in Indianapolis, Indiana, and other nearby
communities. IPL operates four power plants with more than 3 gigawatts of capacity.
4 Duke was a sub-recipient for a federal grant for the state of Indiana on this project. This effort was not funded
under the SGIG program.

U.S. Department of Energy |December 2014
Evaluating Electric Vehicle Charging Impacts and Customer Charging Behaviors Page 7
Figure 6. Example of a 240-Volt
Commercial Charging Station
Installed by IPL
Figure 7. Indianapolis Locations of 9
Public Charging Stations
IPL’s SGIG project has a total budget of almost $49
million, including $20 million in DOE funding. The
project includes deployment of advanced metering
infrastructure, communications networks, and systems
for meter data management; more than 10,000 smart
meters; customer systems such as home area
networks, web portals, and programmable
communicating thermostats; distribution automation
systems such as automated feeder switches,
capacitors, voltage regulators, and equipment
monitors; and more than 170 electric vehicle charging
stations. Figure 6 shows a commercial charging station
installed by IPL. Figure 7 shows a map of the Indianapolis-area charging station locations.
Charging Station Evaluations: IPL evaluated more than 170 residential, commercial, and public
electric vehicle charging stations (240 volts) in 114 locations. Evaluation objectives include
gaining insights into the potential impacts on distribution systems; understanding customer
expectations and vehicle charging patterns; testing new equipment and time-based rates for
encouraging off-peak charging; and determining customer acceptance of electric vehicles and
their “range anxiety” when depending on public
charging.
The project includes 89 residential units at
individual homes and 51 fleet installations at 14
commercial locations, including IPL’s operations
center, car dealerships, local universities, and
the Indianapolis Department of Public Works.
The project also included 22 installations at 9
public locations including parking garages, a
library branch, university, and community
center. In addition, the project included 10
secondary or back-up installations at 3 locations
including a manufacturing facility and the
Indianapolis Zoo.
2.4 Madison Gas and Electric (MGE)
Utility and Project Overview: MGE serves 141,000 electric customers in Madison, Wisconsin
and several surrounding Dane County communities. MGE also serves about 147,000 natural gas
customers in Dane, and six neighboring counties. The total population served exceeds 300,000.

U.S. Department of Energy |December 2014
Evaluating Electric Vehicle Charging Impacts and Customer Charging Behaviors Page 8
Figure 9. Residential
Charger Installed by
Progress Energy
Figure 8. MGE Metering
System for Collecting
Charging Data
MGE owns and operates electric power plants and purchases additional resources from the
Midwest Independent System Operator.
MGE’s SGIG project has a total budget of about $11 million, including DOE funding of about
$5.5 million. The project includes deployment of advanced metering infrastructure,
communications networks, and systems for meter data management; about 4,500 smart
meters; distribution management systems; 19 public charging stations, in addition to 6 existing
ones; and advanced metering at 26 residential charging stations.
Charging Station Evaluations: MGE’s charging stations are
located at ten different public locations and have two outlets
per station: one for charging at 120 volts, the other for charging
at 240 volts. Both outlets can be used by customers
simultaneously. Evaluation objectives include assessing
technical performance and customer acceptance of charging
equipment; pricing options to encourage of-peak charging; and
grid impacts. Figure 8 shows the metering system used to
collect charging data from MGE customers.
MGE conducted education and outreach activities to inform
vehicle owners, auto dealerships, and host entities for the public charging stations about how
to use the systems safely and how patterns of charging behavior can affect grid operations and
electricity costs.
2.5 Progress Energy
Utility and Project Overview: Progress Energy serves more than
3 million customers in North and South Carolina and Florida. In
2012, Progress Energy merged with Duke Energy.
Progress Energy’s SGIG project has a total budget of more than
$520 million, including DOE funding of $200 million. The project
includes deployment of advanced metering infrastructure,
communications networks, and systems for meter data
management; 160,000 smart meters; customer systems such as
190,000 load control devices, time-based rate programs, and
customer web portals; distribution automation equipment for
more than 2,400 feeders such as automated switches,
capacitors, and voltage regulators; and more than 300 AC Level
2 electric vehicle charging stations. Figure 9 show a residential charger.

U.S. Department of Energy |December 2014
Evaluating Electric Vehicle Charging Impacts and Customer Charging Behaviors Page 9
Figure 10. SMUD Service Territory
Map
Charging Station Evaluations: Residential chargers were installed at 188 locations in North and
South Carolina, while public charging stations were installed at 46 locations in North and South
Carolina and 68 locations in Florida. Evaluation objectives include: collecting and analyzing
charging data and assessing patterns of charging behaviors; assessing charging station
installation and maintenance costs; and determining market readiness of vehicles, stations, and
supporting grid infrastructure, consumers, and local conditions.
2.6 Sacramento Municipal Utility District (SMUD)
Utility and Project Overview: SMUD serves about
620,000 residential and commercial customers in
Sacramento, California and surrounding communities
in Placer County. SMUD has a summer peak demand of
about 3 gigawatts, driven largely by residential and
commercial air conditioning. SMUD serves a total
population of more than 1.4 million. Figure 10 shows a
service territory map.
SMUD’s SGIG project has a total budget of almost $308
million, including DOE funding of almost $128 million.
The project includes deployment of advanced metering
infrastructure, communications networks, and systems
for meter data management; 617,000 smart meters;
customer systems such as in-home displays,
programmable communicating thermostats, direct load
control devices, and time-based rate programs; distribution automation equipment for more
than 170 feeders such as automated switches and capacitors; and 80 electric vehicle charging
stations.
Time-Of-Use Rate and Charging Station Evaluations: SMUD conducted a Residential Electric
Vehicle Pilot Program with roughly 200 vehicle participants to better understand off-peak
charging potential with time-of-use rates and dynamic rate options. SMUD tested two different
time-of-use pricing plans to determine driver satisfaction: a Whole House Time-of-Use pricing
plan and a Dedicated Meter Pricing Plan that was sub-metered. The latter rate included up to
12 Conservation Days when customers were signaled to reduce load during peak hours. Both
pricing plans experienced high customer satisfaction. Table 3 summarizes the three residential
treatment groups evaluated by SMUD.

U.S. Department of Energy |December 2014
Evaluating Electric Vehicle Charging Impacts and Customer Charging Behaviors Page 10
Table 3. Summary of SMUD Electric Vehicle Charging Options
Treatment Groups Descriptions Whole House Time-
of-Use Plan Level 1 charging only (120V); 39 participants
Single smart meter monitors combined house and electric vehicle usage
Wave 1: No initial incentive; Wave 2: Convenience cord-set valued at $595
No Conservation Day participation
Dedicated Meter Time-of-Use Plan
(Self-Managed during Conservation Day
events)
• Level 1 and 2 charging (120V and 240V); 98 participants • AMI time-of-use sub-meter on dedicated circuit monitors electric vehicle usage • Wave 1: Installation of Meter Socket Box valued at ~$600; Wave 2: If already has
sub-meter, received $599 rebate • No utility control. Participant was responsible for reducing load during
Conservation Days, or they would incur a demand charge of $3.50/kW in addition to the time-of-use peak energy charge of $0.42/kWh.
Dedicated Meter Time-of-Use Plan (SMUD Managed
during Conservation Day events)
• Level 2 charging (240V); 60 participants • AMI time-of-use sub-meter on dedicated circuit monitors electric vehicle usage • Installation of Dedicated Circuit, Meter Socket Box, and smart charging station
with ZigBee radio to receive load reduction signals from SMUD. Total value: ~$3,600.
• On Conservation Days, SMUD would send a signal to the SMUD-controlled charging station, signaling the connected electric vehicle to reduce load to 1.4kW during the peak hours from 2 pm to midnight.

U.S. Department of Energy |December 2014
Evaluating Electric Vehicle Charging Impacts and Customer Charging Behaviors Page 11
Figure 11. Charging Patterns with (TOU) and without (RES) Whole
House Time-of-Use Rate during Summer Weekdays at Progress
Energy (Peak period is in gray)
3. Project Results and Lessons Learned
While electric vehicle markets are in early development and adopters are just beginning to
establish regular charging schedules, the projects delivered valuable data that utilities continue
to analyze. Evaluation of charging station usage and behavior provides key insight that can
inform utility decisions as plug-in electric vehicle adoption rises.
The utilities identified several common technical and market needs that must be met before
electric vehicle charging stations can be adopted more widely:
1. Improve significantly the reliability of communications and ease of integration between
smart meters and charging stations.
2. Achieve better coordination with equipment vendors to ensure that performance
specifications are understood and properly implemented.
3. Reduce the costs for equipment and maintenance for public charging stations.
4. Make Level 2 chargers available to residential customers in a convenient and cost-
effective manner.
5. Develop pricing strategies for public stations that encourage consumers to use them,
don’t exacerbate peak demands, and enable profitable business models for ownership
and operation.
3.1 Charging Behaviors
Charging behaviors differ depending on whether the customer is charging at home or at a
public station, and what type of vehicle they have—either an all-electric vehicle or a plug-in
hybrid. IPL found that approximately 76% of the electricity used for charging occurred during
off-peak periods, an
additional 4%
occurred during mid-
peak, and the
remaining 20%
occurred during peak
periods. Figure 11
from Progress Energy
shows differences in
charging patterns with
and without time-
based rates.

U.S. Department of Energy |December 2014
Evaluating Electric Vehicle Charging Impacts and Customer Charging Behaviors Page 12
Customers took advantage of time-based rates to save on overnight residential charging.
Participants generally prefer charging their cars overnight at home. Time-based rates
encouraged off-peak charging and provided savings for overnight chargers. The rates were
especially convenient when customers could pre-program charging sessions to start when off-
peak rates came into effect.
Plug-in hybrid owners with quicker charging times “top off” at public charging stations more
frequently than all-electric owners. MGE learned that plug-in hybrid electric drivers often use
public charging stations—especially where free public charging was available—before returning
home. All-electric drivers more often chose to wait and charge their depleted batteries at
home, in large part because of the longer times required to charge the all-electric vehicle
batteries. Duke Energy reported over 84% of charging sessions at public retail locations lasted
less than 2 hours, while only 45% of sessions at office and municipal locations lasted under two
hours. This highlights the different utilization and charge profiles that may be expected in
different locations.
Burbank similarly reported that most charging sessions at its public stations lasted 1-2 hours,
though there were sessions that lasted 8 hours and longer. As shown in Figure 12, Burbank
found that 52% of sessions were 2 hours or less and that only 6% of sessions exceeded 4 hours.
Public charging stations were used primarily during the day and increased potential overlap
with peak periods. Commercial and public stations were used mostly during business hours,
and as such, there was a higher likelihood for overlap with typical peak time periods for utilities.
While this is usually the late afternoon in the summertime, exact peak times will vary based on
Figure 12. Data on the Length of Charging Session from Burbank

U.S. Department of Energy |December 2014
Evaluating Electric Vehicle Charging Impacts and Customer Charging Behaviors Page 13
Figure 13. Percentage of Charging Sessions by Time-of-Day
for Commercial Charging Stations at Progress Energy
the utility. Figure 13 shows data from Progress Energy on public charging patterns, with the vast
majority of charging sessions occurring between 9:00 a.m. and 7:00 p.m. Public charging
stations were used infrequently compared to residential units.
Low electric vehicle adoption resulted in limited use of public charging stations. The utilities
generally did not observe public stations causing demand impacts; therefore the analysis
focused on customer acceptance and use, and several utilities offered promotional rates to
encourage access. For
example, IPL offered
customers a $2.50 flat rate
with unlimited duration and
still observed low levels of
use. Several offered free
charging, though customer
use was still low despite the
clear incentive. With time and
sales growth the utilities
expect use of public stations
to grow. MGE, for example,
saw driver enrollments grow
from 8 to 123 over a one-year period.
Extended duration charging sessions at public stations—longer than necessary to complete
charging—reduces the number of chargers available for other drivers. MGE found public
station users occupied the stations about 45 minutes longer on average than was needed to
charge the batteries. This caused problems as the station was unavailable during these periods
for other drivers to use.
3.2 Grid Impacts
Project results indicate that as the numbers of electric vehicles on the road increases, utilities
may need to upgrade existing infrastructure or build new capacity to handle growth in
electricity demand. These actions can be mitigated if electric vehicles charge when air
conditioning use begins to decrease.
Current electric vehicles have chargers rated at from about 3 kilowatts to 20 kilowatts, whereas
the grid-connected chargers are Level 1 AC at 120 volts, Level 2 AC at 240 volts, and DC fast
chargers at usually 480 volts. Charger demand capacity is independent from the size of the car
battery pack. For example, MGE found that the most common all-electric vehicle in the MGE
program averaged 3.7 kilowatts and the most common hybrid-electric vehicle in the MGE
program averaged 3.2 kilowatts during home charging sessions with the Level 2 240-volt units.
U.S. Department of Energy |December 2014
Evaluating Electric Vehicle Charging Impacts and Customer Charging Behaviors Page 14
Plug-in hybrid electric vehicles have battery sizes that range from 7 kilowatt-hours to 17
kilowatt-hours, and battery-only electric vehicles have battery sizes that range from about 20
kilowatt-hours to 50 kilowatt-hours, or greater. Charger size determines how fast the battery
draws energy from the grid; battery size relates to the amount of energy stored.
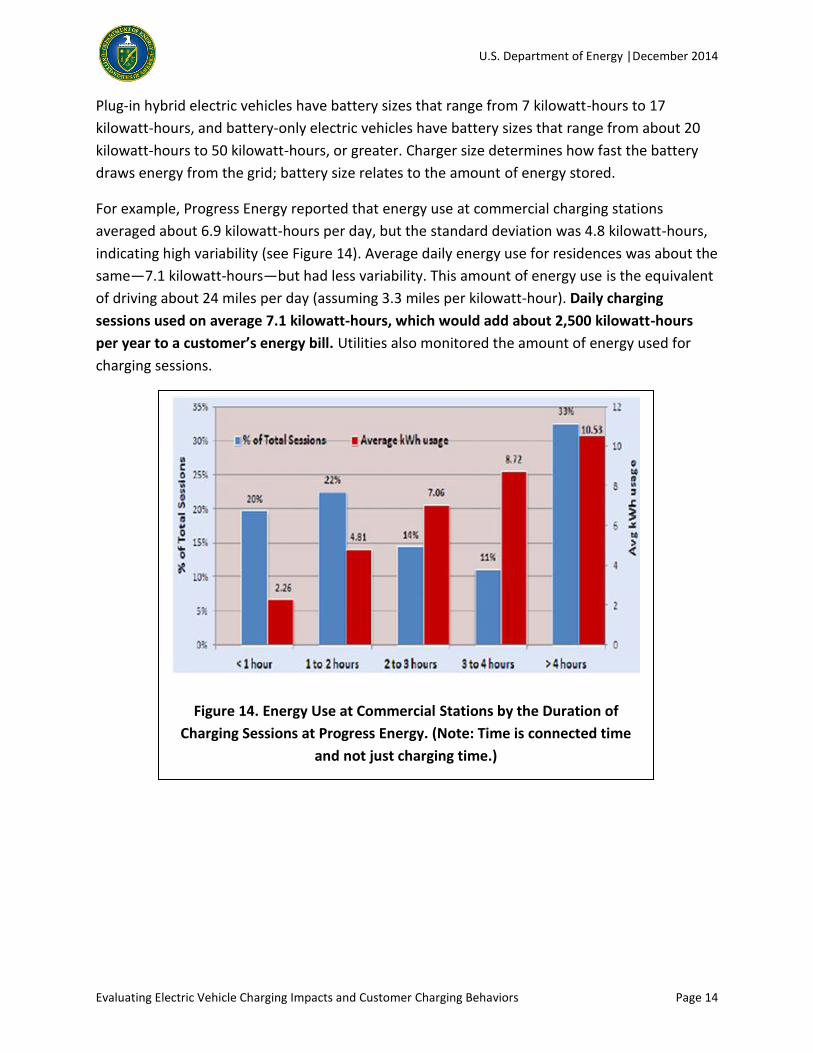
For example, Progress Energy reported that energy use at commercial charging stations
averaged about 6.9 kilowatt-hours per day, but the standard deviation was 4.8 kilowatt-hours,
indicating high variability (see Figure 14). Average daily energy use for residences was about the
same—7.1 kilowatt-hours—but had less variability. This amount of energy use is the equivalent
of driving about 24 miles per day (assuming 3.3 miles per kilowatt-hour). Daily charging
sessions used on average 7.1 kilowatt-hours, which would add about 2,500 kilowatt-hours
per year to a customer’s energy bill. Utilities also monitored the amount of energy used for
charging sessions.
Figure 14. Energy Use at Commercial Stations by the Duration of
Charging Sessions at Progress Energy. (Note: Time is connected time
and not just charging time.)

U.S. Department of Energy |December 2014
Evaluating Electric Vehicle Charging Impacts and Customer Charging Behaviors Page 15
Figure 15 shows how energy use varies by the time of day and the length of residential charging
sessions at Progress Energy.
Key potential adverse impacts on the grid include overloading circuits by excessive demand
on any particular circuit, at any particular time. This can be mitigated by tracking the number
and location of Level 2 AC chargers on residential customers. Smart grid technologies enable
utilities to more easily monitor this potential overload problem. In addition, deployment of DC
fast chargers could easily overload most residential neighborhood circuits, so their installations
should be and commonly are managed by utilities. Properly designed and installed chargers of
any size can be safely installed in suitable locations on the grid.
Secondly, with increased volumes of car charging, there is a cost and reliability impact if an
excessive number of charging sessions occur during the peak hours of the day. Time-of-use
rates may be used to encourage customers to charge their vehicles during off-peak periods.
3.3 Technology and Cost Issues
Customers strongly prefer shorter charging sessions, but this requires higher-voltage charging
stations that can add from $600 to $3,600 per residential installation. Reducing installation
costs is a top-priority issue for the electric vehicle industry. Table 4, from MGE, provides
information about typical charging times for plug-in hybrid and all-electric vehicles. The table
shows that times can be greatly shortened with higher power charging units.
Table 4. Typical Charging Times by Power Level and Electric Vehicle
Charger Voltage/Amperage Demand Impact Plug-in Hybrids All-Electrics
120 volts/<20 amps 1.4-2.0 kilowatts 6-9 hours 12-14 hours
240 volts/<80 amps <19 kilowatts 2-3 hours 3-4 hours
250-450 volts-dc/<200 amps <90 kilowatts NA 80% in 30 minutes
Figure 15. Residential Energy Use by Time-of-Day and the Duration of Charging Sessions.
(Note: Time is active charging time only.)

U.S. Department of Energy |December 2014
Evaluating Electric Vehicle Charging Impacts and Customer Charging Behaviors Page 16
While customers strongly prefer shorter sessions, the incremental cost involved has a longer
payback. The 120-volt charging units use standard wall outlets, typically requiring no
installation costs. Installation of faster charging 240-volt units typically requires a licensed
electrician to install a dedicated circuit, and in some cases a sub-meter, which SMUD found may
cost from $600 to $3,600 (including smart, electric vehicle supply equipment, or EVSE)
depending on how much work is needed. The cost of “fast charging” units that use 480 volts DC
is much higher and therefore suitable for public charging stations only.
High costs of public charging stations combined with low current use led utilities to adopt a
“wait and see” approach before installing additional stations. Several speculate that third-
party providers may have greater success. Equipment and installation costs for public charging
stations vary considerably based on the distance from the charger to the nearest electric
distribution system transformer, host site requirements for underground wiring, and Americans
with Disabilities Act compliance. All of the utilities found that costs for public stations, coupled
with their relatively low level of current use, made it difficult to develop a financially attractive
business case for public charging stations now. A BWP analysis showed that with growth in
usage of 25% per year, utility investments in public charging stations could have a seven-year
payback, which may be financially attractive enough to invest. This will require many more
electric vehicles on the road and increased demand for public charging.
Additional costs for public charging stations involve coordination with host entities and
sometimes with local officials to identify suitable sites and work out operating schedules and
availability. The utilities found a need for education to raise awareness about operating
procedures and safety requirements. As a result of total cost issues, most of the utilities do not
currently plan to build and own additional public stations until regional electric vehicle adoption
increases.
Charging station technology is not mature and some experienced meter interoperability
issues. Utilities found they need additional coordination with equipment vendors to ensure
products satisfied utility requirements. SMUD found that available products with ZigBee radios
were not mature enough for its needs, and has partnered with equipment developers to
improve performance, particularly communications interoperability between the ZigBee radio
in the charging station and the SMUD meter. SMUD found charging equipment communication
modules successfully connected to SMUD meters about 50% of the time for several reasons,
including poor ZigBee radio signal quality (often range related), problems with power supply
circuits in the EVSE communications module packet loss recovery, and environmental
interference.

U.S. Department of Energy |December 2014
Evaluating Electric Vehicle Charging Impacts and Customer Charging Behaviors Page 17
3.4 Lessons Learned
The lessons learned involved specific business process improvements and general needs for
outreach and education. The low saturation of electric vehicles resulted in no measurable grid
impacts. Table 5 is a summary of major lessons learned.
Table 5. Summary of Lessons Learned
Category Lesson Learned
Planning and Management
Initially install a small number of chargers as demonstrations, and evaluate their use to justify larger deployments.
Plan for sufficient resources to support customer issues throughout the project. A high level of customer support to address technical issues was typically required.
Conduct smaller, in-house process and field tests prior to full field implementation, perhaps using employees.
Develop detailed process maps to streamline operating procedures; guide vendors, installers, and service technicians; and provide higher quality customer services and issues resolution.
Market Development
Consider the needs of the different target markets, such as single families, multi-family housing units, fleets, employers, dealerships, and public access. Evaluate use cases for each that examines the charging patterns of the users in those segments.
Implementation
Site and installation scheduling requires hands-on attention which vendors can provide to help ensure customer satisfaction.
Locate chargers where it is convenient for the consumers, not necessarily for utilities. This will optimize utilization and shorten capital cost recovery.
In addition, all of the utilities agreed that outreach and education is important. While all of the
projects were limited in scope, and focused on studies and evaluations, not program roll-outs,
the activities involved many players and moving parts. The utilities found it valuable to educate
customers, auto dealerships, vendors, host sites, local officials, installation contractors, and
others on the program and technology prior to implementation. Public sites particularly
required coordination and negotiation with site hosts for use of space and equipment
installation. The utilities generally found outreach and coordination with outside groups to be
necessary ingredients in electric vehicle charging programs.

U.S. Department of Energy |December 2014
Evaluating Electric Vehicle Charging Impacts and Customer Charging Behaviors Page 18
4. Future Plans
While market projections are uncertain, many of the world’s major auto manufacturers are
now producing or introducing a variety of electric vehicle models, with the expectation a few
million U.S. electric vehicles on the road within the next decade. All six utilities featured in this
report will continue to assess the results of their evaluations and consider next steps for electric
vehicle charging and related activities.
BWP plans to continue monitoring electric vehicle interest—which it labels as “low but
measurable”—in its service territory and will maintain and monitor existing public charging
stations. The utility has worked with the City to establish new parking restrictions that improve
access and availability of charging stations. It also plans to install more 240-volt charging
stations and 480-volt direct current “fast chargers,” potentially at the airport and shopping
centers. BWP also recently adopted new charger service pricing (in dollars per kilowatt-hour)
that are more financially attractive and intended to attract all types of electric vehicles.
Duke Energy (including former Progress Energy) is in the process of evaluating its SGIG project
results and will determine next steps when those evaluations are complete. Charging stations
that were part of the three research projects have conveyed to the host sites as the participants
roll off the program. As Duke Energy assesses the next steps for any new charging
infrastructure projects, it will continue to work closely with industry and community
stakeholders to support education and plug-in electric vehicle readiness. In addition, Duke
Energy is also actively involved in developing standards and conducting research to support
grid-friendly charging solutions to accommodate future growth of electric vehicles.
IPL continues to monitor and analyze information from its charging stations and refine its
strategies for electric vehicle markets in Indianapolis. IPL plans to continue offering time-of-use
rates, which have been judged successful in shifting electric vehicle charging to off-peak
periods. IPL plans to expand its own fleet of electric vehicles and track their impact on
distribution infrastructure and needs for more charging stations. IPL is also working with the
City of Indianapolis to support the first all-electric car sharing program in the U.S. If approved
by the Indiana Utility Regulatory Commission, up to 1,000 electric vehicle chargers will support
a fleet of up to 500 electric vehicles by 2016. See http://www.blue-indy.com/faq for more
information.
MGE plans to continue monitoring electric vehicle interest in its service territory and test new
technologies and systems for electric vehicle charging as they become commercially available.
The utility also plans to continue evaluating alternative pricing strategies for electric vehicle
charging to assess customer acceptance and effects on charging behaviors. MGE plans to
continue education and outreach activities to inform customers, auto dealers, and charging

U.S. Department of Energy |December 2014
Evaluating Electric Vehicle Charging Impacts and Customer Charging Behaviors Page 19
station hosts about requirements for safe operations and how charging behavior patterns affect
peak demand and electricity costs.
SMUD plans to continue evaluating electric vehicle markets in Sacramento, alternative pricing
options, and impacts of the alternatives on electric distribution infrastructure. The utility is
currently evaluating the results of its SGIG project and will determine next steps when reports
are completed.

U.S. Department of Energy |December 2014
Evaluating Electric Vehicle Charging Impacts and Customer Charging Behaviors Page 20
5. Where to Find Additional Information
To learn more about national efforts to modernize the electric grid, visit the Office of Electricity
Delivery and Energy Reliability’s website and www.smartgrid.gov. DOE has published several
reports that contain findings on topics related to the six projects featured in this report. Web
links to these reports are listed in Table 6.
Table 6. Web Links to Related DOE Reports
SGIG Program,
Progress, and
Results
i. Progress Report II, October 2013
ii. Progress Report I, October 2012
iii. SGIG Case Studies
Recent SGIG
Publications
iv. Smart Meter Investments Yield Positive Results in Maine, February
2014
v. Smart Meter Investments Benefit Rural Customers in Three Southern
States, March 2014
vi. Control Center and Data Management Improvements Modernize Bulk
Power Operations in Georgia, August 2014
vii. Using Smart Grid Technologies to Modernize Distribution
Infrastructure in New York, August 2014
viii. Automated Demand Response Benefits California Utilities and
Commercial & Industrial Customers, September 2014
ix. New Forecasting Tool Enhances Wind Energy Integration in Idaho and
Oregon, September 2014
x. Automated Demand Response Benefits California Utilities and
Commercial & Industrial Customers, September 2014
xi. Integrated Smart Grid Provides Wide Range of Benefits in Ohio and
the Carolinas, September 2014
xii. Municipal Utilities’ Investment in Smart Grid Technologies Improves
Services and Lowers Costs, October 2014
xiii. Smart Grid Investments Improve Grid Reliability, Resilience, and
Storm Responses, November 2014
Recent SGDP
Publications
and Related
Websites
i. AEP-Ohio gridSMART Demonstration Project Final Technical Report,
June 2014
ii. Pecan Street SGDP – Interim Technology Performance Report, June
2014
iii. UCLA Smart Grid Energy Research Center Website
iv. UCLA Smart Grid Energy Research Center – Reports and Publications