Embed Size (px)
Citation preview

©Ofcom
Appendix 4
Nielsen Advertising Spend and Impact Data
©Ofcom 2
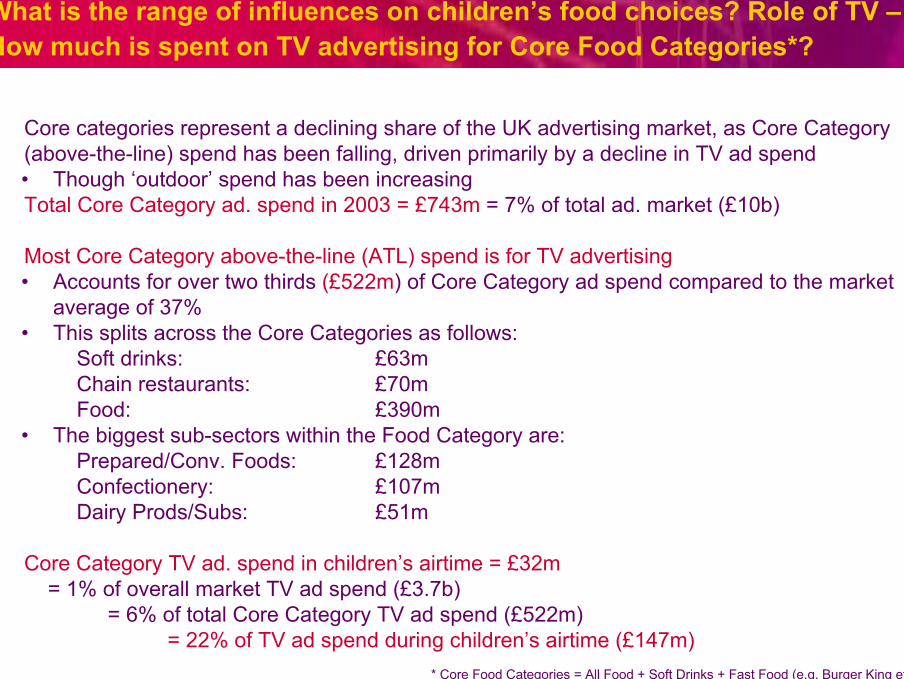
What is the range of influences on children’s food choices? Role of TV –How much is spent on TV advertising for Core Food Categories*?
• Core categories represent a declining share of the UK advertising market, as Core Category (above-the-line) spend has been falling, driven primarily by a decline in TV ad spend• Though ‘outdoor’ spend has been increasing
• Total Core Category ad. spend in 2003 = £743m = 7% of total ad. market (£10b)
• Most Core Category above-the-line (ATL) spend is for TV advertising• Accounts for over two thirds (£522m) of Core Category ad spend compared to the market
average of 37%• This splits across the Core Categories as follows:
Soft drinks: £63mChain restaurants: £70mFood: £390m
• The biggest sub-sectors within the Food Category are:Prepared/Conv. Foods: £128mConfectionery: £107mDairy Prods/Subs: £51m
• Core Category TV ad. spend in children’s airtime = £32m = 1% of overall market TV ad spend (£3.7b)
= 6% of total Core Category TV ad spend (£522m)= 22% of TV ad spend during children’s airtime (£147m)
* Core Food Categories = All Food + Soft Drinks + Fast Food (e.g. Burger King etc.)
©Ofcom 3
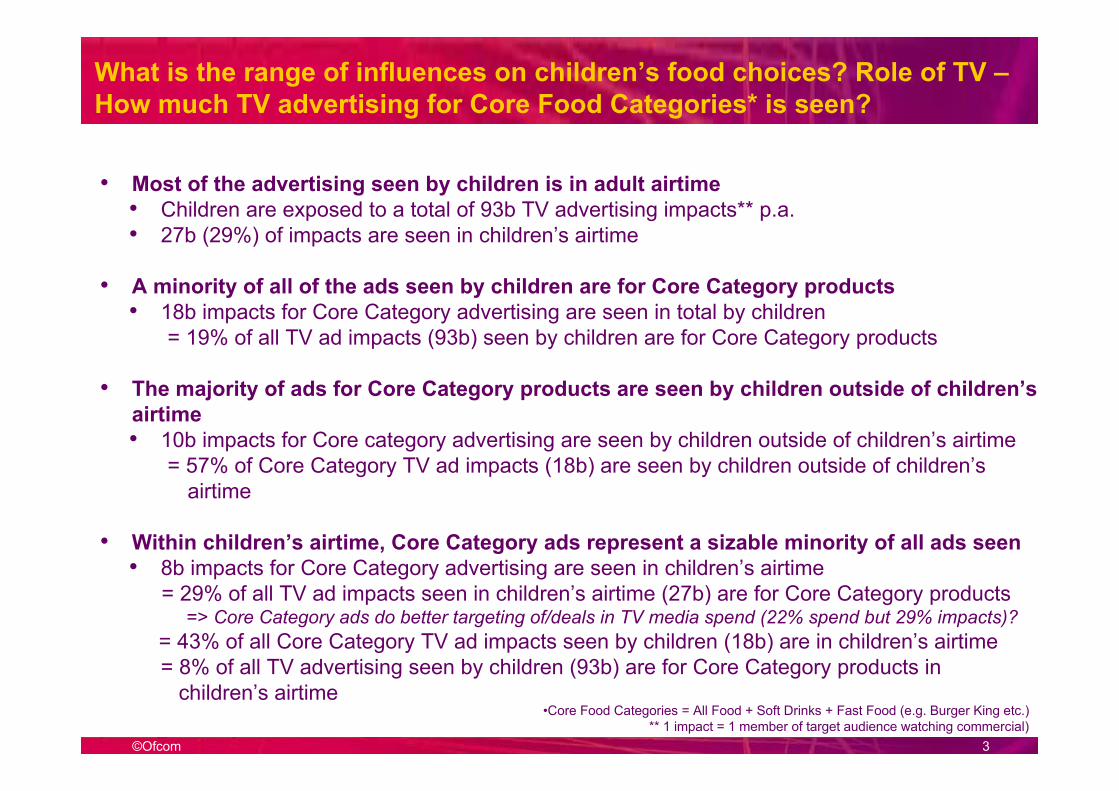
What is the range of influences on children’s food choices? Role of TV –How much TV advertising for Core Food Categories* is seen?
• Most of the advertising seen by children is in adult airtime• Children are exposed to a total of 93b TV advertising impacts** p.a. • 27b (29%) of impacts are seen in children’s airtime
• A minority of all of the ads seen by children are for Core Category products• 18b impacts for Core Category advertising are seen in total by children
= 19% of all TV ad impacts (93b) seen by children are for Core Category products
• The majority of ads for Core Category products are seen by children outside of children’s airtime• 10b impacts for Core category advertising are seen by children outside of children’s airtime
= 57% of Core Category TV ad impacts (18b) are seen by children outside of children’s airtime
• Within children’s airtime, Core Category ads represent a sizable minority of all ads seen• 8b impacts for Core Category advertising are seen in children’s airtime
= 29% of all TV ad impacts seen in children’s airtime (27b) are for Core Category products=> Core Category ads do better targeting of/deals in TV media spend (22% spend but 29% impacts)?
= 43% of all Core Category TV ad impacts seen by children (18b) are in children’s airtime = 8% of all TV advertising seen by children (93b) are for Core Category products in
children’s airtime•Core Food Categories = All Food + Soft Drinks + Fast Food (e.g. Burger King etc.)
** 1 impact = 1 member of target audience watching commercial)
©Ofcom 4
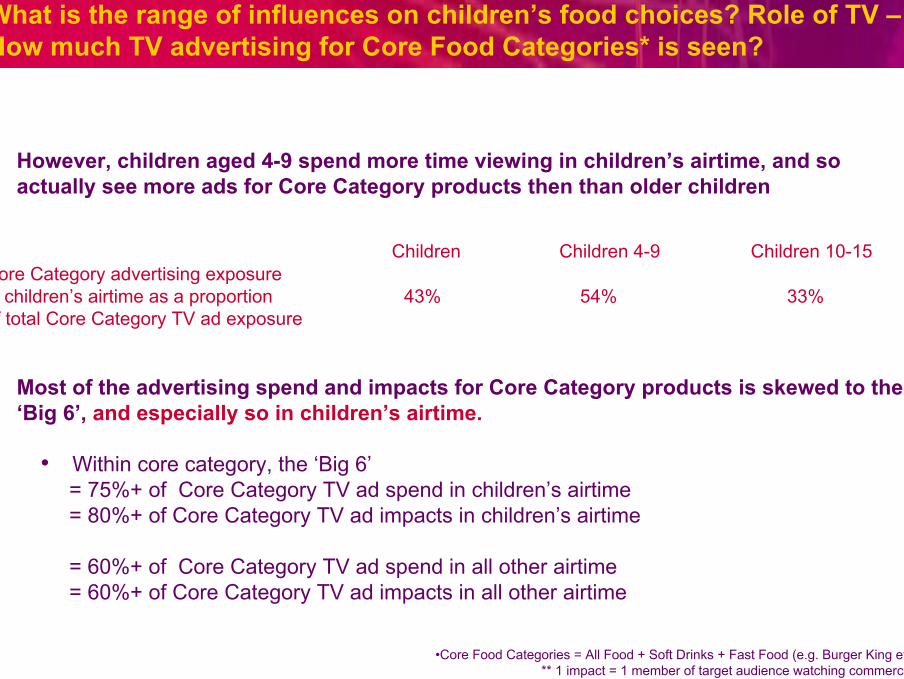
What is the range of influences on children’s food choices? Role of TV –How much TV advertising for Core Food Categories* is seen?
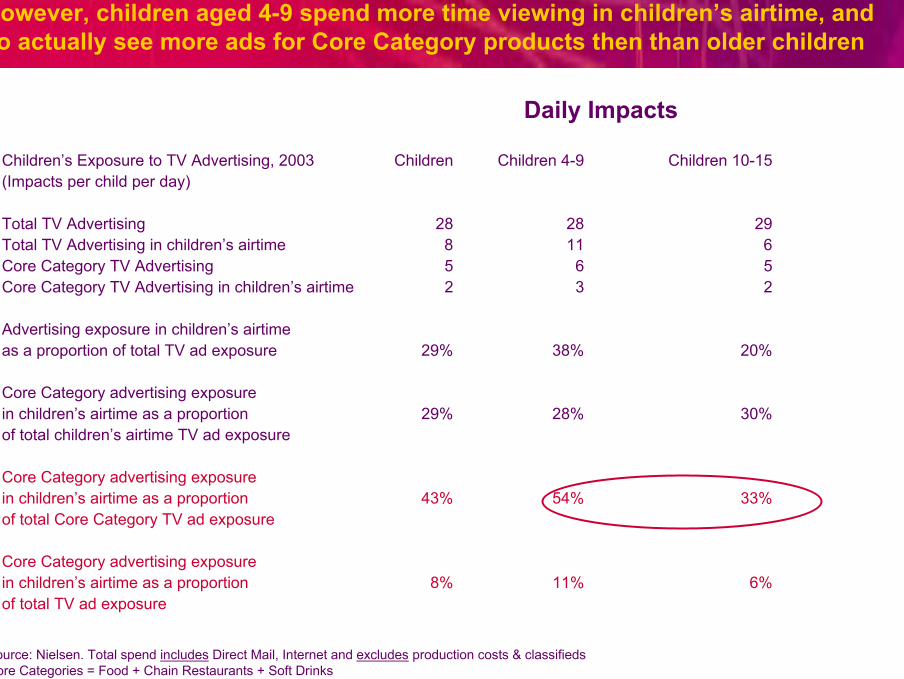
• However, children aged 4-9 spend more time viewing in children’s airtime, and so actually see more ads for Core Category products then than older children
Children Children 4-9 Children 10-15Core Category advertising exposurein children’s airtime as a proportion 43% 54% 33%of total Core Category TV ad exposure
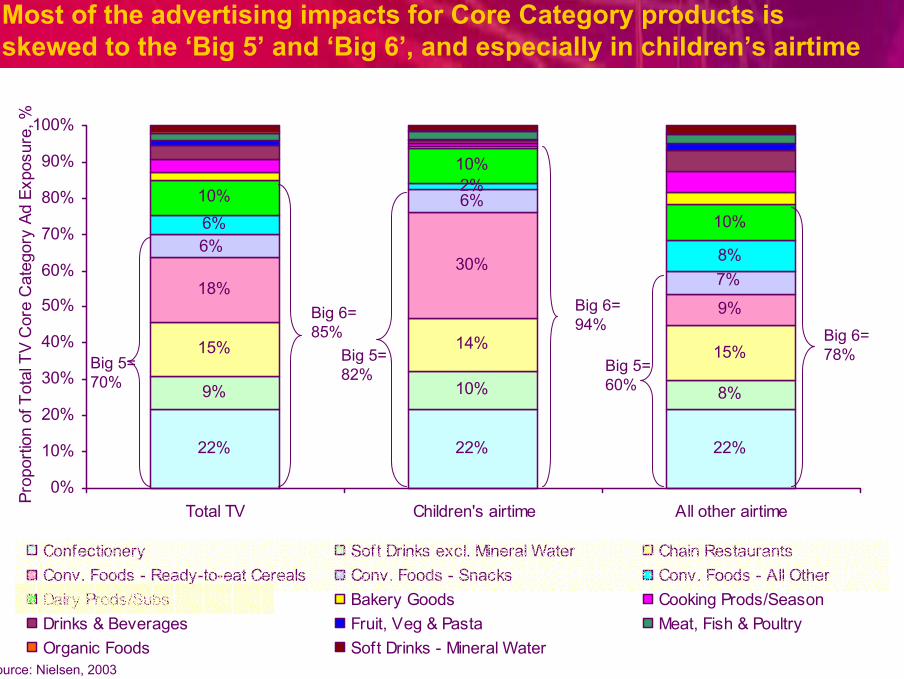
• Most of the advertising spend and impacts for Core Category products is skewed to the ‘Big 6’, and especially so in children’s airtime.
• Within core category, the ‘Big 6’ = 75%+ of Core Category TV ad spend in children’s airtime= 80%+ of Core Category TV ad impacts in children’s airtime
= 60%+ of Core Category TV ad spend in all other airtime= 60%+ of Core Category TV ad impacts in all other airtime
•Core Food Categories = All Food + Soft Drinks + Fast Food (e.g. Burger King etc.)** 1 impact = 1 member of target audience watching commercial)

©Ofcom 5
Core Categories* represent a declining share of the UK advertising market …
Source: Nielsen. Total spend excludes Direct Mail & Internet spend as continuous data is unavailable* = Food + Chain Restaurants + Soft Drinks
% of Total UK Ad Spend Represented by Core Categories
11.2%10.0% 9.6% 9.3% 8.8%
1999 2000 2001 2002 2003
% o
f Tot
al U
K Ad
Spe
nd
% of Total UK TV Ad Spend Represented by Core Categories
18.6%16.4% 15.9% 15.3% 14.1%
1999 2000 2001 2002 2003
% o
f Tot
al U
K Te
levi
sion
Ad
Spen
d
©Ofcom 6
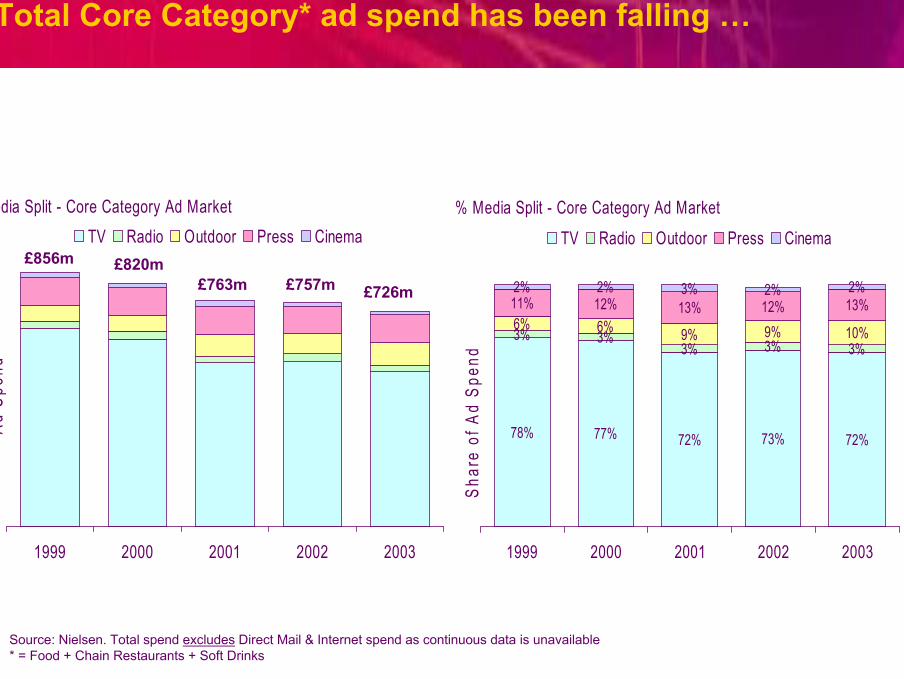
Total Core Category* ad spend has been falling …
Source: Nielsen. Total spend excludes Direct Mail & Internet spend as continuous data is unavailable* = Food + Chain Restaurants + Soft Drinks
Media Split - Core Category Ad Market
1999 2000 2001 2002 2003
Ad S
pend
TV Radio Outdoor Press Cinema£856m £820m
£763m £757m £726m
% Media Split - Core Category Ad Market
78% 77% 72% 73% 72%
3% 3%3% 3% 3%
6% 6% 9% 9% 10%
11% 12% 13% 12% 13%2% 2% 3% 2% 2%
1999 2000 2001 2002 2003
Shar
e of
Ad
Spen
d
TV Radio Outdoor Press Cinema
©Ofcom 7
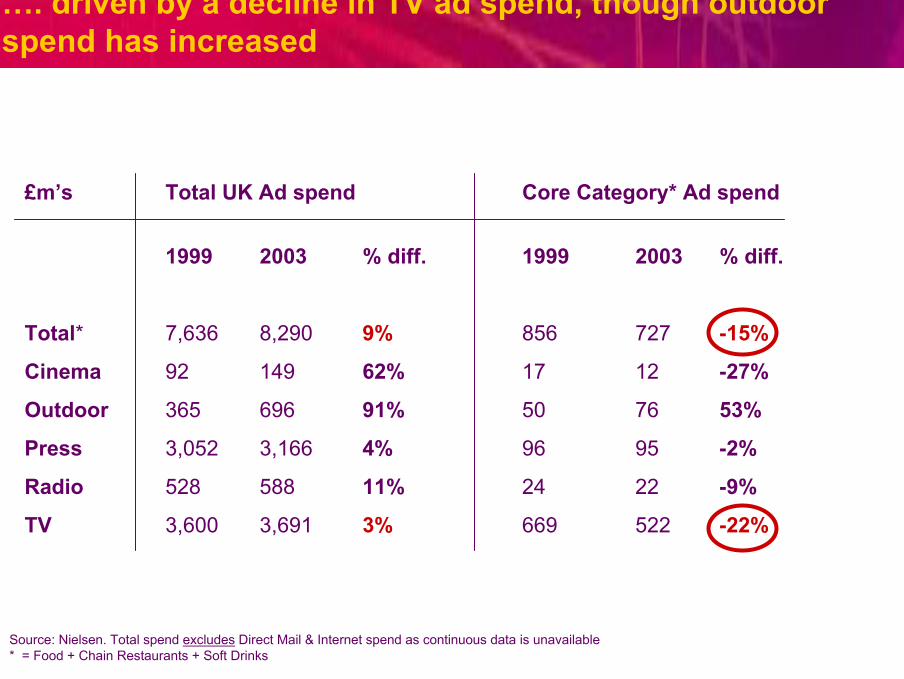
…. driven by a decline in TV ad spend, though outdoor spend has increased
£m’s Total UK Ad spend Core Category* Ad spend
1999 2003 % diff. 1999 2003 % diff.
Total* 7,636 8,290 9% 856 727 -15%
Cinema 92 149 62% 17 12 -27%
Outdoor 365 696 91% 50 76 53%
Press 3,052 3,166 4% 96 95 -2%
Radio 528 588 11% 24 22 -9%
TV 3,600 3,691 3% 669 522 -22%
Source: Nielsen. Total spend excludes Direct Mail & Internet spend as continuous data is unavailable* = Food + Chain Restaurants + Soft Drinks
©Ofcom 8
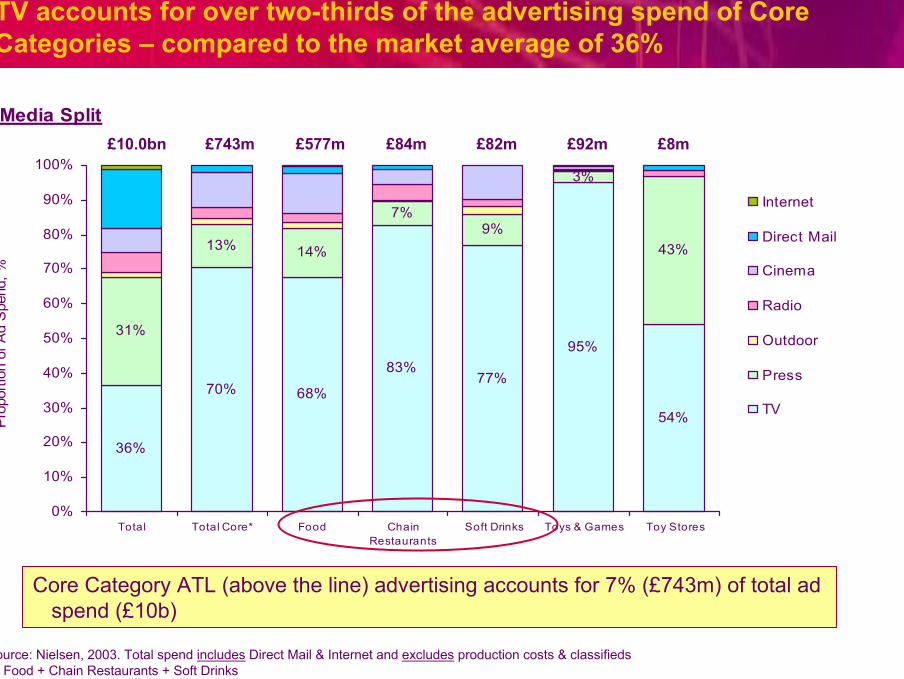
TV accounts for over two-thirds of the advertising spend of Core Categories – compared to the market average of 36%
Source: Nielsen, 2003. Total spend includes Direct Mail & Internet and excludes production costs & classifieds *= Food + Chain Restaurants + Soft Drinks
Core Category ATL (above the line) advertising accounts for 7% (£743m) of total ad spend (£10b)
Media Split
36%
70% 68%
83%77%
95%
54%
31%
13% 14%
7%9%
3%
43%
0%
10%
20%
30%
40%
50%
60%
70%
80%
90%
100%
Total Total Core* Food ChainRestaurants
Soft Drinks Toys & Games Toy Stores
Pro
porti
on o
f Ad
Spe
nd, %
Internet
Direct Mail
Cinema
Radio
Outdoor
Press
TV
£10.0bn £577m £84m £82m £92m £8m£743m

©Ofcom 9Source: Nielsen, 2003. Total spend includes Direct Mail & Internet and excludes production costs & classifieds *= Food + Chain Restaurants + Soft Drinks
Core Categories* account for 14% (£522m) of the overall TV advertising market
• Spend on TV across these categories amounts to £522m – 14.1% of the total UK television advertising mkt
• This splits across Core categories as follows: - Soft Drinks £63m- Chain restaurants £70m- Food £390m
£10bn
Split in Overall Advertising Spend
93%
6%0%
10%
20%
30%
40%
50%
60%
70%
80%
90%
100%
Total Ad Spend
All Other
Soft Drinks
Chain Restaurants
Food
7.3%
£3.7bn
Split in TV Advertising Spend
86%
11%0%
10%
20%
30%
40%
50%
60%
70%
80%
90%
100%
Total TV Spend
14.1%

©Ofcom 10
The biggest sub-sectors within the Food Category are Prepared & Convenience Foods, Confectionery and Dairy Products
Split in Food Advertising Spend by Sub-sector
4%
28%
7%
13%
11%3%4%
30%
0%
10%
20%
30%
40%
50%
60%
70%
80%
90%
100%
Total Spend(Food)
Pro
porti
on o
f Ad
Spe
nd, %
Source: Nielsen, 2003. Total spend includes Direct Mail & Internet and excludes production costs & classifieds
The split in spend across categories is fairly consistent across the total advertising market and the TV market
£577m £390m
4%
28%
8%
13%
9%3%3%
33%
0%
10%
20%
30%
40%
50%
60%
70%
80%
90%
100%
TV Spend(Food)
Pro
porti
on o
f Ad
Spe
nd, %
Food Corporate
Food Sponsorship
Food- Internet
Organic Foods
Prepared/Conv. Foods
Meat, Fish & Poultry
Fruit, Veg & Pasta
Drinks & Beverages
Dairy Prods/Subs
Cooking Prods/Season
Confectionery
Bakery Goods

©Ofcom 11
Core Category spend during children’s airtime represents 1% of total television ad spend…
Source: Nielsen, 2003Core Categories = Food + Chain Restaurants + Soft Drinks
Non-food categories (e.g. motors, retail, finance) = 86%
Core = 14%
1%
Total TV Ad spend = £3.7bn
Core Category TV Ad spend/all airtime = £522m
Core Category TV Ad spend in
children’s airtime = £32m
©Ofcom 12
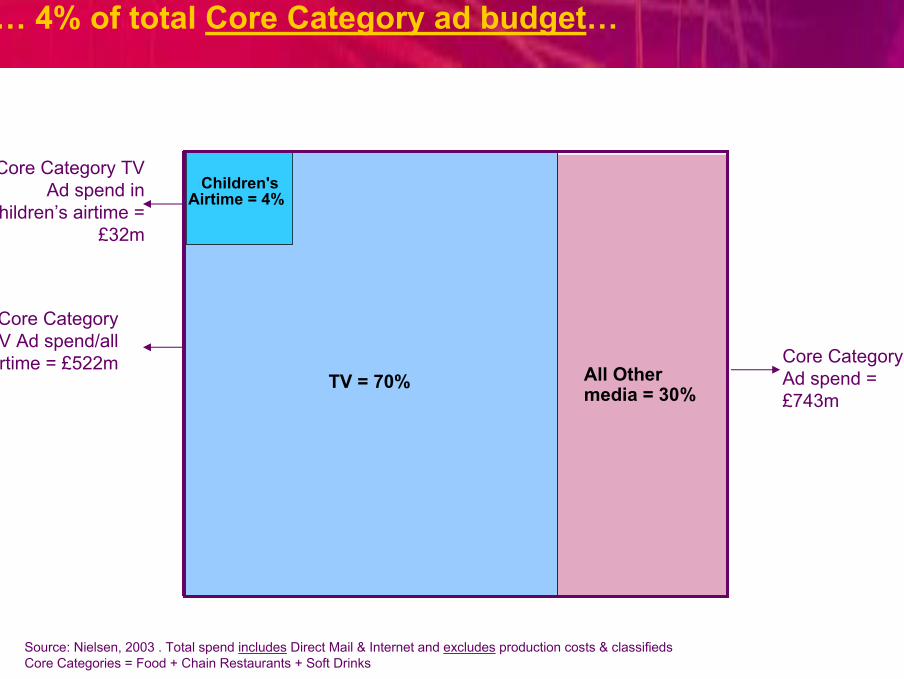
All Other media = 30%
… 4% of total Core Category ad budget…
Source: Nielsen, 2003 . Total spend includes Direct Mail & Internet and excludes production costs & classifieds Core Categories = Food + Chain Restaurants + Soft Drinks
TV = 70%
Children's Airtime = 4%
Core Category Ad spend = £743m
Core Category TV Ad spend/all airtime = £522m
Core Category TV Ad spend in
children’s airtime = £32m
©Ofcom 13
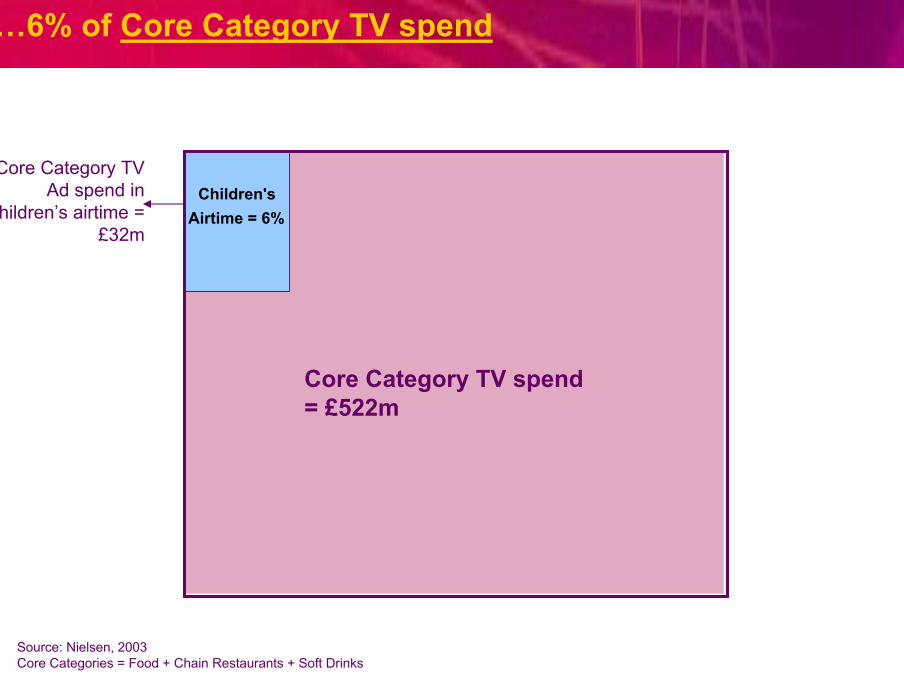
Core Category TV spend = £522m
…6% of Core Category TV spend
Source: Nielsen, 2003Core Categories = Food + Chain Restaurants + Soft Drinks
Children's Airtime = 6%
Core Category TV Ad spend in
children’s airtime = £32m

©Ofcom 14
Source: Nielsen, 2003 (Child impacts)Core Categories = Food + Chain Restaurants + Soft Drinks
Children’s airtime (27bn impacts) accounts for 29% of all
advertising (93 bn impacts) seen by 4-15 year olds
©Ofcom 15
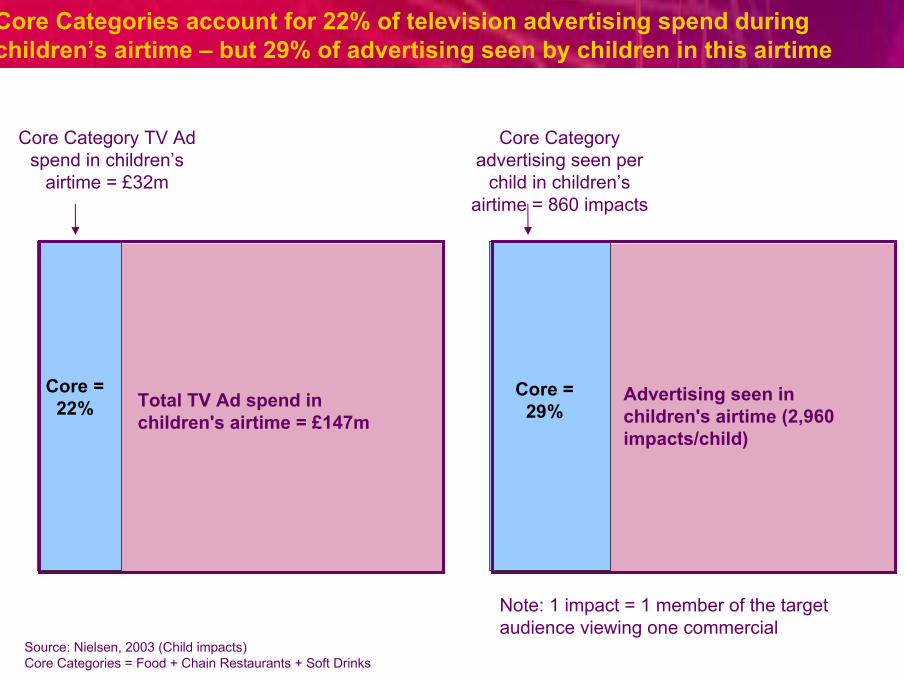
Total TV Ad spend in children's airtime = £147m
Core Categories account for 22% of television advertising spend during children’s airtime – but 29% of advertising seen by children in this airtime
Source: Nielsen, 2003 (Child impacts)Core Categories = Food + Chain Restaurants + Soft Drinks
Core = 22%
Core Category TV Ad spend in children’s
airtime = £32m
Advertising seen in children's airtime (2,960 impacts/child)
Core = 29%
Core Category advertising seen per
child in children’s airtime = 860 impacts
Note: 1 impact = 1 member of the target audience viewing one commercial
©Ofcom 16
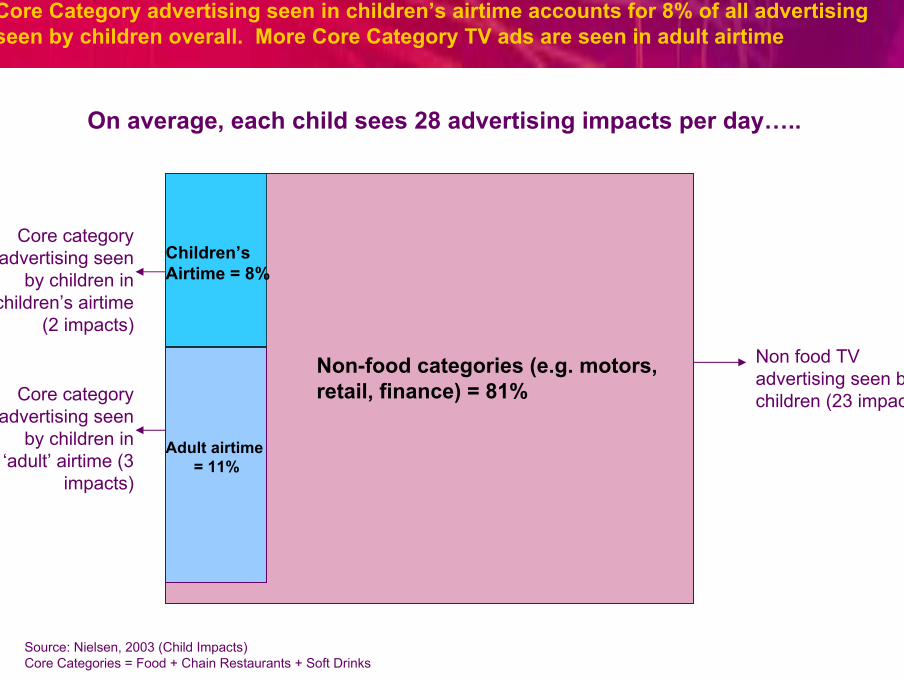
Core Category advertising seen in children’s airtime accounts for 8% of all advertising seen by children overall. More Core Category TV ads are seen in adult airtime
Source: Nielsen, 2003 (Child Impacts)Core Categories = Food + Chain Restaurants + Soft Drinks
Non-food categories (e.g. motors, retail, finance) = 81%
Adult airtime= 11%
Children’sAirtime = 8%
Non food TV advertising seen by children (23 impacts)Core category
advertising seen by children in
‘adult’ airtime (3 impacts)
Core category advertising seen
by children in children’s airtime
(2 impacts)
On average, each child sees 28 advertising impacts per day…..
©Ofcom 17
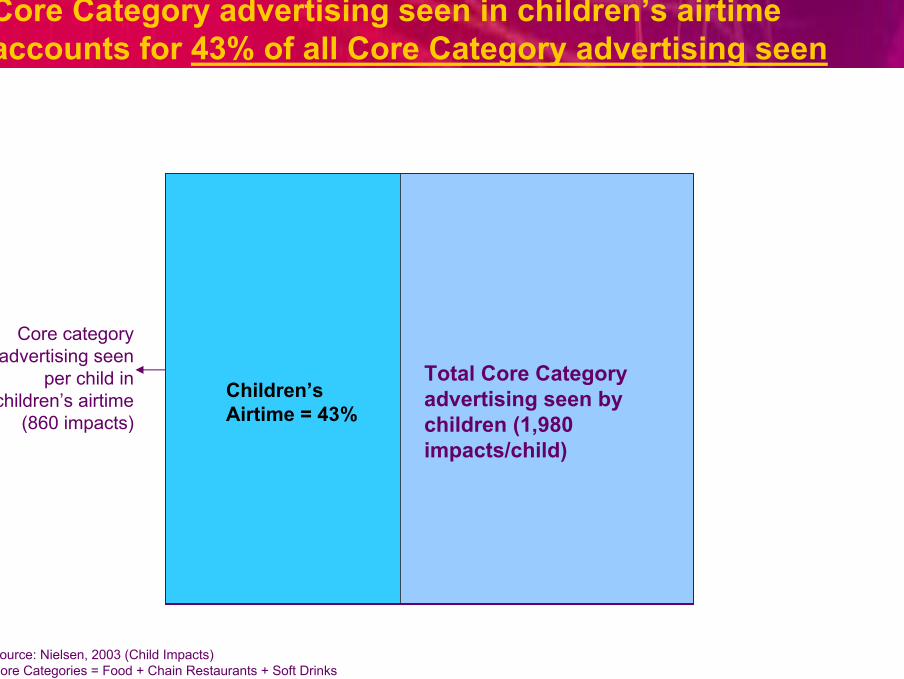
Total Core Category advertising seen by children (1,980 impacts/child)
Core Category advertising seen in children’s airtime accounts for 43% of all Core Category advertising seen
Source: Nielsen, 2003 (Child Impacts)Core Categories = Food + Chain Restaurants + Soft Drinks
Children’sAirtime = 43%
Core category advertising seen
per child in children’s airtime
(860 impacts)
©Ofcom 18
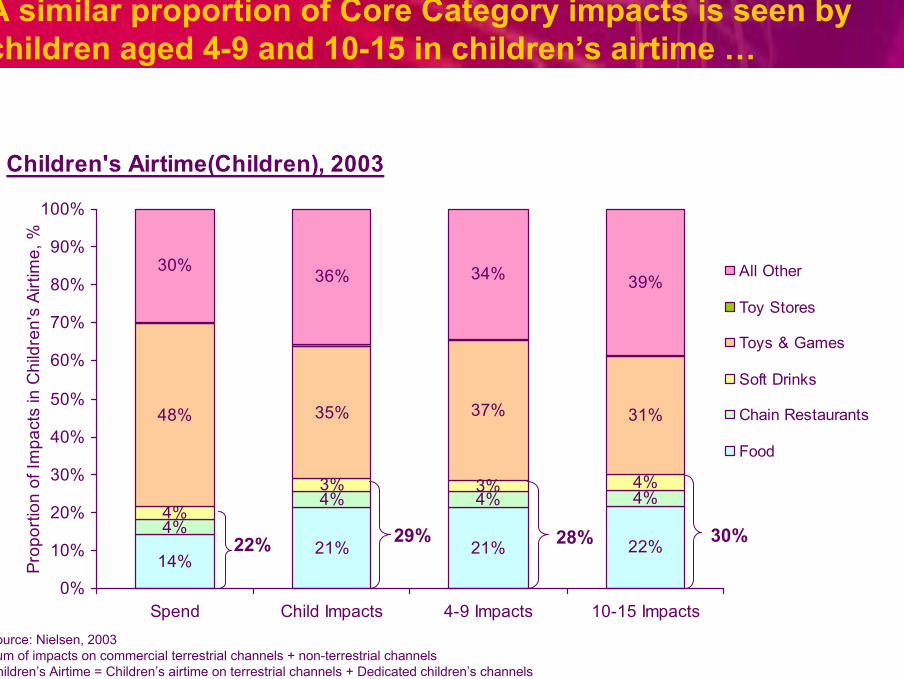
A similar proportion of Core Category impacts is seen by children aged 4-9 and 10-15 in children’s airtime …
Source: Nielsen, 2003Sum of impacts on commercial terrestrial channels + non-terrestrial channels Children’s Airtime = Children’s airtime on terrestrial channels + Dedicated children’s channels
Children's Airtime(Children), 2003
14%21% 21% 22%
4%4%
4%3%
31%
30% 36% 34% 39%
4%4%4%3%
35% 37%48%
0%
10%
20%
30%
40%
50%
60%
70%
80%
90%
100%
Spend Child Impacts 4-9 Impacts 10-15 Impacts
Prop
ortio
n of
Impa
cts
in C
hild
ren'
s Ai
rtim
e, %
All Other
Toy Stores
Toys & Games
Soft Drinks
Chain Restaurants
Food
22% 29% 28% 30%
©Ofcom 19
However, children aged 4-9 spend more time viewing in children’s airtime, and so actually see more ads for Core Category products then than older children
Source: Nielsen. Total spend includes Direct Mail, Internet and excludes production costs & classifieds Core Categories = Food + Chain Restaurants + Soft Drinks
Children’s Exposure to TV Advertising, 2003 Children Children 4-9 Children 10-15(Impacts per child per day)
Total TV Advertising 28 28 29Total TV Advertising in children’s airtime 8 11 6Core Category TV Advertising 5 6 5Core Category TV Advertising in children’s airtime 2 3 2
Advertising exposure in children’s airtimeas a proportion of total TV ad exposure 29% 38% 20%
Core Category advertising exposurein children’s airtime as a proportion 29% 28% 30%of total children’s airtime TV ad exposure
Core Category advertising exposurein children’s airtime as a proportion 43% 54% 33%of total Core Category TV ad exposure
Core Category advertising exposurein children’s airtime as a proportion 8% 11% 6%of total TV ad exposure
Daily Impacts

©Ofcom 20
Most of the advertising spend for Core Category products is skewed to the ‘Big 5’ and ‘Big 6’, and especially in children’s airtime
Source: Nielsen, 2003
Big 5=59%
Big 5=77% Big 5=
58%
Big 6=95% Big 6=
77%
Big 6=78%
21% 19% 21%
10% 16% 10%
13%17%
13%
9%
19%
9%
9% 10%
10%
17%
9%
6%
6%
6%
2%
0%
10%
20%
30%
40%
50%
60%
70%
80%
90%
100%
Total TV Spend Children's airtime All other airtime
Prop
ortio
n of
Cor
e C
ateg
ory
Spen
d, %
Confectionery Soft Drinks excl. Mineral Water Chain RestaurantsConv. Foods - Ready-to-eat Cereals Conv. Foods - Snacks Conv. Foods - All OtherDairy Prods/Subs Bakery Goods Cooking Prods/SeasonDrinks & Beverages Fruit, Veg & Pasta Meat, Fish & PoultryOrganic Foods Soft Drinks - Mineral Water
©Ofcom 21
Most of the advertising impacts for Core Category products is skewed to the ‘Big 5’ and ‘Big 6’, and especially in children’s airtime
Source: Nielsen, 2003
22% 22% 22%
9% 10% 8%
15% 14% 15%
18%30%
9%
8%
10%
10%
10%
7%
6%
6%
2%
6%
0%
10%
20%
30%
40%
50%
60%
70%
80%
90%
100%
Total TV Children's airtime All other airtime
Prop
ortio
n of
Tot
al T
V C
ore
Cat
egor
y Ad
Exp
osur
e, %
Confectionery Soft Drinks excl. Mineral Water Chain RestaurantsConv. Foods - Ready-to-eat Cereals Conv. Foods - Snacks Conv. Foods - All OtherDairy Prods/Subs Bakery Goods Cooking Prods/SeasonDrinks & Beverages Fruit, Veg & Pasta Meat, Fish & PoultryOrganic Foods Soft Drinks - Mineral Water
Big 5=70%
Big 5=82% Big 5=
60%
Big 6=94%
Big 6=78%
Big 6=85%

©Ofcom 22
There is proportionally little seasonal variation in Core Category ad spend
Source: Nielsen. Total spend includes Direct Mail, Internet and excludes production costs & classifieds Core Categories = Food + Chain Restaurants + Soft Drinks
Ad spend, £ Q1 2003 Q2 2003 Q3 2003 Q4 2003 2003
Total TV Ad spend £845m £947m £863m £1,035m £3.7bnTotal Core Category Ad spend £168m £220m £182m £173m £743mTotal Core Category TV spend £125m £159m £122m £115m £522mCore Category TV spend in children’s airtime £8m £11m £8m £4m £32m
Core Category TV spend in children’s airtime as a proportion of:-Total TV spend 1% 1% 1% 0% 1%-Total Core Category Ad spend 5% 5% 5% 3% 4%-Core Category TV spend 7% 7% 7% 4% 6%
©Ofcom 23
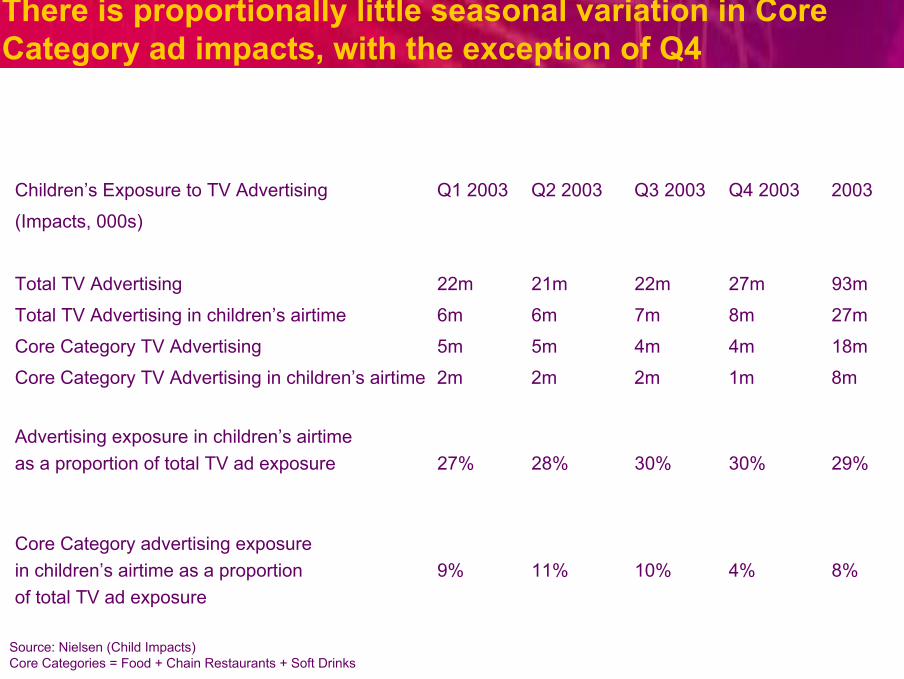
There is proportionally little seasonal variation in Core Category ad impacts, with the exception of Q4
Source: Nielsen (Child Impacts)Core Categories = Food + Chain Restaurants + Soft Drinks
Children’s Exposure to TV Advertising Q1 2003 Q2 2003 Q3 2003 Q4 2003 2003
(Impacts, 000s)
Total TV Advertising 22m 21m 22m 27m 93m
Total TV Advertising in children’s airtime 6m 6m 7m 8m 27m
Core Category TV Advertising 5m 5m 4m 4m 18m
Core Category TV Advertising in children’s airtime 2m 2m 2m 1m 8m
Advertising exposure in children’s airtimeas a proportion of total TV ad exposure 27% 28% 30% 30% 29%
Core Category advertising exposurein children’s airtime as a proportion 9% 11% 10% 4% 8%of total TV ad exposure
©Ofcom 24
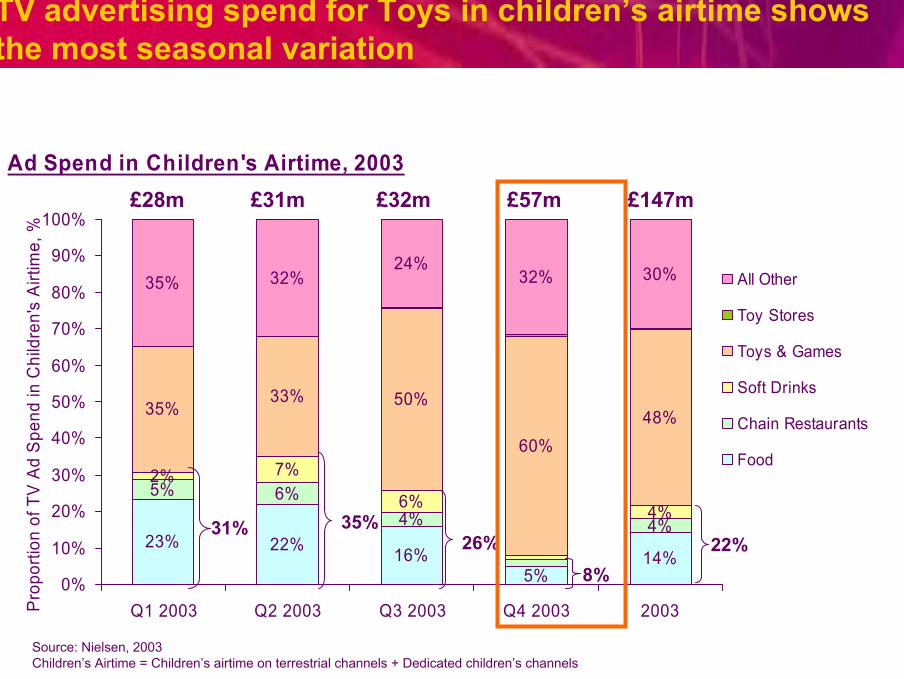
TV advertising spend for Toys in children’s airtime shows the most seasonal variation
Source: Nielsen, 2003Children’s Airtime = Children’s airtime on terrestrial channels + Dedicated children’s channels
Ad Spend in Children's Airtime, 2003
23% 22% 16%5%
14%
5%
4% 4%
2%6% 4%
60%48%
35% 32%24%
32% 30%
6%7%
33% 50%35%
0%
10%
20%
30%
40%
50%
60%
70%
80%
90%
100%
Q1 2003 Q2 2003 Q3 2003 Q4 2003 2003Pro
porti
on o
f TV
Ad
Spe
nd in
Chi
ldre
n's
Airti
me,
%
All Other
Toy Stores
Toys & Games
Soft Drinks
Chain Restaurants
Food
31% 35%26%
8%22%
£28m £31m £32m £57m £147m

©Ofcom 25
Source: Nielsen, 2003Sum of impacts on commercial terrestrial channels + non-terrestrial channels Children’s Airtime = Children’s airtime on terrestrial channels + Dedicated children’s channels
Impacts in Children's Airtime(Children), 2003
28% 27% 24%9%
21%
5%4% 4%
1%5%
3%
59%35%
43% 42% 36%26%
36%
5%6%
20% 30%22%
0%
10%
20%
30%
40%
50%
60%
70%
80%
90%
100%
Q1 2003 Q2 2003 Q3 2003 Q4 2003 2003
Prop
ortio
n of
Impa
cts
in C
hild
ren'
s A
irtim
e, %
All Other
Toy Stores
Toys & Games
Soft Drinks
Chain Restaurants
Food
35% 38% 34%
14%29%
TV advertising impacts for Toys in children’s airtime shows the most seasonal variation