Embed Size (px)
Citation preview

Appendix 1
Some Mathematical and Statistical Techniques
LINEAR AND LOG LINEAR EQUATIONS
In economics a behavioural equation shows a relationship between a dependent variable and a set of independent (or causal) variables. A consumption function in which consumption in the current period, CI> depends positively on current income, Y t , and wealth in the previous period, Wt-I> may be written in functional notation as Ct = C(Yt, Wt-I). If the functional form is assumed to be linear then the equation is
Ct = bo + blYt + b 2W t - 1 (A.I)
where bo, b l and b 2 are positive constants. One way of summarising the quantitative relationship between the dependent variable and a particular independent variable is to calculate the ratio of the absolute change in the dependent variable to the absolute change in one of the independent variables between two time periods (when all other independent variables are held constant); for example, ACt/AYt, where ACt = Ct - Ct- I, and AYt = Y t - Y t- I, and it is assumed that W t- I is held constant. If the equation is linear, then such a ratio is constant no matter how large the change in the variables may be, and is equal to the value of the coefficient in front of that particular independent variable. Thus b l = ACt/AYt - of course this is known as the marginal propensity to consume (out of current income). Similarly, b2 = ACt/AWt- 1 and is the marginal propensity to consume out of (previous periods') wealth.
Sometimes economic theory or a priori intuition suggest that a particular behavioural equation should be a linear function. However, this is not always so and a linear functional form has the drawback that the numerical value of the marginal response coefficients like b l and b 2 are dependent on the units in which the

170 Macroeconomic Policy
variables are measured. This is not usually a serious problem in the case of the linear consumption function, where the variables Ct , Y t ,
Wt- t are normally all measured in the same units. However, when equations contain independent variables like real output (an index number) and the interest rate (a percentage) the problem becomes more acute. It then becomes useful to express the quantitative relationship between two variables as the ratio of the percentage change in the dependent variable to the percentage change in the independent variable (with all other independent variables held constant). Such a ratio is a measure of the 'elasticity' between the two variables and is independent of the units used in measuring the variables. For example, the income elasticity of the demand for money is defined as the ratio MDtfYt, where MDt is the demand for money at time t, MDt = IlMD,/MDt_t = (MDt - MD t_ I )/
M D t- t; Yt is similarly defined. The elasticity is a positive (negative) number if the relationship between the two variables is positive (negative). Usually the sign of the elasticity is understood and its absolute value (i.e. its numerical value regardless of sign) only is quoted. The (absolute) value of the elasticity may in principle be anywhere between zero and infinity, but economic theory or intuition frequently imposes bounds on what is considered to be a 'plausible' value. The log linear function is useful in that its coefficients give a direct measure of the required elasticities. For example, in the log linear demand for money function:
(A.2)
where Rt is the interest rate, Yt is real income, 'Y and I are constants and measure the income and interest-rate elasticities of the demand for money, respectively (this is shown· below).
Although we cannot go into the theory of logarithms here, a few general observations and rules of thumb may prove helpful. Logarithm (to the base 'e') (i.e. 'log') alters or 'transforms' a particular variable, as in a similar fashion X 2 indicates that one should 'transform' the variable X by multiplying it by itself once. If X t and Y t are any two variables, then the following rules of logarithms apply:
(i) Difference rule
Xt> 0
(A.3)

Appendix 1 171
Thus, for small changes, the absolute difference in the logarithm of a variable between two time periods is equal to the percentage change, Xt, in the variable itself.
(ii) Product rule
log (XtYt) = log X t + log Yt, (A.4)
(iii) Quotient rule
log (X,/Yt ) = log XI - log YI, (A.5)
We can now show that y = MDtlYt (Rt held constant) and I = MD/R t (Yt held constant). Applying the 'difference rule' to equation (A.2) we obtain:
(A.6)
When R t is held constant, Rt = 0, and therefore it follows directly from equation (A.6) that y = MDtfVt (which, by definition, is the income elasticity of the demand for money). Similarly, if Yt = 0, then 1= MDt/Rt •
Notice that any log linear equation may be written in terms of percentage changes in the variables; we use this result particularly in Chapter 4. Also, if I is a measure of the interest elasticity and I' is the equivalent marginal response coefficient in a linear demand for money function (i.e. I' = I1MD,/l1R t ), then at this level of analysis the reader may accept that when I approaches either ° or 00, I' also approaches these same limits; this result is also valid for other elasticities and their marginal response coefficients.
The above rules of logarithms can also be used to show how expressions involving products and quotients may be transformed into relationships in terms of percentage changes in the variables. Consider, first, the level of wage costs per unit of output, WCUO. This may be defined as wage-earnings (£s per man-week, W) divided by labour productivity (output per man-week, Q), i.e. WCUO = WIQ (£s per unit of output). Using the quotient rule, we obtain log WCUO = log W -log Q, and using the difference rule, WCUO = (W - Q); the latter term in parentheses is the percentage change in wage costs per unit of output and appears in the Keynesian and New Cambridge 'mark-up' price equations. Con-

172 Macroeconomic Policy
sider next the relative price of U.K. exports, RPX, which is an independent variable in the export-volume equation. The relative price of U.K. exports is defined as the ratio of the price of U.K. exports in foreign currency ($), PXF, to the world ($) price of exports, WPX, produced by the United Kingdom's competitors; thus RPX = PXF/WPx. If PX is the sterling price of U.K. exports and E is the dollar-sterling exchange rate, then by definition PXF = PX x E; hence RPX = PX x E/WPX. By using in turn the 'product', 'quotient' and 'difference' rules we obtain RPX = ix + E - WPx. Thus, for example, U.K. (export) price competitiveness improves (Le. RPX < 0) whenever the (percenta,ge) depreciation in the sterling exchange rate (E < 0) exceeds the excess of domestic inflation over world inflation (i.e. PX-WPX).
GEOMETRIC SERIES
In economics we frequently wish to find the sum of a series of numbers 1, w, w2 , w3 , ••• , where w is a number having a value greater than zero and less than unity, i.e. 0 < w < 1. This series is known as a geometric series. Each number in this series is smaller than the previous one, Le. 1 > w > w 2 > w3 , ••• ,for 0 < w < 1, and the ratio of adjacent numbers in the sequence is constant (=w). Denoting the sum of such a series as S, then
S = 1 + w + w2 + w3 + ... (A.7)
It can be shown that the sum of this series may be written in a simplified and more convenient way as
1 S = -:----
(1 -w) (A.8)
(The reader might like to check that (A.7) and (A.8) are equivalent by using, for example, w = ! in each equation.)
The (first-order) adaptive-expectations hypothesis of, for example, the formation of expectations of price changes may be written:
(A.9)

Appendix 1 173
hence
(A.10)
and therefore in the adaptive-expectations hypothesis an individual's expectation of the rate of inflation at time t, p;, is a weighted average of the current rate, Pt, and his previous period's expectation, P;-t, the weights given to the current rate of inflation and the past expected rate being A and 1 - A respectively. It is easy to show that the adaptive-expectations hypothesis is also consistent with the view that individuals form their expectations of the rate of inflation (at time t) as a geometrically weighted average of past price changes. This follows from the fact that (A.10) implies:
P;-t = 'AFt- t + (1 - A)P;-2
Substituting (A.ll) in (A.1O) gives:
Pi = APt + A(l - A)P/-I + (1 - A)2Pt_2
By substituting repeatedly for Pt-2' then Pt-3, etc. gives:
(A.ll)
where 0< A < 1 and the 'weights' A, A(l - A), A(l - A)2 ... have a constant ratio (of 1 - A) and therefore form a geometric series. If actual inflation were constant for a number of years, at a rate P* , i.e. Pt = Pt- t = PH = ... = P*, then it would be plausible to assume that the expected rate of inflation should also equal P*. With the above information on geometric series we can show that the adaptive-expectati?ns hypothesis pro9uces such a result. From equation (A.9), with PI = PH = ... = P*, we have:
P/ = [A + A(l - A) + A(l - A)2 + .. . ]p*
= A[l + (1 - A) + (1 - A)2 + .. . ]P*
(A.13)
(A.14)
Letting w = (1 - A) we see that the sum of terms in the square brackets equals 1/(1 - w) = 1/[1 - (I-A)] = 1/A; hence P/ = P*.
174 Macroeconomic Policy
THE STATISTICAL TESTING OF ECONOMIC MODELS
Below we outline a number of 'test statistics' that are used to measure (i) the degree to which a particular behavioural (struc~ural) equation 'fits' the data, and (ii) the forecasting accuracy of a complete (simultaneous-equation) model of the economy.
Consider, for example, the estimating equation given by the absolute-income theory of the consumption function:
whereon a priori reasoning it is assumed that 0 < b l < 1 andbo > 0; bo and b l are the population parameters (or coefficients) - they are the values we would obtain if we had all the possible data on Ct
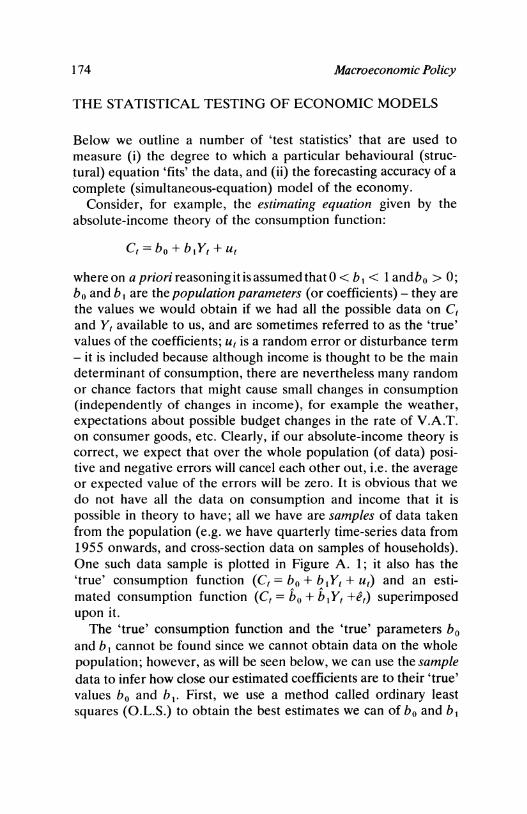
and Y t available to us, and are sometimes referred to as the 'true' values of the coefficients; Ut is a random error or disturbance term - it is included because although income is thought to be the main determinant of consumption, there are nevertheless many random or chance factors that might cause small changes in consumption (independently of changes in income), for example the weather, expectations about possible budget changes in the rate of V.A.T. on consumer goods, etc. Clearly, if our absolute-income theory is correct, we expect that over the whole population (of data) positive and negative errors will cancel each other out, i.e. the average or expected value of the errors will be zero. It is obvious that we do not have all the data on consumption and income that it is possible in theory to have; all we have are samples of data taken from the population (e.g. we have quarterly time-series data from 1955 onwards, and cross-section data on samples of households). One such data sample is plotted in Figure A. 1; it also has the 'true' consumption function (C t = bo + blYt + Ut) and an estimated consumption function (Ct = ho + hlYt +et) superimposed upon it.
The 'true' consumption function and the 'true' parameters bo and b I cannot be found since we cannot obtain data on the whole population; however, as will be seen below, we can use the sample data to infer how close our estimated coefficients are to their 'true' values bo and b l . First, we use a method called ordinary least squares (O.L.S.) to obtain the best estimates we can of bo and b l

Appendix 1 175
Consumption
, ! , , I
Popu latlon data
Sample data
..... C,-=-bo+b1 Yt+e, .,,"" (the estimated regressIon line)
","
I ..... "" ••• C,=bo+b , Yt +u/
• .....:~ .......... :. ••• (the 'true' regression line) • "" ..... xI • •
• • ..... ". I· • ",-,......-. .. • • , .. .. , t, I-_.....L __ --'.~,.:.:;;,..
• •• • I .....
• ~~::-:1 c, I--,;·,..:...."'-·----l-I--I
" ....
Sample data are shown as crosses Population data consist of the sample data and additional data (denoted by dots) which IS not available to the researcher.
Yr Income
Figure A.I Estimated and 'true' regression lines
using the sample data. The O.L.S. technique involves choosing an estimate for the intercept and slope which minimises the error sum n , of squares, I c/, where ct = (C t - Ct ) = (C1 - ho -h 1Y t ). The
1=1
O.L.S. estimators ho and hi are calculated from the original sample data using the formulae:
;,
, .t~=~I _______ __ b1 =-
1/
where C = I Ct/n and Y = I Yt/n. t = 1 t = 1
The O.L.S. estimators ho and hi may not equal their 'true' values, bo and b 1, because they have been calculated using only a sample of data from the total population. If, for example, more data on Ct and Y t become available and are used in calculating new O.L.S. estimates, then the new values of ho and 61 may be different
176 Macroeconomic Policy
from those calculated using the original data only. The question arises as to whether we can quantify how close our estimates 60 and 61 are to their 'true' values. It seems intuitively obvious that if most of the data points lie very close to the estimated line, than a small additional amount of data is unlikely to change radically the values of the O.L.S. estimates and we can be fairly sure that the estimates calculated using the original data are close to their 'true' (or population) values. Put in a slightly different way, we are saying that if most of the data points lie close to the estimated line, then the variability of 60 and 61 around their 'true' values would be small. A statistical measure of the variability of, say, bl around its 'true' value is the variance of bl (var bl ) or its square root, known as the standard error of bl (s.e. bl); these can be calculated from the sample data. Hence it should be obvious that bl will be very close to its true value if the standard error of bl (or its variance) is small in relation to the absolute size of bl ; this will be the case if the ratio bt/(s.e. bl ) is large. The ratio bt/(s.e. bl ) is known as the t statistic. In general a t statistic havi,-tg an (absolute) value greater than 2 indicates that the estimated value of the coefficient lies close to its true value, and is 'statistically significant'.
The t statistic measures the degree to which an individual coefficient approximates its true value; in contrast the coefficient of determination, R 2 , measures the degree to which the estimated relationship (which involves all the coefficients), picks up the variability in the actual dependent variable. R2 is defined as:
variation in the dependent variable explained by the regression equation variation in the dependent variable
R2 can only take values between 0 and 1 since, at the two extremes, the regression equation either explains all of the variability in the dependent variable (i.e. R2 = 1) or none (i.e. R2 = 0). An R2 of 0.8 indicates that 80 per cent of the variability of the dependent variable is explained by the independent variables of the estimated equation.
The R2 statistic has the undesirable property that it usually increases when more independent variables are added to the estimating equation. Two closely related statistics, 'R bar squared', R2 , and the 'standard error of the equation', avoid this problem and one or the other is usually used in preference to R2.
Appendix 1 177
Assume that the regression results for the absolute-income hypothesis (using annual data) are as follows:
C t = 11.5 + 0.8 Y t ,
(3.0) (0.2) R2 = 0.85
( ) = standard error of the coefficient. The value of the marginal propensity to consume is consistent
with a priori notions; it is positive and has an estimated value of 0.8. Its t statistic has a value of 4, indicating that the estimated marginal propensity to consume is probably very close to its true value. The value of R2 indicates that 85 per cent of the variability in consumption is explained by the independent variable, income.
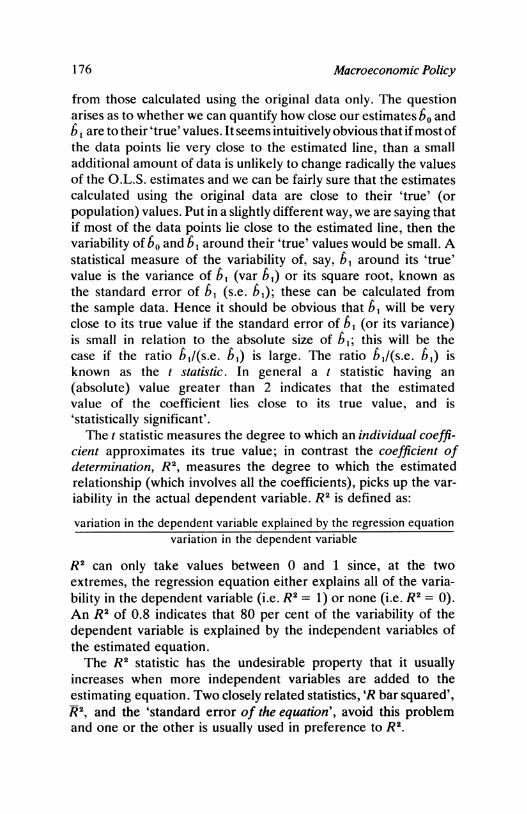
One of the main aims in constructing an economic theory is to understand and explain what has happened to a particular dependent variable in the past; another is to make predictions about movements in the dependent variable in the future. To the extent that one is interested in explaining the past, high R2 and good t statistics are indicative of success; however, such results do not necessarily imply that the equation will produce a good forecast of movements in the dependent variable outside the sample period of estimation. Before we describe some test statistics that measure forecast error, we must briefly outline some forecasting terminology with the aid of Figure A.2.
The estimation (or sample) period is the data period over which the equation is estimated. An ex post simulation predicts the value of the dependent variable within the estimation period, while an ex post forecast predicts the value of the dependent variable outside of the estimation period but within a period for which data on the variables are known. An ex ante forecast predicts the values of the dependent variable outside the period for which data are available. Finally, we can note that in an unconditional forecast all the
Ex post SImulation Ex post forecast Ex ante forecast
EstImatIon period
-----Oata penod------_ ..
T, T,
Figure A.2 Simulation periods
T, (today)
TI me

178 Macroeconomic Policy
explanatory variables are known with certainty, while in a conditional forecast we can only guess their values. Thus an ex post forecast is an unconditional forecast, while an ex ante forecast is usually (though not always) a conditional forecast.
The forecast error is a quantitative measure of the model's forecasting performance. There are several ways of measuring the forecast error and in the case of some simple single-equation models it is possible to do so analytically (see, for example, Koutsoyiannis, 1977). However, with more complex single-equation models (and certainly with most simultaneous-equation models) this is not possible, and we have to use the more ad hoc methods given below.
Consider, for example, the absolute-income regression equation Ct = ho + hlY, and assume that ho and hI were estimated using annual data for the period 1955-66. Using the available data on income for the years 1967-77, we can now use this equation to calculate the ex post forecast values of consumption for these years, Cf, and see how close they are to the actual known values, C~, to give us various measures of the forecast error.
The mean absolute error, M.A.E., is defined as:
1 t = T2
M.A.E. = T! I C~ -~I t = Tl
where in this case Tl = 1967, T2 = 1977 and T is the total number of time periods, i.e. 10 (years). The two parallel lines indicate that any negative values of (cr - C~) are to be considered as positive values when summed. The M.A.E. gives answers in units of the dependent variable (in this case, say, £1970m., constant prices); we can get some idea of the percentage M.A.E. error by dividing the M.A.E. by the mean value of the dependent variable over the forecast period:
I=T2
Ct" = ! CUT I=TI
If the model over-predicts (under-predicts) consumption in a particular forecast period, then Cf - C~ will be positive (negative); hence, the sum
1 I=T2
M.B.= - ! (C~ - C~) T I=TI

Appendix 1 179
where M.B. stands for the mean bias, and measures the degree of over- (or under-) prediction on average. M.B. = 0 indicates that on average the model neither over- nor under-predicts; M.B. < 0 indicates under-prediction; and M.B. > 0 indicates overprediction.
Notice that a small value for the M.A.E. or a value of zero for the M.B. does not necessarily indicate that an equation accurately predicts turning-points in the data. This is because these statistics measure average performance and a set of turning-points are special discrete events. However, direct observation of q' and C~ over time allows one to determine the number of turning-points (in consumption) predicted by the regression equation.
If a regression equation is to explain the past adequately and to forecast well, its coefficients should not undergo sudden large changes in their values. The degree of stability in the coefficients can be tested using either the forecast error approach or by estimating the equation over various data sub-periods. An unstable relationship tends to produce large ex post forecast errors and if estimated over data sub-periods exhibits large changes in its estimated coefficients. (Note that 'stability' is not used in this text in the sense of the dynamic properties of difference and differential equations.)
Given a number of alternative regression equations which purport to explain the movement of a particular dependent variable, it is unlikely that anyone of them will outperform the others on all of the above statistical criteria. Hence the researcher must use his judgement in deciding which equation is 'best' on empirical grounds.
Having outlined a set of criteria for testing the empirical performance of single equations, we can now look at the slightly more complex case of evaluating the performance of the whole set of equations which make up a simultaneous-equation model.
Forecast errors in the set of endogenous variables (i.e. variables that are determined or 'solved' by the model) arise because of (i) incorrect forecast values for the 'residual errors' in individual behavioural equations, (ii) errors or instability in the coefficients of behavioural equations, or (iii) errors in forecasting the exogenous variables (i.e. those variables determined outside the model). Given data on the exogenous variables the complete model can be solved (either analytically or, for large or non-linear models, by

180 Macroeconomic Policy
iterative techniques) for the time path of all the endogenous variables. If past data on the exogenous variables are used, then the resulting (ex post) predictions for the endogenous variables can be used to compute forecast error statistics such as the M.A.E., M.B. and the number of turning-points predicted. These statistics can then be used to evaluate the relative forecasting performance of alternative large-scale models.

Selected Reading
Some of the references given in the text (and provided in the Bibliography) are probably rather difficult for the economics nonspecialist. The readings below give a relatively simple exposition of the main topics covered.
CHAPTER 1
Morris, D. (ed.) (1977) The Economic System in the U.K. (London, Oxford University Press). This is an elementary theoretical and empirical overview of the U.K. economy.
Prest, A. R. and Coppock" D. J. (eds) (1976) The U.K. Economy: A Manual of Applied Economics (London, Weidenfeld & Nicolson). This gives a detailed account of the past behaviour of the U.K. economy.
CHAPTER 2
Laury, J., Lewis, G. and Ormerod, P. (1978) 'Properties of Macroeconomic Models of the U.K. Economy: A Comparative Study', National Institute Economic Review, vol. ·83, pp. 52-72. This is an account of the N .I.E.S.R., H.M. Treasury and London Business School models.
Surrey, M. J. C. (1971) The Analysis and Forecasting of the British Economy, (Cambridge, N.I.E.S.R.) This is an account of the relatively simple N.I.E.S.R. model in use in 1971.
Surrey, M. J. C. (1977) 'Assessing the Economy', in Morris (1977) ch. 15.
182 Macroeconomic Policy
CHAPTER 3
Ball, R. J., Burns, T. and Laury, J. S. E. (1976) 'The Role of Exchange Rate Changes in Balance of Payments Adjustment -the United Kingdom Case', Economic Journal, March, pp.1-29.
Cuthbertson, K. (1979), 'Demand Management and the New School: A Comment', Applied Economics, vol. 11, no. 1, pp. 71-6.
Godley, W. A. H. -(1977) 'Inflation in the United Kingdom', in Krause and Salant (1977).
Smith, R. P. (1976) 'Demand Management and the "New School" ',Applied Economics, vol. 8, no. 3, September.
CHAPTER 4
Goodhart, C. A. E. (1975) Money, Information and Uncertainty (London, Macmillan). This is difficult in parts, but is an excellent survey of the literature and offers a critical approach.
Gordon, R. J. (1976) 'Recent Developments in the Theory of Inflation and Unemployment', Journal of Monetary Economics, vol. 2, pp. 185-220. This deals with theoretical aspects and has a section on rational expectations.
Laidler, D. E. W. (1971) 'The Influence of Money on Economic Activity: A Survey of Some Current Problems', in Monetary Theory and Monetary Policy in the 1970s, ed. Clayton, G., Gilbert, J. and Sedgwick, R. (London, Oxford University Press).
Laidler, D. E. W. (1977a.) The Demand for Money: Theories and Evidence, 2nd ed .. o(New York, Dun-Donnelley).
Laidler, D. E. W. (1978b) 'Money and Money Income: An Essay on the Transmission Mechanism, Journal of Monetary Economics, vol. 4, pp. 151-92.
Laidler, D. and Parkin, J. (1975) 'Inflation: A Survey', Economic Journal, vol. 85, December, pp. 741-809.
CHAPTER 5
Corden, W. M., Little, I. M. D. and Scott, M. FG. (1975) 'Import Controls Versus Devaluation and Britain's Economic

Selected Reading 183
Prospects', Trade Policy Research Centre: Guest Paper No.2 (a critique of New Cambridge).
Economic Policy Review (published annually and gives New Cambridge analysis and policy prescriptions, including import controls).
National Institute Economic Review (published quarterly and gives the Institute's views on future economic policy, as well as articles on special topics).
Posner, M. (ed.) (1978) Demand Management (London, Heinemann). This is a comprehensive account of the policy analysis of the major U.K. forecasting units.
Thirlwall, A. P. (1978) 'The U.K.'s Economic Problem: A Balance of Payments Constraint?', National Westminster Bank Quarterly Review, February, pp. 24-32.

Notes and References
CHAPTER 1
1. Kahn and Posner in The Times, 17 April 1974, referred to their version of the Keynesian view as the 'Old School' and dubbed what we have called 'New Cambridge' as the 'New School'. In this text we shall use the more common terminology of 'Keynesian' and 'New Cambridge' throughout.
2. This view seems to be held most strongly by the N.I.E.S.R. (see, for example, Savage, 1978; and Surrey, 1978) and also perhaps by the U.K. Treasury (H.M. Treasury, 1977). Such a view was also held by the London Graduate School of Business until quite recently (see Ball et al., 1972).
CHAPTER 2
1. This implies that not all changes in business confidence are picked up by the accelerator relationship.
2. Strictly speaking (2.10) is a pseudo reduced-form equation since X and Ml depend on relative prices, the domestic price component of which may depend on other endogenous variables.
3. The value of the multiplier depends on the equations used in the model at a particular time. This range of estimates has been obtained from the N.I.E.S.R. models reported by Bispham (1975) and Ormerod (1977). The current U.K. Treasury model gives a similar value for the mutliplier of 1.1 (see Laury et al., 1978, p.56).
4. In the current N.I.E.S.R. model employment also depends negatively on the real wage but its effect on employment is small relative to that of output.
5. In the current N.I.E.S.R. wage equation unemployment has a small effect on wage inflation. However, in practice this tends to be ignored (see Surrey and Ormerod, 1978).
6. Note that estimates of the relative importance of domestic costs and world prices in the determination of U.K. export prices vary considerably (see, for example, Artus 1974; Dornbusch and
Notes and References 185
Krugman, 1976; and for microeconomic evidence Rosendale, 1973; and Holmes 1978.
7. This result follows from a simple rule about price elasticities, namely that if the elasticity is less than (greater than) unity, a fall in price causes a reduction (increase) in revenues received (see Lipsey, 1976).
8. This is the so-called Marshall-Lerner condition (see Pearce, 1970).
9. Given that the world trade elasticity of exports in the N.I.E.S.R.-Keynesian model is 0.5, the reader should be able to produce the results in Table 2.3.
10. This may be demonstrated mathematically by using a simplified form. of th~ price. and wage ~quati~ns of the Keynesian model, i.e. P = aW + gPM (1) and W = cP - ql (2), where we have ignored the productivity terms and 1 is a (dummy) variable which has a value of unity when an incomes policy is operating and zero otherwise. From (1) and. (2) we obtain the reduced-fo~m equations for prices and wages: P = - aq /(1 - ac)1 + g/(1 - ac)PM (3), and W = cg/(l - ac)P'M- q/(1 - ac)1 (4). Fr?m (3).and.(4) the rate of growth of real wages, RW = W - P = g(c - 1)/(1 - aC)PM - q(1 - a)/(1 - ac)1 (5). Thus if c < 1 (and ac", 1), then even without an incomes policy (l = 0) the rate of growth of real wages is temporarily lower after a step devaluation because of the effect of the once-and-for-all rise in the level of import prices. However, with an incomes policy (I = 1) there is an additional negative effect on the rate of growth of real wages, but only while the incomes policy is in operation. Consistent with our version of the Keynesian position the above equations assume no (full) catching-up effect on the level of money wages when the incomes policy is removed. If incomes policy has an independent effect on price inflation, this may be incorporated by the additional term -qpl in equation (1) above. Incorporating this assumption into the above analysis gives the result that incomes policy lowers the rate of growth of real wages if q > qp(1 - c)/(1 - a); and as 0 ~ (1 - c)/(1 - a) < 1, this condition is likely to hold. Finally, note that we have assumed that incomes policy does not alter the coefficients of the above equations.
CHAPTER 3
1. The budget deficit may be considered by the reader to be synonymous with the Public Sector Borrowing Requirement (P.S.B.R.).

186 Macroeconomic Policy
2. An alternative view is that an increase in the expected rate of inflation (as proxied by the actual rate) might reduce the savings ratio as people switched from financial assets to real assets such as consumer durables. In any case a better measure of 'uncertainty' would probably be the dispersion of inflation around its mean value. See Deaton (1977) and Davidson et al. (1978) for further discussion on these points.
3. Since companies and banks are both part of the private sector, the reduction in the latter's NAFA must be caused, for example, by banks switching out of government debt (a fall in the private sector's assets) and issuing a new advance and thus a bank deposit (no change in the private sector's net assets).
4. This resembles the Monetarist proposition concerning the constancy of the money-nominal-income ratio, i.e. MD = yPY, which is dealt with in Chapter 4.
5. See, for example, Worswick (1974) and Bispham (1975). Note also that Stamler found negative contemporaneous covariances between the residual errors in the personal- and company-sector equations. Since the error in the personal-sector expenditure equation influences personal-sector expenditure and thus company income, then the marginal propensity to spend of the company sector, if estimated using ordinary least squares, will be lower than its 'true' value because of simultaneous-equation bias.
6. Notice that the New Cambridge assumption that the marginal propensity to spend (on consumption and investment goods) is unity implies that all private saving (i.e. private income minus consumption) is spent on investment goods. In addition note that, strictly speaking, the dynamic NAFA equation (3.6) reduces to equation (3.13) when do + d l = 1 and when the change in nominal income is zero. Since empirically New Cambridge find that do + d l = 1, then in equation (3.13) we are implicitly assuming zero inflation and real income growth, i.e. equation (3.13) represents a static long-run equilibrium result.
7. Of course it is always open to Keynesian forecasters to make an ad hoc adjustment to their investment forecast on the basis of their forecast for retained earnings. Also, their accelerator equations for investment might give similar results to New Cambridge if output and retained earnings are highly correlated over the cycle. However, there can be no guarantee that our Keynesian model will produce a similar forecast to New Cambridge for the NAFA and the marginal propensity to spend (on this, see Posner, 1978, p. 215).
8. Import costs (prices) rise by as much as the devaluation
Notes and References 187
(equation (3.31», as do domestic prices (equation (3.20» and thus wages (equation (3.17». Total costs, which are a' weighted average of wage costs and import costs, therefore also rise by the amount of the devaluation. Thus domestic (export) prices and total costs rise by the same amount and sterling profit margins remain constant.
9. Neild (1973), a New Cambridge economist, was foremost in seemingly advocating this simple rule; for an analysis of the implications of this assumption, see Smith (1976). For evidence that the New Cambridge rule involves the tax rate and not the budget surplus, see Godley et af. (1974, para. 504) and Cuthbertson (1979). 10. This assumption is not strictly correct since in real terms the
equation involves the terms of trade (see Economic Policy Review, no. 1, 1975, p. 91). 11. Note that New Cambridge economists do not assert that the
commodity price rises in the 1970s and in the aftermath of the Korean war were offset by an increase in export value. In fact they believe that the 1970 commodity price boom was deflationary.
12. This is a variant of the so-called 'absorption' approach to the balance of payments.
CHAPTER 4
1. The Monetarist model outlined in this chapter closely resembles that of Laidler (1978a) and Jonson (1976) and some versions of the London Graduate School of Business' model (Ball and Burns, 1978). Smith (1977) has also produced a small U.K. 'Monetarist' model but (possibly with the exception of the London Graduate School of Business) none of these models are used regularly in forecasting the U.K. economy.
2. For simplicity and brevity we ignore the theoretical debate over precisely what constitutes the 'net worth' of the private sector; for a concise introduction to this area, see Laidler (1977a).
3. Again, this is a convenient simplication. However, the reader (possibly with the help of the section on geometric series in Appendix 1) can easily see that if permanent income is proxied by the adaptive-expectations hypothesis, then in the long run all changes in current income are eventually assimilated into permanent income.
4. For a financial asset such as an equity issued by a private company, where the coupon (dividend) varies over time, the relationship between the market interest rate (or 'yield') and the

188 Macroeconomic Policy
n market price of the bond is given by PBt = I CPt/(1 + R)t.
t=l Thus for a given expected flow of coupon receipts, the bond price and interest rate are inversely related. The reader (by using the formula for the sum of a geometric series with w = 1/(1 + R): see Appendix 1) might like to show that the above equation reduces to R = CP/PB when the coupon is constant and the life of the bond (i.e. 'n') approaches infinity.
5. In the United States the reserves of the banks plus cash held by the N.B.P.S. are collectively known as 'high-powered money'.
6. The discount -houses, largely for historic reasons, act as an intermediary between the commercial banks and the Bank of England. Here we 'net out' the discount houses and assume they simply purchase Treasury Bills on behalf of the commercial banks.
7. For simplicity we assume that official borrowing overseas is zero. For a clear exposition of the effect of balance-of-payments flows on the U.K. money supply, see Lomax and Mowl (1978).
8. In practice this may take the form of a longer repayment period.
9. This of course is a partial-equilibrium result. For example, it ignores, first, the problem of financing the additional interest payments on such bonds (which might tend to increase interest rates further), and second, the possibility that the demand for government bonds might rise over time, say with an increase in N.B.P.S. wealth (which would tend to mitigate any increase in interest rates).
10. Closely allied concepts in the United Kingdom are 'Bank Rate' and the 'Minimum Lending Rate'. 11. If CD is the cash to deposits ratio of the N.B.P.S. and the
money supply is defined to include cash held by the N.B.P.S. as well as their bank deposits, then our previous formula for the money supply (i.e. RES/RR) becomes RES(1 + CD)/RR. Thus to predict changes in the money supply we have to be able to predict changes in the cash to deposits ratio of the N.B.P.S. as well as the reserve ratio of the banks, RR. Also, if the N.B.P.S. switches out of government debt or foreign bonds into bank deposits, the government has to acquire additional sterling finance. Bank reserves will increase if this additional finance is met by sales of government debt to the banks (equation (4.8». In practice in the United Kingdom the authorities attempt to circumvent this process by calling for 'supplementary special deposits' if (interest-bearing) bank deposits exceed a certain amount. 12. For analytic purposes the reader may assume that a change in
domestic credit as defined here is equivalent to a change in domes-

Notes and References 189
tic credit expansion (D.C.E.), as defined in official U.K. statistics. The definition of the latter concept is somewhat involved and the interested reader might like to consult National Institute (1977b). 13. Note that this particular analysis does not demonstrate the
so-called 'direct effect' of the money supply on economic 'activity, even though equation (4.22) is consistent with such a 'direct effect'. When Monetarists refer to the 'direct effect' of money on spending they are concerned either with its effect via changes in wealth (which can be dealt with in our (/S-LM) analytic framework) or via the direct substitution of money for real assets. The latter cannot be dealt with in our (/S-LM) analytic framework because of the implicit assumption that the rate of return on money is constant or zero, thus ruling out any change in relative yields between money and real assets originating from changes in the money supply (see Goodhart, 1975, pp. 171-9, for a full exposition of these points). Most empirical work on the behavioural equations of Monetarist models deal only with the money to bonds, bonds to real assets, substitution effect, and this is why we have concentrated on this aspect here. 14. The velocity of circulation of money is the number of times a
given money stock is used in financing transactions in final goods. It is defined as P x Y/MS. In equilibrium MS = MD and given that MD = yP x Y it is easy to see that for this linear demand for money function the velocity of circulation is given by 1/y.
15. See note 13 above. 16. Although for pedagogic reasons it is useful here to derive the
'purchasing-power parity' equation (4.27) in this manner, the reader should note that a number of alternative approaches produce this result-for example, international 'price arbitrage (see p. 130) or a price-expectations-augmented Phillips curve and a cost-determined price equation. The latter case is represented by W = -(3t(lJ.-Uo) +.(32P'. (1) and P = aW + gPM (2). By definition PM = PMF-E, where PM is sterling import prices, PMF is foreign (world) price of imports, a~d E !s the dOllar-sterling exchange rate. In equiliprium U ~ Uo, re = P, and therefore from (1) and (2) we obtain P = g(PMF - E)/.(1 - q(32) (~). If {32 = 1 and g = (1 - a), then (3) implies E = PMF - P. See Ball et al. (1976) for a detailed exposition of these theoretical aspects and Genberg (1978), Isard (1977) and Kravis and Lipsey (1978) for some empirical results for a number of industrial countries.
17. This is the marginal-productivity theory of the demand for labour with changes in marginal productivity proxied by changes in average productivity. 18. The reader should note, however, that the results for the

190 Macroeconomic Policy
United Kingdom are dependent on the Carlson-Parkin series being an adequate measure of price expectations. Foster and Gregory (1977) provide a critique of the method by which this series was constructed. 19. Laidler (1975, 1977b) provides a formal analysis of this
proposition.
CHAPTER 5
1. For equation (5.1) to be strictly comparable with the Keynesian and New Cambridge reduced-form equations for output we require the terms V and Z in these equations to be zero (or small). In practice this assumption is broadly correct.
2. Some of the large-scale forecasting models of the U.S. economy embody this view (Fisher and Sheppard, 1972; Choucfhry, 1976; Modigliani, 1975). It seems that the Bank of England (1978b) may also be moving towards this Post-Keynesian position. Note also that others may define 'Post-Keynesian' in a different way to that adopted here.
3. Interestingly Chick (1977, pp. 55-7, 131-9) argues that Monetarist and non-Monetarist views concerning the influence of the money supply on economic activity may be partly reconciled by an analysis of the way money enters the system. For example, she argues that non-Monetarists (like New Cambridge theorists and the Keynesians) are more likely to agree with Monetarists about the effect on output of an increase in the money supply consequent on a budget deficit than they are on an increase originating from a release of special deposits.
4. 'Competition and Credit Control' (Bank of England, 1971) gave the U.K. commercial banks increased scope in competing for additional deposits. Previously the banks had operated a cartel in the setting of rates of interest paid on deposits and possibly advances.
5. For the period 1960-75 the nominal interest rate on U.K. government bonds minus the actual rate of inflation (a proxy for price expectations) has been roughly constant at 3 per cent p.a. over the medium term.
6. Certainly, for non-Monetarists aggregate measures of excess capacity, such as the output-capacity ratio, the proportion of firms who say they are working at less than full capacity and the actual level of unemployment, indicate that this is so. Note, however, that Monetarists would not accept the latter as an adequate measure of excess capacity in the labour market, since they see

Notes and References 191
much of the current level of unemployment as being 'voluntary' (and partly caused by high earnings-related unemployment benefits) rather than 'involuntary' (and caused by deficient demand, as argued by Keynesians and New Cambridge economists). In addition all schools of thought recognise that there may be shortages of particular types of labour, say skilled workers, even when aggregate indices show an over-all excess supply of labour..
7. Equation (2.16) shows that if output and employment are at their 'full-employment' levels, the share of profit in total income is negatively related to the real wage. Also note that if the devaluation is to be successful, these profits cannot be recouped by increased company taxation since this reduces the incentive to export.
8. Although recently there has been a great furore in the United Kingdom over the size of the budget deficit, evidence suggests that much of the deficit is the result of the severe recession, increasing unemployment benefits and reducing the tax receipts (Bank of England, 1978a; H.M. Treasury, 1978). The 'full-employment budget deficit' (Le. the actual budget deficit adjusted for the effects of these 'built-in stabilisers') shows that over the past few years fiscal policy has not been particularly expansionary.
9. Notice also that this transmission mechanism from the money supply to prices does not require the excessdemand-inflation link of the Phillips curve, and provides a plausible reason for the observed instability in the latter, in small open economies (like the United Kingdom) operating under flexible exchange rates.
10. 'M1', i.e. currency plus demand (sight) deposits, would seem to be the most useful monetary aggregate to use since the demand function for 'M1' is probably more stable than the other official U.K. monetary aggregates, and it may also be easier to monitor. 11. Given that the short-run interest elasticity of the demand for
money is small, then large changes in interest rates (and bond prices) would ensue if an attempt were made to alter moneysupply growth rapidly, and this could cause instability in the N.B.P.S. demand for gilts, thus exacerbating the problem of money-supply control (see, for example, Goodhart, 1975, pp. 156-160). Also, casual observation suggests that sudden changes in money-supply growth may cause short-run cash-flow problems and unnecessary bankruptcies (e.g. the difficulties experienced by the secondary banks in the United Kingdom around 1973).

192 Macroeconomic Policy
12. If shifts in the demand for money function (and the LM curve) are more volatile in the short run than shifts in the goods market (and the IS curve), then to minimise the variation in output economic theory (Poole, 1970) suggests that interest rates rather than the money supply should be controlled in the short run (see Goodhart, 1975, pp. 231-40, for a concise exposition). 13. All three schools would probably agree that some level of
unemployment would generate wage inflation. The priceexpectations-augmented Phillips curve approach (Le. the Monetarist view) illdicates that, at present in the United Kingdom, the 'natural rate' of unemployment probably lies between 3 and 5 per cent of the labour force. Some Keynesians and New Cambridge estimate 'full employment' at about 2-2! per cent of the labour force (see National Institute Economic Review, no. 79, 1977, p. 51, and the Economic Policy Review, no. 4, 1978, p. 6). My own view is that the unemployment rate consistent with a low rate of inflation varies with the economic policies pursued, and I would put it at about 3 per cent ± 1 per cent of the labour force if a sustained growth policy were to be pursued.
Bibliography
Anderson, L. C. and Carlson, K. M. (1970) 'A Monetarist Model for Economic Stabilization', Federal Reserve Bank of St Louis Review, April.
Ando, A. and Modigliani, F. (1963) 'The Life Cycle Hypothesis of Saving: Aggregate Implications and Tests', American Economic Review, vol. 53.
Artis, M. J. (1976) A Comment on Duck et al. (1976), in Inflation in the World Economy, ed. Parkin, J. M. and Zis, G. (Manchester University Press).
Artis, M. J. and Lewis, M. K. (1976) 'The Demand for Money in the U.K. 1963-73', Manchester School, vol. 44, pp. 147-8I.
Artis, M. J. and Nobay, A. R. (1969) 'Two Aspects of the Monetary Debate', National Institute Economic Review, vol. 49. August, pp. 33-5I.
Artus, J. R. (1974) 'The Behaviour of Export Prices of Manufactures', I.M.F. Staff Papers, vol. xXI(3).
Ash, J. C. K. and Smyth, D. J. (1973) Forecasting the United Kingdom Economy (Farnborough, Saxon House).
Ball, R. J. and Burns, T. (1976) 'The Inflationary Mechanism in the U.K. Economy, American Economic Review, vol. 66, September, pp. 478-84.
Ball, R. J. and Burns, T. (1978) 'Stabilisation Policy in Britain 1964-81', in Posner (1970, pp. 66--97).
Ball, R. J., Burns, T. and Laury, J. S. E. (1976) 'The Role of Exchange Rate Changes in Balance of Payments Adjustment -the United Kingdom Case', Economic Journal, March, pp.I-29.
Ball, R. J., Burns, T. and Miller, G. W. (1972) 'Preliminary Simulations with the London Business School Macroeconomic Model', in Renton (1975).
Bank of England (1971) 'Competition and Credit Control', Bank of England Quarterly Bulletin, vol. II.
Bank of England (1972) 'Timing Relationships between Movements of Monetary and National Income Variables', reprinted in Johnson, (1972).

194 Macroeconomic Policy
Bank of England (1975) 'The Personal Savings Ratio', Bank of England Quarterly Bulletin, March.
Bank of England (1978a) 'Why is Britain in a Recession?', Bank of England Quarterly Bulletin, vol. 18(1), March, pp.38-47.
Bank of England (1978b) 'An Account of Monetary Policy: The Governor's Mais Lecture', Bank of England Quarterly Bulletin, vol. 18(1), March, pp. 31-7.
Batchelor, R. A. and Sheriff, T. D. (1978) 'Unemployment and Unanticipated Il!.flation in Postwar Britain', Centre for Banking and International Finance, City University, Discussion Paper No.4, February.
Baumol, W. J. (1952) 'The Transactions Demand for Cash: An lnventory Theoretic Approach', Quarterly Journal of Economics, 66, November, pp. 545-56. .
Bispham, J. A. (1975) 'The New Cambridge and "Monetarist" Criticisms of "Conventional" Economic Policy-Making', National Institute Economic Review, vol. 74, November, pp.39-55.
Blackaby, F. T. (1978) 'The Reform of the Wage Bargaining System', National Institute Economic Review, vol. 85, August, pp.49-54.
Blinder, A. S. and Solow, R. M. (1973) 'Analytical Foundations of Fiscal Policy', in Economics of Public Finance (Washington, D.C., Brookings Institution).
Boatwright, B. D. and Renton, G. A. (1973) 'The Determinants of U.K. Inflows and Outflows of Long-Term Portfolio Capital', London Graduate School of Business, E.F.U. Discussion Paper No. 30.
Bodkin, R. G. (1969) 'Real Wages and Cyclical Variations in Employment: A Re-examination of the Evidence', Canadian Journal of Economics, August, pp. 353-74.
Brechling, F. R. (1974) 'Monetary Policy and Neoclassical Investment Analysis', in Johnson and Nobay (1974).
Brechling, F. R. (1975) Investment and Employment Decisions (Manchester University Press).
Bruce Johnson, M. (1971) Household Behaviour: Consumption, Income and Wealth (Harmondsworth, Penguin).
Burns, T. and Warburton, P. J. (1977) 'International Aspects of U.K. Inflation: Some Preliminary Empirical Results', London Graduate School of Business, Discussion Paper.
Carlson, J. A. and Parkin, J. M. (1975) 'Inflation Expectations', Economica, n.s., vol. 42, May, pp. 123-38.
Chick, V. (1977) The Theory of Monetary Policy, new ed. (Oxford: Blackwell).

Bibliography 195
Choudhry, N. N. (1976) 'Integration of Fiscal and Monetary Sectors in Econometric Models: A Survey of Theoretical Issues and Empirical Findings', I.M.F. Staff Papers, July.
Coghlan, R. T. (1978) 'A Transactions Demand for Money', Bank of England Quarterly Bulletin, vol. 18(1), March, pp. 48-60.
Corden, W. M., Little, I. M. D. and Scott, M. FG. (1975) 'Import Controls versus Devaluation and Britain's Economic Prospects', Trade Policy Research Centre: Guest Paper No.2.
Coutts, K. J. (1977) 'A Post Mortem on Five Years of C.E.P.G. Forecasting', Economic Policy Review, no. 3, ch. 10.
Coutts, K. J., Tarling, R. J. and Wilkinson, S. F. (1976) 'Wage Bargaining and the Inflation Process', Economic Policy Review, no. 2, ch. 2.
Cripps, T. F. and Fetherston, M. J. (1977) 'The Role of Monetary Policy in Economic Management', Economic Policy Review, no. 3, ch. 4.
Cripps, T. F., Fetherston, M. J. and Godley, W. (1976) 'What's Left of "New Cambridge"?', Economic Policy Review, no. 2.
Cross, R. B. and Laidler, D. E. W. (1975) 'Inflation, Excess Demand and Expectations in Fixed Exchange Rate Open Economies: Some Preliminary Empirical Results', in Inflation in the World Economy, ed. Parkin, J. M. and Zis, G. (Manchester University Press).
Currie, D. A. (1976) 'Some Criticisms of the Monetary Analysis of Balance of Payments Correction', Economic Journal, vol. 86.
Cuthbertson, K. (1979) 'Demand Management and the "New School": A Comment', Applied Economics, vol. 11. no. 1, pp. 71-6.
Davidson, J. E. H., Hendry, D. F., Srba, F. and Yeo, S. (1978) 'Econometric Modelling of the Aggregate Time-Series Relationship between Consumers' Expenditure and Income in the United Kingdom', London School of Economics mimeograph, February.
Deaton, A. S. (1972) 'Wealth Effects on Consumption in a Modified Life-Cycle Model', Review of Economic Studies, vol. 32(120), October, pp. 443-53.
Deaton, A. S. (1977) 'Involuntary Saving through Unanticipated Inflation', American Economic Review, 67, pp. 899-910.
Department of Employment (1976) Gazette, October. Dogas, D. and Hines, A. G. (1975) 'Trade Unions and Wage
Inflation in the U.K.: A Critique of Purdy and Zis', Applied Economics, vol. 7, pp. 195-211.
Dornbusch, R. (1973) 'Devaluation, Money and Nontraded Goods', American Economic Review, vol. 53, December, pp.871-80.

196 Macroeconomic Policy
Dornbusch, R. and Krugman, P. (1976) 'Flexible Exchange Rates in the Short Run', Brookings Papers on Economic Activity, vol. 3.
Duck, N. W. and Sheppard, D. K. (1978) 'A Proposal for the Control of the U.K. Money Supply', Economic Journal, vol. 88, March, pp. 1-17.
Duck, N. W., Parkin, J. M., Rose, D. E., and Zis, G. (1976) 'The Determination of the Rate of Change of Wages and Prices in the Fixed Exchange Rate World Economy 1956-71, in Inflation in the World Economy, ed. Parkin, J. M. and Zis, G. (Manchester University Press).
Economic Policy Review (1975, 1976, 1977,1978), Department of Applied Economics, University of Cambridge.
Edgren, G., Faxen, K. O. and Odhner, G. E. (1969) 'Wages Growth and the Distribution of Income', Swedish Journal of Economics, vol. 71(3), September, pp. 133-60.
Evans, M. K. (1969) Macroeconomic Activity (New York, Harper & Row).
Fetherston, M. J. (1975) 'Estimation of Simultaneous Relationships: A U.K. Private Expenditure Function', mimeograph, Department of Applied Economics, University of Cambridge.
Fetherston, M. J. (1976) Technical Manual on the C.E.P.G. Model, Department of Applied Economics, University of Cambridge, April.
Fetherston, M. J., Moore, B. and Rhodes, J. (1977) 'Manufacturing Export Shares and Cost Competitiveness of Advanced Industrial Countries', Economic Policy Review, no. 3, ch. 6.
Fisher, G. and Sheppard, D. (1972) 'Effects of Monetary Policy on the United States Economy: A Survey of Econometric Evidence', Economic Outlook, Occasional Studies, Paris, O.E.C.D., December.
Fisher, I. (1926) 'A Statistical Relation Between Unemployment and Price Changes', International Labour Review, vol. 13, June, pp. 785-92 (reprinted as 'I Discovered the Phillips Curve', Journal of Political Economy, vol. 81, no. 2, March/April 1973, pp. 496-502.
Flemming, J. S. (1976) Inflation (London, Oxford University Press).
Foster, J. and Gregory, M. (1977) 'Inflationary Expectations: The Use of Qualitative Survey Data', Applied Economics, December, pp. 319-31.
Friedman, M. (1968) 'The Role of Monetary Policy', American Economic Review, vol. 58, March, pp. 1-17.
Friedman, M. (1977) Inflation and Unemployment (London, Institute of Economic Affairs).

Bibliography 197
Genberg, H. (1978) 'Purchasing Power Parity under Fixed and Flexible Exchange Rates', Journal of International Economics 8(2).
Godfrey, L. G. (1971) 'The Phillips Curve: Incomes Policy and Trade Union Effects', in The Current Inflation, ed. Johnson, H. G. and Nobay, A. R. (London, Macmillan) ch. 6.
Godley, W., Fetherston, M. and Cripps, T. F. (1974) Evidence given in Ninth Report of the Expenditure Committee, HC328, Public Expenditure, Inflation and the Balance of Payments (London, H.M.S.O.).
Godley, W. and Fetherston, M. (1977) "'New Cambridge" Macroeconomics and Global Monetarism: Some Issues in the Conduct of U.K. Economic Policy', mimeograph, Department of Applied Economics, University of Cambridge.
Godley, W. (1977) 'Inflation in the United Kingdom', in Krause and Sal ant (1977, pp. 451-92).
Goodhart, C. A. E. (1975) Money, Information and Uncertainty (London, Macmillan).
Goodhart, C. A. E. (1978) 'Monetary Policy', in Posner (1978). Goodhart, C. and Crockett, A. D. (1970) 'The Importance of
Money', Bank of England Quarterly Bulletin, vol. 10(3), June, pp. 181-90 (reprinted in Johnson (1972».
Gordon, R. J. (1976) 'Recent Developments in the Theory of Inflation and Unemployment', Journal of Monetary Economics, vol. 2, pp. 185-220.
Grey, M. R., Ward, R. G. and Zis, G. (1976) 'The World Demand for Money Function: Some Preliminary Results', in Inflation in the World Economy, ed. Parkin, J. M. and Zis, G. (Manchester University Press).
Grice, J. (1974) 'Select Committee on Public Expenditure: Mr Godley's Paper', H.M. Treasury internal memo, July.
Griliches, Z., Maddala, G. S., Lucas, R. and Wallace, N. (1962) 'Notes on Estimated Quarterly Aggregate Consumption Functions', Econometrica, vpl. 30.
Hacche, G. (1974) 'The Demand for Money in the U.K.: Experience Since 1971', Bank of England Quarterly Bulletin, vol. 14(3), September.
Hagger, A. J. (1977) Inflation: Theory and Policy (London, Macmillan).
Hendry, D. F. (1978) 'Predictive Accuracy and Econometric Modelling in Macroeconomics: The Transactions Demand for Money Function', London School of Economies, mimeograph, May.
Hendry, D. F. and Mizon, G. E. (1978) 'Serial Correlation as a Convenient Simplification Not a Nuisance: A Comment on a
198 Macroeconomic Policy
Study of the Demand for Money by the Bank of England', Economic Journal, vol. 88, pp. 549-63.
Henry, S. G. B. and Ormerod, P. (1978) 'Incomes Policy and Wage Inflation: Empirical Evidence for the U.K. 1961-77', National Institute Economic Review, vol. 85, August, pp. 31-9.
Henry, S. G. B., Sawyer, M. C. and Smith, P. (1976) 'Models of Inflation in the U.K.', National Institute Economic Review, vol. 77, August.
H.M. Treasury (1977) Technical Manual (London, H.M.S.O.).
H.M. Treasury (1978) 'The Standardised Budget Balance', Treas-ury Working Paper, no. 1. _
Hilton, K. and Crossfield, D. H. (1970) 'Short-Run Consumption Functions for the U.K. 1955-65, in The Econometric Study of the United Kingdom, ed. Hilton, K. and Heathfield, D. F. (London, Macmillan).
Hines, A. G. (1964) 'Trade Unions and Wage Inflation in the United Kingdom: 1893-1961', Review of Economic Studies, vol. 31(4), October, pp. 221-52.
Hines, A. G. (1968) 'Unemployment and the Rate of Change of Money Wage Rates in the U.K., 1862-1963: A Reappraisal', Review of Economic Studies, February.
Hines, A. G. (1969) 'Wage Inflation in the United Kingdom, 1948-62. A Disaggregated Study', Economic Journal, vol. 74, March.
Holden, K. and Peel, D. A. (1977) 'An Empirical Investigation of Inflationary Expectations', Oxford Bulletin of Economics and Statistics, vol. 39(4), November, pp. 291-9.
Holmes, P. M. (1978) Industrial Pricing Behaviour and Devaluation (London, Macmillan).
Isard, P. (1977) 'How Far Can We Push the "Law of One Price"T, American Economic Review, December.
Johnson, H. G. (ed.) (1972) Readings in British Monetary Economics (London, Oxford University Press).
Johnson, H. G., and Nobay, A. (1974) Issues in Monetary Economics (London, Oxford University Press).
Johnston, J. and Timbrell, M. (1973) 'Empirical Tests of a Bargaining Theory of Wage Rates Determination', Manchester School, pp. 141-68.
Jonson, P. D. (1976) 'Money and Economic Activity in the Open Economy: The United Kingdom', Journal of Political Economy vol. 84, pp. 979-1012.
Jorgenson, D. W. (1971) 'Econometric Studies of Investment Behaviour: A Survey', Journal of Economic Literature, vol. 9.

Bibliography 199
Kennedy, M. C. (1969) 'How Well Does the National Institute Forecast?', National Institute Economic Review, November, pp.40-52.
Keynes, J. M. (1936) The General Theory of Employment, Interest and Money (London, Macmillan).
Koutsoyiannis, A. (1977) Theory of Econometrics, 2nd ed. (London, Macmillan).
Krause, L. B. and Salant, W. S. (1977) Worldwide Inflation (Washington, D.C., Brookings Institution).
Kravis, I. B. and Lipsey, R. E. (1978) 'Price Behaviour in the Light of Balance of Payments Theories', Journal of International Economics, vol. 8 (2).
Kuhn, T. S. (1962) The Structure of Scientific Revolutions (University of Chicago Press).
Laidler, D. E. W. (1971) 'The Influence of Money on Economic Activity - A Survey of Some Current Problems', in Monetary Theory and Monetary Policy in the I 970s, ed. Clayton, G., Gilbert, J. and Sedgwick, R. (London, Oxford University Press).
Laidler, D. E. W. (1975) 'Price and Output Fluctuations in an Open Economy', in Essays on Money and Inflation (Manchester University Press) ch. 9.
Laidler, D. E. W. (1977a) The Demand for Money: Theories and Evidence, 2nd ed. (New York, Dun-Donnelley).
Laidler, D. E. W. (1977b) 'Expectations and the Behaviour of Prices and Output under Flexible Exchange Rates', Economica, November, pp. 327-37.
Laidler, D. E. W. (1978a) 'A Monetarist Viewpoint', in Posner (1978, pp. 35-65).
Laidler, D. E. W. (1978b) 'Money and Money Income: An Essay on the Transmission Mechanism', Journal of Monetary Economics, vol. 4, pp. 151-92.
Laidler, D. E. W. and Parkin, J. M. (1970) 'The Demand for Money in the U.K. 1956-67, Preliminary Estimates', Manchester School, vol. 38, September (reprinted in Johnson, 1972).
Laidler, D. E. W. and Parkin, J. M. (1975) 'Inflation: A Survey', Economic Journal, vol. 85, December, pp. 741-809.
Laury, J., Lewis, G. and Ormerod, P. (1978) 'Properties of Macroeconometric Models of the U.K. Economy: A Comparative Study', National Institute Economic Review, vol. 83, pp.52-72.
Leijonhufvud, A. (1968) On Keynesian Economics and the Economics of Keynes (London, Oxford University Press).
Lipsey, R. G. (1976) An Introduction to Positive Economics (London, Weidenfeld & Nicolson).
200 Macroeconomic Policy
Lipsey, R. G. and Parkin, J. M. (1970) 'Incomes Policy: A Reappraisal', Economica, n.s., vol. 36, May, pp. 115-38.
Lomax, R. and Mowl, C. (1978) 'Balance of Payments Flows and the Monetary Aggregates in the United Kingdom', H.M. Treasury Working Paper No.5 (London, H.M.S.O.).
Maki, D. and Spindler, Z. A. (1975) 'The Effect of Unemployment Compensation on the Rate of Unemployment in Great Britain', Oxford Economic Papers, vol. 27(3), November.
Matthews, K. G. P. and Ormerod, P. A. (1978) 'St Louis Models of the U.K. Economy', National Institute Economic Review vol. 84, May, pp. 65-9.
Modigliani, F. (1971) 'Monetary Policy and Consumption', in Consumer Spending and Monetary Policy: The Linkages (Federal Reserve Bank of Boston).
Modigliani, F. (1975) 'The Channels of Monetary Policy in the Federal Reserve-M.I.T.-University of Pennsylvania Econometric Model of the U.S.', in Renton (1975).
Morris, D. (ed.) (1977) The Economic System in the U.K. (London, Oxford University Press).
Mortensen, D. T. (1970) 'A Theory of Wage and Employment Dynamics', in Phelps (1970).
National Institute (1976) 'Incomes Policy', National Institute Economic Review, February, pp. 75-9.
National Institute (1977a) 'A Listing of the National Institute Model III, May 1977 Review', National Institute of Economic and Social Research, Discussion Paper No.7.
National Institute (1977b) 'Some Aspects of the Medium-Term Management of the Economy', National Institute Economic Review, March, pp. 38-57.
Neild, R. R. (1973) 'The Case for a Change in Fiscal Policy', London and Cambridge Economic Bulletin, no. 85.
Nordhaus, W. D. (1972a) 'The Worldwide Wage Explosion', Brookings Papers on Economic Activity, no. 2, pp. 431-65.
Nordhaus, W. D. (1972b} 'Recent Developments in Price Dynamics', in The Econometrics of Price Determination Conference, ed.
"Eckstein, O. Nordhaus, W., Coutts, K. and Godley, W. (1978) Industrial
Pricing in the United Kingdom (Cambridge University Press). Nordhaus, W. D. and Godley, W. (1972) 'Pricing in the Trade
Cycle', Economic Journal, vol. 82, pp. 853-82. Norton, W. E. (1969) 'Debt Management and Monetary Policy in
the U.K.', Economic Journal, vol. 79 (315), September. Odling-Smee, J. and Hartley, N. (1978) 'Some Effects of

Bibliography 201
Exchange Rate Changes', H.M. Treasury Working Paper No.2, March.
Okun, A. M. (1975) 'Inflation: Its Mechanics and Welfare Costs', Brookings Papers on Economic Activity, vol. 6, no. 2, pp.351-90.
O.E.C.D. (1970) Inflation: the Present Problem, Paris, December. Ormerod, P. A. (1977) 'The Structure and Properties of the
National Institute Model', National Institute of Economic and Social Research, Discussion Paper No.4.
Parkin, J. M. (1977a) 'Inflation in the United Kingdom: a Comment on Godley', in Krause and Salant (1977).
Parkin, J. M. (1977b) 'World Inflation, International Relative Prices and Monetary Equilibrium under Fixed Exchange Rates, in The Political Economy of Monetary Reform, ed. Aliber, R. Z. (London, Macmillan).
Parkin, J. M., Richards, I. and Zis, G. (1976) 'The Determination and Control of the World Money Supply under Fixed Exchange Rates 1961-71', in Inflation in Open Economies, ed. Parkin, J. M. and Zis, G. (Manchester University Press).
Parkin, J. M. and Sumner, M. T. (1978) Inflation in the United Kingdom (Manchester University Press).
Parkin, J. M., Sumner, M. T. and Jones, R. A. (1972) 'A Survey of the Econometric Evidence of the Effects of Incomes Policy on the Rate of Inflation', in Incomes Policy and Inflation, ed. Parkin, J. M. and Sumner, M. T. (Manchester University Press).
Parkin, J. M., Sumner, M. T. and Ward, R. (1976) 'The Effects of Excess Demand, Generalised Expectations and Wage-Price Controls on Wage Inflation in the U.K.', in The Economics of Wage and Price Controls, ed. Brunner, K. and Meltzer, A. H. (Amsterdam, North-Holland).
Pearce, I. F. (1970) International Trade (London, Macmillan). Peston, M. H. (1974) Theory of Macroeconomic Policy (Oxford,
Philip Allan). Phelps, E. S. (1970) Microeconomic Foundations of Employment
and Inflation Theory (New York, Norton). Phillips, A. W. (1958) 'The Relation between Unemployment and
the Rate of Change of Wages Rates in the United Kingdom, 1862-1957, Economica, vol. 25, November, pp.283-99 (reprinted in Inflation, ed. Ball, R. J. and Doyle, P. (Harmondsworth, Penguin).
Poole, W. (1970) 'Optimal Choice of Monetary Policy Instruments in a Simple Stochastic Macro Model', Quarterly Journal of Economics, August.

202 Macroeconomic Policy
Posner, M. (ed.) (1978) Demand Management (London, Heinemann).
Prest, A. R. and Coppock, D. J. (eds) (1976) The U.K. Economy: A Manual of Applied Economics (London, Weidenfeld & Nicolson).
Price, L. D. (1972) 'The Demand for Money in the U.K.: A Further Investigation', Bank of England Quarterly Bulletin, vol. 12(1), March, pp. 43-55.
Purdy, D. and Zis, G. (1973) 'Trade Unions and Wage Inflation in the U.K.: A Reappraisal', in Essays in Modern Economics, ed. Parkin, J. M. and Nobay, A. R. (London, Longmans).
Purdy, D. and Zis, G. (1974) 'On the Concept and Measurement of Union Militancy', in Inflation and Labour Markets, ed. Laidler, D. E. W. and Purdy, D. (Manchester University Press).
Purdy, D. and Zis, G. (1976), 'Trade Unions and Wage Inflation in the U.K.: A Reply to Dogas and Hines, Applied Economics, vol. 8, pp. 249-65.
Renton, G. A. (1975) Modelling the Economy (London, Heinemann).
Rosendale, P. R. (1973) 'The Short-Run Pricing Policies of Some British Engineering Exporters', National Institute Economic Review, no. 65, August.
Rowan, D. C. (1976) 'Godley's Law, Godley's Rule and the "New Cambridge" Macroeconomics', Banca Nationale del Lavoro Quarterly Review, vol. 117, June.
Savage, D. (1978) 'The Channels of Monetary Influence: A Survey of the Empirical Evidence', National Institute Economic Review, vol. 83, February, pp. 73-89.
Sargent, T. J. and Wallace, N. (1976) 'Rational Expectations and the Theory of Economic Policy', Journal of Monetary Economics, 2(2), April, pp. 169-85.
Smith, D. (1977) 'A Monetary Model of the British Economy 1880-1975', National Westminster Bank Quarterly Review, February, pp. 18-32.
Smith, G. W. (1978) 'Price Determination', in Parkin and Sumner (1978, ch. 5).
Smith, R. P. (1976) 'Demand Management and the "New School"', Applied Economics, vol. 8, no: 3, September.
Stamler, H. (1975) 'Some Further Investigations into "New Cambridge" Expenditure Functions', H.M. Treasury internal memo, June.
Sumner, M. T. (1978) 'Wage Determination', in Parkin and Sumner (1978).

Bibliography 203
Surrey, M. J. C. (1971) The Analysis and Forecasting of the British Economy (Cambridge, N.I.E.S.R.).
Surrey, M. J. C. (1978) 'Summary and Appraisal', National Institute Economic Review, vol. 83, February, pp. 3-6.
Surrey, M. J. C. and Ormerod, P. A. (1978) 'Demand Management in Britain 1964--81', in Posner (1978).
Tarling, R. and Wilkinson, F. (1977) 'Inflation and the Money Supply', Economic Policy Review no. 3, pp. 56-60.
Thirlwall, A. P. (1978) 'The UK's Economic Problem: A Balance of Payments Constraint?', National Westminster Bank Quarterly Review, February, pp. 24--32.
Tobin, J. (1958) 'Liquidity Preference as Behaviour towards Risk', Review of Economic Studies, vol. 25, February, pp.65-86.
Turnovsky, S. J. (1970) 'Empirical Evidence on the Formation of Price Expectations', Journal of the American Statistical Association, vol. 65, December.
White, W. R. (1975) 'Some Econometric Models of Deposit Bank Portfolio Behaviour in the U.K., 1963-70', in Renton (1975).
Williams, D., Goodhart, C. and Gowland, D. (1976) 'Money, Income and Causality: the U.K. Experience', American Economic Review, vol. 66, pp. 417-23.
Worswick, G. D. N. (1974) Evidence given in the Ninth Report of the Public Expenditure Committee, HC328, Public Expenditure, Inflation and the Balance of Payments (London, H.M.S.O.) pp.28-47.
Worswick, G. D. N. (1975) 'National Institute Experience with Econometric Models', in Renton (1975).
Zellner, A., Huang, D. S. and Chau, L. C. (1965) 'Further Analysis of the Short-Run Consumption Function with Emphasis on the Role of Liquid Assets', Econometrica, vol. 33.

Index
absolute income theory 174 absorption approach to the balance of
payments 187 accelerator 25, 92 advances, see bank advances aggregate demand 8 Anderson, L. C. 123 Ando, A. 91 anticipated inflation, see inflation arbitrage
international interest rate 131 international price 11, 134, 150 wage 137
Artis, M. J. 98, 124, 145 Artus, J. R. 184 Ash, J. K. C. 50-1,83 asset demand function 95-8 asset substitution 92, 123, 148, 163,
189 asset-switching 95-111, 189
balance of payments 4, 15-19, 35-8, 79-82, 110-11, 129, 134-5, 158
balance sheet of banks 99-103 balances with the Bank of England
99-111 Ball, R. J. 182 bank
advances 100, 102-4, 106, 108, 120
commercial 99-111 profits of 107
Bank of England 91, 125 Bank Rate 188 Batchelor, R. A. 116-17, 144 Baumol, W. J. 95 behavioural equation 169 Bispham, J. A. 184 Blackaby, F. T. 159 Blinder, A. S. xi Boatwright, B.D. 132
Bodkin, R. G. 114 bond 95-111 bond price 93-8, 188 Brechling, F. R. 153 Bretton Woods 129 'broad' money supply 97-8 Bruce Johnson, M. 92 Brunner, K. 201 budget surplus/deficit 79-82, 154,
162, 185 building society deposits 56 Burns, T. 128, 138, 141, 182
Cambridge Economic Policy Group 12
capital flows 108, 131, 133, 155 capital gains/losses 94-5 capital goods 95. See also investment Carlson, J. A. 123 Carlson, K. M. 141 cash base 108 cash-deposit ratio 107, 188 cash flow 191 cash reserve ratio 109-10 Chau, L. C. 203 Chick, V. 190 Choudhry, N. N. 190 closed economy 7, 90 coefficient of determination (R2)
176-7 Coghlan, R. T. 97 commercial bills 100 commodity prices 85, 187 company sector 57-8 conditional forecast 177 consumers' expenditure 57,92 consumption function 24, 91, 169 control theory 167 Coppock, D. J. 181 Corden, W. M. 182 corporation tax 83

Index
correlation analysis of money-supply effects 125
coupon on a bond 93-4, 187-8 Coutts, K. J. 65, 88 credit 152. See also hire-purchase
credit Cripps, T. F. 53,61 Crockett, A. D. 98, 124 Cross, R. B. 116, 139, 142 Crossfield, D. H. 91 crowding out 9, 118, 120, 163 Currie, D. A. 161 customer markets 140 Cuthbertson, K. 182
Davidson, J. E. H. 186 Deaton, A. S. 92, 186 deflation 77 demand for bonds 96 demand for cash 107, 109 demand for labour 112-14 demand for money 9,95-111 Department of Applied Economics,
Cambridge 12 Department of Employment 144 dependent variable 169 devaluation/depreciation 3-19,41-3,
73.75-8. 133-5. 158-9 direct taxes 65, 69 dirty floating 17, 41, 182. See also
devaluation Discount Houses 99, 188 discretionary policy 6, 14, 49 Dogas, D. 31 domestic credit 110-11, 118, 132,
135, 162-5, 188-9 expansion (DCE) 18, 188-9
Dornbusch, R. 184 Doyle, P. 201 Duck, N. W. 107, 145 dynamic effects 167
earnings-related unemployment benefit 117, 143-4
Edgren,G. 196 elasticity
defined 170 of the demand for money 97-8,
118, 119-21, 133, 152, 163, 170, 191
of export volume 37, 72-3, 185 of import volume 36, 72-3 of investment 25,93, 118-20, 151,
163
eligible liabilities 106 eligible reserve assets 109 employment function 27 endogenous variables 179
205
equality rule between instruments and targets 156
estimating equation 174 ex ante forecast 177 ex post forecast 50-2, 177, 179 excess capacity 190 excess demand 4, 68, 70, 113-17,
147, 153-4. See also Phillips curve
Exchange Equalisation Account 101 exchange rate 4.9-14.41-3.47.75-8.
125-33, 135-6, 172 expectations 155
adaptive 30, 139-42, 150, 172-3 price 30,157,172-3
expected holding period yield 94-5 expected rate of inflation, see inflation expenditure switching 35,75-8, 129 export price equation 37,77 export prices 36-9, 75-9 export profitability 37 export volume equation 26 export-led growth 73 exports 26, 39-47, 75-9
factor cost adjustment 24 Faxen, K. O. 196 Federal Reserve Bank of St Louis's
Model 7 Fetherston, M. J. 53,61,72, 161 financial asset 55-61 financial institutions
definition of 54 financial surplus 55-7 fine-tuning 23, 49, 83-5 fiscal drag 25 fiscal policy 3-4, 8, 15-19, 47, 77,
123 multiplier 123 rule 79-86
Fisher, G. 190 Fisher, I. 116 Flemming, J. S. 111 flow of funds 54-7, 101 forecasting accuracy/error 50-2,
88-9, 177-80 foreign bonds 133 foreign-exchange reserves 101, 105,
110-11, 131-6 foreign-trade sector 154
206
Foster, J. I. 189 Friedman, M. 7,93, 116 frustration hypothesis, See trade-
union power/pushfulness full employment 157-8, 192
Genberg, H. 189 geometric series 172-3 gilt-edged stock 56, 105 Godfrey, L. G. 31,39-41 Godley, W. A. H. 83, 88, 116-17,
161, 182 Goodhart, C. A. E. 98, 124, 182 goods market 24, 74, 91-3, 118 Gordon, R. J. 182 government expenditure 39-41 Gowland, D. 203 Gregory, M. 189 Grey, M. R. 127 Grice, J. 62 Griliches, Z. 91 Gross Domestic Product (GDP) IS,
50-1
Hacche, G. 98 Hagger, A. J. III Hartley, N. 166 Hendry, D. F. 97 Henry, S. G. B. 66, 111 H.M. Treasury 3, 23, 50-2 high-powered money 188 Hilton, K. 91 Hines, A. G. 31 hire-purchase credit 5-6, 58-62 Holden, K. 140-1 holding period of a bond 94-6,
150 Holmes, P. M. 185 Huang, D. S. 203
import controls/quotas/tariffs 14, 86-8, 159-61
import price equation 36, 76 import prices 31-7, 45, 48-9, 70-1,
75-9, 85-6 import volume equation 26 imported inflation 131 imports 26,39-47, 75-9 income elasticity of the demand for
money 98, 170-1 income-expenditure model 53 incomes policy 5, 13, 47-9, 65-70,
158-60 independent variable 169
Macroeconomic Policy
inflation 40-1, 135-6 anticipated/expected 111-17,
121-2 imported 131 in the U.K. 15-19 international transmission of 5,
135-6 unexpected/unanticipated 111-14,
121-2, 152, 157 world rate of 130-2, 135-6
inflation and unemployment, See Phillips curve
interest elasticity of the demand for advances 108
interest elasticity of the demand for money 97-8, 118, 119-21, 133; 191
interest elasticity of investment 25, 93, 118-20, 163
interest rate 92, 95-111, 187-8 intermediate policy target 82 internal rate of return 92-8 International Monetary Fund
(I.M.F.) 162 international price arbitrage, see
arbitrage investment (expenditure) 25, 57, 92 investment grants/allowances 83 IS curve 118, 120, 147, 189, 192 Isard, P. 189
J-curve 43 Johnson, H. G. 7 Johnston, J. 31 Jones, R. A. 201 Jonson, P. D. 139 Jorgenson, D. W. 92
Kahn, R. 3, 184 Kennedy, M. C. 50-1,83 Keynes, J. M. 1, 155 Koutsoyiannis, A. 199 Krause, L. B. 199 Kravis, I. B. 189 Krugman, P. 184 Kuhn, T. S. 149
labour market 111-17, 122 labour supply 28,87,111-17,158 Laidler, D. E. W. 7, 98, 116, 139,
142, 182 Laury, J. S. E. 181, 182 law of one price 130 Leijonhufvud, A. 154 lender-of-Iast-resort 106

Index
Lewis, G. 181 Lewis, M. K. 98 life-cycle hypothesis 91 linear function/equation 122, 169-70 Lipsey, R. E. 189 Lipsey, R. G. 112, 116 liquid assets 91, 153 Little, I. M. D. 182 LM curve 119-20,147,189,192 local authority bonds 56 logarithms, rules of 170-2 log-linear function/equation 122,
170-2 Lomax, R. 188 London Graduate School of Business/
London Business School 3 Lucas, R. 197
Ml 191 M3. see sterling M3 Maddala, G. S. 197 Maki, D. 143 marginal productivitY'theory 112, 142 marginal propensity to consume 24,
64 marginal propensity to spend 14,
58-64 market optimists/pessimists 149 mark-up 31, 151 Marshall-Lerner condition 185 Matthews, K. G. p, 123-4 mean absolute error 50-2, 178, 180 mean bias 50-2, 178, 180 Meltzer, A. H. 201 Miller, G. W. 193 minimum lending rate 188 Mizon, G. E. 97 Modigliani, F. 91,190 money at call 99-100 money supply 5-12, 25, 99-111,
119-25, 127-8, 131-2, 136, 154, 162-5
money-supply multiplier 119,121-5 Moore, B. 196 Morris, D. 181 Mortensen, D. T. 111 Mowl, C. 188 multiplier
money supply 119-25 national income/output 24-7, 41,
43-4, 74, 83
'narrow' money 97-8 National Institute of Economic and
Social Research 3, 23-52, 144
207
natural rate of unemployment 10, 143-4,149,157,192
Neild, R. R. 187 net acquisition of financial assets
and private expenditure 54-64, 79-87, 186
equation 58-64 net worth. see wealth new microeconomics 111 'New School' 184 Nobay, A. R. 124 non-bank private sector (N.B.P.S.)
95-111 non-marketable debt 101 non-Monetarist 149 non-price factors and foreign trade 73 non-tradeables 136-9
and excess demand 138-9, 146 price determination 137-9
Nordhaus, W. D. 70,111-12,115-16 Nordic model of inflation 137-8,
145-6 normal cost hypothesis 70 normal earnings 70 Norton, W. E. 108
Odhner, G. E. 196 Odling-Smee,l. 166 Okun, A. M. 140 'Old School' 184 open economy 7,90 open-market operations 101, 109-10 ordinary least squares (O.L.S.) 174-6 Organisation for Economic Co-
operation and Development (O.E.C.D.) 116
Ormerod, P. 66, 123-4, 181 output-capacity ratio 190 overseas sector 54-7
definition of 54
'par' tax rate 15, 86-8 par value of a bond 94 Parkin, 1. M. 7,70,98,116,127,136,
141-3, 182 participation rate 111 Pearce, I. F. 185 Peel, D. A. 140-1 penal interest rate 106 permanent income hypothesis 92, 96,
187 personal sector 54-7 Peston, M. H. 167 Phelps, E. S. 111

208
Phillips, A. W. 117 Phillips curve 4, 111-17, 139, 153-4,
159 expectations-augmented 10. 114.
117, 13~ 15~ 18~ 192 simple 4 stability of 115-17, 139, 142-6,
159 world 145
policy instruments 1,15,21,39,156, POlicy mix 20,84, 156 PolICy rules see rules versus discre-
tion policy'targets 1, 15,21,39, 156 Poole, W. 192 population parameter/coefficient
174-6 Posner, M. 3, 183, 184 post-Keynesian 2, 148 Prest, A. R. 181 Price, L. D. 98 pric~ arbitrage 130, 134
equation 130 price elasticity
and revenue 185 of exports 37-8, 4f-3, 45, 72 of imports 36, 38, 142-3, 45, 72
price equation 31,· 33, 34, 70-1, 115-16, 130, 1~2, 136--9, 151
cost mark-up 31--41, 70-1 price expectations '\ 30, 114-17,
139-42, 144-6'1 152, 155, 157, 172-3
See also expectations private expenditure 57-64
function 57-64, 186 private sector 54-64
definition of 54 production function 112 productivity 69, 137-8, 161, 171-2
tradeables and non-tradeables 137-8,150
profit margin 70, 187 exporters' 77
profits 2&-9 public sector, definition of 54-5 Public Sector Borrowing Requirement
(P.S.B.R.), see budget deficit purchasing-power parity 130, 164,
189 Purdy, D. 31
R2 176--7 random error 174
Macroeconomic Policy
rational expectations 139-42, 146, 14&-9, 153, 163-4
hypothesis 139-40, 153 Monetarist 2, 14&-9
real cost of borrowing 152 real money balances 96 real rate of return 152 real wage 34,65-70,111-14
desired 65-70, 153 gap 65-70 resistance 65-70, 153
rediscount rate 106, 11 0 reduced-form equation
balance of payments 81 budget surplus 80 foreign-exchange reserves 132 output 26, 74, 80, 93, 119, 121,
147 prices 71, 163
relative prices of exports and imports 26, 72-3, 126, 172
Renton, G. A. 132 reserve assets of commercial
banks 99-111 reserve ratio 99-111 residual trends in exports and
imports 72-3, 158, 161 retained earnings of companies 57 retentions ratio 65-72 reverse causality 125, 128, 154 Rhodes, J. 196 Richards, I. 127, 136 risk-averter 95, 167 riskiness of bonds 95 Rose, D. E. 196 Rosendale, P. R. 185 Rowan, D. C. 88 rules versus discretion 6, 14, 165
Salant, W. S. 199 sample data 174 Sargent, T. J. 140 Savage, D. 93 savings 57 savings ratio 59, 186 Sawyer, M. C. 198 Scott, M. FG. 182 search costs 140 search theories of employment and
inflation 111, 117 Sheppard, D. K. 107,190 Sheriff, T. D. 116--17,144 simulation 39 Smith, D. 187
Index
Smith, G. W. 70 Smith, R. P. 182 Smyth, D. J. 50-1,83 socio-political factors 31 Solow, R. M. xi Special Deposits 100-3, 105, 109 Spindler, Z. A. 143 Srba, F. 195 stability 85-6, 150, 155
of coefficients 179 stagflation 1 Stamler, H. 62 standard error 176-7 statistical tests of models 174-80 sterilisation policy 105, 128, 161 sterling M3 95, 98 stocks and stockbuilding 58-64 structural break, see stability structural
relationship/equation 151-5 structure of the book 19-22 stylised facts 17-20, 150 substitution 92,109,123, 147-8, 163 Sumner, M. T. 116, 142-4 Supplementary Special Deposits 188 supply constraints 152, 157 supply of labour 111 Surrey, M. J. C. 116, 181 symbols used in text 22
t statistic 176 tariff, see import tariffs Tarling, R. J. 70, 123-4 taxes 15, 25, 40, 45, 65, 69, 71, 74,
79-89,91-3,118,156,159 test statistics 174-80 Thirlwall, A. P. 183 till money 100 Timbrell, M. 31 Tobin, J. 95 trade-off 4, 86, 115
inflation-unemployment, see Phillips curve
trade-union power/pushfulness 5,23, 30-5, 44, 153-4, 157, 159
tradeable goods 11, 130-1, 136-9 transactions theory of the demand for
money 96 Treasury, see H.M. Treasury Treasury Bills 56 Turnovsky, S. J. 203
unanticipated inflation, see inflation uncertainty and inflation 60 unconditional forecast 177
unemployment 28 benefit 143-4 frictional 112-17 inflation and, see Phillip-s curve natural rate of 112 voluntary 143
unit labour costs 70
variance 176
209
velocity of circulation of money 121, 189
wage arbitrage 137 costs per unit of output, defined
171-80 determination of 29-30, 65-70 drift 66 earnings 44-5 equation 30 gross money 65 money 29-35 real 28, 34-5, 65-70, 159-60 settlements 65-70 See also Phillips curve
wage inflation 40, 64-70 See a/so trade-union power/pushful-
ness wage-price feedback/spiral 34-5,70-1 Wallace, N. 140 Warburton, M. 128, 138, 141 Ward, R. G. 116-17 wealth effects on spending/consump
tion 91,118,120,147,153,163, 187
White, W. R. 108 Wilkinson, S. F. 70, 123-4 Williams, D. 125 work-leisure choice 144 world demand for money 127 world money supply 127-8, 136 world prices 19,126-7,172 world rate of inflation 126-8, 130-2,
136-9, 142, 144-6 world trade 21,26,48-9,72-3,86
elasticity of exports 49, 72-3, 185 Worswick, G. D. N. 50-1
Yeo, S. 195 yield on a bond 93-4, 187-8
Zellner, A. 91 Zis, G. 31,127,136