Embed Size (px)
Citation preview

Hybrid Statistical and Mechanistic Mathematical
Model Guides Mobile Health Intervention
for Chronic Pain
SARA M. CLIFTON,1 CHAERYON KANG,2 JINGYI JESSICA LI,3
QI LONG,4 NIRMISH SHAH,5 and DANIEL M. ABRAMS1
ABSTRACT
Nearly a quarter of visits to the emergency department are for conditions that could havebeen managed via outpatient treatment; improvements that allow patients to quicklyrecognize and receive appropriate treatment are crucial. The growing popularity ofmobile technology creates new opportunities for real-time adaptive medical intervention,and the simultaneous growth of ‘‘big data’’ sources allows for preparation of personal-ized recommendations. Here we focus on the reduction of chronic suffering in the sicklecell disease (SCD) community. SCD is a chronic blood disorder in which pain is the mostfrequent complication. There currently is no standard algorithm or analytical methodfor real-time adaptive treatment recommendations for pain. Furthermore, current state-of-the-art methods have difficulty in handling continuous-time decision optimizationusing big data. Facing these challenges, in this study, we aim to develop new mathe-matical tools for incorporating mobile technology into personalized treatment plans forpain. We present a new hybrid model for the dynamics of subjective pain that consists ofa dynamical systems approach using differential equations to predict future pain levels,as well as a statistical approach tying system parameters to patient data (both personalcharacteristics and medication response history). Pilot testing of our approach suggeststhat it has significant potential to well predict pain dynamics, given patients reportedpain levels and medication usages. With more abundant data, our hybrid approachshould allow physicians to make personalized, data-driven recommendations for treatingchronic pain.
Keywords: dynamical systems, mechanistic model, pain, sickle cell disease, statistical model.
1Department of Engineering Sciences and Applied Mathematics, McCormick School of Engineering and AppliedScience, Northwestern University, Evanston, Illinois.
2Department of Biostatistics, Graduate School of Public Health, University of Pittsburgh, Pittsburgh, Pennsylvania.3Department of Statistics, University of California, Los Angeles, Los Angeles, California.4Department of Biostatistics and Epidemiology, Perelman School of Medicine, University of Pennsylvania, Phila-
delphia, Pennsylvania5Department of Medicine, Duke University, Durham, North Carolina.
JOURNAL OF COMPUTATIONAL BIOLOGY
Volume 24, Number 7, 2017
# Mary Ann Liebert, Inc.
Pp. 675–688
DOI: 10.1089/cmb.2017.0059
675
Dow
nloa
ded
by N
orth
wes
tern
Uni
vers
ity f
rom
onl
ine.
liebe
rtpu
b.co
m a
t 06/
30/1
7. F
or p
erso
nal u
se o
nly.
1. INTRODUCTION
In the fields of physics, chemistry, and engineering, models are often derived from mechanistic
fundamental laws expressed in the form of differential equations. Resulting ‘‘dynamical systems’’ models can
be used both to gain intuition into the expected behavior of the system and to make specific predictions about
results of experiments (e.g., see Strogatz, 2014). In fields such as social sciences, bioinformatics, and medicine,
models are often constructed from data via statistical inference, without direct derivation from fundamental
principles (e.g., see Freedman, 2009). The mechanistic and statistical approaches to mathematical modeling have
different advantages. The former allows prior knowledge to be introduced and validated or rejected based on the
success of the model. The latter requires almost no a priori information about how the system is expected to behave.
In this article, we present a hybrid approach to mathematical modeling that incorporates both mecha-
nistic and statistical elements, with the goal of gaining a deeper understanding of the human experience of
subjective pain. Specifically, we hope to predict how patient-reported pain levels vary over time based on
medication dosage information and other patient characteristics.
1.1. Application to pain
Sickle cell disease (SCD) is a chronic illness associated with frequent medical complications and
hospitalizations. Approximately 90% of acute care visits are for pain events, and 30-day hospital re-
utilization rates are alarmingly high (Platt et al., 1991). While factors influencing these high reutilization
rates are poorly understood, close follow-up and continued use of pain medications have been shown to
decrease rehospitalization rates. Mobile technology has become an integral part of healthcare management,
and our recently self-developed mobile application (Sickle cell Mobile Application to Record symptoms
via Technology, or SMART app—see Fig. 1) for SCD assists with documentation and intervention of pain.
Pain in particular is difficult to quantify and has never before been monitored at the temporal scale we
report here across so many patients. It is known that subjective pain, although indeed subjective, is correlated
with objective measurable stimulus qualities in experiments (see, e.g., Stevens et al., 1958; Hughes et al.,
2002; Granovsky et al., 2008). Thus, there is reason to believe that subjective pain may follow understandable
dynamics in time, especially when mitigated by opioid or nonopioid drugs. Our approach to the problem is
motivated by the hope that a reasonable model for pain dynamics will yield some level of predictive power,
despite the clear expectation that there will also be significant noise within and across patients. We can
attribute the stochastic variation to sources such as patient mood, temporal changes in patient state, and
weather. In contrast, we hope that patient attributes such as age, gender, and SCD type will remain roughly
constant on the time scale of the experiment and allow us to explore possible correlation of these attributes
with model parameters.
FIG. 1. Smartphone app. Sample images of SMART app for iPhone/Android smartphone devices.
676 CLIFTON ET AL.
Dow
nloa
ded
by N
orth
wes
tern
Uni
vers
ity f
rom
onl
ine.
liebe
rtpu
b.co
m a
t 06/
30/1
7. F
or p
erso
nal u
se o
nly.

1.2. Data source: mobile health app
We seek to understand the temporal dynamics of chronic pain as experienced by SCD patients. To that
end, we have developed a mobile phone app that allows patients to record medication usage and subjective
pain levels (measured on a 0–10 scale) in real time (Shah et al., 2014; Jonassaint et al., 2015).
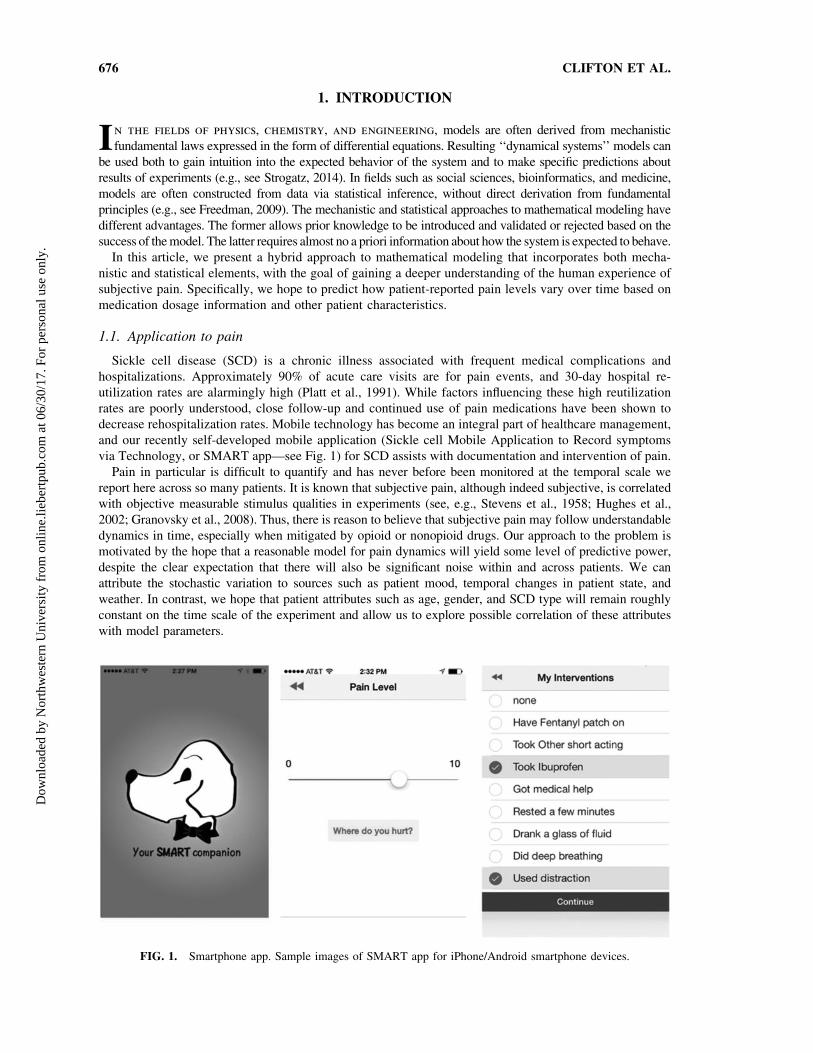
Figure 1 shows several images of the app interface, while Figure 2 shows a typical data set resulting from
a single patient’s use of the app over the course of several weeks.
2. METHODS
2.1. Data
As of October 2016, data were available from 47 patients using the SMART app. Data sets from eight of
those patients were excluded because of excessive sparsity based on the following criteria: (1) total number
of reports � 5 or (2) pain reports never exceeded zero during the period under consideration. See Table 1
for demographic details of included patients. We denote the sample size n = 39.
2.2. Predictive model
To develop a hybrid model that incorporates both a mechanistic a priori knowledge-driven component
and a statistical data-driven component, we divide tasks into two disjoint sets that fit these two categories
(see Section 4 for more context). We begin with a ‘‘dynamical systems’’ model for subjective pain
Pai
n le
vel (
0 to
10)
0
1
2
3
4
5
6
7
8
9
10
0 50 100 150 200 250 300 3500
0.5
1
1.5
Time (hours)Std
. dru
g do
ses
in b
lood
stre
am
FIG. 2. Sample pain and medication data from a single patient. Upper panel: patient-reported pain (circles) and model
fit (thick solid line); shading indicates model fit – one standard deviation. Lower panel: long-acting methadone (solid
line) and short-acting oxycodone (dashed line) medication concentrations in patient bloodstream as inferred from
medication usage reported via the SMART application.
MANAGING PAIN VIA MHEALTH AND HYBRID MODELING 677
Dow
nloa
ded
by N
orth
wes
tern
Uni
vers
ity f
rom
onl
ine.
liebe
rtpu
b.co
m a
t 06/
30/1
7. F
or p
erso
nal u
se o
nly.

motivated by the hypothesis that human sensory systems function on a roughly ‘‘return to set point’’ basis
(McRuer and Krendel, 1974; Fors et al., 1988; Britton et al., 1995; Stepan, 2009). Any model of human
pain response, however, will inevitably require specification of a variety of parameters determining the
time scale(s) and degree of severity of the response. The statistical modeling tasks use patient data to infer
parameters (1) from patient characteristics and population distributions and (2) from patient-specific pain
and medication response history.
To make this more concrete, in Figure 3 we present a flow chart summarizing our approach to the hybrid
modeling problem. Steps I2 and A comprise the statistical modeling component; steps B and C comprise the
mechanistic modeling component. A further optimization step D builds on the predictions of the hybrid
model to allow for a balance between competing demands of pain reduction and medication usage mini-
mization. This article details steps I1, I2, A, and B. We leave the remaining steps for future work.
2.2.1. Mechanistic component (for every patient). We propose and evaluate two related mecha-
nistic models based on a set of coupled ordinary differential equations (ODEs), either (1) deterministic or
(2) stochastic. The stochastic differential equation model comprises a Langevin equation, which can be
Table 1. Patient Demographic Information and the Number of Pain Reports
Supplied by Patients Across the Entire Study
Demographic characteristics
Institution, N (%)
A 14 (35.9)
B 17 (43.6)
C 8 (20.5)
Gender, N (%)
Male 16 (41.0)
Female 23 (59.0)
Age at baseline (years), N (%)
18–34 24 (61.5)
> 34 15 (38.5)
SCD type, N (%)
Hemoglobin SC 8 (20.5)
Hemoglobin SS 22 (56.4)
Hemoglobin SB + (Beta) Thalassemia 5 (12.8)
Beta-Zero Thalassemia 3 (7.7)
SOArab 1 (2.6)
Hydroxyurea user, N (%) 27 (69.2)
Folic acid vitamin user, N (%) 26 (66.7)
Long-acting opioid user, N (%) 29 (74.4)
Short-acting opioid user, N (%) 35 (89.7)
Nonopioid user, N (%) 29 (74.4)
Mean SD (Min, Max)
Number of pain reports 67.2 60.4 (9.0, 257.0)
Days of pain reports 164.6 109.6 (10.3, 435.1)
Within-patient average VAS score 4.7 2.1 (0.3, 9.4)
Mean SD (Min, Max)
Number of pain reports (first 2 weeks) 13.2 9.6 (2.0, 45.0)
Number of long-acting opioid doses (first 2 weeks) 6.0 8.4 (0.0, 35.0)
Number of short-acting opioid doses (first 2 weeks) 7.2 7.5 (0.0, 35.0)
Number of nonopioid doses (first 2 weeks) 2.1 3.1 (0.0, 12.0)
SCD, sickle cell disease; VAS, visual analog scale.
678 CLIFTON ET AL.
Dow
nloa
ded
by N
orth
wes
tern
Uni
vers
ity f
rom
onl
ine.
liebe
rtpu
b.co
m a
t 06/
30/1
7. F
or p
erso
nal u
se o
nly.

converted into a Fokker–Planck partial differential equation for the evolution of the probability distribution
for pain q(P‚ t) (Gardiner et al., 1985). This allows for prediction of both the expected pain level for a patient
at any point in the future and an assessment of the confidence in (and a confidence interval for) that prediction.
Mathematically, the deterministic mechanistic model we propose is the following, for a single patient:
dP
dt= - (k0 + k1D1 + k2D2 + k3D3)P + k0u
dD1
dt= - kD1
D1 +PN1
j = 1
d(t - s1‚ j)
dD2
dt= - kD2
D2 +PN2
j = 1
d(t - s2‚ j)
dD3
dt= - kD3
D3 +PN3
j = 1
d(t - s3‚ j)‚
(1)
where P is the patient pain level (on a scale of 1–10), k0 is the pain relaxation rate without drugs, ki is the
marginal effect on the pain relaxation rate due to drug i (i = 1‚ 2‚ 3), u is the unmitigated pain level (i.e.,
without drug intervention), Di is the amount of standard drug i doses within the patient, kDiis the
elimination rate of drug i within the patient, fsi‚ jgNi
j = 1 are the drug i dosage times, and Ni is the number of
doses of drug i taken. d represents the Dirac delta function. Note that the parameters and variables will in
general need to be indexed with distinct values for each patient in a population, although we omit those
indices here for clarity. For convenience and clarity, we also here omit ‘‘hatted’’ notation (e.g., P̂(t))
sometimes used for model predictions. Tables 2 and 3 summarize the meanings of model variables and
parameters, respectively.
In this very simple model for pain dynamics (1), pain is expected to relax at rate k0 to unmitigated level
u set by aggravating factors (such as SCD) in the absence of intervention through opioids (drugs 1 and 2)
or nonopioids (drug 3). When drugs are present in the patient’s body, pain drops at a faster rate and the
short-term equilibrium pain level (not the unmitigated pain level u) is reduced. Note that we treat all
parameters as constant over the time period of interest, which we take to be 2 weeks (based on clinical
heuristic experience).
In the model for drug concentrations, medication in the body is assumed to be metabolized at a constant
rate. Rates can be determined from existing substantiated pharmacokinetic models (e.g., Poulin and Theil,
FIG. 3. Schematic flowchart showing model framework. Rounded rectangles represent modeling or computation
steps, rhombuses represent data inputs or outputs, and diamond represents decision step. Items I1 and I2 are only
necessary for initialization of the model. Items A and B are the focus of this article.
MANAGING PAIN VIA MHEALTH AND HYBRID MODELING 679
Dow
nloa
ded
by N
orth
wes
tern
Uni
vers
ity f
rom
onl
ine.
liebe
rtpu
b.co
m a
t 06/
30/1
7. F
or p
erso
nal u
se o
nly.

2002; Yang et al., 2006); Dirac delta function onset of medication serum concentration is a good ap-
proximation to the fast rise typical of the medications under consideration. See Figure 2 for a sample
deterministic model output.
Note that we deliberately chose to use an extremely simple conceptual model for pain dynamics. More
sophisticated versions might be developed to incorporate higher order dynamics for P, or to include
nonlinear or nonautonomous effects (e.g., allowing for explicit parameter variation with time of day or
year), but currently available data are insufficient to constrain a model of greater complexity.
The stochastic differential (Langevin) equation version of our mechanistic model is as follows:
dP = - (k0 + k1D1 + k2D1)Pdt + k0u(dt + edW)
dD1 = - kD1D1 +PN1
j = 1
d(t - s1‚ j)
!dt
dD2 = - kD2D2 +PN2
j = 1
d(t - s2‚ j)
!dt
dD3 = - kD3D3 +PN3
j = 1
d(t - s3‚ j)
!dt ‚
(2)
where a hypothesis of uncorrelated additive white noise has been made. From this we derive the Fokker–
Planck equation for the probability distribution of pain over time q(P‚ t):
@q@t
= -@
@P( - (k0 + k1D1 + k2D2 + k3D3)P + k0u)q(P‚ t)½ � + @2
@P2
1
2(ek0u)2q(P‚ t)
� �: (3)
Absent any pain medication, this Fokker–Planck equation implies the steady-state pain distribution
q�(P) =ffiffiffiffiffiffiffiffiffiffiffiffiffiffiffi
1
pk0u2e2
rexp -
(P - u)2
k0u2e2
� �‚ (4)
a Gaussian distribution with mean u and standard deviation ueffiffiffiffiffiffiffiffiffik0=2
p. See Figure 4 for a sample stochastic
model output.
Table 3. Parameters in Mechanistic Models
Parameter Meaning Units
u Unmitigated pain level Pain
k0 Rate of decrease of pain in the absence of drugs or disease/sources of pain T - 1
k1 Effect of drug 1 (long-acting opioid) on pain relaxation rate T - 1
k2 Effect of drug 2 (short-acting opioid) on pain relaxation rate T - 1
k3 Effect of drug 3 (nonopioid) on pain relaxation rate T - 1
kD1Rate of decay of drug 1 (long-acting opioid) in body due to metabolism T - 1
kD2Rate of decay of drug 2 (short-acting opioid) in body due to metabolism T - 1
kD3Rate of decay of drug 3 (nonopioid) in body due to metabolism T - 1
e Amplitude of intrinsic noise (variability) in human subjective pain reports T1/2
Ni Number of standard drug i doses taken Count
fsi‚ jg Drug i dose times (indexed by j) T
Table 2. Variables in Mechanistic Models
Variable Meaning Units
P(t) Instantaneous pain level on 0–10 scale Pain
D1(t) Concentration of drug 1 (long-acting opioid) in the body Standard doses
D2(t) Concentration of drug 2 (short-acting opioid) in the body Standard doses
D3(t) Concentration of drug 3 (nonopioid) in the body Standard doses
q(P‚ t) Instantaneous probability distribution of pain level P Probability
680 CLIFTON ET AL.
Dow
nloa
ded
by N
orth
wes
tern
Uni
vers
ity f
rom
onl
ine.
liebe
rtpu
b.co
m a
t 06/
30/1
7. F
or p
erso
nal u
se o
nly.

2.2.2. Statistical component (for all patients). To account for the variation among patients and
improve prediction of the unmitigated pain level, we associate patient characteristics and history with the
unmitigated pain level u (an n-dimensional vector with uj corresponding to the j-th patient’s unmitigated
pain level) using a linear model. Let X be an n · p design matrix containing the covariates of patients (i.e.,
patient characteristics). We write X = (X1‚ . . . ‚ Xn)T , with Xj corresponding to the p-dimensional covariates
of patient j. Then, we formulate the relationship between u and the p predictors as follows:
u = Xb + �‚ (5)
where b is a p-dimensional coefficient vector, and � is an n-dimensional vector of zero-mean random
errors. When p is small, the estimate for b is obtained using the ordinary least squares procedure:
b̂ = arg minb2Rp
ku - Xbk22, where k�kq denotes the ‘q norm. Then, the unmitigated pain level uj is updated by
unewj = XT
j b̂, j = 1‚ . . . ‚ n.
Since the unmitigated pain levels are not observable from patient pain reports, the initial uj’s are
independently sampled from a uniform distribution between 0 and 10, that is, u0j *U(0‚ 10). After using
fu0j g as initial values to fit the mechanistic model, the resulting estimated fujg will be updated by the linear
model (5) as funewj g, which will then be used as initial values in the next round of fitting of the mechanistic
model. See Section 2.3 for more details on the hybridization of the statistical component with the mech-
anistic component.
Given a high-dimensional set of patient characteristics, we need to select a subset of patient charac-
teristics that are significantly associated with u by minimizing the penalized loss function. In this study,
we select patient characteristics using the Least Absolute Shrinkage and Selection Operator (LASSO)
(Tibshirani, 1996), by minimizing the penalized loss function G(b) = ku - Xbk22 + k kbk1 with respect to b.
The penalty parameter k is determined using a fivefold cross-validation. The selected p features are then
used to fit the linear model (5) by ordinary least squares.
If time-varying unmitigated pain levels and time-varying covariates are present, the regression model
(5) can be extended to the linear mixed model (Diggle, 2002; Fitzmaurice et al., 2012): u = Xb + Zd + �‚ where
Z = (Z1‚ . . . ‚ Zn)T is an n · r design matrix for r random effect factors and d = (d1‚ . . . ‚ dr)T is a vector of
random effects. Patient characteristics can be selected by maximizing the penalized log likelihood:
‘pen (b‚ d) = ‘(b‚ d) - k kbk1 (Groll and Tutz, 2014) where ‘ is the log likelihood function. Such an extension
of the proposed hybrid model to allow for time-varying unmitigated pain levels and covariates will be
considered in a future study with more data available.
0 250
2
4
Time
Pai
n an
d dr
ug le
vel
FIG. 4. Sample output from stochastic differential equation model (2). Middle smooth line: theoretical mean pain; upper
and lower smooth lines: –one theoretical standard deviation; middle noisy black line: mean of pain distribution in ensemble
of 100 stochastic simulations; upper and lower noisy gray lines: –one standard deviation in ensemble of 100 stochastic
simulations; bottom dashed line: drug 1 dose in bloodstream. Spikes occur when patient takes recommended dosage.
MANAGING PAIN VIA MHEALTH AND HYBRID MODELING 681
Dow
nloa
ded
by N
orth
wes
tern
Uni
vers
ity f
rom
onl
ine.
liebe
rtpu
b.co
m a
t 06/
30/1
7. F
or p
erso
nal u
se o
nly.

2.3. Model fitting
We fit our model to real patient data by minimizing the residual sum of squares between model
predictions and patient reports provided within the first two weeks of reporting. We expect that the
assumption of constant model parameters breaks down after *2 weeks (clinical heuristics). Minimization
over parameters u, k1, k2, and k3 was done via the Nelder–Mead simplex algorithm (Nelder and Mead,
1965). Parameter k0 was fixed at 2 ln (2) � 1:4 corresponding to a pain equilibration half-life time scale of
30 minutes in the absence of medication. If a patient did not take all three classes of drugs, the model and
fitting only included the consumed drugs.
We initialize the parameter optimization in n mechanistic models (one per patient) with random values
during a first iteration, and then, we feed the optimization output into the statistical model (for all patients).
Once the statistical model is run, it results in a new set of parameter estimates that can then be used as
initial parameter seeds for a second round of optimization in n mechanistic models (to minimize the
residual sum of squares). Proceeding iteratively in this manner (Fig. 3), we find convergence to a consistent
set of parameters for each patient (details below).
2.4. Method verification
Before applying our hybrid model to real-world patient data, we verify the soundness of the ap-
proach with synthetic data constructed to resemble real-world data, but generated by the model itself
with high sampling frequency. The synthetic data used for verification of the method are generated
directly from the mechanistic model with an assumed parameter set generated in the following way:
unmitigated pain u = (patient age)=10, initial pain level P(t = 0) = u - 2, and drug parameters
k1‚ k2‚ k3*N(0:75‚ 0:25). Each patient reports pain every 1/2 hour for 336 hours (2 weeks). At each
report time, the probability of the patient taking a particular drug (among three drug classes) is 1/16;
in other words, the patients took each drug on average every 8 hours. White noise of magnitude 1 is
added to each pain report.
As an illustration using real patient drug times (specifically those of Patient A3), we create synthetic data
generated using u = 5, k1 = 3, and k2 = 2 (Fig. 5). When the initial parameter search is seeded with random
parameter values, the mechanistic model fit can lead to convergence to either the ‘‘true’’ optimum (5‚ 3‚ 2)
or to other ‘‘spurious’’ optima with incorrect values of u, k1, and k2. In this illustrative example, the method
pain
leve
l (0
to 1
0)
0
5
10
0 3500
1
Time (hours)
dose
s in
blo
od
FIG. 5. Model fitting demonstration for densely reported noisy synthetic data. Upper panel: hypothetical densely
reported patient pain (circles) and model fit (solid line); shading indicates model fit – one standard deviation. Lower
panel: long-acting opioid (solid line) and short-acting opioid (dashed line) medication concentration in patient
bloodstream.
682 CLIFTON ET AL.
Dow
nloa
ded
by N
orth
wes
tern
Uni
vers
ity f
rom
onl
ine.
liebe
rtpu
b.co
m a
t 06/
30/1
7. F
or p
erso
nal u
se o
nly.

converges to u = 5:0111, k1 = 3:1878, and k2 = 1:8435. The relevant root-mean-square (RMS) error is
1.0133; this is close to the lowest possible expected error, given the unit magnitude noise added to the
synthetic data. This numerical experiment shows that the mechanistic model fitting method can converge
even in the presence of significant amounts of noise. However, with only the mechanistic model it can be
quite difficult to find a good set of initial parameter seeds*: that is one motivation for introducing the
statistical model.
To test our hybrid method using both the mechanistic model for fitting and the statistical model for
parameter estimation, we create a synthetic patient database of 39 patients as described above. We then
iterate rounds of fitting between mechanistic and statistical models, starting with uniform random guesses
for all patient parameters (u‚ k1‚ k2‚ k3). Figure 6 demonstrates how the parameter u converges to a value
with small error after just a few iteration steps, even in the presence of significant noise. To evaluate the
performance of the model on new data, we use the hold-out validation method by splitting the data set into
a training set (first week) and a test set (second week). Model fit error and hold-out validation error, as well
as other parameter values, converge similarly (Fig. 7).
3. RESULTS
3.1. General results
One key result is that our model for chronic pain does indeed have some predictive value (Fig. 8). This is
an improvement over the current state-of-the-art, since no other predictive model exists of which we are
aware. Furthermore, fitted parameter values correlate significantly with patient characteristics, suggesting
that meaningful information is captured by this minimal plausible model. It may be possible to motivate
new clinical insight on the basis of the observed correlations, perhaps leading to differential treatment of
SCD sufferers with differing characteristics.
3.2. Statistical results
We use the following baseline patient characteristics to predict the unmitigated pain levels in the
statistical modeling step: age, gender, SCD type, hydroxyurea use, folic acid vitamin use, long-acting
opioid use, short-acting opioid use, and nonopioid use. We explore the marginal effects of these charac-
teristics and their possible pairwise two-way interactions using the LASSO. The model (5) can be extended
to include time-varying covariates such as temperature, weather, patient’s walking/social activities, and
patient’s mood at time t, once these data become available in a future study.
The statistical model that resulted from the LASSO variable selection is given by
0 1 2 3 4 50
0.5
1
iteration
mea
n pa
ram
eter
est
imat
ion
erro
rFIG. 6. Hybrid model fitting demonstration for en-
semble of densely reported noisy synthetic data. For an
ensemble of 39 synthetic patient data sets, the average
absolute error in u gradually decreases. Iteration 0 in-
dicates one fit to the mechanistic model alone. Sub-
sequent iterations indicate the number of hybrid model
(statistical+mechanistic) fits.
* The seeding problem becomes exponentially harder as the dimension of the parameter space increases.
MANAGING PAIN VIA MHEALTH AND HYBRID MODELING 683
Dow
nloa
ded
by N
orth
wes
tern
Uni
vers
ity f
rom
onl
ine.
liebe
rtpu
b.co
m a
t 06/
30/1
7. F
or p
erso
nal u
se o
nly.

u = b0 + b11fSCD disease type = HgbSCg + b21fSC Ddisease type = SB + Thal or SOArabg+ b3(age - 18) + b41fHydroxyurea userg + b51fNon - opioid userg+ b61fSCD disease type = SB + Thal or SOArabg · (age - 18) + �‚
(6)
where �j*N(0‚ r2), j = 1‚ . . . ‚ n, and 1f�g is the indicator function.
Table 4 summarizes the results from one round of fitting of the regression model (6). Adjusting for the
effect of other terms in the regression model, SCD type of SB + Thal or SOArab (with coefficient b2),
nonopioid use (with coefficient b5), and the interaction term between SCD type of SB + Thal or SOArab and
age (with coefficient b6) are important predictors of the unmitigated pain levels at the significant level of
0.05. Using nonopioid medication is associated with decreased unmitigated pain levels. Unmitigated pain
levels increase with patients’ age for SB + Thal or SOArab patients.
4. DISCUSSION AND LIMITATIONS
4.1. Reflection on hybrid modeling
Statistical models and mechanistic models have both been successfully applied to various aspects of
human behavior. The inference of ‘‘black box’’ statistical models from empirical data has the advantage
that it obviates the need for a priori knowledge of system dynamics. However, mechanistic models
(sometimes referred to as ‘‘white box’’ or ‘‘clear box’’) can easily incorporate such knowledge when
available.
Perhaps because of the often distinct educational background of practitioners or distinct typical appli-
cations, statistical and mechanistic approaches are not frequently combined in addressing a single problem.
0 1 2 3 4 51.00
1.02
iteration
fit e
rror
0 1 2 3 4 51.08
1.13
iteration
hold
−ou
t val
idat
ion
erro
r
FIG. 7. Hybrid model fitting demonstration for en-
semble of densely reported noisy synthetic data. For an
ensemble of 39 synthetic patient data sets, the average
RMS error in patient pain levels gradually decreases.
Iteration 0 indicates one fit to the mechanistic model
alone. Subsequent iterations indicate the number of
hybrid model (statistical+mechanistic) fits. Training
error (or fit error) is on the left; test error (or validation
error) is on the right. Due to the additive white noise of
magnitude 1, the smallest testing or training error we
could expect is 1. RMS, root-mean-square.
0 1 2 3 4 51.3
1.8
iteration
fit e
rror
0 1 2 3 4 52.0
2.4
iteration
hold
−ou
t val
idat
ion
erro
r
FIG. 8. Hybrid model fitting on real patient data. For
an ensemble of 39 real patient data sets, the average
RMS error in patient pain levels gradually decreases.
Iteration 0 indicates one fit to the mechanistic model
alone. Subsequent iterations indicate the number of
hybrid model (statistical+mechanistic) fits. Training
error (or fit error) is on the left; test error (or validation
error) is on the right.
684 CLIFTON ET AL.
Dow
nloa
ded
by N
orth
wes
tern
Uni
vers
ity f
rom
onl
ine.
liebe
rtpu
b.co
m a
t 06/
30/1
7. F
or p
erso
nal u
se o
nly.

Compared with our work, the most similar hybrid modeling idea was developed by Sheiner and colleagues
in the field of pharmacokinetics, where they proposed models to estimate population characteristics of
pharmacokinetic parameters (Sheiner et al., 1977; Sheiner and Beal, 1980; Mandema et al., 1992). In their
work, the pharmacokinetic models (i.e., mechanistic models) are well established, and the novelty and
focus was the introduction of statistical models for pharmacokinetic parameter estimation. On the contrary,
in our study, the mechanistic model is not known before but developed by us based on clinical knowledge
and reasonable assumptions, and our focus is the prediction of pain levels rather than parameter estimation.
Other majority of attempts based on the hybrid modeling idea in the scientific literature have appeared
in the context of neural networks (e.g., Psichogios and Ungar, 1992; Thompson and Kramer, 1994; Su
et al., 2014) and chemical engineering (e.g., Schubert et al., 1994; Thompson and Kramer, 1994; Duarte
and Saraiva, 2003), where they largely played a computational rather than analytical role. Some attempts
have also been made with medical applications: Rosenberg et al. (2007) and Adams et al. (2007) de-
veloped a model by combining a dynamical systems approach with a statistical model to predict a patient’s
CD4 cell counts and HIV viral load over time in an HIV study. Timms et al. (2014) proposed a dynamical
systems approach using ODEs to improve self-regulation in a smoking cessation study. Reinforcement
learning techniques such as Q-learning (e.g., Jaimes et al., 2014) also share some commonalities with the
hybrid approach.
In this work, we make our own attempt at a novel incorporation of statistical inference together
with mechanistic dynamical systems modeling to produce a hybrid mathematical model for predicting
and explaining human behavior. We apply the new approach specifically to the problem of predicting
the dynamics of subjective pain in a population of individuals suffering from SCD. The rationale behind
our method development is that we have prior knowledge of pain trajectories with medication, mak-
ing the problem suitable for mechanistic modeling; meanwhile, we do not know the relationship be-
tween patient health characteristics and pain levels, so we would like to investigate this using a
statistical model.
4.2. Limitations
The hybrid dynamical systems/statistical approach appear to have great potential. The low frequency of
pain reporting currently limits its usefulness, but future addition of high-frequency pain correlates such as
blood pressure, heart rate, and activity level via wearable medical devices (e.g., the ‘‘Fitbit’’) may dras-
tically improve on that. Furthermore, application of similar methods to more data-rich forecasting problems
(e.g., insulin levels) may also expand the utility of our work.
Another important limitation to our current model lies in the mechanistic component. We presented here
what we considered to be the simplest plausible model: pain fluctuates about an ‘‘unmitigated’’ equilibrium
u, and medication reduces pain below that level, but pain returns as medication is metabolized and removed
from the bloodstream. This simple model cannot capture long-term changes in the unmitigated pain level,
and hence, its forecast validity is likely limited to short time scales (days to weeks).
Perhaps the most significant limitation lies in a potentially unmodeled bias in our data set. Patients
typically reported pain levels when taking medication, but many of them only take medication when pain
levels rise. Thus, there may be a selection bias of unknown significance, causing higher pain levels to be
reported at a disproportionately high rate. This could be alleviated in future data collection efforts if pain
Table 4. Result of the Prediction Model of Unmitigated Pain Using the Linear Regression Model
Variable Estimate Std Err T p
Intercept 7.646 1.228 6.228 0.000***
HgbSC -1.566 0.890 -1.761 0.088
SB+Thal or SOArab -5.479 2.332 -2.349 0.025*
Age at baseline-18 0.001 0.034 0.290 0.773
Hydroxyurea user -1.205 0.839 -1.437 0.160
Nonopioid user -2.523 0.842 -2.995 0.005**
SB+Thal or SOArab · (age at baseline -18) 0.241 0.010 2.419 0.021*
*, **, and *** respectively denote levels .05, .01, and .001 of statistical significance.
MANAGING PAIN VIA MHEALTH AND HYBRID MODELING 685
Dow
nloa
ded
by N
orth
wes
tern
Uni
vers
ity f
rom
onl
ine.
liebe
rtpu
b.co
m a
t 06/
30/1
7. F
or p
erso
nal u
se o
nly.

estimates were based on automatically reported correlates or if patients’ pain reports were requested at
random times distinct from medication times.
Society is clearly moving in the direction of an overwhelming amount of medical data. It is imperative
that we learn to take advantage of this information to improve patient treatments beyond the traditional
standard of care. The approach we report here not only addresses the specific challenge of chronic pain
mitigation in SCD patients but also provides a test bed for new ways of dealing with big, ever-growing data
sets in real time.
5. CONCLUSIONS
A key goal of the modeling of human pain dynamics is to develop predictions that allow optimized
treatment: both pain and medication use should be minimized. Excess medication carries particular long-
term risks for chronic pain sufferers (Bannwarth, 1999; Savage, 1999; Brookoff, 2000; Gatchel, 2001), but
pain mitigation is also a primary goal of SCD treatment. How can these contradictory objectives be
balanced?
Our model allows us to forecast the probability distribution of pain for a patient at a point in the near
future, given past data. We believe that this information will be useful to a physician, allowing him or her to
make an optimized, data-driven decision balancing medication and pain for the patient. Real-time im-
plementation of such a scheme remains the subject of ongoing work.
We have successfully demonstrated the hybrid application of statistical and mechanistic mathematical
modeling with application to understanding the dynamics of subjective human pain. Our model explains
real-world data on human pain and can generate predictions of future pain dynamics.
We expect that similar methods could be used to incorporate disease-specific knowledge and modeling
with statistical inference in a variety of medical applications. Given the coming deluge of data from
wearables (including clinical trial NCT02895841 already underway) and mobile health applications, there
is a clear need for new mathematical methods to take advantage of the opportunity for personalizable, data-
driven medical treatments.
ACKNOWLEDGMENT
The authors gratefully acknowledge NSF support through grants No. DMS-1557727 and No. DGE-1324585.
AUTHOR DISCLOSURE STATEMENT
No competing financial interests exist.
REFERENCES
Adams, B., Banks, H., Davidian, M., et al. 2007. Estimation and prediction with hiv-treatment interruption data. Bull.
Math. Biol 69, 563–584.
Bannwarth, B. 1999. Risk-benefit assessment of opioids in chronic noncancer pain. Drug Saf. 21, 283–296.
Britton, N., Skevington, S., and Chaplain, M. 1995. Mathematical modelling of acute pain. J. Biol. Syst. 3, 1119–1124.
Brookoff, D. 2000. Chronic pain: 2. The case for opioids. Hosp. Pract. 35, 69–84.
Diggle, P., Heagerty, P., Liang, K.Y., and Zeger, S. 2002. Analysis of Longitudinal Data. Oxford University Press, New
York, NY.
Duarte, B.P., and Saraiva, P.M. 2003. Hybrid models combining mechanistic models with adaptive regression splines
and local stepwise regression. Ind. Eng. Chem. Res. 42, 99–107.
Fitzmaurice, G.M., Laird, N.M., and Ware, J.H. 2012. Applied Longitudinal Analysis, volume 998. John Wiley & Sons,
New Jersey.
Fors, U.G., Edwall, L.G., and Haegerstam, G.A. 1988. The ability of a mathematical model to evaluate the effects of
two pain modulating procedures on pulpal pain in man. Pain 33, 253–264.
686 CLIFTON ET AL.
Dow
nloa
ded
by N
orth
wes
tern
Uni
vers
ity f
rom
onl
ine.
liebe
rtpu
b.co
m a
t 06/
30/1
7. F
or p
erso
nal u
se o
nly.

Freedman, D.A. 2009. Statistical Models: Theory and Practice. Cambridge University Press, New York.
Gardiner, C.W., et al. 1985. Handbook of Stochastic Methods, volume 3. Springer: Berlin/Heidelberg, New York,
Tokyo.
Gatchel, R.J. 2001. A biopsychosocial overview of pretreatment screening of patients with pain. Clin. J. Pain 17,
192–199.
Granovsky, Y., Granot, M., Nir, R.-R., et al. 2008. Objective correlate of subjective pain perception by contact heat-
evoked potentials. J. Pain 9, 53–63.
Groll, A., and Tutz, G. 2014. Variable selection for generalized linear mixed models by l 1-penalized estimation. Stat.
Comput. 24, 137–154.
Hughes, A., Macleod, A., Growcott, J., et al. 2002. Assessment of the reproducibility of intradermal administration of
capsaicin as a model for inducing human pain. Pain 99, 323–331.
Jaimes, L.G., Llofriu, M., and Raij, A. 2014. A stress-free life: Just-in-time interventions for stress via real-time
forecasting and intervention adaptation. In Proceedings of the 9th International Conference on Body Area Networks,
pp. 197–203. ICST (Institute for Computer Sciences, Social-Informatics and Telecommunications Engineering).
London, UK.
Jonassaint, C.R., Shah, N., Jonassaint, J., et al. 2015. Usability and feasibility of an mhealth intervention for monitoring
and managing pain symptoms in sickle cell disease: The sickle cell disease mobile application to record symptoms
via technology (smart). Hemoglobin Vol. 39, No. 3, pp 162–168.
Mandema, J.W., Verotta, D., and Sheiner, L.B. 1992. Building population pharmacokineticpharmacodynamic models. i.
Models for covariate effects. J. Pharmacokinet. Biopharm. 20, 511–528.
McRuer, D.T., and Krendel, E.S. 1974. Mathematical models of human pilot behavior. Technical Report, DTIC
Document. Advisory Group for Aerospace Research and Development. Neuilly-Seine, France.
Nelder, J.A., and Mead, R. 1965. A simplex method for function minimization. Comput. J. 7, 308–313.
Platt, O.S., Thorington, B.D., Brambilla, D.J., et al. 1991. Pain in sickle cell disease: Rates and risk factors. N. Engl.
J. Med. 325, 11–16.
Poulin, P., and Theil, F.-P. 2002. Prediction of pharmacokinetics before in vivo studies. ii. Generic physiologically
based pharmacokinetic models of drug disposition. J. Pharm. Sci. 91, 1358–1370.
Psichogios, D.C., and Ungar, L.H. 1992. A hybrid neural network-first principles approach to process modeling. AIChE
J. 38, 1499–1511.
Rosenberg, E.S., Davidian, M., and Banks, H.T. 2007. Using mathematical modeling and control to develop structured
treatment interruption strategies for hiv infection. Drug Alcohol Depend. 88, S41–S51.
Savage, S. 1999. Opioid therapy of chronic pain: Assessment of consequences. Acta Anaesthesiol. Scand. 43, 909–
917.
Schubert, J., Simutis, R., Dors, M., et al. 1994. Hybrid modelling of yeast production processes—Combination of a
priori knowledge on different levels of sophistication. Chem. Eng. Technol. 17, 10–20.
Shah, N., Jonassaint, J., and De Castro, L. 2014. Patients welcome the sickle cell disease mobile application to record
symptoms via technology (smart). Hemoglobin 38, 99–103.
Sheiner, L.B., and Beal, S.L. 1980. Evaluation of methods for estimating population pharmacokinetic parameters. i.
Michaelis-menten model: Routine clinical pharmacokinetic data. J. Pharmacokinet. Biopharm. 8, 553–571.
Sheiner, L.B., Rosenberg, B., and Marathe, V.V. 1977. Estimation of population characteristics of pharmacokinetic
parameters from routine clinical data. J. Pharmacokinet. Biopharm. 5, 445–479.
Stepan, G. 2009. Delay effects in the human sensory system during balancing. Philos. Trans. A Math. Phys. Eng. Sci.
367, 1195–1212.
Stevens, S., Carton, A., and Shickman, G. 1958. A scale of apparent intensity of electric shock. J. Exp. Psychol. 56, 328.
Strogatz, S.H. 2014. Nonlinear Dynamics and Chaos: With Applications to Physics, Biology, Chemistry, and En-
gineering. Westview Press, Boulder, CO, USA.
Su, H.-T., Bhat, N., Minderman, P., et al. 2014. Integrating neural networks with first principles models for dynamic
modeling. In Dynamics and Control of Chemical Reactors, Distillation Columns and Batch Processes
(DYCORD+’92): Selected Papers from the 3rd IFAC Symposium, Maryland, USA, 26–29 April 1992, pp. 327.
Elsevier, Amsterdam, The Netherlands.
Thompson, M.L., and Kramer, M.A. 1994. Modeling chemical processes using prior knowledge and neural networks.
AIChE J. 40, 1328–1340.
Tibshirani, R. 1996. Regression shrinkage and selection via the lasso. J. R. Stat. Soc Series B Methodol. 58, 267–288.
Timms, K.P., Rivera, D.E., Collins, L.M., et al. A dynamical systems approach to understanding self-regulation in
smoking cessation behavior change. Nicotine Tob. Res. 16, S159–S168.
Yang, F., Tong, X., McCarver, D.G., et al. 2006. Population-based analysis of methadone distribution and metabo-
lism using an age-dependent physiologically based pharmacokinetic model. J. Pharmacokinet. Pharmacodyn. 33,
485–518.
MANAGING PAIN VIA MHEALTH AND HYBRID MODELING 687
Dow
nloa
ded
by N
orth
wes
tern
Uni
vers
ity f
rom
onl
ine.
liebe
rtpu
b.co
m a
t 06/
30/1
7. F
or p
erso
nal u
se o
nly.

Address correspondence to:
Dr. Daniel M. Abrams
Department of Engineering Sciences and Applied Mathematics
McCormick School of Engineering and Applied Science
Northwestern University
2145 Sheridan Road
Room M444
Evanston, IL 60208
E-mail: [email protected]
Dr. Chaeryon Kang
Department of Biostatistics
Graduate School of Public Health
University of Pittsburgh
7131 Parran Hall
130 DeSoto Street
Pittsburgh, PA 15261
E-mail: [email protected]
Dr. Jingyi Jessica Li
Department of Statistics
University of California, Los Angeles
520 Portola Plaza
8125 Math Sciences Building
Los Angeles, CA 90095
E-mail: [email protected]
688 CLIFTON ET AL.
Dow
nloa
ded
by N
orth
wes
tern
Uni
vers
ity f
rom
onl
ine.
liebe
rtpu
b.co
m a
t 06/
30/1
7. F
or p
erso
nal u
se o
nly.