Embed Size (px)
Citation preview

APPARENT AND STANDARDIZED ILEAL AMINO ACID DIGESTIBILITY OF PROCESSED SOYBEAN PRODUCTS FED TO PIGS
BY
SARAH FLORDELIZ CERVANTES PAHM
B.S., University of the Philippines at Los Banos, 1989
THESIS
Submitted in partial fulfillment of the requirements for the degree of Master of Science in Animal Sciences
in the Graduate College of the University of Illinois at Urbana-Champaign, 2007
Urbana, Illinois
Adviser: Dr. Hans Henrik Stein
ii
ABSTRACT. Three experiments were conducted to evaluate the feeding value of
processed soybean (SB) products fed to pigs. The first objective of experiment 1 was to
measure the apparent (AID) and standardized (SID) of CP and AA in a high protein SB
fed to growing pigs. Values obtained were compared to the AID and SID of CP and AA
in conventional SB, conventional soybean meal (SBM) and soy protein concentrate
(SPC). Four cornstarch based diets were formulated using each soy product as the only
source of CP and AA in the diet. The second objective was to measure the effect of
adding oil on amino acid digestibility of SBM and SPC. Two additional diets were
formulated by adding 7.55 and 7.35% oil to SBM and SPC, respectively. A N-free diet
was used to measure the basal endogenous losses of CP and AA. The AID and SID of
CP and AA in the high protein SB were not different from conventional SB and the SID
of most AA in the high protein SB was similar to SBM with oil and SPC. The addition of
oil improved the SID of most AA in SBM and SPC.
Experiment 2 was conducted to measure the AID and SID of CP and AA of 4 SB
products, fishmeal (FM), and casein fed to weanling pigs. The 4 SB products were SBM,
a soy protein product (SPP), soy protein isolate (SPI), and fermented SBM (FSBM).
Each protein source was included as the only source of CP and AA in cornstarch based
diets. An N-free based diet was also used to measure basal endogenous losses of CP and
AA. The SID of most AA in casein was superior compared with the other protein
sources. However, the SID of most AA in SPP and SPI were similar to casein. Except
for Lys, the SID for all indispensable AA in FSBM was not different from FM, SPP, and
SPI. No differences were also observed in the SID of AA between SBM and FSBM.
iii
Experiment 3 was conducted to evaluate the impact of processing in conventional
SBM and 3 SBM that had been treated to increase the amount of rumen undegraded
protein (RUP). The objective of part 1 of this experiment was to measure the apparent
(ADD) and standardized (SDD) duodenal digestibility, AID and SID of CP and AA and
the ADD, AID, and the small intestinal disappearance of reactive Lys in the 4 SBM using
the pig as a model. Four cornstarch based diets were formulated using each of the SBM
as the only source of CP and AA in the diets. A N-free based diet was also used to
measure basal endogenous losses of CP and AA. The objective of part 2 of this
experiment was to test the hypothesis that reactive Lys procedures can be used to predict
RUP in heated SBM. Rumen undegraded protein was calculated from CP fractions
obtained from the N disappearance of each of the SBM incubated in the rumen of dairy
cows. Regression equations were obtained correlating RUP with the concentration of
reactive Lys in the 4 SBM. Conventional SBM had greater concentration of AA, greater
(P < 0.05) ADD, and SID of AA, greater (P < 0.05) concentration of reactive Lys, and
greater (P < 0.05) ADD of reactive Lys but lower (P < 0.05) RUP than treated SBM. The
SID of Lys, the concentration of reactive Lys, and the AID of reactive Lys was not
different among the treated SBM. The concentration of blocked Lys measured using the
homoarginine procedure provided the best estimate (R2=.77) for RUP in SBM.
Keywords: amino acids, digestibility, fermented soybean meal, high protein
soybean, pigs, rumen undegraded protein

iv
TABLE OF CONTENTS ABSTRACT ........................................................................................................................ ii CHAPTER 1. INTRODUCTION .......................................................................................1
LITERATURE CITED ................................................................................................3
CHAPTER 2. SOY PRODUCTS IN ANIMAL NUTRITION: LITERATURE
REVIEW ..............................................................................................................................4
INTRODUCTION ........................................................................................................4
SOYBEAN PRODUCTS USED IN THE FEED AND FOOD INDUSTRIES ...........4
Soybean Meal ........................................................................................................4
Soybean Oil ...........................................................................................................5
Full Fat Soybeans ..................................................................................................6
Soy Protein Concentrate .......................................................................................7
Soy Protein Isolate ................................................................................................7
Fermented Soybean Meal .....................................................................................8
Enzymatically digested Soybean Meal .................................................................8
Heated Soybean Meal with Increased Rumen By-pass Proteins ..........................9
Soy Hulls ...............................................................................................................9
NEW VARIETIES OF SOYBEANS.............................................................................9
High Protein Soybeans ..........................................................................................9
Low Oligosaccharide Soybeans ..........................................................................10
Low Trypsin Inhibitor Soybeans ........................................................................11
FACTORS AFFECTING AMINO ACID DIGESTIBILITY IN SOYBEAN
PRODUCTS .................................................................................................................11

v
Anti-nutritional factors ........................................................................................11
Protease inhibitors ......................................................................................11
Oligosaccharides ........................................................................................12
Processing ...........................................................................................................12
Extrusion ....................................................................................................13
Processing by Alcohol, Acid, or Heat and Water ......................................13
Fermentation ..............................................................................................14
Oil Addition ........................................................................................................14
Fiber ....................................................................................................................15
CONCLUSION AND PERSPECTIVE .......................................................................15
LITERATURE CITED ................................................................................................17
CHAPTER 3. ILEAL AMINO ACID DIGESTIBILITY OF HIGH PROTEIN
SOYBEANS, CONVENTIONAL SOYBEANS, AND SOYBEAN MEAL AND SOY
PROTEIN CONCENTRATE WITHOUT AND WITH ADDED OIL FED TO
GROWING PIGS ...............................................................................................................30
INTRODUCTION .......................................................................................................31
MATERIALS AND METHODS .................................................................................32
RESULTS ....................................................................................................................36
DISCUSSION ..............................................................................................................39
LITERATURE CITED ................................................................................................44
CHAPTER 4. ILEAL AMINO ACID DIGESTIBILITY OF SOYBEAN AND ANIMAL
PROTEIN SOURCES FED TO WEANLING PIGS.........................................................64
INTRODUCTION .......................................................................................................65

vi
MATERIALS AND METHODS .................................................................................66
RESULTS ....................................................................................................................71
DISCUSSION ..............................................................................................................73
LITERATURE CITED ................................................................................................79
CHAPTER 5. DUODENAL AND ILEAL AMINO ACID DIGESTIBILITY AND
REACTIVE LYS DIGESTIBILITY IN PIGS, AND RUMEN UNDEGRADED
PROTEIN IN DAIRY COWS OF CONVENTIONAL AND TREATED SOYBEAN
MEALS……... ...................................................................................................................97
INTRODUCTION .......................................................................................................98
MATERIALS AND METHODS .................................................................................99
RESULTS ..................................................................................................................107
DISCUSSION ............................................................................................................110
LITERATURE CITED ..............................................................................................116
CONCLUSION ................................................................................................................143

1
CHAPTER 1
INTRODUCTION
Soybeans grown in the Orient where traditionally prepared as a source of protein
for humans but in North America, the demand for soybeans is driven by the demand for
soybean meal (SBM). A large proportion of SBM produced in the United States is fed to
livestock (ASA, 2007). The popularity of SBM as a protein source for animals came from
the fact that SBM provides the AA that are deficient in corn (Baker, 2000). The AA in
SBM, therefore, complements the AA in corn better than other protein sources. The
selective breeding of high protein soybeans, such as SSeed HP.290, is designed to
optimize the potentials of soybeans as a protein source.
Although SBM is an excellent source of protein, it has limitations when fed to
young pigs and dairy cows. Feeding SBM to young pigs often cause digestive
disturbances resulting in poor growth (Liener, 2000). Pepsoygen, a fermented SBM
product was recently introduced. The fermentation of SBM is effective in reducing the
concentration of trypsin inhibitors and increasing the concentration of small peptides in
SBM (Hong et al., 2004). The fermentation process also removes the oligossacharides in
SBM (Nout and Kiers, 2005). Fermented SBM, therefore, has the potential to be used in
diets fed to young pigs without the adverse effects of SBM. Amino acid digestibility may
also be improved because of the pre-digested proteins in fermented SBM.
The high rumen degradability of SBM proteins limits its use in dairy cows (NRC,
2001). Heating has been employed to increase the concentration of rumen undegraded
protein (RUP) in SBM. The addition of lignosulfonates and soyhulls to SBM prior to
heating is also effective in increasing RUP (Castro et al., 2007). However, heat treatment

2
has the risk of reducing the digestibility of AA in proteins but more information on the
assessment of the consequences of heating in SBM is needed.
This thesis will primarily evaluate the AA digestibility of some soybeans products
as affected by breeding, by the addition of oil, by fermentation and by heating.
Specifically, the objectives of this thesis are:
1. To determine the apparent (AID) and standardized (SID) ileal AA digestibility
of a new high protein soybean and to evaluate the effect of oil addition on the AA
digestibility of SBM and soy protein concentrate fed to growing pigs
2. To determine the AID and SID of fermented SBM fed to weanling pigs
3. To determine the intestinal digestibility of treated SBM using the pig as a model

3
LITERATURE CITED
ASA, 2007. Soy Stats™, a reference guide to important soybean facts and figures.
http://www.soystats.com. Accessed Oct. 29, 2007.
Baker, D. H. 2000. Nutritional constraints to use of soy products by animals. Page 1-12
in Soy in Animal Nutrition. J. K. Drackley, ed. Federation of Animal Science
Societies, Savoy, IL.
Castro, S. I. B, L. E. Phillip, H. Lapierre, W. P. Jardon, and R. Berthiaumet. 2007.
Ruminal degradability and intestinal digestibility of protein and amino acids in
treated soybean meal products. J. Dairy Sci. 90:810-822.
Hong, K. J., C. H. Lee, and S. W. Kim. 2004. Aspergillus oryzae GB-107 fermentation
improves nutritional quality of food soybeans and feed soybean meals. J. Med.
Food. 7: 430-435.
Liener I. E., 2000. Non-nutritive factors and bioactive compounds in soy. Page 13-35 in
Soy in Animal Nutrition. J. K. Drackley, ed. Federation of Animal Science
Societies, Savoy, IL.
Nout, M. J. R., and J L. Kiers. 2005. Tempe fermentation, innovation and functionality:
update into the third millennium. J. Appl. Microbiol. 98:789-805.
NRC. 2001. Pages 43-65 in Nutrient Requirements of Dairy Cattle. 10th rev. ed. Natl.
Acad. Press, Washington, D.C.

4
CHAPTER 2
Soy Products in Animal Nutrition: Literature Review
INTRODUCTION
The soybean (Glycine max) is often referred to as a “miracle crop” because it has
numerous applications not only in the food and animal industry, but in other industries as
well (ASA, 2007). The recent discovery that bioactive peptides in soybean (SB) proteins
may prevent chronic diseases adds another dimension to the usefulness of soy proteins in
the field of health and medicine (Liu, 1997).
The use of SB as a rich source of CP and oil was long recognized in China
(Snyder and Kwon, 1987). In Asia, SB is prepared in a variety of ways which results in
different forms and textures of digestible SB products that complement rice-based diets
(Snyder and Kwon, 1987). The use of SB as a healthy alternative protein source is also
recognized in North America. From the traditional products of SBM for livestock, and
oil for industrial use, advances in processing technology in combination with the
functional versatility of SB proteins triggered the production of different types of
products available for human and animal consumption (Liu, 1997).
SOYBEAN PRODUCTS USED IN THE FEED AND FOOD INDUSTRIES
Soybean Meal
Soybean meal (SBM) is produced by the extraction of oil from the SB seed (Liu,
1997). It is considered to be the “gold standard” for protein evaluation because of its
excellent AA profile and high digestibility (Drakely, 2000). Several factors influence the
concentration of CP and AA in SBM. The method of extraction can result in differences
in the CP and AA concentration in SBM. The expeller method is the traditional way of

5
removing oil from the seed. The SB flows through an auger with reducing diameter until
it is crushed at the terminal end and pressed into a die to break the cell structure and let
the oil flow (Liu, 1997). This method of oil removal retains approximately 6% oil in the
meal. The most common current commercial procedure of oil extraction is the solvent
extraction method, which is a more efficient way of removing oil from SB. Solvent
extracted SBM contains less than 1% oil and has greater concentrations of CP and AA
than expeller SBM (Opapeju, et al., 2006), but because of the lower oil concentration,
they contain less energy than expeller SBM (Woodworth et al., 2001). Dry extrusion in
combination with expeller method has shown promise because of increased oil recovery
in a single processing run and because it produces a properly cooked SBM (Nelson et al.,
1987).
Soybeans may be dehulled prior to crushing and the resulting SBM contains more CP
and AA than non-dehulled SBM (Woodworth et al., 2001). Soybean meals processed
from SB grown in the northern part of the United States also contain less AA than SBM
processed from SB grown in the central and southern parts of the United States, which
indicates that variations in the composition of SBM within the US exists (Grieshop et al.,
2003; Karr-Lilienthal et al., 2005).
Soybean Oil
Soybean oil is the second most economically important component in SB. It is
the most consumed oil in the world after palm oil (ASA, 2007). Most of the soybean oil
produced is refined to cooking oil or salad oil. Soybean oil is mainly composed of
unsaturated fatty acids and its high concentration of linolenic acid (9%) makes it
6
susceptible to oxidation (Snyder and Kwon, 1987). Therefore, research has been focused
towards the breeding of low linolenic acid SB (Liu, 1997).
Soy oil is included in swine diets primarily to add energy, but soy oil can also
contribute essential fatty acids and fat soluble vitamins (Azain, 2001). An additional
advantage of using oil in swine diets is that it also reduces the dustiness of the feeds
(Barbi, 1996).
Full Fat Soybeans
Whole SB are referred as “full fat” SB (Barbi, 1996). The acceptance of the use
of full fat SB was based on its economic advantages over the use of SBM and oil. But
later research has shown that the use of full fat SB has other additional benefits (Hancock
and Behnke, 2001).
Most of the full fat SB is processed by either roasting or extrusion. Roasting
involves dry heating of the whole soybeans at 110º -170ºC for short periods (Barbi, 1996;
Hanson, 1996). The whole SB is then ground, or flaked before mixing into the diet.
Extrusion involves moving the whole soybeans in a screw conveyor with reducing
configurations until the soybeans are pressed through a die to achieve tissue disruption
(Barbi, 1996). Heat that is generated by friction and added pressure increases bean
temperature from ambient temperature to 135ºC in the 30 seconds that the beans are
inside the extruder (Nelson et al., 1987). A high quality SB is produced because the high
temperature used during a short time prevents overheating that can reduce the nutritional
quality of the full fat SB (Nelson et al., 1987; Parsons et al., 1992). The process of
extrusion may be wet or dry depending on if steam is added or not (Hanson, 1996).

7
Full fat SB contain 35% CP, which is lower than SBM, but it contains 18% fat
(NRC, 2001). Because of the high fat concentrations, FFSB contain more energy than
SBM when fed to growing or finishing pigs (Kim et al., 2000).
Soy Protein Concentrate
The removal of soluble carbohydrates (i.e., sucrose, raffinose, stachyose, and
verbascose) from SBM results in a product called soy protein concentrate (SPC; Liu,
1997). It contains approximately 70% CP in DM basis and is produced by 3 different
methods (alcohol extraction, acid extraction, or moist heat and water leaching extraction).
The composition and characteristics of SPC, therefore, vary according to its
manufacturing process (Berk, 1992).
Soy protein concentrate is mainly used in diets fed to young pigs and calves because
of their immature digestive tract and sensitivity to antigenic factors in SBM (Dawson et
al., 1988; Sohn et al., 1994). Glycinin and β-conglycinin in SBM are the antigenic factors
that cause the immune stimulation in pigs (Li et al., 1990). The absence of
oligosaccharides, the reduced concentration of trypsin inhibitors, and the reduced
concentration of antigenic factors in SPC make young pigs tolerate SPC better than SBM
resulting in improved performance (Sohn et al., 1994).
Soy Protein Isolate
Soy protein isolate (SPI) contains approximately 90% CP and is the most
concentrated form of SB protein (Liu, 1987). Its manufacture starts with the
solubilization of the soy protein in SBM achieved at a slightly alkaline pH. After the
proteins go into solution, the proteins are precipitated by acidification, neutralized and
dried (Berk, 1992). Soy protein isolates are use as a substitute for milk products in
8
newly-weaned pigs but N digestibility and performance are inferior in animals fed soy
based diets than milk based diets (Dawson et al., 1988). Compared to SBM, SPI contains
relatively less Lys, sulfur AA, and Thr because some of the AA are removed during the
isolation and precipitation process (Liu, 1987; Emmert and Baker, 1995).
Fermented SBM
Methods for the fermentation of SB or SBM were developed in China and fermented
soy products have been recognized as healthy sources of protein (Liu, 1997). The
fermentation process is facilitated by the use of a mold or bacteria or both with
Aspergillus Oryzae and Bacillus subtilis as the predominant strains of mold and bacteria,
respectively (Hong et al, 2004, Yang et al., 2007). The fermentation process reduces the
concentration of trypsin inhibitors in SBM, but increases the concentration of CP, AA,
fat, and P. The AA profile of the fermented product was also different from conventional
SBM because of the preferential utilization of some AA by the fungi (Hong et al., 2004).
Fermented SBM also contain smaller peptides than SBM which indicates that protein has
been digested by the proteases produced by A. oryzae (Sardjono et al., 1998; Hong et al.,
2004).
Enzymatically digested SBM
This is a commercial product under the trade name of HP 300
(www.hamletprotein.com). It is an enzymatically treated SBM with reduced
concentrations of trypsin inhibitors, oligosaccharides, and other anti-nutritional
components that are present in SBM (Zhu et al., 1998). The AA composition of HP 300
is similar to SBM, but the apparent (AID) and standardized (SID) ileal digestibility of

9
most AA in HP 300 is greater than SBM (Yang et al., 2007) and similar to value obtained
in SPC and fermented SBM (Yang et al., 2007).
Heated SBM with increased Rumen By-pass Protein
Heating was shown to increase the ruminal by-pass value of the proteins in SBM
(Faldet et al., 1992). A protein source with a high by-pass value is needed in the feed for
high yielding dairy cows because these cows have a high AA requirement (Stern et al.,
1994). Heating of SBM induces the Maillard reaction, which is believed to be the
mechanism of protecting the SBM from rumen degradation (Faldet et al. 1992). Methods
to increase the by-pass value of proteins include mixing SBM with lignosulfonates or
soyhulls prior to heating (Can and Yilmaz, 2002, Heitritter et. al., 1998). Exposing SBM
to severe heat using a mechanical expeller is also an effective way to increase by-pass
SBM (Castro et al., 2007).
Soy Hulls
Soy hulls are by-products of soybean processing. They are removed during the
cleaning process before oil extraction (Liu, 1997). The complex carbohydrate in soy
hulls are composed of 30% pectin, 50% hemicellulose, and 20% cellulose (Kikuchi et al.,
1971). Increasing levels of dietary soy hulls resulted in a linear reduction in the AID and
SID of AA in SBM fed to pigs (Dilger et al., 2004). Therefore the use of soy hulls in diets
fed to swine is limited.
NEW VARIETIES OF SOYBEANS.
High Protein Soybean
A major reason for breeding high protein SB is that CP concentration is positively
correlated with the yield of soy milk and tofu (Liu, 1997). Conventional SB contains 35-
10
37 % CP whereas high protein SB contains at least 41% CP (Chohan et al., 1993; NRC,
2001; Yaklich, 2001). The increase in CP is associated with an increase in AA
concentration, but the concentration of sulfur AA does not usually increase as much as
the concentration of other AA (Krishnan, et al., 2005). The true ileal digestibility of AA
in roosters fed 2 SBM processed from 2 high protein SB varieties, were not different to
the conventional SBM however, more research is needed to evaluate the feeding value of
these new varieties in swine diets.
Low Oligosaccharide Soybean
The feeding of soybeans to young animals, poultry and humans is constrained by the
inherent presence of indigestible oligosaccharides in soybeans. The α-1,6 galactosidic
linkage that connects the galactose in raffinose and stachyose can not be digested in the
small intestines of monogastric animals because of the lack of endogenous α-
galactosidase (Liener, 2000). This enzyme is necessary to digest the α-1,6 galactosidic
bonds and break the oligosaccharide to its component sugars. Microbial fermentation in
the distal ileum and colon digests these oligosaccharides producing gas which is the main
reason for the flatulence observed in humans eating beans and other legumes containing
α-galactosides (Suarez et al., 1999). The low ME in SBM fed to poultry is also attributed
to these oligosaccharides. The development of a low-oligosaccharide SB has resulted in
SBM that have 86% lower raffinose and stachyose concentration than conventional SBM
(Parsons et al., 2000). The reduction in the oligosaccharide concentration of the modified
SB result in a 7% improvement in true metabolizable energy compared with conventional
SB (Parsons et al., 2000). However, in dogs, nutrient digestibility of low-oligosaccharide
SB and conventional soybean were not different (Zuo et al., 1996).

11
Low Trypsin Inhibitor Soybean
The low-trypsin inhibitor SB contain 40-50% less trypsin inhibitors than conventional
raw SB but the AA concentration is similar to conventional SB (Chohan et al., 1992;
Herkelman et al., 1992). Birds fed low-trypsin inhibitor SB had a similar N digestibility
and performance as birds fed raw SB, but birds fed roasted SB performed better than
birds fed raw and low-trypsin inhibitor SB (Chohan et al., 1992). This indicates that the
concentration of trypsin inhibitors in low-trypsin inhibitor SB has not been reduced
enough to reduce the negative effects on growth performance. In pigs, apparent ileal
digestibility of CP and AA in low-trypsin inhibitor SB is greater than in conventional raw
SB but heating improved CP and AA digestibility in low-trypsin inhibitor SB to a greater
extent than heated conventional SB (Herkelman et al., 1992). This further suggests that
heating is necessary to optimize the feeding value of low-trypsin inhibitor SB and the use
of these SB has no advantage over conventional SB. However, if the concentration of
trypsin inhibitors can be further reduced, these varieties could be an alternative o
conventional SB.
FACTORS AFFECTING AMINO ACID DIGESTIBILITY IN SOYBEAN
PRODUCTS
Anti-nutritional Factors
Protease Inhibitors. Two types of protease inhibitors are inherent in soybeans. The
Kunitz inhibitor that binds trypsin, and the Bowman-Birk inhibitor that binds both trypsin
and chymotrypsin (Liener, 2000). These protease inhibitors are responsible for most of
the reduction of CP and AA digestibility that is observed in raw SB compared with
heated SB (Herkelman et al., 1992). The reason for this is that they reduce the digestion
12
of proteins by inactivating trypsin and chymotrypsin. The compensatory response of the
body to increase secretion of these 2 enzymes contributes to the reduction in CP and AA
digestibility of feedstuffs (Liener, 2000).
Oligosaccharides. The major oligosaccharides in soybeans are raffinose and
stachyose that are present at approximately 1% and 6% in SBM dry matter (Grieshop et
al., 2003). The addition of 9% soy oligosaccharide reduced the AID of AA in SPC- fed
pigs. However, pigs fed SBM that contained increasing levels of soy oligossacharides
did not have a reduction in AID of AA (Smiricky, et al., 2002). Dogs fed low
oligosaccharide SBM had similar nutrient digestibility as dogs fed conventional SBM
(Zuo et al., 1996). But weanling pigs fed 1 and 2% added stachyose had lower weight
gains than milk based diets. Diarrhea incidence was also greater in pigs fed SBM diets
than milk based diets. The above studies indicate that the age of the animal influences the
impact of oligossacharides on nutrient digestibility.
Processing
Heating is an effective way to reduce the anti-nutritional factors in SBM and the
reduction in trypsin inhibitor concentration results in improved CP and AA digestibility
(Herkelman et al., 1992). Different methods of heat application are used and the
efficiency by which the anti-nutritional factors are reduced is influenced by the method of
heating. The processing facilities, the temperature, and the duration of heating, therefore,
influence the digestibility of amino acids (Woodworth et al., 2001; Opapeju et al. 2006).
The direct measure of trypsin inhibitor activity or concentration is a good indicator of
underheated SBM, however, the simplicity of the urease activity assay makes it the
method of choice in evaluating SBM quality (Snyder and Kwon, 1987). It is based on the

13
principle that the urease enzyme in SBM is denatured at the same rate as protease
inhibitors during heating (Parsons, 2000). The optimum range of urease pH change is
0.05-0.20 (AOCS, 1973) but SBM that have a zero urease pH change also showed Lys
digestibility of not less than 90% using the cecectomized rooster assay (Parsons, 2000).
This suggests that the urease activity assay is not a sensitive measure of overheating
(Parsons, 2000).
Extrusion. The denaturation of SB native proteins and the disruption of SB fat
globules during extrusion may contribute to the greater feeding value of extruded SB
compared with roasted SB (Hancock and Behnke, 2001). Apparent ileal digestibility of
most AA in extruded SB is greater than in roasted or jet-sploded SB, but lower than in
conventional SBM (Marty et al., 1994; Marty and Chavez, 1995; Kim et al., 2000). The
reduced AID of AA in roasted SB is associated with greater endogenous losses of Lys
and greater ileal recovery of dietary Lys in the distal ileum (Marty and Chavez, 1995).
Regardless of the equipment used to heat soybeans, overheating of soybeans reduces the
true digestibility of some AA, particularly Lys (Parsons, et al., 1992). When fed to pigs,
the AID of AA in roasted SBM that was heated to increase rumen by-pass was also lower
than in conventional SBM (Marty and Chavez, 1995).
Processing by alcohol, acid, or heat and water. Processing of SBM improves AA
digestibility. The AID of AA in young pigs fed SPI and SPC containing diets were
greater than the AID of AA in pigs fed SBM (Walker et al., 1986; Sohn et al., 1994). The
improvement in the AID of AA in SPC and SPI was attributed to the removal of
indigestible carbohydrates and antigenic proteins in these products (Walker et al., 1986;
Sohn et al., 1994). However, the advantage of SPC over SBM may be limited to young

14
pigs because the SID of AA in growing pigs fed SPC was not different from values
obtained in pigs fed SBM (Smiricky, et al., 2002).
Fermentation. Fermentation of SBM using A. oryzae produces a product that
contains more peptides than conventional SBM (Hong et al., 2004). Peptides are
absorbed in the small intestines at a faster rate than free AA (Webb, 1990). As a result,
the fermentation of SBM is expected to improve AA digestibility. However, the
fermentation of SBM improved the AID and SID of some, but not all, AA in fermented
SBM compared with conventional SBM (Yun et al., 2005; Yang et al., 2007). The AID
of AA in fermented SBM fed to early-weaned pigs was not different from the AID of AA
in fish meal, SPC, and HP 300 (Yun et al., 2005; Yang et al., 2007).
Oil addition
There is limited information about effect of dietary oil on AA digestibility. The
addition of graded levels of oil improved the AID of AA (Albin et al., 2001; Imbeah and
Sauer, 1991), which may be a result of a reduction in the rate of gastric emptying
(Gentilcore et al., 2006) or a reduction in the rate of passage of the digesta through the
small intestines (Valaja and Silijander, 2001). This would provide longer time for
digestion and absorption of AA and peptides (Zhao et al., 2000). However, addition of
oil to SBM in order to simulate the fat content in full-fat soybeans did not result in
similar AA digestibilities between the two products (Fan et al., 1995; Marty and Chavez,
1995; Bruce et al., 2006). The lower values for AID of AA in FFSB than in SBM with
added oil was attributed to a greater concentration of trypsin inhibitors and a greater
concentration of dietary fiber from soy hulls in FFSB than in SBM with oil diet (Fan et
al., 1995; Bruce et al., 2006). Greater endogenous loss of Lys was also observed at the

15
distal ileum of pigs fed micronized, jet-sploded or roasted FFSB compared with SBM
with oil (Marty and Chavez, 1994).
Fiber
The soy hulls contain most of the fiber in soybeans. It is removed before oil
extraction and sometimes is added back to the meal to produce a meal with 42- 44% CP
(Liu, 1997). Additions of soy hulls to SBM reduce the AID and SID of AA (Dilger, et
al., 2004). This maybe a result of increasing concentration of neutral detergent fiber
(NDF) in the diet because increasing NDF can reduce AA digestibility in 2 ways. First, it
may increase pancreatic secretions of enzymes (Ikegami et al., 1990) and increase
sloughing of intestinal epithelium (Shah et al., 1982), which may result in an increase in
endogenous CP and AA losses. Second, NDF particularly pectin which is present in soy
hulls, may increase digesta viscosity which may reduce the interaction between nutrients
and enzymes resulting in a slow rate of nutrient absorption (Mosenthin et al., 1994;
Buraczewska et al., 2007).
CONCLUSION AND PERSPECTIVES
As world population continues to increase, the demand for protein also increases.
The demand for an inexpensive high quality protein as food for man and animals alike, is
the driving force to explore the full potential of SB proteins and expand the use of SB in
human food systems and animal production systems.
Selective breeding of SB to increase the concentration of CP may improve the
feeding value of SB as a protein source for human and animal consumption. However,
there is a lack of information on the AID and SID of AA in high protein SB compared

16
with conventional SB and more research is needed to measure the AA digestibility in
high protein SB.
Pepsoygen, a fermented SBM product, was recently introduced. The fermentation
process was suggested to overcome the constraints of the use of conventional SBM in
starter diets. Therefore, this product can potentially be a substitute for more expensive
soy products such as SPC and SPI, FM, and dairy products in starter diets.
Different methods are used to produce rumen by-pass SBM. The process of
inducing the Maillard reaction through heat and the addition of reducing sugars not only
increases RUP but also decreases the concentration of reactive Lys. Measuring RUP
using rumen-cannulated cows is tedious and expensive. In-vitro procedures for
measuring the concentration of reactive Lys may be useful in predicting RUP of by-pass
SBM.
Formulating diets to meet the CP and AA requirement of animals requires that
reliable data on SID of AA in feed ingredients are available. Knowing the SID of CP and
AA in high protein SB and fermented SBM will enable nutritionists to make sound
decisions in choosing suitable feed ingredients relative to their price.

17
LITERATURE CITED
__________. http://www.hamletprotein.com. Accessed Nov. 26, 2007.
Albin, D. M., M. R. Smiricky, J. E. Wubben, and V. M. Gabert. 2001. The effect of
dietary level of soybean oil and palm oil on apparent ileal amino acid digestibility
and postprandial flow patterns of chromic oxide and amino acids in pigs. Can. J.
Anim. Sci. 81:495-503.
ASA, 2007. Soy Stats™, a reference guide to important soybean facts and figures.
http://www.soystats.com. Accessed Oct. 29, 2007.
Azain, M. J. 2001. Fat in swine nutrition. Pages 95-105 in Swine Nutrition, 2nd ed. A. J.
Lewis and L. L. Southern, eds. CRC Press, N.Y.
Barbi, J. W. 1996. Technology comparisons and results on processing and nutrition of
full fat soya. Page 56-63 in Proc. 2nd Int. Fullfat Soya Conference, Budapest,
Hungary.
Berk, Z. 1992. Technology of production of edible flours and protein products from
soybean. http://www.fao.org/docrep/t0532e/t0532e00.htm Accessed Nov. 20,
2006.
Bruce, K. J., L. K. Karr-Lilienthal, K. E. Zinn, L. L. Pope, D. C. Mahan, N. D. Fastinger,
M. Watts, P. L. Utterback, C. M. Parsons, E. O. Castaneda, M. Ellis, and G. C.
Fahey, Jr. 2006. Evaluation of the inclusion of soybean oil and soybean
processing by-products to soybean meal on nutrient composition and digestibility
in swine and poultry. J. Anim. Sci. 84:1403-1414.
Buraczewska, L., E. Święch, A. Tusnio, M. Taciak, M. Ceregrzyn, and W. Korczyński.
2007. The effect of pectin on amino acid digestibility and digesta viscosity,

18
motility and morphology of the small intestine, and on N-balance and
performance of young pigs. Livest. Sci. 109:53-56.
Can, A., and A. Yilmax. 2002. Usage of xylose or glucose as non-enzymatic browning
agent for reducing ruminal protein degradation of soybean meal. Small Rumin.
Res. 46:173-178.
Castro, S. I. B, L. E. Phillip, H. Lapierre, W. P. Jardon, and R. Berthiaumet. 2007.
Ruminal degradability and intestinal digestibility of protein and amino acids in
treated soybean meal products. J. Dairy Sci. 90:810-822.
Chohan, A. K., R. M. G. Hamilton, M. A. McNiven, and J. A. MacLeod. 1992. High
protein and low trypsin inhibitor varities of full-fat soybeans in broiler chicken
starter diets.
Dawson, D. P., J. L. Morrill, P. G. Reddy, and H. C. Minocha. 1988. Soy protein
concentrate and heated soy flour as protein sources in milk replacer for
preruminat calves. J. Dairy Sci. 71:1301-1309.
Decuypere, J. A., A. Mecusen, and H. K. Henderickx. 1981. Influence of the partial
replacement of milk protein by soybean protein isolates with different physical
properties on the performance and nitrogen digestibility of early-weaned pigs. J.
Anim. Sci. 53:1011-1018.
Dilger, R. N., J. S. Sands, D. Ragland, and O. Adeola. 2004. Digestibility of nitrogen
and amino acids in soybean meal with added soyhulls. J. Anim. Sci. 82:715-724.
Drakely, J. K. 2000. Preface. Page ix-x in Soy in Animal Nutrition. J. K. Drackley, ed.
Federation of Animal Science Societies, Savoy, IL.

19
Eldridge, A. C., L. T. Black, and W. J. Wolf. 1979. Carbohydrate composition of
soybean flours, protein concentrates, and isolates. J. Agric. Food Chem. 27:799-
802.
Emmert, J. L., and D. H. Baker. 1995. Protein quality assessment of soy products. Nutr.
Res. 15:1647-1656.
Faldet, M. A., L. D. Satter, and G. L. Broderick. 1992. Determining optimal heat
treatment of soybeans by measuring available lysine chemically and biologically
with rats to maximize protein utilization by ruminants. J. Nutr. 122:151-160.
Gentilcore, D., R. Chaikomin, K. L. Jones, A. Rusco, C. Feinle-Bisset, J. M. Wishart, C.
K. Rayner, and M. Horitz. 2006. Effect of fat on gastric emptying of and the
glycemic, insulin, and incretin responses to a carbohydrate meal and Type 2
diabetes. J. Clin. Endocrinol. Metab. 91:2062-2067.
Grieshop C. M., C. T. Kadzere, G. M. Clapper, E. A. Flickinger, L. L. Bauer, R. L.
Frazier, and G. C. Fahey, Jr. 2003. Chemical and nutritional characteristics of
United States soybeans and soybean meals. J. Agric. Food Chem. 51:7684-7691.
Hancock, J. D., and K. C. Behnke 2001. Use of ingredient and diet processing
technologies (grinding, mixing, pelleting, and extruding) to produce high quality
feeds for pigs. Page 469-497 in Swine Nutrition, 2nd ed. A. J. Lewis and L. L.
Southern, eds. CRC Press, N.Y.
Hanson, L. J. 1996. Expected animal response to the quality of full fat soya. Page 83-89
in Proc. 2nd Int. Fullfat Soya Conference, Budapest, Hungary.

20
Heitritter, G. V., J. B. Yeates, and P. L. Huffman. 1998. Method for manufacturing
protein protected ruminant feed. US Pat. No. 5,824,355. http://www.uspto.gov/
Accessed June 16, 2007.
Herkelman, K. L., G. L. Cromwell, T. S. Stahly, T. W. Pfeiffer, and D. A. Knabe. 1992.
Apparent digestibility of amino acids in raw and heated conventional and low-
trpsin-inhibitor soybeans for pigs. J. Anim. Sci. 70: 818-826.
Hong, K. J., C. H. Lee, and S. W. Kim. 2004. Aspergillus oryzae GB-107 fermentation
improves nutritional quality of food soybeans and feed soybean meals. J. Med.
Food. 7: 430-435.
Ikegami, S., F. Tsuchihashi, H. Harada, N. Tsuchihashi, E. Nishide, and S. Innami. 1990.
Effect of viscous indigestible polysaccharide on pancreatic-biliary secretion in the
pig. Reprod. Nutr. Dev. 27:353-360.
Imbeah M., and W. C. Sauer. 1991. The effect of dietary level of fat on amino acid
digestibilities in soybean meal and canola meal and on rate of passage in growing
pigs. Livest. Prod. Sci. 29:227-239.
Kaankuka, F. G., T. F. Balogun, and T. S. Tegbe. 1995. Effect of duration of cooking of
full-fat soya beans on proximate analysis, levels of antinutritional factors, and
digestibility of weanling pigs. Anim. Feed Sci. Technol. 62:229-237.
Karr-Lilienthal, L. K., C. M. Grieshop, and G. C. Fahey, Jr. 2005. Chemical and
nutritional properties of soybean carbohydrates as related to nonruminants: A
review. Livest. Prod. Sci. 97:1-12.
Kikuchi, T., S. Ishii, D. Fukushima, and T. Yokotsuka. 1971. Food chemical studies on
soybean polysaccharide. Part I. Chemical and physical properties of soybean cell

21
wall polysaccharide and their changes during cooking. J. Agric. Chem. Soc.
45:228-234.
Kim, I. H., J. D. Hancock, and R. H. Hines. 2000. Influence of processing method on
ileal digestibility of nutrients from soybeans in growing and finishing pigs.
Asian-Aus. J. Anim. Sci 13:192-199.
Krishnan, H. B., J. O. Bennett, W. Kim, A. H. Krishnan, and T. P. Mawhinney. 2005.
Nitrogen lowers the sulfur amino acid content of soybean (Glycine max [L.]
Merr) by regulating the accumulation of Bowman-Birk protease inhibitor. J.
Agric. Food. Chem. 53:6347-6354.
Li, D. F., J. L. Nelssen, P. G. Reddy, F. Blecha, J. D. Hancock, G. L. Allee, R. D.
Goodband, and R. D. Klemm. 1990. Transient hypersensitivity to soybean meal in
the early-weaned pig. J. Anim. Sci. 68:1790-1799.
Li, S., and W. C. Sauer. 1994. The effect of dietary fat content on amino acid digestibility
in young pigs. J. Anim. Sci. 72: 1737-1743.
Liener, I. E. 2000. Non-nutritive factors and bioactive compounds in soy. Page 13-35 in
Soy in Animal Nutrition. J. K. Drackley, ed. Federation of Animal Science
Societies, Savoy, IL.
Liu, K. 1997. Soybeans: Chemistry, Technology, and Utilization. Chapman and Hall,
NY.
Marty, B. J., and E. R. Chavez. 1995. Ileal digestibilities and urinary losses of amino
acids in pigs fed heat processed soybean products. Livest. Prod. Sci. 43: 37-48.
Marty, B. J., E. R. Chavez, and C. F. M. de Lange. 1994. Recovery of amino acids at the
distal ileum for determining apparent and true ileal amino acid digestibilities in

22
growing pigs fed various heat-processed full-fat soybean products. J. Anim. Sci.
72:2029-2037.
Mosenthin, R., W. Sauer, and F. Ahrens. 1994. Dietary pectin’s effect on ileal and fecal
amino acid digestibility and exocrine pancreatic secretions in growing pigs. J.
Nutr. 124:1222-1229.
Nelson, A. I., W. B. Wijeratne, S. W. Yeh, T. M. Wei, and L. S. Wei. 1987. Dry
extrusion as an aid to mechanical expelling of oil from soybeans. J. AOCS.
64:1341-1349.
NRC. 1998. Pages 110-142 in Nutrient Requirements of Swine. 10th rev. ed. Natl. Acad.
Press, Washington, D.C.
Opapeju, F. O., A. Golian, C. M. Nyachoti, and L. D. Campbell. 2006. Amino acid
digestibility in dry extruded-expelled soybean meal fed to pigs and poultry. J.
Anim. Sci. 84:1130-1137.
Parsons, C. M. 2000. Assessment of nutritional quality of soy products for animals.
Page 90-105 in Soy in Animal Nutrition. J. K. Drackley, ed. Federation of Animal
Science Societies, Savoy, IL
Parsons, C. M., K. Hashimoto, K. J. Wedekind, Y. Han, and D. H. Baker. 1992. Effect
of overprocessing on availability of amino acids and energy in soybean meal.
Poultry Sci. 71:133-140.
Parsons, C. M., Y. Zhang, and M. Arabat. 2000. Nutritional evaluation of soybean meals
varying in oligosaccharide content. Poultry Sci. 79:1127-1131.

23
Sardjono, Y. Zhu, and W. Knol. 1998. Comparison of fermentation profile between
lupine and soybean by Aspergillus oryzae and Aspergillus sojae in solid state
culture systems. J. Agric. Food Chem. 46:3376-3380.
Schulze, H., P. van Leeuwen, M. W. A. Verstegen, J. Huisman, W. B. Souffrant, and F.
Ahrens. 1994. Effect of level of dietary neutral detergent fiber on ileal apparent
digestibility and ileal nitrogen losses in pigs. J. Anim. Sci. 72:2362-2368.
Shah, N., A. T. Mokhtar, R. M. Raymond, and P. L. Pellett. 1982. Effect of dietary fibre
components on fecal nitrogen excretion and protein utilization in growing rats. J.
Nutr. 112:658-663.
Smiricky, M. R., C. M. Grieshop, D. M. Albin, J. E. Wubben, V. M. Gabert, and G. C.
Fahey, Jr. 2002. The influence of soy oligosaccharide on apparent and true ileal
amino acid digestibilities and fecal consistency in growing pigs. J. Anim. Sci.
80:2433-2441.
Snyder, H. E., and T. W. Kwon. 1987. Soybean Utilization. Van Nostrand Reinhold
Company, NY.
Sohn, K. S., C. V. Maxwell, L. L. Southern, and D. S. Buchanan. 1994. Improved
soybean protein sources for early-weaned pigs: II. Effects on ileal amino acid
digestibility. J. Anim. Sci. 72:631-637.
Stern, M. D., G. A. Varga, J. H. Clark, J. L. Firkins, J. T. Huber, and D. L. Palmquist.
1994. Evaluation of chemical and physical properties of feeds that affect protein
metabolism in the rumen. J. Dairy Sci. 77:2762-2786.

24
Suarez, F. L., J. Springfield, J. K. Furne, T. T. Lohrmann, P. S. Kerr, and M. D. Levitt.
1999. Gas production in humans ingesting a soybean flour derived from beans
naturally low in oligosaccharides. Am. J. Clin. Nutr. 69:135-139.
Valaja, J., and H. Silijander-Rasi. 2001. Dietary fat supplementation affects apparent
ileal digestibility of amino acids and digesta passage rate of rapeseed meal-based
diets. Page 175-177 in Digestive Physiology of Pigs. J. E. Linberg and B. Ogle.
ed. CABI Publishing, N.Y.
Van Heugten, E. 2001. Mycotoxin and other antinutritional factors in swine feeds.
Pages 563-583 in Swine Nutrition, 2nd ed. A. J. Lewis and L. L. Southern, eds.
CRC Press, N.Y.
Walker, W. R., C. V. Maxwell, F. N. Owens, and D. S. Buchanan. 1986. Milk versus
soybean protein sources for pigs: II. Effects on amino acid availability. J. Anim.
Sci. 63: 513-524.
Woodworth, J. C., M. D. Tokach, R. D. Goodband, J. L. Nelssen, P. R. O’Quinn, D. A.
Knabe, and N. W. Said. 2001. Apparent ileal digestibility of amino acids and the
digestible and metabolizable energy content of dry extruded-expelled soybean
meal and its effects on growth performance of pigs. J. Anim. Sci. 2001. 79:1280-
1287.
Yaklich, R. W. 2001. ß-conglycinin and glycinin in high-protein soybean seeds. J. Agric.
Food. Chem. 49:729-735.
Yang, Y. X., Y. G. Kim, J. D. Lohakare, J. H. Yun, J. K. Lee, M. S. Kwon, J. I. Park,
J.Y. Choi, and B. J. Chae. 2007. Comparative efficacy of different soy protein

25
sources on growth performance, nutrient digestibility, and intestinal morphology
in weaned pigs. Asian-Aust. J. Anim. Sci. 20:775-783.
Yun, J. H., I. K. Kwon, J. D. Lohakare, J. Y. Choi, J. S. Yong, J. Zheng, W. T. Cho, and
N. J. Chae. 2005. Comparative efficacy of plant and animal protein sources on the
growth performance, nutrient digestibility, morphology, and caecal microbiology of
early-weaned pigs. Asian-Aust. J. Anim. Sci. 18:1285-1293.
Zhao, X. T., L. Wang, and H. C. Lin. 2000. Slowing of intestinal transit by fat on –
naloxone-blockable afferent, opioid pathway. Am. J. Physiol. Gastrointest. Liver
Physiol 278: G866-G870.
Zhu, X., D. Li, ., S. Qiao, C. Xiao, Q. Qiao, and C. Gi. 1998. Evaluation of HP 300
soybean in starter pig diets. Asian-Aust. J. Anim. Sci. 11:201-207.
Zuo, Y., G. C. Fahey, Jr., N. R. Merchen, and N. L. Bajjalieh. 1996. Digestion responses
to low oligosaccharide soybean meal by ileally-cannulated dogs. J. Anim. Sci.
74:2441-2449.

26
Table 2.1 CP and AA composition (%) of soy products1, as fed basis
Parameter
CSBM2
Extruded
FFSB3
High
CP
FFSB4
By-
pass
SBM5
Extruded
SPC6 SPI7
HP
3008 FSBM9
CP, % 47.50 35.71 41.87 50.11 66.39 90.23 56.00 50.46
Indispensable AA, %
Arg 3.48 2.56 2.60 3.39 4.53 6.50 3.87 3.57
Hist 1.28 0.92 0.89 1.20 1.70 2.28 1.40 1.34
Ile 2.16 1.51 1.68 2.28 2.83 4.22 2.47 2.38
Leu 3.66 2.59 2.81 4.46 5.00 7.19 4.14 4.12
Lys 3.02 2.14 3.49 2.89 4.05 5.68 3.28 2.98
Met 0.67 0.51 0.93 0.66 0.38 1.30 0.70 0.75
Phe 2.39 1.68 1.88 2.80 3.21 4.66 2.69 2.64
Thr 1.85 1.24 1.36 2.16 2.45 3.37 2.10 2.04
Try 0.65 0.35 - 0.64 - - 0.73 0.66
Val 2.27 2.55 1.80 2.73 2.92 4.37 2.58 2.63
Dispensable AA, %
Ala - 1.33 - - 2.73 3.86 - 2.21
Asp - 3.81 - - 7.54 10.30 - 5.74
Cys 0.74 0.53 0.30 0.73 1.23 0.97 0.75 0.90
Glu - 5.67 - - 11.88 17.52 - 9.00
Gly - 1.26 - - 2.73 3.70 - 2.22
Pro - 1.65 - - 3.39 4.55 - 2.49

27
Ser - 1.59 - - 3.39 4.65 - 2.43
Tyr - 1.29 - - 2.17 3.37 1.99 1.87
1 CSBM =conventional soybean meal; FFSB = full fat soybean; SPC = soy protein
concentrate; SPI = soy protein isolate; HP 300 = Hamlet Protein 300; FSBM = fermented
soybean meal
2 NRC, 1998.
3 Rudolph et al., 1983.
4 Chohan et al., 1993.
5 NRC, 2001..
6 Clapper et al., 2001.
7 Walker et al., 1986.
8 Data from manufacturer; www.hamletprotein.com.
9 Hong et al., 2004.
28
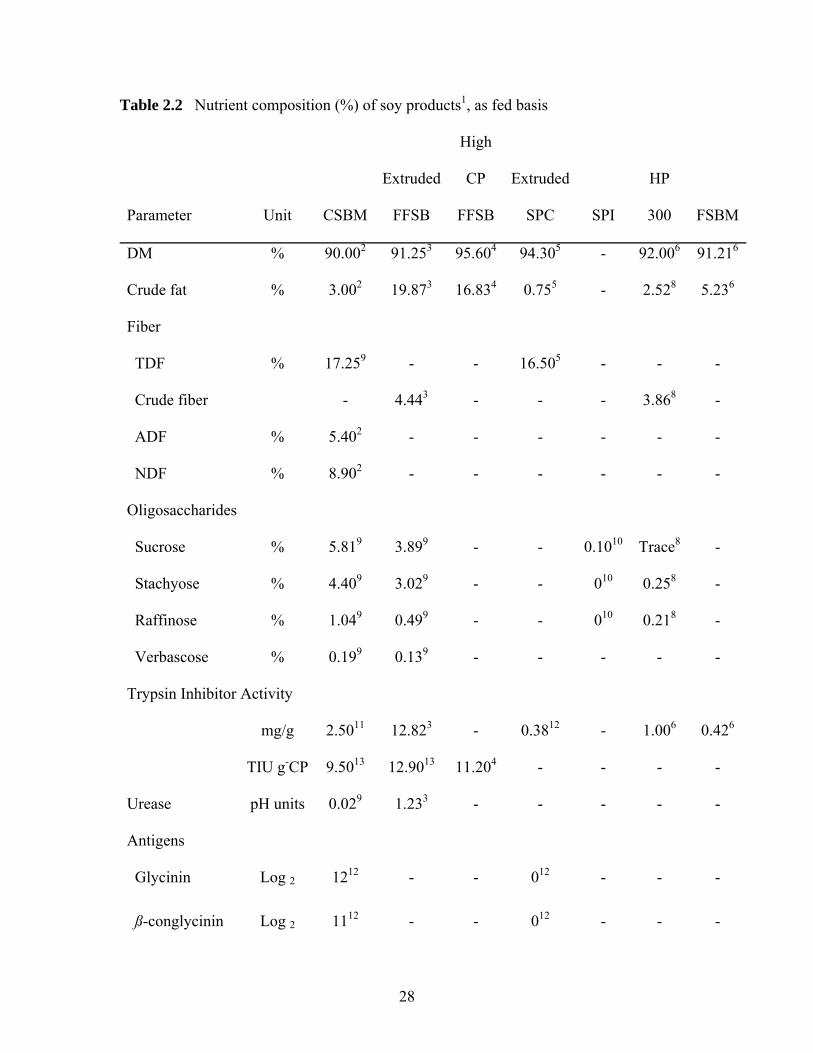
Table 2.2 Nutrient composition (%) of soy products1, as fed basis
Parameter Unit
CSBM
Extruded
FFSB
High
CP
FFSB
Extruded
SPC SPI
HP
300 FSBM
DM % 90.002 91.253 95.604 94.305 - 92.006 91.216
Crude fat % 3.002 19.873 16.834 0.755 - 2.528 5.236
Fiber
TDF % 17.259 - - 16.505 - - -
Crude fiber - 4.443 - - - 3.868 -
ADF % 5.402 - - - - - -
NDF % 8.902 - - - - - -
Oligosaccharides
Sucrose % 5.819 3.899 - - 0.1010 Trace8 -
Stachyose % 4.409 3.029 - - 010 0.258 -
Raffinose % 1.049 0.499 - - 010 0.218 -
Verbascose % 0.199 0.139 - - - - -
Trypsin Inhibitor Activity
mg/g 2.5011 12.823 - 0.3812 - 1.006 0.426
TIU g-CP 9.5013 12.9013 11.204 - - - -
Urease pH units 0.029 1.233 - - - - -
Antigens
Glycinin Log 2 1212 - - 012 - - -
ß-conglycinin Log 2 1112 - - 012 - - -

29
ppm - - - - - 2.006 -
1 CSBM = conventional soybean meal; FFSB = full fat soybean; SPC = soy
protein concentrate; SPI = soy protein isolate; HP 300 = Hamlet Protein 300; FSBM =
fermented soybean meal
2 NRC, 1998
3 Rudolph et al., 1983
4 Chohan et al., 1993
5 Clapper et al., 2001
6 Data from manufacturer; www.hamletprotein.com
7 Hong et al., 2004
8 Jiang et al., 2006
9 Grieshop et al., 2003
10 Eldridge et al., 1979
11 Herkelman et al., 1992
12 Friesen et al., 1993; values of glycinin and ß-conglycinin for conventional
soybean meal is based on soy flakes
13 Marty et al., 1994

30
CHAPTER 3
Ileal amino acid digestibility of high protein soybeans, conventional soybeans, and
soybean meal and soy protein concentrate without and with added oil fed to growing
pigs
ABSTRACT. A study was conducted to measure the apparent (AID) and standardized
(SID) ileal digestibility of CP and AA in a new high protein variety of soybeans
(SSeed.HP 290) fed to growing pigs and compare these values to the AID and SID of CP
and AA in conventional full fat soybeans (FFSB), soybean meal (SBM), and soy protein
concentrate (SPC). A second objective of the study was to evaluate the effect of oil
addition on CP and AA digestibility in SBM and SPC. Four cornstarch-based diets were
prepared using each soy product as the sole source of CP and AA. Two additional diets
were formulated by adding soybean oil (7.55 and 7.35%, respectively) to SBM and SPC.
A N-free diet was also used to measure basal endogenous losses of CP and AA. Before
the experiment, SSeed.HP 290 and FFSB were extruded at 150oC. Seven growing
barrows (initial BW: 26.2 ± 2.24 kg) were fitted with a T-cannula in the distal ileum and
allotted to a 7 x 7 Latin square design with 7 diets and 7 periods. Ileal digesta were
collected from the pigs on d 6 and 7 of each period. All digesta samples were lyophilized
and analyzed for DM, CP, AA, and chromium, and values for AID and SID of CP and
AA were calculated. Results of the experiment showed that the SID for 6 of the
indispensable AA in SSeed.HP290 were greater (P < 0.05) than in conventional FFSB
and the SID for all indispensable AA except Met, were greater (P < 0.05) in SSeed.HP
290 than in SBM. However, the SID for most AA in SSeed.HP 290 were similar to SBM

31
with oil and SPC, but these values were lower (P < 0.05) than in SPC with oil. Except for
the SID of Lys, Phe, Trp, and Met, the SID of the indispensable AA were not different
among conventional FFSB, SBM, and SBM with oil. The addition of oil improved (P <
0.05) the SID for most indispensable AA in SBM and SPC. In conclusion, the SID of
AA in Seed.HP 290 were greater than in SBM and similar to conventional FFSB and
SPC. The addition of oil improved the SID of most AA in SBM and SPC fed to growing
pigs.
Keywords: amino acids, digestibility, high protein soybean, oil, pigs, soybean meal
INTRODUCTION
New varieties of soybeans are constantly being developed for agronomic or
nutritional reasons. Soybeans that are free of lectin and kunitz trypsin inhibitors have
been developed and evaluated (Palacios et al., 2004). Recently, a high CP variety of
soybeans was developed (SSeed.HP 290; Shillinger Seed, Des Moines, IA). This variety
provides greater concentrations of CP and AA than regular soybeans in diets fed to pigs,
but the digestibility of AA in SSeed.HP 290 has not yet been measured.
Full fat soybeans (FFSB) have a high CP and lipid concentration that contribute
significant amounts of energy and protein to compound feeds (Zarkadas and Wiseman,
2005), but soybean meal (SBM) is the most popular source of protein in diets fed to
animals (Baker, 2000). Soy protein concentrate (SPC) is also used in animal feeding and
the AA in SPC are considered more digestible than in SBM (NRC, 1998). However, it is
not known if the AA in SSeed.HP 290 are more or less digestible than AA in SBM and
SPC.
32
One of the differences between FFSB and SBM is the concentration of oil
(Cromwell, 2000). Studies that evaluated the effect of oil on AA digestibility are few (Li
and Sauer, 1994; Jørgensen et al., 1985; Albin et al., 2001) and these studies measured
apparent ileal digestibility (AID) of AA. However, standardized ileal digestibility values
(SID) for CP and AA take into account the AA contributions that are of endogenous
origins and is, therefore, a more accurate estimate of the digestibility of AA in a feed
ingredient (Stein et al., 2007). But limited information is available on the effect of fat
addition on the SID of AA in SBM and SPC. The objective of this experiment was to
measure the AID and SID of CP and AA in SSeed.HP 290 and compare these values to
values obtained in commercial sources of FFSB, SBM, and SPC. A second objective was
to evaluate the effect of oil addition to SBM and SPC on AA digestibility.
MATERIALS AND METHODS
Animals, Housing, and Experimental Design
Seven growing barrows (initial BW: 26.2 ± 2.2 kg) originating from the matings
of SP-1 boars to line 13 sows (Ausgene Intl. Inc, Gridley, IL) were equipped with a T-
cannula in the distal ileum using the method described by Stein et al. (1998). After
surgery, pigs were transferred to individual pens (1.2 x 1.8 m) in a temperature controlled
room (22oC) where they were allowed to recover for 14 d. A standard corn-soybean meal
diet (16% CP) was provided on an ad libitum basis during this time. Pigs were then
allotted to a 7 X 7 Latin square design with pigs and periods comprising the rows and
columns, respectively. The animal part of the study was conducted at South Dakota State
University, and the experiment was approved by the Institutional Animal Care and Use
Committee at South Dakota State University.
33
Ingredients, Diets, and Feeding
Four soybean products were used in this experiment (Table 1). The 4 sources
were a high protein FFSB (SSeed.HP 290), a conventional source of FFSB, conventional
SBM, and a commercial source of SPC (Profine E, Central Soya Co. Inc., Fort Wayne,
IN). The conventional FFSB and SBM were obtained locally. Before the experiment,
both sources of FFSB were ground and extruded at 150 to 160oC using an Insta Pro
extruder, Model 2500 (Insta Pro, Des Moines, IA). Immediately following extrusion,
beans were cooled to 43oC using a tumble drum cooler (Insta Pro, Des Moines, IA).
Seven diets were formulated (Tables 2 and 3). Four diets contained each of the
soybean products as the only protein and AA source. Two additional diets were
formulated by adding soybean oil to the diets containing SBM and SPC, respectively, to
bring the total concentration of ether extract in those diets close to the concentrations in
the 2 diets containing FFSB. A N-free diet was used to measure basal ileal endogenous
losses of AA. Chromic oxide was included (0.40%) in all diets as an inert marker.
Feed was provided in quantities equal to 3 times the estimated daily maintenance
energy requirement of the pigs (106 kcal ME per kg 0.75; NRC, 1998). The daily
allotment of feed was divided into 2 equal meals that were provided at 0830 and 1600.
Water was available at all times.
Data and Sample Collection
Pig BW were recorded at the beginning of the experiment and at the end of each
period. Each period lasted 7 d and pigs were allowed to adapt to their diet during the
initial 5 d. On d 6 and 7, ileal digesta were collected for 8 h. A 225-ml plastic bag was
attached to the cannula barrel using a cable tie and digesta flowing into the bag were

34
collected. Bags were removed every 30 min and replaced with a new one. Digesta were
immediately stored at –20oC to prevent bacterial degradation of the AA in the digesta.
Ileal samples obtained over the 2-d collection period were thawed, mixed within animal
and diet, and a sub-sample was collected for chemical analysis. A sample of each diet
and of each of the protein sources was collected as well. Digesta samples were
lyophilized and finely ground prior to chemical analysis.
Chemical Analysis
The soy products were analyzed for urease activity (procedure Ba9-58; AOCS,
1998) and NDF using the procedure of Holst (1973). Sucrose, raffinose, and stachyose
were analyzed using the procedure of Janauer and Englmaier (1978). All soy products
and diets were also analyzed for ether extract (procedure 4.5.01; AOAC, 2000), DM
(procedure 4.1.06; AOAC, 2000), and CP (procedure 4.2.08; AOAC, 2000). Ileal
digesta samples were also analyzed for DM and CP. Amino acids were analyzed in all
samples on a Beckman 6300 Amino Acid Analyzer (Beckman Instruments Corp., Palo
Alto, CA) using ninhydrin for postcolumn derivatization and norleucine as the internal
standard. Prior to analysis, samples were hydrolyzed with 6 N HCL for 24 h at 110oC
(procedure 4.1.11, alternative 3; AOAC, 1998). Methionine and Cys were determined as
Met sulfone and cysteic acid respectively, after cold performic acid oxidation overnight
prior to hydrolysis (procedure 4.1.11, alternative 1; AOAC, 1998). Tryptophan was
determined after NaOH hydrolysis for 22 h at 110oC (procedure 45.4.04; AOAC, 2000).
Chromium concentrations of diets and ileal digesta were determined after nitric acid-
perchloric acid wet ash sample preparation (procedure 9.2.39; AOAC 2000).

35
Calculations
Apparent ileal digestibility values for AA in samples obtained from feeding the
protein-containing diets were calculated using equation [1] (Stein et al., 2007):
AID = (1 – [(AAd/AAf) x (Crf/Crd)] x 100 % [1]
where AID is the apparent ileal digestibility of an AA (%), AAd is the concentration of
that AA in the ileal digesta DM, AAf is the AA concentration of that AA in the feed DM,
Crf is the chromium concentration in the feed DM, and Crd is the chromium
concentration in the ileal digesta DM. The AID for CP was also calculated using this
equation.
The basal endogenous flow to the distal ileum of each AA was determined based
on the flow obtained after feeding the N-free diet using equation [2] (Stein et al., 2007):
IAAend = [ AAd x (Crf/Crd)] [2]
where IAAend is the basal endogenous loss of an AA (g per kg DMI). The basal
endogenous loss of CP was determined using the same equation.
By correcting the AID for the IAAend of each AA, standardized ileal AA
digestibility values were calculated using equation [3] (Stein et al., 2007):
SID = AID + [(IAAend/AAf) x 100] [3]
where SID is the standardized ileal digestibility value (%).
Concentrations of standardized ileal digestible AA in each protein source were
calculated using equation [4]:
Digestible AA (g/kgDM)= [AAing x (SID/100)] [4]
where AAing is the AA concentration (g/kg DM) in the protein source. The concentration
of standardized ileal digestible protein was also calculated using this equation.

36
Statistical Analysis
Data were analyzed using the MIXED procedure of SAS (SAS Inst. Inc., Cary,
NC). The UNIVARIATE procedure of SAS was used to confirm the homogeneity of the
variance. Outliers were determined as values that were more than 3 SD above or below
the mean. No outliers were identified. An analysis of variance was conducted with diet as
the fixed effect and pig and period as random effects. Whenever differences were
detected, treatment means were separated using the Least Significant Difference test of
PROC MIXED. Orthogonal contrasts were used to compare SBM and SPC vs. SBM
with oil and SPC with oil to determine the effect of oil addition on AA digestibility. The
pig was the experimental unit for all analyses and an alpha value of 0.05 was used to
assess significance among treatments.
RESULTS
The CP and AA concentrations were greater in SSeed.HP 290 compared with
conventional FFSB and SBM (Table 3.1). However, the concentration of ether extract
was lower in SSeed.HP 290 than in conventional FFSB. Soybean meal contained more
CP and AA than conventional FFSB, but the concentration of CP and AA in SPC was
greater than in the other soybean sources. The concentration of NDF was greater in SBM
than in the other protein sources. The concentration of sucrose, raffinose, and stachyose
were lower in SPC compared with the other soybean products, but the concentration of
sucrose was similar between SBM and conventional FFSB. However, these values were
greater than in SSeed.HP 290. The concentration of raffinose was lower in conventional
FFSB than in SSeed.HP 290, but the stachyose concentration was not different for FFSB
and SBM. The urease activity was within the range of 0.05 to 0.20 for all samples.

37
The AID for CP in SSeed.HP 290 (81.0%) was similar to the AID in SPC with oil
(81.5%) and both of these values were greater (P < 0.05) than the AID obtained for the
other diets (Table 3.4). The AID for CP in SBM (68.1%) and SBM with oil (71.5%)
were similar and these values were lower (P < 0.05) than the AID for CP in FFSB
(76.4%). However, the AID for CP in FFSB and SBM with oil were similar to SPC
(75.4%).
For most AA, no differences in the AID were observed among SSeed.HP 290,
SPC, and SPC with oil. However, the AID for most AA in SBM, and SBM with oil was
lower (P < 0.05) than in SSeed.HP 290, SPC, and SPC with oil. The AID for 6 of the 10
indispensable AA (Arg, His, Ile, Leu, Phe, and Val) was greater (P < 0.05) in SSeed.HP
290 than in conventional FFSB, but the AID for most AA in conventional FFSB was
similar to SBM and SBM with oil. Diets containing SPC and SPC with oil had greater (P
< 0.05) AID for most indispensable AA compared with conventional FFSB, but the AID
for most dispensable AA in conventional FFSB were similar to the SPC-containing diets.
The addition of oil to SBM and SPC improved (P < 0.05) the AID of most
indispensable AA. Among the dispensable AA, only the AID for Ala, Cys, and Glu were
improved (P < 0.05) by oil addition.
The SID for CP in SBM (84.8%) was lower (P < 0.05) than in all other diets, and
the SID for CP in SPC plus oil (97.6%) was greater (P < 0.05) than in all other diets
except the value (94.1%) obtained for SSeed.HP 290 (Table 3.5). The SID for most AA
in SSeed.HP 290 were similar to SBM with oil and SPC, but these values were lower (P
< 0.05) than in SPC with added oil. The SID for Ile, Leu, Phe, Val, Ser, and Tyr in
SSeed.HP 290 were greater (P < 0.05) than in conventional FFSB, but the SID for the

38
remaining AA where not different between the 2 sources of FFSB. The SID for most of
the indispensable AA in conventional FFSB were similar to SBM and SBM plus oil. The
SID of Lys, Phe, and Trp were greater (P < 0.05) in conventional FFSB than in SBM, but
the SID of Met was lower (P < 0.05) in conventional FFSB compared with SBM plus oil.
However, for the remaining indispensable AA, no differences among these 3 diets were
observed. The SID for most AA in SPC and SPC plus oil were greater (P < 0.05) than
for conventional FFSB and SBM. The addition of oil improved (P < 0.05) the SID for
most indispensable AA in SBM and SPC, but greater improvements were observed for
SBM than for SPC.
Among all ingredients, conventional FFSB had the lowest (P < 0.05)
concentration (352 g) of SID CP (Table 3.6). The concentration of SID CP in SSeed.HP
290 (472 g) was greater (P < 0.05) than in SBM (406 g) and SBM with oil (430 g). Soy
protein concentrate had a greater (P < 0.05) concentration (652 g) of SID CP than
SSeed.HP 290, but SPC with oil (691 g) had the greatest (P < 0.05) concentration of SID
CP among all treatments.
Concentration of most of the digestible AA in SSeed.HP 290 were greater (P <
0.01) than in conventional FFSB, SBM, and SBM with oil, but the concentration of
digestible Lys in SSeed.HP 290 was similar to SBM and SBM with oil. In contrast, the
concentration of digestible Met and Trp were lower (P < 0.05) in SSeed.HP 290 than in
SBM and SBM with oil. The concentration of digestible Thr in SSeed.HP 290, however,
was similar to SBM, but lower (P < 0.05) than in SBM with oil. The concentration of
digestible AA in SSeed.HP 290 were lower (P < 0.01) than in SPC and SPC with oil, but
conventional FFSB had the lowest (P < 0.05) concentration of digestible AA among all
39
diets. The concentration of digestible Ile, Leu, Met, Trp, and Val was greater (P < 0.01)
in SBM with oil than in SBM, but for the remaining indispensable AA, no differences
between these 2 diets were observed. Soy protein concentrate had a greater (P < 0.01)
concentration of digestible AA than SBM with oil, and the addition of oil to SPC
increased (P < 0.01) the concentrations of all indispensable AA except Met and Phe.
Therefore, SPC with oil had a greater (P < 0.05) concentration of digestible AA than all
other diets.
DISCUSSION
Composition of Ingredients
To increase the feeding value of soybeans, varieties with increased concentration
of CP or reduced concentration of trypsin inhibitors and oligosaccharides have been
selected. The SSeed.HP 290 variety was selectively bred for greater concentration of CP.
The increase in CP was achieved partly at the expense of ether extract that was reduced in
SSeed.HP 290 compared with conventional FFSB. The negative correlation of soybean
protein to seed oil and yield are the major obstacles that hinder the development of high
CP soybeans for commercial use because soybeans are traded on a weight basis and high
CP lines often have a lower yield and contain less oil (Yaklich, 2001). The CP
concentration of soybeans is also negatively correlated with the concentration of sucrose
but positively correlated with the concentration of stachyose (Hartwig et al., 1997). This
inverse relationship between protein and sucrose concentration explains the lower sucrose
concentration in SSeed.HP 290 than in conventional FFSB, but the stachyose
concentration was similar between the 2 soybean varieties. The stachyose concentration

40
in high protein soybeans averaged 4.13% (Hartwig et al., 1997), which is close to the
value obtained in this study for both SSeed.HP 290 and conventional FFSB.
Aqueous alcohol extraction removes the sucrose, raffinose, and stachyose from
defatted soy flakes (Eldridge et al., 1979). The concentrations of oligosaccharides in SPC
are, therefore, lower than in SBM. The concentration of sucrose, raffinose, and stachyose
in SPC and SBM were within the range of values reported in other studies (Eldridge et
al., 1979; Bach Knudsen, 1997, Grieshop et al., 2003).
The fiber in soybean is mainly present in the seed coat. The fiber in the seed coat
contains approximately 80% polysaccharides, which can be separated into cellulose,
hemicellulose, and pectin on the basis of solubility (Stombaugh et al., 2000). Seed coat
contribution to the total seed weight is relatively constant. Although the increase in the
concentration of CP results in a reduction in ether extract, the combined concentration of
CP and ether extract increases, therefore, the fiber and carbohydrate components decrease
when the soybeans are selected for high protein concentration (Hartwig et al., 1997). This
may explain the lower concentration of NDF in SSeed.HP 290 than in conventional
FFSB. On the other hand, the extraction of fat from the soybean seed results in a greater
concentration of NDF in SBM than in FFSB and the values for NDF obtained in this
study are similar to the values reported by Edwards et al. (2000), but lower than the
values reported by Grieshop et al. (2003). Genotypic variation may account for the
difference in the polysaccharides present in the seed coat (Stombaugh et al., 2000).
The CP and AA concentration in conventional FFSB and SBM used in this study
were similar to the values reported by NRC (1998) and from other studies (Kim et al.,
2000; Clapper et al., 2001; Grieshop et al., 2003). However, the AA concentration in

41
SPC was slightly lower than the values reported by NRC (1998) but similar to the values
reported by Clapper et al. (2001). Differences in processing methods during the
production of SPC may result in SPC with different characteristics (Berk, 1992).
Comparison of SSeed. HP290 and other Soy Products
The total concentration of AA in SSeed.HP 290 was 25% greater than in
conventional FFSB, which indicates that this new variety of soybeans may have a greater
feeding value than conventional FFSB. Among the indispensable AA, Arg and His
concentrations had the greatest improvement (28%). The concentration of Arg usually
increases with increasing CP concentration (Krishnan et al., 2007). In contrast, the
concentration of Trp usually decreases with increasing CP concentration (Krishnan et al.,
2007); however, in this study, no difference in Trp concentration was observed between
SSeed.HP 290 and conventional FFSB. Among the dispensable AA, Glu followed by
Asp had the greatest increase in concentration (30%) and this is consistent with the
observation of Zarkadas et al., (1993) who reported that Glu and Asp are the most
abundant AA in FFSB comprising 26-28% of the CP in soybeans regardless of cultivar.
The concentration of Met and Cys in SSeed.HP 290 was only 8% greater than in
conventional FFSB.
The lack of a difference in AID and SID of most AA between SSeed.HP 290 and
conventional FFSB is consistent with the findings of Marty and Chavez (1994) who
reported that the AID of AA in 3 soybean cultivars were similar. Although there is no
difference in the SID of AA between SSeed.HP 290 and FFSB, the concentration of SID
AA in SSeed.HP 290 was greater than in FFSB because of the greater concentration of

42
AA in SSeed.HP 290 compared with FFSB. Using SSeed.HP 290 instead of FFSB will,
therefore, increase the contribution of digestible AA to the diet.
Effect of Oil Addition to SBM and SPC
The increased AID and SID of AA when oil was included in the diet may be due
to slower gastric emptying, which increase the time that feed proteins are exposed to
proteolytic enzymes (Gentilcore et al., 2006). The presence of fat in the small intestine
may also reduce the passage rate of the ingested feed (Valaja and Silijander-Rasi, 2001).
This may provide a longer time for AA and peptides to be absorbed (Zhao et al., 2000).
Addition of graded levels of canola oil to SBM resulted in a linear improvement
in the AID of most AA (Li and Sauer, 1994), but both linear and quadratic improvements
were observed in other studies upon oil addition (Imbeah and Sauer, 1991; Albin et al.,
2001). Thus, the results of this experiment showing an increase in AID of AA in SBM
when oil was added to the diet agree with previous reports. However, results from the
present experiment also demonstrated that the SID for AA in SBM improved by the
addition of oil. To our knowledge, this is the first study to report on the effect of oil on
the SID of AA in SBM. The results of this study also showed that the AID and SID of
AA in a highly digestible protein source such as SPC will increase when oil is added to
the diet.
Previous studies have shown that the digestibility of AA in FFSB is lower than in
SBM with added oil (Fan et al., 1995; Marty et al., 1994; Bruce et al., 2006). The reason
for the reduced digestibilities has been attributed to greater concentration of trypsin
inhibitors (Fan et al., 1995) and soy hulls (Bruce et al., 2006) in FFSB than in SBM. It
has also been reported that the FFSB induces a greater endogenous Lys loss than SBM

43
with added oil (Marty et al., 1994). In the present experiment, there were no differences
in AA digestibility between FFSB and SBM with added oil. The SBM used in this
experiment was not dehulled and the concentration of hulls was expected to be similar in
SBM and FFSB. In addition, both FFSM and SBM were adequately heated as reflected
by their urease activity which is within the range of 0.05 to 0.20, the generally acceptable
index for adequate cooking of SBM (Parson, 2000).
Based on these observations, it is concluded that the major reason for the
increased digestibility of AA in both sources of FFSB as compared with SBM was the
presence of more oil in FFSB. When oil was added to SBM, the digestibility increased to
a level that was similar to the digestibility in FFSB.

44
LITERATURE CITED
Albin, D. M., M. R. Smiricky, J. E. Wubben, and V. M. Gabert. 2001. The effect of
dietary level of soybean oil and palm oil on apparent ileal amino acid digestibility
and postprandial flow patterns of chromic oxide and amino acids in pigs. Can. J.
Anim. Sci. 81:495-503.
AOAC. 1998. Official Methods of Analysis. 16th ed. Assoc. Anal. Chem., Arlington,
VA.
AOAC. 2000. Official Methods of Analysis. 17th ed. Assoc. Anal. Chem., Gaithersburg,
MD.
AOCS, 1998. Official methods and recommended practices of the AOCS. 5th ed.
American Oil Chemist’s Society, Champaign, IL.
Bach Knudsen, K. E. 1997. Carbohydrate and lignin contents of plant materials used in
animal feeding. Anim. Feed Sci. Technol. 67:319-338.
Baker, D. H. 2000. Nutritional constraints to use of soy products by animals. Page 1-12
in Soy in Animal Nutrition. J. K. Drackley, ed. Federation of Animal Science
Societies, Savoy, IL.
Berk, Z. 1992. Technology of production of edible flours and protein products from
soybean. http://www.fao.org/docrep/t0532e/t0532e00.htm Accessed Nov. 20,
2006.
Bruce, K. J., L. K. Karr-Lilienthal, K. E. Zinn, L. L. Pope, D. C. Mahan, N. D. Fastinger,
M. Watts, P. L. Utterback, C. M. Parsons, E. O. Castaneda, M. Ellis, and G. C.
Fahey, Jr. 2006. Evaluation of the inclusion of soybean oil and soybean

45
processing by-products to soybean meal on nutrient composition and digestibility
in swine and poultry J. Anim. Sci. 84: 1403-1414.
Clapper, G. M., C. M. Grieshop, N. R. Merchen, J. C. Russet, J. L. Brent, and G. C.
Fahey. 2001. Ileal and total tract digestibilities and fecal characteristics of dogs
as affected by soybean protein inclusion in dry, extruded diets. J. Anim. Sci.
79:1523-1532.
Cromwell, G. L. 2000. Utilization of soy products in swine diets. Page 274-280 in Soy
in Animal Nutrition. J. K. Drackley, ed. Federation of Animal Science Societies,
Savoy, IL.
Edwards, H. M., M. W. Douglas, C. M. Parsons, and D. H. Baker. 2000. Protein and
energy evaluation of soybean meals processed from genetically modified high
protein soybeans. Poult. Sci. 79:525-527.
Eldridge, A. C., L. T. Black, and W. J. Wolf. 1979. Carbohydrate composition of
soybean flours, protein concentrates, and isolates. J. Agric. Food Chem. 24:799-
802.
Fan, M. Z., W. C. Sauer, and C. F. M. de Lange. 1995. Amino acid digestibility in
soybean meal, extruded soybean and full-fat canola for early-weaned pigs. Anim.
Feed Sci. Technol. 52:189-203.
Gentilcore, D., R. Chaikomin, K. L. Jones, A. Rusco, C. Feinle-Bisset, J. M. Wishart, C.
K. Rayner, and M. Horitz. 2006. Effect of fat on gastric emptying of and the
glycemic, insulin, and incretin responses to a carbohydrate meal and Type 2
diabetes. J. Clin. Endocrinol. Metab. 91:2062-2067.

46
Grieshop C. M., C. T. Kadzere, G. M. Clapper, E. A. Flickinger, L. L. Bauer, R. L.
Frazier, and G. C. Fahey. 2003. Nutritional characteristics of United States
soybeans and soybean meals. J. Agric. Food Chem. 51:7684-7691.
Hartwig, E. E., T. M. Kuo, and M. M. Kenty. 1997. Seed protein and its relationship to
soluble sugars in soybean. Crop Sci. 37:770-778.
Holst, D. O. 1973. Holst filtration apparatus for Van Soest detergent fiber analysis. J.
AOAC. 56:1352-1356.
Imbeah M., and W. C. Sauer. 1991. The effect of dietary level of fat on amino acid
digestibilities in soybean meal and canola meal and on rate of passage in growing
pigs. Livest. Prod. Sci. 29:227-239.
Janauer, G. A., and P. Englmaier. 1978. Multi-step time program for the rapid gas-liquid
chromatography of carbohydrates. J. Chromatogr. 153:539-542.
Jørgensen, H., J. A. Fernandez, and A. Just. 1985. The effect of dietary fat and mineral
level on the site of absorption of some nutrient at different levels of crude fiber
and crude protein. Pages 356-359 in Proc. 3rd Int. Seminar Digestive Physiol. in
the Pig. H. Jørgensen, J. A. Fernandez, and A. Just, ed. Copenhagen, Denmark.
Kim, I. H., J. D. Hancock, R. H. Hines, and T. L. Gugle. 2000. Roasting and extruding
affect nutrient utilization from soybeans in 5 and 10 kg nursery pigs. Asian-Aust.
J. Anim. Sci. 132:200-206.
Krishnan, H. B., S. S. Natarajan, A. A. Mahmoud, and R. L. Nelson. 2007.
Identification of glycinin and β-conglycinin subunits that contribute to the
increased protein content of high-protein soybean lines. J. Agric. Food Chem.
55:1839-1845.

47
Li, S., and W. C. Sauer. 1994. The effect of dietary fat content on amino acid digestibility
in young pigs. J. Anim. Sci. 72: 1737-1743.
Marty, B. J, E. R. Chavez, and C. F. M. de Lange. 1994. Recovery of amino acids at the
distal ileum for determining apparent and true ileal amino acid digestibilities in
growing pigs fed various heat-processed full-fat soybean products. J. Anim. Sci.
72:2029-2037.
Marty, B. J., and E. R. Chavez. 1994. Apparent digestibility of protein and amino acids
at the distal ileum and of protein and energy over the whole tract in several
extruded soybean cultivars for pigs. Can. J. Anim. Sci. 74:675-678.
NRC. 1998. Pages 110-142 in Nutrient Requirements of Swine. 10th rev. ed. Natl. Acad.
Press, Washington, D.C.
Palacios, M. F., R. A. Easter, K. T. Soltwedel, C. M. Parsons, M. W. Douglas, T.
Hymowitz, and J. E. Pettigrew. 2004. Effect of soybean variety and processing
on growth performance of young chicks and pigs. J. Anim. Sci. 82:1108-1114.
Parsons, C. M. 2000. Assessment of nutritional quality of soy products for animals.
Page 90-105 in Soy in Animal Nutrition. J. K. Drackley, ed. Federation of
Animal Science Societies, Savoy, IL.
Stombaugh, S. K., H. G. Jung, J. H. Orf, and D. A. Somers. 2000. Genotypic and
environmental variation in soybean seed cell wall polysaccharides. Crop Sci.
40:408-412.
Stein, H. H., B. Sève, M. F. Fuller, P. J. Moughan, and C. F. M. de Lange. 2007. Invited
review: Amino acid bioavailability and digestibility in pig feed ingredients:
Terminology and application. J. Anim. Sci. 85:172-180.

48
Stein, H. H., C. F. Shipley, and R. A. Easter. 1998. Technical Note: A technique for
inserting a T-cannula into the distal ileum of pregnant sows. J. Anim. Sci.
76:1433-1436.
Valaja, J., and H. Silijander-Rasi. 2001. Dietary fat supplementation affects apparent
ileal digestibility of amino acids and digesta passage rate of rapeseed meal-based
diets. Page 175-177 in Digestive Physiology of Pigs. J. E. Linberg and B. Ogle.
ed. CABI Publishing, N.Y.
Yaklich, R. W. 2001. β-conglycinin and glycinin in high-protein soybean seeds. J.
Agric. Food Chem. 49:729-735.
Zarkadas, C. G., Z. Yu, H. D. Voldeng, and A. Minero-Amador. 1993. Assessment of
the protein quality of a new high protein soybean cultivar by amino acid analysis.
J. Agric. Food Chem. 41:616-623.
Zarkadas, L. N., and J. Wiseman. 2005. Influence of processing of full fat soya beans
included in diets for piglets: II. Digestibility and intestinal morphology
Anim. Feed Sci. Technol. 118: 121-137
Zhao, X. T., L. Wang, and H. C. Lin. 2000. Slowing of intestinal transit by fat on –
naloxone-blockable afferent, opioid pathway. Am. J. Physiol. Gastrointest. Liver
Physiol 278: G866-G870.

Table 3.1. Analyzed nutrient composition of SSeed.HP 290, extruded full fat soybeans
(FFSB), soybean meal (SBM), and soy protein concentrate (SPC), as-fed basis
Item Ingredient: SSeed. HP290 FFSB SBM SPC
DM, % 94.91 93.43 89.60 90.55
CP, % 47.64 35.78 42.92 64.15
Ether extract, % 16.40 20.80 1.53 0.11
NDF, % 8.68 9.75 11.26 9.34
Sucrose, % 4.69 7.30 8.14 0.70
Raffinose, % 1.19 0.73 0.99 0.15
Stachyose, % 4.11 4.07 4.51 0.86
Urease Activity,1 pH rise 0.12 0.10 0.18 0.12
Indispensable AA, %
Arg 3.83 3.00 3.00 4.70
His 1.24 0.98 1.15 1.69
Ile 2.02 1.64 1.83 2.94
Leu 3.43 2.76 3.24 5.00
Lys 2.81 2.35 2.74 4.05
Met 0.64 0.59 0.67 0.94
Phe 2.31 1.84 2.14 3.23
Thr 1.66 1.39 1.69 2.47
Trp 0.33 0.33 0.56 0.81
Val 2.16 1.77 1.97 3.11

50
Dispensable AA, %
Ala 1.89 1.57 1.86 2.77
Asp 5.25 4.08 4.8 7.29
Cys 0.66 0.61 0.68 0.92
Glu 8.31 6.39 7.48 11.36
Gly 1.89 1.54 1.8 2.72
Pro 2.17 1.7 2.0 3.04
Ser 2.21 1.74 2.18 3.17
Tyr 1.63 1.33 1.56 2.27
Total AA, % 44.43 35.17 41.35 62.49
1 Urease activity was measured in the 2 sources of FFSB after extrusion.
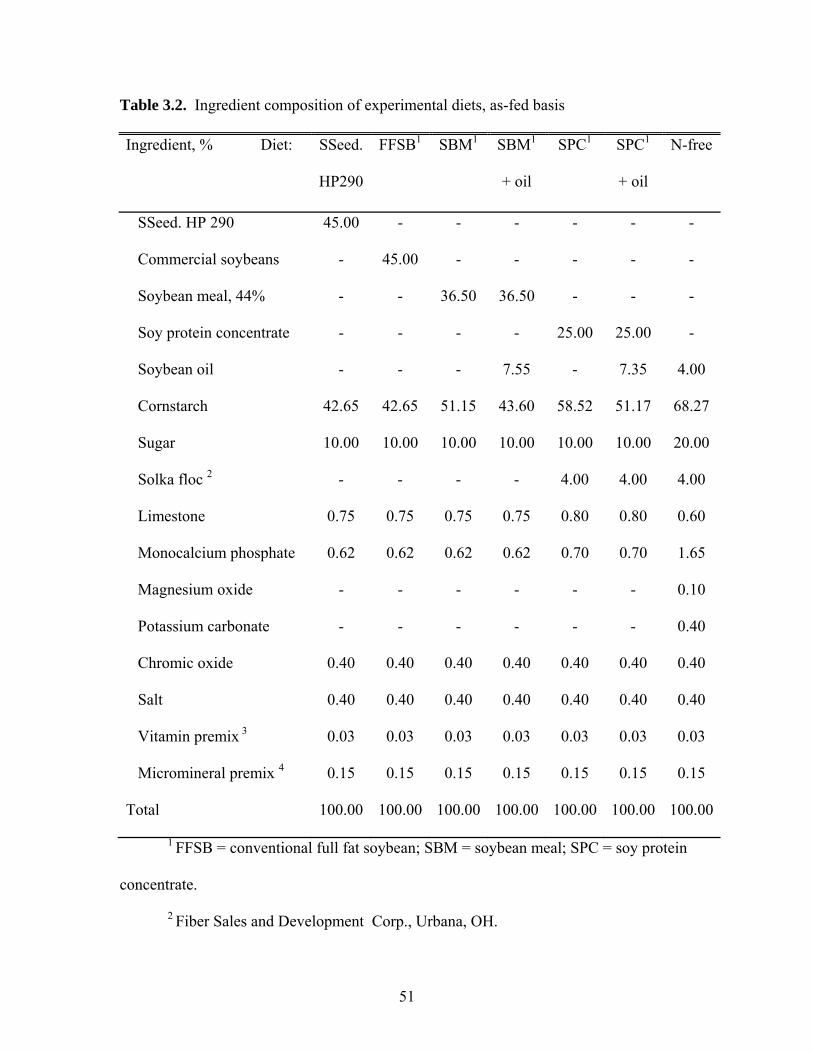
51
Table 3.2. Ingredient composition of experimental diets, as-fed basis
Ingredient, % Diet: SSeed.
HP290
FFSB1 SBM1 SBM1
+ oil
SPC1 SPC1
+ oil
N-free
SSeed. HP 290 45.00 - - - - - -
Commercial soybeans - 45.00 - - - - -
Soybean meal, 44% - - 36.50 36.50 - - -
Soy protein concentrate - - - - 25.00 25.00 -
Soybean oil - - - 7.55 - 7.35 4.00
Cornstarch 42.65 42.65 51.15 43.60 58.52 51.17 68.27
Sugar 10.00 10.00 10.00 10.00 10.00 10.00 20.00
Solka floc 2 - - - - 4.00 4.00 4.00
Limestone 0.75 0.75 0.75 0.75 0.80 0.80 0.60
Monocalcium phosphate 0.62 0.62 0.62 0.62 0.70 0.70 1.65
Magnesium oxide - - - - - - 0.10
Potassium carbonate - - - - - - 0.40
Chromic oxide 0.40 0.40 0.40 0.40 0.40 0.40 0.40
Salt 0.40 0.40 0.40 0.40 0.40 0.40 0.40
Vitamin premix 3 0.03 0.03 0.03 0.03 0.03 0.03 0.03
Micromineral premix 4 0.15 0.15 0.15 0.15 0.15 0.15 0.15
Total 100.00 100.00 100.00 100.00 100.00 100.00 100.00
1 FFSB = conventional full fat soybean; SBM = soybean meal; SPC = soy protein
concentrate.
2 Fiber Sales and Development Corp., Urbana, OH.

52
3 The vitamin premix provided the following quantities of vitamins per kilogram of
complete diet: Vitamin A, 6,594 IU as vitamin A acetate; vitamin D3, 989 IU as D-activated
animal sterol; vitamin E, 33 IU as alpha tocopherol acetate; vitamin K3, 2.6 mg as
menadione dimethylpyrimidinol bisulphite; thiamin, 2.0 mg as thiamine mononitrate;
riboflavin, 5.9 mg; Pyridoxine, 2.0 mg as pyridoxine hydrochloride; vitamin B12, 0.026 mg;
D-pantothenic acid, 20 mg as calcium pantothenate; niacin, 33 mg; folic acid, 0.66 mg; and
biotin, 0.1 mg.
4 Provided the following quantities of minerals per kilogram of complete diet:
Cu, 16 mg as copper sulfate; Fe, 165 mg as iron sulfate; I, 0.36 mg as potassium iodate;
Mn, 44 mg as manganese sulfate; Se, 0.3 mg as sodium selenite; and Zn, 165 mg as zinc
oxide.

53
Table 3.3. Analyzed nutrient composition of experimental diets, as-fed basis
Item Diet: SSeed.HP290 FFSB1 SBM1 SBM1
+ oil
SPC1 SPC1
+ oil
N-
free
DM, % 93.44 92.92 91.21 91.63 91.97 91.88 92.76
CP, % 20.72 17.32 15.92 14.60 16.14 16.59 1.00
Ether extract, % 7.35 9.29 0.69 7.50 0.24 6.70 -
Indispensable AA, %
Arg 1.69 1.17 1.21 1.05 1.25 1.11 -
His 0.56 0.46 0.47 0.41 0.47 0.42 -
Ile 0.91 0.76 0.79 0.70 0.81 0.71 -
Leu 1.56 1.29 1.33 1.17 1.37 1.19 0.01
Lys 1.28 1.11 1.13 0.99 1.12 0.99 0.01
Met 0.31 0.28 0.30 0.26 0.28 0.25 -
Phe 1.04 0.86 0.88 0.77 0.89 0.78 -
Thr 0.75 0.65 0.67 0.58 0.67 0.58 -
Trp 0.27 0.22 0.23 0.23 0.25 0.22 <0.04
Val 0.99 0.82 0.85 0.75 0.86 0.76 0.01
Dispensable AA, %
Ala 0.86 0.73 0.76 0.67 0.76 0.65 0.01
Asp 2.38 1.90 1.86 1.72 2.00 1.71 0.01
Cys 0.31 0.28 0.29 0.23 0.27 0.23 0.01
Glu 3.76 2.90 3.05 2.68 3.17 2.70 0.03
Gly 0.86 0.72 0.74 0.65 0.74 0.64 -

54
Pro 0.99 0.80 0.82 0.73 0.84 0.78 0.01
Ser 0.98 0.82 0.83 0.72 0.85 0.74 0.01
Tyr 0.57 0.49 0.52 0.45 0.48 0.41 -
Total AA, % 20.06 16.54 17.01 14.98 17.08 14.88 0.11
1 FFSB = full fat soybean; SBM = soybean meal; SPC = soy protein concentrate.

Table 3.4. Apparent ileal digestibility (%) of CP and AA in experimental diets 1
Item Diet SSeed. FFSB2 SBM2 SBM2 SPC2 SPC2 SEM P- Effect of oil4
HP290 + oil + oil Value3 SEM P- value
CP, % 81.0u 76.4z 68.1x 71.5xy 75.4yz 81.5u 1.75 0.001 2.76 0.01
Indispensable AA, %
Arg 93.1 z 88.1x 86.5x 87.1x 89.5xy 92.6 yz 1.22 0.001 2.19 0.12
His 88.5 y 85.8 x 84.0 x 85.0 x 88.5 y 90.8 z 1.00 0.001 1.51 0.04
Ile 87.6z 83.7 xy 82.9 x 84.7 y 87.6 z 88.5 z 0.81 0.001 1.22 0.04
Leu 87.1 z 83.1 xy 81.9 x 83.9 y 86.9 z 87.9 z 0.86 0.001 1.33 0.04
Lys 88.2 zu 87.0 yz 82.4 x 84.5 xy 87.9 yz 91.8 u 1.62 0.001 2.54 0.03
Met 88.0 xyz 85.7 x 86.7xy 88.7 yz 89.5 z 89.8 z 1.18 0.013 1.70 0.18
Phe 89.0 z 85.1 xy 83.5 x 85.2 y 89.0 z 89.8 z 0.77 0.001 1.19 0.04
Thr 76.7 yz 73.9 xy 71.7 x 72.3x 77.5 z 77.3 z 1.43 0.002 2.23 0.87
Trp 83.9 yz 81.8 xy 79.4 x 83.0 y 86.5 zu 88.1 u 1.41 0.001 2.21 0.02
Val 84.0 y 79.8 x 78.6 x 80.6 x 84.1 y 85.3 y 1.10 0.001 1.67 0.06

56
u-z Means within a row lacking a common superscript letter differ (P < 0.05).
1 Data are least square means of 7 observations per treatment.
2 FFSB = full fat soybean; SBM = soybean meal; SPC = soy protein concentrate.
Mean 87.5 y 83.8 x 81.9 x 83.6 x 86.8 y 88.5 y 0.98 0.001 1.53 0.04
Dispensable AA, %
Ala 81.5 z 78.1 yz 73.7 x 76.5 xy 78.2 yz 81.60 z 1.43 0.001 2.64 0.03
Asp 86.0 zu 83.6 yzu 79.4 x 80.5xy 84.4 zu 86.3 u 1.44 0.001 2.33 0.21
Cys 74.8 xy 74.1 x 70.3 x 73.5 x 73.9 x 79.8 y 2.76 0.048 3.87 0.03
Glu 87.3 yz 86.0 yz 80.4 x 82.6 xy 85.6 y 90.8 z 2.11 0.003 3.37 0.04
Gly 61.8 z 51.1 xy 41.6 x 48.0 xy 53.1 yz 57.4 yz 4.21 0.009 7.07 0.14
Pro 62.80 42.00 18.30 15.10 14.60 14.30 18.40 0.256 33.20 0.92
Ser 83.2 y 79.3 x 77.2 x 79.0 x 84.0 y 84.6 y 1.02 0.001 1.62 0.15
Tyr 88.4 z 85.0 x 85.6 xy 86.9 yz 90.9 u 90.7 u 0.81 0.001 1.24 0.36
Mean 81.4 z 76.6 xyz 70.2 xy 72.0 xy 75.0 xyz 77.6 yz 2.55 0.026 4.59 0.34
All AA, % 84.2 z 79.9 yz 75.6 x 77.4 xy 80.6 yz 82.7 z 1.67 0.004 2.98 0.20

57
3 P-value for the ANOVA comparing all 6 diets.
4 P-value for the effect of adding oil to SBM and SPC.
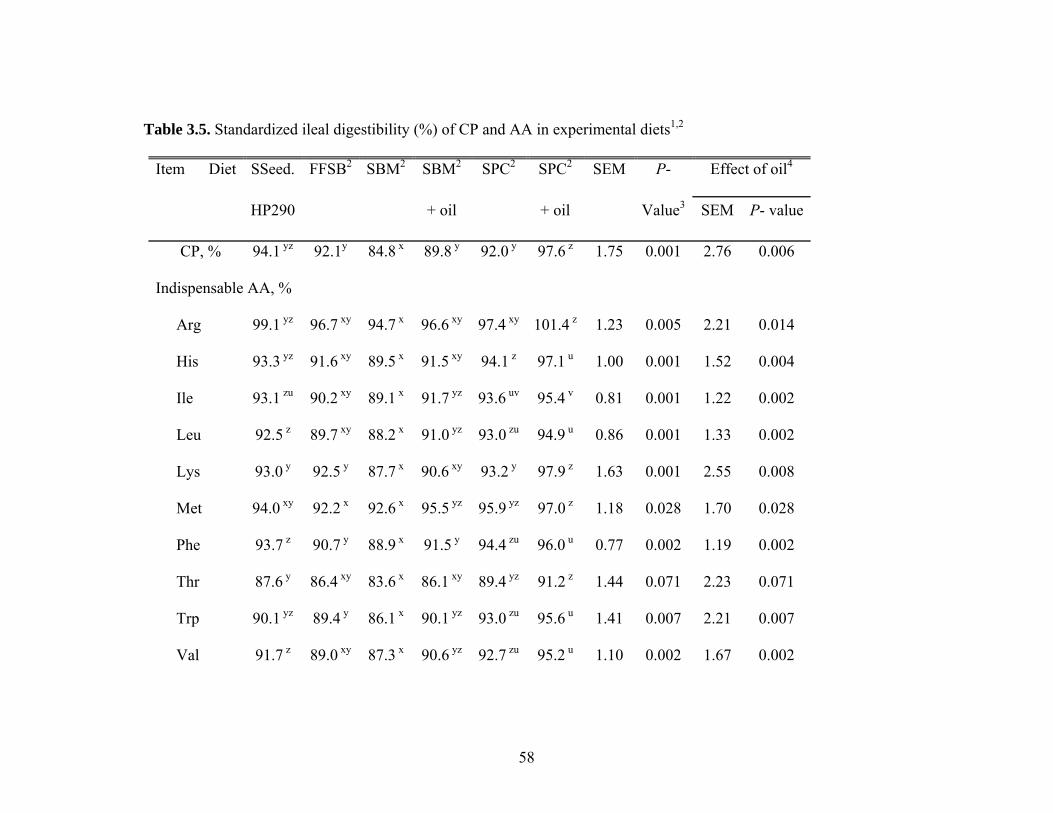
58
Table 3.5. Standardized ileal digestibility (%) of CP and AA in experimental diets1,2
Item Diet SSeed. FFSB2 SBM2 SBM2 SPC2 SPC2 SEM P- Effect of oil4
HP290 + oil + oil Value3 SEM P- value
CP, % 94.1 yz 92.1y 84.8 x 89.8 y 92.0 y 97.6 z 1.75 0.001 2.76 0.006
Indispensable AA, %
Arg 99.1 yz 96.7 xy 94.7 x 96.6 xy 97.4 xy 101.4 z 1.23 0.005 2.21 0.014
His 93.3 yz 91.6 xy 89.5 x 91.5 xy 94.1 z 97.1 u 1.00 0.001 1.52 0.004
Ile 93.1 zu 90.2 xy 89.1 x 91.7 yz 93.6 uv 95.4 v 0.81 0.001 1.22 0.002
Leu 92.5 z 89.7 xy 88.2 x 91.0 yz 93.0 zu 94.9 u 0.86 0.001 1.33 0.002
Lys 93.0 y 92.5 y 87.7 x 90.6 xy 93.2 y 97.9 z 1.63 0.001 2.55 0.008
Met 94.0 xy 92.2 x 92.6 x 95.5 yz 95.9 yz 97.0 z 1.18 0.028 1.70 0.028
Phe 93.7 z 90.7 y 88.9 x 91.5 y 94.4 zu 96.0 u 0.77 0.002 1.19 0.002
Thr 87.6 y 86.4 xy 83.6 x 86.1 xy 89.4 yz 91.2 z 1.44 0.071 2.23 0.071
Trp 90.1 yz 89.4 y 86.1 x 90.1 yz 93.0 zu 95.6 u 1.41 0.007 2.21 0.007
Val 91.7 z 89.0 xy 87.3 x 90.6 yz 92.7 zu 95.2 u 1.10 0.002 1.67 0.002

59
Mean 92.3 z 89.7 xy 87.5 x 90.0 yv 92.3 zv 94.8 u 0.98 0.001 1.53 0.004
Dispensable AA, %
Ala 92.7 yz 91.1y 86.0 x 90.5 y 90.5 y 96.1 z 1.43 0.001 2.64 0.001
Asp 91.0 z 89.7yz 85.3 x 87.3 x y 90.2yz 93.1 z 1.44 0.001 2.33 0.046
Cys 84.9 x 85.0 x 80.6 x 85.0 x 85.1 x 92.8 y 2.76 0.006 3.87 0.005
Glu 91.0 y 90.7 y 84.9 x 87.7 xy 89.9 xy 95.9 z 2.11 0.003 3.37 0.015
Gly 93.9 y z 89.2 y 77.9 x 89.6 y z 89.6 yz 99.7 z 4.50 0.008 7.08 0.006
Pro 153.6 153.7 125.2 135.8 119.8 127.6 18.55 0.621 33.26 0.588
Ser 91.1 zu 88.6 y 86.3 x 89.5 yz 92.9 uv 94.9 v 1.02 0.001 1.62 0.004
Tyr 93.6 y 90.9 x 91.1 x 93.3 y 96.9 z 97.7 z 0.81 0.001 1.24 0.021
Mean 93.8 y 91.7 y 84.6 x 88.5 xy 89.1 xy 94.2 y 2.56 0.057 4.60 0.064
All AA, % 94.8 yz 92.7 yz 87.9 x 91.4 xy 92.6 yz 96.7 z 1.68 0.008 2.99 0.019
u-z Means within a row lacking a common superscript letter differ (P < 0.05).
1 Data are least square means of 7 observations per treatment.
2 Standardized ileal digestibility values were calculated by correcting the AID values for the basal ileal endogenous
losses. Basal ileal endogenous losses were determined as (g/kg DMI): CP, 29.11; Arg, 1.09; His, 0.29; Ile, 0.53; Leu, 0.91;

60
Lys, 0.66; Met, 0.20; Phe, 0.53; Thr, 0.88; Trp, 0.18; Val, 0.81; Ala, 1.02; Asp, 1.27; Cys, 0.33; Glu, 1.50; Gly, 3.95; Pro,
9.62; Ser, 0.82, Tyr, 0.31.
3 FFSB = full fat soybean; SBM = soybean meal; SPC = soy protein concentrate.
4 P-value for the ANOVA comparing all 6 diets.
5 P-value for the effect of adding oil to SBM and SPC.

Table 3.6. Concentration of standardized ileal digestible CP and AA (g/kg DM) in each
protein source. 1
Item Ingredient: SSeed.
HP290
FFSB2 SBM2 SBM2
+ oil
SPC2 SPC2
+ oil
SEM P-
value
CP, % 472.3z 352.7x 406.2y 430.2y 651.8u 691.4v 9.73 0.001
Indispensable AA, %
Arg 40.0 z 26.6 x 31.7 y 32.3 y 50.6 u 52.6 v 0.48 0.001
His 12.2z 9.9 x 11.5 y 11.7 y 17.6 u 18.1 v 0.14 0.001
Ile 19.8 u 15.9 x 18.2 y 18.7 z 30.4 v 30.9 w 0.18 0.001
Leu 33.4 z 26.5 x 31.9 y 32.9 z 51.5 u 52.4 v 0.33 0.001
Lys 27.6 y 23.3 x 26.8 y 27.7 y 41.7 z 43.7 u 0.54 0.001
Met 6.3 y 5.8 x 7.0 z 7.2 u 10.0 v 10.1 v 0.10 0.001
Phe 22.8 u 17.9 x 21.2 yz 21.9 z 33.7 v 34.2 w 0.19 0.001
Thr 15.3 y 12.9 x 15.8 yz 16.2 z 24.5 u 24.9 u 0.28 0.001
Trp 3.1 x 3.20 x 5.4 y 5.6 z 8.3 u 8.5 v 0.08 0.001
Val 20.9 u 16.9 x 19.2 y 19.9 z 31.9 v 32.6 w 0.26 0.001
Dispensable AA, %
Ala 18.4 yz 15.3 x 17.8 y 18.8 z 27.7 u 29.4 v 0.32 0.001
Asp 50.3 z 39.2 x 45.7 y 47.0 y 72.7 u 75.9 u 0.90 0.001
Cys 5.9 xy 5.5 x 6.1 yz 6.4 z 8.7 u 9.4 v 0.22 0.001
Glu 79.9 z 62.0 x 70.9 y 73.3 y 112.9 u 120.2 v 2.12 0.001
Gly 18.7 z 14.7 x 15.6 xy 18.0 yz 26.9 u 30.0 v 21.43 0.001
Pro 35.1 28.0 27.8 30.2 39.3 42.5 5.08 0.161

62
Ser 21.2 yz 16.5 x 21.0 y 21.8 z 32.6u 33.2 u 0.26 0.001
Tyr 16.1 yz 12.9 x 15.8 y 16.2 z 24.3 u 24.5 u 0.14 0.001
All AA, % 443.7 z 349.9 x 405.2 y 421.7 yz 639.6 u 667.6 v 8.99 0.001
u-z Means within a row lacking a common superscript letter differ (P < 0.05).
1 Data were calculated by multiplying the AA concentration in each ingredient by
the measured value for the standardized ileal digestibility. N=7.
2 FFSB = conventional full fat soybean; SBM = soybean meal; SPC = soy protein
concentrate.

63
CHAPTER 4
Ileal amino acid digestibility of soybean and animal protein sources fed to weanling pigs
ABSTRACT. An experiment was conducted to determine the apparent (AID) and
standardized (SID) ileal digestibility of CP and AA by weanling pigs of 4 soybean products,
fishmeal (FM), and casein. The 4 soybean products were soybean meal (SBM), a soy protein
product (SPP), soy protein isolate (SPI), and fermented soybean meal (FSBM). Seven
weanling barrows (initial BW: 10.9 kg) were fitted with a T-cannula in the distal ileum. The
barrows were arranged in a 7 x 7 Latin square design with 7 diets and 7 periods. Six
cornstarch-based diets were prepared using each of the protein sources as the only source of
CP and AA in one diet. A N-Free diet was also used to measure basal endogenous losses of
CP and AA. Results of the experiment showed that casein had the greatest (P < 0.05) SID for
most AA, but the SID for Arg, Lys, Thr, and Trp in SPP and SPI were similar to casein.
There were no differences in SID for any AA among FM, SPP, and SPI. Except for Lys, the
SID for all indispensable AA in FSBM was not different from FM, SPP, and SPI, and there
were no differences in SID between FSBM and SBM. In conclusion, although the SID of AA
in FSBM is similar to SBM, FSBM contains more digestible AA than SBM because it has a
greater AA concentration than SBM. With the exception of Lys, the SID of AA in FSBM is
also similar to FM, SPP, and SPI, but the SID of most AA in casein is greater than any of the
other protein sources.
Keywords: amino acids, casein, digestibility, fermented soybean meal, fish meal, soy protein
isolate

64
INTRODUCTION
Soybeans are commonly used as a source of dietary AA for humans and animals.
Proper heat treatment of raw soybeans, however, is necessary to inactivate anti-nutritional
factors such as trypsin inhibitors and lectins to make it suitable for consumption (Baker,
2000). Soybean meal (SBM) usually has low concentrations of trypsin inhibitors and lectins
(Lallès, 2000) because it has undergone heating during the process of fat extraction (Baker,
2000). However, when SBM is fed to young pigs, digestive disturbances are sometimes
observed. The presence of indigestible carbohydrate complexes (Sohn et al., 1994), antigenic
soy proteins (Li et al., 1990), and residual trypsin inhibitors (Lallès, 2000) may contribute to
this problem. Therefore, fish meal (FM) or milk proteins are usually used as protein sources
in pig starter diets and only limited quantities of SBM are included in these diets. Soy protein
products such as soy protein isolate (SPI) and HP 300 (Hamlet Protein, Horsens, Denmark)
are defatted soy flakes that are further processed to remove the heat stable oligosaccharides
and antigens (Cromwell, 2000; Zhu et al., 1998). These products, therefore, are better
tolerated by young pigs than regular SBM (Zhu et al., 1998; Li et al., 1991).
Recently, fermented soybean meal (FSBM) was introduced. It has a lower trypsin
inhibitor concentration and a greater CP concentration than SBM and it is reported to contain
higher amounts of smaller peptides (<20 kDa) compared with unfermented SBM (Hong, et
al., 2004). Therefore, FSBM is thought to be more digestible to young animals than other
soybean products. However, there is limited information on the digestibility of AA in FSBM
it is not known how SID for AA values in FSBM compare with animal proteins. Therefore,
the objective of this experiment was to measure AID and SID of CP and AA in SBM, HP

65
300, SPI, and FSBM and compare these values to the AID and SID of CP and AA in FM and
casein.
MATERIALS AND METHODS
Animals, Housing, and Experimental Design
Seven growing barrows (initial BW: 10.9 ± 2.3 kg) originating from the matings of
SP-1 boars to line 13 sows (Ausgene Intl. Inc., Gridley, IL) were equipped with a T-cannula
in the distal ileum for digesta collection using the method described by Stein et al. (1998).
After surgery, pigs were transferred to individual pens (1.2 x 1.8 m) in a temperature
controlled room (22o C) where they were allowed to recover for 10 d. A standard corn-
soybean meal nursery diet (20% CP) was provided on an ad libitum basis during this time.
Pigs were allotted to a 7 x 7 Latin square design with pigs and periods comprising the rows
and columns, respectively. The animal part of the study was conducted at South Dakota
State University, Brookings, and the experiment was approved by the Institutional Animal
Care and Use Committee at South Dakota State University (# 06-A022).
Ingredients, Diets, and Feeding
The test proteins consisted of 4 soybean products, FM, and casein (Table 1). The
soybean products were conventional SBM, a soy protein product (HP 300, Hamlet Protein,
Horsens, Denmark), SPI (Ardex AF, Archer Daniel Midland, Decatur, IL), and FSBM
(Pepsoygen, Genebiotech Co., Ltd, South Korea). Fish meal was mainly menhaden
(Menhaden Select) from Omega Protein, Houston, TX and casein was obtained from Erie
Foods Intl., Erie, IL.
The conventional SBM was a commercial source of dehulled SBM whereas the soy
protein product (SPP) is HP 300, an enzymatically treated soy protein product that has

66
decreased concentrations of oligosaccharides and anti-nutritional factors compared with
SBM (Jiang et al., 2006). Soy protein isolate is the proteinacious fraction of the soybean meal
(Baker, 2000). It is produced by solubilizing the protein at neutral or slightly alkaline pH and
precipitating the extract by acidification to obtain the protein isolate (Berk, 1992).
Pepsoygen is a product of the fermentation of soybean meal with Aspergillus oryzae GB-107
(Hong et al., 2004). It is believed to have a low trypsin inhibitor concentration and the partial
digestion of large peptides by proteases secreted by A. Oryzae during fermentation may
increase the concentrations of small peptides in the product (Hong et al., 2004). Menhaden
select FM is a protein source that is commonly used in diets fed to young pigs (Maxwell and
Carter, 2001). Menhaden fish is steamed, strained, and pressed to remove oil and other
liquids and the remaining cake is then dried to produce the FM (FAO, 1986). Casein is the
solid residue obtained by acid coagulation of defatted milk (Kellems et al., 2002). It is a milk
protein and has been shown to have superior nutrient digestibility compared with soy
proteins (Veum and Odle, 2001) when fed to young pigs.
Six diets were formulated to contain each protein ingredient as the only protein and
AA source (Tables 2 and 3). A N- Free diet was also included to determine the basal
endogenous losses of CP and AA. Chromic oxide (0.40%) was included in all diets as an
inert marker. Pigs were allowed ad libitum access to water and their respective diets
throughout the experiment.
Data and Sample Collection
Pig BW were recorded at the beginning of the experiment and at the end of each
period. Each period lasted 7 d and pigs were allowed to adapt to their diet during the initial 5
d. On d 6 and 7, ileal digesta were collected for 8 h as described by Stein et al. (1999).
67
Briefly, a 225-ml plastic bag was attached to the cannula barrel using a cable tie and digesta
flowing into the bag were collected. Bags were removed every 30 min and replaced with a
new one. Digesta were immediately stored at – 20oC to prevent bacterial degradation of the
AA in the digesta. At the completion of 1 experimental period, all the remaining feeds in the
feeder was removed and pigs were given access to a new diet.
Ileal samples obtained over the 2-d collection period were thawed, mixed within
animal and diet, and a sub-sample was taken for chemical analysis. A sample of each diet
and of each of the protein sources was taken as well. Digesta samples were lyophilized and
finely ground prior to chemical analysis.
Chemical Analysis
All protein sources were analyzed for ether extract (procedure 4.5.01; AOAC,
2000), crude fiber (procedure 4.6.02; AOAC, 2000), Ca (procedure 4.8.02; AOAC, 2000),
and P (procedure 4.8.13; AOAC, 2000). Protein separation in these ingredients was
performed by SDS-PAGE according to the method of Laemmli (1970) using a Bio-Rad
Criterion Electrophoresis system (Bio-Rad, Hercules, CA). Proteins (40 μg) were applied to
a 12% Criterion XT precast gel (Bio-Rad, Hercules, CA) and separated at 150 V for 60
minutes. After electrophoresis, the gel was stained with Coomassie Blue (Sigma-Aldrich, St.
Louis, MO). Molecular weights were estimated by comparing the bands with known
standards (Mark 12, Invitrogen; Carlsbad, CA) and protein quantification was performed on a
Typhoon 9400 using Image Quant (R) software (GE Healthcare, Fairfield, CT). The bands
were classified as large peptides (60 kDa and greater), medium (20-60 kDa), and smaller
peptides (less than 20 kDa). The amount of each peptide in each class was expressed as
percent of total protein in a sample.

68
Concentrations of glycinin and β-conglycinin in the soybean proteins were
measured by SDS-PAGE using the method of Wu et al. (1999). Densitometry was
accomplished by using the Kodak 1D mage analysis (Kodak, Rochester, NY) on scanned
images produced by a Biotech image scanner (Amersham Pharmacia, Piscataway, NJ)
Trypsin inhibitor concentration was also determined (procedure Ba 12-75, AOCS). The
sugar profile of soybean products was determined using a high-performance liquid
chromatography with an Alcott autosampler (Norcross, GA), a Waters 510 pump (Milford,
MA), a Dionex CarboPac PA1 column (Sunnyvale, Ca) and a Dionex pulsed amperometric
detector (Sunnyvale, Ca) based on the procedure of Rocklin et. al (1998). Results from
samples were compared with known standards for stachyose and raffinose (Sigma-Aldrich,
St. Louise, MO) and known standards for glucose, sucrose, maltose, and fructose (Chem
Service, West Chester, PA) to determine concentrations of monosaccharides and
oligosaccharides.
All samples were analyzed for DM (procedure 4.1.06; AOAC, 2000) and for CP
(procedure 4.2.08, AOAC, 2000). Amino acids were analyzed in ingredients, diets, and ileal
samples on a Beckman 6300 Amino Acid Analyzer (Beckman Instruments Corp., Palo Alto,
CA) using ninhydrin for postcolumn derivatization and norleucine as the internal standard.
Before analysis, samples were hydrolyzed with 6 N HCL for 24 h at 110oC (procedure
4.1.11, alternative 3; AOAC, 1998). Methionine and Cys were determined as Met sulfone
and cysteic acid, respectively, after cold performic acid oxidation overnight prior to
hydrolysis (procedure 4.1.11, alternative 1; AOAC, 1998). Tryptophan was determined after
NaOH hydrolysis for 22 h at 110oC (procedure 45.4.04; AOAC, 2000). Chromium

69
concentrations of diets and ileal digesta were determined after nitric acid- perchloric acid wet
ash sample preparation (procedure 9.2.39; AOAC, 2000).
Calculations
Apparent ileal digestibility values for AA in samples obtained from feeding the diets
containing a protein source were calculated using equation [1] (Stein et al., 2007):
AID = (1 – [(AAd/AAf) x (Crf/Crd)] x 100 % [1]
where AID is the apparent ileal digestibility of an AA (%), AAd is the concentration of that
AA in the ileal digesta DM, AAf is the AA concentration of that AA in the feed DM, Crf is
the chromium concentration in the feed DM, and Crd is the chromium concentration in the
ileal digesta DM. The AID for CP was also calculated using this equation.
The basal endogenous flow to the distal ileum of each AA was determined based on
the flow obtained after feeding the N-free diet using equation [2] (Stein et al., 2007):
IAAend = [ AAd x (Crf/Crd)] [2]
where IAAend is the basal endogenous loss of an AA (g per kg DMI). The basal endogenous
loss of CP was determined using the same equation.
By correcting the AID for the IAAend of each AA, standardized ileal AA digestibility
values were calculated using equation [3] (Stein et al., 2007):
SID = AID + [(IAAend/AAf) x 100] [3]
where SID is the standardized ileal digestibility value (%).
Concentration of digestible AA in the ingredients was calculated using equation [4]:
Digestible AA = AAing x (SID/100) [4]
where digestible AA is the concentration of AA in the ingredients that was absorbed (g/kg
DM) and AAing is the AA concentration in the protein source DM (g/kg)..
70
Statistical Analysis
Data were analyzed using the Proc Mixed procedure of SAS (SAS Inst. Inc., Cary,
NC). Homogeneity of the variances among treatments was confirmed using the
UNIVARIATE procedure of SAS. Outliers were determined as values that were more than 3
SD above or below the mean. No outliers were identified. An analysis of variance was
conducted with diet as the fixed effect and pig and period as random effects. Whenever
differences were detected, treatment means were separated using the Least Significant
Difference test of Proc Mixed. The pig was the experimental unit for all analyses and an
alpha value of 0.05 was used to assess significance among treatments.
RESULTS
Fermented soybean meal contained more DM, CP, Ca, and P but less ether extract
than SBM (Table 4.1). Casein contained more CP and AA than the other ingredients, but the
concentration of ether extract, Ca, and P were greater in FM than in the other ingredients.
Fermented soybean meal also contained more AA than SBM, but the distribution of peptides
did not differ between the 2 soybean products (Table 4.2). Fermented soybean meal did not
contain sucrose, stachyose, and raffinose whereas these carbohydrates were present in SBM.
Glycinin and β-conglycinin concentrations were greater in FSBM than in SBM, but the
concentration of trypsin inhibitors was lower in FSBM than in the other soybean products.
The AID for CP in casein (81.7%) was greater (P < 0.05) than in SBM (66%), FSBM
(70.4%), and FM (71.4%), but not different from the values of 77.2% and 79.3% obtained for
SPP and SPI, respectively (Table 4.5). The AID for all indispensable AA, except Lys, in
FSBM was similar to the AID for indispensable AA in SBM, SPP, SPI, and FM. The AID
for Lys in FSBM was similar to SBM, but lower (P < 0.05) than in the other protein sources.

71
Soy protein concentrate and SPI had similar AID for all indispensable AA. With the
exception of Arg, His, and Lys, the AID for all AA in casein was greater (P < 0.05) than in
the other ingredients.
The AID for all dispensable AA was similar in FSBM, SBM, and FM. Soy protein
concentrate and SPI had a greater (P < 0.05) AID for Asp, Glu, and Gly than SBM, but with
a few exceptions, no differences between SPP, SPI, FSBM, and FM were observed. The AID
for most dispensable AA in casein was also similar to the AID in SPP and SPI.
The SID for CP (97.0%) in casein was greater (P < 0.05) than in SBM (80.3%),
FSBM (82.2%), and FM (85.0%), but not different from SPP and SPI that had an SID of
92.2% and 92.1%, respectively (Table 4.6). The SID for Lys in FSBM was lower than in FM
(P < 0.05), but the SID for all other indispensable AA in FSBM was similar to SBM and FM.
The SID for all AA except Arg, His, and Lys in FSBM were also similar to the SID in SPP
and SPI. Soy protein concentrate and SPI had similar values for SID of all indispensable
AA. Casein had greater (P < 0.05) values for SID of Ile, Leu, Met, Phe, and Val than all
other protein sources, but for the remaining indispensable AA, the values obtained for casein
were similar to SPI.
The SID for the dispensable AA in FSBM was similar to SBM and FM. Soy protein
concentrate and SPI had similar values for SID of all dispensable AA, and with a few
exceptions, these values were also similar to the SID in FSBM and casein.
Fermented soybean meal contained 480 g of SID CP, which is more (P < 0.01) than
in SBM (Table 4.7). The concentration of SID CP in SPP (545 g) and FM (586 g) were
similar but these values were lower (P < 0.01) than the concentration in SPP (757 g) and
casein (924 g).

72
Concentrations of SID Lys and Trp in SBM were similar to FSBM but for the
remaining AA, FSBM had a greater (P < 0.01) concentration of digestible AA than SBM.
The concentration of most of the digestible AA in FSBM was also similar to SPP, but these
values were lower (P < 0.01) than in SPI. Although digestible Trp concentration was low in
FM, concentrations of most digestible AA in FM were greater (P < 0.01) than in all soybean
products, but the concentrations of most digestible AA in casein were greater (P < 0.01)
compared with all other protein sources.
Concentrations of SID dispensable AA in FM were similar to SBM for most AA and
with the exception of Cys and Pro, concentrations of SID dispensable AA in FSBM were
greater (P < 0.01) than in SBM. Soy protein isolate contained more (P < 0.05) digestible
dispensable AA compared with SPP and FSBM, whereas casein contained more (P < 0.01)
SID AA than all other protein sources.
DISCUSSION
Composition of Ingredients
The AA composition of FSBM used in this study was similar to the values obtained
by Hong et al. (2004) and Yun et al. (2005). Fermented SBM also contained more DM, CP,
Ca, and P than SBM which is consistent with the findings from other studies (Hong et al.,
2004; Feng et al., 2007a,b). The AA composition of the SBM used in this study was similar
to the values reported by NRC (1998) and by other studies (Rudolph, et al., 1983; Kim et al.,
2000; Opapeju et al., 2006). Likewise, the concentration of raffinose and stachyose in SBM
obtained in this study was also similar to the values reported by Grieshop (2003). The
concentrations of most AA in FM and in casein used in this study were also similar to
previously reported values (NRC, 1998; Kim and Easter, 2001). The CP and AA composition

73
of SPP used in this study was similar to the values reported by Zhu et al. (1998) who used the
same protein product in their study. The CP and AA concentration in the SPI used in this
study were greater than NRC (1998) values. The use of new processing technology results in
more efficient protein recovery (Koseoglu and Rhee, 1993), which may account for the
higher AA concentration in the SPI used in the study.
The concentration of crude fiber was greater and the concentration of ether extract
was lower in FSBM than in SBM. These results are not consistent with previous studies
where a concentration of crude fiber was reduced but a concentration of crude fat was
increased after fermentation (Zamora and Veum, 1979, 1988; Feng et al., 2006a,b). The SBM
used in this study was obtained from a commercial source and the variation in the chemical
characteristics of SBM may be the cause of the difference in the ether extract and crude fiber
between FSBM and SBM (Grieshop et al., 2003). The absence of stachyose and raffinose in
fermented soybean meal may be due to the production of α-galactosidase by Aspergillus
oryzae during the fermentation process (Shankar and Mulimani, 2007) and the removal of
the oligosaccharides in FSBM and the low concentrations of oligosaccharides in SPP and SPI
may be an advantage because the diarrhea associated with feeding SBM to weanling pigs was
suggested to be attributed to the oligosacharrides present in SBM (Liener, 2000). The
fractionation of soy proteins during the production of soy protein isolates (Wolf, 1970) and
the enzymatic cleavage of SBM to produce SPP may have contributed to more small peptides
in SPP and SPI whereas the processing of SBM, SPP, and SPI may have contributed to their
low trypsin inhibitor activity.

74
Ileal Amino Acid digestibility
Fermented soybean meal contained fewer anti-nutritional factors (trypsin inhibitors,
stachyose, and raffinose) than regular SBM which was shown to be a result of the
fermentation process (Hong et al., 2004). This has the potential to enhance the digestibility
of AA in FSBM when fed to young animals. Hong et al. (2004) showed that FSBM
contained greater amount of small peptides than SBM. The rate and extent of absorption for
small peptides was reported to be greater than for free AA (Webb, 1990) therefore, having
more small peptides could improve the digestibility of FSBM. However, CP and AA
digestibility were not greater in FSBM than in SBM. Fermented SBM and SBM contained
similar amounts of small peptides which may explain the lack of difference in the AID and
SID of AA between FSBM and SBM. The concentration of glycinin and β-conglycinin in
FSBM is two fold greater than in SBM. The reason for this is unknown however the
differences in the concentration of glycinin and β-conglycinin among the 4 soy protein
products may be partially attributed to the variations in the growing conditions of the
soybean, soybean genotype and the type of processing the soybean product was subjected to
(Murphy and Resurrecion, 1984; Wu et al., 2004).
The presence of trypsin inhibitors and soybean oligosaccharides reduced AA
digestibility (Smiricky et al., 2002; Święch et al., 2004) but despite the absence of
oligosaccharides and a low trypsin inhibitor concentration in FSBM, no improvement in the
SID of AA in FSBM was observed compared with SBM. However, the concentration of
raffinose and stachyose in SPC and SPI were closer to the values obtained for FSBM. This
may explain the lack of difference of the AID and SID of most AA among FSBM, SPP, and
SPI. The difference in the concentration of trypsin inhibitors in the 4 soybean products is

75
unlikely to greatly influence the SID of AA. Defatted soy flakes containing trypsin inhibitor
activity that vary from 1.4 to 6.2 mg had similar AID of CP and AA when fed to pigs
(Vandergrift, et. al., 1983). Similarly, true digestibility of N was not different among
soybean products that contained trypsin inhibitor concentrations in the range of 3.4 to 16.85
mg when fed to rats (Taciak et al., 2004). Although the SID of AA between FSBM and SBM
were similar, the feeding value of FSBM is greater than SBM because it has more
concentration of AA than SBM.
Previous studies did not concur with the results of this study. Previous studies have
shown that the AID of most AA in FSBM is greater than SBM (Yun et al., 2005; Yang et al.,
2007). The difference in the results between this study and previous studies may be due to
the use of 17 to 23 day old pigs in the previous study as compared to the 11 kg pigs used in
this study. Older pigs are less sensitive to antigenic components in soy proteins and
oligosaccharides than early weaned pigs (Li et al., 1990; Smiricky et al., 2002), and this may
be the reason for the lack of difference in the AID of AA between FSBM and SBM in this
study. Further, the type of microorganism used in the fermentation process may influence
the degree of proteolysis of the substrate protein (Baumann and Bisping, 1995; Wilson et al.,
2005) and these may account for the differences in the AID of AA observed among FSBM.
However, the SID of AA is a better indicator of the digestibility of AA in a feedstuff because
it accounts for the basal endogenous losses (Stein et al., 2007). In this study, no difference
was observed in the SID of AA between FSBM and SBM. Although the SID of Arg, Ile,
Lys, Gly, and Pro was greater in FSBM than SBM, the study of Yang et al. (2007) observed
that the SID of the remaining AA was not different between FSBM and SBM.

76
The nutrient digestibility of plant proteins was shown to be inferior compared with
the nutrient digestibility of animal proteins (Yun et al., 2005). In this study, the AID and SID
of most AA in the 4 soybean products were not lower than the AID and SID of AA in FM.
Among the soy proteins, most AA in SPP and SPI were absorbed at the same extent as
casein. This suggests that digestive capacity of the pigs at this age were sufficient to break
the dietary proteins in the forms by which it can be absorbed. However, the combination of a
low concentration of raffinose and stachyose and the presence of more small peptides in SPP
and SPI may have contributed to the greater AID and SID of AA in SPC and SPI compared
with SBM and FSBM (Sohn et al., 1994; Webb, 1990).
Most of the studies that evaluated the effect of soy proteins on AA digestibility used
early weaned pigs (Sohn et al., 1994b; Walker et al., 1996) and at this age, aside from being
sensitive to anti-nutritional factors that reduces AA digestibility, the digestive capacity of the
gastro-intestinal tract is limited (Veum and Oodle, 2000). Thus, the soy proteins were
reported to be not as digestible as milk proteins (Walker et al., 1986; Viljoen et al., 1998).
However, since older pigs are used in this study, no difference was observed in the AID and
SID of most AA in SPP, SPI, and casein which concurs with the study of Sohn, et al.,
(1994a) that the AID of most AA in processed soybean products are not different from dried
skim milk.
The AID of AA in casein obtained in this study was lower compared with the values
reported by NRC (1998) but similar to the values reported by Walker et al. (1986). Both of
these studies used young pigs and ileal AA digestibility was shown to increase over time.
Milk proteins are still the ideal protein source for young pigs and this is shown by its superior
SID of AA when fed to young pigs and it contributes more SID AA (g/kg) than SPI.

77
In conclusion, the SID of FSBM is similar to SBM but FSBM has a greater feeding
value than SBM because it contains more AA than SBM. The SID of AA in SBM, FSBM,
SPP and SPI was not different from FM but the SID for most of the AA in SPP and SPI were
similar to casein. Casein is still superior source of SID AA among the other protein sources
tested.

78
LITERATURE CITED
AOAC. 1995. Official Methods of Analysis. 16th ed. Assoc. Anal. Chem., Arlington, VA.
AOAC. 2000. Official Methods of Analysis. 17th ed. Assoc. Anal. Chem., Gaithersburg,
MD.
Baker, D. H. 2000. Nutritional constraints to use of soy products by animals. Page 1-12 in
Soy in Animal Nutrition. J. K. Drackley, ed. Federation of Animal Science Societies,
Savoy, IL.
Baumann, U., and B. Bisping. 1995. Proteolysis during tempe fermentation. Food
Microbiology 12:39-47.
Berk, Z. 1992. Technology of production of edible flours and protein products from
soybean. http://www.fao.org/docrep/t0532e/t0532e00.htm Accessed Nov. 20, 2006.
Cromwell, G. L. 2000. Utilization of soy products in swine diets. Page 274-280 in Soy in
Animal Nutrition. J. K. Drackley, ed. Federation of Animal Science Societies, Savoy,
IL.
FAO. 1986. The production of fishmeal and oil.
http://www.fao.org/DOCREP/003/X6899E/X6899E00.HTM Accessed Nov. 20, 2006.
Feng, J., X. Liu, Z. R. Xu, Y. P. Lu, and Y. Y. Liu. 2007b. The effect of Aspergillus oryzae
3.042 fermented soybean meal on growth performance, digestibility of dietary
components and activities of intestinal enzymes in weaned piglets. Anim. Feed Sci.
Technol. 134: 295-303.
Feng, J., X. Liu, Z. R. Xu, Y. Y. Liu, and Y. P. Lu. 2007a. The effect of Aspergillus oryzae
3.042 fermented soybean meal on growth performance and plasma biochemical
parameters in broilers. Anim. Feed Sci. Technol. 134:235-242.

79
Hong, K. J., C. H. Lee, and S. W. Kim. 2004. Aspergillus oryzae GB-107 fermentation
improves nutritional quality of food soybeans and feed soybean meals. J. Med. Food.
7: 430-435.
Jiang, H. Q., L. M. Gonh, X. Ma, Y. H. He, D. F. Li, and H. X. Zhai. 2006. Effect of
stachyose supplementation on growth performance, nutrient digestibility and caecal
fermentation characteristics in broilers. Br. Poult. Sc. 47: 516-522.
Kellems, R. O., and D. C. Church. 2002. Supplemental protein sources. Page 86-116 in
Livestock Feeds and Feeding. 5th ed. R.O. Kellems and D. C. Church, ed. Prentice-
Hall, New Jersey.
Koseoglu, S. S., and K. C. Rhee. 1993. New technologies in processing protein products.
Page 241-247 in Proceedings of the World Conference on Oilseeds Technology and
Utilization. T. H. Applewhite, ed. AOCS Press, Champaign, IL.
Lallès, J. P., 2000. Soy products as protein sources for preruminants and young pigs. Page
106-126 in Soy in Animal Nutrition. J. K. Drackley, ed. Federation of Animal Science
Societies, Savoy, IL.
Li, D. F., J. L. Nelssen, P. G. Reddy, F. Blecha, J. D. Hancock, G. L. Allee, R. D. Goodband,
and R. D. Klemm. 1990. Transient hypersensitivity to soybean meal in the early-
weaned pig. J. Anim. Sci. 68:1790-1799.
Li, D. F., J. L. Nelssen, P. G. Reddy, F. Blecha, R. Klemm, D. W. Giesting, J. D. Hancock,
G. L. Allee, and R. D. Goodband. 1991. Measuring suitability of soybean products for
early-weaned pigs with immunological criteria. J. Anim. Sci. 69:3299-3307.

80
Liener, I. E., 2000. Non-nutritive factors and bioactive compounds in soy. Page 13-35 in
Soy in Animal Nutrition. J. K. Drackley, ed. Federation of Animal Science Societies,
Savoy, IL.
Maxwell, C. V., and S. D. Carter. 2001. Feeding the weaned pigs. Page 691-715 in Swine
Nutrition. 2nd ed. A. J. Lewis and L. L. Southern, ed. CRC Press, Washington, DC.
Murphy, P. A., and A. P. Resurreccion. 1984. Varietal and environmental differences in
soybean glycinin and β-conglycinin content. J. Agric. Food. Chem. 32:911-915.
Opapeju, F. O., A. Golian, C. M. Nyachoti, and L. D. Campbell. 2006. Amino acid
digestibility in dry extruded-expelled soybean meal fed to pigs and poultry. J. Anim.
Sci. 84: 1130-1137.
Rocklin, R. D., A. P. Clark, and M. Weitzhandler. 1998. Improved Long-Term
Reproducibility for Pulsed Amperometric Detection of Carbohydrates via a New
Quadruple-Potential Waveform. Anal. Chem. 70:1496-1501.
Rudolph, B. C., L. S. Boggs, D. A. Knabe, T. D. Tanksley, and S. A. Anderson. 1983.
Digestibility of nitrogen and amino acids in soybean products for pigs. J. Anim. Sci.
57:373-386.
Shankar, S. K. and V. H. Mulimani. 2007. α-Galactosidase production by Aspergillus
oryzae in solid-state fermentation. Bioresource Technol. 98:958-961.
Smiricky, M. R., C. M. Griesop, D. M. Albin, J. E. Wubben, V. M. Gabert, and G. C. Fahey.
2002. The influence of oligosaccharides on apparent and true ileal amino acid
digestibilities and fecal consistency in growing pigs. J. Anim. Sci. 80: 2433-2441.

81
Sohn, K. S., C. V. Maxwell, D. S. Buchanan, and L. L. Southern. 1994. Improved soybean
protein sources for early-weaned pigs: I. Effects on performance and total tract amino
acid digestibility. J. Anim. Sci. 72:622-630.
Stein, H. H., B. Sève, M. F. Fuller, P. J. Moughan, and C. F. M. Lange. 2007. Invited
review: Amino acid bioavailability and digestibility in pig feed ingredients:
Terminology and application. J. Anim. Sci. 85:172-180.
Stein, H. H., C. F. Shipley, and R. A. Easter. 1998. Technical Note: A technique for
inserting a T-cannula into the distal ileum of pregnant sows. J. Anim. Sci. 76:1433-
1436.
Stein, H. H., S. Aref, and R. A. Easter. 1999. Comparative protein and amino acid
digestibilities in growing pigs and sows. J. Anim. Sci. 77:1169-1179.
Święch, E., L. Buraczewska, and M. Taciak. 2004. The effect of trypsin inhibitor level in
soy products on in vitro and in vivo (piglets and rats) protein and amino acid
digestibility. Page 247-250 in Recent Advances of Research in Antinutritional Factors
in Legume seeds and oilseeds. Muzquiz, M. G. D. Hill, C. Cuadrado, M. M. Pedrosa,
and C. Burbano, ed. Wageningen Academic Publishers, The Netherlands.
Taciak, M., E. Święch, and B. Pastuszewska. 2004. Nutritional value and physiological
effects of industrial soybean products differing in protein solubility and trypsin
inhibitor content. Page 251-254 in Recent Advances of Research in Antinutritional
Factors in Legume seeds and Oilseeds. Muzquiz, M., G. D. Hill, C. Cuadrado, M. M.
Pedrosa, and C. Burbano, ed. Wageningen Academic Publishers, The Netherlands.
Veum, T. L., and J. Odle. 2001. Feeding neonatal pigs. Page 671-690 in Swine Nutrition.
2nd ed. A. J. Lewis and L. L. Southern, ed. CRC Press, Washington, DC.

82
Walker, W. R., C. V. Maxwell, F. N. Owens, and D. S. Buchanan. 1986. Milk versus
soybean protein sources for pigs: II. Effects on amino acid availability. J. Anim. Sci.
63: 513-524.
Webb, K. E. 1990. Intestinal absorption of protein hydrolysis products: A review. J. Anim.
Sci. 68: 3011-3022.
Wilson, S., K. Blaschek, and E. G. de Mejia. 2005. Allergenic proteins in soybeans:
Processing and reduction of P34 allergenicity. Nutrition Reviews 63:47-58.
Wu, AS., P. A. Murphy, L. A. Johnson, M. A. Reuber, and A. R. Fratzke. 2000. Simplified
process for soybean glycinin and β-conglycinin fractionation. J. Agric. Food. Chem.
48:2702-2708.
Yun, J. H., I. K. Kwon, J. D. Lohakare, J. Y. Choi, J. S. Yong, J. Zheng, W. T. Cho, and N. J.
Chae. 2005. Comparative efficacy of plant and animal protein sources on the growth
performance, nutrient digestibility, morphology, and caecal microbiology of early-
weaned pigs. Asian-Aust. J. Anim. Sci. 18:1285-1293.
Zamora, R. G., and T. L. Veum. 1979. The nutritive value of dehulled soybeans fermented
with Aspergillus oryzae or Rhizopus oligosporus as evaluated by rats. J. Nutr.
109:1333-1339.

83
Table 4.1. Analyzed nutrient composition (%) of soybean meal, soy protein product,
soy protein isolate, fermented soybean meal, fishmeal, and casein, as-fed basis
Item Ingredient: Soybean
meal
Soy
protein
product
Soy
protein
isolate
Fermented
soybean
meal
Fish meal Casein
DM, % 89.32 91.48 94.10 91.33 91.71 91.12
CP, % 45.07 54.40 77.89 53.74 63.52 87.33
Ether extract, % 1.07 1.13 1.24 0.80 8.73 0.09
Crude fiber, % 2.78 3.75 0.28 3.31 0.07 0.00
Ca, % 0.26 0.35 0.17 0.29 5.21 0.00
P, % 0.67 0.74 0.72 0.82 2.88 0.69
Indispensable AA, %
Arg 3.06 3.75 5.55 3.50 3.56 3.24
His 1.13 1.35 1.96 1.30 1.39 2.64
Ile 1.89 2.31 3.64 2.48 2.33 4.61
Leu 3.37 3.98 5.94 4.09 4.10 8.30
Lys 2.77 3.06 4.78 3.11 4.50 7.02
Met 0.63 0.71 1.03 0.76 1.59 2.54
Phe 2.23 2.74 3.91 2.71 2.41 4.61
Thr 1.71 2.02 2.76 1.98 2.32 3.51
Trp 0.62 0.69 1.03 0.67 0.54 1.07
Val 1.96 2.40 3.84 2.69 2.83 5.98
Dispensable AA, %

84
Ala 1.86 2.25 3.13 2.29 3.70 2.58
Asp 4.80 5.71 8.49 5.67 5.12 6.01
Cys 0.67 0.76 0.97 0.77 0.50 0.32
Glu 7.48 8.75 13.55 8.56 7.22 18.33
Gly 1.77 2.26 3.10 2.23 4.50 1.58
Pro 2.08 2.46 3.70 2.45 2.75 9.15
Ser 1.97 2.35 3.23 2.24 1.99 4.03
Tyr 1.67 2.03 2.81 1.97 1.88 5.11
Total AA 41.67 49.58 73.42 49.47 53.23 90.63

Table 4.2. Biochemical characteristics of soybean meal, soy protein product,
soy protein isolate, and fermented soybean meal
Item Ingredient:
Soybean
meal
Soy
protein
product
Soy
protein
isolate
Fermented
soybean
meal
Peptide size distribution (% of total protein)
60 kDa and higher 27.00 28.87 23.59 29.21
20-60 kDa 43.16 37.51 41.55 42.68
20 kDa and lower 29.84 33.62 34.86 28.11
Carbohydrate1, %
Glucose 0.0 0.54 0.0 0.39
Sucrose 8.74 0 0 0
Maltose 0 0 0 0
Fructose 0.70 1.21 0 0.77
Stachyose 5.79 0.78 0.15 0.00
Raffinose 1.21 0.18 0.05 0.00
Storage proteins2
Glycinin 16.24 64.27 55.30 33.40
βνινιχψλγνοχ− 4.83 19.03 19.00 8.23
Trypsin inhibitor, TIU/mg 4.00 2.10 7.20 <1.00
1 DM basis.
2 Expressed as % of protein.

86
Table 4.3. Ingredient composition of experimental diets, as-fed basis
Ingredient, % Diet: Soybean
meal
Soy
protein
product
Soy
protein
isolate
Fermented
soybean
meal
Fish
meal
Casein N-free
Soybean meal, 47% 30.00 - - - - - -
Soy protein
concentrate
- 21.50 - - - - -
Soy protein isolate - - 17.20 - - - -
Fermented soybean
meal
- - - 30.00 - - -
Fish meal - - - - 20.00 - -
Casein - - - - - 13.00 -
Soybean oil 2.00 2.00 2.00 2.00 2.00 2.00 4.00
Cornstarch 55.32 63.77 67.82 55.32 67.02 72.42 68.42
Sugar 10.00 10.00 10.00 10.00 10.00 10.00 20.00
Solka floc 1 - - - - - - 4.00
Limestone 0.75 0.80 0.90 0.75 - 0.90 0.90
Monocalcium
phosphate
0.95 0.95 1.10 0.95 - 0.70 1.20
Magnesium oxide - - - - - - 0.10
Potassium carbonate - - - - - - 0.40
Chromic oxide 0.40 0.40 0.40 0.40 0.40 0.40 0.40
Salt 0.40 0.40 0.40 0.40 0.40 0.40 0.40

87
Vitamin premix 2 0.03 0.03 0.03 0.03 0.03 0.03 0.03
Micro mineral premix
3
0.15 0.15 0.15 0.15 0.15 0.15 0.15
Total 100.00 100.00 100.00 100.00 100.00 100.00 100.00
1 Fiber Sales and Development Corp., Urbana, OH.
2 Provided the following quantities of vitamins per kilogram of complete diet: Vitamin A,
6,594 IU as vitamin A acetate; vitamin D3, 989 IU as D-activated animal sterol; vitamin E, 33 IU
as alpha tocopherol acetate; vitamin K3, 2.6 mg as menadione dimethylpyrimidinol bisulphite;
thiamin, 2.0 mg as thiamine mononitrate; riboflavin, 5.9 mg; Pyridoxine, 2.0 mg as pyridoxine
hydrochloride; vitamin B12, 0.026 mg; D-pantothenic acid, 20 mg as calcium pantothenate;
niacin, 33 mg; folic acid, 0.66 mg; and biotin, 0.1 mg.
3 Provided the following quantities of minerals per kilogram of complete diet: Cu, 16
mg as copper sulfate; Fe, 165 mg as iron sulfate; I, 0.36 mg as potassium iodate; Mn, 44 mg as
manganese sulfate; Se, 0.3 mg as sodium selenite; and Zn, 165 mg as zinc oxide.

88
Table 4.4. Analyzed nutrient composition of experimental diets, as-fed basis
Item Diet: Soybean
meal
Soy
protein
product
Soy
protein
isolate
Fermented
soybean
meal
Fish
meal
Casein N-free
DM, % 91.22 92.01 91.55 92.60 94.67 95.25 91.94
CP, % 12.20 11.67 13.62 15.01 13.26 11.80 0.35
Indispensable AA, %
Arg 0.83 0.79 0.96 1.05 0.70 0.41 0
His 0.34 0.29 0.34 0.42 0.30 0.34 0
Ile 0.57 0.55 0.66 0.77 0.49 0.62 0
Leu 0.94 0.88 1.08 1.26 0.85 1.10 0.01
Lys 0.79 0.69 0.87 0.94 0.93 0.94 0
Met 0.15 0.18 0.20 0.24 0.34 0.34 0
Phe 0.63 0.60 0.72 0.82 0.49 0.62 0.01
Thr 0.45 0.42 0.49 0.59 0.47 0.46 0
Trp 0.19 0.17 0.19 0.21 0.14 0.16 <0.04
Val 0.63 0.59 0.71 0.84 0.59 0.80 0.01
Dispensable AA, %
Ala 0.53 0.51 0.58 0.72 0.78 0.36 0.01
Asp 1.35 1.27 1.55 1.75 1.06 0.81 0.01
Cys 0.20 0.17 0.18 0.24 0.11 0.07 0
Glu 2.21 2.07 2.62 2.83 1.59 2.61 0.01
Gly 0.51 0.47 0.57 0.70 0.94 0.22 0

89
Pro 0.57 0.54 0.65 0.75 0.57 1.17 0.01
Ser 0.51 0.48 0.60 0.67 0.41 0.56 0
Tyr 0.31 0.30 0.35 0.46 0.25 0.51 0.01
Total AA, % 11.71 10.97 13.32 15.26 11.01 12.10 0.08

90
Table 4.5. Apparent ileal digestibility (%) of DM, CP, and AA in experimental diets 1
Item Diet: Soybean
meal
Soy
protein
product
Soy
protein
isolate
Fermented
soybean
meal
Fish
meal
Casein SEM P-
value
DM, % 57.1x 61.4y 70.9z 61.1y 76.3u 83.3v 1.61 0.001
CP, % 66.0 x 77.2 yzu 79.3 zu 70.4 xy 71.4 xyz 81.7 u 3.63 0.009
Indispensable AA, %
Arg 83.6 xy 90.5 z 92.2 z 87.6 yz 85.2 xy 81.8 x 2.21 0.001
His 78.9 x 82.8 xy 85.5 yz 80.2 xy 81.0 xy 90.3 z 2.16 0.003
Ile 77.8 x 84.5 y 85.2 y 82.0 xy 81.4 xy 90.9 z 2.20 0.002
Leu 76.9 xy 83.8 z 84.4 z 81.5 xyz 82.5 xyz 92.0 u 2.24 0.001
Lys 74.2 xy 82.4 yz 86.2 zu 72.9 x 83.2 yzu 92.8 u 3.80 0.001
Met 78.6 x 86.2 y 86.4 y 83.8 xy 86.2 y 95.2 z 2.04 0.001
Phe 78.1 x 85.6 y 86.5 y 82.6 xy 79.5 x 91.1 z 2.09 0.001
Thr 65.2 72.6 73.8 69.0 74.8 78.5 3.30 0.062
Trp 80.0 82.1 83.1 79.1 81.9 86.0 2.12 0.128
Val 72.2 x 79.0 y 80.7 y 76.9 xy 78.3 xy 88.9 z 2.41 0.001
Mean 76.5 x 83.5 y 85.0 uz 79.8 xy 81.6 xy 89.6 z 2.38 0.003
Dispensable AA, %
Ala 66.4 77.5 76.8 73.1 80.9 76.6 3.8 0.054
Asp 74.1 x 82.5 yz 83.23 yz 77.5 xy 74.0 x 84.6 z 2.9 0.014
Cys 63.7 73.9 71.4 61.6 57.8 54.8 5.9 0.073
Glu 77.1 x 89.5 zu 88.3 yzu 81.1 xy 81.1 xyz 92.6 u 3.3 0.004

91
Gly 33.0 y 59.8 z 59.4 z 51.0 yz 67.2 z -1.8 x 8.11 0.001
Pro 22.7 45.0 60.5 56.9 15.0 62.4 17.87 0.145
Ser 72.9 x 79.1 xy 82.3 y 74.8 x 74.2 x 83.9 y 2.53 0.005
Tyr 80.3 xy 86.1 yz 86.0 y 83.8 xy 78.3 x 92.1 z 2.26 0.002
Mean 66.4 x 79.1 yz 80.6 z 74.0 xyz 70.0 xy 80.6 z 4.14 0.025
All AA 71.2 x 81.2 yzu 82.7 zu 76.8 xyz 75.6 xyz 85.0 u 3.18 0.009
x,y,z,u Means within a row lacking a common superscript letter differ (P <0.05).
1 Data are least square means of 7 observations per treatment except for fish meal
that has only 6 observations.

92
Table 4.6. Standardized ileal digestibility (%) of CP and AA in experimental diets1,2
Item Diet: Soybean
meal
Soy
protein
product
Soy
protein
isolate
Fermented
soybean
meal
Fish
meal
Casein SEM P-
value
CP, % 80.3x 92.2 yz 92.1 yz 82.2 x 85.0 xy 97.0 z 3.63 0.003
Indispensable AA, %
Arg 90.9 x 98.2 yz 98.5 z 93.5 xy 94.2 xyz 97.2 yz 2.21 0.025
His 84.0 x 88.9 xy 90.7 yz 84.4 x 87.0 xy 95.7 z 2.16 0.002
Ile 82.9 x 89.8 y 89.6 y 85.8 xy 87.5 xy 95.7 z 2.20 0.002
Leu 82.0 x 89.3 y 88.9 y 85.4 xy 88.3 y 96.5 z 2.24 0.001
Lys 79.2 xy 88.3 yz 90.8 z 77.2 x 87.7 yz 97.3 z 3.80 0.002
Met 85.5 x 92.2 y 91.7 y 88.3 xy 89.5 xy 98.5 z 2.04 0.001
Phe 84.1 x 91.9 y 91.7 y 87.2 xy 87.7 xy 97.4 z 2.09 0.001
Thr 77.4 x 85.8 xyz 85.0 xyz 78.5 xy 86.9 yz 90.9 z 3.30 0.026
Trp 84.8 x 87.5 xy 87.9 xy 83.5 xy 88.7 xy 92.0 y 2.12 0.034
Val 81.9 x 89.5 y 89.3 y 84.3 xy 89.0 y 96.8 z 2.41 0.001
Mean 83.2 x 90.6 yzu 90.9 zu 85.1 xy 88.8 xyz 96.2 u 2.38 0.002
Dispensable AA, %
Ala 77.0 x 88.7 yz 86.6 yz 81.0 xy 88.4 yz 93.0 z 3.77 0.014
Asp 79.5 x 88.3 yz 88.0 yz 81.7 xy 81.1 xy 94.0 z 2.91 0.002
Cys 73.4 85.2 82.0 69.7 76.0 84.6 5.87 0.171
Glu 81.1 x 93.7 zu 91.6 yzu 84.2 xy 86.8 xyz 96.1 u 3.27 0.005
Gly 65.0 94.9 88.2 74.6 85.2 75.7 8.11 0.071

93
Pro 120.7 149.4 146.7 132.5 116.7 112.3 17.87 0.352
Ser 82.5 x 89.4 y 90.8 y 82.2 x 86.6 xy 93.0 y 2.53 0.007
Tyr 86.1 xy 92.1 yz 91.2 xyz 87.7 xy 85.7 x 95.8 z 2.26 0.017
Mean 82.9 x 96.9 z 95.0 yz 86.8 xy 88.6 xyz 97.6 z 4.14 0.020
All AA 83.0 x 94.0 zu 93.2 yzu 86.0 xy 88.8 xyz 97.0 u 3.18 0.006
x, y, z, u Means within a row lacking a common superscript letter differ (P < 0.05).
1 Data are least square means of 7 observations per treatment except for fish meal
that has only 6 observations.
2 Standardized ileal digestibility values were calculated by correcting the values
for apparent ileal digestibility for the basal ileal endogenous losses. Basal ileal
endogenous losses were determined as (g/kg DMI): CP, 19.06; Arg, 0.67; His, 0.19; Ile,
0.32; Leu, 0.52; Lys, 0.44; Met, 0.12; Phe, 0.41; Thr, 0.60; Trp, 0.10; Val, 0.67; Ala,
0.62; Asp, 0.80; Cys, 0.21; Glu, 0.96; Gly, 1.79; Pro, 6.12; Ser, 0.54, and Tyr, 0.20.
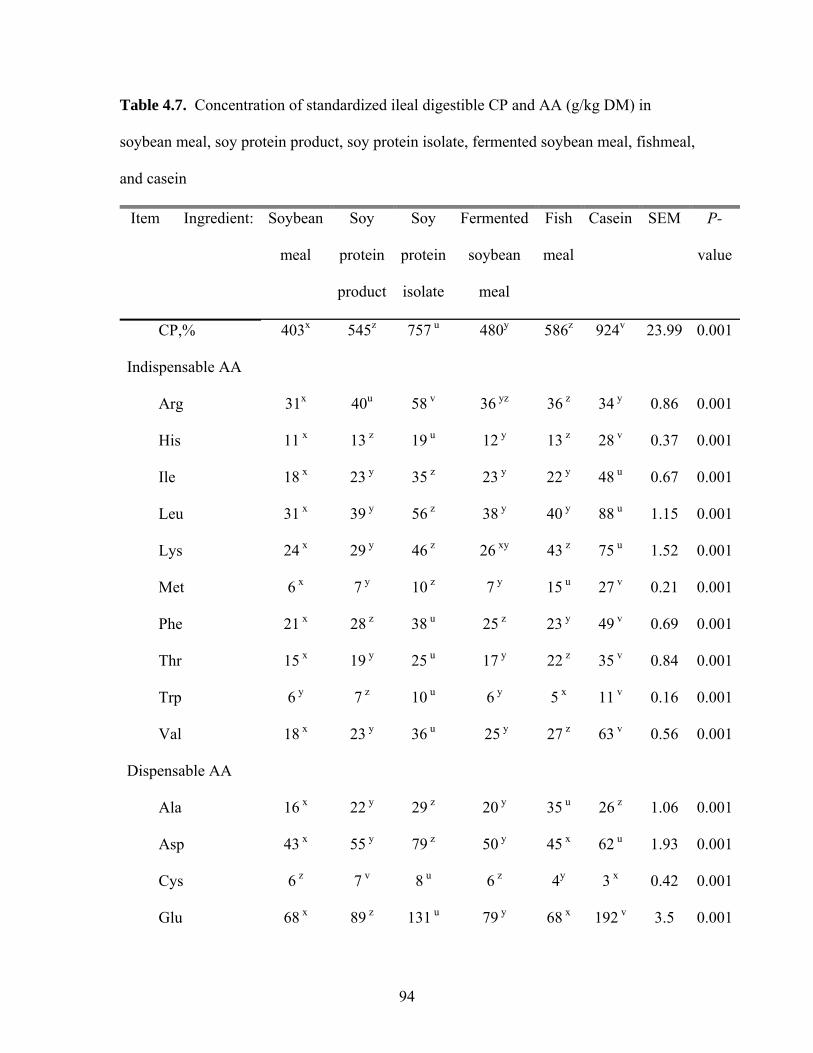
94
Table 4.7. Concentration of standardized ileal digestible CP and AA (g/kg DM) in
soybean meal, soy protein product, soy protein isolate, fermented soybean meal, fishmeal,
and casein
Item Ingredient: Soybean
meal
Soy
protein
product
Soy
protein
isolate
Fermented
soybean
meal
Fish
meal
Casein SEM P-
value
CP,% 403x 545z 757 u 480y 586z 924v 23.99 0.001
Indispensable AA
Arg 31x 40u 58 v 36 yz 36 z 34 y 0.86 0.001
His 11 x 13 z 19 u 12 y 13 z 28 v 0.37 0.001
Ile 18 x 23 y 35 z 23 y 22 y 48 u 0.67 0.001
Leu 31 x 39 y 56 z 38 y 40 y 88 u 1.15 0.001
Lys 24 x 29 y 46 z 26 xy 43 z 75 u 1.52 0.001
Met 6 x 7 y 10 z 7 y 15 u 27 v 0.21 0.001
Phe 21 x 28 z 38 u 25 z 23 y 49 v 0.69 0.001
Thr 15 x 19 y 25 u 17 y 22 z 35 v 0.84 0.001
Trp 6 y 7 z 10 u 6 y 5 x 11 v 0.16 0.001
Val 18 x 23 y 36 u 25 y 27 z 63 v 0.56 0.001
Dispensable AA
Ala 16 x 22 y 29 z 20 y 35 u 26 z 1.06 0.001
Asp 43 x 55 y 79 z 50 y 45 x 62 u 1.93 0.001
Cys 6 z 7 v 8 u 6 z 4y 3 x 0.42 0.001
Glu 68 x 89 z 131 u 79 y 68 x 192 v 3.5 0.001
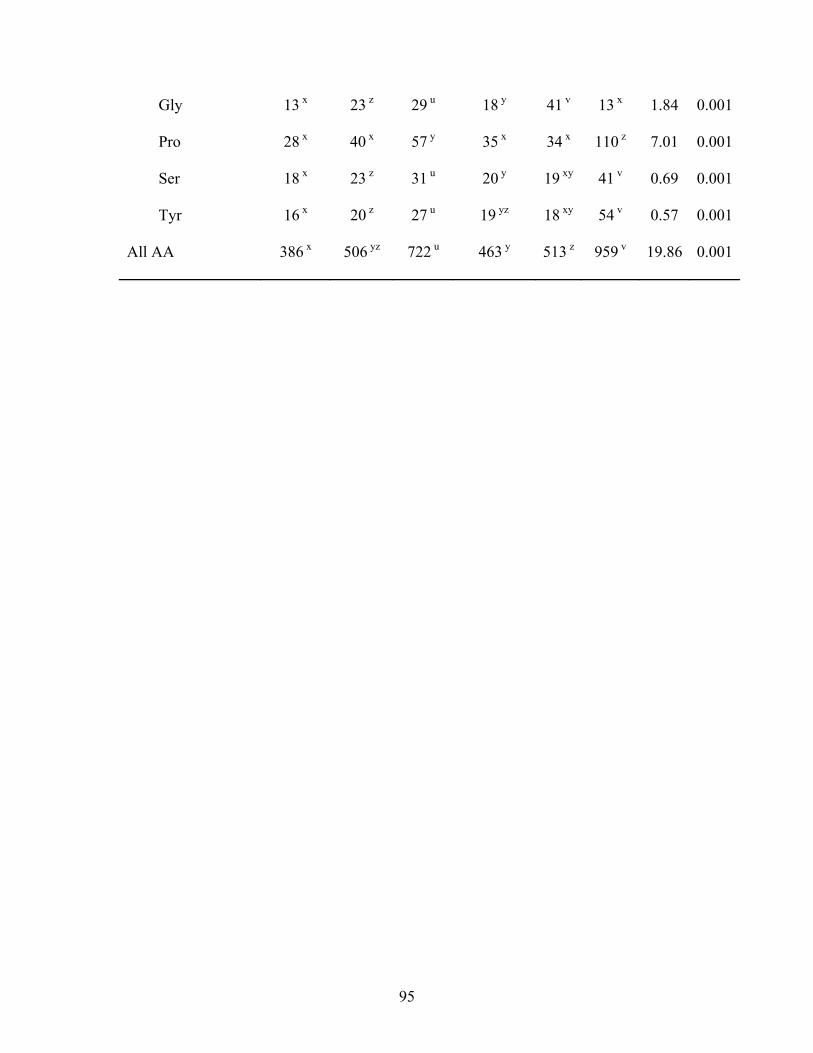
95
Gly 13 x 23 z 29 u 18 y 41 v 13 x 1.84 0.001
Pro 28 x 40 x 57 y 35 x 34 x 110 z 7.01 0.001
Ser 18 x 23 z 31 u 20 y 19 xy 41 v 0.69 0.001
Tyr 16 x 20 z 27 u 19 yz 18 xy 54 v 0.57 0.001
All AA 386 x 506 yz 722 u 463 y 513 z 959 v 19.86 0.001

96
CHAPTER 5
Duodenal and ileal amino acid digestibility and reactive Lys digestibility in pigs, and
rumen undegraded protein in dairy cows of conventional and treated soybean meals
ABSTRACT: Two experiments were conducted to evaluate the digestibility of CP and
AA in a conventional soybean meal (SBM) and in 3 SBM that had been treated to
increase the amount of rumen undegradable protein (RUP). Experiment 1 was conducted
to measure the apparent (ADD) and standardized (SDD) duodenal and apparent (AID)
and standardized (SID) ileal digestibility of CP and AA in each of the 4 SBM in pigs.
Four cornstarch-based diets were prepared with each of the 4 sources of SBM as the only
source of CP and AA in the diets. A nitrogen-free diet was also used to measure
endogenous CP and AA losses. Five growing barrows were fitted with duodenal and
ileal cannulas and were arranged in a 5 × 5 Latin square design with 5 diets and five 9-d
periods. Ileal digesta were collected on d 6 and 7 of each period and duodenal digesta
were collected on d 8 and 9. Collected samples were lyophilized and analyzed for DM,
chromium, CP, and AA. Reactive Lys was measured in each source of SBM using 3
different procedures (homoarginine, furosine, and sodium borohydride). The ADD, SDD,
AID, and SID of CP and AA and the ADD, AID, and small intestinal disappearance of
reactive Lys were calculated. Experiment 2 was conducted to measure the RUP of each
SBM using an in-situ procedure. Four lactating Holstein dairy cows that were fitted with
a rumen cannula were used. Samples for each SBM were weighed into N-free bags that
were either not incubated or incubated in the rumen for 8, 16, and 24 h. All bags,
including the non-incubated bags, were rinsed in cold water and in-situ residues were

97
analyzed for DM and CP. Rumen undegraded protein was calculated from CP fractions
obtained from the N disappearance. Results of the experiment showed that conventional
SBM had greater concentrations of AA, greater SDD (P < 0.05) and SID of AA, greater
(P < 0.05) concentration of reactive Lys, and greater (P < 0.05) ADD of reactive Lys, but
lower (P < 0.05) RUP than treated SBM. The SDD and SID of most AA in 1 of the
treated SBM was similar to the SDD and SID in conventional SBM, but the other 2
treated SBM had digestibility values for AA that were lower (P < 0.05) than conventional
SBM. The SID of Lys, the concentration of reactive Lys, the AID of reactive Lys and the
small intestinal disappearance of reactive Lys were not different among the treated SBM.
Among the reactive Lys procedures, the homoarginine procedure provided the best
estimate (R2=0.77) for RUP in SBM.
Keywords: amino acids, dairy cows, digestibility, reactive Lys, rumen
undegraded protein, soybean meal
INTRODUCTION
Heat treatment of soybean meal (SBM) protects the proteins from ruminal
proteolysis and increases the supply of dietary proteins to the small intestine for
absorption (Firkins and Fluharty, 2000). Heating SBM in the presence of reducing sugars
promotes the Maillard reaction, which is believed to be the mechanism that makes
proteins unavailable for microbial digestion in the rumen (Faldet et al., 1992). Among all
AA, the availability of Lys is most affected during the Maillard reaction because the
reducing sugar binds to the epsilon amino group of Lys, which makes the Lys
biologically unavailable (Finot, 2005). However, upon reaching the acidic environment in
the stomach, the Lys that is bound in the very early Maillard reaction products is believed

98
to be released from the reducing sugar, making it available for absorption in the small
intestine (Finot, 1982). The proper control of heating of the SBM is critical, because
overheating of the SBM produces Amadori compounds and late Maillard reaction
products that cannot be converted back to Lys. These compounds are unavailable to the
animal, and their production results in a loss of nutritive value of the SBM.
Dietary Lys that has been damaged during heating may be analyzed as normal
Lys although it is not bio-available to the animal. The dietary Lys that is bio-available is
called reactive Lys. Several methods such as the homoarginine procedure, the furosine
procedure, and the sodium borohydride procedure may be used to estimate the
concentration of reactive Lys in a feed ingredient (Mauron and Bujard, 1964; Thomas,
1972). However, only the homoarginine procedure has been used to evaluate the effect
of heating on the nutritional value of SBM (Rutherfurd et al., 1997).
The objective of this experiment was to estimate small intestinal disappearance of
treated SBM using the pig as a model and to test the hypothesis that reactive Lys
procedures can be used to predict the ruminal by-pass value in heated SBM.
MATERIALS AND METHODS
Soybean Meal samples
Three SBM that had been treated to increase the ruminal by-pass value, and a
conventional non-treated SBM were used (Table 1). The conventional SBM was
obtained from South Dakota Soybean Processors, Volga, SD. The 3 by-pass SBM was a
SBM that was heated after being sprayed with lignosulfonate (LS-SBM; Surepro, Land O
Lakes, Shoreview, MN), a SBM that was heated and mixed with soybean hulls via a

99
patented process (SBM-SH; Amino Plus, AGP, Omaha, NE), and an expeller SBM (ME-
SBM; Soy Best, Grain States Soya, Inc., West Point, NE).
Industrial processes in the manufacture of SBM with high by-pass value
commonly involve heating to initiate the Maillard reaction (Firkins and Fluharty, 2000).
Lignosulfonate SBM is manufactured by spraying lignosulfonate to the SBM prior to
heating at 95°C (Castro, 2007). Lignosulfonate is a source of xylose, a highly reactive
reducing sugar that easily participates in the Maillard reaction (Can and Yilmaz, 2002,
Castro, 2007). The heating of SBM at 100°C after mixing SBM and soybean hulls at
10:1 ratio, also involves Maillard reaction because soy hulls is a source of reducing
sugars (Karr-Lilienthal et al., 2005). However, the procedure used to produce SBM-SH
is patented (Heitritter et al., 1998). The expeller process is the traditional way of
removing oil from the soybean. The heat generated in the press as the soybean is crushed
may induce the Maillard reaction because the temperature reaches 163°C (Liu, 1997).
Pig Experiment
Animals, Housing, and Experimental Design. Five growing barrows (initial
BW:57.3 ± 3.46) originating from the matings of SP-1 boars to line 13 sows (Ausgene
Intl. Inc., Gridley, IL) were equipped with a T-cannula in the anterior duodenum and
another T-cannula in the distal ileum. After surgery, pigs were transferred to individual
pens (1.2 x 1.8 m) in a temperature controlled room (22ºC) where they were allowed to
recover for 14 d. A standard corn-soybean meal diet (16% CP) was provided on an ad
libitum basis during this time. Pigs were then allotted to a 5 × 5 Latin square design with
pigs and periods comprising the rows and columns, respectively. The animal part of the

100
study was conducted at South Dakota State University, and the experiment was approved
by the Institutional Animal Care and Use Committee at South Dakota State University.
Diets and Feeding. Five cornstarch based diets were formulated (Tables 2 and
3). Four diets contained each of the SBM as the only protein and AA source. The fifth
diet was a N-Free diet that was used to measure basal ileal endogenous losses of AA.
Chromic oxide was included (0.50%) in all diets as an inert marker.
Feed was provided in quantities equal to 3 times the estimated daily requirement
for maintenance (106 kcal ME per kg 0.75; NRC, 1998). The daily allotment of feed was
divided into 2 equal meals that were provided at 0800 and 2000. Water was available at
all times.
Data and Sample Collections. Pig BW were recorded at the beginning of the
experiment and at the end of each period. Each period lasted 9 d and pigs were allowed
to adapt to their diet for the initial 5 d of each period. On d 6 and 7, ileal digesta were
collected for 12 h as described by Stein et al. (1999). On d 8, duodenal samples were
collected from 0800 to 1000, from 1200 to 1400, and from 1600 to 1800. On d 9,
duodenal samples were collected from 1000 to 1200, from 1400 to 1600, and from 1800
to 2000. During the ileal and duodenal collections, a 225-ml plastic bag was attached to
the cannula barrel using a cable tie and digesta flowing into the bag were collected. Bags
were removed every 30 minutes or when full and replaced with a new bag. Digesta were
immediately stored at -20ºC to prevent bacterial degradation of the AA in the digesta. At
the completion of 1 experimental period, pigs were given access to a new diet.
Ileal and duodenal samples were thawed at the conclusion of the experiment,
mixed within animal and diet, and a subsample was collected for chemical analysis.

101
Digesta samples were lyophilized and finely ground prior to analysis. A sample of each
diet and each protein source was also collected.
Chemical Analysis. The SBM was analyzed for crude fat (Thiex et al. 2003)
using a Soxtec 2050 automatic system (Foss analytical AB, Höganäs, Sweden) and NDF
using the procedure of Holst (1973). All samples were analyzed for DM (procedure
4.1.06; AOAC, 2000), and CP (procedure 4.2.08; AOAC, 2000). Chromium
concentrations in diets and ileal digesta were determined after nitric acid-perchloric acid
wet ash sample preparation (procedure 9.2.39; AOAC 2000) and AA were determined as
described by Stein et al. (1999).
Reactive Lysine Analysis. Three different reactive Lys procedures (i.e., the
homoarginine procedure, the furosine procedure, and the sodium borohydride procedure)
were used to estimate the concentration of reactive Lys in the SBM and in duodenal and
ileal samples. The homoarginine procedure was used as described by Rutherford and
Moughan (1990) and modified by Pahm (2008). Briefly, guanidinated samples were
hydrolyzed with 6 N HCl and refluxed for 24 h (procedure 4.1.11; AOAC, 2000). The
solution obtained was evaporated to dryness using a Centrifuge evaporator (Labconco,
Kansas City, MO). Homoarginine was analyzed using cation exhange chromatography
with norleucine (Sigma-Aldrich Inc., St. Louis, MO) as the internal standard and
ninhydrin (Trione, Pickerings Laboratories, Mt. View, CA) for color development.
Homoarginine was quantified using homoarginine hydrochloride (Fisher Scientific
International Inc., Pittsburgh, PA) as the reference standard.
The furosine concentration in all samples was measured by adding 30 mL of 6 N
HCl to approximately 0.2 g sample in a 250 mL flask. Hydrolysis of the samples and

102
quantification by HPLC were performed as for the homoarginine analysis except that a
furosine standard (ε-N-2-furoymethy-lysine, Neosystems Laboratory, Strasbourg, France)
was used.
Reactive Lys was also analyzed using the sodium borohydride procedure
(Thomas, 1972) but 12 N HCl was used to hydrolyze the samples. Ground samples
weighing approximately 0.2 g were mixed with 13 mL deionized water in a 125-mL
flask and stirred slowly for 1 min using a Multimagnestir 1278 (Labline Instruments,
Melrose Park, IL) magnetic stirrer. The 125-mL flasks were packed in crushed ice for 15
min after which sodium borohydride was added at a rate of 5 mg per 5 min until 25 mg
had been added. The samples were stirred with a magnetic stirrer after every sodium
borohydride addition for 1 min. After 1 h, the flasks were removed from the ice bath and
allowed to equilibriate at room temperature for 30 min. Two mL of deionized water was
used to rinse the magnetic bar upon removal. Fifteen mL of 12 N HCl was added to the
flasks and the samples were refluxed for 24 h and analyzed for total Lys using a
procedure similar to the one used for homoarginine analysis.
Calculations. Apparent ileal digestibility (AID) and standardized ileal
digestibility (SID) values for AA in samples obtained from feeding the protein-
containing diets were calculated using equations previously published (Stein et al., 2007).
The basal endogenous flow to the distal ileum of each AA was determined from the flow
obtained after feeding the N-free diet using the equation described by Stein et al. (2007).
Apparent duodenal digestibility (ADD) and standardized duodenal digestibility
(SDD) values were also calculated using these equations but the values used in these
calculations were the concentrations of AA in the duodenal samples instead of the ileal

103
samples. Small intestinal disappearance of reactive Lys was calculated similarly except
that the AA in the feed was replaced by the concentration of reactive Lys in the
duodenum and the AA in the digesta was the concentration of the reactive Lys in the ileal
samples.
The guanidination of the SBM samples resulted in the conversion of reactive Lys
to homoarginine. The concentration of reactive Lys from homoarginine were calculated
using Equation [1] :
Reactive Lys (g/kg) = [homoarginine (g/kg)/MW homoarginine] x MW Lys [1]
where the molecular weight (MW) of homoarginine and Lys were 188 g/mole and
146.14 g/mole, respectively.
The concentration of Lys that was not converted to homoarginine is eluted as the
analytical Lys in the chromatograph. This Lys represents the Lys whose ε-amino group
participated in Maillard reactions and is unavailable to react with O-methylisourea. This
is referred to as blocked Lys.
The Amadori compound is an early Maillard reaction product that represents the
major form of blocked Lys in heated proteins (Hurrel and Carpenter, 1981). Upon acid
hydrolysis, the Amadori compound from heated proteins produce 32% furosine and 40%
regenerated Lys (Finot and Mauron, 1972). Therefore, blocked Lys can be calculated
using equation [2] (Finot et al., 1981):
Blocked Lys = 1/(32/100) × Furosine [2]
The concentration of reactive Lys in the SBM can be calculated from the relative
concentration of Lys and Furosine in the samples (equation 3).
Reactive Lys SBM (g/kg) = [total Lys – ((40/32) × Furosine)] [3]

104
However, for digested proteins, i.e. proteins in duodenal and ileal samples,
Amadori compounds produce 20.33% furosine and 49.5% regenerated Lys (Finot and
Mauron, 1972). Therefore, a different equation is used to calculate the reactive Lys in
these samples (equation 4).
Reactive Lys digesta (g/kg) = [total Lys – ((49.5/20.33) × Furosine] [4]
Sodium borohydride reduces the Amadori compounds and makes it acid stable,
which prevents the Lys that is bound in the Amadori compound from being regenerated
as Lys (Couch and Thomas, 1974; Hurrell and Carpenter, 1974). Therefore, the total Lys
that is analyzed after the sample has been treated with sodium borohydride is the Lys that
has not undergone Maillard reaction (Hurrell and Carpenter, 1981). Thus, the reactive
Lys is measured directly if this procedure is used.
Statistical Analysis. Data were analyzed using the MIXED procedure of SAS
(SAS Inst. Inc., Cary, NC). The UNIVARIATE procedure of SAS was used to confirm
the homogeneity of the variance. Outliers were determined as values that were more than
3 SD above or below the mean. No outliers were identified. An analysis of variance was
conducted to compare the effects of diet, site of digestion, and the interaction between
diet and site of digestion on the concentration of reactive Lys. Analysis of variance was
also used to compare the digestibility of reactive Lys in the SBM with diet as the fixed
effect and pig and period as the random effects. Whenever differences were detected,
treatment means were separated using the PDIFF option of SAS. The pig was the
experimental unit for all analyses and differences among treatments were considered
significant at an alpha level of 0.05.

105
In Situ Experiment
Animals, Housing, and Diets. Four lactating Holstein cows that were fitted with a
rumen cannula (Bar Diamond, Parma, ID) were used to determine the extent of ruminal N
disappearance in the 4 sources of SBM. The animals were housed in a tie-stall barn and
fed a totally mixed ration at 1000 and 1700 h. The protocol for the experiment was
approved by the Institutional Animal Care and Use Committee at the University of
Illinois.
Data and Sample Collection. Approximately 750 mg of each SBM was weighed
into 5 × 10 cm N-free polyester bags (Ankom Technology, Macedon, NY) to obtain a
sample size: surface area ratio of 15 mg/cm2. All bags were sealed by an electric sealer.
Duplicate samples were prepared for each SBM and each duplicate consisted of 4 bags
with a total of 8 bags per SBM. The samples were grouped into sets. Each set was
composed of all SBM in duplicates. Each set of samples was incubated in the rumen for
8, 16, and 24h. An additional set of samples was not incubated (0 h). After incubation,
all bags, including time 0 bags, were rinsed in cold water and placed in a washing
machine at cold cycle for the final rinse.
Chemical Analysis. All in-situ bags were dried at 55ºC to a constant weight in a
Thelco oven (Precision Scientific, Chicago, IL). Nitrogen determination was conducted
on the entire bag using the Kjeldahl method (procedure 978.02; AOAC, 2000).
Calculations. In-situ rumen degradability of CP was estimated according to the
model of Mertens and Loften (1980) using nonlinear regression (Sherrod, 2000).

106
Estimates of the different N fractions were obtained from the model and rumen
undegraded protein (RUP) was calculated based on equation [5] (NRC, 2001):
RUP = B[Kp/(Kd+Kp)] + C [5]
where B is the degradable CP fraction, Kp is the fractional rate of passage from the
rumen (assumed to be 6.25%·h-1), Kd is the fractional rate of degradation of the B
fraction, and C is the insoluble CP fraction.
Statistical Analysis. Data were analyzed using the MIXED procedure of SAS
(SAS Inst. Inc., Cary, NC). An analysis of variance was conducted to compare the
different CP fractions and RUP with diet as the fixed effect and cow as random effect.
The cow was the experimental unit. Whenever differences were detected, treatment
means were separated using the PDIFF option of SAS. Differences among experimental
treatments were considered significant at an alpha level of 0.05 and a tendency to be
significant at an alpha level between 0.05 and 0.10. Correlation analysis between RUP
and the concentration of reactive Lys, and between RUP and the concentration of blocked
Lys was conducted using Proc REG of SAS.
RESULTS
Pig experiment
The concentration of CP and crude fat in LS-SBM and SBM-SH were similar to
conventional SBM (Table 5.1). However, the concentration of crude fat in ME-SBM was
greater (6.16%), and the concentration of CP was lower in ME-SBM than in the other
SBM. The concentration of NDF was greater in all the treated SBM than in conventional
SBM.

107
The ADD of CP was negative and ranged from -30.73% in ME-SBM to -3.01% in
conventional SBM (Table 5.4). The ADD of CP and most AA in LS-SBM was similar to
values obtained in conventional SBM, but greater (P < 0.05) than in SBM-SH and ME-
SBM. With a few exceptions, the ADD of CP and AA in SBM-SH and ME-SBM were
not different from each other, but they were lower (P < 0.05) than in conventional SBM
and LS-SBM.
The SDD of CP ranged from -13.51 in ME-SBM to 10.44 in conventional SBM
(Table 5.5). The SDD of CP and AA in LS-SBM was not different from conventional
SBM. With the exception of Met, Trp, and Cys, the SDD of AA in SBM-SH were
similar to ME-SBM, but these values were lower (P < 0.05) than in conventional SBM
and LS-SBM.
The AID of CP ranged from 62.58% to 82.23%, but these values were not
different among the SBM (Table 5.6). The AID of Lys and Cys were lower (P < 0.05) in
all the treated SBM than in conventional SBM. The AID of Met was also lower (P <
0.05) in SBM-SH (69.18%) compared with conventional SBM (93.91%), but this value
was not different from LS-SBM (87.93%) and ME-SBM (86.18%). The AID of Thr
(58.02%) and Asp (61.15%) in SBM-SH were lower (P < 0.05) than in conventional
SBM (80.94 and 86.88%, respectively) and in LS-SBM (72.82 and 76.96%, respectively),
but they were not different from the AID in ME-SBM (66.75 and 73.32%, respectively).
The SID of CP (Table 5.7) ranged from 73.17% to 91.33% and was not different
among the SBM, but the SID of Lys was lower (P < 0.05) in all treated SBM compared
with conventional SBM (93.85%). The SID of Met (72.93%) and Asp (66.34%) in SBM-
SH were lower (P < 0.05) than in conventional SBM (96.16 and 90.86%, respectively),

108
but not different from ME-SBM (88.84 and 78.20%, respectively). In contrast, the SID
of Met (90.45%) and Asp (81.14%) in LS-SBM, was similar to conventional SBM and to
ME-SBM. Likewise, the AID of Cys was not different between LS-SBM (72.87%) and
conventional SBM (88.64%), but this value was greater (P < 0.05) than in SBM-SH
(60.88%) and ME-SBM (64.47%).
The concentration of reactive Lys in diets containing conventional SBM was
greater (P < 0.05) than in diets containing treated SBM, but among the treated SBM, the
concentration of reactive Lys in the diets were not different (Table 5.8). This was true
regardless of the procedure used to measure reactive Lys. When estimated using the
homoarginine or the furosine procedures, the concentration of reactive Lys in the
duodenum of pigs fed SBM-SH (1.11%) and ME-SBM (1.08%) was greater (P < 0.05)
than the concentration of reactive Lys in the diets (0.93 and 0.83, respectively) that
contained these SBM. However, the concentration of reactive Lys in the duodenum of
pigs fed conventional SBM and LS-SBM were not different from values in the diets.
When the concentration of reactive Lys was measured using the sodium borohydride
procedure, no differences between duodenal and diet samples were observed. Regardless
of the method of estimation, the concentration of reactive Lys in the ileum was lower (P
< 0.05) than the concentration of reactive Lys in the diet and in the duodenum.
The ADD of reactive Lys (Table 5.9) in ME-SBM (-33.61%) was not different
from the values for SBM-SH (-19.18%), but was lower (P < 0.05) than for conventional
SBM and LS-SBM (-3.14% and -5.85% respectively). The ADD of reactive Lys in LS-
SBM was similar to the ADD in conventional SBM and SBM-HS except when measured
using the sodium borohydride procedure where the value for SBM-SH was lower (P <

109
0.05) than the value for conventional SBM (4.67%) and LS-SBM (6.75%). For the AID
and the apparent small intestinal disappearance of reactive Lys, no differences among
SBM were observed, regardless of the procedure used to measure reactive Lys.
In Situ Experiment
The soluble fraction of the CP (Table 5.10) in ME-SBM was 33.5% and was
greater (P < 0.05) than in the other SBM. The degradable fraction of CP in LS-SBM
(85.2%) was not different from conventional SBM (81.3%), but was greater (P < 0.05)
than in SBM-SH (65.0%) and ME-SBM (50.0%). The degradable fraction of CP in ME-
SBM was not different from the degradable fraction of CP in SBM-SH, but lower (P <
0.05) than in conventional SBM. There was a tendency (P = 0.06) for a lower fractional
rate of degradation of CP in LS-SBM than in conventional SBM, but no differences were
observed for the fractional rate of degradation of CP in SBM-SH and ME-SBM
compared with conventional SBM. There was also a tendency (P = 0.07) for a greater
indigestible CP fraction in SBM-SH than in LS-SBM. The RUP ranged from 32.9% in
conventional SBM to 64.4% in LS-SBM with values for all the treated SBM being
greater (P < 0.05) than the value for conventional SBM.
The concentration of reactive Lys in the samples of SBM could not be used to
predict the RUP value of SBM (Table 5.11). However, blocked Lys measured by the
homoarginine or the furosine method provided estimates of RUP with an R2 of 77% and
66% respectively.
DISCUSSION
The concentration of CP and AA in conventional SBM was similar to the values
reported by NRC (1998; 2001), but the CP and AA values in LS-SBM, SBM-SH, and

110
ME-SBM were lower than previously reported (Awadeh et al., 2007; Castro et al., 2007).
The reduced concentration of all AA, especially Lys, in treated SBM suggests that some
AA have been destroyed during the heat treatment used to increase the RUP value.
Destroyed AA are not recovered during acid hydrolysis (Hurrell and Carpenter, 1977)
and can be detected as a reduction in AA concentration (Mauron, 1981). Advanced
Maillard reactions can also destroy Arg, His, and Cys, which explains the low
concentration of these 3 AA in the treated SBM (Hurrell and Carpenter, 1977). Low
concentrations of Lys, Arg, and His were also observed by Castro, et al. (2007) in ME-
SBM and LS-SBM.
The negative ADD for CP and most AA in the SBM suggest a contribution of
endogenous CP prior to the anterior duodenum. This is consistent with the observation of
Zebrowska et al. (1982) who reported that N and total AA contained in the duodenal
digesta of pigs was 17% and 8% greater than the N and AA ingested, respectively. The
increased N in the duodenal digesta can be attributed to the N in saliva, gastric juice, bile,
and pancreatic juice secretions that flowed to the duodenum (Low, 1979). The relatively
low values for the ADD of Gly and Pro suggest a high concentration of endogenous
secretions in the duodenal digesta because Gly is a major constituent of glychocholic
acid, which is the main bile salt in pigs (de Lange et al., 1989), and Pro is abundant in
gastric mucus (van Klinken et al., 1998).
The negative value for ADD is in contrast to the observations of Wilfart et al.
(2007) who obtained a low, but positive, ADD for CP. The difference between results
obtained in the 2 studies may be due to the big variation in duodenal digestibility values
that are usually observed (Low, 1979; Wilfart et al., 2007).

111
The very low ADD and SDD of CP and AA of SBM-SH and ME-SBM may be
caused by the type of fiber in SBM-SH or the presence of advanced Maillard reaction
products in ME-SBM. The carbohydrate fraction in soy hulls is composed of 30% pectin,
50% hemicellulose, and 20% cellulose (Kikuchi et al., 1971). Pectin is a soluble fiber
that forms gel complexes in the small intestines. The reduced AA digestibility observed
with the addition of pectin in the diet was attributed to increased endogenous secretions
of AA (de Lange et al., 1989), impaired protein digestion (Mosenthin et al., 1994), and
increased digesta viscosity (Buraczewska et al., 2007). The presence of advanced
Maillard reaction products, such as premelanoidins, may also inhibit the activity of
pancreatic carboxypeptidases (Hansen and Millington, 1979; Öste, et al., 1987), which
may increase endogenous AA losses and reduce values for AID. This hypothesis is
supported by the observation of Marty and Chavez (1995) who reported that the
endogenous flow of Lys increased in pigs fed roasted SBM compared with pigs fed non-
roasted SBM.
The reduced AID and SID of Lys in treated SBM compared with conventional
SBM reflects the effect of heat treatment on Lys. Aside from Lys blockage through early
Maillard reactions, cross-linkages established by Lys and other AA between polypeptide
chains within a protein during heating are enzyme resistant (Hurrell and Finot, 1985;
Gerrard, 2002). These modified proteins are not digested resulting in decreased
digestibility of AA (Hurrell and Finot, 1985; Finot, 1982). The presence of
premelanoidins may also block absorption sites due to steric hindrances, which reduces
the digestibility of AA and peptides (Ford, 1973). This is consistent with the results of
Marty and Chavez (1995) who reported greater endogenous losses and greater ileal

112
recovery of exogenous Lys in pigs fed by-pass SBM compared with pigs fed
conventional SBM.
The lower concentration of reactive Lys in the treated SBM than in conventional
SBM supports the hypothesis that the Lys in the treated SBM was blocked or destroyed
in Maillard reactions. Endogenous Lys contributed to the increase in the concentration
of reactive Lys in the duodenum, but for pigs fed SBM-SH and ME-SBM, the release of
Lys from Schiff bases, an intermediate formed after the condensation of the ε-amino
group of Lys to a sugar, may be the reason for the increase in the concentration of
reactive Lys in the duodenum. Schiff bases are unstable compounds but they are
biologically available (Finot, 1982). In the low pH of the stomach, the Schiff bases
disassociates to Lys and its corresponding reducing sugar (Finot, 1982). Thus, the
concentration of the Schiff bases in SBM-SH and ME-SBM may have contributed to the
increase in the concentration of reactive Lys in the duodenum to such an extent that the
concentration was greater than the concentration of reactive Lys in the diet. To our
knowledge, this is the first time that the 3 reactive Lys procedures have been used to
evaluate treated SBM and the first time that the presence of Schiff bases has been
suggested to contribute to the increase in the concentration of reactive Lys in the
duodenum of pigs fed treated SBM. A similar observation was reported by Awadeh et al.
(2007) who observed that the concentration of FDNB-reactive Lys in rumen residues
where greater than in their respective treated SBM.
The concentration of RUP in conventional SBM that was measured in this study
is similar to values reported previously (Can and Yilmaz, 2002; NRC, 2001). The low
RUP of the conventional SBM is attributed to a high degradable CP fraction and a high

113
fractional rate of degradation. The high RUP of the treated SBM confirms that controlled
non-enzymatic browning is an effective method of increasing RUP (Can and Yilmax,
2002; Castro et al., 2007). However the RUP was different among the treated SBM and
this is consistent with the results of Awawdeh et al. (2007) who reported that the RUP of
ME-SBM is lower than that of LS-SBM. The low RUP in ME-SBM was a function of
the low concentration of degradable CP, a higher fractional rate of degradation, and a
greater fraction of soluble CP compared with LS-SBM. A greater fraction of soluble CP
in ME-SBM was also observed by Awawdeh et al. (2007). In contrast, Castro et al.
(2007) did not observe differences in the effective degradability among LS-SBM, SBM-
SH, and ME-SBM.
The concentration of reactive Lys in the SBM did not correlate well with the
RUP of the SBM as reflected by the low R2 values. However, the calculated
concentration of blocked Lys measured by the homoarginine procedure was a better
predictor of RUP. The reason for this observation is that blocked Lys is a direct measure
of the Lys that is bound in Amadori compounds (Hurrell and Carpenter, 1981). As more
heat is applied, the concentration of blocked Lys increases, resulting in an increased RUP
value but also a reduced digestibility of Lys.
The low AID of AA in pigs fed treated SBM suggests that the feeding value of
treated SBM is lower than conventional SBM, however, treated SBM increases milk
yield in dairy cows (Sahlu, et al., 1984). This indicates that the degree of damage
attributed to heating, is less than the degree of damage caused by rumen microbial action
in conventional SBM. More AA therefore, reaches the small intestines from heated
SBM. This may also indicate that the pig is not a suitable model to evaluate treated SBM

114
because the rumen microbes may reverse the negative effects of heating by producing
enzymes that can hydrolyze the Amadori compounds. Micro-organisms from the hind
gut can degrade Amadori compounds (Finot and Magnenat, 1981) and Amadoriases,
enzymes that are capable of breaking the bond between the AA and the sugar in the
Amadori compound, was isolated from several fungi and bacteria (Takahashi, et al. 1997;
Capuano et al., 2007). The hypothesis that micro-organisms in the rumen may produce
such enzymes is possible.
In conclusion, heat processing of SBM affected the AA concentration, SDD and
SID of AA, the concentration of reactive Lysine, and the concentration of RUP in SBM.
Conventional SBM contained a greater concentration of AA, had greater SDD and SID of
AA, had a greater concentration of reactive Lys, but a lower RUP value compared with
the treated SBM. Among the treated SBM, LS-SBM provided the greatest RUP and SDD
and SID of most AA, except Lys. However, the SID of Lys, the concentration of reactive
Lys, and the AID of reactive Lys was not different among the treated SBM. The
concentration of blocked Lys estimated by the Homoarginine or the furosine procedure
may be used to predict RUP values in treated SBM.

115
LITERATURE CITED
AOAC. 2000. Official Methods of Analysis. 17th ed. Assoc. Anal. Chem., Gaithersburg,
MD.
Awawdeh, M. S., E. C. Titgemeyer, J. S. Drouillard, R. S. Beyer, and J. E. Shirley. 2007.
Ruminal degradability and lysine bioavailability of soybean meals and effects on
performance of dairy cows. J. Dairy Sci. 90:4740-4753.
Buraczewska, L., E. Święch, A. Tusnio, M. Taciak, M. Ceregrzyn, and W. Korczyński.
2007. The effect of pectin on amino acid digestibility and digesta viscosity,
motility and morphology of the small intestine, and on N-balance and
performance of young pigs. Livest. Sci. 109:53-56.
Can, A., and A. Yilmax. 2002. Usage of xylose or glucose as non-enzymatic browning
agent for reducing ruminal protein degradation of soybean meal. Small Rumin.
Res. 46:173-178.
Capuano, E., F. Fedele, C. Mennella, M. Visciano, A. Napolitano, S. Lanzuise, M.
Ruocco, M. Lorito, M. D. del Castillo, and V. Fogliano. 2007. Studies on the
effect of Amadoriase from Aspergillus fumigatus on peptide and protein glycation
in vitro. J. Agric. Food Chem. 55:4189-4195.
Castro, S. I. B, L. E. Phillip, H. Lapierre, W. P. Jardon, and R. Berthiaumet. 2007.
Ruminal degradability and intestinal digestibility of protein and amino acids in
treated soybean meal products. J. Dairy Sci. 90:810-822.
de Lange, C. F. M., W. C. Sauer, R. Mosenthin, and W. B. Souffrant. 1989. The effect
of feeding different protein-free diets on the recovery and amino acid composition

116
of endogenous protein collected from the distal ileum and feces in pigs. J. Anim.
Sci. 67:746-754.
Demjanec, B., N. R. Merchen, J. D. Cremin, C. G. Aldrich, and L. L. Berger. 1995.
Effect of roasting on site and extent of digestion of soybean meal by sheep: I.
Digestion of nitrogen and amino acids. J. Anim. Sci. 73:824-834.
Faldet, M. A., L. D. Satter, and G. L. Broderick. 1992. Determining optimal heat
treatment of soybeans by measuring available lysine chemically and biologically
with rats to maximize protein utilization by ruminants. J. Nutr. 122:151-160.
Finot, P. A., and E. Magnenat. 1981. Metabolic transit of early and advanced
Maillard products. Prog. Food Nutr. Sci. 5:193-207.
Finot, P. A. 1982. Non-enzymatic browing products: physiologic effects and metabolic
transit in relation to chemical structure. A review. Diabetes 31:22-28.
Finot, P. A. 2005. The absorption and metabolism of modified amino acids in processed
foods. J. AOAC Intl. 88:894-902.
Finot, P. A., and E. Magnenat. 1981. Metabolic transit of early and advanced Maillard
products. Prog. Food Nutr. Sci. 5 :193-207.
Finot, P. A., and J. Mauron. 1972. Le blocage de la lysine par la réaction de Maillard. II.
Propriétés chimiques des dérivés N-(désoxy-1-D-fructosyl-1) et N-(désoxyl-1-D-
lactosyl-1) de la lysine. Helv. Chim. Acta. 55:1153-1164.
Firkins, J. L., and F. L. Fluharty. 2000. Soy products as protein sources for beef cattle
and dairy cattle. Page 182-214 in Soy in Animal Nutrition. J. K. Drackley, ed.
Federation of Animal Science Societies, Savoy, IL.

117
Ford, J. E. 1973. Some effects of processing on nutritive value. Page 515-529 in
Proteins in Human Nutrition. J. W. G. Porter and B. A. Rolls, ed. Academic
Press, NY.
Gerrard, J. A. 2002. Protein-protein crosslinking in food: methods, consequences,
applications. Trends in Food Sci. & Technol. 13:391-399.
Goering, H. K., P. J. Van Soest, and R. W. Hemken. 1973. Relative susceptibility of
forages to heat damage as affected by moisture, temperature, and pH. J. Dairy
Sci. 56:137-143.
Hansen, L. P. and R. J. Millington. 1979. Blockage of protein enzymatic digestion
(carboxypeptidases-B) by heat-induced sugar-lysine reactons. J. Food Sci.
44:1173-1177.
Heitritter, G. V., J. B. Yeates, and P. L. Huffman. 1998. Method for manufacturing
protein protected ruminant feed. US Pat. No. 5,824,355. http://www.uspto.gov/
Accessed June 16, 2007.
Holst, D. O. 1973. Holst filtration apparatus for Van Soest detergent fiber analysis. J.
AOAC. 56:1352-1356.
Hussein, H. S., B. Demjanec, N. R. Merchen, and C. G. Aldrich. 1995. Effect of
roasting on site and extent of digestion of soybean meal in sheep: II. Digestion of
artifacts of heating. J. Anim. Sci. 73:835-842.
Hurrell, R. F., and K. J. Carpenter. 1974. Mechanism of heat damage in proteins 4. The
reactive lysine content of heat-damaged material as measured in different ways.
Br. J. Nutr. 32:589-604.

118
Hurrell, R. F., and K. J. Carpenter. 1977. Mechanism of heat damage in proteins. 8. The
role of sucrose in the susceptibility of protein foods to heat damage. Br. J. Nutr.
38:285-297.
Hurrell, R. F., and K. J. Carpenter. 1981. The estimation of available lysine in foodstuffs
after the Maillard reaction. Prog. Food Nutr. Sci. 5:159-176.
Hurrell, R. F., and P. A. Finot. 1985. Effects of food processing on protein digestibility
and amino acid availability. Page 233-246 in Digestibility and Amino acid
Availability in Cereals and Oilseeds. J. W. Finley and D. T. Hopkins, eds.
American Association of Cereal Chemist, St. Paul, MN.
Karr-Lilienthal, L K., C. T. Kadzere, C. M. Grieshop, and G. C. Fahey, Jr. 2005.
Chemical and nutritional properties of soybean carbohydrates as related to
nonruminants: A review. Livest. Prod. Sci. 97:1-12.
Kikuchi, T., S. Ishii, D. Fukushima, and T. Yokotsuka. 1971. Food chemical studies on
soybean polysaccharide. Part I. Chemical and physical properties of soybean cell
wall polysaccharide and their changes during cooking. J. Agric. Chem. Soc.
45:228-234.
Liu, K. 1997. Soybeans: Chemisty, Technology, and Utilization. Chapman and Hall,
NY.
Low, A. G. 1979. Studies on digestion and absorption in the intestines of growing pigs
5. Measurements of the flow of nitrogen. Br. J. Nutr. 41:137-156.
Marty, B. J., and E. R. Chavez. 1995. Ileal digestibilities and urinary losses of amino
acids in pigs fed heat processed soybean products. Livest. Prod. Sci. 43:37-48.

119
Mauron, J. 1981. The Maillard reaction in food; A critical review from the nutritional
standpoint. Prog. Food Nutr. Sci. 5:5-35.
Mauron, J., and E. Bujard. 1964. Guanidination, an alternative approach to the
determination of available lysine in foods. Page 489-490 in Proc. 6th Int. Congr.
Nutr. Edinburgh, Scotland.
Mertens, D. R., and J. R. Loften. 1980. The effect of starch on forage fiber digestion
kinetics in vitro. J. Dairy Sci. 63: 1437-1416.
Mosenthin, R., W. Sauer, and F. Ahrens. 1994. Dietary pectin’s effect on ileal and fecal
amino acid digestibility and exocrine pancreatic secretions in growing pigs. J.
Nutr. 124: 1222-1229.
NRC. 1998. Pages 110-142 in Nutrient Requirements of Swine. 10th rev. ed. Natl. Acad.
Press, Washington, D.C.
NRC. 2001. Pages 43-65 in Nutrient Requirements of Dairy Cattle. 10th rev. ed. Natl.
Acad. Press, Washington, D.C.
Öste, R. E., R. Miller, H. Sjöström, and O. Norén. 1987. Effect of maillard reaction
products on protein digestion. Studies on pure compounds. J. Agric. Food.
Chem. 35: 938-942.
Pahm, A. A. 2008. Factors affecting reactive Lysine measurement in distillers dried
grains with solubles and its relationship with standardized ileal digestible lysine in
growing pigs. Ph.D dissertation, University of Illinois Urbana-Champaign,
Urbana, IL.
Rutherfurd, S. M., and P. J. Moughan. 1990. Guanidination of lysine in selected dietary
proteins. J. Agric. Food Chem. 38:209-211.

120
Rutherfurd, S. M., P. J. Moughan, and L. van Osch. 1997. Digestible reactive lysine in
processed feedstuffs: Application of a new bioassay. J. Agric. Food Chem.
45:1189-1194.
Sahlu, T., D. J. Schingoethe, and A. K. Clark. 1984. Lactational and chemical
evaluation of soybean meal heat treated by 2 methods. J. Dairy Sci. 67:1725-
1738.
Sherrod, P. H. 2000. Nonlinear regression analysis program, NLREG Version 5.0.
Nashville, TN.
Stein, H. H., S. Aref, and R. A. Easter. 1999. Comparative protein and amino acid
digestibilities in growing pigs and sows. J. Anim. Sci. 77:1169-1179.
Stein, H. H., B. Sève, M. F. Fuller, P. J. Moughan, and C. F. M. de Lange. 2007. Invited
review: Amino acid bioavailability and digestibility in pig feed ingredients:
Terminology and application. J. Anim. Sci. 85:172-180.
Takahashi, M., M. Pischetsrieder, and V. M. Monnier. 1997. Isolation, purification, and
characterization of Amadoriase isoenzymes (Fructosyl Amine-oxygen
Oxidoreductase EC 1.5.3) from Aspergillus sp. J. Biol. Chem. 272:3437-3443.
Thiex, N. J., S. Anderson, and B. Gildmeister. 2003. Crude fat, hexane extraction, in
feed, cereal grain, and forage (Randall/Soxtec/Submersion method): A
collaborative study. J. Assoc. Off. Anal. Chem. Int. 86: 899-908
Thomas, M. C. 1972. A chemical method for the determination of available lysine. Ph.D
dissertation, Texas A. & M. University, College Station, TX.
Van Klinken, J. W., A. Einerhand, H. Buller, and J. Dekker. 1998. Strategic biochemical
analysis of mucins. Anal. Biochem. 265:103-116.

121
Wilfart, A., L. Montagne, P. H. Simmins, J. van Milgen, and J. Noblet. 2007. Sites of
nutrient digestion in growing pigs: effect of dietary fiber. J. Anim. Sci. 85:976-
983.
Zebrowska, T., O. Simon, R. Münchmeyer, E. Wolf, H. Bergner, and H. Zebrowska.
1982. Flow of endogenous and exogenous amino acids along the gut of pigs.
Arch. Tierernährung 32:431-444.

122
Table 5.1. Analyzed nutrient composition (%) of conventional soybean meal and 3
treated soybean meals, as-fed basis
Item
Soybean meal treatment
Conventional
Ligno-
sulfonate
Soy
hulls
Mechanical
extraction
CP, % 48.02 47.88 46.36 43.04
Crude fat, % 1.13 1.45 1.64 6.16
NDF, % 8.92 29.34 24.57 18.53
Indispensable AA, %
Arg 3.38 3.06 3.09 2.81
His 1.23 1.13 1.15 1.04
Ile 2.10 2.04 2.00 1.85
Leu 3.62 3.47 3.45 3.13
Lys 2.96 2.56 2.64 2.44
Met 0.71 0.67 0.68 0.64
Phe 2.35 2.26 2.25 2.02
Thr 1.83 1.74 1.74 1.58
Trp 0.68 0.67 0.65 0.57
Val 2.18 2.13 2.09 1.95
Dispensable AA, %
Ala 2.03 1.91 1.92 1.75
Asp 5.24 5.07 5.03 4.51
Cys 0.65 0.60 0.58 0.59

123
Glu 8.20 7.88 7.79 6.95
Gly 1.98 1.89 1.88 1.73
Pro 2.35 2.33 2.19 2.00
Ser 2.20 2.06 2.05 1.88
Tyr 1.72 1.64 1.63 1.49
Total, % 45.41 43.11 42.81 38.93

124
Table 5.2. Ingredient composition of experimental diets, as-fed basis, pig experiment
Item Diet: Soybean meal diets N-free diet
Ingredient, %
Soybean meal 37.50 -
Cornstarch 46.50 69.50
Sugar 10.00 20.00
Solka floc1 - 3.00
Soybean oil 3.00 3.00
Limestone 0.75 0.50
Monocalcium phosphate 1.15 2.40
Chromic oxide 0.50 0.50
Salt 0.40 0.40
Vitamin premix 2 0.05 0.05
Micromineral premix 3 0.15 0.15
Magnesium oxide - 0.10
Potassium carbonate - 0.40
Total, % 100.00 100.00
1 Fiber Sales and Development Corp., Urbana, OH.
2 Provided the following quantities of vitamins per kg of complete diet: Vitamin
A, 10,990 IU; vitamin D3, 1,648 IU; vitamin E, 55 IU; vitamin K, 4.4 mg; thiamin, 3.3
mg; riboflavin, 9.9 mg; pyridoxine, 3.3 mg; vitamin B12, 0.044 mg; D-pantothenic acid,
33 mg; niacin, 55 mg; folic acid, 1.1 mg; and biotin, 0.17 mg.

125
3 Provided the following quantities of minerals per kg of complete diet: Cu, 16
mg as copper sulfate; Fe, 165 mg as iron sulfate; I, 0.36 mg as potassium iodate; Mn, 44
mg as manganese sulfate; Se, 0.3 mg as sodium selenite; and Zn, 165 mg as zinc oxide.
Table 5.3. Analyzed nutrient composition (%) of diets, as-fed basis, pig experiment

126
Pro 0.89 0.91 0.71 0.77
Ser 0.84 0.81 0.66 0.71
Soybean meal treatment
Item Conventional Ligno-sulfonate Soy hulls Mechanical extraction
CP, % 18.34 16.5 15.61 14.33
Indispensable AA, %
Arg 1.30 1.19 0.97 1.06
His 0.48 0.45 0.37 0.4
Ile 0.82 0.81 0.64 0.7
Leu 1.42 1.38 1.11 1.2
Lys 1.19 0.99 0.87 0.92
Met 0.30 0.27 0.18 0.26
Phe 0.93 0.89 0.71 0.77
Thr 0.73 0.69 0.56 0.60
Try 0.26 0.25 0.24 0.19
Val 0.87 0.83 0.68 0.74
Dispensable AA, %
Ala 0.81 0.77 0.63 0.68
Asp 2.12 2.00 1.61 1.73
Cys 0.28 0.26 0.18 0.24
Glu 3.27 3.18 2.55 2.73
Gly 0.79 0.76 0.62 0.67

127
Tyr 0.55 0.50 0.45 0.51
Total AA, % 17.85 16.93 13.74 14.87

128
Table 5.4. Apparent duodenal digestibilities (%) of CP and AA in conventional soybean
meal and 3 treated soybean meals, pig experiment1
Item
Soybean meal treatment
SEM P-value Conventional
Ligno-
sulfonate Soy hulls
Mechanical
extraction
CP -3.01y -4.52y -22.23x -30.73x 5.75 0.006
Indispensable AA, %
Arg 4.56y 8.35y -25.88x -14.82x 5.50 0.001
His 2.99y 7.95y -24.54x -14.38x 4.79 0.001
Ile -2.14y 5.47y -28.30x -21.53x 5.18 0.001
Leu 1.38 y 8.18 y -26.86x -18.72x 5.19 0.001
Lys 3.50 y 3.77 y -24.50x -17.99x 4.61 0.001
Met 20.60 y 24.34z -35.11x -4.30y 10.93 0.001
Phe 3.12 y 9.36 y -26.60 x -17.17 x 5.17 0.001
Thr -1.10 y 3.09 y -31.51 x -26.82 x 5.06 0.001
Trp -13.12 y -13.60 y -25.35 y -50.27 x 6.96 0.005
Val -2.49 y 0.52 y -32.27 x -24.02 x 5.46 0.002
Mean 1.80 y 6.13 y -27.48 x -19.53 x 5.12 0.001
Dispensable AA, %
Ala -2.71 y -1.20 y -35.44 x -23.26 x 4.91 0.001
Asp 1.76 y 5.37 y -27.26 x -21.03 x 4.91 0.001
Cys -10.02 z -9.17 z -66.28 x -35.13 y 5.70 0.001

129
Gly -35.79 y -39.38 y -72.19 x -59.08 y 8.90 0.032
Pro -41.39 y -47.94 y -84.94 x -53.08 y 13.99 0.022
Ser -5.20 y 0.92 y -33.71 x -30.29 x 5.40 0.001
Tyr 1.15 y 2.79 y -34.50 x -26.69 x 6.02 0.001
Mean -5.89 y 10.37 y -46.88 x -34.52 x 5.56 0.001
All AA -2.26 y 0.39 y -33.19 x -23.09 x 5.08 0.001
x-z Means within a row lacking a common superscript letter differ (P < 0.05).
1 Data are least squares means of 5 observations per treatment except for
mechanically extracted SBM that had 4 observations.
Glu 1.54 y 7.57 y -23.89 x -17.21 x 4.63 0.001
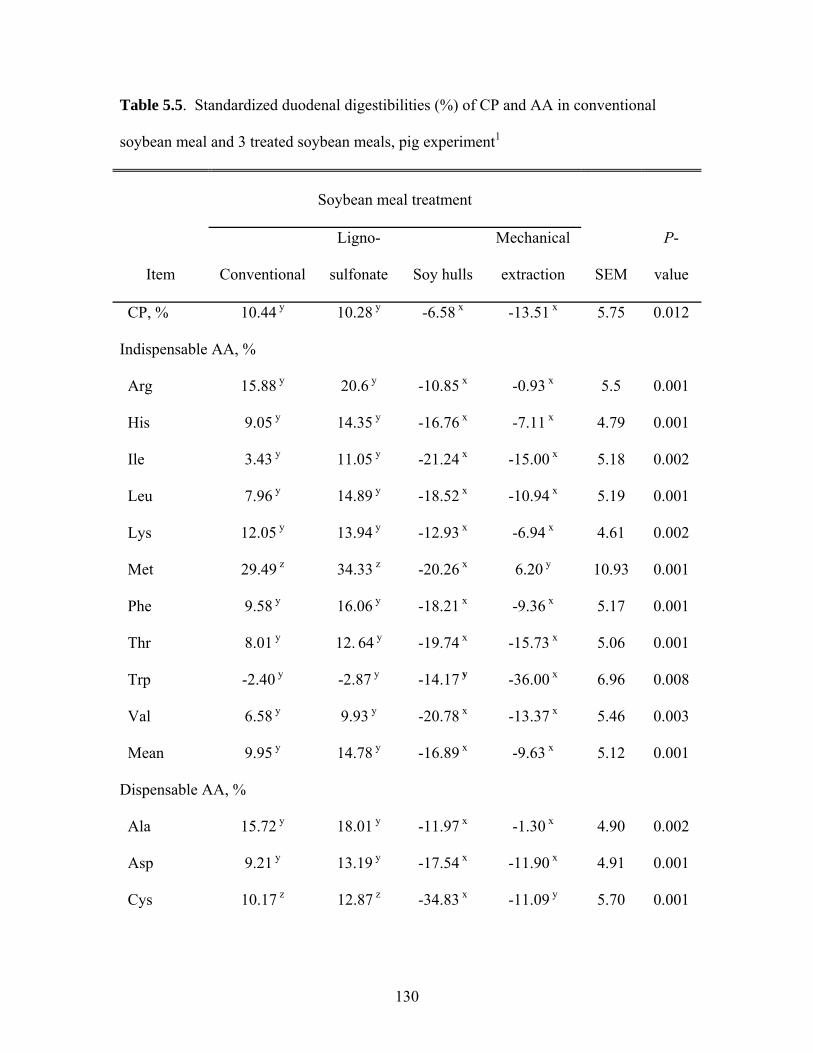
130
Table 5.5. Standardized duodenal digestibilities (%) of CP and AA in conventional
soybean meal and 3 treated soybean meals, pig experiment1
Item
Soybean meal treatment
SEM
P-
value Conventional
Ligno-
sulfonate Soy hulls
Mechanical
extraction
CP, % 10.44 y 10.28 y -6.58 x -13.51 x 5.75 0.012
Indispensable AA, %
Arg 15.88 y 20.6 y -10.85 x -0.93 x 5.5 0.001
His 9.05 y 14.35 y -16.76 x -7.11 x 4.79 0.001
Ile 3.43 y 11.05 y -21.24 x -15.00 x 5.18 0.002
Leu 7.96 y 14.89 y -18.52 x -10.94 x 5.19 0.001
Lys 12.05 y 13.94 y -12.93 x -6.94 x 4.61 0.002
Met 29.49 z 34.33 z -20.26 x 6.20 y 10.93 0.001
Phe 9.58 y 16.06 y -18.21 x -9.36 x 5.17 0.001
Thr 8.01 y 12. 64 y -19.74 x -15.73 x 5.06 0.001
Trp -2.40 y -2.87 y -14.17 y -36.00 x 6.96 0.008
Val 6.58 y 9.93 y -20.78 x -13.37 x 5.46 0.003
Mean 9.95 y 14.78 y -16.89 x -9.63 x 5.12 0.001
Dispensable AA, %
Ala 15.72 y 18.01 y -11.97 x -1.30 x 4.90 0.002
Asp 9.21 y 13.19 y -17.54 x -11.90 x 4.91 0.001
Cys 10.17 z 12.87 z -34.83 x -11.09 y 5.70 0.001

131
Glu 8.21 y 14.37 y -15.42 x -9.22 x 4.63 0.001
Gly 12.52 10.35 -11.23 -2.11 8.91 0.216
Pro 68.66 58.66 51.68 74.14 13.99 0.348
Ser 5.69 y 12.10 y -19.98 x -17.40 x 5.40 0.001
Tyr 7.32 y 10.60 y -25.83 x -18.96 x 6.02 0.001
Mean 15.83 y 13.28 y -17.36 x -6.96 x 5.56 0.002
All AA, % 13.15 y 16.48 y -13.36 x -4.59 x 5.08 0.002
x-z Means within a row lacking a common superscript letter differ (P < 0.05).
1 Data are least squares means of 5 observations per treatment except for
mechanically extracted SBM that had 4 observations.
2 Standardized duodenal digestibility values were calculated by correcting the
ADD values for the basal duodenal endogenous losses. Basal duodenal endogenous
losses were determined as (g/kg DMI): CP, 25.89; Arg, 1.55; His, 0.31; Ile, 0.48; Leu,
0.98; Lys, 1.07; Met, 0.28; Phe, 0.33; Thr, 0.70; Trp, 0.28; Val, 0.83; Ala, 1.57; Asp,
1.66; Cys, 0.60; Glu, 2.29; Gly, 4.01; Pro, 10.28; Ser, 0.96, Tyr, 0.41.

132
Table 5.6. Apparent ileal digestibilities (%) of CP and AA in conventional soybean meal
and 3 treated soybean meals, pig experiment 1
Item
Soybean meal treatment
SEM
P-
value Conventional
Ligno-
sulfonate Soy hulls
Mechanical
extraction
CP, % 82.23 75.93 62.58 66.02 6.06 0.084
Indispensable AA,%
Arg 93.33 86.57 79.06 85.82 4.38 0.116
His 89.91 80.95 68.71 77.62 5.51 0.051
Ile 87.76 80.29 67.2 76.97 6.13 0.103
Leu 87.52 80.82 68.15 77.79 5.73 0.098
Lys 89.82y 77.60x 68.89x 76.85x 4.53 0.018
Met 93.91 y 87.93 xy 69.18 x 86.18 xy 5.79 0.027
Phe 88.62 81.95 70.02 79.30 5.61 0.106
Thr 80.94 y 72.82 y 58.02 x 66.75 xy 5.73 0.039
Trp 87.63 80.43 76.11 72.45 5.02 0.140
Val 84.80 76.21 62.99 72.95 6.00 0.073
Mean 88.42 80.41 68.96 77.66 5.34 0.070
Dispensable AA, %
Ala 81.44 72.59 57.27 68.96 6.73 0.078
Asp 86.88 z 76.96 yz 61.15 x 73.32 xy 4.90 0.009
Cys 78.55y 61.85 x 45.15 x 52.45 x 6.64 0.013

133
x-z Means within a row lacking a common superscript letter differ (P < 0.05).
1 Data are least squares means of 5 observations per treatment except for
mechanically extracted SBM that had 4 observations.
Glu 89.04 82.33 69.51 78.57 5.36 0.064
Gly 72.52 58.92 43.85 50.97 7.57 0.056
Pro 66.15 41.38 40.11 54.96 12.63 0.219
Ser 84.63 76.71 65.72 73.75 5.00 0.061
Tyr 91.57 85.66 70.79 78.15 5.60 0.051
Mean 83.98 y 71.76 xy 58.39 x 69.27 xy 6.04 0.036
All AA, % 86.00 76.52 64.62 74.13 5.47 0.054

134
Table 5.7. Standardized ileal digestibilities (%) of CP and AA in conventional soybean
meal and 3 treated soybean meals, pig experiment1,2
Item
Soybean meal treatment
SEM
P-
value Conventional
Ligno-
sulfonate
Soy
hulls
Mechanical
extraction
CP, % 91.33 85.96 73.17 77.67 6.06 0.129
Indispensable AA, %
Arg 97.36 90.93 84.41 90.77 4.38 0.169
His 93.56 84.81 73.40 82.01 5.51 0.067
Ile 92.39 84.93 73.07 82.39 6.13 0.136
Leu 91.71 85.10 73.47 82.75 5.73 0.128
Lys 93.85y 82.41x 74.36x 82.06x 4.53 0.028
Met 96.16y 90.45y 72.93x 88.84xy 5.79 0.039
Phe 92.70 86.17 75.32 84.23 5.61 0.142
Thr 88.48 80.72 67.75 75.92 5.73 0.068
Trp 92.50 85.44 81.33 79.11 5.02 0.198
Val 91.31 82.97 71.24 80.61 6.00 0.107
Mean 93.04 85.31 74.95 83.27 5.34 0.099
Dispensable AA, %
Ala 89.78 81.29 67.90 78.90 6.73 0.125
Asp 90.86y 81.14y 66.34 x 78.20 xy 4.89 0.012
Cys 88.64y 72.87xy 60.88 x 64.47 x 6.64 0.031

135
Gly 88.77 75.65 64.36 70.13 7.57 0.118
Pro 117.75 91.36 104.17 114.61 107.47 0.228
Ser 90.75 83.00 73.44 80.99 5.00 0.094
Tyr 95.21 89.62 75.19 82.07 5.59 0.060
Mean 93.95 82.62 71.95 81.93 6.04 0.079
All AA, % 93.48 84.33 74.25 83.11 5.47 0.091
x-z Means within a row lacking a common superscript letter differ (P < 0.05).
1 Data are least squares means of 5 observations per treatment except for
mechanically extracted SBM that had 4 observations.
2 Standardized ileal digestibility values were calculated by correcting the AID
values for the basal ileal endogenous losses. Basal ileal endogenous losses were
determined as (g/kg DMI): CP, 17.53; Arg, 0.55; His, 0.18; Ile, 0.40; Leu, 0.63; Lys,
0.50; Met, 0.07; Phe, 0.40; Thr, 0.58; Trp, 0.13; Val, 0.59; Ala, 0.71; Asp, 0.89; Cys,
0.30; Glu, 1.18; Gly, 1.35; Pro, 4.82; Ser, 0.54, Tyr, 0.21.
Glu 92.49 85.85 73.90 82.71 5.36 0.082

136
Table 5.8. Concentration of reactive Lys (%) estimated by homoarginine, furosine, or
sodium borohydride procedures in conventional soybean meal and 3 treated soybean meals
in diets, duodenal, and ileal samples, pig experiment 1
Soybean meal treatment
SEM
P-value
Conven-
tional
Ligno-
sulfonate
Soy
hulls
Mechanical
extraction Diet Site
Diet*
Site
Homoarginine
Diet 1.19y 0.87 x 0.93 x 0.83 x 0.05 0.001 0.001 0.001
Duodenum2 1.23 z 0.93 x 1.11 y 1.08 y
Ileum3 0.12 0.18 0.22 0.17
Furosine
Diet 1.06 y 0.84 x 0.88 x 0.82 x 0.05 0.021 0.001 0.003
Duodenum2 1.20 z 0.94 x 1.07 y 1.07 y
Ileum3 0.11 x 0.20 xy 0.23 y 0.21 xy
Sodium borohydride
Diet 1.14 y 0.90 x 0.87 x 0.89 x 0.05 0.014 0.001 0.003
Duodenum 1.04 z 0.85 x 1.02 yz 0.95 xy
Ileum3 0.10 0.18 0.20 0.18
x-z Means within a row lacking a common superscript letter differ (P < 0.05).
1 Data are least squares means of 5 observations per treatment except for
mechanically extracted SBM that had 4 observations.

137
2 Values in the duodenum for soybean meal with soyhulls and mechanically-
extracted soybean meal are different (P < 0.05) from values in the diet, but for the other
soybean meals, no differences between diet and duodenum values was observed.
3 Ileal values are different (P < 0.05) from values in the duodenum and diet for
all soybean meals.

138
Table 5.9. Apparent digestibility and small intestinal disappearance of reactive Lys (%) measured
by homoarginine, furosine, and sodium borohydride procedures in regular soybean meal (SBM)
and different treated soybean meals, pig experiment 1
Procedure and Site
Soybean meal treatment
SEM
P-
value
Conven-
tional
Ligno-
sulfonate
Soy
hulls
Mechanical
extraction
Homoarginine
Duodenal digestibility, % -3.14z -5.85 yz -19.18 xy -33.61 x 5.01 0.003
Ileal digestibility % 90.28 79.64 76.20 78.36 4.35 0.133
Small intestinal disappearance, % 90.41 80.71 79.88 83.90 3.49 0.158
Furosine
Duodenal digestibility, % -12.88 y -10.50 y -21.39 xy -34.82 x 5.52 0.036
Ileal digestibility, % 90.28 76.64 73.57 74.19 4.45 0.052
Small intestinal disappearance, % 90.56 78.79 77.92 80.51 3.76 0.094
Sodium borohydride
Duodenal digestibility, % 4.67 yz 6.75 z -16.72x -9.82 xy 4.70 0.007
Ileal digestibility, % 90.90 80.75 76.58 78.89 4.03 0.093
Small intestinal disappearance, % 90.26 79.31 79.56 80.48 3.80 0.155
x-z Means within a row lacking a common superscript letter differ (P < 0.05).
1 Data are least square means of 5 observations per treatment except for
mechanically extracted SBM that had 4 observations.

139
Table 5.10. CP fractions, fractional rate of degradation, and rumen undegraded CP of conventional soybean meal and 3
treated soybean meals, in situ experiment 1
Components
Soybean meal treatment
SEM P-value
Conven-
tional
Ligno-
sulfonate
Soy
hulls
Mechanical
extraction
Soluble fraction, % of CP 15.7 x 15.0 x 16.5 x 33.5 y 2.8 0.001
Degradable fraction, % of CP 81.3 yz 85.2 z 65.0 xy 50.0 x 8.9 0.006
Fractional rate of degradation, %/hour 11.0 y 2.0 x 7.2 xy 9.2 y 2.5 0.060
Indigestible fraction, % of CP 3.0 xy 0.0 x 18.8 y 16.8 xy 7.1 0.074
Rumen undegraded CP, % of CP 32.9x 64.4 u 52.8 z 42.4 y 2.0 0.001
x-z Means within a row lacking a common superscript letter differ (P < 0.05).
1 Data are least squares means of 4 observations per treatment except for conventional SBM that had 3
observations.
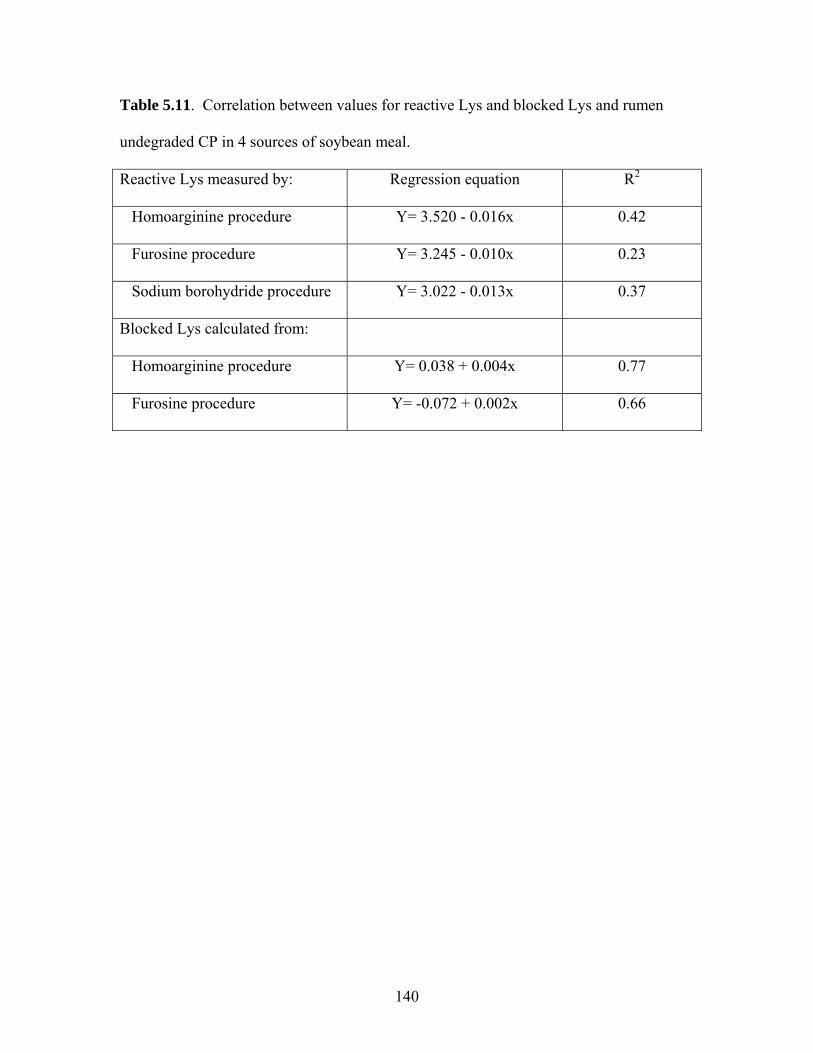
140
Table 5.11. Correlation between values for reactive Lys and blocked Lys and rumen
undegraded CP in 4 sources of soybean meal.
Reactive Lys measured by: Regression equation R2
Homoarginine procedure Y= 3.520 - 0.016x 0.42
Furosine procedure Y= 3.245 - 0.010x 0.23
Sodium borohydride procedure Y= 3.022 - 0.013x 0.37
Blocked Lys calculated from:
Homoarginine procedure Y= 0.038 + 0.004x 0.77
Furosine procedure Y= -0.072 + 0.002x 0.66

141
CHAPTER 6
CONCLUSION Advances in breeding and processing technology have expanded the application
of soybeans (SB) and SB products in food and feed. Advances in breeding, such as the
genetic selection of SB with high concentrations of CP and AA resulted to a product that
has AA concentrations more than conventional SB. Although CP and AA digestibility of
conventional and high protein SB is not different, the feeding value of high protein SB is
greater because it contributes greater digestible AA per kg/DM.
The addition of oil increases the AA digestibility. This is demonstrated in this
thesis where the addition of soybean oil to soybean meal (SBM) improve AA digestibility
to the level of SB. The main difference between SB and SBM is the oil content therefore
the increase AA digestibility of SB compared with SBM is because of the oil content.
Amino acid digestibility of fermented SBM is not different from conventional
SBM but because the AA concentrations in fermented SBM is more than conventional
SBM, the feeding value of fermented SBM is greater than conventional SBM. The
absence of the non-digestible oligosaccharides, stachyose and raffinose, in fermented
SBM may also contribute to the greater feeding value of this product compared to SBM
when fed to weanling pigs.
Treatment of SBM is effective in increasing the concentration of rumen
undegraded protein (RUP) but the feeding value of the treated SBM, as assessed by
measuring AA digestibility in pigs, is low. However, feeding treated SBM to dairy cows
resulted to increased milk yield which indicates that the pig is not a good model to
estimate digestibility of treated SBM because microbes in the rumen may reverse the

142
negative effects of heating. The concentration of blocked Lys using the homoarginine or
the furosine procedure may be used to predict RUP values in treated SBM.