Embed Size (px)
Citation preview

ANNUAL REPORT 2014/2015“TUrNiNg EvEry WorkPLAcE
iNTo A TrAiNiNg SPAcE”


01
Vision
mission
Values
Leaders in closing the skills gap
To increase access to high-quality and relevant skills development and training opportunities to support economic growth in order to reduce inequalities and unemployment and to promote employability and participation in the economy
We care
We belong
We serve

ANNUAL REPORT 2014/2015
coN
TEN
TSPArT A: gENErAL iNForMATioNForeword by the ChairpersonChief Executive Officer’s OverviewList of Abbreviations/AcronymsStatement of responsibility for the confirmation of accuracy of the Annual ReportLegislative and Other MandatesOrganisational StructureAccounting AuthorityManagement Committee
4 461011
12131415
PArT B: oPErATioNS ovErviEWIntroductionManagement of Levies and GrantsPartnershipsCareer GuidanceNSDS III Related Projects and ProgrammesQualification, Curriculum and Learning Programmes and Quality AssuranceCustomer Interaction Centre
16161720232325 26
PArT c: STrATEgy ANd rESEArchIntroductionProjects Development UnitStrategy UnitSSP Research and chambers UnitSituational AnalysisPerformance Information by Programme
28282830323233
PArT d: corPorATE SErvicESIntroduction and OverviewGovernance
424243
PArT E: hUMAN rESoUrcES MANAgEMENT
Introduction
Human Resouraces Oversight Statistics
56 56
60
PArT F: FiNANciAL iNForMATioN
Report of the Auditor General
Summary of Financial Information
Audit and Risk Committee Report
Annual Financial Statements
64 64
67
71
72

01
MP highER EducaTiOn and TRainingIt is indeed a pleasure and privilege to present to you the annual report of the Manufacturing, Engineering and Related Services SETA for the period 1 April 2014 to 31 March 2015.
I thank you and your Ministry for the unwavering support received during this accounting period and trust you will find the report in order and share our pride in contributing to the strategic objective of meaningful skills development in South Africa.
Yours Faithfully
Honourable minister b e nzimande
Raymond Patel (Dr) Chief Executive Officer
ANNUAL REPORT 2014/2015

02m
erSE
TA A
nnua
l Rep
ort 2
014/
2015
registered Name: merSETA (Manufacturing, Engineering and Related Services SETA)
registration Number: 17/merSETA/1/04/11
Physical Address: 95, 7th Avenue, cnr. Rustenburg Road Melville Johannesburg 2092
Postal Address: PO Box 61826 Marshalltown Johannesburg
Telephone Number: 010 219 3000
E-Mail Address: [email protected]
Website Address: www.merSETA.org.za
External Auditors: Auditor General (SA)
Bankers: Standard Bank Ltd
company Secretary: Ms Florence M. Nkomo
iSBN Number: 978-0-621-43747-8
rP Number: RP199/2015
merSETASocial
@merSETASocial
merSETA Social

03

04m
erSE
TA A
nnua
l Rep
ort 2
014/
2015
gEN
ErA
L iN
ForM
ATi
oN Foreword by
ThE chaiRPERsOn
a working nation is a winning nationIn a year of hard work and overachievement on targets, the merSETA continues to play a pivotal role in closing the skills gap, and helping to grow the economy.
Born in the light of hope and promise, after decades of inequity and struggle, our young democracy reached the traditional age of adulthood this year.
At 21, we hold the key to unlocking a better life for all, and the key, as any great achiever will tell you, is hard work. Science tells us that work is any effort or activity that is directed towards the accomplishment of a goal.
In South Africa, the greater goal, the shared vision, is to build a society that can proudly take its place among the winning nations of the world. A vital pillar of such a society is the creation of jobs that will help to provide sustenance, growth, dignity and prosperity for all our people.
At the merSETA, we take pride in being able to play our part in achieving this vision, in line with such far-reaching Government initiatives as the New Growth Path, the National Skills Development Strategy (NSDS III), the Industrial Policy Action Plan (IPAP2), and the Strategic Infrastructure Projects (SIPS).
Our mission at the merSETA is as important as it is ambitious. We seek to close the skills gap, by facilitating the transfer of skills, knowledge and know-how that can empower workers, boost the manufacturing and engineering sector and grow the economy.
With this in mind, I am honoured to present the Annual Report, including the Annual Financial Statements, of the Manufacturing, Engineering and Related Services Sector Education and Training Authority for the year 2014/2015.
In this, the fifth year of my stewardship, it is with great pleasure that I note that the merSETA has received yet another unqualified financial report, the 15th since its establishment.
PartnersHiPs in tHe Pursuit oF excellenceIn the year under review, the fourth year of the NSDS III lifespan, the merSETA overachieved its target against 26 of its 28 indicators.
The highest performance was recorded against indicators relating to Employed learners entering into learnerships (559%), unemployed learners entering into
05g
eneral in
Form
ation
learnerships (448%) and Employed learners entered into Skills Programmes (444%).
The achievement against unemployed bursaries was 33%, due to the transfer of bursary funding to the National Student Financial Aid Scheme (NSFAS) and the absence of the relevant performance data in this area.
Overall, the merSETA has performed well during the year, with over-achievements brought about through strategic partnerships with member companies, local and provincial governments and other active role players in the skills development arena.
As we draw towards the end of the current NSDS III cycle and our SETA licence, we look forward to a clear mandate from the department regarding the future landscape of post-school education and training.
We are confident that the great work of skills development in the manufacturing and engineering sector will continue to shape the future of our nation and contribute significantly to economic growth, human development and job creation.
goVernance witH integrityOnce again, in the year under review, the Accounting Authority continued to provide strategic direction to the merSETA, endorsing the principles and guidelines of the King III Codes to ensure that our affairs are conducted with the highest integrity.
In alignment with the standard SETA Constitution, our governance structures, including organised labour, organised employers and independent members of the Accounting Authority, have worked tirelessly in the various committees and chambers. I salute them for their efforts and dedication.
My sincere gratitude to the Honourable Minister for Higher Education and Training, Dr Blade Nzimande, the Honourable Deputy Minister, Mr Mduduzi Manana, and the Parliamentary Portfolio Committee on Higher Education for guiding our vision and direction.
My thanks also to the merSETA Deputy Chairs, Mr Xolani Tshayana and Ms Jeanne Esterhuizen, all other members of the Accounting Authority, our stakeholders, the Chief Executive Officer, management and staff for making all our achievements possible.
Let us work together to make South Africa work. Let us lead the way in closing the skills gap, and building a winning nation!
P. Baleni (neé Nzimande) (Chairperson)
06m
erSE
TA A
nnua
l Rep
ort 2
014/
2015
cHieF executiVe OFFicER’s OVERViEW
As in past years, I would like this year to seek inspiration from Khalil Gibran, who was born in 1883 in Bsharri, Lebanon, and who died in 1931 in New York City. His writing powers and philosophy came from some great reservoir of spiritual life. It is so universal and so potent, yet undoubtedly the majesty and beauty of the language with which he clothed it were all his own.
“The Prophet”, by Gibran, begins as follows: “ALMUSTAFA, the chosen and the beloved, who was a dawn unto his own day, had waited twelve years in the city of Orphalese for his ship that was to return and bear him back to the isle of his birth.
“And in the twelfth year, on the seventh day of lelool, the month of reaping, he climbed the hill without the city walls and looked seaward; and he beheld his ship coming with the mist.
“Then the gates of his heart were flung open, and his joy flew far over the sea. And he closed his eyes and prayed in the silences of his soul.”
This year I celebrate 12 years as CEO in the Sector Education and Training field and nine years as CEO of the merSETA.
learning to conquerAs we look back on a busy year of partnership and progress, the merSETA stands ready for the challenges and opportunities that lie ahead.
When you stand in the foothills of a valley, and you cast your gaze to the towering peaks, the challenge before you may seem not just daunting, but insurmountable.
How, you may wonder, is it humanly possible to scale the greatest of heights, to conquer the most hostile of environments, and plant your flag firmly at the top?
The answer lies in the very fact that we are human. It is in our nature to rise to the challenge. It is part of our being to aspire to reach the peaks.
That is why, on May 29, 1953, a New Zealand mountaineer named Edmund Hillary, and his Nepalese Sherpa guide, Tenzing Norgay, became the first people to summit the highest mountain on earth, Mount Everest.
More than 4 000 people have since reached the top of Everest, confirming Hillary’s reflection when he was asked about the scale of his achievement.
“It is not the mountains we conquer,” he said, “but ourselves.”
When we strive to achieve something great, we must first conquer our fear, our doubts, our worry that we will not be fit or ready for the task. There is only one way to find out, and that is to take the first bold step.
In our own country, 21 years ago, through collective will and inspirational leadership, we dared to conquer the inhumanity of Apartheid, and plant our new flag on the summit of a free South Africa.
But that was only the beginning of the journey.
It is Gibran who states: “Long were the days of pain I have spent within its walls, and long were the nights of aloneness; and who can depart from his pain and his aloneness without regret?”
Much has been achieved in the quest to overcome the injustices and inequalities of the past, and build a better tomorrow for all. But still, in this new world of challenge and opportunity, there are mountains left to climb.
The reality is that South Africa, for all its wealth of resources and its sophisticated infrastructure, has been

07G
eneral In
form
atIon
(Co
ntIn
UeD
)
falling behind in the race to get to the top.
Already, in the last 10 years, more than 300 000 manufacturing jobs have been lost in South Africa.
By the end of 2014, manufacturing in South Africa had endured 36 quarters of negative growth, with a steady year-on-year decline in manufacturing output as a percentage of Gross Domestic Product (GDP).
Clearly, we need to reverse this trend.The global economy is harsh and demanding, and the winning nations will be those that can best compete on the basis of their skills and know-how.
At the merSETA, our mission is to increase access to the high quality, relevant skills development and training opportunities that will help the manufacturing sector live up to this challenge.
We need to grow. We need to build. We need to create jobs, opportunities and value. We need to climb the mountain.
As Gibran says: “Work is love made visible.
“And if you cannot work with love but only with distaste, it is better that you should leave your work and sit at the gate of the temple and take alms of those who work with joy.
“For if you bake bread with indifference, you bake bitter bread that feeds but half man’s hunger.
“And if you grudge the crushing of the grapes, your grudge distils a poison in the wine.
“And if you sing though as angles, and love not the singing, you muffle man’s ears to the voices of the day and the voices of the night.”
As this 2014/2015 Annual Report shows, the merSETA is taking great strides in that direction.
As part of our mandate, we conduct skills development research and produce the Sector Skills Plan, which analyses skills in high demand, against supply.
This helps produce a scarce and critical skills list, which is combined with that of other sectors to produce the national skills list of occupations and skills in high demand for skills planning purposes.
The scarce and critical skills list is also used for awarding grants to companies in the merSETA sector.
In line with our vision of being “Leaders in Closing the Skills Gap”, the merSETA has successfully positioned itself as the leading SETA for the training and development of artisans.
During the period under review, merSETA ran 43 career guidance events, supporting almost 4 000 learners across the country.
We are helping young learners to make informed career choices in the manufacturing, engineering and related services sectors.
As part of this initiative, we launched the merSETA Career Bus, a mobile unit equipped with 12 satellite-linked computer stations. The bus allows school learners, out-of-school-youth and unemployed people to explore their career interests and technical career opportunities in the sector.
Backed by an online career portal, featuring easy-to-access information and YouTube video clips, the Career Bus is going out of its way to guide young South Africans on the road to a brighter tomorrow.

08m
erSE
TA A
nnua
l Rep
ort 2
014/
2015
On teaching, Gibran states: “If he is indeed wise he does not bid you enter the house of his wisdom, but rather leads you to the threshold of your own mind.”
In the realm of higher education, merSETA is leading the way with Masters and PhD scholarship programmes, in partnership with such local and international institutions as the University of Cape Town, University of Bremen, Tshwane University of Technology and the University of the Witwatersrand.
We also provide Higher Education institutional support in the form of merSETA Chairs in Engineering at Nelson Mandela Metropolitan University, the Tshwane University of Technology and the Walter Sisulu University in the Eastern Cape.
These encompass a number of strategic projects, providing targeted support for studies in the engineering disciplines, including industrial engineering, mechanical engineering, metallurgical engineering, mechatronics and polymer technology.
During a busy and productive year for the merSETA, we also entered into 37 agreements with TVET colleges, giving 640 NC(V) learners a golden opportunity to gain the work experience that will help them qualify as artisans.
Similar co-funded agreements were concluded with the British Council and the Saldanha Industrial Development Zone, proving the power of strategic partnerships as a gateway to empowerment and job creation.
Our nation is often celebrated for its glittering array of gold, diamonds and platinum, unearthed from the deep. But our greatest asset is our human resources.
By investing in people, by investing in potential, by turning every workplace into a place of training, we can build the stockpile of knowledge and skills that will equip us for our journey to the ultimate destination the future.
It is Gibran who reminds us:
“You would measure time the measureless and the immeasurable. “You would adjust your conduct and even direct the course of your spirit according to hours and seasons.
“Of time you would make a stream upon whose bank you would sit and watch its flowing. “But if in your thought you must measure time into seasons, let each season encircle all the other seasons, “And let today embrace the past with remembrance and the future with longing.”
The peaks ahead of us may look daunting, but they are not insurmountable. As our Father of Democracy, Nelson Mandela, once said, it always looks impossible until it’s done. Let’s strive together, let’s work together, and let’s do it!
Finally, Gibran states:
“Some of you say, ‘Joy is greater than sorrow,’ and others say, ‘Nay, sorrow is the greater’
“But I say unto you, they are inseparable.
“Together they come, and when one sits, alone with you at your board, remember that the other is asleep upon your bed.”
Chief Executive Officer
Dr Raymond Patel

09G
eneral In
form
atIon
(Co
ntIn
UeD
)

10m
erSE
TA A
nnua
l Rep
ort 2
014/
2015
AATP Accelerated Artisan Training Programme
ABET Adult Basic Education and Training
AcT The Skills Development Act No 97 of 1998 (as amended)
AET Adult Education and Training
AgSA Auditor General of South Africa
AMEo Automobile Manufacturers’ Employers Organisation
AMic Automotive Manufacturing Industry Certificate
ArPL Artisan Recognition of Prior Learning
APP Annual Performance Plan
ASgiSA Accelerated Shared Growth Initiative of South Africa
ATr Annual Training Report
ATrAMi Artisan Training and Recognition Agreement for the Metal Industry
BBBEE Broad-Based Black Economic Empowerment
BFMdP Black Female Management Development Project
BSc Balanced Scorecard
cBMT Competency Based Modular Training
cBo Community Based Organisation
cEo Chief Executive Officer
cEPPWAWU Chemical, Energy, Pulp, Paper, Wood and Allied Workers’ Union
cFo Chief Financial Officer
cLo Client Liaison Officer
cPUT Cape Peninsula University of Technology
dhET Department of Higher Education and Training
doE Department of Basic Education
doL Department of Labour
dPrU Development Policy Research Unit
dTi Department of Trade and Industry
EE Employment Equity
ESSA Department of Labour’s Employment Services of South Africa
ETQA Education and Training Quality Assurance
EXco Executive Committee
FET Further Education and Training
FLc Foundational Learning Competence
FridgE Fund for Research into Industrial Development Growth and Equity
gAAP Generally Accepted Accounting Practice
gTAc Government Technical Advisory Centre
gdS Growth and Development Summit
grAP Generally Recognised Accounting Practice
hET Higher Education and Training
iEB Independent Examination Board
LMiP Labour Market Intelligence Partnership
MANco Management Committee
NAMB National Artisan Advisory Board
Nc(v) National Certificate (Vocational)
NdP National Development Plan
NPo Non-Profit Organisation
NSA National Skills Accord
NSFAS National Student Financial Aid Scheme
NUMSA National Union of Metalworkers of South Africa
NQF National Qualifications Framework
oFo Organising Framework for Occupations
PFMA Public Finance Management Act
QcTo Quality Council for Trades and Occupations
QdP Qualification Development Partner
rAP Retrenchment Assistance Programme
SAQA South African Qualifications Authority
ScM Supply Chain Management
SETA Sector Education and Training Authority
SSP Sector Skills Plan
TLS Training Layoff Scheme
TvET Technical and Vocational Education and Training
Tr Treasury Regulations
UiF Unemployment Insurance Fund
WSP Workplace Skills Plan
LisT OF abbreViations/acronyms

11G
eneral In
form
atIon
(Co
ntIn
UeD
)
To the best of my knowledge and belief, I confirm the following:
All information and amounts disclosed in the annual report are consistent with the annual financial statements audited by the Auditor General.
The annual report is complete, accurate and free from any omissions.
The annual report has been prepared in accordance with the guidelines issued by National Treasury.
The annual financial statements (Part F) have been prepared in accordance with Generally Recognised Accounting Practice (GRAP).
The Accounting Authority is responsible for the preparation of the annual financial statements and for the judgements made in this information.
The Accounting Authority is responsible for establishing and implementing a system of internal control, designed to provide reasonable assurance of the integrity and reliability of the performance information, the Human Resources information and the annual financial statements.
The external auditors are engaged to express an independent opinion on the annual financial statements.
In our opinion, the annual report fairly reflects the operations, the performance information, the Human Resources information and the financial affairs of the public entity for the financial year ended 31 March 2015.
Yours faithfully
statement oF resPonsibility For and cOnFiRMaTiOn OF accuRacY OF ThE annuaL REPORT
Chairperson of the Accounting Authority
Ms Phindile Baleni
31 July 2015
Chief Executive Officer
Dr Raymond Patel
31 July 2015

12m
erSE
TA A
nnua
l Rep
ort 2
014/
2015
legislatiVe and OThER MandaTEs
merSETA is a Schedule 3a public entity, governed by the Public Finance Management Act No. 1 of 1999 (as amended). The entity’s mandate is derived from the Skills development Act No. 97 of 1998 and its responsibilities include the following:
i. Develop a Sector Skills Plan (SSP) within the framework of the National Skills Development Strategy (NSDS).
ii. Establish and promote learnerships through:
• identifying the need for a learnership;
• developing and registering learnerships;
• identifying workplaces for practical work experience;
• supporting the development of learning materials;
• improving the facilitation of learning; and
• assisting in the conclusion and registration of learnership agreements.
iii. Collect and disburse the skills development levies in its sector; approve workplace skills plans (WSPs) and allocate grants in the prescribed manner to employers, education and training providers and workers.
iv. Fulfil the functions of an ETQA as delegated by the QCTO.
v. Monitor education and training in the sector.
The legislative framework in which merSETA functions and policies and legislation that influence programme spending plans are:
i. National Skills Development Strategy (NSDS III);
ii. Skills Development Act No. 97 of 1998;
iii. Skills Development Amendment Act 31 of 2003;
iv. Skills Development Amendment Act 37 of 2008;
v. Sector Education and Training Authorities (SETA) Grant Regulations regarding monies received by a SETA and related matters (‘Grant Regulations’) under Notice 35940 of 3 December 2012;
vi. Skills Development Act (97/1998) Service Level Agreement Regulations under regulation No. R716 of 18 July 2005;
vii. Skills Development Levies Act 9 of 1999;
viii. Regulations regarding the establishment of Sector Education and Training Authorities under Notice R106 of 4 February 2005, (‘SETA Establishment Regulations’);
ix. Public Finance Management Act No. 1 of 1999 as amended (PFMA);
x. Treasury Regulations issued in terms of the Public Finance Management Act (‘Treasury Regulations’) of 2005;
xi. Public Audit Act 25 of 2004;
xii. Directive : Public Finance Management Act under GN647 of 27 May 2007;
xiii. Government Notice GN52 of 6 February 2010: Extension of existing period of establishment of Sector Education and Training Authorities;
xiv. Standard Constitution of SETA Regulations of 7 May 2012;
xv. Promotion of Access to Information Act;
xvi. Promotion of Administrative Justice Act;
xvii. Employment Equity Act, Labour Relations Act, Basic Conditions of Employment Act and Occupational Health and Safety Act;
xviii. Tax Laws.

13G
eneral In
form
atIon
(Co
ntIn
UeD
)
Accounting Authority
Mr Derrick Peo
Strategy & Research Executive
Chief Operations OfficerMs Lindiwe Ndlela
Chief Financial Officer Corporate Services Executive
Ms Valerie NdouMr Wayne Adams
organisational sTRucTuRE
Chief Executive OfficerDr Raymond Patel

14m
erSE
TA A
nnua
l Rep
ort 2
014/
2015
accounting auThORiTY
Dr Raymond Patel (CEO) Ms Phindile Baleni (Chairperson)
Ms Malebo Lebona Prof Fiona Tregenna
Mr Thapelo Molapo Mr Mustak Ally Mr Anton Hanekom Mr Jonathan Swarts
Ms Jeanne Esterhuizen (Deputy Chairperson)
Mr Xolani Tshayana (Deputy Chairperson)
Mr Jacobus Olivier Mr Herman Kostens Mr Johan van Niekerk
Mr Andrew Chirwa
Absent: Mr Alex Mashilo, Ms Helen Von Maltitz

15G
eneral In
form
atIon
(Co
ntIn
UeD
)
management cOMMiTTEE
Mr Derrick Peo
Ms Lindiwe Ndlela
Mr Wayne Adams
Ms Valerie Ndou
Dr Raymond Patel

16m
erSE
TA A
nnua
l Rep
ort 2
014/
2015
oPerations OVERViEW
oPE
rATi
oN
Sintroduction The Operations Division consists of four units, each with its own functions. These are: Programme Implementation, Administration, Quality Assurance and Partnerships and Client Services. The functions of the units synergise towards achieving the goals of NSDS lll, and the implementation of merSETA’s Annual Performance Plan. In line with merSETA’s values, the division aims continue to provide quality services to internal and external stakeholders, maintaining good relationships with Government and provincial departments, public institutions, communities and special interest groups through partnerships and other agreements.
The main functions of the Operations Division include the management and administration of the mandatory and discretionary grant processes. The discretionary funded projects and programme areas are reviewed annually in relation to NSDS lll, as well as ministerial directives and related national guidelines.
The education and training emphasis of the mandatory and discretionary grants, programme and project areas is facilitated through learning programmes primarily based on critical and scarce skills, identified through the SSP research. Integral to the implementation of contractual agreements is continuous monitoring and evaluation and quality assurance, which includes provider accreditations and the registration of learners, assessors and moderators. The Administration Unit provides systems-based support for the administrative processes, in collaboration with merSETA’s regional offices, managed by Client Services. merSETA has seven regional offices in Gauteng, North West, Mpumalanga/Limpopo, KwaZulu-Natal, Free State/Northern Cape, Eastern Cape and Western Cape. The seven regional offices provide services to all nine provinces and include two satellite offices in Kimberley and East London. The regional offices are geared towards becoming one-stop shops for all services required by our valued stakeholders.
During the period under review, the Quality Council for Trades and Occupations (QCTO) and the National Artisan Moderation Body (NAMB) began implementing revised policies and regulations. The responsibilities of the QCTO, as delegated by NAMB, include processing and issuing trade-related certificates. The transfer of this function from merSETA to the QCTO has led to a backlog in issuing trade certificates. While there have been interventions to deal with the backlog, it remains a challenge.
The Operations Division contributed significantly to merSETA’s achieving 26 out of the 27 numerical indicators. merSETA achieved 25 targets by more than 120% and one target by 100%. Only one target was under-achieved, namely unemployed

17o
Peration
s oVerView
bursary candidates completing their studies, as a result of the DHET’s request to transfer all available funds in this area to the National Student Financial Aid Scheme (NSFAS).
1. management oF leVies and grants
Levies receivedTotal grants paid and committed
2013/14 2014/15
200 000
400 000
600 000
800 000
1 000 000
1 200 000
1 400 000
-
Figure 1: Levies received vs grants paid and committed over a two-year period
Figure 2: distribution of discretionary grants, over a two-year period, for various learning areas
Prog ending in artisan status
Individual Learnerships
Experientials/ Internships Skills Prog RPL Other
2013/14 2 457 247 833 3 900 238 958
2014/15 3 468 645 917 5 219 526 933

18m
erSE
TA A
nnua
l Rep
ort 2
014/
2015
1.1 mandatory grants
Legislation requires companies to submit their mandatory grant applications and PIVOTAL plans annually. This is to ensure credible information from our stakeholders which contributes to the research agenda, assists in the identifying current and future skills needs of the sector.
The mandatory grant information requirements were designed to go beyond the minimum compliance requirements. The new format supports the emphasis on high-quality skills planning and reporting related to NSDS III.
Target Achievement2015
500
833
2 446
608
1 155
2 315
Target
Large
MediumSmall
Achievement2014
500
1 000
1 500
2 000
2 500
3 000
0
500
495
72183
3
2 446
2 273
Figure 3: Mandatory grant targets vs achievements over a two-year period
The mandating grant results were encouraging, thanks to the constructive and well-directed advocacy campaign in the various regions, as shown in Figures 3 and 4.
Despite changes in the funding regulations that decreased the mandatory grant award from 50% to 20%, the number of mandatory grant applications remained constant.
Disbursements of mandatory grants were slightly below budget, resulting in the current year’s total of R175 million.
The decline in mandatory grant disbursements is due to non-compliance of the sign-off requirement by labour.

19O
peratiOn
s Overview
(CO
ntin
UeD
)
2013/2014 2014/2015
Mandatory grants paid R166m R175m Mandatory levies received R237m R256m
claims ratio 70% 68%
Figure 4: Mandatory grant submissions vs approvals over a two-year period
Table 1 and Figure 5 illustrate the mandatory grant claim ratio over a two-year period. While submissions remained constant, approvals declined due to the number of companies not meeting the submission criteria as per merSETA’s Grant Policy.
629
495 72
1
1 115
2 378
2 273
Submitted
Large
MediumSmall
Approved2014
500
1 000
1 500
2 000
2 500
3 000
0
640
608
1 225
1 155
2 565
2 315
Submitted Approved2015
Table 1: Mandatory grant claims ratio over a two-year period
Figure 5: Mandatory grant claims ratio over a two-year period
To ensure the smooth running of the mandatory process during the year under review, capacity building processes were arranged to increase support to merSETA’s stakeholders. In an attempt to address challenges, 116 training committees were capacitated on skills development matters to enhance the quality of submissions.
Workshops were held in all regions on the changes impacting on the mandatory and discretionary grant processes as well as the changes to the decentralised trade testing processes. 1 420 stakeholders attended.
1.2 discretionary grants
The available funding for discretionary grants for the period under review was R1.015 billion, which included the surplus of R260 million approved by National Treasury. The discretionary grants are aimed at addressing the critical and scarce skills needs through the PIVOTAL programme application support, as well as partnerships with Technical and Vocational Education and Training (TVET) Colleges, national and provincial governments.
Of the available funding for discretionary grants, 97% was committed to contractual agreements with merSETA stakeholders, prioritised partnerships and related areas of national significance.
166 2
94 175 1
34
256 4
48
237 8
01
2014 2015
50 000
100 000
150 000
200 000
250 000
300 000
0

20m
erSE
TA A
nnua
l Rep
ort 2
014/
2015
2. PartnersHiPsNSDS lll calls for the implementation of programmes contributing to the revitalisation of vocational education and training. It requires competent lecturers and trainers to provide work-relevant education and training, and promote occupationally directed research and innovation.
Through partnership agreements with TVET colleges, universities and universities of technology, as well as national and provincial governments, merSETA established a national footprint for skills development. One objective is to support employability and contribute to the professional development of TVET educators. The agreements support localisation through networking relevant businesses, industry, national and provincial departments in providing work-integrated learning opportunities. The range of categorised partnership agreements is shown in Tables 2 and 3, representing:
• National and provincial department partnership agreements
• Public university and university of technology agreements
• TVET college agreements, specifically supporting National Certificate (Vocational) (NC(V)) learners and lecturers.
Figure 7: distribution of 2014/2015 discretionary grant awards for various learning areas
Apprentices Learnerships including Level 2-4 ending in a trade test
Experientials learners
Internship
Skills Programmes
ABET / AET
Bursaries
RPL
27%
21%36%
2%
2%
4%
4%4%

21O
peratiOn
s Overview
(CO
ntin
UeD
)
Table 2: National and provincial department partnerships
oPS Partnerships objective Partner duration
Artisan training330 artisan training-related
learnersNational Department of Public Works
Agreement end date: March 2015
Development of youth to artisans
156 apprenticeships registered (school learner/unemployed target group)
Gauteng Education Department
Agreement end date: March 2018
Governmental partnership to develop youth
100 NQF level 2 learners Limpopo Provincial Government
Agreement end date: May 2016
Governmental partnership to develop youth
200 unemployed learners on artisan programmes and 1 660 unemployed learners on skills programmes
KwaZulu-Natal Provincial Government
Agreement end date: March 2019
Governmental partnership to develop artisans
100 learners on artisan programmes
Mpumalanga Department of Public Works
Agreement end date: April 2018
Departmental partnership to develop artisans
100 learners on artisan programmes
Western Cape Department of Economic Development and Tourism
Agreement end date: March 2018
Multi-year agreement for development of people in the Eastern Cape
231 experiential learners (P1&2) / 92 learnerships / 28 apprenticeships / 31 NC(V) learners on artisan programmes
Office of the Premier in the Eastern Cape
Agreement end date: December 2015
Skills development and re-integration of offenders
Skills development of awaiting-parole offenders for re-integration into society – 40 learners in Bloemfontein and 40 in Kimberley
Department of Correctional Services: Free State/Northern Cape
Agreement end date: March 2016
Development of learners with learning difficulties
Work-integrated learning (TVET provider) – 33 disadvantaged learners with learning difficulties
Western Cape Department of Education
Agreement end date: December 2015
Skills development for the Office of the Premier in Mpumalanga
143 learners on artisan programmes / 86 for skill sets
Mpumalanga Department of Education
Agreement end date: July 2015
Skills training in the North West province
Learnerships, artisan training and skills programmes
Office of the Premier of North West
Agreement end date: March 2019
Development of military veterans in conjunction with the Department of Military Veterans
50 learners on ARPL trainingDepartment of Military Veterans
Agreement end date: March 2016
Developing artisans in a state-owned company
15 learners on apprenticeship training
State-owned entity Denel Aviation
Agreement end date: March 2016

22m
erSE
TA A
nnua
l Rep
ort 2
014/
2015
Table 3: Partnerships with universities and universities of technology
oPS Partnerships objective hEi Partners
Three-year agreement with the university in innovative and TVET supportive skills development
Mathematics and Science tutoring for Grades 10, 11 and 12 / upgrading of two Technical High School technical laboratories / Technical School support / Women in Engineering programme (WELA)
Nelson Mandela Metropolitan University, Eastern Cape
Agreement end date: July 2015
Supporting Human Resource capacity in the university to support access and throughput in engineering disciplines
The second phase in supporting mentorship of undergraduate students in Mathematics and Science (engineering-related) Training teaching assistants in the Extended Curriculum Programme at the university
University of the Western Cape, Western Cape
Agreement end date: March 2016
Capacity building at six TVET colleges
Access and CPD programmes for TVET College learners and lecturers
Free State Central University of Technology, Free State
Agreement end date: September 2016
Part of the ministerial turn-around strategy of Walter Sisulu University
Establishing a funded Chair for Engineering, STEM support, WIL and CPD, linkages with TVET colleges, light manufacturing and rural development through applied research
Walter Sisulu University, Eastern Cape
Agreement end date: 2018
Academic and skills development support for the University of Venda
Learner support for rural learners in Mathematics, Science and Technology / Development of the next generation of academics / Capacity building at TVET colleges
University of Venda, LimpopoAgreement end date: 2016
Testing a new concept of WIL via an established incubator centre
UJ experiential learners, to be placed at the incubation hub for small businesses at Resolution Circle (services to industry, as well as product and process development)
University of Johannesburg, Gauteng (A)
Agreement end date: March 2017
Work-Integrated Learning
Placement of UJ experiential learners for work-integrated learning at merSETA companies
University of Johannesburg, Gauteng (B)
Agreement end date: March 2016
Black Female Management
Black Female Management Development Programme for 50 women from merSETA companies (NQF Level 6 and 7 programmes)
University of Pretoria, Centre for Continuing Education, Gauteng
Agreement end date: December 2014
Piloting the appropriateness and applicability of newly registered Occupational Qualifications
Piloting the new QCTO Wind Turbine Service Technician qualification
Cape Peninsula University of Technology, Western Cape
Agreement end date: September 2016

23O
peratiOn
s Overview
(CO
ntin
UeD
)
During the year under review, merSETA entered into 37 agreements with TVET colleges to place 640 NC(V) learners into industry, to obtain the work-integrated experience required in becoming qualified artisans. Some agreements included lecturer support for continuous professional development and where applicable, to advance TVET lecturers towards attaining artisan status. The total value of the agreements was R94.8 million.
merSETA and the British Council have entered into a co-funded agreement to support TVET leadership development in selected TVET colleges. The total value of the partnership is R1 million.
merSETA and the Saldanha Industrial Development Zone have entered into a co-funded agreement to train 768 learners on fabrication-related skills programmes to support the fabrication hub in the Saldanha area. The total value of the partnership agreement is R10 million.
3. career guidance During the period under review, merSETA supported 3 980 learners through 43 career guidance events throughout the country. These help young learners make informed career choices in the manufacturing, engineering and related services sectors. The merSETA’s Career Bus is a mobile unit equipped with 12 satellite-linked computer stations. The bus allows school learners, out-of-school-youth and unemployed people to explore their career interests and the technical career opportunities in the sector. merSETA’s Career Bus was present at 54 career guidance events attended by 6 238 visitors in all nine provinces. A total of 42 schools were visited, and 4 859 learners participated in the career guidance information sessions. Through the respective events, 672 schools were reached.
Career guidance opportunities were enhanced by technology-based, youth-friendly approaches, welcomed by our young target groups. An online merSETA Career Portal was also launched, containing a career-related information and YouTube video clips.
4. nsds iii related ProJects and Programmes
4.1 the retrenchment assistance Programme, the training layoff scheme and the unemployment insurance Fund Programme
During the period under review merSETA continued to support the following vulnerable groups in our sector:
• retrenchees, through the Retrenchment Assistance Programme (RAP)
• current workforce employed by companies in distress, through the Training Layoff Scheme (TLS)
• retrenched workers from all sectors through the Unemployment Insurance Fund Programme (UIF).
RAP addresses the training needs of retrenched workers in the merSETA sector. It aims to equip workers with skills re-enter the labour market and/or to start their own businesses or co-operatives. During the period under review, 24 companies were assisted and six completed their training programmes. A total of 7 477 workers have benefitted from RAP interventions since the inception of the programme, which focusses on skills for sustainable livelihoods, job creation and income generation. The total cost of RAP training, inclusive of learner allowances for the period under review, amounted to R52 million.
The TLS, a government initiative that commenced in 2009, helps prevent the retrenchment of workers by providing some economic relief to companies in distress. The period under review saw 18 merSETA levy-paying companies approved for the scheme, of which three have successfully completed their training and reverted to normal operating conditions. Overall, a total of 2 962 workers stand to benefit from this intervention.
The UIF Programme is a jointly funded agreement between merSETA and the UIF. The programme aims to train 1 500 retrenched workers from various sectors in merSETA-related trades over four years. One of the

24m
erSE
TA A
nnua
l Rep
ort 2
014/
2015
criteria is that suitable unemployed candidates must be recruited from the Department of Labour’s Employment Services of South Africa (ESSA) database. The UIF funds 50% of the programme and merSETA funds 50%.
4.2 black Female management development Project (bFmdP)
Females remain under-represented in management portfolios in the male-dominated manufacturing and engineering related industries. The aim of the BFMDP Project was to support black women already in management roles or earmarked for management roles within merSETA levy-paying companies. The project attracted great interest, and 92 women were nominated, of whom 50 were selected, based on rigorous assessment focusing on their conceptual ability. The Centre for Continuing Education at the University of Pretoria was appointed as the service provider through an open tender process. The programmes were pitched at NQF levels 6 and 7, with 25 participants per group. The project was successfully completed during the period under review.
4.3 HiV and aids in the workplace
NSDS lll refers to seven developmental and transformative imperatives, which are: race, class, gender, geography, age, disability and HIV and AIDS. It was in this context that the HIV and AIDS in the Workplace Project was conceptualised and implemented in 2013, targeting 100 merSETA companies. In total 97 companies registered for the project and 83 remained dedicated until completion in March 2015. Although the initial focus was on HIV and AIDS, it was broadened in line with the new South African National Standard for wellness and disease management. This more inclusive purpose was welcomed by many of the participating companies. Companies were supported with the development of in-house wellness and/or HIV policies, based on their needs. Company wellness or HIV co-ordinators were trained to sustain productivity and counteract absenteeism through specialised interventions.
4.4 sustainable green skills development
The National Development Plan (NDP) is based on the notion of sustainability, inclusive of a focus on renewable and alternative energy sources and the related technical skills. merSETA started investigating green skills in 2012 and subsequently QCTO-related qualification development commenced to support artisan and technician specialisations in this context. merSETA has partnered with the Cape Peninsula University of Technology (CPUT) to pilot the first of these qualifications, namely the Wind Turbine Service Technician qualification.
The South African Renewable Energy Technology Centre is based at the Bellville campus of CPUT and is fully equipped to support the pilot training.
One of the first merSETA projects in the area of renewable energy was in collaboration with the East London Industrial Development Zone to support 20 learners in artisan training in renewable energy skills. The project closed out in 2014. Other initiatives include merSETA’s collaboration with the Energy and Water Resources SETA and False Bay TVET College to train 500 learners in Khayelitsha in the Western Cape on solar geyser installations. The partnership between merSETA and the British Council has as one of its objectives the development of a curriculum for solar heating and green awareness to support TVET colleges embarking on green skills development.
merSETA’s partnership with the Nelson Mandela Metropolitan University includes research and development support for renewable energy and new technology and the development of an electrical car and a solar-powered cart that could potentially lend themselves to a number of applications.
4.5 correctional services
merSETA signed a medium-term skills development agreement to provide awaiting-parole offenders with technical skills training towards their re-integration into society. The technical skills training given to the learners is complemented by business skills development

25O
peratiOn
s Overview
(CO
ntin
UeD
)
training. Upon release, the ex-offenders should be sufficiently skilled either to find employment or to start their own businesses. merSETA has successfully completed two projects, where 40 offenders participated in each of the projects at the Grootvlei prison. A public TVET College supported the training. merSETA is currently rolling out a third project in Kimberley that will focus on ensuring the availability of training equipment and the accreditation of the facility. Suitably qualified officials will be registered to deliver the programmes. merSETA intends to roll out this programme on a national level. The intention of the project is to contribute constructively to the re-integration of ex-offenders into society.
5. qualiFications, curriculum and learning Programmes and quality assurance
5.1 qualifications, curriculum and learning programmes
Qualifications, curricula and learning programmes are integral to education, training and skills development. During the year under review, merSETA, as delegated by the QCTO, co-ordinated and managed the development of 21 new occupational qualifications. Thirteen of the 21 qualifications were finalised and submitted to the QCTO. Nine occupational qualifications were fully registered.
The Foundational Learning Competence (FLC) certificate is an integral aspect of the QCTO’s qualification model. The certificate was registered as a part-qualification in previous financial years when merSETA started the first FLC pilot. During the period under review the pilot was expanded to another five contracts with merSETA companies, which included a baseline survey to investigate implementation issues and challenges. merSETA shared the findings and recommendations with the QCTO.
Negotiations commenced for further implementation pilots to evaluate the new occupational qualifications,
Figure 8: Solar-powered cart and electrical car
Figure 9: TvET / correctional services Partnership in training of offenders

26m
erSE
TA A
nnua
l Rep
ort 2
014/
2015
inclusive of an agreement with Ekurhuleni East TVET College to pilot the occupational qualifications linked to foundry occupations.
A total of 190 requests were addressed for the distribution of modularised unit-standard-based learning materials. A total of 44 skills programmes were evaluated and registered. A guideline was also developed for skills-set criteria to support employees who operate in specialised units in companies, requiring cross-cutting skills and competencies from different qualification areas. Companies subsequently developed five skills sets, which were evaluated and registered.
The management of learner contracts is legislated, requiring accurate records of all types of rescission, inclusive of terminations and withdrawals. During the financial period under review, 783 rescissions were recorded.
5.2 quality assurance
merSETA continued to perform the quality assurance activities of all unit standard-based sector-specific qualifications, as delegated by the QCTO. A total of 801 accreditation visits, 1 126 moderations and 158 audits of accredited training providers were carried out to ensure that merSETA’s quality standards were adhered to and maintained. These activities included verification of assessments, accreditation, monitoring and capacity building of providers. Fourteen capacity-building provider workshops were conducted to ensure that all new developments, particularly in the quality assurance arena, and the implementation thereof, were communicated to stakeholders.
Operations staff members also participated in policy development activities in the QCTO and the NAMB contexts. merSETA has been approved as an Assessment Quality Partner for three occupational qualifications, namely Vehicle Damage Quantifier, Solar Photovoltaic Service Technician and Wind Turbine Service Technician.
merSETA also collaborated in a pilot of the Artisan Recognition of Prior Learning Project (ARPL). This initiative is driven by the National Artisan Development Directorate on a national platform. Training commenced during the period under review for the first cohort of National Union of Metalworkers of
South Africa (NUMSA) shop stewards as candidate ARPL advisors. Based on the lessons learned, the ARPL implementation plan was revised for a further rollout in the next financial year, aimed at taking 100 employed artisan aides through the ARPL process.
6. customer interaction centre
The Customer Interaction Centre received 121 274 calls, of which 114 172 were successfully dealt with. The average answering speed is 10 seconds, with an internal quality score of 93.49%.
Figure 10: customer information centre performance for the 2014/2015 financial year
To improve efficiency, the Customer Interaction Centre assisted with quality surveys, visits to member companies, as well as companies that were awarded discretionary grants during 2011/2012 and 2012/2013, were conducted by the regional offices. Fifty per cent of companies took part in the survey. The surveys enquired whether clients were satisfied with service, and whether further assistance was required. The surveys increased interaction with stakeholders through forums and visits by the Client Liaison Officers.
2011-2012 2012-2013 2013-2014 2014-2015
20 000
40 000
60 000
80 000
100 000
120 000
140 000
4
2
0
6
8
10
12
14
16
0
Abandoned Calls Answered
Average Speed of Answer (sec)

27O
peratiOn
s Overview
(CO
ntin
UeD
)

28m
erSE
TA A
nnua
l Rep
ort 2
014/
2015
1. introductionThe Strategy and Research Division is staffed by a team with multi-disciplinary competencies and is organised into three inter-related functional units:
1. Projects Development Unit (incorporating Dual System Apprenticeships (DSPs), Applied Research and R&D partnerships)
2. Strategy Unit (incorporating knowledge and innovation management, monitoring and evaluation, performance reporting and quality systems)
3. SSP Research and Chambers Unit (incorporating labour market information and regional committees).
Collectively, and in association with other internal divisions and units, as well as stakeholders via the Innovation, Research and Development (IRD) Advisory Committee, Regional Committees and Chambers, the three units are responsible for the participatory development of merSETA’s SSP, Strategic Plan (SP) and Annual Performance Plan (APP).
To assist the division to implement its mandate, merSETA determined that it needed to engage in longer-term partnerships with institutions to drive their research strategy, which would enable it to develop research capacity at universities, but also allow it the benefit of critical academic insight into skills development and its various nuances. The cornerstone of this strategy is a co-operation agreement with the Development Policy Research Unit (DPRU) within the Faculty of Economics at the University of Cape Town (UCT).
2. ProJects deVeloPment unitThe Projects Development Unit has made substantial progress over the past year in respect of the following three areas of work:
• strengthening the public Further Education and Training (FET) system in its role of delivering suitably qualified artisans for sustained employability;
• building work-integrated learning linkages between TVET Colleges and their industrial counterparts; and
• strengthening opportunities for employment growth in the sector through industrial competitiveness and innovation.
strategy and REsEaRch
STrA
TEg
y &
rE
SEA
rch

29strateg
y & researc
H
2.1 Higher education institution partnerships
With the main focus of establishing a research-based infrastructure for building capacity in the TVET arena, and in particular with TVET Colleges, the Projects Development Unit has continued to strengthen collaboration with Higher Education Institutions. These are governed by a Higher Education Institutions Research Partnership Strategy, as approved by the IRD Advisory Committee. These collaborations include:
Table 5: higher Education institution partnerships
r&d Project objective hEi Partner
Master’s in Technology-Based
Entrepreneurship
Master’s qualification development
specialising in the field of
entrepreneurship linked to the
industrialisation of Intellectual Property,
developed through HEIs in support of
new manufacturing opportunities in SA
University of Cape Town, Commerce
Faculty
Research Chair in Manufacturing Skills
Development
Identifying and supporting skills for
technology gaps that will improve the
competitiveness and sustainability of
the South African manufacturing value
chain. Master’s, Doctoral and Post-
doctoral candidates are to be hosted
through this new research chair.
Tshwane University of Technology,
Engineering Faculty
Sector Skills and Economic Evolution
in SA
A Master’s, Doctoral and Post-doctoral
academic programme that seeks to
integrate VET, industrial policy and
evolutionary economics disciplines
contributing to the new skills required
by DHET for skills planning purposes
Wits University, School of Education,
Centre for Researching Education and
Labour

30m
erSE
TA A
nnua
l Rep
ort 2
014/
2015
2.2 applied research
A high-level partnership with the University of Bremen TVET Research Group (i:BB) supports deeper research into vocational competence development. This measurement instrument is designed to identify the strengths and weaknesses of vocational education and training and provide a comparative assessment across institutions in South Africa. The Cost Benefit and Quality Analysis instrument is used to measure the cost associated with the implementation of apprenticeship models or leaning pathways. Lastly, the three PhD scholarships that support knowledge transfer initiatives from the University of Bremen to South Africa.
2.3 dual system apprenticeships Pilot Project
To promote the responsiveness of TVET colleges to the intermediate skills needs of the sector, the Projects Development unit began implementing Dual System Apprenticeships. This is a Department of Higher Education and Training initiative. It focusses on teaching practices and work-integrated learning approaches, to improve the relevance of skills taught at the colleges and to strengthen post qualification employability.
3. strategy unit
3.1 knowledge management and innovation
The financial year under review saw the implementation of a Knowledge Management (KM) framework to enable appropriate ‘knowledge actions’ in the organisation with a defined purpose and scope to guide decision-making under a given set of circumstances within the framework of merSETA’s goals and objectives. The framework focuses on issues of accessing, sharing, integrating, disseminating and preserving merSETA’s knowledge assets in order to turn merSETA into an innovative learning and knowledge-based organisation. A KM policy was also developed and implemented in the year under review. The policy will strengthen the governance of knowledge so as to help foster an open
and enabling forum for the communication of thoughts, ideas, concepts and information and knowledge throughout merSETA.
The KM function is responsible for sourcing policy, strategic and related skills-development data and information that is critical in SSPs and research. It has established a knowledge repository for the systematic storage and organisation of knowledge resources produced at merSETA for easier access, searching, retrieval and dissemination. Mechanisms have also been established to give operational staff and leadership access to the latest news, information, socio-economic, political and technological developments affecting the skills development world.
merSETA-generated research has been disseminated through various platforms such as Achieve, an internally produced stakeholder magazine, the DHET research bulletin and the Labour Market Intelligence Partnership (LMIP) repository, to mention a few.
The KM unit with the assistance of other business units has promoted innovation in the organisation by encouraging staff to contribute to the improvement of processes, systems, learner support, corporate social investment and financial sustainability. The year under review saw the implementation of several ‘star ideas’ that are set to make significant contributions in achieving the vision of ‘being the leaders in closing the skills gap’.
3.2 quality management system
As an ISO 9001:2008 certified entity, in the 2014/2015 financial year merSETA successfully maintained its status as issued by an independent firm, PricewaterHouseCoopers. During the financial year under review, four audit assessments were conducted by PricewaterHouseCoopers; all corrective actions have been implemented in line with their recommendations.
3.4 stakeholder interface
As part of its commitment to offering quality service to its stakeholders, merSETA conducted a stakeholder survey for the period under review to determine and track stakeholder satisfaction with service delivery levels. The overall customer experience ratings were at the 7/10 mark. Perceptions of the organisation

31Strateg
y & reSearc
h (c
on
tinu
ed)
tended to vary across the different stakeholder segments, consistent with the diversity of profiles and interests. Despite the results indicating some decline in stakeholders’ satisfaction in comparison to the last survey in 2013/2014, this was a marginal and non-significant statistical change signifying that stakeholder satisfaction levels have remained relatively constant over the past 12 months.
As part of continuously monitoring the services offered to stakeholders, merSETA has developed and implemented an online tool through which stakeholders are able to provide real-time service experience feedback. The platform provides merSETA with data that forms part of an on-going Stakeholder Experience Management Framework.
In order to facilitate a quicker response to stakeholder feedback received through the online tool, merSETA has a dedicated email address to which the ‘red flags’ can be sent for investigation and corrective action as part of continuous improvement.
Figure 11: Monitoring and Evaluation model
3.5 monitoring and evaluation
In the 2014/15 financial year, the Strategy and Research
Division initiated a discussion with the Government
Technical Advisory Centre (GTAC), a unit of the National
Treasury, around the development of an organisation-
wide Monitoring and Evaluation (M&E) system. The
specific objectives for the GTAC technical support are to
support merSETA’s capability to monitor, report on and
evaluate its performance in relation to its operations as
well as its skills development interventions; to advise
on and recommend to merSETA ways to improve its
use of M&E for its decision making and planning;
and to provide improved information on the skills
development achievements of merSETA and the impact
thereof. This will also address the identified need for a
performance information policy, with a set of guidelines
to govern the identification, collection, verification,
storage and reporting of performance information on a
regular basis.
NdP, NgP, NSdS, SdA mandate and other government priorities
Impact (measuring contribution to employment growth and sector growth)
Impact (measuring changes in skills level, competencies in merSETA labour market)
Outcomes (measuring 5 year goals and strategic objectives)
Outputs (measuring MTEF indicators and annual targets)
Targets (measuring targets agreed with DHET)
Activities (measuring operational efficiencies of the organisation)
SSP
Strategy
APP
SLA
ops Plans

32m
erSE
TA A
nnua
l Rep
ort 2
014/
2015
To date, the M&E Policy and a Results-based M&E Framework have been developed, and the next step is to develop a set of guidelines and tools, followed by capacity building targeting staff, management and other structures. The framework is based on the following conceptual model:
4. ssP researcH and cHambers unit
The unit is responsible for research and sector skills planning at merSETA. The overarching objective of the SSP Research and Chambers Unit is: Establish a credible institutional mechanism for skills planning through informed decision-making, sound research methodologies and reliable quantitative and qualitative data. Research at merSETA not only focuses on merSETA skills development issues but also informs national development imperatives.
A key study conducted in the year under review investigated employability through work-integrated learning. The purpose of this study was to understand, against the backdrop of massive youth unemployment, the interplay between work and learning. It examined the workplace as a learning environment that supports the development of skills and attributes that will enhance the employability of new young entrants to the workplace.
Other sector-based research initiatives were commissioned and completed in the year under review:
• Metal Chamber: The purpose of this research study was to identify and estimate occupational skills demand in the metal industry.
• Motor Chamber: The purpose of this study was to determine actual skills requirements in relation to the identified change drivers within the various geographical and market sectors, to determine what type of motor skills are required in those areas.
• New Tyre Chamber: The purpose of this study was to unpack incipient and future trends in the global tyre industry so as to understand how these trends will affect the future skills requirements of the five tyre manufacturers located in South Africa (and hence change the linear projections incorporated into the Skills Demand Profiler through to 2020).
• Plastics Chamber: The purpose of this study was to explore and provide research-based recommendations on how the plastics and related industries can best attract, develop and retain technical talent in order to ensure that the industry continues to survive and thrive in an increasingly competitive and changeable marketplace.
• Auto Chamber: The purpose of this study is to provide a broader provincial and national picture of the public institutional training capacity for skills development for the automotive sector.
4.1 strategic national initiatives
The Strategy and Research Division has continued to participate in and contribute to national initiatives such as the Post-School Education and Training Research Forum, Strategic Integrated Projects (SIPs) and the LMIP workshops and policy round tables. merSETA uses these platforms to engage on skills development issues at policy, strategic and national level. Most recently merSETA has put in place support mechanisms for the presidential Operation Phakisa, aimed at unlocking the potential of the ocean economy.
4.2 capacity building
The year under review saw the strengthening of the research team through various labour market and econometric capacity-building initiatives in preparation for the internal development of the 2015/2016 SSP. The co-operation agreement with the DPRU at UCT has been integral to this internal development process. The 2015/2016 year will see the SSP being developed entirely in-house, a challenge that the SSP development team has prepared for.
5. situational analysis
5.1 service delivery environment
The merSETA skills development eco-system has its foundation in the NSDS III, the National Growth Path and the NDP.
In the 2013/2014 financial year, these core strategies enabled merSETA goals and objectives to segue from

33Strateg
y & reSearc
h (c
on
tinu
ed)
6. PerFormance inFormation by Programme
6.1 merseta’s performance against nsds iii targets 2014/2015
The 2014/2015 financial year was the fourth year of the NSDS III. merSETA and the DHET signed a service level agreement that indicated the NSDS III quantitative indicator targets for the 2014/2015 financial year. The targets per indicator were grouped according to the eight programmes that were identified by the Accounting Authority.
The word ‘certificated’ in an indicator name was replaced by the word ‘completed’ in order to differentiate completions from certifications, as certification happens as a separate process after completion. The Artisan Entered and Completed indicators previously distinguished employed from unemployed learners. This was not the case in the current year. The indicator ‘FET Graduate Placement’ from the last financial year was replaced by the indicator ‘TVET Graduate Placement’. The indicator ‘FET College Partnerships’ was changed to ‘TVET College Partnerships’ and the indicator ‘Workplace Experience’ was changed to ‘University Graduate Placement’.
The quarterly performance was reported to the Accounting Authority and DHET. Our highest performance by percentage included learnership and apprenticeship programmes that form part of our core activities.
merSETA’s overall annual performance is reflected in Table 6.
an SSP to a five-year Strategic Plan set to end in March 2016. Out of this, merSETA developed its Strategic Plan which was operationalised. The Service Level Agreement with the DHET guided our targets and achievements. The service delivery environment was influenced by many factors, such as:
• the introduction of new treasury regulations, which resulted in budget cuts and strict monitoring of expenditure
• the request from government for merSETA to contribute towards the NSFAS
• the request from government for merSETA to support TVET colleges and SIPs.
In the financial year under review, merSETA was however able to meet its targets despite the above-mentioned constraints.
5.2 strategic-outcome-oriented goals
Five strategic priorities were developed:
• Priority 1 is to develop a sector labour market intelligence system;
• Priority 2 is the continued and increased focus on artisan development;
• Priority 3 is to establish and facilitate strategic partnerships that will impact on both the funding available for skills development and the improved quality of skills development;
• Priority 4 is to increase the flow of newly-skilled workers into the sector, through increasing the skills available to the sector to meet its short-term needs and improve the base level of learning; and
• Priority 5 is to develop the skills of the existing workforce, as this is of primary importance for the development of the sector and for achieving outcomes that are consistent with decent work, equity and sector economic growth and employment.

34m
erSE
TA A
nnua
l Rep
ort 2
014/
2015
Prog
ram
me
goa
lPe
rfor
man
ce in
dica
tor
Indi
cato
r Defi
nitio
n /
Not
es20
13/1
4
Ach
ieve
men
t20
14/2
015
Targ
ets
2014
/201
5 A
chie
vem
ent a
nd
varia
nce
Not
es
Prog
ram
me
3:
incr
ease
d ac
cess
to
occ
upat
iona
lly-
dire
cted
pro
gram
mes
Une
mpl
oyed
le
arne
rshi
ps e
nter
ed
This
shal
l be
the
list o
f em
ploy
ed le
arne
rs
who
are
reco
gnise
d by
mer
SETA
as
havi
ng
com
men
ced
a re
gist
ered
lear
ners
hip
in a
ccor
danc
e to
mer
SETA
’s pr
oces
ses
and
proc
edur
es fo
r the
per
iod
bein
g co
nsid
ered
.
2 97
170
03
139.
The
ach
ieve
men
t aga
inst
this
targ
et w
as 4
48%
.
(Ach
ieve
men
t inc
lude
s pa
rtner
ship
pr
ojec
ts a
nd u
nrep
orte
d en
rolm
ents
du
e to
out
stan
ding
requ
irem
ents
from
a
rele
vant
prio
r per
iod,
tota
lling
1 1
01).
Une
mpl
oyed
inte
rns
ente
red
This
shal
l be
the
list o
f une
mpl
oyed
gr
adua
tes
who
are
reco
gnise
d by
mer
SETA
as
hav
ing
been
pla
ced
in a
mer
SETA
m
embe
r com
pany
to e
nter
a fo
rmal
in
tern
ship
pro
gram
me
in a
ccor
danc
e to
m
erSE
TA’s
proc
esse
s an
d pr
oced
ures
for
the
perio
d be
ing
cons
ider
ed.
346
200
297.
The
ach
ieve
men
t aga
inst
this
targ
et w
as 1
49%
.
Fund
ed b
y m
erSE
TA:
139
Fund
ed b
y In
dust
ry:
158
(The
ove
r-ac
hiev
emen
t is
due
to
indu
stry
fund
ed le
arne
rs a
s ill
ustra
ted
abov
e.)
Une
mpl
oyed
ski
lls
prog
ram
mes
ent
ered
This
shal
l be
the
list o
f une
mpl
oyed
le
arne
rs w
ho a
re re
cogn
ised
by m
erSE
TA
as h
avin
g co
mm
ence
d a
regi
ster
ed s
kills
pr
ogra
mm
e in
acc
orda
nce
to m
erSE
TA’s
proc
esse
s an
d pr
oced
ures
for t
he p
erio
d be
ing
cons
ider
ed.
* 3
188
500
1 26
5. T
he a
chie
vem
ent a
gain
st th
is ta
rget
was
253
%.
Fund
ed b
y m
erSE
TA:
1 00
2Fu
nded
by
Indu
stry
: 26
3
(Ach
ieve
men
t inc
lude
s un
repo
rted
enro
lmen
ts fr
om a
rele
vant
pr
ior p
erio
d du
e to
out
stan
ding
re
quire
men
ts, t
otal
ling
378.
)
Tabl
e 6.
mer
SETA
’s o
vera
ll an
nual
per
form
ance
is re
flect
ed

35Strateg
y & reSearc
h (c
on
tinu
ed)
Prog
ram
me
goa
lPe
rfor
man
ce in
dica
tor
Indi
cato
r Defi
nitio
n /
Not
es20
13/1
4
Ach
ieve
men
t20
14/2
015
Targ
ets
2014
/201
5 A
chie
vem
ent a
nd
varia
nce
Not
es
Prog
ram
me
3:
incr
ease
d ac
cess
to
occ
upat
iona
lly-
dire
cted
pro
gram
mes
Une
mpl
oyed
le
arne
rshi
ps c
ompl
eted
This
shal
l be
the
list o
f une
mpl
oyed
le
arne
rs w
ho a
re re
cogn
ised
by m
erSE
TA
as h
avin
g su
cces
sful
ly c
ompl
eted
a
regi
ster
ed le
arne
rshi
p in
acc
orda
nce
to
mer
SETA
’s pr
oces
ses
and
proc
edur
es fo
r th
e pe
riod
bein
g co
nsid
ered
.
*1 7
6570
01
209.
The
ach
ieve
men
t aga
inst
this
targ
et w
as 1
73%
.
Fund
ed b
y m
erSE
TA: 6
28
Fund
ed b
y In
dust
ry: 5
81
(Ach
ieve
men
t inc
lude
s un
repo
rted
com
plet
ions
from
a re
leva
nt
prio
r per
iod
due
to o
utst
andi
ng
requ
irem
ents
, tot
allin
g 4
99.
Une
mpl
oyed
inte
rn-
ship
s co
mpl
eted
This
shal
l be
the
list o
f une
mpl
oyed
gr
adua
tes
who
are
reco
gnise
d by
mer
SETA
as
hav
ing
com
plet
ed a
n in
tern
ship
with
a
mer
SETA
mem
ber c
ompa
ny in
acc
orda
nce
to m
erSE
TA’s
proc
esse
s an
d pr
oced
ures
fo
r the
per
iod
bein
g co
nsid
ered
.
231
100
125.
The
ach
ieve
men
t aga
inst
this
targ
et w
as 1
25%
.
Fund
ed b
y m
erSE
TA:
77
Fund
ed b
y In
dust
ry:
48
(The
ove
r-ac
hiev
emen
t is
due
to
indu
stry
fund
ed le
arne
rs a
s ill
ustra
ted
abov
e.)
Une
mpl
oyed
sk
ills
prog
ram
mes
co
mpl
eted
This
shal
l be
the
list o
f une
mpl
oyed
le
arne
rs w
ho a
re re
cogn
ised
by m
erSE
TA
as h
avin
g su
cces
sful
ly c
ompl
eted
a
regi
ster
ed s
kills
pro
gram
me
in a
ccor
danc
e to
mer
SETA
’s pr
oces
ses
and
proc
edur
es
for t
he p
erio
d be
ing
cons
ider
ed.
* 2
278
750
1 08
5. T
he a
chie
vem
ent a
gain
st th
is ta
rget
was
145
%.
Fund
ed b
y m
erSE
TA: 4
7 Fu
nded
by
Indu
stry
: 1 0
38
(Ach
ieve
men
t inc
lude
s un
repo
rted
com
plet
ions
from
a re
leva
nt
prio
r per
iod
due
to o
utst
andi
ng
requ
irem
ents
, tot
allin
g 71
0.)

36m
erSE
TA A
nnua
l Rep
ort 2
014/
2015
Prog
ram
me
goa
lPe
rfor
man
ce in
dica
tor
Indi
cato
r Defi
nitio
n /
Not
es20
13/1
4
Ach
ieve
men
t20
14/2
015
Targ
ets
2014
/201
5 A
chie
vem
ent a
nd
varia
nce
Not
es
Empl
oyed
bur
sarie
s en
tere
d
This
shal
l be
the
list o
f em
ploy
ed le
arne
rs
who
are
reco
gnise
d by
mer
SETA
as
havi
ng c
omm
ence
d a
burs
ary
prog
ram
me
in a
ccor
danc
e to
mer
SETA
’s pr
oces
ses
and
proc
edur
es fo
r the
per
iod
bein
g co
nsid
ered
.
202
100
122.
The
ach
ieve
men
t aga
inst
this
targ
et w
as 1
22%
.
Fund
ed b
y m
erSE
TA:
31
Fund
ed b
y In
dust
ry:
91
(The
ove
r-ac
hiev
emen
ts is
due
to
indu
stry
fund
ed s
tude
nts
as il
lust
rate
d ab
ove.
)
Empl
oyed
bur
sarie
s co
mpl
eted
This
shal
l be
the
list o
f em
ploy
ed le
arne
rs
who
are
reco
gnise
d by
mer
SETA
as
havi
ng c
ompl
eted
a b
ursa
ry p
rogr
amm
e in
acc
orda
nce
to m
erSE
TA’s
proc
esse
s an
d pr
oced
ures
for t
he p
erio
d be
ing
cons
ider
ed.
1310
13. T
he a
chie
vem
ent a
gain
st th
is ta
rget
w
as 1
30%
.
Une
mpl
oyed
bur
sarie
s co
mpl
eted
This
shal
l be
the
list o
f une
mpl
oyed
le
arne
rs w
ho a
re re
cogn
ised
by m
erSE
TA
as h
avin
g co
mpl
eted
a b
ursa
ry p
rogr
amm
e in
acc
orda
nce
to m
erSE
TA’s
proc
esse
s an
d pr
oced
ures
for t
he p
erio
d be
ing
cons
ider
ed. T
his
targ
et c
urre
ntly
exc
lude
s le
arne
rs g
radu
atin
g un
der t
he N
SFAS
ag
reem
ent a
nd w
ill b
e up
date
d in
the
first
qu
arte
r of t
he n
ew fi
nanc
ial y
ear.
5547
49. T
he a
chie
vem
ent a
gain
st th
is ta
rget
w
as 1
04%
.
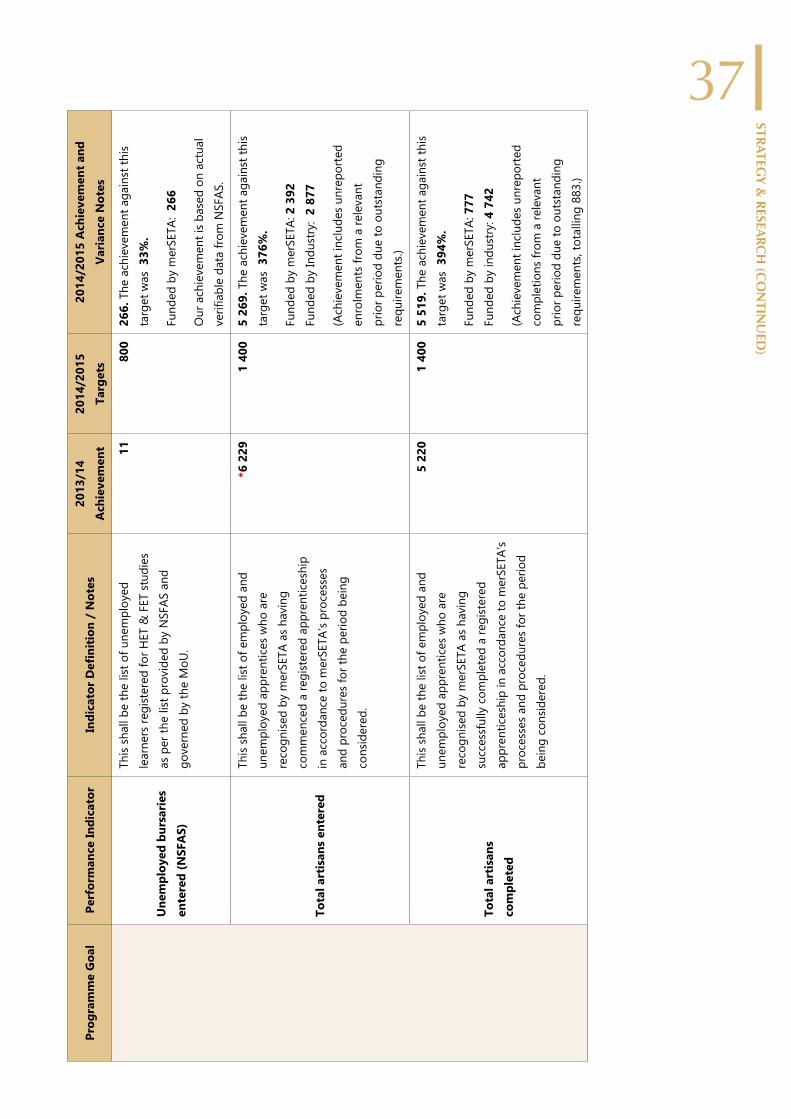
37Strateg
y & reSearc
h (c
on
tinu
ed)
Prog
ram
me
goa
lPe
rfor
man
ce in
dica
tor
Indi
cato
r Defi
nitio
n /
Not
es20
13/1
4
Ach
ieve
men
t20
14/2
015
Targ
ets
2014
/201
5 A
chie
vem
ent a
nd
varia
nce
Not
es
Une
mpl
oyed
bur
sarie
s en
tere
d (N
SFA
S)
This
shal
l be
the
list o
f une
mpl
oyed
le
arne
rs re
gist
ered
for H
ET &
FET
stu
dies
as
per
the
list p
rovi
ded
by N
SFAS
and
go
vern
ed b
y th
e M
oU.
1180
026
6. T
he a
chie
vem
ent a
gain
st th
is ta
rget
was
33%
.
Fund
ed b
y m
erSE
TA:
266
Our
ach
ieve
men
t is
base
d on
act
ual
verifi
able
dat
a fro
m N
SFAS
.
Tota
l art
isan
s en
tere
d
This
shal
l be
the
list o
f em
ploy
ed a
nd
unem
ploy
ed a
ppre
ntic
es w
ho a
re
reco
gnise
d by
mer
SETA
as
havi
ng
com
men
ced
a re
gist
ered
app
rent
ices
hip
in a
ccor
danc
e to
mer
SETA
’s pr
oces
ses
and
proc
edur
es fo
r the
per
iod
bein
g co
nsid
ered
.
*6 2
291
400
5 26
9. T
he a
chie
vem
ent a
gain
st th
is ta
rget
was
376
%.
Fund
ed b
y m
erSE
TA: 2
392
Fu
nded
by
Indu
stry
: 2
877
(Ach
ieve
men
t inc
lude
s un
repo
rted
enro
lmen
ts fr
om a
rele
vant
pr
ior p
erio
d du
e to
out
stan
ding
re
quire
men
ts.)
Tota
l art
isan
s co
mpl
eted
This
shal
l be
the
list o
f em
ploy
ed a
nd
unem
ploy
ed a
ppre
ntic
es w
ho a
re
reco
gnise
d by
mer
SETA
as
havi
ng
succ
essf
ully
com
plet
ed a
regi
ster
ed
appr
entic
eshi
p in
acc
orda
nce
to m
erSE
TA’s
proc
esse
s an
d pr
oced
ures
for t
he p
erio
d be
ing
cons
ider
ed.
5 22
01
400
5 51
9. T
he a
chie
vem
ent a
gain
st th
is ta
rget
was
394
%.
Fund
ed b
y m
erSE
TA: 7
77
Fund
ed b
y in
dust
ry: 4
742
(Ach
ieve
men
t inc
lude
s un
repo
rted
com
plet
ions
from
a re
leva
nt
prio
r per
iod
due
to o
utst
andi
ng
requ
irem
ents
, tot
allin
g 88
3.)

38m
erSE
TA A
nnua
l Rep
ort 2
014/
2015
Prog
ram
me
goa
lPe
rfor
man
ce in
dica
tor
Indi
cato
r Defi
nitio
n /
Not
es20
13/1
4
Ach
ieve
men
t20
14/2
015
Targ
ets
2014
/201
5 A
chie
vem
ent a
nd
varia
nce
Not
es
Uni
vers
ity g
radu
ate
plac
emen
ts
This
shal
l be
the
list o
f lea
rner
s re
cogn
ised
by m
erSE
TA a
s be
ing
supp
orte
d in
ac
cord
ance
with
mer
SETA
’s pr
oces
ses
and
proc
edur
es fo
r the
qua
rter b
eing
co
nsid
ered
, to
acqu
ire th
eir P
1, P
2 or
re
leva
nt e
xper
ienc
e in
ord
er to
obt
ain
thei
r qu
alifi
catio
n.
*874
500
664.
The
ach
ieve
men
t aga
inst
this
targ
et w
as 1
33%
.
Fund
ed b
y m
erSE
TA: 4
42
Fund
ed b
y In
dust
ry: 2
22
(The
ove
r-ac
hiev
emen
ts is
due
to
indu
stry
fund
ed le
arne
rs a
s ill
ustra
ted
abov
e.)
TvET
gra
duat
e pl
acem
ents
This
shal
l be
the
list o
f TVE
T Co
llege
gr
adua
tes
who
hav
e be
en p
lace
d in
m
erSE
TA m
embe
r com
pani
es to
get
on
-the
-job
expe
rienc
e ot
her t
han
mer
SETA
’s st
ruct
ured
lear
ning
in
terv
entio
ns.
1 90
450
077
0. T
he a
chie
vem
ent a
gain
st th
is ta
rget
was
154
%.
Fund
ed b
y m
erSE
TA:
83
Fund
ed b
y In
dust
ry:
687
(The
ove
r-ac
hiev
emen
ts is
due
to
indu
stry
fund
ed le
arne
rs a
s ill
ustra
ted
abov
e.)
Prog
ram
me
4:
Prom
ote
the
resp
onsi
vene
ss o
f Tv
ET c
olle
ges
to
Sect
or S
kills
Nee
ds
TvET
col
lege
pa
rtne
rshi
ps
This
shal
l be
the
list o
f TVE
T Co
llege
s th
at
have
a fo
rmal
agr
eem
ent w
ith m
erSE
TA
in a
ccor
danc
e to
mer
SETA
’s pr
oces
ses
and
proc
edur
es fo
r the
per
iod
bein
g co
nsid
ered
.
2414
21. T
he a
chie
vem
ent a
gain
st th
is ta
rget
w
as 1
50%
.
(Ach
ieve
men
t inc
lude
s m
ulti-
year
ag
reem
ents
.)

39Strateg
y & reSearc
h (c
on
tinu
ed)
Prog
ram
me
goa
lPe
rfor
man
ce in
dica
tor
Indi
cato
r Defi
nitio
n /
Not
es20
13/1
4
Ach
ieve
men
t20
14/2
015
Targ
ets
2014
/201
5 A
chie
vem
ent a
nd
varia
nce
Not
es
Prog
ram
me
5:
Add
ress
the
low
le
vel o
f you
th a
nd
adul
t lite
racy
and
nu
mer
acy
skill
s to
en
able
add
ition
al
trai
ning
Empl
oyed
ski
lls
prog
ram
mes
ent
ered
This
shal
l be
the
list o
f em
ploy
ed le
arne
rs
who
are
reco
gnise
d by
mer
SETA
as
havi
ng
com
men
ced
a re
gist
ered
ski
lls p
rogr
amm
e in
acc
orda
nce
to m
erSE
TA’s
proc
esse
s an
d pr
oced
ures
for t
he p
erio
d be
ing
cons
ider
ed.
* 4
534
700
3 11
1. T
he a
chie
vem
ent a
gain
st th
is ta
rget
was
444
%
Fund
ed b
y m
erSE
TA:
1 39
7 Fu
nded
by
Indu
stry
: 1
714
(Ach
ieve
men
t inc
lude
s un
repo
rted
enro
lmen
ts fr
om a
rele
vant
pr
ior p
erio
d du
e to
out
stan
ding
re
quire
men
ts, t
otal
ling
928.
)
Empl
oyed
ski
lls
prog
ram
mes
co
mpl
eted
This
shal
l be
the
list o
f em
ploy
ed le
arne
rs
who
are
reco
gnise
d by
mer
SETA
as
havi
ng
succ
essf
ully
com
plet
ed a
regi
ster
ed s
kills
pr
ogra
mm
e in
acc
orda
nce
to m
erSE
TA’s
proc
esse
s an
d pr
oced
ures
for t
he p
erio
d be
ing
cons
ider
ed.
* 1
300
700
1 12
4. T
he a
chie
vem
ent a
gain
st th
is ta
rget
was
161
%.
Fund
ed b
y m
erSE
TA: 2
34
Fund
ed b
y In
dust
ry:
890
(Ach
ieve
men
t inc
lude
s un
repo
rted
com
plet
ions
from
a re
leva
nt
prio
r per
iod
due
to o
utst
andi
ng
requ
irem
ents
, tot
allin
g 7
34.)
AET
pro
gram
mes
en
tere
d
This
shal
l be
the
list o
f em
ploy
ed a
nd
unem
ploy
ed a
dults
who
hav
e en
tere
d AB
ET, F
LC o
r oth
er s
hort
cour
ses
in
acco
rdan
ce to
mer
SETA
’s pr
oces
ses
and
proc
edur
es.
1 9
3120
055
0. T
he a
chie
vem
ent a
gain
st th
is ta
rget
was
275
%.
(Ach
ieve
men
t inc
lude
s FL
C le
arne
rs
and
Trai
ning
Lay
off S
chem
e le
arne
rs.)
AET
pro
gram
mes
co
mpl
eted
This
shal
l be
the
list o
f em
ploy
ed a
nd
unem
ploy
ed a
dults
who
hav
e co
mpl
et-
ed A
BET,
FLC
or o
ther
sho
rt co
urse
s in
ac
cord
ance
to m
erSE
TA’s
proc
esse
s an
d pr
oced
ures
.
1 0
8620
028
1. T
he a
chie
vem
ent a
gain
st th
is ta
rget
was
141
%.
Fund
ed b
y m
erSE
TA:
189
Fund
ed b
y In
dust
ry:
92
(Incl
udes
FLC
lear
ners
and
Tra
inin
g La
yoff
sche
me
lear
ners
.)

40m
erSE
TA A
nnua
l Rep
ort 2
014/
2015
Prog
ram
me
goa
lPe
rfor
man
ce in
dica
tor
Indi
cato
r Defi
nitio
n /
Not
es20
13/1
4
Ach
ieve
men
t20
14/2
015
Targ
ets
2014
/201
5 A
chie
vem
ent a
nd
varia
nce
Not
es
Prog
ram
me
6: T
o pr
omot
e w
orkp
lace
sk
ills
deve
lopm
ent
with
in th
e se
ctor
Empl
oyed
lear
ners
hips
co
mpl
eted
This
shal
l be
the
list o
f em
ploy
ed le
arne
rs
who
are
reco
gnise
d by
mer
SETA
as
havi
ng
succ
essf
ully
com
plet
ed a
regi
ster
ed
lear
ners
hip
in a
ccor
danc
e to
mer
SETA
’s pr
oces
ses
and
proc
edur
es fo
r the
per
iod
bein
g co
nsid
ered
.
*2 3
7070
01
568.
The
ach
ieve
men
t aga
inst
this
targ
et w
as 2
24%
.
Fund
ed b
y m
erSE
TA:
559
Fund
ed b
y In
dust
ry:
1009
(Ach
ieve
men
t inc
lude
s un
repo
rted
com
plet
ions
from
a re
leva
nt
prio
r per
iod
due
to o
utst
andi
ng
requ
irem
ents
, tot
allin
g 57
2.)
Empl
oyed
lear
ners
hips
en
tere
d
This
shal
l be
the
list o
f em
ploy
ed le
arne
rs
who
are
reco
gnise
d by
mer
SETA
as
havi
ng
com
men
ced
a re
gist
ered
lear
ners
hip
in a
ccor
danc
e to
mer
SETA
’s pr
oces
ses
and
proc
edur
es fo
r the
per
iod
bein
g co
nsid
ered
.
2 65
170
03
910.
The
ach
ieve
men
t aga
inst
this
targ
et w
as 5
59%
.
Fund
ed b
y m
erSE
TA: 1
340
Fu
nded
by
Indu
stry
: 2 5
70
(Ach
ieve
men
t inc
lude
s un
repo
rted
enro
lmen
ts fr
om a
rele
vant
pr
ior p
erio
d du
e to
out
stan
ding
re
quire
men
ts, t
otal
ling
700.
)
com
pani
es B
eing
Pai
d M
anda
tory
gra
nts
Larg
e Fi
rms:
Thi
s sh
all b
e th
e lis
t of
larg
e co
mpa
nies
that
hav
e be
en p
aid
out m
anda
tory
gra
nts
in a
ccor
danc
e to
m
erSE
TA p
roce
sses
and
pro
cedu
res
for t
he
perio
d be
ing
cons
ider
ed.
469
500
514.
The
ach
ieve
men
t aga
inst
this
targ
et w
as 1
03%
.
Med
ium
Firm
s: T
his
shal
l be
the
list o
f m
ediu
m c
ompa
nies
that
hav
e be
en p
aid
out m
anda
tory
gra
nts
in a
ccor
danc
e to
m
erSE
TA p
roce
sses
and
pro
cedu
res
for t
he
perio
d be
ing
cons
ider
ed.
668
833
805.
The
ach
ieve
men
t aga
inst
this
targ
et w
as 9
7%.
Smal
l Firm
s: T
his
shal
l be
the
list o
f sm
all c
ompa
nies
that
hav
e be
en p
aid
out m
anda
tory
gra
nts
in a
ccor
danc
e to
m
erSE
TA p
roce
sses
and
pro
cedu
res
for t
he
perio
d be
ing
cons
ider
ed.
2 15
61
812
2 07
2. T
he a
chie
vem
ent a
gain
st th
is ta
rget
was
114
%.
(Ach
ieve
men
t due
to d
rive
to re
crui
t m
ore
smal
l com
pani
es.)

Programme Goal Performance Indicator2013/14
Achievement2014/2015
Targets2014/2015 Achievement and Variance
Notes
Programme 6: To promote workplace skills development within the sector
Co-operatives
This shall be the list of cooperatives that have been supported by merSETA through a skills development agreement, advocacy, implementation or monitoring according to merSETA’s processes and procedures for the period being considered.
19 16 20. The achievement against this target was 125%.
(Achievement due to drive to recruit more co-operatives.)
Programme 7: cooperatives, small enterprises, NGOs and community- initiated training
Small Business support
This shall be the list of small companies that have been supported by merSETA through a skills development agreement, advocacy, implementation or monitoring in any qualifying way according to merSETA’s processes and procedures for the period being considered.
4 859 2 000 2 919. The achievement against this target was 146%.
(Achievement due to drive to recruit more small companies and dedicated project.)
NGO, CBO, NLPE
This shall be the list of NGOs, CBOs and NLPEs that have been supported by merSETA through a skills development agreement, advocacy, implementation or monitoring in any qualifying way according to merSETA’s processes and procedures for the period being considered.
345 130 208. The achievement against this target was 160%.
(Achievement due to success with NLPE support programme.)
Programme 8: Career Development
Career awareness
This shall be the list of recipients who have received qualifying career awareness support in accordance to merSETA’s processes and procedures for the period being considered.
3 980 1 720 5 842. The achievement against this target was 340%.
(2014/15 was the Year of the Artisan and combined advocacy from merSETA, DHET and the media contributed to the high participation rates.)
* merSETA. This is outside merSETA’s control.

42m
erSE
TA A
nnua
l Rep
ort 2
014/
2015
1. introduction and oVerViewThe Corporate Services Division has deepened its roots during the past year, improving areas relating to Governance, Human Resources, Marketing & Communications and Facilities Management.
merSETA has continued to comply with the principles of the King III Code of Good Governance as well as relevant legislation. The management of both internal and external stakeholder relations has been carried out effectively and matters relating to IT governance have been brought to the fore and will be addressed primarily via the newly established Governance and Strategy Committee. Risk management continues to be a priority and compliance with all relevant legislation has been monitored regularly throughout the year.
Despite the uncertainties and challenges that merSETA has faced this year, overall the organisation has developed significantly and this can be attributed largely to increased human capital value-add. An improvement in performance has been felt at all levels and employee development and wellness initiatives have enhanced staff morale and team effectiveness. The financial wellness theme has gone a long way towards empowering staff to pay off excessive debt and begin a culture of saving. In addition, physical wellness days have improved awareness and attitudes towards healthy eating, exercise and long-term fitness.
Partnership with the Knowledge Management (KM) Unit ensured that the focus of Corporate Services remained as a strategic business partner in achieving set organisational objectives. The newly established KM framework has proved invaluable in enhancing the effectiveness of training and development interventions. Coupled with improved cross-functional communication mechanisms, this has assisted internal innovation and continuous improvement and contributed to the establishment of a learning organisation.
A succession planning process was undertaken during the year, with a view to mitigating risks associated with a loss of staff in key positions as well as to creating career-development pathways for talented equity candidates.
Organisational facilities, assets and travel policies were all reviewed during the course of 2014/2015 to ensure value for money and compliance with National Treasury guidelines on cost containment. A review of facilities, including health and safety conditions, was undertaken and recommendations are being implemented. corP
orA
TE
SErv
icES
corPorate sERVicEs

43c
orPo
rate serVices
Business continuity and disaster recovery plans were drafted during the year, with input from all unit and divisional managers. These have been finalised and will be submitted for approval through the relevant governance structures.
2. goVernance
2.1 introduction
merSETA is a Schedule 3a public entity and reports to the DHET. The Minister of Higher Education and Training is the main stakeholder on behalf of government. The Accounting Authority is responsible for providing strategic direction to merSETA and ensuring that merSETA achieves its objectives and implements the goals of NSDS III.
merSETA is stakeholder-driven and, in terms of the Skills Development Act, structures within merSETA must be equally represented by organised labour and organised employers.
2.2 executive authority
The Ministry of Higher Education and Training is merSETA’s Executive Authority. In that regard, merSETA reports to the DHET which in turn reports to Parliament.
merSETA has made all the required submissions to the Executive Authority, which include quarterly reports (financial and performance), the APP and the Service Level Agreement during the period under review.
2.3 the accounting authority
2.3.1 introduction
In line with the Standard Constitution, the Accounting Authority comprises 15 independent non-executive members who are appointed by the Minister of Higher Education and Training in terms of the Standard Constitution, of whom six represent organised labour and six represent organised employers. There are also three ministerial appointees.
Members of the Accounting Authority are appointed for a five-year term of office.
2.3.2 the role of the accounting authority
The Accounting Authority is generally responsible for governance and ensuring that merSETA achieves its mandate through the review of corporate strategy, monitoring compliance with applicable legislation as detailed in Part A and monitoring performance information and policy development, among other responsibilities.
The Accounting Authority also endorses the principles and guidelines espoused by the King III Report on corporate governance. In so doing, the members recognise the need to conduct the affairs of the entity with integrity and in accordance with the accepted norms applying to corporate practices. The requirement for openness and accountability is recognised as an inclusive process that gives due recognition to the importance of all stakeholders in ensuring the viability and sustainability of merSETA’s operations.
2.3.3 accounting authority charter
The Accounting Authority functions are guided by a charter that is regularly reviewed to ensure alignment with the Standard Constitution, King III Code of Governance and other relevant legislation and statutes.
The Accounting Authority Charter provides an overview of the roles, powers, functions, duties and responsibilities of the members, both collectively and
individually.
2.3.4 composition of the accounting authority
Ms Phindile Baleni was the Chairperson of the Accounting Authority during the year under review, while Mr Xolani Tshayana and Ms Jeanne Esterhuizen both served as Deputy Chairpersons. The following members served as Independent Non-Executive Members: Mr Alex Mashilo, Mr Anton Hanekom, Professor Fiona Tregenna, Mr Jacobus Olivier, Mr Jonathan Swarts, Mr Johan van Niekerk, Ms Malebo Lebona, Mr Herman Kostens, Mr Andries Chirwa, Mr Thapelo Molapo, Ms Helen von Maltitz and Mr
Mustak Ally.

44m
erSE
TA A
nnua
l Rep
ort 2
014/
2015
NAME
AccoUNTiNg
AUThoriTy
AUdiT
ANd riSk
coMMiTTEE
EXEcUTivE
coMMiTTEE
hUMAN
rESoUrcES &
rEMUNErATioN
coMMiTTEE
FiNANcE
ANd grANTS
coMMiTTEE
govErNANcE
ANd
STrATEgy***
Phindile Baleni 6/6 4/5 2/5
Jeanne Esterhuizen 5/6 4/5 4/4 1/2
Xolani Tshayana 5/6 4/5 5/5 2/2
Alex Mashilo 4/6 2/2
Andries Chirwa 4/6
Anton Hanekom 6/6 4/4 2/2
Fiona Tregenna 5/6 3/4
Jacobus Olivier 5/6 3/4
Jonathan Swarts 6/6 4/4 3/4
Johan van Niekerk 5/6
Mustak Ally** 2/6 0/5 1/2
Malebo Lebona 6/6 5/5 4/4 1/2
Thapelo Molapo 5/6 5/5
Helen von Maltitz* 2/6
Herman Kostens 5/6 2/2
Martin Kuscus 3/4
Romano Daniels 3/5
Sizeka Rensburg 2/4
Mantunka Maisela 5/5
Andrew Mashifane 4/4
Fay Mukkadam 3/4
Thulisile Mashanda 4/4
Table 7: Attendance at the Accounting Authority and committee meetings
* Ms Helen von Maltitz was appointed on 8 October 2014.
** Mr Mustak Ally was appointed on 14 January 2015.
***The Governance and Strategy Committee only held two meetings during the 2014/2015
financial year, as it was established in May 2014.
2.3.5 attendance at the accounting authority and committee meetings
The attendance of members at meetings during the 2014/2015 financial year is summarised in Table 7.

45C
orpo
rate ServiCeS (C
oN
tiNU
eD)
NAME
rEMUNErATioN
r,000
oThEr
ALLoWANcES
oThEr
rEiMBUrSEMENTS
r,000
ToTAL
r,000
Alex Mashilo 86 86
Andrew Mashifane 132 132
Andries Chirwa 52 52
**Anton Hanekom 94 94
Jonathan Swarts 98 10 108
Fay Mukaddam 55 55
Fiona Tregenna 83 83
**Herman Kostens 86 86
**Jacobus Olivier 84 84
Jeanne Esterhuizen 113 113
Johan Van Niekerk 85 85
Mustak Ally 23 23
Malebo Lebona 108 108
Mantuka Maisela 51 51
Martin Kuscus 47 47
Helen von Maltitz 24 24
Phindile Baleni*
Romano Daniels 52 52
Sizeka Rensburg 36 36
Thapelo Molapo 87 87
Thulisile Mashanda 77 77Xolani Tshayana 113 7 120
*Ms Phindile Baleni is a non-paid member.
** The following Accounting Authority members’ remuneration is paid to the organisations they represent:
Mr Anton Hanekom (Plastics SA)
Mr Herman Kostens (Motor Industry South Africa)
Mr Jacobus Olivier (Retail Motor Industry)
Table 8: remuneration of the Accounting Authority and committee Members
2.3.6 remuneration of the accounting authority and committee members
In accordance with the remuneration rates stipulated by National Treasury, the payments in Table 8 were made to members of the Accounting Authority and its committees.

46m
erSE
TA A
nnua
l Rep
ort 2
014/
2015
2.4 committees of the accounting authority
The following committees have been established in terms of Annexures 5 (1) and (2) and Annexure 6 of the Standard Constitution:
• Executive Committee (EXCO)
• Audit and Risk Committee (ARC)
• Human Resources and Remuneration Committee (HRRC)
• Finance and Grants Committee (FGC)
• Governance and Strategy Committee (GSC)
• Chamber Committees and
• Regional Committees
All committees operate within written terms of reference that are regularly reviewed and approved by the Accounting Authority.
2.4.1 the executive committee
Purpose The Executive Committee (EXCO) is responsible for overseeing the management of the financial affairs of merSETA, including determination of budgets and business plans. The committee is also responsible for monitoring national issues and developments as well as ensuring that the policies of the Accounting Authority are implemented.
composition The EXCO comprises five members, all of whom are members of the Accounting Authority.
The Chairperson of the EXCO is Ms Phindile Baleni while Ms Jeanne Esterhuizen, Ms Malebo Lebona, Mr Mustak Ally and Mr Xolani Tshayana serve as members.
Meetings The committee met on five occasions during the period under review.
2.4.2 the audit and risk committee
Purpose The Audit and Risk Committee (ARC) fulfils a supervisory and monitoring role on behalf of the Accounting Authority, overseeing the company’s
financial affairs and its relationship with the internal and external auditors as well as risk management.
The committee monitors the quality, integrity and reliability of the company’s compliance with the relevant legislation, ensuring that an appropriate system of internal controls is maintained to protect the assets of the organisation. The ARC is also responsible for evaluating the independence, objectivity and effectiveness of the external and internal auditors, considering the accounting and auditing policies and addressing any concerns identified by the auditors.
The ARC is also responsible for promoting the accuracy, reliability and credibility of financial reporting and reviewing the annual financial statements and annual report of the organisation for recommendation and approval by the Accounting Authority.
composition The ARC comprises five members. Three are independent members, namely Mr Andrew Mashifane (Chairperson), Ms Thulisile Mashanda and Advocate Fay Mukaddam; two are Accounting Authority Members: Mr Jacobus Olivier and Mr Jonathan Swarts. The committee chairperson attends Accounting Authority meetings by invitation.
Meetings The committee met on four occasions during the period under review.
2.4.3 Human resources and remuneration committee
Purpose The object of the Human Resources and Remuneration Committee (HRRC) is to play an oversight role in the management of all matters relating to the Human Resources of merSETA. The committee provides guidance to the Chief Executive Officer (CEO) pertaining to the management and the effective and efficient utilisation of the human resources of merSETA, in compliance with the approved policies and long-term business plan requirements of the organisation.
The committee has access to independent consultants as well as current developments in the field of Human Resources and remuneration, which stands it in good

47C
orpo
rate ServiCeS (C
oN
tiNU
eD)
stead to advise on the HRRC practices within merSETA. The committee is also responsible for the evaluation of the CEO’s performance against set and agreed objectives.
composition The HRRC comprises five members. Two are independent members, namely Mr Romano Daniels and Ms Mantunka Maisela, and three are Accounting Authority Members: Mr Thapelo Molapo (Chairperson), Mr Alex Mashilo and Mr Xolani Tshayana.
Meetings The committee met on five occasions during the period under review.
2.4.4 Finance and grants committee
Purpose The Finance and Grants Committee (FGC) plays an oversight role in terms of the management of grant disbursements as well as monitoring the financial implications of policies, decisions and changes on the budget and business plan of merSETA.
composition The Finance and Grants Committee comprises seven members. Two are independent members – Mr Martin Kuscus and Ms Sizeka Rensburg – and four are Accounting Authority members, namely Mr Anton Hanekom (Chairperson), Professor Fiona Tregenna, Ms Malebo Lebona and Mr Jonathan Swarts.
Meetings The committee met on four occasions during the period under review.
2.4.5 governance and strategy committee
Purpose The Governance and Strategy Committee was established on 28 May 2014 in line with the Standard SETA Constitution. The committee plays an oversight role with regard to matters relating to the governance and strategy of merSETA in order to ensure that practices in this regard are consistent and compliant with the SETA Constitution, relevant legislation and best practice. The Governance and Strategy Committee also acts as advisor to the CEO and Senior Management Committee (MANCO) in relation to the aforesaid matters.
composition The Governance and Strategy Committee comprises one independent member, Ms Khulekelwe Mbonambi, and seven Accounting Authority members, namely Mr Alex Mashilo (Chairperson), Mr Xolani Tshayana, Ms Jeanne Esterhuizen, Ms Malebo Lebona, Mr Herman Kostens, Mr Mustak Ally and Mr Anton Hanekom. IT experts from the Internal Auditor team attend meetings of the committee by invitation.
Meetings The committee met on two occasions during the period under review.
2.5 chamber and regional committees
2.5.1 chamber committees
The chambers are committees of the Accounting Authority established to support merSETA in addressing national skills development strategic objectives in carrying out its functions as prescribed in the Skills Development Act, 1998 (Act 97/1998) and related Grant Regulations (as amended).
merSETA has five chamber committees with an increased membership composition of a maximum of ten members each per business and labour constituency. The following are the five chamber committees:
2.5.1.1 Automobile Manufacturing chamber The Auto Chamber Committee and other four chamber committees of merSETA are responsible for identifying training needs and monitoring the implementation of training in the sector in accordance with national skills development strategic objectives and National Skills Accord (NSA) commitments made by representatives of business, organised labour, the community constituency and government, where parties agreed to form partnerships to achieve the New Growth Path targets and now work toward the realisation of the NDP.
The auto sector involves auto-manufacturing and assembling plants, referred to as original equipment manufacturers – OEMs. The sector is guided by policy instruments and initiatives from the state and the Department of Trade and Industry (DTI)’s Automotive Production Development Programme.

48m
erSE
TA A
nnua
l Rep
ort 2
014/
2015
The purpose of the study was to investigate the potential of technical high schools and TVET colleges in metro cities where there are auto-manufacturing and assembling companies to alleviate skills shortages in the auto sector.
The Auto Chamber Committee is chaired by Mr Xolani Tshayana while Dr Lesley Lee, Mr Thapelo Molapo, Mr Wayne Osborne, Mr Johannes van Rensburg, Ms Chrissy Berichon, Mr Stephen Goold, Mr Charles Kemp, Ms Hester Fourie, Ms Malebo Lebona, Mr Joseph Lekgoro, Mr Rudi Swarts, Mr. Motlatsi Maphela, Mr Andile Gqokoma, Mr Lord Mampane, Mr Thabo Mogoroe, Mr Hendrick Makgopela, Mr Vusumzi Mkhungo, Mr Jongisizwe Gomomo and Ms Zintle Mona serve as members.
2.5.1.2 Metals and Engineering chamber The metals sector comprises firms involved in the manufacturing and servicing of capital equipment including machinery, large computers, transport equipment and metal fabrication and other related subsectors. The sector forms a substantial part of South Africa’s manufacturing sector and is based on the country’s rich natural endowment in a wide range of metals.
The purpose of the study was to identify and estimate occupational skills demand in the metals industry and further identify current supply-side weaknesses and constraints in the provision of education and training for occupations in demand.
The Metal Chamber is chaired by Mr Jonathan Swarts while Mr Cobus Cato, Mr Mustak Ally, Mr Abduraghmaan Adams, Mr John Davies, Mr Vusumzi. Mabho, Ms Azia Nxumalo, Ms Malebo Lebona, Ms Carole Hills, Mr Bheki Gumbi, Mr Eddie Kirsten, Mr Collen Mokoena, Ms Nadine Sha, Mr Edward Thobejane, Mr Willy Matthiae, Mr Edward Matube, Mr Andrea Gouws, Mr Brian Muir, Mr Terrence Harrison, Ms Amanda Hattingh and Mr Timothy Pule serve as members.
2.5.1.3 retail Motor and components Manufacturing chamber The sector includes firms involved in the motor retail and auto-service industries, as well as in the manufacture of automotive components. The sector is invariably closely linked to the automotive manufacturing sector as the
supplier of components for motor vehicle assembly and the automotive aftermarket – the secondary market of the automotive industry, concerned with the remanufacturing, distribution, retailing and installation of all vehicle parts, chemicals, equipment and accessories, after the sale of the automobile to the consumer.
The purpose of the study was to determine actual skills requirements in relation to the identified change drivers within the various geographical and market sectors to determine what type of motor-sector skills are required in those areas.
The Motor Chamber Committee is chaired by Ms Jeanne Esterhuizen while Ms Malebo Lebona, Mr Abraham Dunn, Mr Herman Kostens, Ms Ilze Botha, Mr Elias Kubeka, Mr Marwaan Davids, Mr Motsamai Sefume, Mr Isaac Boshomane, Mr Piet Verryne, Mr Hudson Boggenpoel, Mr Jabulani Linda, Ms Jade Strachan, Mr Felix Luxomo, Mr Frik Burger, Mr Bheki Mbatha, Mr Vishal Premlall, Mr Moegamat Abrahams, Mr Hugh Chaplin and Mr Jan Schoeman serve as members.
2.5.1.4 New Tyre Manufacturing chamber committee The subsector consists of firms involved in the manufacture of new tyres. The South African tyre market is described by the South African Tyre Manufacturers’ Conference as fiercely competitive. The sector positions South Africa as a springboard to sub-Saharan Africa and a popular market for exports.
The purpose of the study was to unpack incipient and future trends in the global tyre industry so as to understand how these trends will affect the future skills requirements of the five tyre manufacturers located in South Africa (and hence change the linear projections incorporated into the Skills Demand Profiler through to 2020).
The New Tyre Chamber Committee is chaired by Ms Helen von Maltitz while Ms Susan Muller, Mr Bandla Mtshiselwa, Mr James Selala, Mr Llewellyn Bosch, Mr Malwandwe Gogela, Ms Eileen Gardner, Mr Thabo Majola, Ms Vantola Bosch, Mr Philani Khoza, Mr Neil Rademan, Mr Jean-Paul Delport, Ms Linda Duruwe, Mr Mthobeli Maya, Ms Malebo Lebona and Mr Vusumuzi Mkhungo serve as members.

49C
orpo
rate ServiCeS (C
oN
tiNU
eD)
2.5.1.5 Plastics Manufacturing chamber The Plastics Chamber includes firms involved in the manufacture of plastics products from locally manufactured and imported polymers. The sector represents the downstream section of the plastics value chain and is largely composed of small firms.
The purpose of the study was to explore and provide research-based recommendations on how the plastics and related industries can best attract, develop and retain technical talent in order to ensure that the industry continues to survive and thrive in an increasingly competitive and changeable market place.
The Plastics Chamber Committee is chaired by Mr Anton Hanekom. Mr Jonathan Swarts, Ms Kirtida Bhana, Mr Robert Bond, Mr Sidwell Tseledi, Ms Vanessa Davidson, Ms Wendy Seloi, Ms Valencia Ellse, Mr Dave Duncan, Ms Amanda Hattingh, Mr Bernard Sauls, Ms Ncediswa Baza, Mr Errol John and Ms Hilda Selepe serve as members.
Achievements and highlights
The 2014/2015 financial year has been another successful one for merSETA chamber committees. During the year under review, chamber committees continued to make strides by making inputs into the Accounting Authority strategic planning processes.
Annual work plans
During the year under review, chamber committees continued to improve and revise annual work plans, a mechanism enabling merSETA to deliberate on skills development matters in an inclusive manner involving all stakeholder committees from different perspectives.
The high quality of annual work plans developed and subsequently approved by the Accounting Authority strategic planning session was such that all work plans developed were geared towards supporting the merSETA-approved NSDS III and NSA’s eight national strategic objectives. In the past chambers mainly made contributions to the skills planning processes through identifying and updating annual scarce skills lists, a process culminating in the development the National Scarce Skills list.
revised chamber committees’ terms of reference
The chamber committees’ terms of reference were successfully revised. The new terms of reference provided merSETA chamber committees with an opportunity to operate more effectively and reposition merSETA to reach out to its wider stakeholder base in addressing national skills development imperatives as stipulated in the NSA and NSDS III.
Support for skills planning
Chamber committees continued to support merSETA and national skills planning processes by successfully concluding Phase II of the chamber-led SSP research projects, which covered a wide range of relevant areas within the NSDS III landscape.
chamber committee meetings
Chamber committees have successfully convened all 20 quarterly meetings scheduled for the year under review. During the quarterly and other additional meetings convened in the process, the chambers continued to provide invaluable feedback to other key strategic structures of merSETA for the effective implementation of the NSDS III and NSA strategic objectives.
By making informed and supportive inputs into policies and procedures, identifying industry training needs and constraints, the chambers enhanced collaborative relations between merSETA and its wide client base.
The reports regularly received from stakeholder consultative forums addressed to the management and various departments, the EXCO and the Accounting Authority enabled the organisation to re-evaluate and redesign merSETA products and services in manner that benefited merSETA stakeholders and enhanced the relevance of the NSDS III in merSETA subsectors.
Apart from providing credible input on the SSP processes, chambers have been instrumental during the year under review in providing feedback on the following strategic matters:
• comments geared towards improvements on the merSETA database system – Seta Management System (SMS)

50m
erSE
TA A
nnua
l Rep
ort 2
014/
2015
• designing merSETA’s scarce skills lists to be chamber- and subsector-specific
• the need for a study to initiate a review process for the RAP and TLS programmes
Quality council for Trades and occupations matters
• comments on the new artisan development transitional arrangements
• identification of industry trade qualification needs for review and development
• comments on the new FLC certificate
2.5.2 regional committees
The regional committees act in a stakeholder capacity, as advisors to assist the chamber committees to carry out the mandate of the Accounting Authority.
merSETA has seven regional committees with an increased membership composition of a maximum of ten members each per business and labour constituency. The regional committees are as follows:
• Eastern Cape Regional Committee • Free State and Northern Cape Regional Committee• Gauteng North and North West Regional Committee • Gauteng South Regional Committee• KwaZulu-Natal Regional Committee • Mpumalanga and Limpopo Regional Committee • Western Cape Regional Committee
Achievements and highlights
The financial year 2014/2015 has proved to be a successful year for merSETA regional committees, based on milestones achieved in the course of implementing skills development within the NSDS III landscape.
regional committee terms of reference
Regional committees successfully revised their terms of reference. The new terms of reference have been an important achievement to enable merSETA regional committees to effectively fulfil their critical role in supporting chamber committees and ensuring they participate in NSDS III strategic objectives and reach out to merSETA’s wide stakeholder base across the nine provinces in South Africa.
regional committee meetings
It took some time for regional committees to be organised and function to optimum levels. During the year under review, for the first time regional committees successfully convened all 21 meetings scheduled for the year.
Strategy to revive regional committee meetings
One of the initiatives that facilitated the transformation and organisation of regional committees was the successful development of the strategy to revive regional committee meetings. This was an inclusive intervention involving the merSETA MANCO, chamber committees, EXCO and the Accounting Authority. Some of the key elements built into the strategy are:
• aligning the regional committee terms of reference to support chamber committee activities
• encouraging chamber and regional committees’ memberships to overlap to facilitate the flow of information between the two committees
• ensuring that the composition of regional committees is representative of subsectors within the demarcated provinces
• encouraging committee members to prepare and consult sufficiently for committee meetings
Quality council for Trade occupation matters
• comments on the new artisanal development transitional arrangements
• identification of industry trade qualifications needs for review and development
• comments on the new FLC certificate
2.6. other strategic committees
The following committees also play a crucial role in ensuring that the mandate of the organisation is achieved:
2.6.1 innovation, research and development advisory committee
Purpose merSETA’s IRD Committee oversees the development and review of the sector IRD strategy. The committee

51C
orpo
rate ServiCeS (C
oN
tiNU
eD)
is responsible for oversight in respect of ensuring programme alignment with merSETA strategy, industry needs and relevant national development priorities. The IRD Committee feeds into the Governance and Strategy Committee. Members of the committee are not remunerated.
composition The IRD Committee has nine members: two from the Accounting Authority, seven experts from the industry and one member co-opted from the DTI.
Meetings The IRD Committee convened four meetings during the period under review.
2.6.2 education, training, quality assurance committee (etqa)
Purpose The ETQA Committee is responsible for the oversight of the execution of the quality assurance functions and obligations of merSETA on behalf of the Accounting Authority.
composition The ETQA Committee comprises eight members of the Accounting Authority.
Meetings The committee convened two meetings during the year under review
2.7 risk management
The Accounting Authority is responsible for the merSETA risk management process. The ARC assists the Accounting Authority in carrying out its risk management responsibilities. The Accounting Authority has delegated to management the responsibility to design, implement and monitor risk management within merSETA.
merSETA continually strives to improve its risk management processes, and risk assessments are carried out on a regular basis to determine the effectiveness of the risk management strategy and to identify new and emerging risks. The entity reviewed its risk management framework and policy in March 2014.
A risk management workshop involving both the ARC and the Accounting Authority was held on 31 July 2014 to identify emerging risks and the entity’s risk tolerance and appetite The Accounting Authority approved the organisation’s risk tolerance and appetite policy on the 26th of May 2015.
2.8 internal audit
merSETA’s internal audit function is outsourced to an independent audit firm that carries out its function on an approved three-year internal audit plan. Sizwe Ntsaluba Gobodo (SNG) were merSETA’s internal auditors during the year under review. The independent internal auditors perform and report in terms of an approved internal audit plan. The Audit and Risk Committee reviews the internal audit charter as well as the performance of the internal auditors on an annual basis.
In the year under review, SNG independently appraised the adequacy and effectiveness of the entity’s systems, financial internal controls and accounting records and reported their findings to the ARC.
The internal control environment of merSETA was found to be in good standing. IT policies were reviewed in order to enhance the internal control environment.
2.9 compliance with laws and regulations
To ensure compliance with relevant legislation, merSETA’s Legislative Compliance Register is reviewed on a quarterly basis. Systems are in place to detect changes in legislation as and when they arise.
2.10 Fraud and corruption
merSETA has a fully implemented Fraud Prevention Plan in place which is regularly reviewed to ensure effectiveness.
The entity has a fraud and corruption hotline which is fully operational, and a register of all reported cases is maintained and reported on through the governance structures periodically. All cases are investigated to determine validity, and appropriate action is taken in

52m
erSE
TA A
nnua
l Rep
ort 2
014/
2015
cases where allegations are found to be true.
2.11 minimising conflict of interest
Members of the Accounting Authority as well as Senior Management are required to avoid situations where they have, or can have, a direct or indirect interest that conflicts, or possibly may conflict, with the company’s interests. Procedures have been put in place for the disclosure by the directors of any such conflicts, and these procedures have been operating effectively. Members of staff also have an obligation to declare their interests on an annual basis in order for the organisation to avoid issuing contracts to related parties.
2.12 code of conduct
The merSETA Code of Conduct acts as a guideline to employees with regard to what is expected of them from an ethical point of view, both in their individual conduct and in their relationships with merSETA stakeholders. It also assists employees to conduct themselves in accordance with the highest standards of integrity and ethics and in compliance with the Skills Development Act and other legislation related to objectivity, independence and conflict of interest. The primary purpose of the code is to promote exemplary conduct.
Violation of the code is dealt with in terms of merSETA’s Grievance and Disciplinary Code and Procedures.
2.13 social responsibility
merSETA contributed to social upliftment through the implementation, management of various initiatives designed to address key social imperatives. These initiatives focused on HIV, rural outreach, in- and out of- school career guidance, bursaries, new venture creation, people with disabilities, ABET and AET/FLC programmes.
merSETA was also involved in Mandela Day. merSETA staff donated stationery, educational toys, books, educational magazines, puzzles, teddy bears, clothes, canned food, cupcakes, sanitary and hygiene supplies to various charities. The Head Office and Gauteng South spent the morning at the Come Back Mission, a centre
for woman affected by poverty, HIV and addiction to alcohol and drugs. Some the staff members went to Choc Childhood Centre Foundation, a home for children living with cancer, to spend the afternoon with the children; other staff members went to the Winnie Madikizela Home, a school for children with disabilities. The Gauteng North regional office spent time with the Luvuyo Orphanage Home in Mpumalanga and with the Praxton Correctional Services, providing career guidance support to inmates. The Free State office went to the Tshepo Foundation, the KwaZulu-Natal regional office to the Khulani Children’s Home and the Western Cape office to the St Joseph’s Home for chronically ill children, reading and interacting with the children, painting and many more activities.
merSETA also held an annual CEO Golf Day to raise funds for the Maths Centre, a national initiative that works towards the improvement of math and science skills for both learners and teachers merSETA’s innovative and proactive approach continues to add value to sustainable social development. The details of these programmes are highlighted in Part B.
2.14 Health and safety
Health and safety policies and procedures are continuously evolving as updates to the Occupational Health and Safety Act No. 85 of 1993 and the National Environmental Management Act No. 107 of 1998 are made, and equipment, best practice and our environment are enhanced and changed. Consequently, to remain abreast of the requirements of the ISO 9001:2008 Quality Management Standards, merSETA documents are continually reviewed. Training of new and existing first-aid officials and fire marshals is conducted annually and evacuation protocols have been refined. A comprehensive Health and Safety Audit was conducted during the year and as a result recommendations were implemented to rectify faults and mitigate risks. Staff members are encouraged to report faults and problems via a dedicated email address, so that health and safety risks are identified and rectified immediately and can be effectively tracked. The Head Office air conditioner and the newly planted atrium garden with working fountains have created a much healthier, happier working environment

53C
orpo
rate ServiCeS (C
oN
tiNU
eD)
at Head Office, significantly contributing to the wellbeing of our staff. Regional offices are supported in their own initiatives.
2.15 environmental responsibility
In line with our principles of leading by example, the waste recycling ‘Greening merSETA’ initiative was established in the previous financial year in collaboration with the City of Johannesburg and an NGO. This initiative is continuing, with waste paper, plastic and cardboard being collected for recycling on a regular basis. The project has assisted merSETA to contribute towards empowering people to create opportunities to make a living through job creation.
During the year under review a comprehensive Green Assessment was conducted at the Head Office building, with a view to significantly reducing the impact on the environment. The viability of solar panels, specialised glass coatings and new lighting installation is under investigation. The merSETA Head Office air conditioning system was upgraded with a modern replacement, resulting in the reduction of our carbon footprint by saving electricity. The Head Office system will be used as a benchmark for informing future initiatives.
2.16 information and communication technology (ict) governance
merSETA relies heavily on Information and Communication Technology (ICT) systems in conducting its business. ICT plays a critical role as a strategic enabler for the organisation. The Corporate Governance of Information, Communication and Technology Policy Framework (CGICTPF) has been implemented and merSETA ICT systems are currently compliant with this framework. merSETA has met all deadlines as outlined by the CGICTPF and is currently in phase 3 which is a continuous improvement of governance and strategic alignment arrangements.
To improve efficiencies, merSETA has implemented the following two new systems:
• The Supply Chain Management (SCM) system was implemented in January 2016 to assist with
order processing. This system automates the order processing process and improves on delivery times. The implementation of the SCM has also resulted in improved governance and compliance related to order processing.
• An online Filing System has also been implemented to enable the merSETA to file documents online. Physical paper documents can now be scanned to make copies available online in order to allow more than one person to access and process customer accounts simultaneously. This level of efficiency is not available with the hard copy filing system.
merSETA has maintained its “GREEN” status with SAQA for its National Learner Records Database (NLRD) uploads. Changes on the SETA Management System (SMS) have been successfully made to align Mandatory Grants to regulatory changes. Changes to the Discretionary Grants have also been successfully implemented in order to make applications and verifications of Discretionary Grants processing easier and faster. Reporting tools for Quarterly Monitoring Reports (QMR) to the Department of Higher Education and Training (DHET) have also been enhanced.
During the year under review, merSETA obtained a 98% uptime on its ICT systems and suffered no serious data loss or security breach.
2.17 marketing and communications
introduction
The vision of the Marketing and Communications unit at merSETA is to keep the organisation speaking with one voice across a vast number of regions and customer interactions. The unit is guided by these strategic objectives:
i. improving and enhancing marketing and communication efforts between the merSETA and its target audiences;
ii. strengthening and maintaining stakeholder relationships;
iii. assisting in the facilitation of a positive work culture and climate;

54m
erSE
TA A
nnua
l Rep
ort 2
014/
2015
iv. enhancing the positive merSETA brand among stakeholders; and
v. profiling the merSETA as valuable, rare, difficult to imitate and hard to substitute.
During 2014/2015, the Marketing and Communications Unit once again coordinated mass publicity around the Mandatory and Discretionary Grant campaign for stakeholders, using print, electronic and radio channels.
Advertisements and notices were placed in targeted publications, particularly in media platforms aimed at the manufacturing, engineering and related services sector. Through the unit’s strong relations with the media, merSETA also gained free publicity in certain newspapers where articles showcasing the organisation’s partnerships with various stakeholders such as training centres, member companies and educational institutions were featured.
The Achieve magazine was produced and printed quarterly in the year ending March 2015. The magazine was directly mailed to 2 500 levy-paying companies. Digital copies of the magazine were made available on the merSETA website: www.merSETA.org.za.
The Marketing and Communications Unit published six editions of the internal digital newsletter, Eyethu. merSETA staff have access to the newsletter via the CIC and merSETA intranet.
A merSETA Corporate Identity (CI) Manual was produced and approved by MANCO. As part of educating staff members about the CI manual, the unit will roll out the Brand Awareness Campaign by hosting workshops at all merSETA regional offices including Head Office.
Career awareness and knowledge repository portals were created on our website. From 1 April 2014 to 31 March 2015, there were 176 845 visitors and 755 662
page views.
During the financial year, the unit focused on reaching technical high school learners and educators through career days. The career days were aimed at exposing learners to available career opportunities in general, but specifically in the manufacturing, engineering and related services sector, equipping educators with updated career information and teaching resources and communicating merSETA’s role and programmes.
Working closely with the Career Awareness Unit, large numbers of career guides, trade-specific information brochures and pamphlets were developed dealing with scarce skills within merSETA’s five chambers, namely Metal and Engineering, New Tyre Manufacturing, Plastics Manufacturing, Motor Retail and Components Manufacturing and Automobile Manufacturing. The guides and other brochures were distributed to scores of learners, life orientation teachers and job seekers at various career events around the country such as merSETA’s own Technical High Schools Career Days, DHET’s Decade of the Artisan launch and the Presidential Youth Indaba on Jobs. In order to create top-of-mind awareness, merSETA-branded promotional gifts were also printed and distributed at these events.
The unit continues with the responsibility of updating and maintaining the merSETA website, with a turnaround time of 24 hours for updates and new documentation.
The Marketing and Communications Unit attended a host of events in 2014/2015 at which they interacted with stakeholders, companies, youth organisations and TVET learners. Stakeholders and clients were reached through these events, thus improving and enhancing marketing and communication efforts between merSETA and its target audiences. Promotional and branding materials were also distributed to thousands of learners.

55C
orpo
rate ServiCeS (C
oN
tiNU
eD)
Figure 12: Analysis of internet traffic.
Sessions290 733 176 845 755 662
2.60 00:03:02
55.36% 58.71%
Users Page views
Pages / sessions Avg Session duration
Bounce rate % New Sessions
1. en-us 144 125
46 535
2 021
217
135
60 128
35 567
323
190
132
49.57%20.68%16.01%12.23%
0.70%0.11%0.07%0.07%0.05%0.05%
5. en_gb
2. en-gb
6. (not set)
3. en
7. en_us
9. en-au
4. en-za
8. ru
10. c
Sessions % Sessions
41.3%
56.7%
New VisitorsReturning Visitors

56m
erSE
TA A
nnua
l Rep
ort 2
014/
2015
hU
MA
N
rESo
Urc
ESHuman resources ManagEMEnT
1. introduction
1.1 overview of Human resources matters
The 2014/2015 financial year has been one of great success for the Human Resources Unit. The benefits of the implementation of the Human Resources Strategy were shown by the increased collaboration across units, which has contributed significantly towards the attainment of organisational objectives.
1.2 staff complement
The merSETA staff complement at the end of the financial period was 252, of whom 226 were permanent staff members and 29 were interns who were employed in the various units of the organisation. The gender ratio remained unchanged and reflects the national statistics (51% females and 49% males) reported by Statistics South Africa.
The internal equity ratio of merSETA is compared with the national statistics in Figures 13 and 14. Overall the equity ratio is considered acceptable and is not cause for concern.
Figure 13: merSETA staff complement
African
Coloured
White
Indian
65%
5%
13%
17%

57H
um
an reso
urc
es
1.3 stakeholder management
The relationship between merSETA’s management team
and the National Education Health and Allied Workers’
Union (NEHAWU) has improved significantly during the
year under review. A key highlight of the year was the
effective wage negotiation process, which was concluded
amicably within a shorter time period than usual.
Shop steward elections are under way and management
has allocated funds to train the newly elected
shop stewards to ensure that they gain a greater
understanding of their role in the organisation as well
as how to execute their duties as representatives of staff
who are associated with the union.
One of the first projects that the new management union
forum will be focusing on during the new financial year is
the review of the current collective agreement to ensure
compliance with the latest legislation and to promote a
sound working relationship between management and
the union.
1.4 achievements against set priorities for the year under review
In instilling a culture of effective and efficient governance within merSETA as per Programme 1 of the organisational objectives, the Human Resources division has embarked on the following initiatives:
• A review of all Human Resources policies was conducted to ensure alignment with current legislation, particularly to comply with legislative changes to the Basic Conditions of Employment Act;
• A leadership and management development programme was scoped and implemented, resulting in enhanced management and leadership practices within merSETA. All managers underwent leadership assessments administered through an independent external provider and development programmes have now been scoped for various levels of managers and leaders in the organisation;
• Opportunities for growth and development have been provided to employees within the organisation through promotions and development initiatives;
• Skills development and learning has been instilled as a culture within the organisation over the financial year, with the WSP being submitted to the Education
Figure 14: National demographics
African
Coloured
White
Indian80%
3%8%
9%

58m
erSE
TA A
nnua
l Rep
ort 2
014/
2015
and Training Development Practices (ETDP) SETA and mandatory grants to the value of R191 395.53 have been received. In addition, a Memorandum of Agreement (MoU) was signed between ETDP SETA and merSETA in which the ETDP SETA undertook to provide 100% funding for employees who are studying towards NQF levels 6 and 7 qualifications at public institutions. During the reporting period, two employees enrolled and became beneficiaries of this agreement. More employees are envisioned to benefit in the new financial year;
• The Skills Development Act advises that 1% of an organisation’s personnel expenditure should be put towards training. merSETA has invested 3.86% of its personnel expenditure in training;
• Staff retention has improved in this period compared to the previous reporting period. This can be attributed to the opportunities for growth and development that are offered to staff members.
1.5 workforce planning
The Human Resources Unit ensures the availability of skills and resources in the shortest possible time whenever vacancies arise. In ensuring that the most suitable candidate is appointed, competency-based interviews are conducted for all vacancies and psychometric assessments are conducted for all supervisory and management positions in addition to the competency-based interview before a placement is made. Preference is given to internal staff members when recruiting and in instances where there is a lack of skills internally, external candidates are appointed in line with the Employment Equity (EE) numerical goals and targets.
merSETA retains talented employees with its competitive strategy, which is to lead the remuneration market, and this is complemented by various Human Resource practices such as:
• rewarding superior performance through the performance management policy and system;
• continuously developing employees by allocating a specific training amount to an employee per financial year;
• providing employee benefits including medical aid,
pension fund and contribution to the Sick Pay Fund in instances where employees have exhausted their sick leave days and are remunerated from the Fund;
• offering six days’ family responsibility leave. The Basic Conditions of Employment Act prescribes three days.
1.6 employee performance management framework
A performance contract is established for each employee in line with merSETA’s targets, goals and objectives. The organisation’s values have also been incorporated into the performance scorecards to ensure that employees live the values in executing their day-to-day functions.
The merSETA performance management system allows consultation and constructive two-way feedback during the performance review process. Once the agreed performance scores are signed off, a moderation panel consisting of the executive management team adjudicates all ratings. The panel considers the performance of the individual, his or her unit and that of his or her grade peers (same job grade level) to ensure consistency and objectivity.
Performance bonuses are paid to eligible employees on 30 April each year and all employees who have achieved a ‘satisfactory’ or ‘above-average’ performance rating receive an additional 2% incentive in recognition of their unique contribution to merSETA’s annual target achievement.
In the year under review, two employees did not satisfy the requirements of their key performance areas and have been placed on performance improvement processes with the aim of bridging the identified performance gaps.
1.7 wellness programmes
merSETA subscribes to ICAS as a wellness provider and their service offering includes:
• stress management: personal and work;
• legal issues: legal matters; maintenance, child custody, divorce law;
• relationship issues: family, work, partners, friends;

59H
Um
an Reso
URc
es (co
ntin
Ued
)
• substance abuse: alcohol, drugs;
• family matters: childcare and care of the elderly, state benefits and allowances;
• health issues: aids counselling; and
• work issues: stress management, career matters.
This service is available to all staff and their immediate family members. It includes telephonic or face-to-face counselling in all 11 official languages. The provider has a national footprint catering for all of merSETA’s regional offices, as well as various satellite offices that provide staff members with the option of receiving counselling in their residential areas.
In addition to the Employee Assistance programme, each staff member has access to a personal financial coach once or twice a month depending on need, and there is a psychologist on site every Wednesday from 09:00 – 17:00. These initiatives have been well supported during the year under review and proved to be highly impactful in assisting staff with debt reduction (financial coaching) and relationship issues (psychological counselling).
merSETA hosted an annual wellness day on 12 September 2014 that included voluntary HIV/AIDS testing and counselling, glucose, cholesterol, blood pressure, eye and Body Mass Index (BMI) testing. A
dietician was also available on the day to assist with advice on healthy eating, meal plans and exercise. Of all staff members, 62% participated in the wellness day. A partnership has been formed with the South African National Blood Service, who are on site on a bi-monthly basis to enable staff members to donate blood.
merSETA has yet again achieved its EE targets for the financial year.
The implementation of the innovation project has resulted in improved service delivery and streamlining of business processes. Post-training interviews (conducted by Human Resources with staff who have recently returned from training) have been instituted to encourage knowledge-sharing on a team, departmental and organisational level.
1.8 challenges faced by the public entity
The uncertainty with regard to the re-licensing of the SETA creates a sense of job insecurity and poses the risk of losing talented and long-serving employees who are conversant with SETA systems, processes and procedures. merSETA has taken the initiative of requesting information on the status of re-licensing from the DHET in order to mitigate this risk.
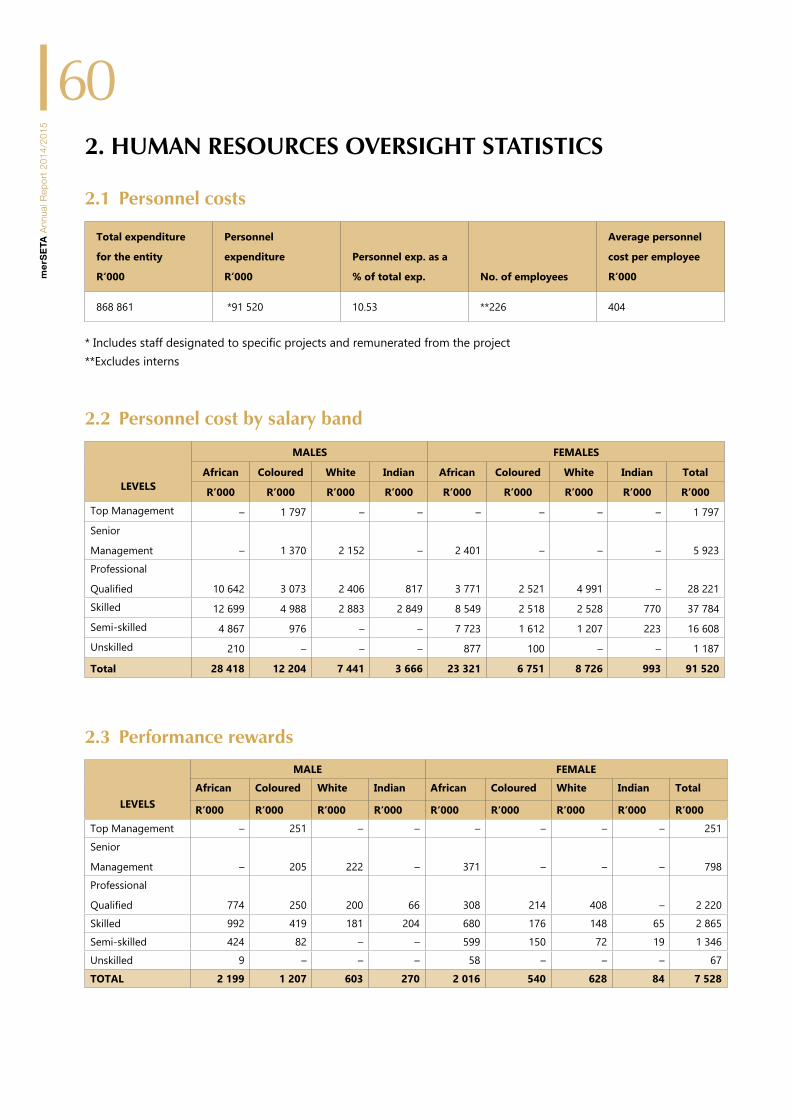
60m
erSE
TA A
nnua
l Rep
ort 2
014/
2015
2. Human resources oVersigHt statistics
2.1 Personnel costs
Total expenditure
for the entity
r‘000
Personnel
expenditure
r‘000
Personnel exp. as a
% of total exp. No. of employees
Average personnel
cost per employee
r‘000
868 861 *91 520 10.53 **226 404
* Includes staff designated to specific projects and remunerated from the project **Excludes interns
2.2 Personnel cost by salary band
LEvELS
MALES FEMALES
African coloured White indian African coloured White indian Total
r’000 r’000 r’000 r’000 r’000 r’000 r’000 r’000 r’000Top Management – 1 797 – – – – – – 1 797Senior
Management – 1 370 2 152 – 2 401 – – – 5 923Professional
Qualified 10 642 3 073 2 406 817 3 771 2 521 4 991 – 28 221Skilled 12 699 4 988 2 883 2 849 8 549 2 518 2 528 770 37 784Semi-skilled 4 867 976 – – 7 723 1 612 1 207 223 16 608Unskilled 210 – – – 877 100 – – 1 187
Total 28 418 12 204 7 441 3 666 23 321 6 751 8 726 993 91 520
2.3 Performance rewards
LEvELS
MALE FEMALEAfrican coloured White indian African coloured White indian Total
r‘000 r‘000 r‘000 r‘000 r‘000 r‘000 r‘000 r‘000 r‘000Top Management – 251 – – – – – – 251Senior
Management – 205 222 – 371 – – – 798Professional
Qualified 774 250 200 66 308 214 408 – 2 220Skilled 992 419 181 204 680 176 148 65 2 865Semi-skilled 424 82 – – 599 150 72 19 1 346Unskilled 9 – – – 58 – – – 67
ToTAL 2 199 1 207 603 270 2 016 540 628 84 7 528

61H
Um
an Reso
URc
es (co
ntin
Ued
)
2.4 training costs
Programme/activity/
objective
Personnel
expenditure r’000
Training
expenditure
r’000
Training
expenditure as %
of personnel cost
No. of
employees
Average
training cost per
employee
r’000
Staff training 91 520 1 540 3.86 104 14.80
2.5 employment and vacancies
Programme/activity/
objective
2012/2013 No. of
employees
2012/2013
Approved posts
2013/2014 No. of
employees
2013/2014
vacancies
Percentage of
vacanciesRecruitment *246 5 **226 22 9.7
* Permanent staff members ** Average number of employees including interns
2.6 employment changes
Salary Band
Employment
at beginning of
period Appointments Terminations
Employment at end of
the period
Top Management 1 – – 1Senior Management 5 – – 5Professional qualified 38 *2 1 39Skilled 93 *12 12 93Semi-skilled 78 *5 6 77Unskilled 10 3 2 11
ToTAL 225 22 21 226
* Including employees who were promoted
2.7 reasons for staff leaving
reason Number % of total no. of staff leavingDeath – –Resignation 12 5.33Dismissal – –Retirement 1 0.44Ill-health – –Expiry of contract 4 1.78Other – –
ToTAL 17 100
2.8 labour relations: misconduct and disciplinary action
Nature of disciplinary action NumberCounselling 4Verbal warning 20Written warning 15Disciplinary Hearing 2CCMA 2

62m
erSE
TA A
nnua
l Rep
ort 2
014/
2015
2.9 equity target and employment equity status
Statistics is for the period August 2013 - September 2014 as per EE plan that is submitted to the Department of Labour annually
Levels
MALEAfrican coloured indian White
current Target current Target current Target current TargetTop Management – – 1 – – – – –Senior Management – – 1 – – – 2 –Professional qualified 15 – 4 – 1 – 3 –Skilled 31 – 10 – 5 – 7 1Semi-skilled 21 – 4 – – 1 – –Unskilled 2 1 – – – – – –
ToTAL 69 1 20 0 6 1 12 1
Levels
FEMALEAfrican coloured indian White
current Target current Target current Target current TargetTop Management – – – – – – – –Senior Management 2 – – – – – – –Professional qualified 6 1 4 – – – 6 –Skilled 23 – 6 – 2 – 6 –Semi-skilled 32 – 6 – 1 – 5 –Unskilled 8 – 1 – – 1 – –
ToTAL 71 1 17 0 3 1 17 0
Levels
diSABLEd STAFFMale Female
current Target current TargetTop Management – – – –
Senior Management – – – –Professional qualified – 1 – –Skilled 2 – – 1Semi-skilled – 1 – 1Unskilled – – 1 1
ToTAL 2 2 1 3

63H
Um
an Reso
URc
es (co
ntin
Ued
)

64m
erSE
TA A
nnua
l Rep
ort 2
014/
2015
FiN
AN
ciA
L
iNFo
rMA
Tio
N FinancialinFORMaTiOn
rePort oF tHe auditor-general to Parliament on tHe manuFacturing, engineering and related serVices sector education and training autHority rePort on tHe Financial statements
introduction
1. I have audited the financial statements of the Manufacturing, Engineering and Related Services Sector Education and Training Authority (merSETA) set out on pages 72 to 120, which comprise the statement of financial position as at 31 March 2015, the statement of financial performance, the statement of changes in net assets, the cash flow statement and the statement of comparison of budget information with actual information for the year then ended, as well as the notes, comprising a summary of significant accounting policies and other explanatory information.
accounting autHority’s resPonsibility For tHe Financial statements
2. The accounting authority is responsible for the preparation and fair presentation of these financial statements in accordance with South African Standards of Generally Recognised Accounting Practice (SA Standards of GRAP) and the requirements of the Public Finance Management Act of South Africa, 1999 (Act No. 1 of 1999) (PFMA) and the Skills Development Act, 1998 (Act No 97 of 1998) (SDA), and for such internal control as the accounting authority determines is necessary to enable the preparation of financial statements that are free from material misstatement, whether due to fraud or error.
auditor-general’s resPonsibility
3. My responsibility is to express an opinion on these financial statements based on my audit. I conducted my audit in accordance with International Standards on Auditing. Those standards require that I comply with ethical requirements, and plan and perform the audit to obtain reasonable assurance about whether the financial statements are free from material misstatement.

65Fin
anc
ial inFo
rmatio
n
4. An audit involves performing procedures to obtain audit evidence about the amounts and disclosures in the financial statements. The procedures selected depend on the auditor’s judgement, including the assessment of the risks of material misstatement of the financial statements, whether due to fraud or error. In making those risk assessments, the auditor considers internal control relevant to the entity’s preparation and fair presentation of the financial statements in order to design audit procedures that are appropriate in the circumstances, but not for the purpose of expressing an opinion on the effectiveness of the entity’s internal control. An audit also includes evaluating the appropriateness of accounting policies used and the reasonableness of accounting estimates made by management, as well as evaluating the overall presentation of the financial statements.
5. I believe that the audit evidence I have obtained is sufficient and appropriate to provide a basis for my audit opinion.
oPinion
6. In my opinion, the financial statements present fairly, in all material respects, the financial position of the Manufacturing, Engineering and Related Services Sector Education and Training Authority as at 31 March 2015 and its financial performance and cash flows for the year then ended, in accordance with SA Standards of GRAP and the requirements of the PFMA and SDA.
emPHasis oF matter
7. I draw attention to the matter below. My opinion is not modified in respect of this matter.
re-licensing
8. As disclosed in note 25 to the financial statements, the merSETA’s license expires on 31 March 2016. As at 31 March 2015, the Minister of Higher Education and Training has not made a pronouncement on renewal of the SETA licences beyond 31 March 2016.
rePort on otHer legal and regulatory requirements
9. In accordance with the Public Audit Act of South Africa, 2004 (Act No. 25 of 2004) and the general
notice issued in terms thereof, I have a responsibility to report findings on the reported performance information against predetermined objectives for selected programmes presented in the annual performance report, non-compliance with legislation and internal control. The objective of my tests was to identify reportable findings as described under each subheading but not to gather evidence to express assurance on these matters. Accordingly, I do not express an opinion or conclusion on these matters.
Predetermined obJectiVes
10. I performed procedures to obtain evidence about the usefulness and reliability of the reported performance information for the following selected programmes presented in the annual performance report of the public entity for the year ended 31 March 2015:
• Programme 3: Increased access to occupationally-directed programmes on pages 34 to 38
• Programme 5: Address the low level of youth and adult literacy and numeracy skills to enable additional training on page 39
• Programme 6: To promote workplace skills development within the sector on pages 40 to 41
11. evaluated the reported performance information against the overall criteria of usefulness and reliability.
12. I evaluated the usefulness of the reported performance information to determine whether it was presented in accordance with the National Treasury’s annual reporting principles and whether the reported performance was consistent with the planned programmes. I further performed tests to determine whether indicators and targets were well defined, verifiable, specific, measurable, time bound and relevant, as required by the National Treasury’s Framework for managing programme performance information (FMPPI).
13. I assessed the reliability of the reported performance information to determine whether it was valid, accurate and complete.
14. I did not raise any material findings on the usefulness and reliability of the reported performance information for the following programmes:

66m
erSE
TA A
nnua
l Rep
ort 2
014/
2015
Auditor-General Pretoria July 2015
• Programme 3: Increased access to occupationally-directed programmes
• Programme 5: Address the low level of youth and adult literacy and numeracy skills to enable additional training
• Programme 6: To promote workplace skills development within the sector
additional matters
15. Although I raised no material findings on the usefulness and reliability of the reported performance information for the selected programmes, I draw attention to the following matters:
acHieVement oF Planned targets
16. Refer to the annual performance report on pages 34 to 41 for information on the achievement of the planned targets for the year.
adJustment oF material misstatements
17. I identified material misstatements in the annual performance report submitted for auditing on the reported performance information of Programmes 3, 5 and 6. As management subsequently corrected the misstatements, I did not raise any material findings on the usefulness and reliability of the reported performance information.
unaudited suPPlementary inFormation
18. The supplementary information set out on pages 67 to 71 does not form part of the annual performance report and is presented as additional information. I have not audited these schedules and, accordingly, I do not report thereon.
comPliance witH legislation
19. I performed procedures to obtain evidence that the public entity had complied with applicable legislation regarding financial matters, financial management and other related matters. My findings on material non-compliance with specific matters in key legislation, as set out in the general notice issued in terms of the PAA, are as follows:
Financial statements
20. The financial statements submitted for auditing were not prepared in accordance with the requirements of section 55(1)(a) and (b) of the PFMA and SA Standards of GRAP. Material misstatements on grants and transfers payables that were identified by the auditors were subsequently corrected by management, which resulted in the financial statements receiving an unqualified audit opinion.
internal control
21. I considered internal control relevant to my audit of the financial statements, annual performance report and compliance with legislation. The matter reported below is limited to the significant internal control deficiency that resulted in the findings on non-compliance with legislation included in this report.
Financial and PerFormance management
22. Management did not adequately implement effective controls for the preparation of credible and reliable financial and performance reports. As a result, management did not prevent and detect all the material misstatements to the financial statements and annual performance report.

67Fin
anc
ial inFo
rmatio
n (c
on
tinu
ed)
summary oF Financial inFormation
reVenue collection
2014/2015 2013/2014
Sources of revenue Budget
Actual Amount collected
(over)/Under collection
Budget Budget
Actual Amount collected
(over)/Under collection
Budgetr’000 r’000 r’000 r’000 r’000 r’000
Skills development levy income 1 198 108 1 255 492 (57 384) 1 046 670 1 155 325 (108 655)Skills development penalties and interest 10 600 23 361 (12 761) 10 000 13 142 (3 142)Government grant income - 23 591 (23 591) 49 360 11 516 37 844Net gains from financial instruments 66 550 83 175 (16 625) 60 500 85 715 (25 215)Other income 53 229 (176) 50 104 (54)Total 1 275 311 1 385 848 (110 537) 1 166 580 1 265 802 (99 222)
Actual current year
Budget current year
Actual prior year
Levy income interest income
1 200 000
1 400 000
1 000 000
800 000
600 000
400 000
200 000
Figure 15: Revenue sources for 2014/2015 financial year

68m
erSE
TA A
nnua
l Rep
ort 2
014/
2015
leVies
merSETA levy income grew by 8.7% in the 2014/2015 financial year over the prior year to reach R1 255 billion. This exceeded the budgeted levy income by 4.8%. The number of contributing employers increased slightly, to 13 399 from 12 849.
The increase in levy income from the prior year is mainly attributable to payroll increases within the contributing companies as well as an increase in the number of qualifying companies as their payroll values reach the minimum threshold of R500 000 per annum.
The breakdown of levies received per chamber as shown in Figures 16 and 17 shows a similar pattern to the prior year, with the Metal Chamber contributing the largest share of levies at 57%. Most companies that were registered, active and contributing were based in Gauteng and the North West as shown in Figure 18.
Percentage of Total Levies Paid by chamber year to date – March 31, 2015 (year 15)
Percentage of Total Levies Paid by chamber year to date – March 31, 2014 (year 14)
Metal, 57%Metal, 57%
Motor, 24%Motor, 24%
Plastics, 8%Plastics, 8%
Auto, 8%Auto, 8%
Unknown, 1%Unknown, 1%
New tyre, 2%New tyre, 2%
AutoAuto
MetalMetal
MotorMotor
New tyreNew tyre
PlasticsPlastics
UnknownUnknown
Figure 16: Percentage of total levies paid by chamber year to date – March 31 2015
Figure 17: Percentage of total levies paid by chamber: year to date – March 31 2014

69Fin
anc
ial inFo
rmatio
n (c
on
tinu
ed)
Figure 18: Total levy analysis by province: year to date March 2015
Figure 19: Size of employer contribution analysis – 2013/2014 vs 2014/2015
Total Levy Analysis by Province year to date March 2015
Active
contributing
UnknownWestern cape
12 000
1 306
6 595
2 104
3 769 4 0
20
2 179
723
437
1 830
1 0491 1
53
11 35
0
743
566
10 000
8 000
6 000
4 000
2 000
0Eastern cape Free State/
Northern cape
gauteng/North West
Mpumulanga /Limpopo
kZN
Size of employer contribution analysis – 2013/14 vs 2014/2015
2015
2014
Empl
oyer
s co
ntrib
utin
g to
dat
e
Employer size
Small Medium Large
12 000 11 42
810
782
1 353 1 3
56
618 71
1
10 000
8 000
6 000
4 000
2 000

70m
erSE
TA A
nnua
l Rep
ort 2
014/
2015
2015 2014
Programme Name BudgetActual
Expenditure(over)/Under Expenditure Budget
Actual Expenditure
(over)/Under Expenditure
r’000 r’000 r’000 r’000 r’000 r’000
Administration 166 861 150 276 16 585 159 824 143 099 16 725
Skills Planning 11 837 6 740 5 097 11 167 8 639 2 528
Increase access to occupationally directed Programmes 418 627 401 857 16 770 468 063 416 704 51 359
Promoting the responsiveness of FETCs to the intermediate skills needs of the sector 34 270 9 993 24 277 35 146 122 513 (87 367)
Addressing the low level of youth and adult language and numeracy skills to enable additional training 14 720 5 060 9 660 19 466 7 934 11 532
Promoting workplace skills development within the sector 326 564 267 593 58 971 317 832 312 686 5 146
Encouraging & supporting co-operatives, small enterprises, worker-initiated and community training initiatives 29 972 11 730 18 242 26 044 12 751 13 293
Career development 10 284 7 816 2 468 11 244 8 567 2 677
Total 1 013 135 861 065 152 070 1 048 786 1 032 893 15 893
mandatory grants
merSETA has experienced a decline in mandatory grant participation as the claims ratio decreased from 70% in the prior year to 67% in the current year. The decline is mainly attributed to issues of companies not obtaining labour sign-off on their WSP submissions as per the requirement of the Grants Regulations.
The mandatory grant expense in the current year decreased by 21% to R206 million from R261 million in the prior year. The decrease is mainly due to the decline in the mandatory grant participation ratio.
Disbursements of mandatory grants are slightly lower than budgeted by 7.9%. The pattern of the mandatory grants actual against budget differs from that of the levy income due to the drop in the claims ratio.
discretionary grants and ProJects exPenditure
Discretionary grants expense, including project expense, in 2014/2015 amounted to R522 million, a decrease of 20% from the prior year expense of R650 million. The increase is mainly due to a unique once-off payment of R114 million to the National Skills Fund in the prior year for a government priority project related to TVET College infrastructure development.

71Fin
anc
ial inFo
rmatio
n (c
on
tinu
ed)
audit and risk committee rePortWe are pleased to present our report for the financial year ended 31 March 2015.
audit and risk committee resPonsibility
The Audit and Risk Committee reports that it has complied with its responsibilities arising from Section 38 (1) (a) of the Public Finance Management Act and Treasury Regulation 3.1. The Audit and Risk Committee also reports that it has adopted appropriate formal terms of reference, as its Charter was reviewed during the year under review. The Committee has regulated its affairs in compliance with this Charter and has discharged all its responsibilities as contained therein.
tHe eFFectiVeness oF internal control and risk management
The merSETA system of controls is designed to provide reasonable assurance that assets are safeguarded and that liabilities and working capital are efficiently managed.
merSETA has a risk management framework and policy in place and these were reviewed during the year under review. A risk register is maintained in order to continually assess the organisation’s risks throughout the year.
The Audit and Risk Committee has considered all significant control matters and associated action plans and it has been established that the organisation’s internal control system and risk management are effective and form a sound basis for the preparation of reliable annual financial statements.
in-year management and montHly/quarterly rePort
The public entity has submitted monthly and quarterly reports to the Executive Authority.
eValuation oF Financial statements
We have reviewed the draft annual financial statements prepared by the public entity.
auditor’s rePort
We have reviewed the public entity’s implementation plan for audit issues raised in the prior year and we are satisfied that the matters have been adequately addressed.
The Audit and Risk Committee concurs with and accepts the conclusions of the external auditor on the annual financial statements and is of the opinion that the audited annual financial statements should be accepted and read together with the report of the auditor.
Mr Andrew Mashifane Chairperson of the Audit Committee merSETA 30 July 2015

72m
erSE
TA A
nnua
l Rep
ort 2
014/
2015
P. Baleni (neé Nzimande) (Chairperson)
R. Patel (Chief Executive Officer)
manuFacturing, engineering and related serVices education and training autHority audited Financial statements
For tHe year ended 31 marcH 2015
The audited Annual Financial Statements for the year ended 31 March 2015, set out on pages 73 to 120, have been approved by the Accounting Authority in terms of section 51(1) (f) of the Public Finance Management Act (PFMA), No 1 of 1999 (as amended) on 30 July 2015, and are signed on their behalf by:

73Fin
anc
ial inFo
rmatio
n (c
on
tinu
ed)
contentsReport of the Accounting Authority 74
Statement of Financial Performance 82
Statement of Financial Position 83
Statement of Changes in Net Assets 84
Cash Flow Statement 85
Statement of Comparison of Actual and Budget Amounts 86
Accounting Policies to the Annual Financial Statements 87
Notes to the Annual Financial Statements 94

74m
erSE
TA A
nnua
l Rep
ort 2
014/
2015
rePort oF tHe accounting autHority to tHe executiVe autHority and Parliament oF tHe rePublic oF soutH aFrica
For tHe Financial year ended 31 marcH 2015
1. general reView oF tHe state oF aFFairs oF tHe merseta
The financial and operational affairs of the merSETA are well-managed and the financial position remains sound. The merSETA has achieved all but one of its performance targets as set out in the Annual Performance Plan. The one target that was not met was unemployed bursaries entered. The management of unemployed bursaries has been handed over to the National Student Financial Aid Scheme (NSFAS) and numerous challenges have been encountered in obtaining the performance reporting information. The merSETA is engaging in continuous discussions with the NSFAS in an effort to address these challenges and to find solutions.
The levy base has shown a steady growth from the prior year, whilst penalties and interest on skills development levy income have increased significantly. Mandatory grant payments have been made on an ongoing basis during the year but the total expenditure decreased significantly from last year. This is mainly due to a drop in the mandatory grant claims ratio.
Disbursements of discretionary grants and projects were lower when compared to prior year. This is mainly due to the once-off payment of R114 million for the TVET infrastructure development project that is managed by the National Skills Fund. The merSETA maintains substantial reserves of which 97% is committed to multiyear learnerships, apprenticeships and projects stretching over the next four years to the value of R1.674 billion.
a. member companies and levies
The merSETA’s levy income grew by 8.7% in the 2014/15 financial year over the prior year to reach
R1.255 billion, exceeding the budgeted levy income by 4.8%.
The number of contributing employers increased slightly to 13,399 from 12,849 in 2013/14. This is represented by:
• Metal chamber – increased by 341 companies
• Motor chamber – increased by 215 companies
• Plastics chamber – decreased by 6 companies
The exemption threshold to paying levies remained at the annual payroll level of R500 000. The increase in the number of contributing employers is marked mainly by the fact that some companies’ annual payroll levels have increased to reach the threshold in the new year, in spite of growing economic challenges within the sector.
grants and Projects
The participation by employers, measured by the number of WSPs submitted in the current year has dropped to 67%, compared to 70% in the prior year. An internal analysis has indicated that the majority of the WSPs that were not approved was due to non-compliance to the sign-off requirements as stipulated in the amended Grant Regulations. The merSETA continues to enforce strict deadlines for the submission of mandatory grant applications, in line with regulations. The merSETA has made mandatory grant disbursements on a regular basis. Disbursements of mandatory grants were slightly below budget resulting in the current year’s total figure of R206 million (prior year: R261 million).
This year, discretionary grants expensed, including project expenses, have decreased by 21% to R516 million from R650 million in the prior year. The prior year expenses were inflated by the once-off payment of R114 million for the public TVET infrastructure

75Fin
anc
ial inFo
rmatio
n (c
on
tinu
ed)
development project. The discretionary grants, including project expenses, is 22% below budget due to delays in milestone delivery on existing MOAs and also delays in the receipt of the project implementation plans on the signed new MOAs. The merSETA continued to effect all first tranche payments at 10% for all programmes except apprenticeship programmes for which the first tranche payment is at 25% of the MOA value, once the company has submitted the signed
yearMandatory discretionary Projects Total
r’000 r’000 r’000 r’0002001 49 714 – 350 50 0642002 66 640 22 144 4 984 93 7682003 188 778 51 530 104 803 345 1112004 143 170 83 794 53 143 280 1072005 256 227 125 061 53 830 435 1182006 362 128 102 719 63 263 528 1102007 250 228 107 811 108 801 466 8402008 204 274 69 114 28 280 301 6682009 303 908 171 534 97 451 572 8932010 334 254 248 928 234 176 817 3582011 368 759 136 870 215 174 720 8032012 445 459 130 680 290 029 866 1682013 514 279 68 794 359 252 942 3252014 261 222 102 372 547 637 911 2312015 206 405 7 369 508 244 722 018
ToTAL 3 955 445 1 428 720 2 669 417 8 053 582
Mandatory R’000’s Non pivotal grants R’000’s Pivotal grants R’000’s
2001
2002
2003
2004
2005
2006
2007
2008
2009
2010
2011
2012
2013
2014
2015
600 000
500 000
400 000
300 000
200 000
100 000
MOA and the implementation report within 60 days of the signed MOA and approved by the merSETA.
The merSETA continues to monitor all the companies that were given discretionary grants as prepayments in the prior years to ensure that training is being implemented. The companies that are not implementing training as per the signed MOA are requested either to effect remedial action or to refund the portion of discretionary grant funds paid to them.
grants paid to date per grant type since inception:

76m
erSE
TA A
nnua
l Rep
ort 2
014/
2015
The growth in grants paid over the period is largely influenced by the growth in the levies received. Discretionary grant expenditure (including projects) increased significantly over the period, which reflects the drive to meet targets as well as to making a significant contribution to other national skills development initiatives.
The drop in mandatory grants in the year 2014 and there after is due to the changes in the Grant
Regulations, whereby the percentage allocation to mandatory grants from levies received was reduced from 50% to 20%. This change has also influenced a decline in the participation ratio year on-year.
The introduction of several co-funding and partnership arrangements to roll out further artisan development projects, have had a profound impact on project expenditure in the last five years.
Non Pivotal grants paid to date by chamber
yearAuto Metal Motor New Tyre Plastic Totalr’000 r’000 r’000 r’000 r’000 r’000
2002 3 016 12 637 4 674 819 998 22 1442003 4 828 32 781 10 663 941 2 317 51 5302004 7 113 50 477 21 257 1 351 3 596 83 7942005 8 650 70 412 37 077 661 8 261 125 0612006 12 516 51 227 31 959 1 187 5 830 102 7192007 12 496 58 152 31 363 851 4 949 107 8112008 7 438 35 829 19 844 1 021 4 982 69 1142009 24 606 84 552 50 676 2 169 9 531 171 5342010 33 139 139 088 62 494 3 342 10 865 248 9282011 17 729 77 123 32 205 3 169 6 644 136 8702012 30 388 57 790 35 136 661 6 705 130 6802013 5 952 36 071 24 410 346 2 015 68 7942014 9 992 67 921 20 197 2 008 2 254 102 3722015 1 5 583 1 785 - - 7 369
ToTAL 177 864 779 643 383 740 18 526 68 947 1 428 720
Auto R’000s Metal R’000s Motor R’000s New tyre R’000s Plastics R’000s
-
40 000
60 000
80 000
100 000
20 000
140 000
120 000
y 2002
y 2003
y 2004
y 2005
y 2006
y 2007
y 2008
y 2009
y 2010
y 2011
y 2012
y 2013
y 2014
y 2015

77Fin
anc
ial inFo
rmatio
n (c
on
tinu
ed)
Mandatory grants paid to date by chamber
yearAuto Metal Motor New Tyre Plastic Totalr’000 r’000 r’000 r’000 r’000 r’000
2001 5 537 27 686 12 429 1 134 2 928 49 7142002 7 990 37 628 15 725 1 986 3 311 66 6402003 28 412 104 438 42 469 5 060 8 399 188 7782004 22 962 77 101 32 670 3 171 7 266 143 1702005 38 581 135 903 60 275 8 744 12 724 256 2272006 47 140 191 523 92 510 6 116 24 839 362 1282007 28 585 129 838 68 159 7 039 16 607 250 2282008 23 316 111 250 52 610 4 210 12 888 204 2742009 32 330 166 167 82 165 4 591 18 655 303 9082010 26 921 190 632 88 582 6 674 21 445 334 2542011 27 865 217 415 96 164 5 703 21 612 368 7592012 43 484 255 222 113 552 8 040 25 161 445 4592013 45 728 300 227 129 835 8 272 30 217 514 2792014 23 246 157 650 60 933 4 657 14 736 261 2222015 23 275 114 513 52 203 3 335 13 079 206 405
ToTAL 425 372 2 217 193 1 000 281 78 732 233 867 3 955 445
The growth in mandatory grants paid over the years is consistent with the levy growth and the increase in participating employers, with the largest levy contributing chamber being paid the most grants. Until 2012/13 there was a consistent increase in the claims ratio year on year. Thereafter, mandatory grants decreased significantly due to the change in the legislated percentage and concomitant drop in the claims ratio.
b. Planned utilisation of surpluses
The merSETA has discretionary reserves of R1.717 billion, of which R1.674 billion is committed to signed contracts approved by the Accounting Authority. These apply to learnerships, apprenticeships, skills programmes and projects that continue to be implemented in ensuing years. Cash and other financial instruments at year end amount to R1.796 billion. The
The allocation of discretionary grants by chamber is consistent with the contribution of each chamber in levies, with metal being the largest levy contributing chamber.
The spike in 2010 is due to the strategic decision to reduce the large surpluses that were carried over from previous years.
y 2002
y 2003
y 2004
y 2005
y 2006
y 2007
y 2008
y 2009
y 2010
y 2011
y 2012
y 2013
y 2014
y 2015
150 000
100 000
200 000
300 000
50 000
-
250 000
350 000
Auto R’000s Metal R’000s Motor R’000s New tyre R’000s Plastics R’000s

78m
erSE
TA A
nnua
l Rep
ort 2
014/
2015
merSETA received approval from National Treasury and the Department of Higher Education and Training to carry forward surpluses for the 2013/14 financial year, and also applied for similar carry-forward surpluses for the 2014/15 financial year in May 2015.
The merSETA carries a R9.8 million administration reserve in its statement of financial position as at 31 March 2015. The administration reserves are equal to the net book value of the noncurrent assets.
2. serVices rendered by tHe merseta
The merSETA renders three broad areas of services to its sector:
a. grant disbursements:
• Disbursement of mandatory grants accounts for 20% of levies paid. This is subject to the companies submitting a valid workplace skills plan received by 30 April 2014. The purpose of the mandatory grant is to partially reimburse companies that undertake training; and
• Disbursements of discretionary grant funds account for a minimum of 49.5%. The discretionary grant is intended to support the training of learners and apprentices and also to undertake special projects that address critical sector needs.
b. quality assurance functions, inclusive of but not limited to:
• Accreditation of workplaces and training providers for the purpose of quality training provision;
• Assessment and moderation of learners against set criteria; and
• Auditing and monitoring of training providers for the purpose of assessing the quality of training provision.
c. skills implementation functions are as follows:
• Development of unit standards and registration of these with the South African Qualifications Authority;
• Development of curriculum and courseware from unit standards registered in the merSETA’s scope of coverage;
• Conceptualisation and implementation of skills initiatives which promote the NSDS objectives and address training needs in the merSETA’s five sub sectors;
• Research into sector training needs in terms of scarce and critical skills and future economic growth related skills;
• Development and maintenance of a database for skills development research and administration;
• Skills development advice and assistance to companies and training providers; and
• Administration and maintenance of the apprenticeship and learnership systems.
3. Human resources
The number of employees as at March 2015 is 249, an increase from the prior year number of 246 employees. The merSETA remained focused on customer service ensuring that the head office and regional offices are sufficiently resourced by competent staff to support stakeholders and deliver on performance targets. A detailed report showing the demographics of the entire organisation is included in the Human Resources section of the Annual Report.

79Fin
anc
ial inFo
rmatio
n (c
on
tinu
ed)
key Personnel
cost to company
2014/15
Performance Bonus
2014/15Total
2014/15Total
2013/14 Notes
r’000 r’000 r’000 r’000Chief Executive Officer 1 798 251 * 2 049 2 204
Chief Financial Officer 1 298 195 * 1 493 1 364
Chief Operating Officer 1 371 206 * 1 577 1 486
Executive: Corporate Services
1 175 176 * 1 351 368 Position vacant from October 2012 to December 2013.
Executive: Strategy and Research
1 215 146 * 1 361 1 283
ToTAL 6 857 974 * 7 831 6 705
* Note that all performance bonuses payable to executives in the 2014/15 year are based on a provision which has been deter-mined based on the outcome of a performance review process.
Employment data for key personnel for merSETA for the 2014/15 financial year: rand 000’s
4. utilisation oF donor Funds
The merSETA entered into an agreement for co-financing of the Accelerated Artisan Training Programme (AATP) with the National Skills Fund (NSF) in March 2009 worth R136 million. Nothing was spent on these funds during the current year as the contract had come to an end. A total of R1.4 million was refunded to the NSF for all unutilised funds.
The merSETA also entered into an arrangement with the Department of Higher Education and Training (DHET) for the Training Layoff Scheme (TLS) in 2009/10. The terms of the agreement were amended such that the DHET’s contribution is only restricted to the wage portion of overall costs, a total of R6.4 million was spent during the year. At the end of March 2015, R10.7 million of these funds was on hand.
The merSETA also entered into an agreement with the Unemployment Insurance Fund (UIF) to the value of R167 million. The funding is utilised for the TLS programme. A total of R17.2 million was expensed during the current year, based on milestone delivery of training provided. At the end of March 2015, R1.6 million of these funds was on hand.
5. business address
The physical and postal addresses of the merSETA are as follows:
merSETA The Atrium 95, 7th Avenue Melville Johannesburg
merSETA P O Box 61826 Marshalltown 2107
6. discontinued actiVities/actiVities to be discontinued
The merSETA did not discontinue any major activity during the year under review and has no plans to discontinue any activities in the next financial year.
7. new/ProPosed actiVities
The merSETA continues to align itself with the government directive to focus on unemployed youth and capacity-building of the public TVET colleges.

80m
erSE
TA A
nnua
l Rep
ort 2
014/
2015 8. eVents aFter tHe
rePorting date
The merSETA is not aware of any events after the reporting date that will affect the financial state of affairs of the organisation for the 2014/15 financial year.
9. PerFormance inFormation
The merSETA’s performance is monitored continually and reported to the Department of Higher Education and Training on a quarterly basis. Performance is measured against merSETA’s strategic programmes, which are based on the objectives of the National Skills Development Strategy III.
The Service Level Agreement between merSETA and DHET contains numerical targets for the financial year, which must be reported in the Annual Report at the end of the financial year. The merSETA is in the process of improving its management information system in an effort to improve the quality of information available for skills planning and monitoring and evaluation, as well as for accuracy of record keeping and reporting.
During the 2014/15 financial year, merSETA has achieved all but one target, namely: unemployed bursaries entered. The details of merSETA’s performance achievements are provided in the Annual Report under the section on Performance Information.
10. corPorate goVernance
The merSETA follows an integrated approach with governance, risk management and compliance forming the three pillars that enable the organisation to achieve its strategic objectives. The elements which are fundamental to governance, risk management and compliance effectiveness have either been addressed by the merSETA or are being addressed as follows:
a. accounting authority
The Accounting Authority which comprises of 15 members, including the three independent members appointed by the Minister of Higher Education and Training (of whom one is the Chairperson), was approved by the Minister of Higher Education and Training on 1 April 2011 for a five year term. Six members represent organised labour and six members represent organised employers.
b. internal audit
The merSETA internal audit function is outsourced to an independent audit firm that carries out its functions based on an approved three year internal audit plan. The independent internal auditors perform and report in terms of the approved Audit and Risk Committee Charter.
c. Financial management
Fraud
In 2010 the merSETA suffered a loss of R 6.3 million through diversion of mandatory grants earmarked for levy-paying employers. The investigation was completed, the perpetrators were charged with fraud, found guilty and sentenced. The funds have not yet been recovered, but the merSETA has instituted legal proceedings to pursue recovery. The merSETA has since reviewed the controls and processes within this area.
The Accounting Authority approved a fraud prevention plan that was successfully implemented during the year resulting in increased fraud awareness and activity on the anonymous fraud hotline.
internal controls
The system of accounting and internal controls is constantly monitored and improved, particularly with regard to financial management, supply chain management and other core business functions. The internal auditors also conduct continuous reviews of the controls and processes in place and advise management of any improvements necessary.
The merSETA’s financial management remains sound and compliant with the PFMA and National Treasury regulations. The merSETA Executive Committee is presented with a full financial management report from the Chief Financial Officer. An all-inclusive budgeting process formed part of the Annual Performance Plan (APP) development process and is used as a benchmark for levy income, grant administration and capital expenditure. A quarterly report showing financial performance results against budget is presented to the merSETA Accounting Authority and the Department of Higher Education and Training.
In terms of the Skills Development Act, total administration expenditure may not exceed 10.5% (this being inclusive of monies payable to the QCTO) of total levy income. The merSETA has kept within the limit.

81Fin
anc
ial inFo
rmatio
n (c
on
tinu
ed)
d. audit and risk committee
The Audit and Risk Committee comprises three independent members and two members of the Accounting Authority. The Audit and Risk Committee has an oversight role and reports to the Accounting Authority. The Committee’s charter is aligned to the duties prescribed by the PFMA and Treasury Regulations and has been approved by the Accounting Authority. The Audit and Risk Committee’s responsibilities also include oversight of risk management processes.
e. other committees
The other Committees of the Accounting Authority are:
I. Executive Committee;
II. Finance and Grants Committee;
III. Human Resource and Remuneration Committee;
IV. Governance and Strategy Committee;
V. Chamber Committees; and
VI. Regional Committees.
The merSETA has one additional support committee, which is the ETQA Committee.
The Committees function within the terms of reference approved by the Accounting Authority and are functioning satisfactorily. More details on the Committees’ functions are presented under the Corporate Governance section of the Annual Report.
f. Policies
The financial statements are prepared in accordance with Generally Recognised Accounting Practice (GRAP) issued by the Accounting Standards Board. The merSETA’s policies and procedures are aligned with GRAP.
Existing policies are reviewed at least every two years, or as necessary to comply with changes in the relevant legislation.
g. supply chain management unit
In response to previous audit reports detailing non-compliance within the supply chain management processes, the merSETA has reviewed all processes and has amended the manual controls and procedures to address weaknesses and also implemented an electronic supply chain management system later in the financial period.
h. it systems
In the current financial year, the merSETA continued to use the Datanet system only for processing levies received and mandatory grant payments.
Data migration from Datanet to SMS began in July 2013 and was completed in July 2014.
The following modules were in operation on the SMS system during the financial year 2014/15: Skills Module, Projects Module, Discretionary Grants Module and ETQA Module.
Great Plains was used throughout the year for the capturing, recording, maintenance and reporting of financial information.
The system used for capturing, maintenance and processing of employee remuneration and benefits is VIP.
i. conflict of interest
The merSETA’s Accounting Authority maintains a declaration of interest register. This is over and above the requirements that members declare whether they have an interest in any item on the agenda of Accounting Authority and subcommittee meetings, to comply with the Public Finance Management Act as well as good corporate governance practice.
P. Baleni (neé Nzimande) (Chairperson)
R. Patel (Chief Executive Officer)

82m
erSE
TA A
nnua
l Rep
ort 2
014/
2015
2015 2014
actual budget Variance actual budget Variance
note r’000 r’000 r’000 r’000 r’000 r’000
REVEnuE
skills development levy income 2 1 255 492 1 198 108 57 384 1 155 325 1 046 670 108 655
skills development penalties and interest 3 23 361 10 600 12 761 13 142 10 000 3 142
national skills Fund income 4 23 591 - 23 591 11 516 49 360 (37 844)
total non-exchange revenue 1 302 444 1 208 708 93 736 1 179 983 1 106 030 73 953
net gains from financial instruments 5 83 175 66 550 16 625 85 715 60 500 25 215
Other income 6 229 53 176 104 50 54
total exchange revenue 83 404 66 603 16 801 85 819 60 550 25 269
total revenue 1 385 848 1 275 311 110 537 1 265 802 1 166 580 99 222
EXPEnsEs
Employer grant and projectexpenses 7 (722 018) (880 235) 158 217 (911 231) (875 387) (35 844)
administration expenses 8 (117 560) (132 903) 15 343 (110 146) (124 039) 13 893
national skills Fund expenses 4 (23 591) - (23 591) (11 516) (49 360) 37 844
total expenses (863 169) (1 013 138) 149 969 (1 032 893) (1 048 786) 15 893
net surplus/(deficit) for the year 1 522 679 262 173 260 506 232 909 117 794 115 115
statement oF Financial PerFormance FOR ThE YEaR EndEd 31 MaRch 2015

83Fin
anc
ial inFo
rmatio
n (c
on
tinu
ed)
31 march 2015 31 march 2014
note r’000 r’000
assETs
current assets
Prepayments 9 185 89
Receivables from non-exchange transfers 10 15 783 9 590
consumables 221 225
Financial instruments at fair value 11 1 638 025 1 320 000
Financial instruments at amortised cost 12 62 050 59 814
cash and cash equivalents 13 157 507 66 784
1 873 771 1 456 502
non-current assets
Property and equipment 14 9 134 11 926
intangible assets 15 629 831
9 763 12 757
total assets 1 883 534 1 469 259
LiaBiLiTiEs
current liabilities
grants and transfers payable 16 129 204 222 088
Financial liabilities at amortised cost 17 12 989 28 712
Provisions 18 12 186 10 683
154 379 261 483
non-current liabilities
Payables from exchange transactions 19 - 1 300
total liabilities 154 379 262 783
net assets 1 729 155 1 206 476
net assets represented by:
administration reserve 9 763 12 757
Employer grant reserve 1 934 2 386
discretionary reserve 1 717 458 1 191 333
total net assets 1 729 155 1 206 476
statement oF Financial Position as aT 31 MaRch 2015

84m
erSE
TA A
nnua
l Rep
ort 2
014/
2015
administrationreserve
employer grant
reservediscretionarygrant reserve
unappropriatedsurplus total
note r’000 r’000 r’000 r’000 r’000
balance at 1 april 2013 9 560 1 388 962 619 - 973 567
net surplus for the year per statement of financial performance - - - 232 909 232 909
allocation of unappropriated surplus for the year 1 35 782 110 982 86 145 (232 909) -
Excess reserves transferred todiscretionary reserve (32 585) (109 984) 142 569 - -
balance at 31 march 2014 12 757 2 386 1 191 333 - 1 206 476
net surplus for the year per statement of financial performance - - - 522 679 522 679
allocation of unappropriated surplus for the year 1 47 435 111 051 364 193 (522 679) -
Excess reserves transferred todiscretionary reserve (50 429) (111 503) 161 932 - -
balance at 31 march 2015 9 763 1 934 1 717 458 - 1 729 155
statement oF cHanges in net assets FOR ThE YEaR EndEd 31 MaRch 2015
The amount retained in the administration reserve is equal to the net book value of the non-current assets.
The amount retained in the employer grant reserve is a mandatory grant provision for newly registered companies participating after the legislative cut-off date. This is noted under contingencies in note 21.2.

85Fin
anc
ial inFo
rmatio
n (c
on
tinu
ed)
casH Flow statement FOR ThE YEaR EndEd 31 MaRch 2015
2015 2014
actual budget Variance actual budget Variance
note r’000 r’000 r’000 r’000 r’000 r’000
cash FLOW FROM OPERaTing acTiViTiEs
operating activities
cash receipts from stakeholdersand others 1 293 883 1 189 484 104 399 1 173 791 1 105 307 68 484
Levies, interest and penalties received 1 276 871 1 208 516 68 355 1 157 656 1 055 417 102 239
income / (outflow) relating togovernment grants 16 783 (19 085) 35 868 16 081 49 840 (33 759)
Other income 6 229 53 176 54 50 4
cash paid to stakeholders, suppliers and employees (962 265) (1 042 934) 80 669 (963 820) (1 128 087) 164 267
grants and project payments (851 703) (915 404) 63 701 (859 053) (1 009 967) 150 914
Employment costs (93 319) (92 848) (471) (84 859) (93 362) 8 503
Payments to suppliers (17 243) (34 682) 17 439 (19 908) (24 758) 4 850
cash (utilised in)/generated from operations 20 331 618 146 550 185 068 209 971 (22 780) 232 751
interest received 80 953 65 040 15 913 47 923 46 089 1 834
net cash inflow from operating activities 412 571 211 590 200 981 257 894 23 309 234 585
cash FLOW FROM inVEsTing acTiViTiEs
Purchase of property andequipment 14 (1 834) (2 076) 242 (6 433) (4 378) (2 055)
Purchase of intangible assets 15 (894) (2 399) 1 505 (1 290) (1 792) 502
Proceeds from disposal ofproperty and equipment 205 - 205 107 30 77
net (purchase)/disposal offinancial instruments at fair value (318 025) (198 000) (120 025) (300 000) (15 000) (285 000)
net cash (outflow) frominvesting activities (320 548) (202 475) (118 073) (307 616) (21 140) (286 476)
cash FLOW FROM Financing acTiViTiEs
Proceeds from borrowings (1 300) (1 233) ( 67) 1 300 - 1 300
net (decrease)/increase in cash and cash equivalents 90 723 7 882 82 841 (48 422) 2 169 (50 591)
cash and cash equivalents atbeginning of year 66 784 66 784 - 115 206 115 206 -
cash and cash equivalents at end of year 13 157 507 74 666 82 841 66 784 117 375 (50 591)

86m
erSE
TA A
nnua
l Rep
ort 2
014/
2015
approvedfinal
budget actual Variance
r’000 r’000 r’000
REVEnuE
skills development levy income 1 198 108 1 255 492 57 384
skills development penalties and interest 10 600 23 361 12 761
government grant income - 23 591 23 591
total non-exchange revenue 1 208 708 1 302 444 93 736
net gains from financial instruments 66 550 83 175 16 625
Other income 53 229 176
total exchange revenue 66 603 83 404 16 801
total revenue 1 275 311 1 385 848 110 537
EXPEnsEs
Employer grant and project expenses (880 235) (722 018) 158 217
administration expenses (132 903) (117 560) 15 343
government grant expenses - (23 591) ( 23 591)
total expenses (1 013 138) (863 169) 149 969
net surplus for the year 262 173 522 679 260 506
statement oF comParison oF budget and actual amounts FOR ThE YEaR EndEd 31 MaRch 2015
revisions to the original budget
No revisions to the original budget had taken place during the financial year ended 31 March 2015.
comparison budget vs. actual
Actual levy income received was in line with the budget amount, showing merely a 4.8% deviation above the budget amount.
Skills development penalties and interest received was higher than normal, at 120% above budget. The manufacturing industry endured a long and protracted industrial action during the year, and the slow down in production during this period resulted in late payments of the skills development levy upon which interest and penalties were levied.
No budget was set at the beginning of the year for
government grants income due to the fact that all previous agreements had been terminated. However, during the year, merSETA managed to finalise an agreement for TLS funded by the Unemployment Insurance Fund (UIF).
Financial instruments performance was below overall budget due to fluctuating market performance during the period on the equity-linked deposits.
Employer grant and project expenses are 18.0% below budget, due to delays in milestone delivery on existing MOAs and submission of the implementation plans for newly signed MOAs.
Administration expenses are 11.6% below budget, showing the impact of the adoption and implementation of the cost containment measures that were issued by National Treasury.

87Fin
anc
ial inFo
rmatio
n (c
on
tinu
ed)
accounting Policies to tHe annual Financial statements
accounting Policies
1. basis oF PreParation
The financial statements have been prepared in accordance with the effective Standards of Generally Recognised Accounting Practices (GRAP) including any interpretations, guidelines and directives issued by the Accounting Standards Board.
The actual and budget information has been prepared and presented on the same basis, being the accrual basis.
2. currency
These financial statements are presented in South African Rands since that is the currency in which the majority of the entity’s transactions are denominated.
3. reVenue recognition
Revenue is recognised when it is probable that future economic benefits will flow to the enterprise and these benefits can be measured reliably.
3.1 levy income
In terms of section 3(1) and 3(4) of the Skills Development Levies Act (SDLA), 1999 (Act No. 9 of 1999), registered member companies of the merSETA pay a skills development levy of 1% of the total payroll cost to the South African Revenue Service (SARS). Companies with an annual payroll cost less than R500 000 are exempted in accordance with section 4(b) of the SDLA (1999) as amended, effective 1 August 2005.
Eighty percent (80%) of skills development levies are paid over to the merSETA (net of a two percent (2%) collection cost to SARS and eighteen percent (18%) contribution to the National Skills Fund).
Skills Development Levy (SDL) transfers are recognised when it is probable that future economic benefits
will flow to the merSETA and these benefits can be measured reliably. This occurs at the earlier of the time the Department of Higher Education and Training (DHET) makes the allocation or payment is made to the merSETA.
Revenue is adjusted for interSETA transfers due to employers changing SETAs. Such adjustments are separately disclosed as interSETA transfers. SDL transfers are made in terms of section 8 of the Skills Development Levies Act, 1999 (Act No 9 of 1999). The amount of the interSETA adjustment is calculated according to the latest Standard Operating Procedure issued by DHET.
The merSETA refunds amounts to employers in the form of grants, based on information from SARS. Where SARS retrospectively amends the information on levies collected, it may result in grants that have been paid to certain employers that are in excess of the amount the merSETA is permitted to have granted to employers. A receivable relating to the overpayment to the employer in earlier periods is raised at the amount of such grant overpayment.
3.2 interest and penalties
Income from interest and penalties on skills development levies is recognised at the earlier of the time the Department of Higher Education and Training (DHET) makes the allocation or payment is made to the merSETA.
3.3 Funds allocated by the national skills Fund for special Projects
Funds transferred by the National Skills Fund (NSF) are accounted for in the financial statements of the merSETA as a deferred income until the related eligible special project expenses are incurred, when the deferred income is extinguished and revenue recognised.
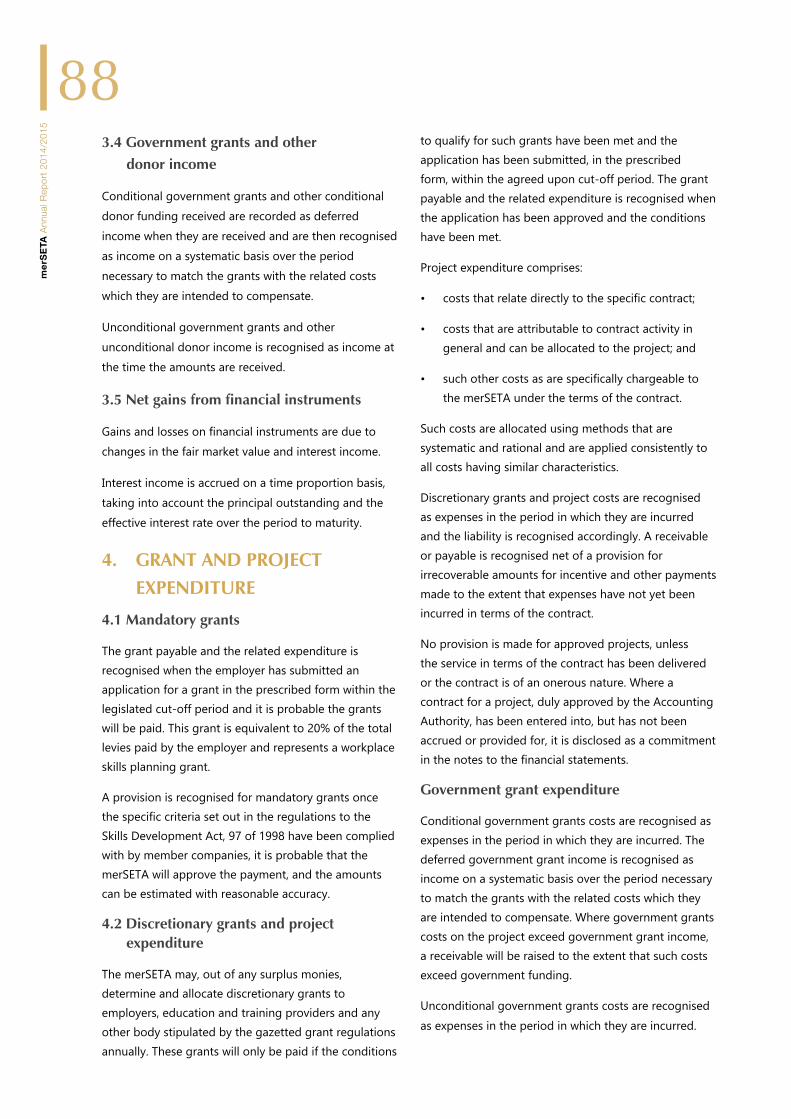
88m
erSE
TA A
nnua
l Rep
ort 2
014/
2015
3.4 government grants and other donor income
Conditional government grants and other conditional donor funding received are recorded as deferred income when they are received and are then recognised as income on a systematic basis over the period necessary to match the grants with the related costs which they are intended to compensate.
Unconditional government grants and other unconditional donor income is recognised as income at the time the amounts are received.
3.5 net gains from financial instruments
Gains and losses on financial instruments are due to changes in the fair market value and interest income.
Interest income is accrued on a time proportion basis, taking into account the principal outstanding and the effective interest rate over the period to maturity.
4. grant and ProJect exPenditure
4.1 mandatory grants
The grant payable and the related expenditure is recognised when the employer has submitted an application for a grant in the prescribed form within the legislated cut-off period and it is probable the grants will be paid. This grant is equivalent to 20% of the total levies paid by the employer and represents a workplace skills planning grant.
A provision is recognised for mandatory grants once the specific criteria set out in the regulations to the Skills Development Act, 97 of 1998 have been complied with by member companies, it is probable that the merSETA will approve the payment, and the amounts can be estimated with reasonable accuracy.
4.2 discretionary grants and project expenditure
The merSETA may, out of any surplus monies, determine and allocate discretionary grants to employers, education and training providers and any other body stipulated by the gazetted grant regulations annually. These grants will only be paid if the conditions
to qualify for such grants have been met and the application has been submitted, in the prescribed form, within the agreed upon cut-off period. The grant payable and the related expenditure is recognised when the application has been approved and the conditions have been met.
Project expenditure comprises:
• costs that relate directly to the specific contract;
• costs that are attributable to contract activity in general and can be allocated to the project; and
• such other costs as are specifically chargeable to the merSETA under the terms of the contract.
Such costs are allocated using methods that are systematic and rational and are applied consistently to all costs having similar characteristics.
Discretionary grants and project costs are recognised as expenses in the period in which they are incurred and the liability is recognised accordingly. A receivable or payable is recognised net of a provision for irrecoverable amounts for incentive and other payments made to the extent that expenses have not yet been incurred in terms of the contract.
No provision is made for approved projects, unless the service in terms of the contract has been delivered or the contract is of an onerous nature. Where a contract for a project, duly approved by the Accounting Authority, has been entered into, but has not been accrued or provided for, it is disclosed as a commitment in the notes to the financial statements.
government grant expenditure
Conditional government grants costs are recognised as expenses in the period in which they are incurred. The deferred government grant income is recognised as income on a systematic basis over the period necessary to match the grants with the related costs which they are intended to compensate. Where government grants costs on the project exceed government grant income, a receivable will be raised to the extent that such costs exceed government funding.
Unconditional government grants costs are recognised as expenses in the period in which they are incurred.

89Fin
anc
ial inFo
rmatio
n (c
on
tinu
ed)
5. irregular, Fruitless and wasteFul exPenditure
Irregular expenditure means expenditure incurred in contravention of, or not in accordance with, a requirement of any applicable legislation, including:
• The Public Finance Management Act (PFMA), No. 1 of 1999 (as amended)
• The Skills Development Act, No. 97 of 1998 (as amended)
Fruitless and wasteful expenditure means expenditure that was made in vain and would have been avoided had reasonable care been exercised. All material irregular, fruitless and wasteful expenditure is recognised against the specific class of expense to which it relates and disclosed in a note to the financial statements when it has been identified.
6. ProPerty and equiPment
Property and equipment comprise tangible assets held for administrative use and are expected to be used during more than one accounting period. Property and equipment are stated at cost less any subsequent accumulated depreciation and adjusted for any impairments. Depreciation has been calculated on the straight-line method to write off the cost of each asset at acquisition to estimated residual value over its estimated useful life as follows:
Asset class depreciation periodComputer equipment 3 - 6 yearsOffice furniture and fittings 5 - 10 yearsOffice equipment 5 - 10 yearsMotor vehicles 4 - 8 yearsOther assets 2 - 5 years
The useful lives of property and equipment and their residual values are reassessed at the end of each financial year.
Where the carrying amount of an asset is greater than its estimated recoverable amount, it is written down immediately to its recoverable amount (i.e. impairment losses are recognised).
Repairs and maintenance costs are charged to the statement of financial performance.
Profits and losses on disposal of property and equipment are determined by reference to their carrying amount and are taken into account in determining operating surplus or deficit.
7. intangible assets
Intangible assets that meet the recognition criteria are recognised in the statement of financial position at amortised cost, being the initial cost price less any accumulated amortisation and impairment losses.
Amortisation is charged to the statement of financial performance so as to write off the cost of intangible assets over their estimated useful lives, using the straight-line method as following:
Asset class Amortisation periodComputer equipment 1 - 3 years
The useful lives of intangible assets are reassessed at the end of each financial year.
8. consumables
Consumables are charged to surplus or deficit on acquisition on cost price. At the end of the financial period an adjustment is made for consumable stock on hand, using the latest available prices.
9. leasing
Finance lease
A lease is an agreement between two parties whereby the one party (the lessor) allows the other party (the lessee) to use its assets for an agreed period of time in return for a payment, or series of payments.
A finance lease is a lease arrangement that transfers substantially all the risks and rewards incidental to ownership to the lessee.
At recognition, an asset and liability is recognised at the lower of: fair value of asset; or present value of minimum lease payment at rate implicit in lease (or incremental borrowing rate if the preceding cannot be

90m
erSE
TA A
nnua
l Rep
ort 2
014/
2015
determined).
The leased asset is subsequently measured as per GRAP 17: Property, Plant and Equipment.
Lease payments are discounted at the rate that causes the present value of the minimum lease payments and unguaranteed residual value to be equal to the sum of the fair value of the leased asset plus any direct costs of the lessee.
operating lease
An operating lease is a lease other than a finance lease.
Rentals payable under operating leases are charged to surplus/deficit on a straight-line basis over the term of the relevant lease. Benefits received and receivable as an incentive to enter into an operating lease are also spread on a straight-line basis over the lease term.
10. retirement beneFit costs
The merSETA participates in the Momentum Funds at Work Umbrella Pension Fund. This fund is a defined contribution plan and the assets are held in separate trustee-administered funds. The plan is generally funded by payments from the entity and employees, taking into account the recommendations of independent qualified actuaries.
Payments to the defined contribution plan are charged to the statement of financial performance in the year to which they relate.
The rules of the defined contribution plan determine the following in respect of contributions:
Contribution by employee 7.50%Contribution by employer 12.08%Total contribution 19.58%
11. ProVisions
Provisions are recognised when the merSETA has a present legal and constructive obligation as a result of a past event and it is probable that this will result in an outflow of economic benefits that can be reliably estimated. The provision is measured at the best estimate of expenditure required to settle the present obligation at the reporting date.
Where the effect of the time value of money is material, the present value of the provision shall be the present value of the expenditure expected to settle the obligation. The merSETA provides for onerous contracts when the expected benefits to be derived from the contract are less than the unavoidable costs of meeting the obligation under the contract.
Provision for employee related entitlements
The cost of other employee benefits (not recognised as retirement benefits - see note 11 above) are recognised during the period in which the employee renders the related service. Employee entitlements are recognised when they accrue to employees. A provision is made for the estimated liability as a result of services rendered by employees up to the reporting date. Provisions included in the statement of financial position are provisions for Workman’s Compensation, leave pay and performance bonuses.
12. Financial instruments
recognition
A financial instrument is any contract that gives rise to a financial asset of one entity and a financial liability or a residual interest in another entity.
Financial assets and financial liabilities are recognised on the merSETA’s statement of financial position when the merSETA becomes a party to the contractual provisions of the instrument.
Financial instruments carried on the statement of financial position include financial assets at fair value, financial assets at amortised cost, and financial liabilities at amortised cost. Where relevant, the particular recognition methods adopted are disclosed in the individual policy statements associated with each item.
Financial assets
Financial assets are defined as cash, or a residual interest of another entity, or a contractual right to receive cash or another financial asset from another entity.
The merSETA’s principal financial assets are financial

91Fin
anc
ial inFo
rmatio
n (c
on
tinu
ed)
assets at fair value, financial assets at amortised cost and cash and cash equivalents.
Financial assets at amortised cost
Financial assets at amortised cost are non-derivative financial instruments, with fixed and determinable payments, excluding those that are held for trading or designated at fair value at initial recognition.
Deposits paid are discounted on a time basis, by reference to the principal outstanding and at the effective interest rate applicable, which is the rate that exactly discounts estimated future cash receipts through the expected life of the financial asset to that asset’s net carrying amount. The prevailing market rate for a similar instrument with a similar credit risk rating is used as the discount rate.
The initial measurement of other receivables from exchange transactions is at fair value including any transaction costs. The subsequent measurement is at amortised cost, using the effective interest rate method, where considered applicable. Impairment losses are recognised in an allowance account where the carrying value exceeds the present value of future cash flows, discounted at the original effective interest rate.
Financial assets at fair value
Financial assets at fair value are either derivatives, combined instruments that are designated at fair value, instruments held for trading, non-derivatives designated at fair value in initial recognition and financial instruments that do not meet the definition of amortised cost or cost.
The merSETA has classified its investments (fixed notice deposits, money market instruments and equity linked deposits) as financial assets at fair value as these non-derivatives were designated at fair value in initial recognition and are held for trading as the intention is to earn short-term gains.
The initial measurement of financial assets at fair value is at fair value. The subsequent measurement is at fair value based on quoted price where an active market exists, or by using a valuation technique if no active market exists.
The net gains and losses for all financial assets at fair value are determined by the changes in the market value between the reporting periods. These net gains and losses include the interest income on fixed notice deposits which is accrued on a time proportion basis, taking into account the principal outstanding and the effective interest rate over the period of maturity.
cash and cash equivalents
Cash and cash equivalents are initially measured at fair value. The subsequent measurement is at amortised cost with interest calculated by using the effective interest rate method.
Financial liabilities
Financial liabilities arise where there is a contractual obligation to deliver cash or another financial asset to another entity, or to exchange financial instruments with another entity under potentially unfavourable conditions.
The merSETA’s principal financial liabilities are trade payables and salary and wage related accruals.
Financial liabilities at amortised cost
Trade payables from exchange transactions and salary and wage-related accruals are classified as financial liabilities at amortised cost. Financial liabilities are initially recognised at fair value and subsequently measured at amortised cost, using the effective interest rate method.
derecognition
A financial asset or a portion thereof is derecognised when the merSETA realises the contractual rights to the benefits specified in the contract, the rights expire, the merSETA waives those rights or otherwise loses control of the contractual rights that comprise the financial asset and transfers to another party substantially all the risks and rewards of ownership of the financial asset.
On derecognition, the difference between the carrying amount of the financial asset and the sum of the proceeds receivable and any prior adjustment to reflect

92m
erSE
TA A
nnua
l Rep
ort 2
014/
2015
the fair value of the asset that had been reported in net assets is included in net surplus or deficit for the period.
Fair value measurement considerations
The fair value at which financial instruments are carried at reporting date have been determined using the available market values. The market values are readily and regularly available from an active market where transactions are on an arm’s length basis. Where market values are not available, the fair value is determined using a valuation technique such as:
• Recent arm’s length market transaction;
• If available, reference to the current fair value of another instrument that is substantially the same; and
• Discounted cash flow analysis, discounting the future receipts/payments of a financial instrument over the period of the contract, by using a market-related interest rate (adjusted for credit risk), to its present value.
offsetting
Financial assets and financial liabilities are offset if there is any intention to realise the asset and settle the liability simultaneously and a legally enforceable right to set off exists.
13. reserVes
Net assets are sub-classified in the statement of financial position between the following funds and reserves:
• Administration reserve
• Employer grant reserve
• Discretionary grant reserve
• Accumulated surplus/deficit
This sub-classification is based on the restrictions placed on the distribution of monies received in accordance with the regulations issued in terms of the Skills Development Act, 1998 (Act No. 97 of 1998).
Member company levy payments are set aside in terms of the Skills Development Act and the regulations issued in terms of the Act, for the purpose of:
2015
%
2014
%Administration costs of the merSETA 10 10QCTO Administration costs 0.5 0.5Mandatory Workplace Skills Planning Grant 20 20Discretionary grants and projects 49.5 49.5Received by the merSETA 80 80Contribution to NSF 20 20
100 100
In addition, contributions received from public service employers in the national or provincial spheres of government may be used to pay for merSETA administration costs.
Interest and penalties received from SARS as well as interest received on investments are utilised for discretionary grants and projects. Other income received is utilised in accordance with the original source of the income.
The minimum amount retained in the administration reserve equates to the net book value of non-current assets.
Surplus funds in the employer grant reserve are transferred to the discretionary grant reserve at the end of the financial year. An amount is retained in the employer grant reserve, after consideration is given to new companies, which in terms of the regulations, have six months after joining to submit their workplace skills plan.
15. contingencies
In terms of the PFMA, all surplus funds as at year-end may be forfeited to National Treasury should an application for retention of surplus funds be denied.
Newly registered member companies have up to six months after registration to submit work place skills plans. The amount retained in the Employer Grant Reserve makes provision for such a contingency.

93Fin
anc
ial inFo
rmatio
n (c
on
tinu
ed)
16. related Party transactions
Parties are considered to be related if one party has the ability to control (or jointly control) the other party or exercise significant influence over the other party, or vice versa, or an entity that is subject to common control, or joint control.
All departments and public entities in the national sphere of government are related parties as they are ultimately under common control.
An individual or entity may be given oversight responsibility over the merSETA , which gives them significant influence, but not control, over the financial and operating decisions of the entity.
Representation of individuals to the Accounting Authority Body, sub-committees of the Accounting Authority or other equivalent body is considered as significant influence.
Management are those persons responsible for planning, directing and controlling the activities of the entity, including those charged with the governance of the entity in accordance with legislation, in instances where they are required to perform such functions.
Close members of the family of a person are considered to be those family members who may be expected to influence, or be influenced by, that member of management in their dealings with the entity.
A related party transaction is a transfer of resources or obligations between related parties, regardless of whether a price is charged.
Only transactions with related parties where the transactions are not concluded within the normal operating procedures or on terms that are no more or no less favourable than the terms it would use to conclude transactions with another entity or person are disclosed.
17. comParatiVe Figures
Where necessary, comparative figures have been adjusted to conform to changes in presentation in the current year.
18. critical accounting Judgements and key sources oF estimation uncertainty
In the application of the merSETA’s accounting policies, management is required to make judgements, estimates and assumptions about the carrying amounts of assets and liabilities that are not readily apparent from other sources. The estimates and associated assumptions are based on historical experience and other factors that are considered to be relevant. Actual results may differ from these estimates.
These estimates and underlying assumptions are reviewed on an ongoing basis. Revisions to accounting estimates are recognised in the period in which the estimate is revised if the revision affects only that period, or in the period of the revision and future periods if the revision affects both current and future periods.
key sources of estimating uncertainty
The following are the key assumptions concerning the future, and other key sources of estimating uncertainty at year end, that have a significant risk of causing a material adjustment to the carrying amounts of assets and liabilities within the next financial year.
Useful lives of property and equipment
All classes of property and equipment are depreciated on a straight-line basis over the asset’s useful life. The merSETA reviews the estimated useful lives and residual values of property and equipment at the end of each annual reporting period. Refer to note 14 for the carrying values of property and equipment.
Provision for below threshold levies received,
Companies with annual payrolls below R500,000 are exempted from paying skills development levies. Each year, the merSETA estimates the value and makes provision for levies paid when the company should not have paid the levies as its annual payroll falls below the threshold.

94m
erSE
TA A
nnua
l Rep
ort 2
014/
2015
total per statement of
Financial Performance
administration reserve
employer grants reserve
discretionary grants
national skills Fund grants
total discretionary
r’000 r’000 r’000 r’000 r’000 r’000
year ended 31 march 2015
total revenue 1 385 848 164 995 317 456 879 806 23 591 903 397
skills development levy income
admin levy income (10%) 164 814 164 814 - - - -
grant levy income (70%) 1 090 678 - 317 456 773 222 - 773 222
skills development levy: penaltiesand interest 23 361 - - 23 361 - 23 361
government grant income 23 591 - - - 23 591 23 591
investment income 83 175 - - 83 175 - 83 175
Other income 229 181 - 48 - 48
total expenses 863 169 117 560 206 405 515 613 23 591 539 204
Employer grants and project expenses 722 018 - 206 405 515 613 - 515 613
administration expenses 117 560 117 560 - - - -
national skills Fund expenses 23 591 - - - 23 591 23 591
net surplus per the statement of financial performance allocated 522 679 47 435 111 051 364 193 - 364 193
year ended 31 march 2014
total revenue 1 265 802 145 928 372 204 736 154 11 516 747 670
skills development levy income
admin levy income (10%) 145 878 145 878 - - - -
grant levy income (70%) 1 009 447 - 372 204 637 243 - 637 243
skills development levy penaltiesand interest 13 142 - - 13 142 - 13 142
government grant income 11 516 - - - 11 516 11 516
investment income 85 715 - - 85 715 - 85 715
Other income 104 50 - 54 - 54
total expenses 1 032 893 110 146 261 222 650 009 11 516 661 525
Employer grants and project expenses 911 231 - 261 222 650 009 - 650 009
administration expenses 110 146 110 146 - - - -
national skills Fund expenses 11 516 - - - 11 516 11 516
net surplus per the statement of financial performance allocated 232 909 35 782 110 982 86 145 - 86 145
notes to tHe Financial statements FOR ThE YEaR EndEd 31 MaRch 2015
1. allocation oF net surPlus For tHe year to reserVes:

95Fin
anc
ial inFo
rmatio
n (c
on
tinu
ed)
notes to tHe Financial statements (continued) FOR ThE YEaR EndEd 31 MaRch 2015
3. skills deVeloPment leVy Penalties and interest
2015 2014
note r’000 r’000
ThE TOTaL LEVY incOME PER ThE sTaTEMEnT OF
FinanciaL PERFORMancE is as FOLLOWs:
levy income: administration 164 814 145 878
Levies received from saRs 164 097 146 758
intersETa transfers in 412 94
intersETa transfers out 87 (114)
Provision for refund from saRs 218 (860)
levy income: employer grants 317 456 372 204
Levies received from saRs 315 377 375 477
intersETa transfers in 56 102
intersETa transfers out 298 (463)
Provision for refund from saRs 1 725 (2 912)
levy income: discretionary grants 773 222 637 243
Levies received from saRs 771 156 640 356
intersETa transfers in 1 970 317
intersETa transfers out 295 (321)
Provision for refund from saRs (199) (3 109)
1 255 492 1 155 325
Penalties 13 934 7 238
interest 9 427 5 903
intersETa transfers - 1
23 361 13 142
2. skills deVeloPment leVy income

96m
erSE
TA A
nnua
l Rep
ort 2
014/
2015
4. goVernment grants
2015 2014
note r’000 r’000
aatP Programme
Opening balance 1 378 2 608
Funds received during the year - 510
investment income 27 50
utilised and recognised as revenue – conditions met - (1 790)
Refund to national skills Fund (1 405) -
closing balance - 1 378
tls Programme
Opening balance 16 458 11 912
Funds received during the year - 10 404
investment income 617 503
utilised and recognised as revenue – conditions met (6 385) (6 361)
closing balance 10 690 16 458
total
Opening balance 17 836 14 520
Funds received during the year - 10 914
investment income 644 553
utilised and recognised as revenue – conditions met (6 385) (8 151)
Refund to national skills Fund (1 405) -
balance of national skills Fund 16 10 690 17 836
The contract for funding the accelerated artisan training programme (AATP) ended in the previous year, thus the remaining unutilised funds were refunded to the National Skills Fund in the current year. Funds were disbursed on the wage portion of the training layoff scheme (TLS) but no further income was received in the current year.
notes to tHe Financial statements (continued) FOR ThE YEaR EndEd 31 MaRch 2015
4.1 national skills Fund

97Fin
anc
ial inFo
rmatio
n (c
on
tinu
ed)
4. goVernment grants (continued)
5. net gains From Financial instruments
6. otHer income
2015 2014
note r’000 r’000
tls Programme
Opening balance 1 249 -
Funds received during the year 17 440 4 566
investment income 104 48
utilised and recognised as revenue – conditions met (17 206) (3 365)
closing balance 16 1 587 1 249
During the current year the merSETA concluded a contract with the National Department of Public Works for the training and development of artisans. One of the conditions of the contract is that a 5% management fee is to be paid to the merSETA for the administration of the contract.
notes to tHe Financial statements (continued) FOR ThE YEaR EndEd 31 MaRch 2015
4.2 unemployment insurance Fund
net gains from financial assets at fair value 80 360 83 013
interest income from financial assets at amortised cost 2 815 2 702
83 175 85 715
surplus on disposal of property and equipment - 50
income from re-certification 48 54
Management fee income 181 -
229 104
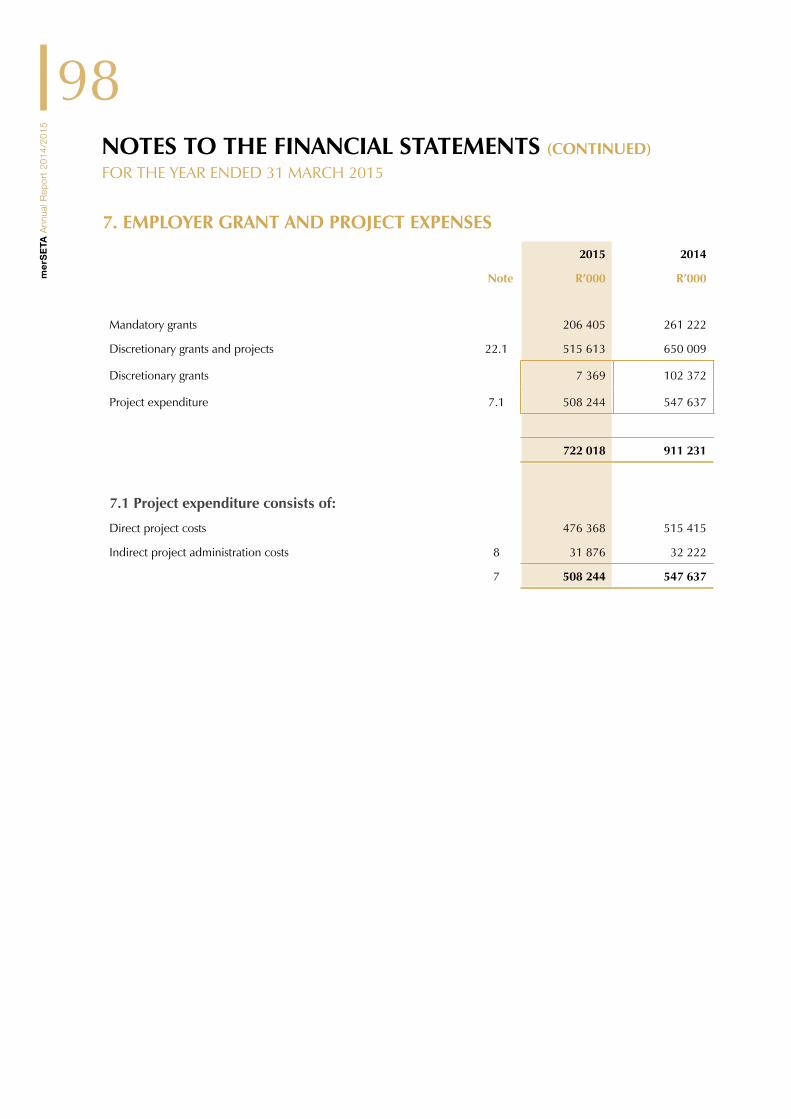
98m
erSE
TA A
nnua
l Rep
ort 2
014/
2015
7. emPloyer grant and ProJect exPenses
2015 2014
note r’000 r’000
Mandatory grants 206 405 261 222
discretionary grants and projects 22.1 515 613 650 009
discretionary grants 7 369 102 372
Project expenditure 7.1 508 244 547 637
722 018 911 231
7.1 Project expenditure consists of:
direct project costs 476 368 515 415
indirect project administration costs 8 31 876 32 222
7 508 244 547 637
notes to tHe Financial statements (continued) FOR ThE YEaR EndEd 31 MaRch 2015

99Fin
anc
ial inFo
rmatio
n (c
on
tinu
ed)
8. administration exPenses
2015 2014
note r’000 r’000
advertising, marketing and promotions, communication 4 001 3 573
amortisation – intangible assets 15 1 096 848
audit costs – internal audit 1 278 1 242
audit costs – external audit 2 737 1 500
Bad debts - 109
Bank charges 318 232
accounting authority and sub-committee costs 1 854 2 345
Remuneration to members of the audit committee 254 256
accounting authority and sub-committee members’ fees 1 372 1 975
accounting authority and sub-committee assessment cost 144 -
stakeholder training 84 -
secretarial services - 114
cleaning and groceries 327 372
depreciation 2 493 2 280
Employment costs 96 917 88 414
Recruitment costs 74 304
salaries, wages and benefits 8.1 94 906 86 228
staff training, development and welfare 1 937 1 882
Entertainment expenses 9 42
gifts, donations and sponsorships paid 64 424
impairment of property and equipment - 150
insurance and licence fees 1 268 1 176
investigations and forensic costs 7 165
Legal fees 1 280 1 289
Loss on disposal of property and equipment 462 -
Operating lease rentals 10 898 10 698
Buildings 10 456 9 208
Equipment 176 -
Parking 266 1 490
Printing, stationery and postages 1 946 2 405
QcTO administration cost 3 236 1 779
Rates, water and electricity 3 098 3 060
Repairs, maintenance and running costs 2 412 2 879
Buildings 1 166 1 624
Property and equipment 1 246 1 255
service provider administration fees 3 771 2 766
special functions 254 950
storage 270 317
Telecommunication expenses 3 148 4 500
Travel, subsistence and meeting expenses 6 292 8 853
149 436 142 368
Less: amounts allocated to project expenditure 7.1 (31 876) (32 222)
net administration cost 117 560 110 146

100m
erSE
TA A
nnua
l Rep
ort 2
014/
2015
8. administration exPenses (continued)
9. PrePayments
2015 2014note r’000 r’000
8.1 salaries and wages 83 233 75 472
Basic salaries 71 989 64 513Performance awards 6 458 6 653arbitration awards 135 -Other non-pensionable allowance 3 412 3 580Temporary staff 585 478Leave payments 654 248
social contributions 11 673 10 756Medical aid contributions 3 256 2 882Pension contributions: defined contribution fund 7 341 6 605uiF 367 351insurance (115) 218Other salary – related costs 824 700
94 906 86 228
average number of employees 252 246
notes to tHe Financial statements (continued) FOR ThE YEaR EndEd 31 MaRch 2015
Refer to the report by the Accounting Authority for disclosure concerning the emoluments of the Chief Executive Officer; the Chief Financial Officer and other Senior Managers.
The defined contribution fund is administered by Momentum. It is a sub-fund under the Funds at Work umbrella fund. The expense recognised in the statement of financial performance equates to the contributions due for the year.
note R’000 R’000
Prepayments – insurance 185 89
10. receiVables From non-excHange transFers
Employer receivable 10.1 - -
Receivable – investigations 10.2 - -Receivable – uiF 15 193 9 461national department of Public Works 587 -intersETa receivable 24.1 3 129
15 783 9 590

101Fin
anc
ial inFo
rmatio
n (c
on
tinu
ed)
notes to tHe Financial statements (continued) FOR ThE YEaR EndEd 31 MaRch 2015
The employer receivable of R8,3 million (March 2014: R7,4 million) is recognised due to SARS effecting retrospective adjustments on levies on which mandatory grants have already been paid. An amount of R 8,3 million (March 2014: R7,4 million) was provided against such employer receivables.
ageing of receivables: 2015 2014
uiF ndPw interseta uiF ndPw interseta
current 760 191 - 375 - 95
30 days 28 - - 1 896 - -
60 days 624 51 - 107 - -
90 days 495 345 - 557 - -
91 days - 6 months 7 864 - - 4 790 - -
6 months - 1 year 2 514 - - 1 772 - -
1 year plus 2 908 - 3 (36) - 34
total 15 193 587 3 9 461 - 129
ageing of receivables: 2015 2014
gross impairment gross impairment
current 1 231 (1 231) 667 (667)
30 days 207 (207) 336 (336)
60 days 251 (251) 288 (288)
90 days 549 (549) 124 (124)
91 days - 6 months 942 (942) 720 (720)
6 months - 1 year 175 (175) 265 (265)
1 year plus 5 024 (5 024) 4 970 ( 4970)
total 8 379 (8 379) 7 370 (7 370)
2015 2014
note r’000 r’000
10.1 employer receivable
Overpayment to employers 8 379 7 370
allowance for doubtful debts (8 379) (7 370)
net effect of saRs retrospective adjustments on affected employers - -
allowance for doubtful debts:
Opening carrying amount (7 370) (9 324)
amount utilised 1 680 4 070
additional provision during period (2 689) (2 116)
closing carrying amount (8 379) (7 370)
10. receiVables From non-excHange transFers (continued)

102m
erSE
TA A
nnua
l Rep
ort 2
014/
2015
2015 2014note r’000 r’000
10.2 receivable - investigationsReceivable arising from investigations 6 329 6 329 allowance for doubtful debt (6 329) (6 329) net receivable from investigations - -
notes to tHe Financial statements (continued) FOR ThE YEaR EndEd 31 MaRch 2015
10. receiVables From non-excHange transFers (continued)
11. Financial instruments at Fair Value
12. Financial instruments at amortised cost
These balances have been carried unchanged since 2011.
2015 2014note r’000 r’000
Fixed notice deposits 300 000 360 000
Money market instruments 1 338 025 960 0001 638 025 1 320 000
All the financial assets at fair value are measured at quoted prices as per the market determinable fair value from an active market at reporting date.
The fair value measurements recognised are at a Level 1 hierarchy as they are based on quoted prices (unadjusted) in an active market.
No significant transfers between the fair value measurements hierarchy levels have occurred during the reporting period.
The merSETA obtained National Treasury approval of the banking institutions where these funds are held as required in terms of Treasury Regulation 31.2. The weighted average interest rate on financial instruments at fair value was 5.57% (2014: 7.41%).
During the 2014 financial year an amount of R109 000, relating mainly to a rental deposit was deemed irrecoverable and was written off in the subsequent year.
2015 2014note r’000 r’000
deposits 1 442 1 427Receivables due by employees and stakeholders 5 6
1 447 1 433Less: allowance for doubtful debts - (109)
1 447 1 324interest receivable 60 603 58 490
62 050 59 814

103Fin
anc
ial inFo
rmatio
n (c
on
tinu
ed)
2015 2014note r’000 r’000
cash at bank 5 638 812cash on hand 31 37call accounts 151 838 66 935
157 507 66 784
notes to tHe Financial statements (continued) FOR ThE YEaR EndEd 31 MaRch 2015
13. casH and casH equiValents
The merSETA obtained National Treasury approval of the banking institutions where these funds are held as required in terms of Treasury Regulation 31.2. The weighted average interest rate for cash and cash equivalents was 5.20% (2014: 4.63%).
As the merSETA was exempted by the National Treasury from the requirements of Treasury regulation 31.3 to invest surplus funds with the Corporation for Public Deposits, surplus funds were invested in line with an investment policy as required by Treasury regulation 31.3.5.
Cash on hand constitutes petty cash that is spread across eight regional offices, including head office.

104m
erSE
TA A
nnua
l Rep
ort 2
014/
2015
14. ProPerty and equiPment
cost
accumulated
depreciation/
impairments
closing
carrying
amountyear ended 31 march 2015 r’000 r’000 r’000 owned assetscomputer equipment 7 906 (4 938) 2 968Office furniture and fittings 6 510 (3 856) 2 654Office equipment 3 391 (2 234) 1 157
Motor vehicles 576 (124) 452Other assets 1 231 (800) 431total owned assets 19 614 (11 952) 7 662leased assetsMotor vehicles 4 162 (2 690) 1 472total asset balance at end of year 23 776 (14 642) 9 134
year ended 31 march 2014owned assetscomputer equipment 9 452 (6 465) 2 987Office furniture and fittings 7 584 (4 294) 3 290Office equipment 4 108 (2 733) 1 375Motor vehicles 576 (64) 512Other assets 1 230 (408) 822balance at end of year 22 950 (13 964) 8 986
leased assetsMotor vehicles 4 162 (1 222) 2 940total asset balance at end of year 27 112 (15 186) 11 926
notes to tHe Financial statements (continued) FOR ThE YEaR EndEd 31 MaRch 2015

105Fin
anc
ial inFo
rmatio
n (c
on
tinu
ed)
14. ProPerty and equiPment (continued)
notes to tHe Financial statements (continued) FOR ThE YEaR EndEd 31 MaRch 2015
opening
carrying
amount
impairment
cost
re-
classification additions
disposals
cost
depreciation
charge
accumulated
depreciation
on disposals
closing
carrying
amount
r’000 r’000 r’000 r’000 r’000 r’000 r’000 r’000
movement summary
2015
owned assets
computer equipment 2 987 - - 1 584 (3 129) (1 213) 2 739 2 968
Office furniture and
fittings3 290 - - 55 (1 129) (454) 892 2 654
Office equipment 1 375 - - 195 (913) (373) 873 1 157
Motor vehicles 512 - - - - (60) - 452
Other assets 822 - - - - (391) - 431
total owned assets 8 986 - - 1 834 (5 171) (2 491) 4 504 7 662
leased assets
Motor vehicles 2 940 - - - - (1 468) - 1 472
balance at end of year 11 926 - - 1 834 ( 5 171) (3 959) 4 504 9 134
movement summary
2014
owned assets
computer equipment 3 175 (130) - 958 (69) (985) 38 2 987
Office furniture and
fittings3 634 (10) - 235 (267) (560) 258 3 290
Office equipment 1 025 (10) - 690 (564) (326) 560 1 375
Motor vehicles 557 - 30 - (157) (75) 157 512
Other assets 767 - - 388 - (333) - 822
total owned assets 9 158 (150) 30 2 271 (1 057) (2 279) 1 013 8 986
leased assets
Motor vehicles - - - 4 162 - (1 222) - 2 940
balance at end of year 9 158 (150) 30 6 433 (1 057) (3 501) 1 013 11 926
No assets have been pledged as security or collateral for any liability.
In the current year the MerSETA reviewed the useful lives, residual values, depreciation methods and tested the assets for impairment.

106m
erSE
TA A
nnua
l Rep
ort 2
014/
2015
15. intangible assets - comPuter soFtware
16. grants and transFers Payable
cost
accumulated
depreciation
closing
carrying
amountyear ended 31 march 2015 r’000 r’000 r’000 intangible assets 899 (270) 629
year ended 31 march 2014intangible assets 1 876 (1 045) 831
opening carrying amount
impair-ment cost
Fair value adjustment additions
disposals cost
deprecia-tion charge
accumulated depreciation on disposals
closing carrying amount
r’000 r’000 r’000 r’000 r’000 r’000 r’000 r’000
year ended 31 march 2015
intangible assets 831 - - 894 (1 872) (1 096) 1 872 629
year ended 31 march 2014
intangible assets 402 - - 1 290 (520) (848) 507 831
notes to tHe Financial statements (continued) FOR ThE YEaR EndEd 31 MaRch 2015
2015 2014note r’000 r’000
grants payable 100 064 184 032
intersETa payables 24.1 1 122 1 590
national skills Fund income received in advance 4.1 10 690 17 836unemployment insurance Fund income received in
advance 4.2 1 587 1 249
Provision for saRs refund 16.1 15 741 17 381
129 204 222 088
16.1 Provision for sars refund
Opening carrying amount 17 381 10 287
amount utilised (5 027) (1 014)
additional provision during the period 3 387 8 108
closing carrying amount 16 15 741 17 381
Companies with annual payrolls below R500,000 are exempted from paying skills development levies. SARS will be refunded where levies have been paid by such exempt companies.

107Fin
anc
ial inFo
rmatio
n (c
on
tinu
ed)
17. Financial liabilities at amortised cost
18. ProVisions
notes to tHe Financial statements (continued) FOR ThE YEaR EndEd 31 MaRch 2015
2015 2014note r’000 r’000
Trade payables from exchange transactions 10 736 26 610
accruals salaries and wages 953 869
short-term portion of finance lease 1 300 1 233
12 989 28 712
2015 2014note r’000 r’000
Provision for leave pay 4 068 3 659
Provision for Workman’s compensation 250 488
Provision for performance bonuses 7 868 6 536
12 186 10 683
The Workman’s Compensation provision is calculated in accordance with the Workman’s Compensation Act no 130 of 1993.
leave pay
workman’s
compensation
Performance
bonusesr’000 r’000 r’000
Opening carrying amount 1 april 2013 3 731 257 5 711amounts utilised 2014 (325) (22) (5 255)(Reversal)/ additional provision during the period 253 253 6 080
closing carrying amount 2014 3 659 488 6 536amounts utilised 2015 (305) (121) (5 571)(Reversal)/ additional provision during the period 714 (117) 6 903closing carrying amount 2015 4 068 250 7 868
19. Payables From excHange transactions31 march 2015 31 march 2014
note r’000 r’000
Finance lease liability 1 300 2 533
short-term portion (1 300) (1 233)
- 1 300
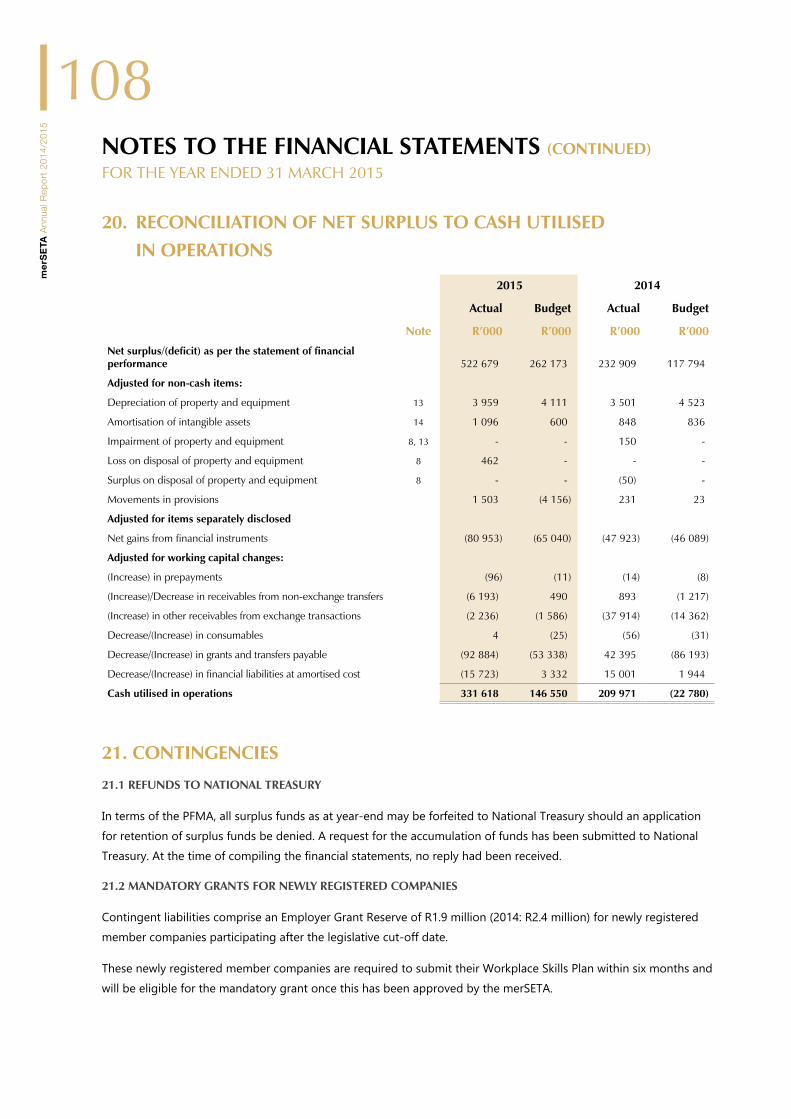
108m
erSE
TA A
nnua
l Rep
ort 2
014/
2015
2015 2014
actual budget actual budget
note r’000 r’000 r’000 r’000
net surplus/(deficit) as per the statement of financial performance 522 679 262 173 232 909 117 794
adjusted for non-cash items:
depreciation of property and equipment 13 3 959 4 111 3 501 4 523
amortisation of intangible assets 14 1 096 600 848 836
impairment of property and equipment 8, 13 - - 150 -
Loss on disposal of property and equipment 8 462 - - -
surplus on disposal of property and equipment 8 - - (50) -
Movements in provisions 1 503 (4 156) 231 23
adjusted for items separately disclosed
net gains from financial instruments (80 953) (65 040) (47 923) (46 089)
adjusted for working capital changes:
(increase) in prepayments (96) (11) (14) (8)
(increase)/decrease in receivables from non-exchange transfers (6 193) 490 893 (1 217)
(increase) in other receivables from exchange transactions (2 236) (1 586) (37 914) (14 362)
decrease/(increase) in consumables 4 (25) (56) (31)
decrease/(increase) in grants and transfers payable (92 884) (53 338) 42 395 (86 193)
decrease/(increase) in financial liabilities at amortised cost (15 723) 3 332 15 001 1 944
cash utilised in operations 331 618 146 550 209 971 (22 780)
20. reconciliation oF net surPlus to casH utilised in oPerations
21. contingencies
21.1 reFunds to national treasury
In terms of the PFMA, all surplus funds as at year-end may be forfeited to National Treasury should an application for retention of surplus funds be denied. A request for the accumulation of funds has been submitted to National Treasury. At the time of compiling the financial statements, no reply had been received.
21.2 mandatory grants For newly registered comPanies
Contingent liabilities comprise an Employer Grant Reserve of R1.9 million (2014: R2.4 million) for newly registered member companies participating after the legislative cut-off date.
These newly registered member companies are required to submit their Workplace Skills Plan within six months and will be eligible for the mandatory grant once this has been approved by the merSETA.
notes to tHe Financial statements (continued) FOR ThE YEaR EndEd 31 MaRch 2015

109Fin
anc
ial inFo
rmatio
n (c
on
tinu
ed)
22. commitments
22.1 discretionary reserVe commitments
Of the balance of R1,717 billion available in the discretionary reserve on 31 March 2015 an amount of R1,674 billion has been approved for future project expenses and discretionary grants as set out below. Amounts for expenses that have already been incurred, and therefore included in project and discretionary grant expense in the statement of financial performance, are also indicated.
notes to tHe Financial statements (continued) FOR ThE YEaR EndEd 31 MaRch 2015
Project/discretionary grant programmes
opening balance
2014
administration expenditure/
other adjustments
2014
approved contractual
expenditure 2014
charged to statement
of financial performance
2014
opening balance
2015
administration expenditure/
other adjustments
2015
approved contractual
expenditure 2015
charged to statement
of financial performance
2015closing balance
r’000 r’000 r’000 r’000 r’000 r’000 r’000 r’000 r’000
Prog 1: administrationdiscretionary grant administration Expenditure - 21 572 - (21 572) - 23 551 - (23 551) -
Project administration Expenditure - 10 650 - (10 650) - 8 326 - (8 326) -
Monitoring & Evaluation - - 768 (576) 192 - - (192) -
Organisational development - 162 - (162) - - - - -
- 32 384 768 (32 960) 192 31 877 - (32 069) -
Prog 2: skills Planning
ssP Review 3 358 2 988 2 244 (8 305) 285 4 005 4 284 (6 530) 2 044
strategic planning project - - - - - - 1 835 (540) 1 295
university of Jhb-WiL - - - - - - 5 494 - 5 494
Labour & stakeholder capacity Building - 97 - (97) - 200 - (200) -
stakeholder information dissemination - 228 - (228) - - - -
3 358 3 313 2 244 (8 630) 285 4 205 11 613 (7 270) 8 833
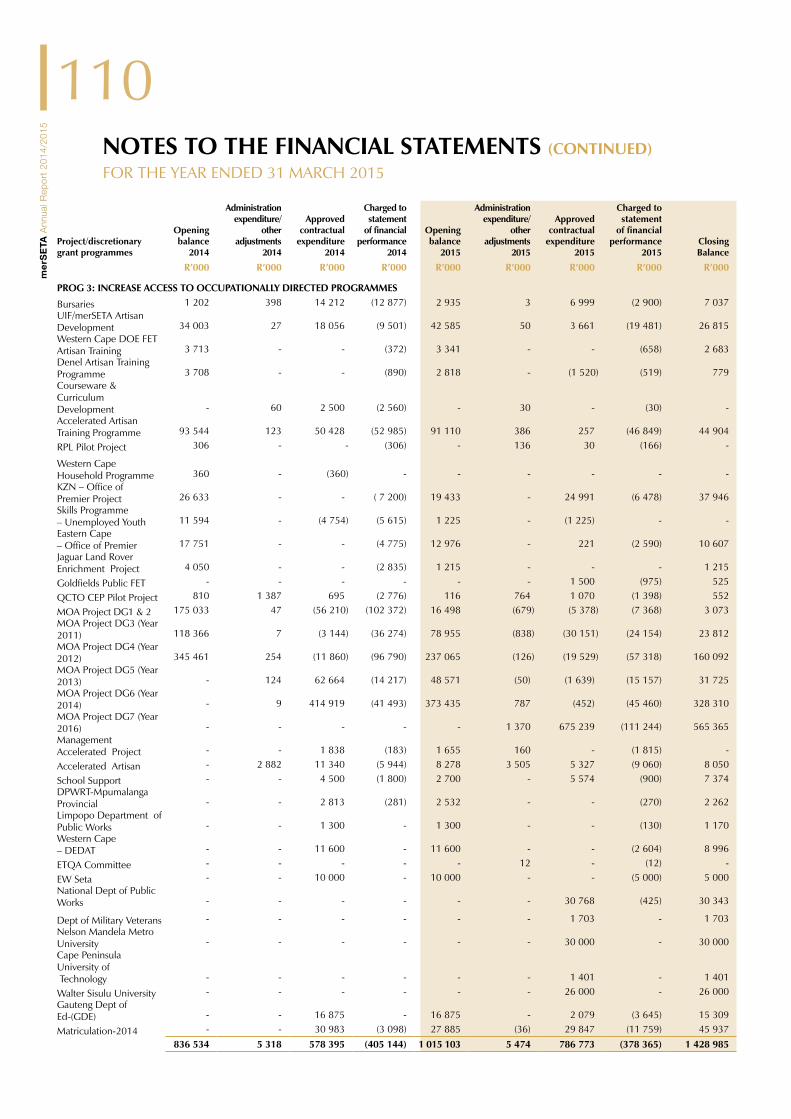
110m
erSE
TA A
nnua
l Rep
ort 2
014/
2015
notes to tHe Financial statements (continued) FOR ThE YEaR EndEd 31 MaRch 2015
Project/discretionary grant programmes
opening balance
2014
administration expenditure/
other adjustments
2014
approved contractual
expenditure 2014
charged to statement
of financial performance
2014
opening balance
2015
administration expenditure/
other adjustments
2015
approved contractual
expenditure 2015
charged to statement
of financial performance
2015closing balance
r’000 r’000 r’000 r’000 r’000 r’000 r’000 r’000 r’000
Prog 3: increase access to occuPationally directed Programmes
Bursaries 1 202 398 14 212 (12 877) 2 935 3 6 999 (2 900) 7 037uiF/mersETa artisan development 34 003 27 18 056 (9 501) 42 585 50 3 661 (19 481) 26 815Western cape dOE FET artisan Training 3 713 - - (372) 3 341 - - (658) 2 683denel artisan Training Programme 3 708 - - (890) 2 818 - (1 520) (519) 779courseware & curriculum development - 60 2 500 (2 560) - 30 - (30) -accelerated artisan Training Programme 93 544 123 50 428 (52 985) 91 110 386 257 (46 849) 44 904
RPL Pilot Project 306 - - (306) - 136 30 (166) -
Western cape household Programme 360 - (360) - - - - - -KZn – Office of Premier Project 26 633 - - ( 7 200) 19 433 - 24 991 (6 478) 37 946skills Programme – unemployed Youth 11 594 - (4 754) (5 615) 1 225 - (1 225) - -Eastern cape – Office of Premier 17 751 - - (4 775) 12 976 - 221 (2 590) 10 607Jaguar Land Rover Enrichment Project 4 050 - - (2 835) 1 215 - - - 1 215
goldfields Public FET - - - - - - 1 500 (975) 525
QcTO cEP Pilot Project 810 1 387 695 (2 776) 116 764 1 070 (1 398) 552
MOa Project dg1 & 2 175 033 47 (56 210) (102 372) 16 498 (679) (5 378) (7 368) 3 073MOa Project dg3 (Year 2011) 118 366 7 (3 144) (36 274) 78 955 (838) (30 151) (24 154) 23 812MOa Project dg4 (Year 2012) 345 461 254 (11 860) (96 790) 237 065 (126) (19 529) (57 318) 160 092MOa Project dg5 (Year 2013) - 124 62 664 (14 217) 48 571 (50) (1 639) (15 157) 31 725MOa Project dg6 (Year 2014) - 9 414 919 (41 493) 373 435 787 (452) (45 460) 328 310MOa Project dg7 (Year 2016) - - - - - 1 370 675 239 (111 244) 565 365Management accelerated Project - - 1 838 (183) 1 655 160 - (1 815) -
accelerated artisan - 2 882 11 340 (5 944) 8 278 3 505 5 327 (9 060) 8 050
school support - - 4 500 (1 800) 2 700 - 5 574 (900) 7 374dPWRT-Mpumalanga Provincial - - 2 813 (281) 2 532 - - (270) 2 262Limpopo department of Public Works - - 1 300 - 1 300 - - (130) 1 170Western cape – dEdaT - - 11 600 - 11 600 - - (2 604) 8 996
ETQa committee - - - - - 12 - (12) -
EW seta - - 10 000 - 10 000 - - (5 000) 5 000national dept of Public Works - - - - - - 30 768 (425) 30 343
dept of Military Veterans - - - - - - 1 703 - 1 703nelson Mandela Metro university - - - - - - 30 000 - 30 000cape Peninsula university of Technology - - - - - - 1 401 - 1 401
Walter sisulu university - - - - - - 26 000 - 26 000gauteng dept of Ed-(gdE) - - 16 875 - 16 875 - 2 079 (3 645) 15 309
Matriculation-2014 - - 30 983 (3 098) 27 885 (36) 29 847 (11 759) 45 937836 534 5 318 578 395 (405 144) 1 015 103 5 474 786 773 (378 365) 1 428 985

111Fin
anc
ial inFo
rmatio
n (c
on
tinu
ed)
notes to tHe Financial statements (continued) FOR ThE YEaR EndEd 31 MaRch 2015
Project/discretionary grant programmes
opening balance
2014
administration expenditure/
other adjustments
2014
approved contractual
expenditure 2014
charged to statement
of financial performance
2014
opening balance
2015
administration expenditure/
other adjustments
2015
approved contractual
expenditure 2015
charged to statement
of financial performance
2015closing balance
r’000 r’000 r’000 r’000 r’000 r’000 r’000 r’000 r’000
Prog 4: Promote tHe resPonse oF Fetcs to skills sector needsFalse Bay Public FET college - - 21 287 - 21 287 - 13 166 (3 667) 30 786isOEs 10 906 174 4 927 (7 492) 8 515 (311) 6 370 (5 203) 9 371TVET support - - - - - - 5 574 - 5 574TVET support - - - - - - 92 318 - 92 318goldfields Public TVET college - - - - - - 2 455 - 2 455national skills Fund - - 114 530 (114 530) - - - - -The British council - - 242 (242) - - - - -central university of Technology - - 1 672 (250) 1 422 - 3 285 (1 122) 3 585
10 906 174 142 658 (122 514) 31 224 (311) 123 168 (9 992) 144 089
Prog 5: address low leVels oF literacyMaths and science student Project 7 285 (600) (51) (3 399) 3 235 - (2 605) (630) - aBET Project Phase 3 & 4 3 640 4 (880) (1 192) 1 572 5 407 (684) 1 300nEET access Programme 7 732 1 418 1 052 (2 909) 7 293 76 (3 511) (3 221) 637FLc Rural Outreach Project - - 1 293 (434) 859 15 221 (525) 570TuT-institute for advanced Tooling - - 1 426 (178) 1 248 - - (669) 579uJ Project - 50 100 (50) 100 - 2 970 - 3 070
18 657 872 2 940 (8 162) 14 307 96 (2 518) (5 729) 6 156
Prog 6: Promote work Place skills deVeloPmentinternships - 1 549 - (1 549) - 2 179 - (2 179) -new Venture creation 1 263 - (463) - 800 - (644) (156) -Retrenchment assistance Programme 22 831 582 56 747 (25 760) 54 400 424 (3 299) (13 858) 37 667People with disabilities 9 389 326 - (3 239) 6 476 126 1 080 (3 206) 4 476accounting Technicians Project - - - - - - 4 995 - 4 995annual conference - 733 - (733) - 225 - (225) -
33 483 3 190 56 284 (31 281) 61 676 2 954 2 132 (19 624) 47 138
Prog 7: suPPort co-oPeratiVes, smmes and ngos
hiV aids Project 83 - 4 040 (849) 3 274 - (612) (2 662) -non Levy Paying ngOs and cBOs 6 590 8 1 458 (4 580) 3 476 71 525 (2 664) 1 408department of Trade & industry - - - - - - 1 500 - 1 500
sME Voucher Project 2 946 4 193 10 485 (7 250) 10 374 2 456 280 (5 421) 7 689
green skills - 72 - (72) - - - - -
9 619 4 273 15 983 (12 751) 17 124 2 527 1 693 (10 747) 10 597

112m
erSE
TA A
nnua
l Rep
ort 2
014/
2015
22.2 oPerating leases
This represents the total of future minimum lease payments under non-cancellable operating leases:
The operating leases relate to premises utilised for office accommodation. The lease agreements were entered into onvarious dates and will be operational for varying periods, the last expiring on 31 March 2016. For purposes of calculating the lease commitments, options to renew the leases on expiry have been ignored. The rental escalations vary from lease to lease, the average being 8%.
2015 2014r’000 r’000
not later than one year 12 420 11 673
Later than one year and not later than five years - 12 644
12 420 24 317
22.3 Finance leases
During the 2012/13 financial year the merSETA acquired a mobile bus for career guidance purposes under a finance lease agreement. The total of future minimum lease payments can be broken down as follows:
2015 2014r’000 r’000
not later than one year 1 336 1 336
Later than one year and not later than five years - 1 336
1 336 2 672
The present value of minimum lease payments can be broken down as follows:
notes to tHe Financial statements (continued) FOR ThE YEaR EndEd 31 MaRch 2015
Project/discretionary grant programmes
opening balance
2014
administration expenditure/
other adjustments
2014
approved contractual
expenditure 2014
charged to statement
of financial performance
2014
opening balance
2015
administration expenditure/
other adjustments
2015
approved contractual
expenditure 2015
charged to statement
of financial performance
2015closing balance
R’000 R’000 R’000 R’000 R’000 R’000 R’000 R’000 R’000
Prog 8: career deVeloPment
World skills - 1 954 - (1 954) - 1 256 2 396 (3 084) 568career Path & development 1 630 2 051 550 (4 231) - 2 168 - (2 168) -international conferences - 121 - (121) - - - - -Mobile skills development - (294) 6 943 (2 261) 4 388 371 - (2 565) 2 194
nsFas - - 20 000 (20 000) - - 69 000 (44 000) 25000
1 630 3 832 27 493 (28 567) 4 388 3 795 71 396 (51 817) 27 762
total commitments 914 187 53 356 826 765 (650 009) 1 144 299 50 617 994 257 (515 613) 1 673 560

113Fin
anc
ial inFo
rmatio
n (c
on
tinu
ed)
notes to tHe Financial statements (continued) FOR ThE YEaR EndEd 31 MaRch 2015
2015 2014r’000 r’000
not later than one year 1 300 1 233
Later than one year and not later than five years - 1 300
1 300 2 533
23. Financial instruments
In the course of the merSETA operations, it is exposed to market risk, credit risk and liquidity risk. The merSETA has developed a comprehensive risk strategy in order to monitor and control these risks. The risk management process relating to each of these risks is discussed under the headings below:
market
Market risk is the risk that fair value or future cash flows of a financial instrument will fluctuate because of changes in market prices. Market risk comprises three types of risk, namely, interest rate risk, currency risk and other price risks.
The merSETA does not have exposure to currency risks as none of the financial instruments are denominated in a foreign currency.
interest rate risk
The merSETA is exposed to interest rate risk as it has invested its cash mainly in interest-bearing instruments.
The merSETA manages its interest rate risk by diversifying its portfolio to include fixed notice deposits that earn short-term gains at fixed rates.
The money market instruments are designed to mitigate the interest rate risk to an acceptable level as the interest is linked to JIBAR rates and the instrument weighted over different maturity periods.
The merSETA limits further exposure to interest rate risk by dealing with well-established institutions. These institutions must be approved by National Treasury and highly rated to be included in the merSETA’s investment policy.
22. commitments (continued)

114m
erSE
TA A
nnua
l Rep
ort 2
014/
2015
notes to tHe Financial statements (continued) FOR ThE YEaR EndEd 31 MaRch 2015
Floating rate Fixed rate non-interest bearing total
amount r’000
effective interest
rateamount
r’000
weighted average
effective interest rate %
weighted average period
for which the rate is fixed
amount r’000
weighted average
period until maturity in
years r’000
year ended 31 march 2015
assets
cash and cash equivalents 5 669 5.20% 151 838 5 .20% 6 months - - 157 507Financial instruments at fair value 1 638 025 5.57% - - - - - 1 638 025Other receivables from exchange transactions - - - - - 62 050 3 months 62 050
total 1 643 694 151 838 62 050 1 857 582
liabilities
Trade Payables - - - - - 10 736 30 days 10 736
Payroll-related accruals - - - - - 953 30 days 953
Total financial liabilities - - - - - 11 689 - 11 689
net financial assets 1 643 694 151 838 50 361 1 845 893
year ended 31 march 2014
assets
cash and cash equivalents 849 4.63% 65 935 4.63% 6 months - - 66 784Financial instruments at fair value 1 320 000 7.41% - - - - - 1 320 000Other receivables from exchange transactions - - - - - 59 814 3 months 59 814
total 1 320 849 65 935 59 814 1 446 598
liabilities
Trade Payables - - - - - 26 610 30 days 26 610
Payroll-related accruals - - - - - 869 30 days 869
Total financial liabilities - - - - - 27 479 - 27 479
net financial assets 1 320 849 65 935 32 335 1 419 119
23. Financial instruments (continued)
The merSETA's exposure to interest rate risk and the effective interest rates on financial instruments at reporting date are as follows:

115Fin
anc
ial inFo
rmatio
n (c
on
tinu
ed)
notes to tHe Financial statements (continued) FOR ThE YEaR EndEd 31 MaRch 2015
Equity market risk
The merSETA is exposed to a pricing risk due to fluctuations in the equity market as it has an investment that is linked to equity instruments.
The equity market risk is managed by ensuring that the capital amount invested is guaranteed by the financial institution. The capital guarantees arising from contractual arrangements with the financial institutions, thus are enforceable by law.
The investment policy that has been approved by the accounting authority states the requirements for the capital preservation on equity-linked instruments and a limited percentage of total investments can be invested in equity-
linked instruments.
sensitiVity analysis
At 31 March 2015, if the weighted average interest rate was 100 basis point higher with all other variables held constant, then the surplus would have been R24 million higher to R546.6 million, arising from the increase in net gains on financial instruments. If the weighted average interest rate was 100 basis point lower with all other variables held constant, then the surplus would have been R8 million lower to R514.6 million, arising from the decreased net gains in financial instruments than what was budgeted for.
At 31 March 2015, if skills development levy income grew only by 5% from the previous financial year, instead of the 9% growth and all other variables held constant, then a surplus of R464.9 million would have been incurred. If the skills development levy income grew by 15% and all other variables held constant, then a surplus of R595.7 million would have been earned.
credit risk
Credit risk is the risk that one party to a financial instrument will cause a financial loss for the other party by failing to discharge an obligation.
The financial assets which potentially subject the merSETA to the risk of non-performance to counter-parties and thereby subject to credit risk are the receivables from exchange transactions.The ageing of receivables is disclosed in note 10.1.
The merSETA is exposed to credit risk in regard to payments made in advance on discretionary grants whereby not all deliverables as agreed upon in the Memorandum of Agreement have been met.
The merSETA has entered into agreements with the qualifying employers, whereby other tranche payments are recoverable only once training has been implemented.
The merSETA does not have any material exposure to any individual or counter-party. The merSETA’s concentration of credit risk is limited to the manufacturing, engineering and related services industry in which the merSETA operates. No events occurred in the manufacturing, engineering and related services industry during the financial year that may have an impact on the receivables that has not been adequately provided for. Receivables are presented net of an allowance for doubtful debts.

116m
erSE
TA A
nnua
l Rep
ort 2
014/
2015
notes to tHe Financial statements (continued) FOR ThE YEaR EndEd 31 MaRch 2015
The entity’s maximum exposure to credit risk is as follows:
2015 2014r’000 r’000
Receivables due by employees and stakeholders 5 6
intersETa receivable 3 1298 135
In the current year receivables due by employees and stakeholders relates to an overpayment of board fees, due to a change in the principles applied in calculating board fees. This will be recovered from future payments. In the prior year it related to an overpayment of leave pay to employees.
liquidity risk
Liquidity risk is the risk that the entity could experience difficulties in meeting its commitments to creditors as financial liabilities fall due for payment.
The merSETA is exposed to liquidity risks as it has outstanding obligations to make payments to levy-paying employers and training providers for training that has been completed and also payments to trade creditors for goods delivered and services rendered.
The merSETA manages liquidity risk through proper management of working capital, capital expenditure, actual against forecast cash flows and its cash management policy. Adequate reserves and liquid resources are also maintained.
Maturity analysis on the entity’s contractual cash flows for its non-derivative financial liabilities :
2015
carrying
amount
contractual
cash Flow
6 months
or less 6-12 months 1-2 years
More than
2 years
Trade and other payables from
exchange transactions 10 736 10 736 10 736 - - -
2014
Trade and other payables from
exchange transactions 26 610 26 610 26 610 - - -
Fair values
The merSETA’s financial instruments consist mainly of cash and cash equivalents and receivables and payables from exchange transactions. No financial instrument was carried at an amount in excess of its fair value and fair values could be reliably measured for all financial instruments. The following methods and assumptions are used to determine the fair value of each class of financial instruments:
23. Financial instruments (continued)

117Fin
anc
ial inFo
rmatio
n (c
on
tinu
ed)
notes to tHe Financial statements (continued) FOR ThE YEaR EndEd 31 MaRch 2015
cash and cash equivalents
The carrying amount of cash and cash equivalents approximates fair value due to the relatively short to medium-term maturity of these financial assets.
otHer receiVables From excHange transactions
The carrying amount of other receivables from exchange transactions approximates fair value due to the relatively short-term maturity of these financial assets.
24. related Party transactions
24.1 transactions witH otHer setas
Interest transactions and balances arise due to the movement of employers from one SETA to another. No other transactions occurred during the year with other SETAs. The balances at year-end included in receivables and payables are:
2015
r’000
2014
r’000
note
net transfers
in/(out) during
the year
amount
receivable/
(payable)
transfers in/(out)
during the year
amount
receivable/
(payable)
receivables 10 2 256 3 (62) 129
cETa - - (179) -
agRisETa 55 - - 3
EWsETa (Previously EsETa) - 3 - 2
FassET - - 19 -
FP&M sETa - - 9 -
chiETa - - - -
MicT sETa (Previously isETT) 2 201 - (3) 32
sERVicEs sETa - - 92 92
Payables 16 862 (1 122) (323) (1 590)
insETa - - (2) -
W&R sETa 862 ( 1 122) (321) (1 590)
total 3 118 (1 119) (385) (1 461)
23. Financial instruments (continued)

118m
erSE
TA A
nnua
l Rep
ort 2
014/
2015
24.2 accounting autHority and indePendent committee members Fees
2015
r’000
2014
r’000net transfers
in/(out) during
the year
amount
receivable/
(payable)
transfers in/(out)
during the year
amount
receivable/
(payable)n chirwa (51) - (62) (49)J Esterhuizen (106) 7 (149) (78)a hanekom * (97) (3) (125) (78)M Kuscus (independent) (47) 1 (78) (49)h Korstens * (85) - (88) (49)J Lopes ** - - (28) -M Maisela (independent) (94) - (27) (7)n Mannie - - (113) (64)M Mogopodi (106) - (180) (64)T Molapo (87) - (93) (51)M ally (22) - - -n suleman (7) - - -J Olivier * (84) - (97) (70)s Rensburg (independent) (36) - (62) (49)F Tregenna (83) - (150) (81)X Tshayana (113) - (186) (97)J swarts (97) - (109) (65)J Van niekerk (85) - (140) (75)J Wilson - - (124) (51)R daniels (independent) (52) - (57) (49)a Mashifane (independent) (132) - (66) (17)h Von Maltitz (24) - - -T Mashanda (independent) (77) - (22) -F Mukaddam (indepedent) (55) - (19) (11)a Mashilo (independent) (86) - - -
(1 626) 5 (1 975) (1 054)
These transactions and balances relate to Accounting Authority fees and independent committee members’ fees. * Board fees for these members were paid to the employer body or representative union ** These members have resigned
25. going concern
The merSETA was set up in terms of the Skills Development Act No 97 of 1998. The Minister extended the MerSETA’s licence for a period of five years up to 31 March 2016. Accordingly, the merSETA has drawn up and presented these financial statements on a going concern basis.
notes to tHe Financial statements (continued) FOR ThE YEaR EndEd 31 MaRch 2015

119Fin
anc
ial inFo
rmatio
n (c
on
tinu
ed)
notes to tHe Financial statements (continued) FOR ThE YEaR EndEd 31 MaRch 2015
26. material losses tHrougH criminal conduct, irregular, Fruitless and wasteFul exPenditure
criminal conduct
There were no losses suffered through criminal conduct in the current year.
During the prior year a forensic investigation into supply chain management uncovered malpractice in the disposal of assets process and fraudulent activities regarding a specific service provider. There is no direct financial loss incurred by the entity with regards to the unethical and unfair process followed in the disposal of assets. The total loss quantified and incurred due to the irregular practice in supply chain management amounted to R96 000.
A disciplinary process is underway during the financial year end, with the responsible incumbent for contravention of the merSETA Code of Conduct and the National Treasury Regulations 16A8.1 and 16A8.2 and 16A.8.3. The disciplinary process was finalised subsequent to the financial year end, and the incumbent was discharged.
irregular exPenditure
2015 2014r’000 r’000
Opening Balance 934 6 679
add: irregular Expenditure – current year - 608
Less: Expenditure where condonation declined - (6 353)
934 934
analysis of expenditure awaiting condonation per age classification
current year - 608
Prior year 934 326
total 934 934
Fruitless and wasteFul exPenditure
No material fruitless and wasteful expenditure was incurred during the current or previous year.
27. taxation
No provision has been made for taxation as the merSETA is exempt from tax in terms of section 10 of the Income Tax Act

120m
erSE
TA A
nnua
l Rep
ort 2
014/
2015
28. new accounting Pronouncements
At the date of authorisation of these financial statements, the Accounting Standards Board had issued the following additional standards that are not yet effective for the 31 March 2015 year end. These may have an impact on future financial statements:
statement effective dateRelated Parties disclosures gRaP 20 no date determined
service concession arrangements: grantor gRaP 32 no date determined
statutory Receivables gRaP 108 no date determined
An entity shall apply Standards of GRAP for Annual Financial Statements covering periods beginning on or after a date to be determined by the Minister of Finance in a regulation to be published in accordance with section 91(1)(b) of the PFMA.
grAP 20 : related Parties disclosures This Standard provides guidance on related-party disclosures to ensure that a reporting entity’s financial statements contain the disclosures necessary to draw attention to the possibility that its financial position and surplus or deficit may have been affected by the existence of related parties and by transactions and outstanding balances with such parties.
grAP 32 : Service concession Arrangements: grantor This Standard prescribes the accounting for service concession arrangements by the grantor, a public sector entity.
grAP 108: Statutory receivables This Standard prescribes accounting requirements for the recognition, measurement, presentation and disclosure of statutory receivables. In July 2014 the Minister of Finance prescribed the application of the following standards of GRAP for the financial years beginning after 1 January 2015 for schedule 3A and 3C public entities and constitutional institutions:
statement effective datesegment Reporting gRaP 18 1 January 2015
Transfer of Function between Entities under common control gRaP 105 1 January 2015
Transfer of Function between Entities not under common control gRaP 106 1 January 2015
Mergers gRaP 107 1 January 2015
grAP 18: Segment reporting This Standard provides guidance on accounting for determination of reporting segments and will require additional disclosure.
grAP 105: Transfers of Functions between entities under common control This Standard provides guidance on how to establish accounting principles for the acquirer and transferor in a transfer of functions between entities under common control. It will not impact the current accounting policies or disclosures.
grAP 106: Transfers of Functions between entities not under common control This Standard provides guidance on how to establish accounting principles for the acquirer in a transfer of functions between entities not under common control. It will not impact the current accounting policies or disclosures.
grAP 107: Mergers This Standard provides guidance on how to establish accounting principles for the combined entity and combining entities in a merger. It will not impact the current accounting policies or disclosures.
notes to tHe Financial statements (continued) FOR ThE YEaR EndEd 31 MaRch 2015

121Fin
anc
ial inFo
rmatio
n (c
on
tinu
ed)

122m
erSE
TA A
nnua
l Rep
ort 2
014/
2015


gauteng soutH (Head oFFice)
mersETa house, 95 7th avenue, cnr Rustenburg
Road, Melville, Johannesburg
Tel: 010 219 3000 | Fax:011 484 5499
gauteng nortH
& nortH west (Pta) & nortH west (Pta)
automotive supplier Park, 30 helium Road,
Rosslyn Ext. 2
Tel: 0861 637 731| Fax: 0866 700299
limPoPo
1st Floor, no 8 corridor street, Route n4,
Business Park, Ben Fleur Ext 11, Witbank
Tel: 0861 637 735 | Fax: 013 656 4629
western caPe
5th floor, catnia Building Bella Rosa Office
development, Bella Rosa Road, Bellville
PO BOX 2383, Bellville, 7535
Tel: 0861 637 732 | Fax: 021 914 8131
eastern caPe
Pickering Park Office suites, 14-20 Pickering
street, newton Park, Port Elizabeth
Tel: 0861 637 734 | Fax: 041 363 0144
Free state
46 second avenue, Westdene, Bloemfontein
Tel: 0861 637 733 | Fax: 051 447 8873
kwazulu natal
149 Essenwood, 149 stephen dlamini Road,
Musgrave, durban.
Tel: 0861 637 736 | Fax: 031 201 8732
www.merseta.org.za