Embed Size (px)
Citation preview
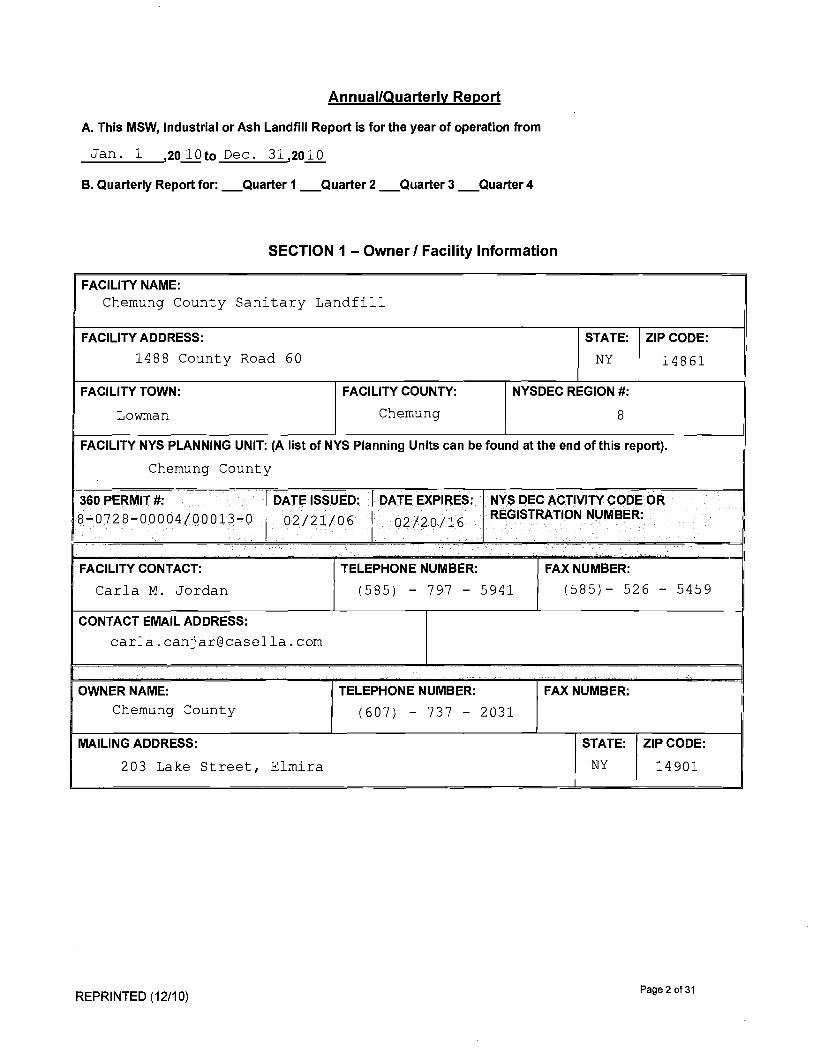
Annual/Quarterly Report
A. This MSW, Industrial or Ash Landfill Report is for the year of operation from
Jan. 1 ,20 10 to Dec. 31 ,2010
B. Quarterly Report for: _Quarter 1 _Quarter 2 _Quarter 3 _Quarter 4
SECTION 1 — Owner / Facility Information
FACILITY NAME: Chemung County Sanitary Landfill
FACILITY ADDRESS:
1488 County Road 60 STATE:
NY ZIP CODE:
14861
FACILITY TOWN:
Lowman
FACILITY COUNTY:
Chemung
NYSDEC REGION #:
8
FACILITY NYS PLANNING UNIT: (A list of NYS Planning Units can be found at the end of this report).
Chemung County
360 PERMIT #: 8 - 0728 - 00004/00013 - 0
DATE ISSUED:
02/21/06 DATE EXPIRES:
02/20/16 NYS DEC ACTIVITY CODE OR
REGISTRATION NUMBER:
FACILITY CONTACT:
Carla M. Jordan TELEPHONE NUMBER:
(585) - 797 - 5941 FAX NUMBER:
(585) - 526 - 5459
CONTACT EMAIL ADDRESS:
carla . canjar@casella . com
I OWNER NAME:
Chemung County TELEPHONE NUMBER:
(607) - 737 - 2031 FAX NUMBER:
MAILING ADDRESS:
203 Lake Street, Elmira
STATE:
NY ZIP CODE:
14901
REPRINTED (1 2/1 0) Page 2 of 31
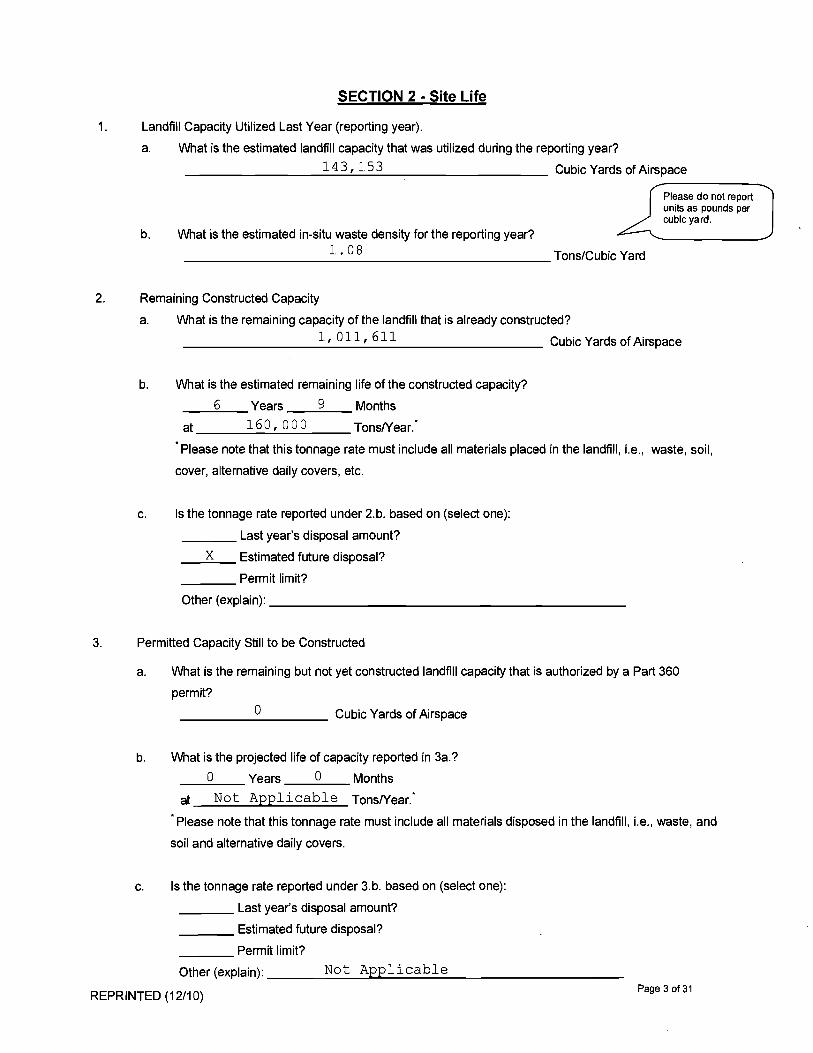
SECTION 2 - Site Life
1. Landfill Capacity Utilized Last Year (reporting year).
a. What is the estimated landfill capacity that was utilized during the reporting year? 143,153 Cubic Yards of Airspace
Please do not report units as pounds per cubic yard.
b. What is the estimated in-situ waste density for the reporting year? 1.08 Tons/Cubic Yard
2. Remaining Constructed Capacity
a. What is the remaining capacity of the landfill that is already constructed? 1,011,611 Cubic Yards of Airspace
b. What is the estimated remaining life of the constructed capacity? 6 Years 9 Months
at 160,000 Tons/Year. *
* Please note that this tonnage rate must include all materials placed in the landfill, i.e., waste, soil,
cover, alternative daily covers, etc.
c. Is the tonnage rate reported under 2.b. based on (select one):
Last year's disposal amount? X Estimated future disposal?
Permit limit?
Other (explain):
3. Permitted Capacity Still to be Constructed
a. What is the remaining but not yet constructed landfill capacity that is authorized by a Part 360
permit? 0 Cubic Yards of Airspace
b. What is'the projected life of capacity reported in 3a.? 0 Years 0 Months
at Not Applicable Tons/Year. *
Please note that this tonnage rate must include all materials disposed in the landfill, i.e., waste, and
soil and alternative daily covers.
c. Is the tonnage rate reported under 3.b. based on (select one):
Last year's disposal amount?
Estimated future disposal?
Permit limit?
Other (explain): Not Applicable
REPRINTED (12/10) Page 3 of 31
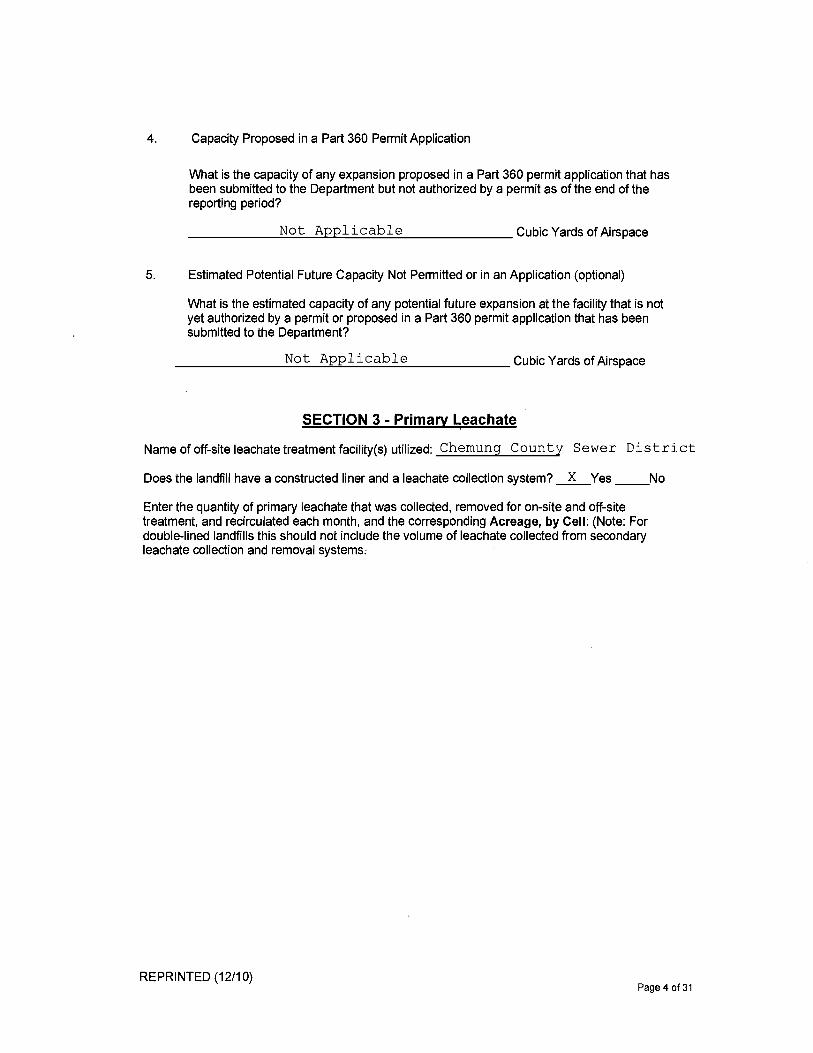
4. Capacity Proposed in a Part 360 Permit Application
What is the capacity of any expansion proposed in a Part 360 permit application that has been submitted to the Department but not authorized by a permit as of the end of the reporting period?
Not Applicable Cubic Yards of Airspace
5. Estimated Potential Future Capacity Not Permitted or in an Application (optional)
What is the estimated capacity of any potential future expansion at the facility that is not yet authorized by a permit or proposed in a Part 360 permit application that has been submitted to the Department?
Not Applicable Cubic Yards of Airspace
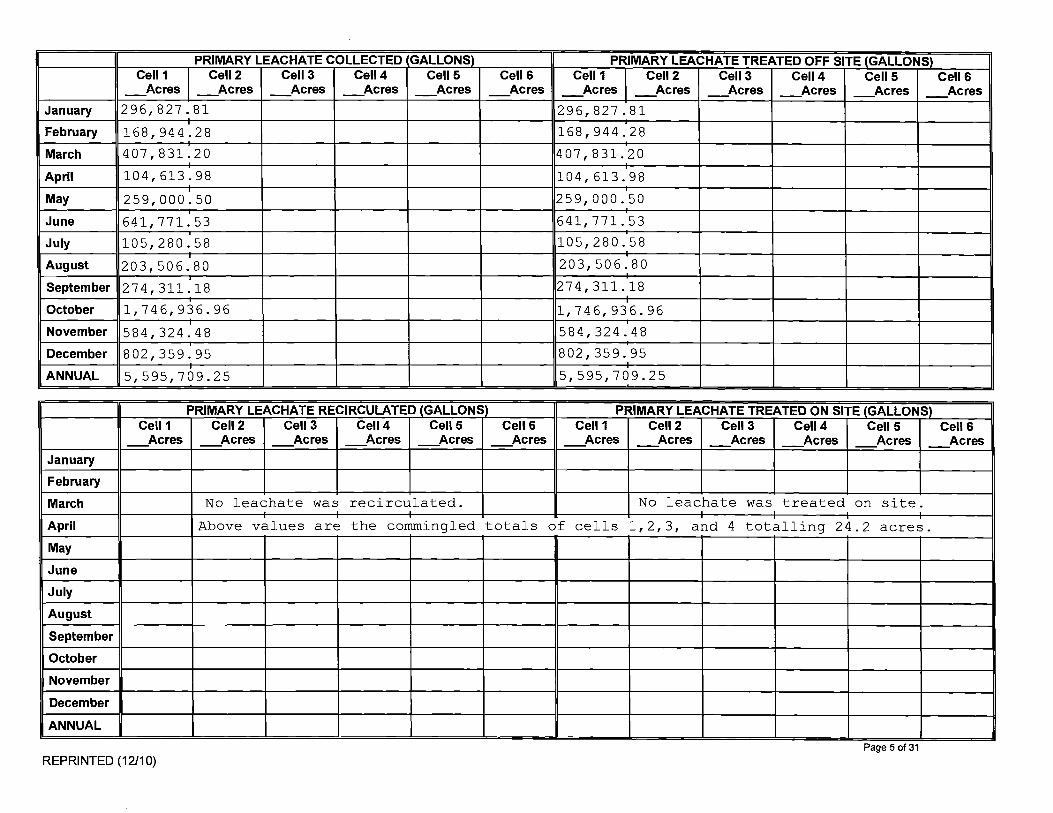
SECTION 3 - Primary Leachate
Name of off-site leachate treatment facility(s) utilized: Chemunq County Sewer District
Does the landfill have a constructed liner and a leachate collection system? X Yes No
Enter the quantity of primary leachate that was collected, removed for on-site and off-site treatment, and recirculated each month, and the corresponding Acreage, by Cell: (Note: For double-lined landfills this should not include the volume of leachate collected from secondary leachate collection and removal systems:
REPRINTED (12/10) Page 4 of 31
Cell 1 Acres
PRIMARY LEACHATE Cell 2
Acres Cell 3
Acres
COLLECTED Cell 4
Acres
(GALLONS) Cell 5
Acres Cell 6
Acres Cell 1
Acres
PRIMARY Cell 2
Acres
LEACHATE TREATED Cell 3
Acres
OFF SITE Cell 4
Acres
(GALLONS) Cell 5
Acres Cell 6
Acres
January 296,827.81 1
296,827.81
February 168,944.28 168,944.28 I
March 407,831.20 407,831.20
April 104,613.98 1
104,613.1 98
I May 259,000.50 259,000.50
641,771.1 53 June 641,771.53
July 105,280.58 1
105,280.58 1
August 203,506.80 203,506.80
September 274,311.18 1
274,311. 118
1 October 1,746,936.96 1,746,936.96
November 584,324.48 584,324.48
December 802,359.95 1
802,359.95 1
ANNUAL 5,595,709.25 5,595,709.25
Cell 1 Acres
PRIMARY Cell 2
Acres
LEACHATE Cell 3
Acres
RECIRCULATED Cell 4
Acres
(GALLONS) Cell 5
Acres Cell 6
Acres Cell 1
Acres
PRIMARY Cell 2
Acres
LEACHATE Cell 3
Acres
TREATED ON SITE Cell 4
Acres
(GALLONS) Cell 5
Acres Cell 6
Acres
January
February
March No leachate was recirculated. I I I 1
No leachate was treated on site
April Above values are the commingled totals of cells 1,2,3, and 4 totalling 24.2 acres.
May
June
July
August
September
October
November
December
ANNUAL
Page 5 of 31 REPRINTED (12/10)

Submit (attached to this form) a copy of the maintenance logs which document compliance with the Operation and Maintenance Manual's schedule for the routine annual flushing and inspection of the primary leachate collection and removal system. List required submissions that have been attached to this form or the reason for not attaching a required piece of information:
The above referenced information is included in Attachment A of this report.
Submit (attached to this form) a tabulated compilation of the semi-annual primary leachate quality data collected throughout the year including a summary comparing this year's data with the previous year's data and a summary discussion of results. This list should identify sample location(s) and method of analysis. List required submissions that have been attached to this form or the reason for not attaching a required piece of information:
The above referenced information is included in the Quarterly
Environmental Monitoring Reports, prepared by On-site Technical Services,
submitted to the State under separate cover.
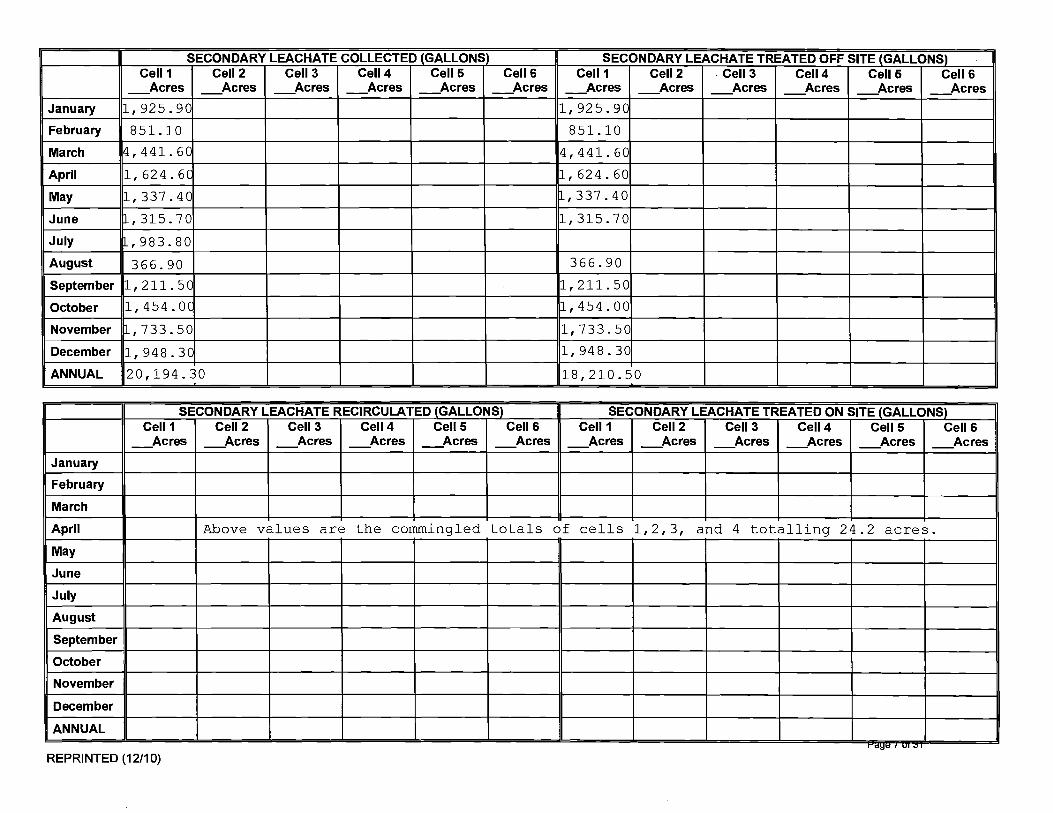
SECTION 4 - Secondary Leachate
Does landfill have a double liner system with a secondary leachate collection and removal system? X Yes No
Submit (attached to this form) a tabulated compilation of the semi-annual secondary leachate quality data collected throughout the year including a summary comparing this year's data with all previous years' data and a summary discussion of results. This list should identify sample location(s) and methods of analysis. List required submissions that have been attached to this form or the reason for not attaching a required piece of information:
The above referenced information is included in the Quarterly
Environmental Monitoring Reports, prepared by On-site Technical Services,
submitted to the State under separate cover.
Please report total cost for the year, not cost/gal.
Leachate Cost: (including transportation if appropriate) during the calendar year for leachate treatment: $ 56, 139 . 20
Total quantity treated: gal 5,613,919.75
Enter the quantity of secondary leachate that was collected, removed for on-site and off-site treatment, and recirculated each month, and the corresponding Acreage, by Cell:
REPRINTED (12/10) Page 6 of 31
SECONDARY LEACHATE COLLECTED (GALLONS) SECONDARY LEACHATE TREATED OFF SITE (GALLONS) Cell 5
Acres Cell 6
Acres Cell 1
Acres Cell 2
Acres Cell 3
Acres Cell 4
Acres Cell 5
Acres Cell 6
Acres Cell 1
Acres Cell 2
Acres Cell 3
Acres Cell 4
Acres
January 1,925.90 1,925.90 February 851.10 851.10
March 4,441.60 4,441.60
April 1,624.61 1,624.60
May 1,337.40 1,337.40
June 1,315.70 1,315.70
July 1,983.80 August 366.90 366.90
September 1,211.50 1,211.50
October 1,454.01 1,454.00
November 1,733.50 1,733.50
December 1,948.30 1,948.30
ANNUAL 20,194.30 18,210.50
SECONDARY LEACHATE RECIRCULATED (GALLONS) SECONDARY LEACHATE TREATED ON SITE (GALLONS) Cell 1
Acres Cell 2
Acres Cell 3
Acres Cell 4
Acres Cell 5
Acres Cell 6
Acres Cell 1
Acres Cell 2
Acres Cell 3
Acres Cell 4
Acres Cell 5
Acres Cell 6
Acres
January
February
March
April Above values are the commingled totals of cells 1,2,3, and 4 totalling 24.2 acres.
May
June
July
August
September
October
November
December
ANNUAL
REPRINTED (1 2/1 0)
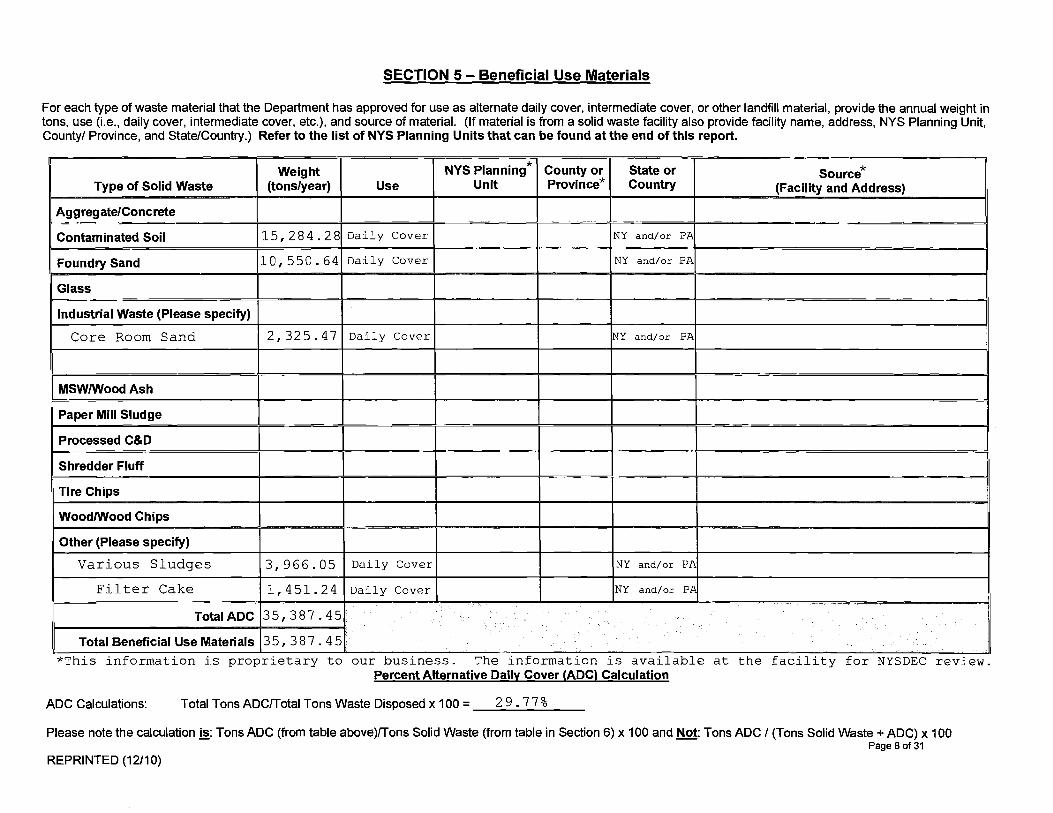
SECTION 5 — Beneficial Use Materials
For each type of waste material that the Department has approved for use as alternate daily cover, intermediate cover, or other landfill material, provide the annual weight in tons, use (i.e., daily cover, intermediate cover, etc.), and source of material. (If material is from a solid waste facility also provide facility name, address, NYS Planning Unit, County/ Province, and State/Country.) Refer to the list of NYS Planning Units that can be found at the end of this report.
Type of Solid Waste Weight
(tons/year) Use NYS Planning*
Unit County or Province*
State or Country
Source* (Facility and Address)
Aggregate/Concrete
Contaminated Soil 15,284.28 Daily Cover NY and/or PA
Foundry Sand 10,550.64 Daily Cover NY and/or PA
Glass
Industrial Waste (Please specify)
Core Room Sand 2,325.47 Daily Cover NY and/or PA
MSW/Wood Ash
Paper Mill Sludge
Processed C&D
Shredder Fluff
Tire Chips
Wood/Wood Chips
Other (Please specify)
Various Sludges 3,966.05 Daily Cover NY and/or PA
Filter Cake 1,451.24 Daily Cover NY and/or PA,
Total ADC 35,387.45
Total Beneficial Use Materials 35,387.45
*This information is proprietary to our business. The information is available at the facility for NYSDEC review. Percent Alternative Daily Cover (ADC) Calculation
ADC Calculations: Total Tons ADC/Total Tons Waste Disposed x 100 = 29.77%
Please note the calculation is: Tons ADC (from table above)/Tons Solid Waste (from table in Section 6) x 100 and Not: Tons ADC / (Tons Solid Waste + ADC) x 100 Page 8 of 31
REPRINTED (12/10)

SECTION 6 - Quantity of Solid Waste Disposed
A. Quantity Disposed by Month/Year
Provide the tonnages of solid waste disposed. Exclude Beneficial Use Material amounts reported in Section 5 and Materials Recovered amounts reported in Section 7. Specify the methods used to measure the quantities disposed and the percentages measured by each method:
10 0 % Scale Weight
% Truck Count
% Estimated
% Other (Specify:
Type of Solid Waste January (tons)
February (tons)
March (tons)
April (tons)
May (tons)
June (tons)
July (tons)
Asbestos
Ash (Coal)
Ash (MSW Energy Recovery)
Construction & Demolition Debris (mixed)
1.69 0 0 0 0 0 0
Industrial Waste (Including Industrial Process Sludges)
791.36 687.77 993.92 1,022.19 1,064.12 1,061.25 955.94
Mixed Municipal Solid Waste (Residential, Institutional & Commercial)
5,210.54 4,331.38 6,072.42 4,993.02 4,749.84 5,516.60 5,246.98
Oil/Gas Drilling Waste 749.88 3,599.80 10,987.33 9,575.61 5,866.35 4,056.55 4,707.02
Petroleum Contaminated Soil
Sewage Treatment Plant Sludge
Treated Regulated Medical Waste
Other (Please specify)
Total Tons Disposed 6,753.47 8,618.95 18,053.67 15,590.82 11,680.31 10,634.40 10,909.94
REPRINTED (12/10) Page 9 of 31
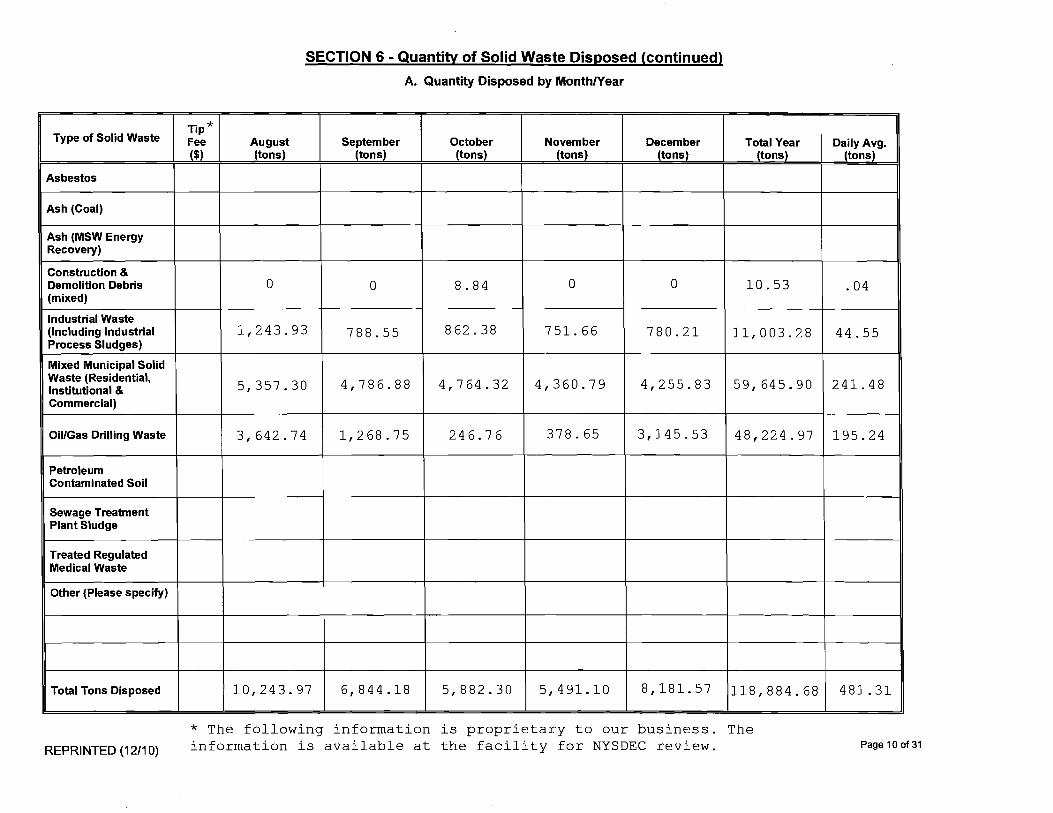
SECTION 6 - Quantity of Solid Waste Disposed (continued)
A. Quantity Disposed by Month/Year
Type of Solid Waste Tip Fee ($)
August (tons)
September (tons)
October (tons)
November (tons)
December (tons)
Total Year (tons)
Daily Avg. (tons)
Asbestos
Ash (Coal)
Ash (MSW Energy Recovery)
Construction & Demolition Debris (mixed)
0 0 8.84 0 0 10.53 .04
Industrial Waste (Including Industrial Process Sludges)
1,243.93 788.55 862.38 751.66 780.21 11,003.28 44.55
Mixed Municipal Solid Waste (Residential, Institutional & Commercial)
5,357.30 4,786.88 4,764.32 4,360.79 4,255.83 59,645.90 241.48
OiMas Drilling Waste 3,642.74 1,268.75 246.76 378.65 3,145.53 48,224.97 195.24
Petroleum Contaminated Soil
Sewage Treatment Plant Sludge
Treated Regulated Medical Waste
Other (Please specify)
Total Tons Disposed 10,243.97 6,844.18 5,882.30 5,491.10 8,181.57 118,884.68 481.31
* The following information is proprietary to our business. The
REPRINTED (1 2/1 0) information is available at the facility for NYSDEC review. Page 10 of 31
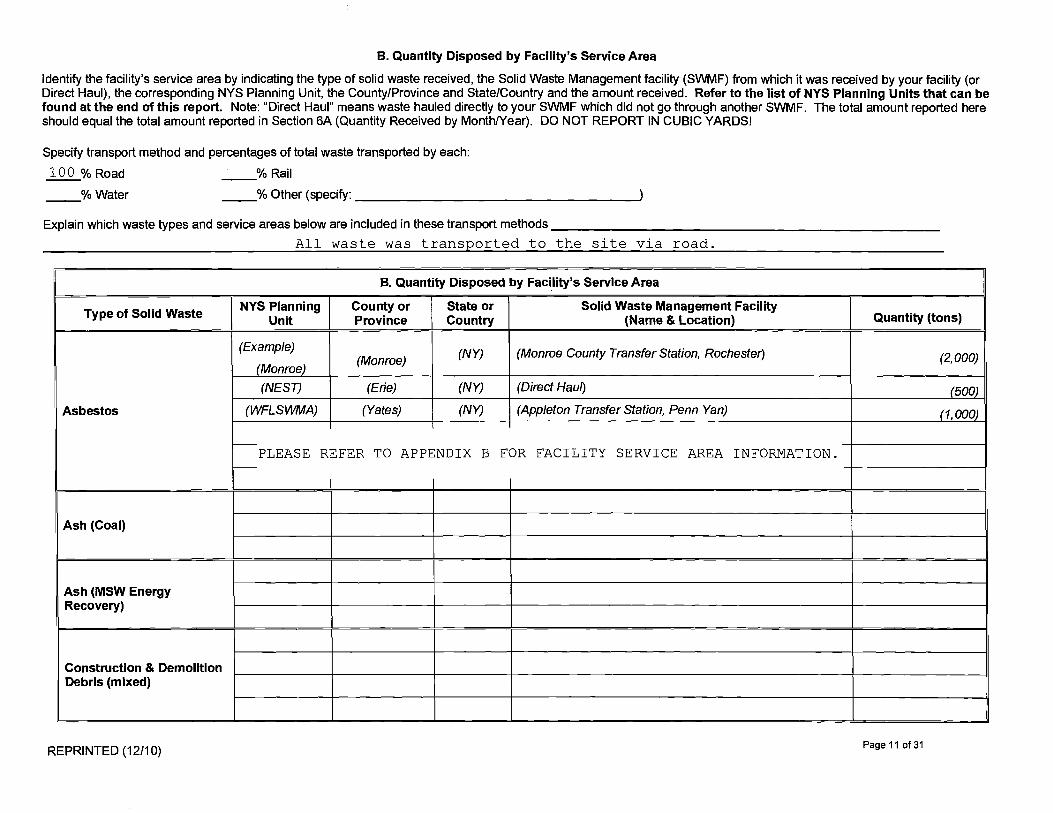
B. Quantity Disposed by Facility's Service Area
Identify the facility's service area by indicating the type of solid waste received, the Solid Waste Management facility (SWMF) from which it was received by your facility (or Direct Haul), the corresponding NYS Planning Unit, the County/Province and State/Country and the amount received. Refer to the list of NYS Planning Units that can be found at the end of this report. Note: "Direct Haul" means waste hauled directly to your SWMF which did not go through another SWMF. The total amount reported here should equal the total amount reported in Section 6A (Quantity Received by Month/Year). DO NOT REPORT IN CUBIC YARDS!
Specify transport method and percentages of total waste transported by each: 10 0 % Road
% Water
% Rail
% Other (specify:
Explain which waste types and service areas below are included in these transport methods All waste was transported to the site via road.
B. Quantity Disposed by Facility's Service Area
Type of Solid Waste NYS Planning Unit
County or Province
State or Country
Solid Waste Management Facility (Name & Location) Quantity (tons)
Asbestos
(Example)
(Monroe) (Monroe)
(NY) (Monroe County Transfer Station, Rochester) (2,000)
(NEST) (Erie) (NY) (Direct Haul) (500)
(WFLSWMA) (Yates) (NY) (Appleton Transfer Station, Penn Yan) (1,000)
TO APPENDIX B FOR PLEASE REFER FACILITY SERVICE AREA INFORMATION.
Ash (Coal)
Ash (MSW Energy Recovery)
Construction & Demolition Debris (mixed)
REPRINTED (12/10) Page 11 of 31
B. Quantity Disposed by Facility's Service Area
Type of Solid Waste NYS Planning Unit
County or Province
State or Country
Solid Waste Management Facility (Name & Location) Quantity (tons)
Industrial Waste (Including Industrial Process Sludges)
Mixed Municipal Solid Waste (Residential, Institutional & Commercial)
Oil/Gas Drilling Waste
Petroleum Contaminated Soil
Sewage Treatment Plant Sludge
Treated Regulated Medical Waste (TRMW)*
Other (Please specify)
Total Tons Disposed
* List generators that provide you Certificates of Treatment forms and quantities of TRMW from each
REPRINTED (12/10) Page 12 of 31
SECTION 7 - RECYCLABLES & RECOVERED MATERIALS A. Quantity of Recyclable Material Received by Facility's Service Area
Identify the facility's service area by indicating the type of recyclable material received, the Solid Waste Management facility (SWMF) from which it was received by your facility (or Direct Haul), the corresponding NYS Planning Unit, and the County/Province and State/Country from which waste was received. Refer to the list of NYS Planning Units that can be found at the end of this report. Note: "Direct Haul" means waste hauled directly to your SWMF which did not go through another SWMF. DO NOT REPORT IN CUBIC YARDS!
Specify transport method and percentages of total waste transported by each:
% Road % Rail % Water
% Other (specify:
Explain which waste types and service areas below are included in these transport methods
RECYCLABLE MATERIAL
NYS PLANNING
UNIT
COUNTY OR PROVINCE
STATE OR COUNTRY
SOLID WASTE MANAGEMENT FACILITY FROM WHICH IT WAS RECEIVED (Name & Address)
TONS RECYCLED
SERVICE AREA: ,
Brush, Branches, Trees, & Stumps
Comingled Containers (metal, glass, mastic) None This section is not applicable for this facility. -
Comingled Paper (all grades)
Electronics
Food Scraps
Leaves & Grass
Single Stream (total)
Other (specify)
TOTAL RECIEVED (tons):
REPRINTED (12/10) Page 13 of 31

B. Quantity of Recyclable Material Recovered
TONS RECYCLED: (Report only in tons. A list of conversion factors is included at the end of this Section) DESTINATION: (Indicate facilities where recyclables were shipped. Be specific as possible. "Recycled" is NOT a destination) PLANNING UNIT: (Refer to the list of NYS Planning Units that can be found at the end of this report.)
Specify transport method and percentages of total waste transported by each:
% Road % Rail Water c/0 Other (specify:
Explain which waste types and service areas below are included in these transport methods
RECYCLABLE MATERIAL
NYS PLANNING UNIT
COUNTY OR PROVINCE
STATE OR COUNTRY
DESTINATION FACILITY (Name & Address)
TONS RECYCLED (out of facility)
PAPER:
Corrugated Cardboard
Junk Mail
Magazines
Newspaper
Office Paper
Paperboard / Boxboard
Other Paper (specify)
TOTAL PAPER RECYCLED (tons):
PAPER RESIDUE (tons): DISPOSAL DESTINATION:
REPRINTED (12/10) Page 14 of 31
B. Quantity of Recyclable Material Recovered (continued)
RECYCLABLE MATERIAL
NYS PLANNING UNIT
COUNTY OR PROVINCE
STATE OR COUNTRY
DESTINATION FACILITY (Name & Address)
TONS RECYCLED (out of facility)
GLASS: '
Container Glass
Industrial Scrap Glass
Non — Container Glass (e.g. windows, vases)
TOTAL GLASS RECYCLED (tons):
GLASS RESIDUE (tons): DISPOSAL DESTINATION:
METAL:
Aluminum Foil I Trays
Bulk Metal
Enameled Appliances / White Goods
Industrial Scrap Metal
Tin & Aluminum Containers
Other Metal (specify)
TOTAL METAL RECYCLED (tons):
METAL RESIDUE (tons): DISPOSAL DESTINATION:,
REPRINTED (12/10) Page 15 of 31
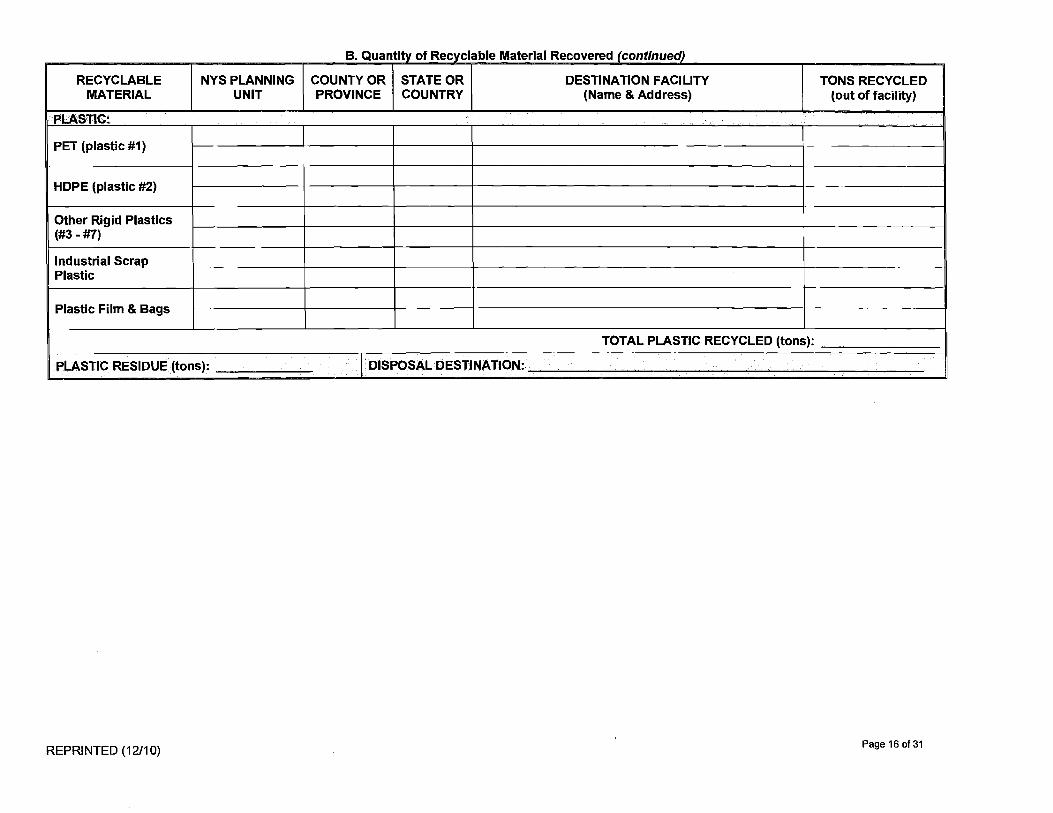
B. Quantity of Recyclable Material Recovered continued
RECYCLABLE MATERIAL
NYS PLANNING UNIT
COUNTY OR PROVINCE
STATE OR COUNTRY
DESTINATION FACILITY (Name & Address)
TONS RECYCLED (out of facility)
PLASTIC:
PET (plastic #1)
HDPE (plastic #2)
Other Rigid Plastics (#3 - #7)
Industrial Scrap Plastic
Plastic Film & Bags
TOTAL PLASTIC RECYCLED (tons):
PLASTIC RESIDUE (tons): DISPOSAL DESTINATION:
REPRINTED (1 2/1 0) Page 16 of 31
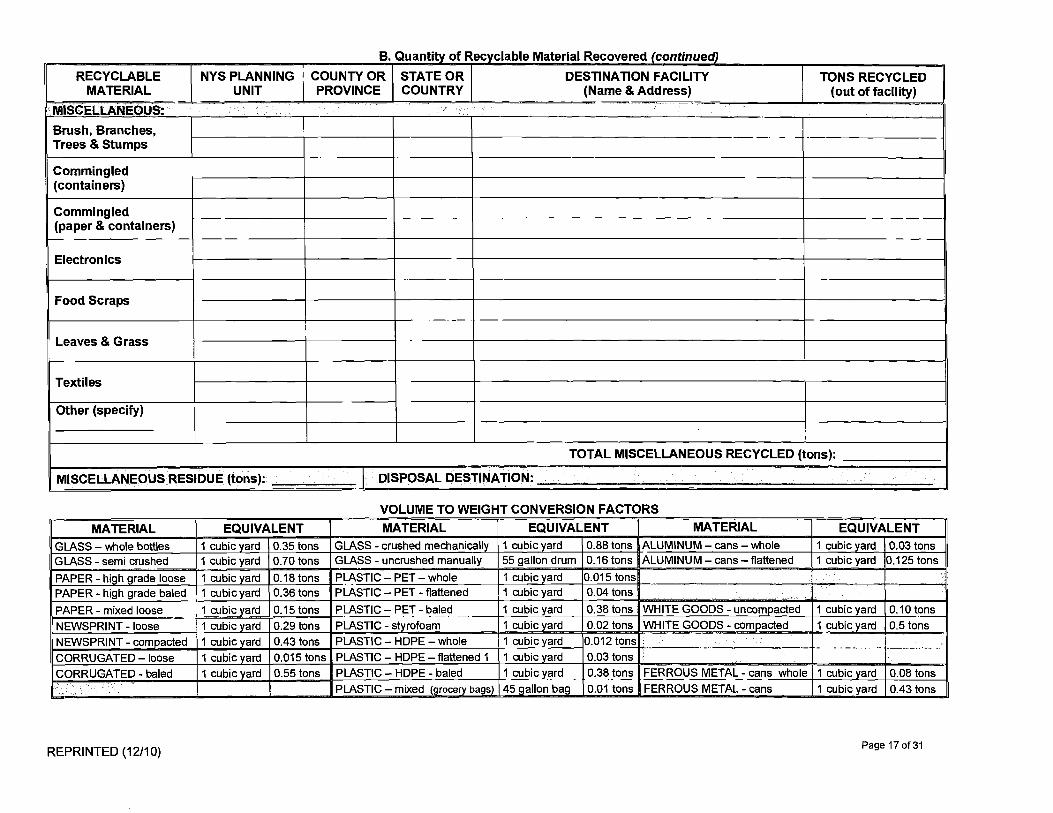
B. Quantity of Recyclable Material Recovered (continued
RECYCLABLE MATERIAL
NYS PLANNING UNIT
COUNTY OR I PROVINCE
STATE OR I COUNTRY
DESTINATION FACILITY (Name & Address)
TONS RECYCLED (out of facility)
' MISCELLANEOUS:
Brush, Branches, Trees & Stumps
Commingled (containers)
Commingled (paper & containers)
Electronics
Food Scraps
Leaves & Grass
Textiles
Other (specify)
TOTAL MISCELLANEOUS RECYCLED (tons):
MISCELLANEOUS RESIDUE (tons): DISPOSAL DESTINATION:
VOLUME TO WEIGHT CONVERSION FACTORS
MATERIAL EQUIVALENT MATERIAL EQUIVALENT MATERIAL EQUIVALENT GLASS — whole bottles 1 cubic yard 0.35 tons GLASS - crushed mechanically 1 cubic yard 0.88 tons ALUMINUM — cans — whole 1 cubic yard 0.03 tons GLASS - semi crushed 1 cubic yard 0.70 tons GLASS - uncrushed manually 55 gallon drum 0.16 tons ALUMINUM — cans — flattened 1 cubic yard 0.125 tons PAPER - hi•h • rade loose 1 cubic ard 0.18 tons PLASTIC — PET — whole 1 cubic ard 0.015 tons PAPER - high grade baled 1 cubic yard 0.36 tons PLASTIC — PET - flattened 1 cubic yard 0.04 tons PAPER - mixed loose 1 cubic yard
1 cubic yard 0.15 tons 0.29 tons
PLASTIC — PET - baled PLASTIC - styrofoam
1 cubic yard 1 cubic yard
0.38 tons 0.02 tons .
WHITE GOODS - uncompacted WHITE GOODS - compacted_
1 cubic yard cubic ar_ c_____
0.10 tons 0.5 tons NEWSPRINT - loose
NEWSPRINT - compacted 1 cubic yard 0.43 tons PLASTIC—HDPE—whole 1 cubic yard 1 cubic yard
0.012 tons 0.03 tons CORRUGATED — loose 1 cubic yard 0.015 tons PLASTIC — HDPE — flattened 1
CORRUGATED - baled 1 cubic yard 0.55 tons PLASTIC — HDPE - baled 1 cubic yard 0.38 tons FERROUS METAL - cans whole 1 cubic yard 0.08 tons PLASTIC — mixed (grocery bags) 45 gallon bag 0.01 tons FERROUS METAL - cans 1 cubic yard 0.43 tons
REPRINTED (12/10) Page 17 of 31
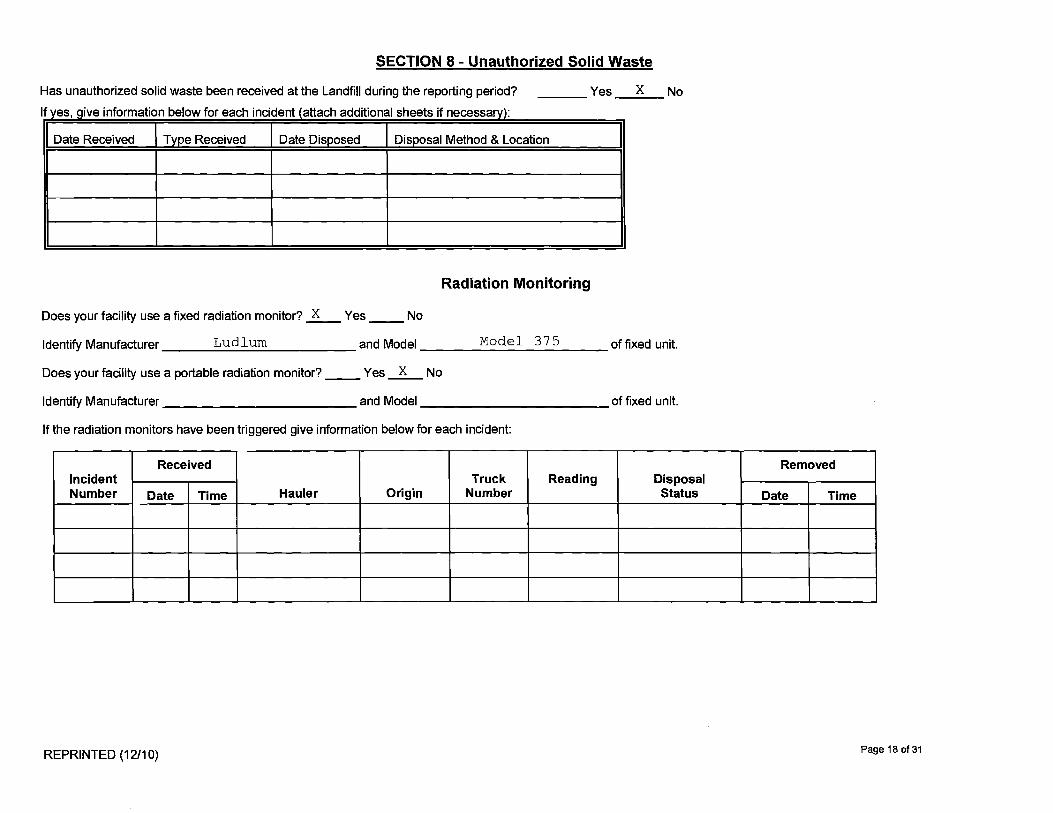
SECTION 8 - Unauthorized Solid Waste
Has unauthorized solid waste been received at the Landfill during the reporting period?
If yes, give information below for each incident (attach additional sheets if necessary):
Yes X No
Date Received Type Received Date Disposed Disposal Method & Location
Radiation Monitoring
Does your facility use a fixed radiation monitor? X Yes No
Identify Manufacturer Ludlum and Model Model 37 5 of fixed unit.
Does your facility use a portable radiation monitor? Yes X No
Identify Manufacturer and Model of fixed unit.
If the radiation monitors have been triggered give information below for each incident:
Incident Number
Received
Hauler Origin Truck
Number Reading Disposal
Status
Removed
Date Time Date Time
REPRINTED (12/10) Page 18 of 31
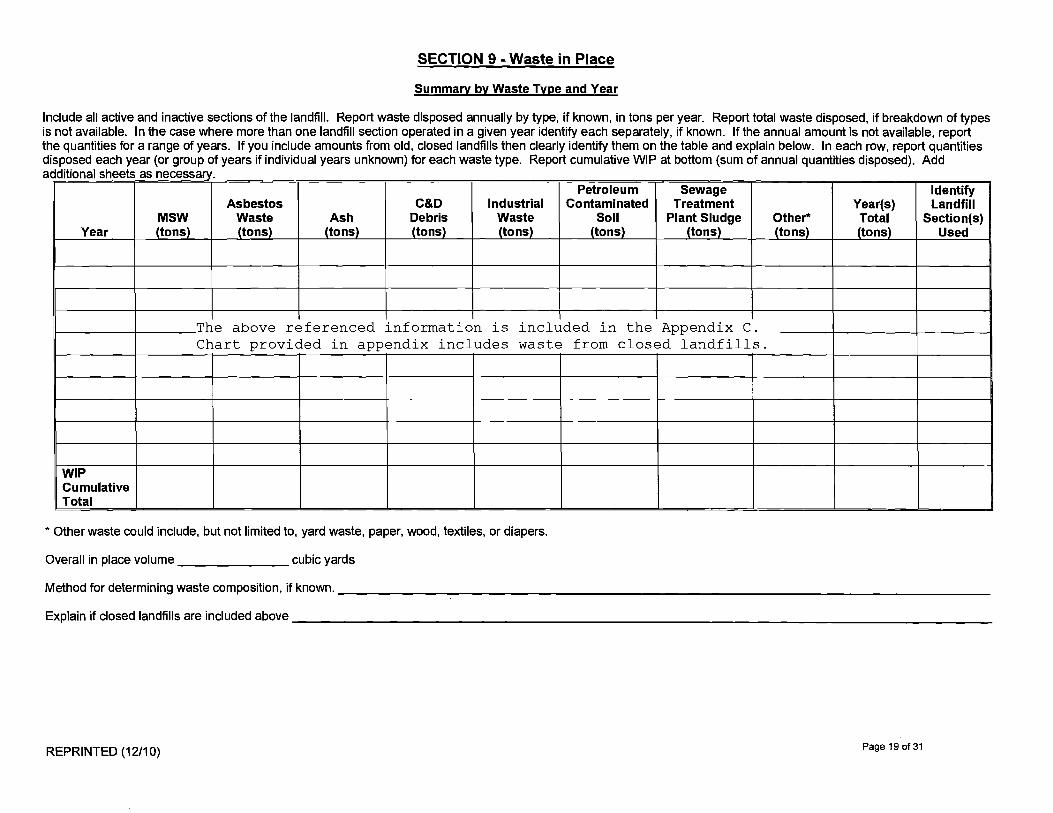
SECTION 9 - Waste in Place
Summary by Waste Type and Year
Include all active and inactive sections of the landfill. Report waste disposed annually by type, if known, in tons per year. Report total waste disposed, if breakdown of types is not available. In the case where more than one landfill section operated in a given year identify each separately, if known. If the annual amount is not available, report the quantities for a range of years. If you include amounts from old, closed landfills then clearly identify them on the table and explain below. In each row, report quantities disposed each year (or group of years if individual years unknown) for each waste type. Report cumulative WIP at bottom (sum of annual quantities disposed). Add additional sheets as necessary.
Year MSW (tons)
Asbestos Waste (tons)
Ash (tons)
C&D Debris (tons)
Industrial Waste (tons)
Petroleum Contaminated
Soil (tons)
Sewage Treatment
Plant Sludge (tons)
Other (tons)
Year(s) Total (tons)
Identify Landfill
Section(s) Used
The provided Chart
above referenced in appendix
information includes
is included waste
in the from closed
Appendix C. landfills.
WIP Cumulative Total
* Other waste could include, but not limited to, yard waste, paper, wood, textiles, or diapers.
Overall in place volume
cubic yards
Method for determining waste composition, if known.
Explain if closed landfills are included above
REPRINTED (12/10) Page 19 of 31
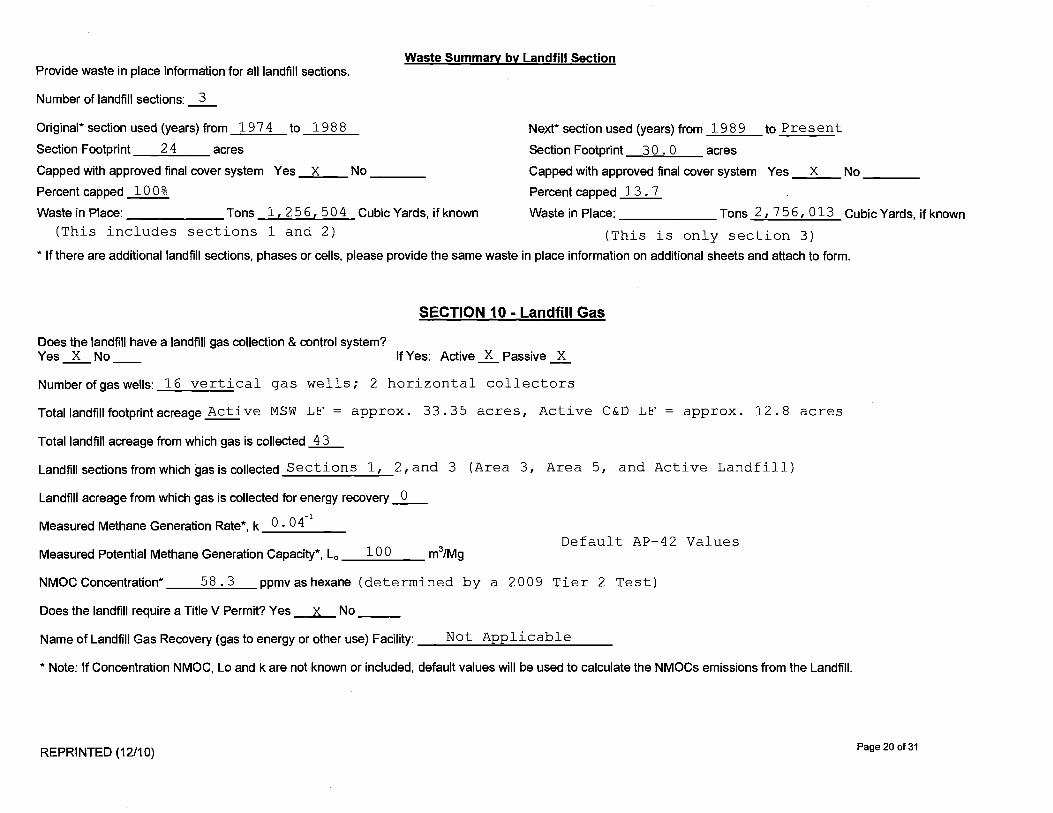
Waste Summary by Landfill Section Provide waste in place information for all landfill sections.
Number of landfill sections: 3
Original* section used (years) from 1974 to 1988
Section Footprint 24 acres
Capped with approved final cover system Yes X No Percent capped 100%
Waste in Place: Tons 1, 256,504 Cubic Yards, if known (This includes sections 1 and 2)
Next* section used (years) from 1989 to Present
Section Footprint 30.0 acres Capped with approved final cover system Yes X No Percent capped 13.7
Waste in Place: Tons 2,756,013 Cubic Yards, if known
(This is only section 3)
* If there are additional landfill sections, phases or cells, please provide the same waste in place information on additional sheets and attach to form.
SECTION 10 - Landfill Gas
Does the landfill have a landfill gas collection & control system? Yes X No If Yes: Active X Passive X
Number of gas wells: 16 vertical gas wells; 2 horizontal collectors
Total landfill footprint acreage Active MSW LF = approx. 33.35 acres, Active C&D LF = approx. 12.8 acres
Total landfill acreage from which gas is collected 43
Landfill sections from which gas is collected Se ctions 1, 2, and 3 (Area 3, Area 5, and Active Landfill)
Landfill acreage from which gas is collected for energy recovery 0
Measured Methane Generation Rate*, k 0. 0
Measured Potential Methane Generation Capacity*, L. 100 m3/Mg Default AP-42 Values
NMOC Concentration* 58.3 ppmv as hexane (determined by a 2009 Tier 2 Test)
Does the landfill require a Title V Permit? Yes x No
Name of Landfill Gas Recovery (gas to energy or other use) Facility: Not Applicable
* Note: If Concentration NMOC, Lo and k are not known or included, default values will be used to calculate the NMOCs emissions from the Landfill.
REPRINTED (12/10) Page 20 of 31
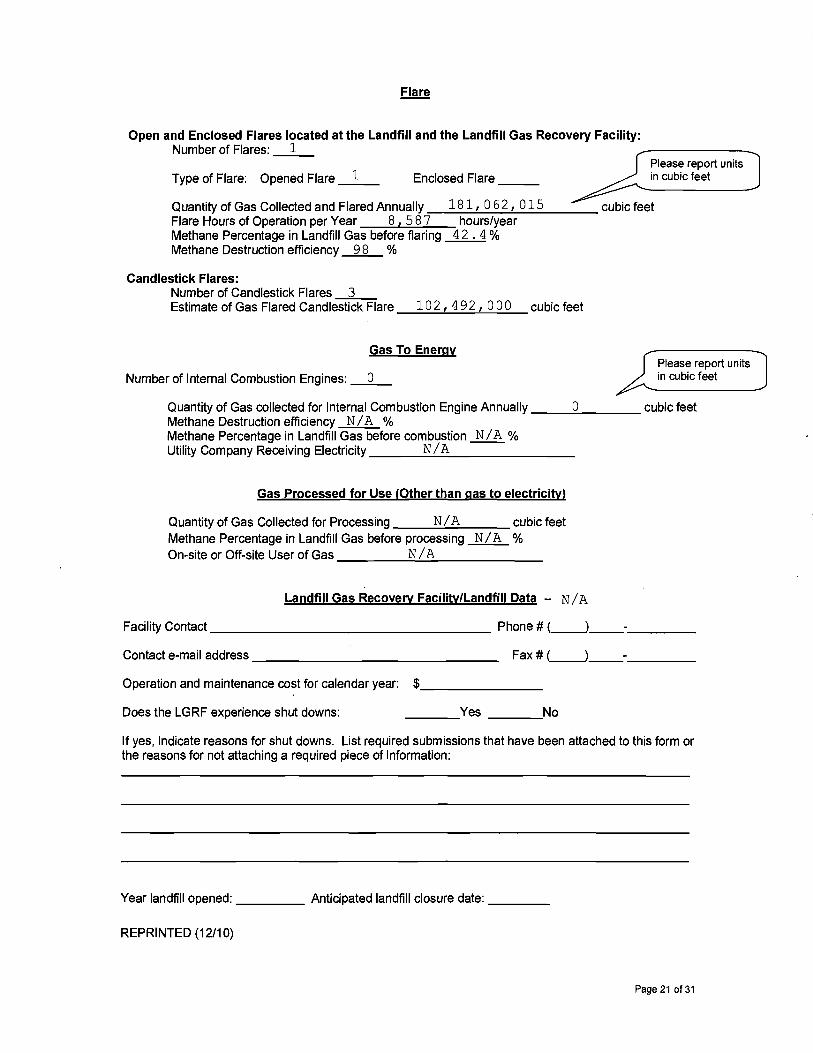
Flare
Open and Enclosed Flares located at the Landfill and the Landfill Gas Recovery Facility: Number of Flares: 1
Please report units Type of Flare: Opened Flare 1 Enclosed Flare in cubic feet
Quantity of Gas Collected and Flared Annually 181,062,015 Flare Hours of Operation per Year 8,587 hours/year Methane Percentage in Landfill Gas before flaring 42.4% Methane Destruction efficiency 98 %
cubic feet
Candlestick Flares: Number of Candlestick Flares 3 Estimate of Gas Flared Candlestick Flare
102,492,000 cubic feet
Gas To Energy Please report units
Number of Internal Combustion Engines: 0 in cubic feet
Quantity of Gas collected for Internal Combustion Engine Annually 0 cubic feet Methane Destruction efficiency N/A % Methane Percentage in Landfill Gas before combustion N/A % Utility Company Receiving Electricity N/A
Gas Processed for Use (Other than gas to electricity)
Quantity of Gas Collected for Processing N/A cubic feet Methane Percentage in Landfill Gas before processing N/A ')/0 On-site or Off-site User of Gas N/A
Landfill Gas Recovery Facility/Landfill Data — N/A
Facility Contact Phone # ( ) -
Contact e-mail address Fax # ( ) -
Operation and maintenance cost for calendar year: $
Does the LGRF experience shut downs: Yes No
If yes, indicate reasons for shut downs. List required submissions that have been attached to this form or the reasons for not attaching a required piece of information:
Year landfill opened: Anticipated landfill closure date:
REPRINTED (12/10)
Page 21 of 31
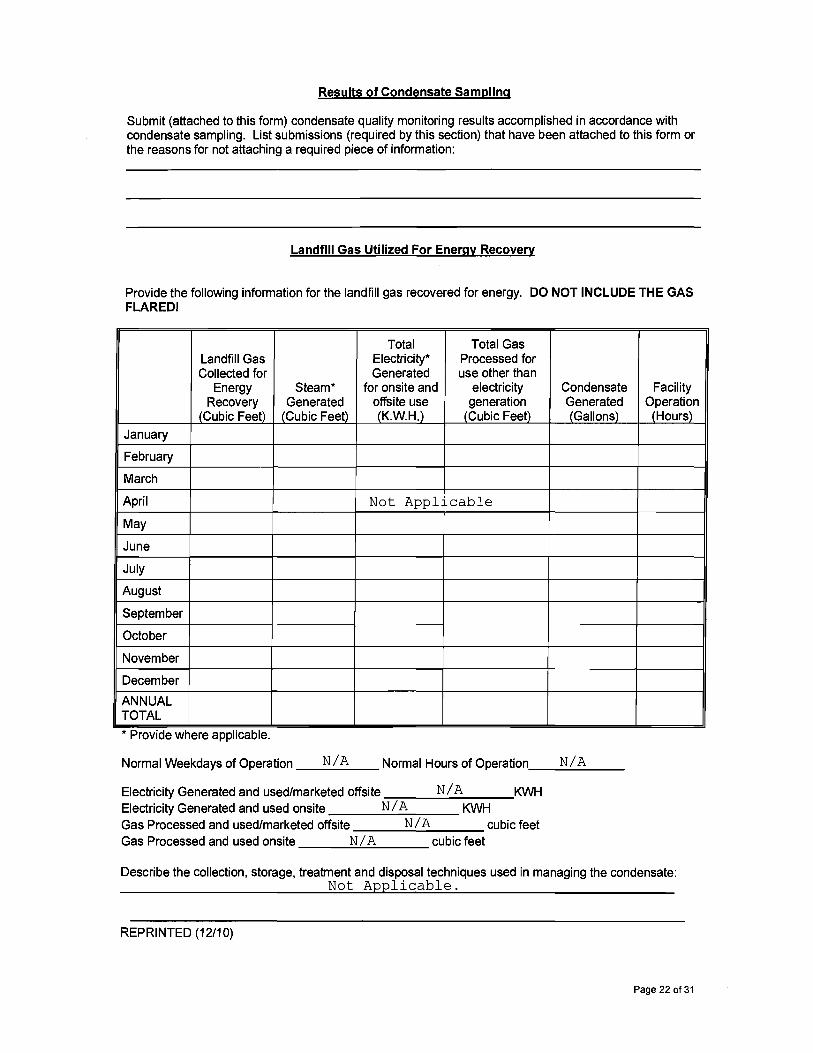
Results of Condensate Sampling
Submit (attached to this form) condensate quality monitoring results accomplished in accordance with condensate sampling. List submissions (required by this section) that have been attached to this form or the reasons for not attaching a required piece of information:
Landfill Gas Utilized For Energy Recovery
Provide the following information for the landfill gas recovered for energy. DO NOT INCLUDE THE GAS FLARED!
Landfill Gas Collected for
Energy Recovery
(Cubic Feet)
Steam* Generated
(Cubic Feet)
Total Electricity* Generated
for onsite and offsite use (K.W.H.)
Total Gas Processed for use other than
electricity generation
(Cubic Feet)
Condensate Generated (Gallons)
Facility Operation (Hours)
January
February
March
April Not Applicable
May
June
July
August
September
October
November
December
ANNUAL TOTAL
* Provide where applicable.
Normal Weekdays of Operation N/A Normal Hours of Operation N/A
Electricity Generated and used/marketed offsite N/A KWH Electricity Generated and used onsite N/A KWH Gas Processed and used/marketed offsite N/A cubic feet Gas Processed and used onsite N/A cubic feet
Describe the collection, storage, treatment and disposal techniques used in managing the condensate: Not Applicable.
REPRINTED (12/10)
Page 22 of 31
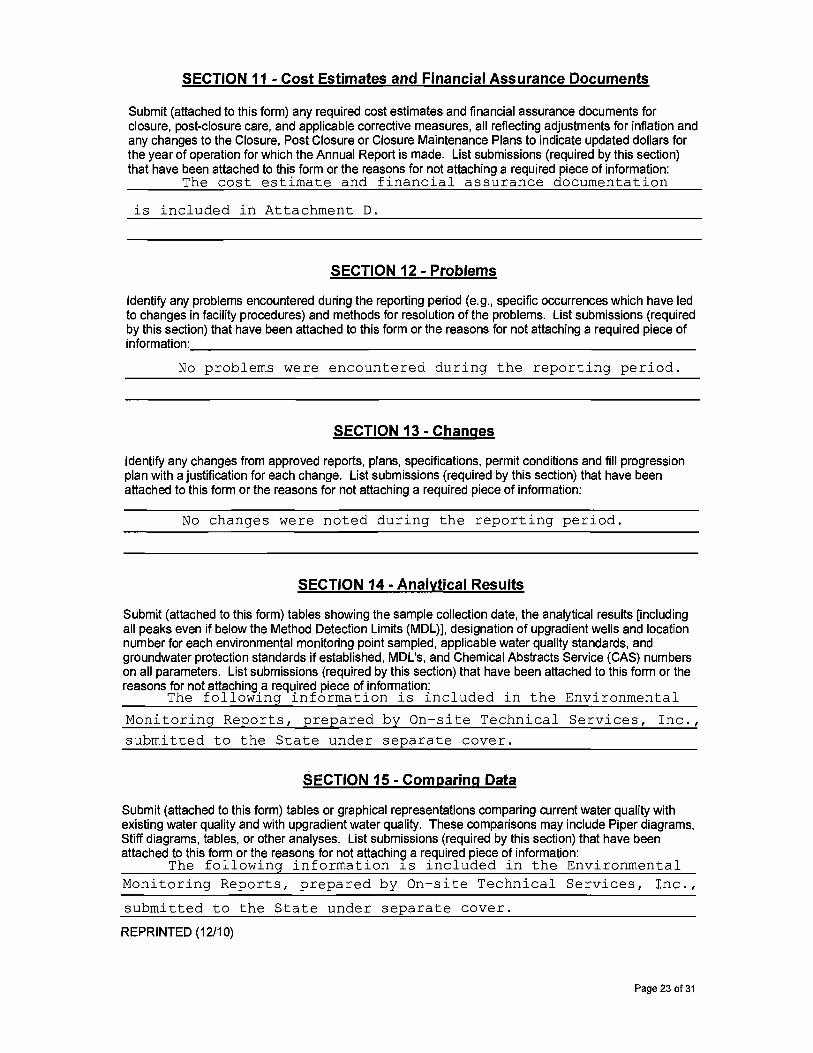
SECTION 11 - Cost Estimates and Financial Assurance Documents
Submit (attached to this form) any required cost estimates and financial assurance documents for closure, post-closure care, and applicable corrective measures, all reflecting adjustments for inflation and any changes to the Closure, Post Closure or Closure Maintenance Plans to indicate updated dollars for the year of operation for which the Annual Report is made. List submissions (required by this section) that have been attached to this form or the reasons for not attaching a required piece of information:
The cost estimate and financial assurance documentation
is included in Attachment D.
SECTION 12 - Problems
Identify any problems encountered during the reporting period (e.g., specific occurrences which have led to changes in facility procedures) and methods for resolution of the problems. List submissions (required by this section) that have been attached to this form or the reasons for not attaching a required piece of information:
No problems were encountered during the reporting period.
SECTION 13 - Changes
Identify any changes from approved reports, plans, specifications, permit conditions and fill progression plan with a justification for each change. List submissions (required by this section) that have been attached to this form or the reasons for not attaching a required piece of information:
No changes were noted during the reporting period.
SECTION 14 - Analytical Results
Submit (attached to this form) tables showing the sample collection date, the analytical results [including all peaks even if below the Method Detection Limits (MDL)], designation of upgradient wells and location number for each environmental monitoring point sampled, applicable water quality standards, and groundwater protection standards if established, MDL's, and Chemical Abstracts Service (CAS) numbers on all parameters. List submissions (required by this section) that have been attached to this form or the reasons for not attaching a required piece of information:
The following information is included in the Environmental
Monitoring Reports, prepared by On-site Technical Services, Inc.,
submitted to the State under separate cover.
SECTION 15 - Comparing Data
Submit (attached to this form) tables or graphical representations comparing current water quality with existing water quality and with upgradient water quality. These comparisons may include Piper diagrams, Stiff diagrams, tables, or other analyses. List submissions (required by this section) that have been attached to this form or the reasons for not attaching a required piece of information:
The following information is included in the Environmental Monitoring Reports, prepared by On-site Technical Services, Inc.,
submitted to the State under separate cover.
REPRINTED (12/10)
Page 23 of 31
SECTION 16 - Discussion of Results
Submit (attached to this form) a summary of any contraventions of State water quality standards, significant increases in concentrations above existing water quality, any exceedances of groundwater protection standards, and discussion of results, and any proposed modifications to the sampling and analysis schedule necessary to meet the Existing, Operational and Contingency water quality monitoring requirements. List submissions (required by this section) that have been attached to this form or the reasons for not attaching a, requiredpiece of information:
The following information is included in the Environmental
Monitoring Reports, prepared by On-site Technical Services, Inc.,
submitted to the State under separate cover.
SECTION 17 - Data Quality Assessment
Submit (attached to this form) any required data quality assessment reports. List submissions (required by this section) that have been attached to this form or the reasons for not attaching a required piece of information:
The following information is included in the Environmental
Monitoring Reports, prepared by On-site Technical Services, Inc.,
submitted to the State under separate cover.
SECTION 18 - Summaries of Monitoring Data
Submit (attached to this form) a summary of the water quality information presented in Sections 15 and 16 for the year of operation for which the Annual Report is made, noting any changes in water quality which have occurred throughout the year. List submissions (required by this section) that have been attached to this form or the reasons for not attaching a required piece of information:
The following information is included in the Environmental
Monitoring Reports, prepared by On-site Technical Services, Inc.,
submitted to the State under separate cover.
SECTION 19 - Surface Impoundments
Does this landfill have a surface impoundment? X Yes No
If yes, there are separate water quality reporting requirements for surface impoundments. Namely, for each surface impoundment, repeat Sections 14 through 17 above for Quarterly Reports and Section 18 above for Annual Reports. List submissions (required by this section) that have been attached to this form or the reasons for not attaching a required piece of information:
The following information is included in the Environmental
Monitoring Reports, prepared by On-site Technical Services, Inc.,
submitted to the State under separate cover.
REPRINTED (12/10)
Page 24 of 31
(
141 I) Date
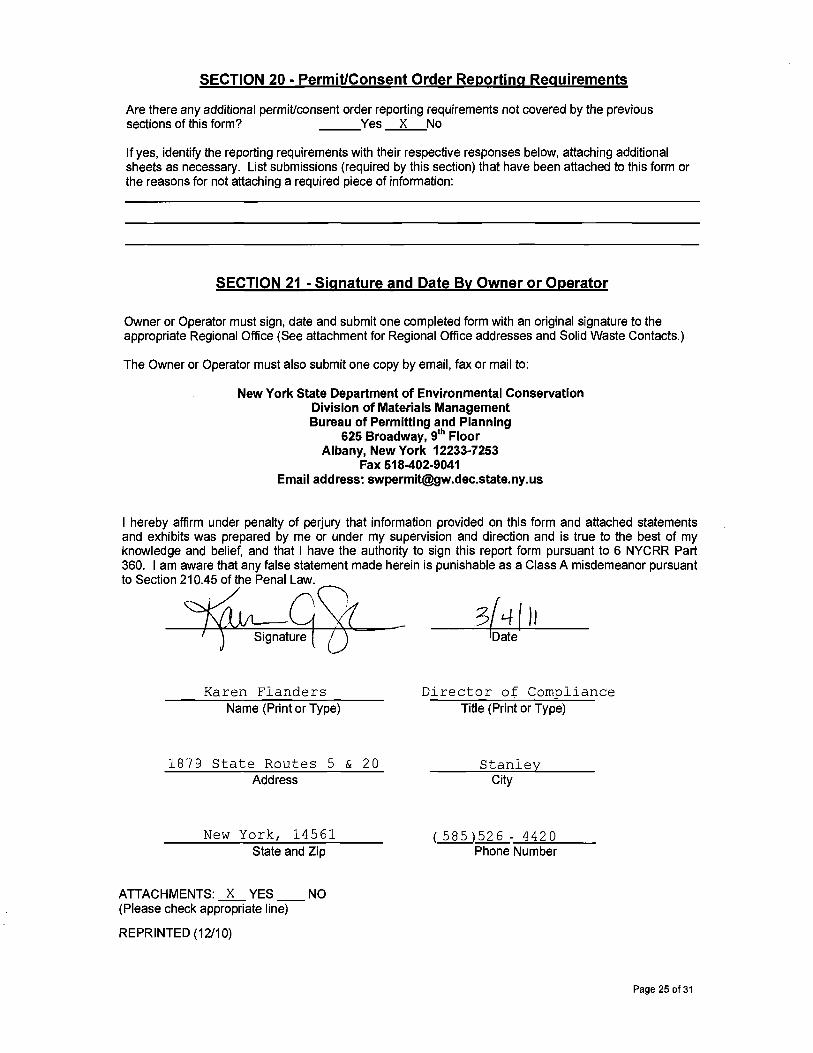
SECTION 20 - Permit/Consent Order Reporting Requirements
Are there any additional permit/consent order reporting requirements not covered by the previous sections of this form? Yes X No
If yes, identify the reporting requirements with their respective responses below, attaching additional sheets as necessary. List submissions (required by this section) that have been attached to this form or the reasons for not attaching a required piece of information:
SECTION 21 - Signature and Date By Owner or Operator
Owner or Operator must sign, date and submit one completed form with an original signature to the appropriate Regional Office (See attachment for Regional Office addresses and Solid Waste Contacts.)
The Owner or Operator must also submit one copy by email, fax or mail to:
New York State Department of Environmental Conservation Division of Materials Management Bureau of Permitting and Planning
625 Broadway, 9 th Floor Albany, New York 12233-7253
Fax 518-402-9041 Email address: [email protected]
I hereby affirm under penalty of perjury that information provided on this form and attached statements and exhibits was prepared by me or under my supervision and direction and is true to the best of my knowledge and belief, and that I have the authority to sign this report form pursuant to 6 NYCRR Part 360. I am aware that any false statement made herein is punishable as a Class A misdemeanor pursuant to Section 210.45 of the Penal Law.
Karen Flanders Director of Compliance
Name (Print or Type) Title (Print or Type)
1879 State Routes 5 & 20 Address
Stanley City
New York, 14561 ( 585)526 - 4420
State and Zip Phone Number
ATTACHMENTS: X YES NO (Please check appropriate line)
REPRINTED (12/10)
Page 25 of 31
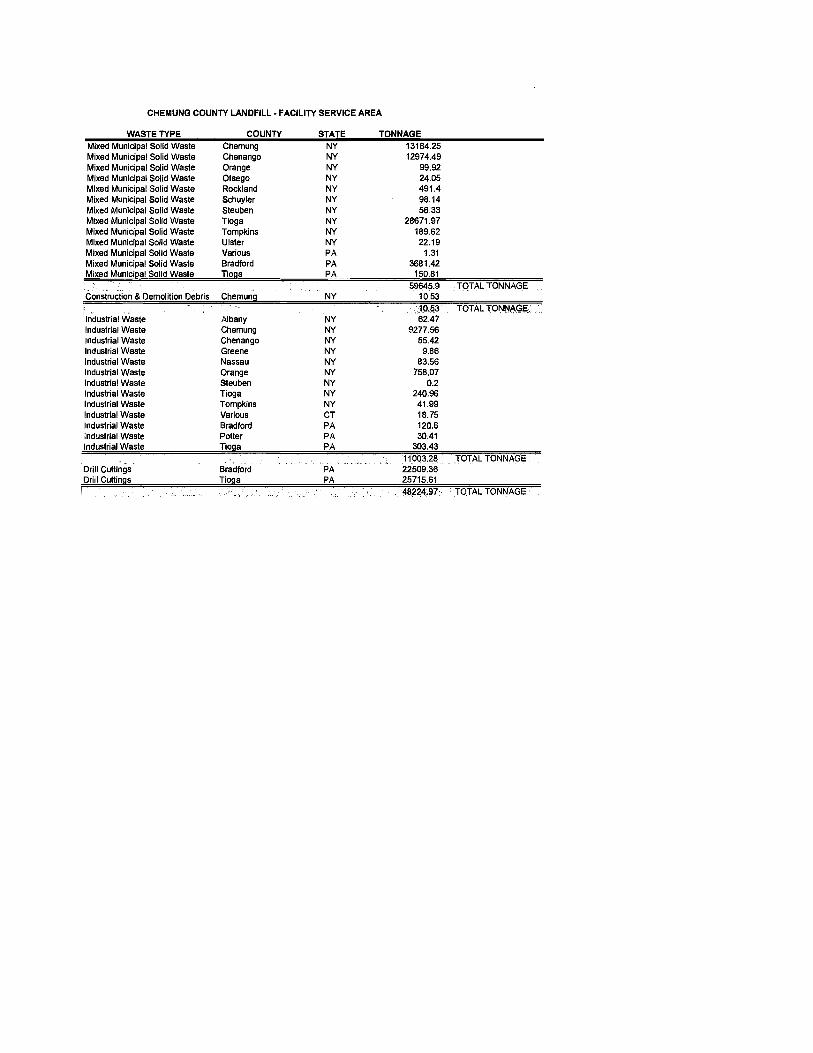
CHEMUNG COUNTY LANDFILL - FACILITY SERVICE AREA
WASTE TYPE COUNTY STATE TONNAGE Mixed Municipal Solid Waste Chemung NY 13184.25 Mixed Municipal Solid Waste Chenango NY 12974.49 Mixed Municipal Solid Waste Orange NY 99.92 Mixed Municipal Solid Waste Otsego NY 24.05 Mixed Municipal Solid Waste Rockland NY 491.4 Mixed Municipal Solid Waste Schuyler NY 98.14 Mixed Municipal Solid Waste Steuben NY 56.33 Mixed Municipal Solid Waste Tioga NY 28671.97 Mixed Municipal Solid Waste Tompkins NY 189.62 Mixed Municipal Solid Waste Ulster NY 22.19 Mixed Municipal Solid Waste Various PA 1.31 Mixed Municipal Solid Waste Bradford PA 3681.42 Mixed Municipal Solid Waste Tioga PA 150.81
59645.9 TOTAL TONNAGE Construction & Demolition Debris Chemung NY 10.53
_10.53 TOTAL TONNAGE ;
Industrial Waste Albany NY 62.47 Industrial Waste Chemung NY 9277.56 Industrial Waste Chenango NY 55.42 Industrial Waste Greene NY 9.86 Industrial Waste Nassau NY 83.56 Industrial Waste Orange NY 758.07 Industrial Waste Steuben NY 0.2 Industrial Waste Tioga NY 240.96 Industrial Waste Tompkins NY 41.99 Industrial Waste Various CT 18.75 Industrial Waste Bradford PA 120.6 Industrial Waste Potter PA 30.41 Industrial Waste Tioga PA 303.43
. _ 11003.28 TOTAL TONNAGE Drill Cuttings Bradford PA 22509.36 Drill Cuttings Tioga PA 25715.61
48.24.9.72,-: TOTAL TONNAGE
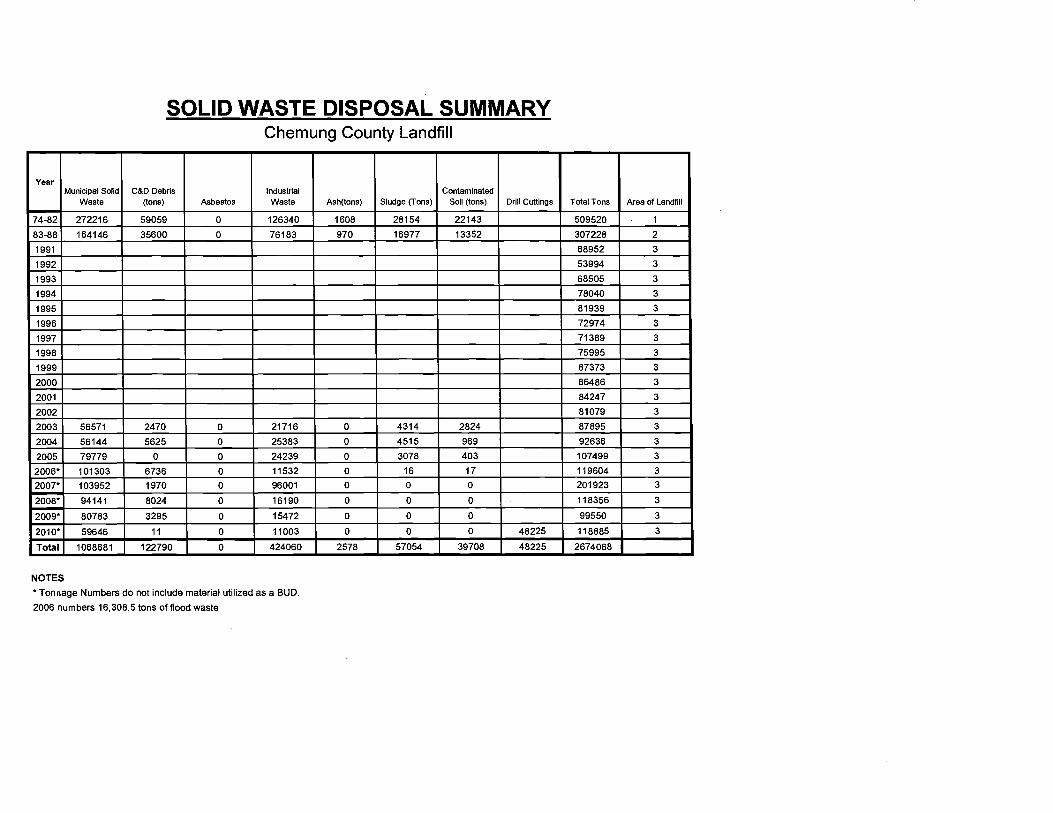
SOLID WASTE DISPOSAL SUMMARY Chemung County Landfill
Year Municipal Solid
Waste C&D Debris
(tons) Asbestos Industrial Waste Ash(tons) Sludge (Tons)
Contaminated Soil (tons) Drill Cuttings Total Tons Area of Landfill
74-82 272216 59059 0 126340 1608 28154 22143 509520 1 83-88 164146 35600 0 76183 970 16977 13352 307228 2 1991 68952 3 1992 53994 3 1993 68505 3 1994 78040 3 1995 81939 3 1996 72974 3 1997 71389 3 1998 75995 3 1999 87373 3 2000 86486 3 2001 84247 3 2002 81079 3 2003 56571 2470 0 21716 0 4314 2824 87895 3 2004 56144 5625 0 25383 0 4515 969 92636 3
2005 79779 0 0 24239 0 3078 403 107499 3
2006* 101303 6736 0 11532 0 16 17 119604 3 2007* 103952 1970 0 96001 0 0 0 201923 3
2008* 94141 8024 0 16190 0 0 0 118356 3
2009* 80783 3295 0 15472 0 0 0 99550 3
2010* 59646 11 0 11003 0 0 0 48225 118885 3
Total 1068681 122790 0 424060 2578 57054 39708 48225 2674068
NOTES
*Tonnage Numbers do not include material utilized as a BUD. 2006 numbers 16,308.5 tons of flood waste