Embed Size (px)
Citation preview
PRESS RELEASE__________________________________________
Mellanox Technologies, Ltd.
Press/Media Contact
Allyson Scott
McGrath/Power Public Relations and Communications
+1-408-727-0351
Investor Contact
Mellanox Technologies
+1-408-916-0012
Israel PR Contact
Sharon Levin
Gelbart Kahana Investor Relations
+972-3-6070567
Mellanox Achieves Record Quarterly and Annual Revenue
Annual revenue growth of 41.9 percent to $658 million
Annual Non-GAAP net income grew 2.4X to $138 million
Record annual revenues in InfiniBand and Ethernet products
SUNNYVALE, Calif. and YOKNEAM, ISRAEL — Jan. 27, 2016 — Mellanox® Technologies, Ltd.
(NASDAQ: MLNX) today announced financial results for its fourth quarter and fiscal year ended
December 31, 2015.
“We are pleased to achieve record quarterly and annual revenues. Our profitability grew 2.4 times year-
over-year with operating income representing 21.3% of revenues. We are proud to grow our annual net
income to $138.5 million and generate $150.5 million in cash from operations in 2015 - while we
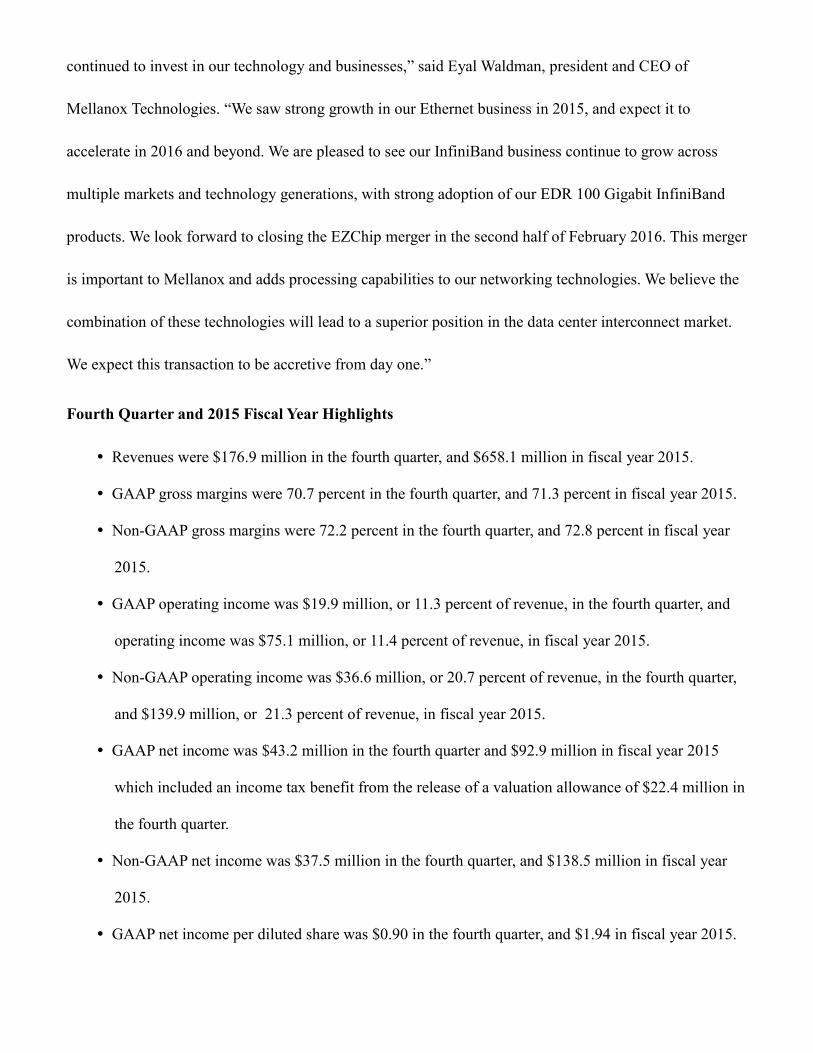
continued to invest in our technology and businesses,” said Eyal Waldman, president and CEO of
Mellanox Technologies. “We saw strong growth in our Ethernet business in 2015, and expect it to
accelerate in 2016 and beyond. We are pleased to see our InfiniBand business continue to grow across
multiple markets and technology generations, with strong adoption of our EDR 100 Gigabit InfiniBand
products. We look forward to closing the EZChip merger in the second half of February 2016. This merger
is important to Mellanox and adds processing capabilities to our networking technologies. We believe the
combination of these technologies will lead to a superior position in the data center interconnect market.
We expect this transaction to be accretive from day one.”
Fourth Quarter and 2015 Fiscal Year Highlights
Revenues were $176.9 million in the fourth quarter, and $658.1 million in fiscal year 2015.
GAAP gross margins were 70.7 percent in the fourth quarter, and 71.3 percent in fiscal year 2015.
Non-GAAP gross margins were 72.2 percent in the fourth quarter, and 72.8 percent in fiscal year
2015.
GAAP operating income was $19.9 million, or 11.3 percent of revenue, in the fourth quarter, and
operating income was $75.1 million, or 11.4 percent of revenue, in fiscal year 2015.
Non-GAAP operating income was $36.6 million, or 20.7 percent of revenue, in the fourth quarter,
and $139.9 million, or 21.3 percent of revenue, in fiscal year 2015.
GAAP net income was $43.2 million in the fourth quarter and $92.9 million in fiscal year 2015
which included an income tax benefit from the release of a valuation allowance of $22.4 million in
the fourth quarter.
Non-GAAP net income was $37.5 million in the fourth quarter, and $138.5 million in fiscal year
2015.
GAAP net income per diluted share was $0.90 in the fourth quarter, and $1.94 in fiscal year 2015.
3
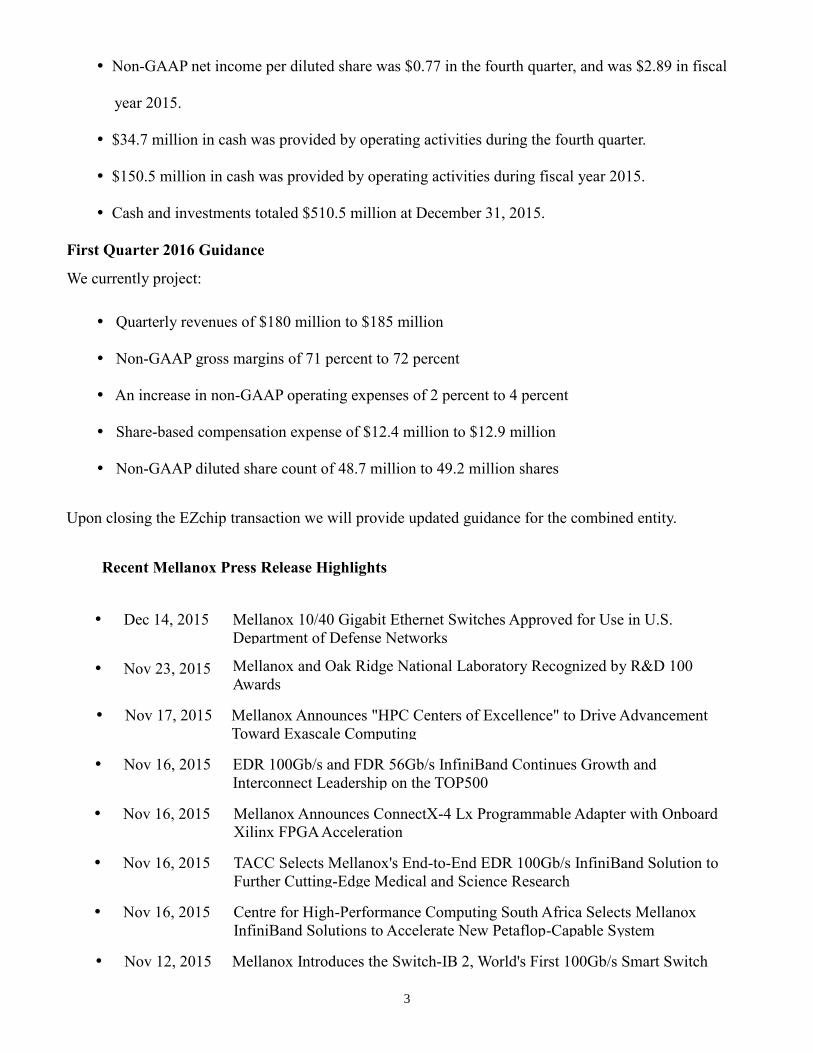
Non-GAAP net income per diluted share was $0.77 in the fourth quarter, and was $2.89 in fiscal
year 2015.
$34.7 million in cash was provided by operating activities during the fourth quarter.
$150.5 million in cash was provided by operating activities during fiscal year 2015.
Cash and investments totaled $510.5 million at December 31, 2015.
First Quarter 2016 Guidance
We currently project:
Quarterly revenues of $180 million to $185 million
Non-GAAP gross margins of 71 percent to 72 percent
An increase in non-GAAP operating expenses of 2 percent to 4 percent
Share-based compensation expense of $12.4 million to $12.9 million
Non-GAAP diluted share count of 48.7 million to 49.2 million shares
Upon closing the EZchip transaction we will provide updated guidance for the combined entity.
Recent Mellanox Press Release Highlights
Dec 14, 2015 Mellanox 10/40 Gigabit Ethernet Switches Approved for Use in U.S.
Department of Defense Networks
Nov 23, 2015 Mellanox and Oak Ridge National Laboratory Recognized by R&D 100
Awards
Nov 17, 2015 Mellanox Announces "HPC Centers of Excellence" to Drive Advancement
Toward Exascale Computing
Nov 16, 2015 EDR 100Gb/s and FDR 56Gb/s InfiniBand Continues Growth and
Interconnect Leadership on the TOP500
Nov 16, 2015 Mellanox Announces ConnectX-4 Lx Programmable Adapter with Onboard
Xilinx FPGA Acceleration
Nov 16, 2015 TACC Selects Mellanox's End-to-End EDR 100Gb/s InfiniBand Solution to
Further Cutting-Edge Medical and Science Research
Nov 16, 2015 Centre for High-Performance Computing South Africa Selects Mellanox
InfiniBand Solutions to Accelerate New Petaflop-Capable System
Nov 12, 2015 Mellanox Introduces the Switch-IB 2, World's First 100Gb/s Smart Switch

Nov 4, 2015 IBM Teams with Mellanox to Help Maximize Performance of Power Systems
LC Line Servers for Cloud and Cluster Deployments
Nov 2, 2015 Mellanox Open Ethernet Switches Accepted By Open Compute Project
Conference Call
Mellanox will hold its fourth quarter and fiscal year 2015 financial results conference call today at 2 p.m.
Pacific Time to discuss the company’s financial results. To listen to the call, dial +1-785-424-1666
approximately 10 minutes prior to the start time.
The Mellanox financial results conference call will be available via live webcast on the investor relations
section of the Mellanox website at http://ir.mellanox.com. Access the webcast 15 minutes prior to the start
of the call to download and install any necessary audio software. Replay of the webcast will also be
available on the Mellanox website.
About Mellanox
Mellanox Technologies is a leading supplier of end-to-end InfiniBand and Ethernet interconnect solutions
and services for servers and storage. Mellanox interconnect solutions increase data center efficiency by
providing the highest throughput and lowest latency, delivering data faster to applications and unlocking
system performance capability. Mellanox offers a choice of fast interconnect products: adapters, switches,
software, cables and silicon that accelerate application runtime and maximize business results for a wide
range of markets including high-performance computing, enterprise data centers, Web 2.0, cloud, storage
and financial services. More information is available at www.mellanox.com.
GAAP to Non-GAAP Reconciliation
To supplement our consolidated financial statements presented in accordance with generally accepted accounting principles
(GAAP), Mellanox uses non-GAAP measures of net income which are adjusted from results based on GAAP to exclude share-
based compensation expense, amortization expense of acquired intangible assets, acquisition related expense, settlement costs,
changes related to recognition of deferred tax valuation allowance and gains (impairment losses) on equity investments. The
company believes the non-GAAP results provide useful information to both management and investors, as these non-GAAP
results exclude expenses that are not indicative of our core operating results. Management believes it is useful to exclude share-
based compensation expense, amortization expense of acquired intangible assets, acquisition related expense, settlement costs,
changes related to recognition of deferred tax valuation allowance, and gains (impairment losses) on equity investments
because it enhances investors’ ability to understand our business from the same perspective as management, which believes that
such items are not directly attributable to nor reflect the underlying performance of the company’s business operations. Further,
management believes certain non-cash charges such as share-based compensation, amortization of acquired intangible assets
and changes related to recognition of deferred tax valuation allowance do not reflect the cash operating results of the business.
These measures should be considered in addition to results prepared in accordance with GAAP, but should not be considered a
substitute for or superior to GAAP results. These non-GAAP measures may be different than the non-GAAP measures used by
other companies. A reconciliation of GAAP to non-GAAP condensed consolidated statements of operations is also presented in
the financial statements portion of this release and is posted under the “Investor Relations” section on our website.
Safe Harbor Statement under the Private Securities Litigation Reform Act of 1995
All statements included or incorporated by reference in this release, other than statements or characterizations of historical fact,
are forward-looking statements, including the guidance for the three months ended March 31, 2016, statements related to our
expectations for achievement of continued revenue growth and record revenue for the fiscal year 2016, statements related to
trends in the market for our solutions and services, opportunities for our company in 2016 and beyond, and future product
capabilities. These forward-looking statements are based on our current expectations, estimates and projections about our
industry and business, management’s beliefs and certain assumptions made by us, all of which are subject to change.
Forward-looking statements can often be identified by words such as “projects,” “anticipates,” “expects,” “intends,” “plans,”
“predicts,” “believes,” “seeks,” “estimates,” “may,” “will,” “should,” “would,” “could,” “potential,” “continue,” “ongoing,”
similar expressions and variations or negatives of these words. These forward-looking statements are not guarantees of future
results and are subject to risks, uncertainties and assumptions that could cause our actual results to differ materially and
adversely from those expressed in any forward-looking statement.
The risks and uncertainties that could cause our results to differ materially from those expressed or implied by such forward-
looking statements include the continued expansion of our product line, customer base and the total available market of our
products, the continued growth in demand for our products, the continued, increased demand for industry standards-based
technology, our ability to react to trends and challenges in our business and the markets in which we operate, our ability to
anticipate market needs or develop new or enhanced products to meet those needs, the adoption rate of our products, our ability
to establish and maintain successful relationships with our OEM partners, our ability to effectively compete in our industry,
fluctuations in demand, sales cycles and prices for our products and services, our success converting design wins to revenue-
generating product shipments, the continued launch and volume ramp of large customer sales opportunities, and our ability to
protect our intellectual property rights. Furthermore, the majority of our quarterly revenues are derived from customer orders
received and fulfilled in the same quarterly period. We have limited visibility into actual end-user demand as such demand
impacts us and our OEM customer inventory balances in any given quarter. Consequently, this introduces risk and uncertainty
into our revenue and production forecasts and business planning and could negatively impact our financial results. In addition,
current uncertainty in the global economic environment poses a risk to the overall economy as businesses may defer purchases
in response to tighter credit conditions, changing overall demand for our products, and negative financial news. Consequently,
our results could differ materially from our prior results due to these general economic and market conditions, political events
and other risks and uncertainties described more fully in our documents filed with or furnished to the Securities and Exchange
Commission.
More information about the risks, uncertainties and assumptions that may impact our business is set forth in our Form 10-Q
filed with the SEC on October 30, 2015, and our annual report on Form 10-K filed with the SEC on March 2, 2015. All

forward-looking statements in this press release, including the guidance for the three months ended March 31, 2016, are based
on information available to us as of the date hereof, and we assume no obligation to update these forward-looking statements.
Mellanox is a registered trademark of Mellanox Technologies, Ltd. All other trademarks are property of their respective
owners.
8
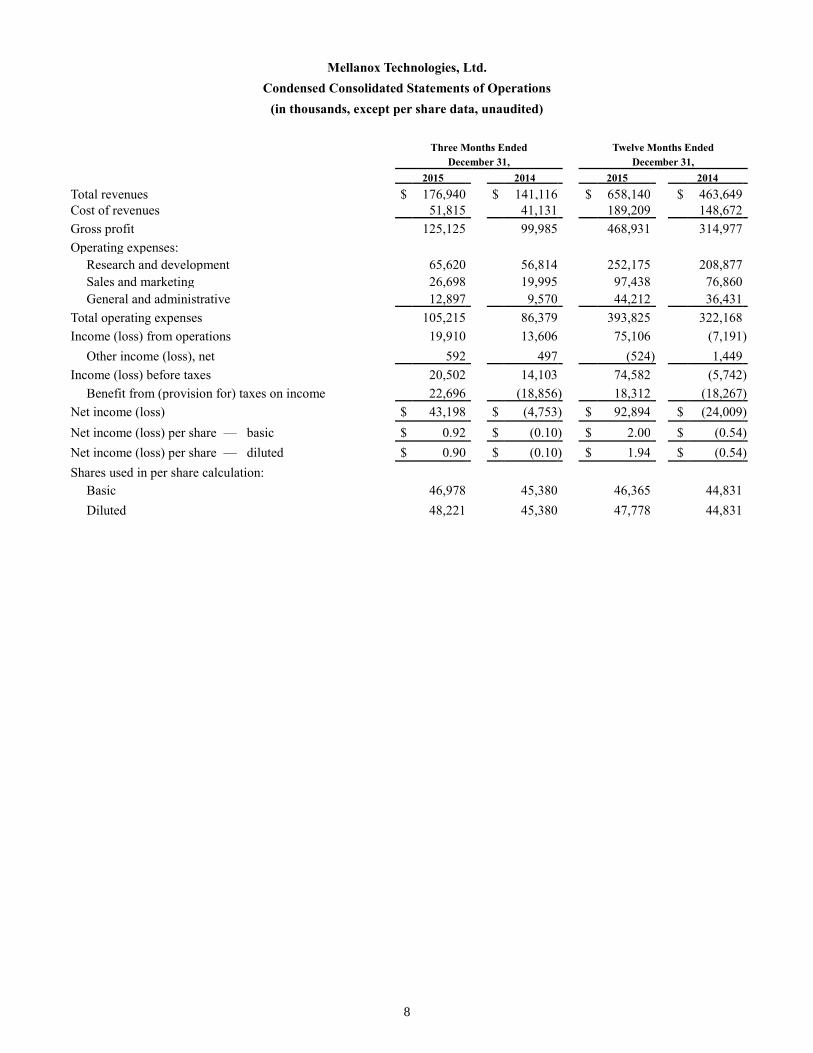
Mellanox Technologies, Ltd.
Condensed Consolidated Statements of Operations
(in thousands, except per share data, unaudited)
Three Months Ended Twelve Months Ended
December 31, December 31,
2015 2014 2015 2014
Total revenues $ 176,940 $ 141,116 $ 658,140 $ 463,649
Cost of revenues 51,815 41,131 189,209 148,672
Gross profit 125,125 99,985 468,931 314,977
Operating expenses:
Research and development 65,620 56,814 252,175 208,877
Sales and marketing 26,698 19,995 97,438 76,860
General and administrative 12,897 9,570 44,212 36,431
Total operating expenses 105,215 86,379 393,825 322,168
Income (loss) from operations 19,910 13,606 75,106 (7,191 )
Other income (loss), net 592 497 (524 ) 1,449
Income (loss) before taxes 20,502 14,103 74,582 (5,742 )
Benefit from (provision for) taxes on income 22,696 (18,856 ) 18,312 (18,267 )
Net income (loss) $ 43,198 $ (4,753 ) $ 92,894 $ (24,009 )
Net income (loss) per share — basic $ 0.92 $ (0.10 ) $ 2.00 $ (0.54 )
Net income (loss) per share — diluted $ 0.90 $ (0.10 ) $ 1.94 $ (0.54 )
Shares used in per share calculation:
Basic 46,978 45,380 46,365 44,831
Diluted 48,221 45,380 47,778 44,831
9
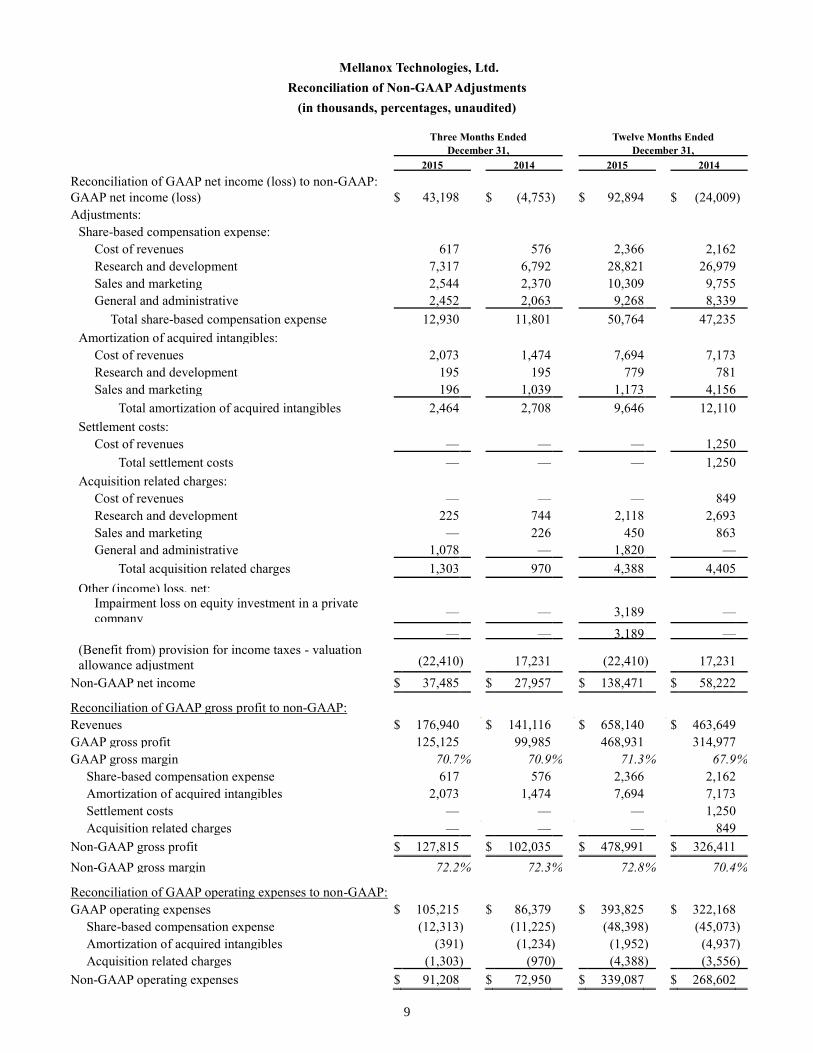
Mellanox Technologies, Ltd.
Reconciliation of Non-GAAP Adjustments
(in thousands, percentages, unaudited)
Three Months Ended Twelve Months Ended
December 31, December 31,
2015 2014 2015 2014
Reconciliation of GAAP net income (loss) to non-GAAP:
GAAP net income (loss) $ 43,198 $ (4,753 ) $ 92,894 $ (24,009 )
Adjustments:
Share-based compensation expense:
Cost of revenues 617 576 2,366 2,162
Research and development 7,317 6,792 28,821 26,979
Sales and marketing 2,544 2,370 10,309 9,755
General and administrative 2,452 2,063 9,268 8,339
Total share-based compensation expense 12,930 11,801 50,764 47,235
Amortization of acquired intangibles:
Cost of revenues 2,073 1,474 7,694 7,173
Research and development 195 195 779 781
Sales and marketing 196 1,039 1,173 4,156
Total amortization of acquired intangibles 2,464 2,708 9,646 12,110
Settlement costs:
Cost of revenues — — — 1,250
Total settlement costs — — — 1,250
Acquisition related charges:
Cost of revenues — — — 849
Research and development 225 744 2,118 2,693
Sales and marketing — 226 450 863
General and administrative 1,078 — 1,820 —
Total acquisition related charges 1,303 970 4,388 4,405
Other (income) loss, net: Impairment loss on equity investment in a private
company —
—
3,189
—
— — 3,189 —
(Benefit from) provision for income taxes - valuation
allowance adjustment (22,410 ) 17,231
(22,410 ) 17,231
Non-GAAP net income $ 37,485 $ 27,957 $ 138,471 $ 58,222
Reconciliation of GAAP gross profit to non-GAAP:
Revenues $ 176,940 %
$ 141,116 %
$ 658,140 %
$ 463,649
GAAP gross profit 125,125 99,985 468,931 314,977
GAAP gross margin 70.7 % 70.9 % 71.3 % 67.9 %
Share-based compensation expense 617 576 2,366 2,162
Amortization of acquired intangibles 2,073 1,474 7,694 7,173
Settlement costs — — — 1,250
Acquisition related charges — %
— %
— %
849
Non-GAAP gross profit $ 127,815 $ 102,035 $ 478,991 $ 326,411
Non-GAAP gross margin 72.2 % 72.3 % 72.8 % 70.4 %
Reconciliation of GAAP operating expenses to non-GAAP:
GAAP operating expenses $ 105,215 $ 86,379 $ 393,825 $ 322,168
Share-based compensation expense (12,313 ) (11,225 ) (48,398 ) (45,073 )
Amortization of acquired intangibles (391 ) (1,234 ) (1,952 ) (4,937 )
Acquisition related charges (1,303 ) (970 ) (4,388 ) (3,556 )
Non-GAAP operating expenses $ 91,208 $ 72,950 $ 339,087 $ 268,602
10
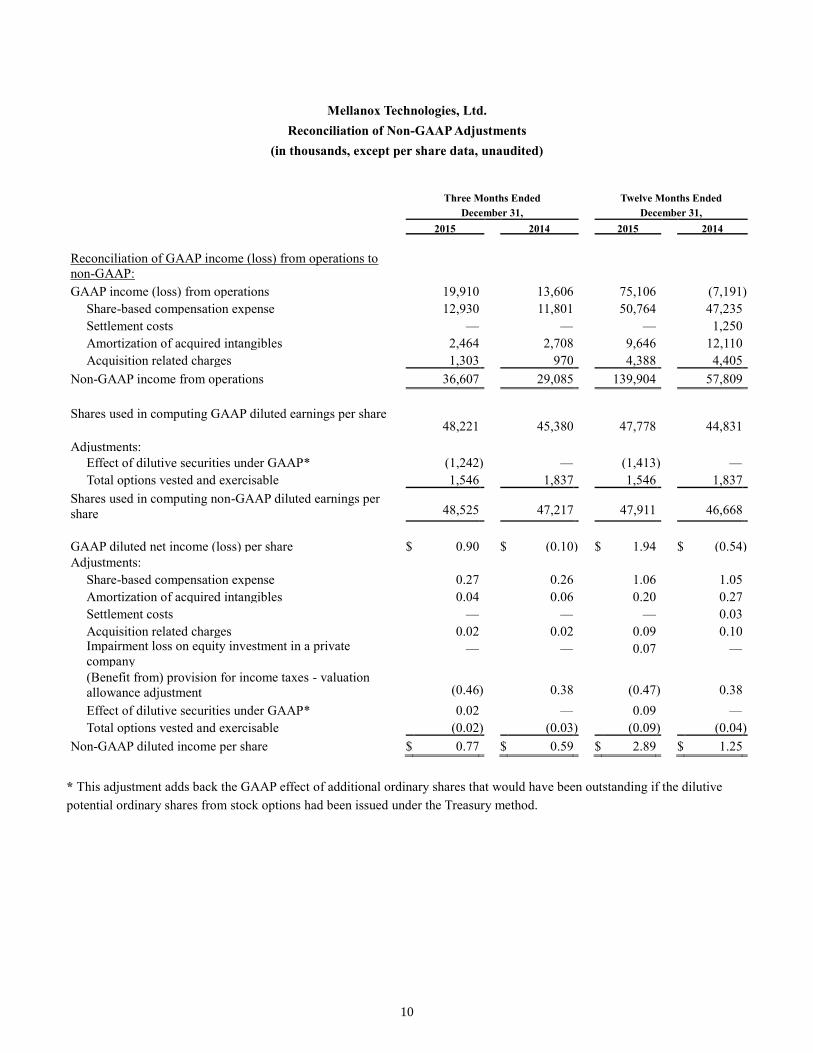
Mellanox Technologies, Ltd.
Reconciliation of Non-GAAP Adjustments
(in thousands, except per share data, unaudited)
Three Months Ended Twelve Months Ended
December 31, December 31,
2015 2014 2015 2014
Reconciliation of GAAP income (loss) from operations to
non-GAAP:
GAAP income (loss) from operations 19,910 13,606 75,106 (7,191 )
Share-based compensation expense 12,930 11,801 50,764 47,235
Settlement costs — — — 1,250
Amortization of acquired intangibles 2,464 2,708 9,646 12,110
Acquisition related charges 1,303 970 4,388 4,405
Non-GAAP income from operations 36,607 29,085 139,904 57,809
Shares used in computing GAAP diluted earnings per share
48,221
45,380
47,778
44,831
Adjustments:
Effect of dilutive securities under GAAP* (1,242 ) — (1,413 ) —
Total options vested and exercisable 1,546 1,837 1,546 1,837
Shares used in computing non-GAAP diluted earnings per
share
48,525
47,217
47,911
46,668
GAAP diluted net income (loss) per share $ 0.90 $ (0.10 ) $ 1.94 $ (0.54 )
Adjustments:
Share-based compensation expense 0.27 0.26 1.06 1.05
Amortization of acquired intangibles 0.04 0.06 0.20 0.27
Settlement costs — — — 0.03
Acquisition related charges 0.02 0.02 0.09 0.10
Impairment loss on equity investment in a private
company — — 0.07 —
(Benefit from) provision for income taxes - valuation
allowance adjustment
(0.46 ) 0.38
(0.47 ) 0.38
Effect of dilutive securities under GAAP* 0.02 — 0.09 —
Total options vested and exercisable (0.02 ) (0.03 ) (0.09 ) (0.04 )
Non-GAAP diluted income per share $ 0.77 $ 0.59 $ 2.89 $ 1.25
* This adjustment adds back the GAAP effect of additional ordinary shares that would have been outstanding if the dilutive
potential ordinary shares from stock options had been issued under the Treasury method.
11
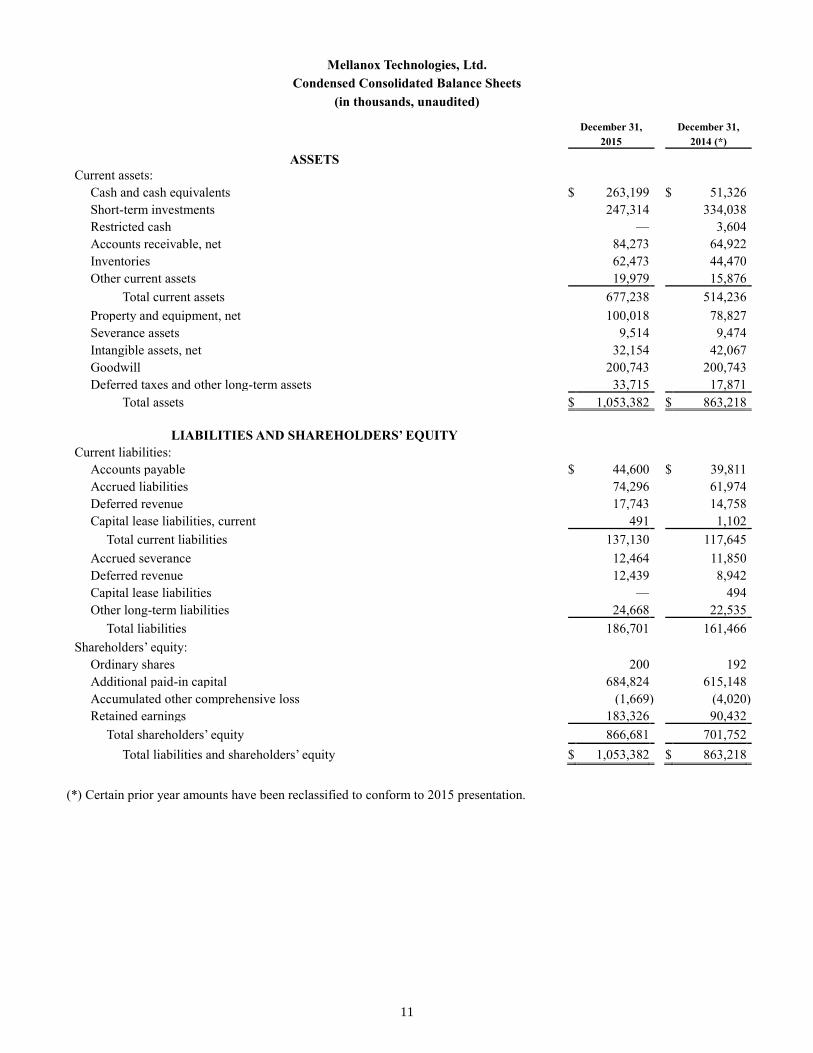
Mellanox Technologies, Ltd.
Condensed Consolidated Balance Sheets
(in thousands, unaudited)
December 31, December 31,
2015 2014 (*)
ASSETS
Current assets:
Cash and cash equivalents $ 263,199 $ 51,326
Short-term investments 247,314 334,038
Restricted cash — 3,604
Accounts receivable, net 84,273 64,922
Inventories 62,473 44,470
Other current assets 19,979 15,876
Total current assets 677,238 514,236
Property and equipment, net 100,018 78,827
Severance assets 9,514 9,474
Intangible assets, net 32,154 42,067
Goodwill 200,743 200,743
Deferred taxes and other long-term assets 33,715 17,871
Total assets $ 1,053,382 $ 863,218
LIABILITIES AND SHAREHOLDERS’ EQUITY
Current liabilities:
Accounts payable $ 44,600 $ 39,811
Accrued liabilities 74,296 61,974
Deferred revenue 17,743 14,758
Capital lease liabilities, current 491 1,102
Total current liabilities 137,130 117,645
Accrued severance 12,464 11,850
Deferred revenue 12,439 8,942
Capital lease liabilities — 494
Other long-term liabilities 24,668 22,535
Total liabilities 186,701 161,466
Shareholders’ equity:
Ordinary shares 200 192
Additional paid-in capital 684,824 615,148
Accumulated other comprehensive loss (1,669 ) (4,020 )
Retained earnings 183,326 90,432
Total shareholders’ equity 866,681 701,752
Total liabilities and shareholders’ equity $ 1,053,382 $ 863,218
(*) Certain prior year amounts have been reclassified to conform to 2015 presentation.
12
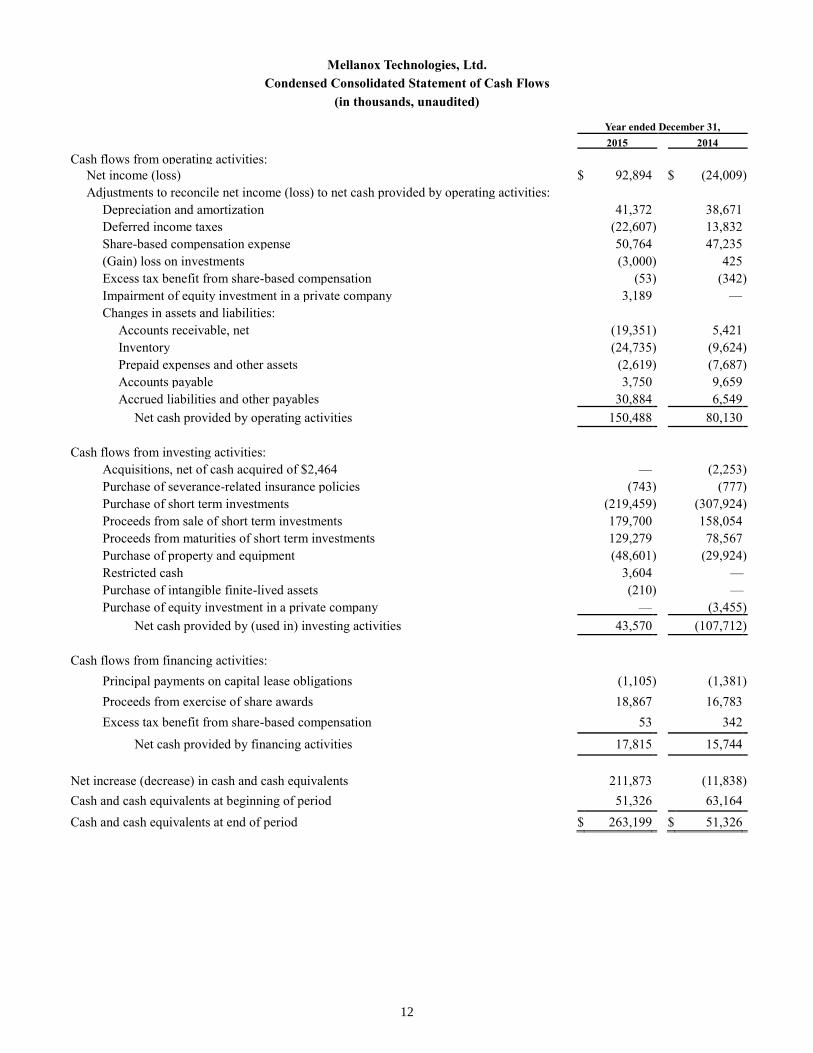
Mellanox Technologies, Ltd.
Condensed Consolidated Statement of Cash Flows
(in thousands, unaudited)
Year ended December 31,
2015 2014
Cash flows from operating activities:
Net income (loss) $ 92,894 $ (24,009 )
Adjustments to reconcile net income (loss) to net cash provided by operating activities:
Depreciation and amortization 41,372 38,671
Deferred income taxes (22,607 ) 13,832
Share-based compensation expense 50,764 47,235
(Gain) loss on investments (3,000 ) 425
Excess tax benefit from share-based compensation (53 ) (342 )
Impairment of equity investment in a private company 3,189 —
Changes in assets and liabilities:
Accounts receivable, net (19,351 ) 5,421
Inventory (24,735 ) (9,624 )
Prepaid expenses and other assets (2,619 ) (7,687 )
Accounts payable 3,750 9,659
Accrued liabilities and other payables 30,884 6,549
Net cash provided by operating activities 150,488 80,130
Cash flows from investing activities:
Acquisitions, net of cash acquired of $2,464 — (2,253 )
Purchase of severance-related insurance policies (743 ) (777 )
Purchase of short term investments (219,459 ) (307,924 )
Proceeds from sale of short term investments 179,700 158,054
Proceeds from maturities of short term investments 129,279 78,567
Purchase of property and equipment (48,601 ) (29,924 )
Restricted cash 3,604 —
Purchase of intangible finite-lived assets (210 ) —
Purchase of equity investment in a private company — (3,455 )
Net cash provided by (used in) investing activities 43,570 (107,712 )
Cash flows from financing activities:
Principal payments on capital lease obligations (1,105 ) (1,381 )
Proceeds from exercise of share awards 18,867 16,783
Excess tax benefit from share-based compensation 53 342
Net cash provided by financing activities 17,815 15,744
Net increase (decrease) in cash and cash equivalents 211,873 (11,838 )
Cash and cash equivalents at beginning of period 51,326 63,164
Cash and cash equivalents at end of period $ 263,199 $ 51,326