Embed Size (px)
Citation preview

Catalogue no. 11-010-X ISSN 1705-0189
by Philip Cross and Diana Wyman
The relationship between monthly, quarterly, and annual growth rates
Canadian Economic Observer

Standard table symbolsThe following symbols are used in Statistics Canada publications:
. not available for any reference period
.. not available for a specific reference period
... not applicable 0 true zero or a value rounded to zero 0s value rounded to 0 (zero) where there is a meaningful distinction between true zero and the value that was rounded p preliminary r revised x suppressed to meet the confidentiality requirements of the Statistics Act E use with caution F too unreliable to be published * significantly different from reference category (p < 0.05)
How to obtain more informationFor information about this product or the wide range of services and data available from Statistics Canada, visit our website, www.statcan.gc.ca. You can also contact us by email at [email protected] telephone, from Monday to Friday, 8:30 a.m. to 4:30 p.m., at the following numbers:
• Statistical Information Service 1-800-263-1136 • National telecommunications device for the hearing impaired 1-800-363-7629 • Fax line 1-514-283-9350
Depository Services Program
• Inquiries line 1-800-635-7943 • Fax line 1-800-565-7757
Note of appreciationCanada owes the success of its statistical system to a long-standing partnership between Statistics Canada, the citizens of Canada, its businesses, governments and other institutions. Accurate and timely statistical information could not be produced without their continued co-operation and goodwill.
Standards of service to the publicStatistics Canada is committed to serving its clients in a prompt, reliable and courteous manner. To this end, Statistics Canada has developed standards of service that its employees observe. To obtain a copy of these service standards, please contact Statistics Canada toll-free at 1-800-263-1136. The service standards are also published on www.statcan.gc.ca under “Contact us” > “Standards of service to the public.”
Published by authority of the Minister responsible for Statistics Canada
© Minister of Industry, 2011
All rights reserved. Use of this publication is governed by the Statistics Canada Open Licence Agreement.
An HTML version is also available.
Cette publication est aussi disponible en français.

The relationship between monthly, quarterly, and annual growth ratesThe relationship between monthly, quarterly, and annual growth rates
by Philip Cross and Diana Wyman by Philip Cross and Diana Wyman
Growth rates have a distinct dynamic: monthly growth rates have a fixed statistical relationship with quarterlyGrowth rates have a distinct dynamic: monthly growth rates have a fixed statistical relationship with quarterlygrowth rates, and quarterly growth rates have a fixed statistical relationship with the annual average growth rate.growth rates, and quarterly growth rates have a fixed statistical relationship with the annual average growth rate.However, these relationships are not well understood by analysts or statisticians. While analysts occasionallyHowever, these relationships are not well understood by analysts or statisticians. While analysts occasionallymake references that show an intuitive understanding of the dynamic, a fuller appreciation is required tomake references that show an intuitive understanding of the dynamic, a fuller appreciation is required tounderstand how individual quarters (or months) specifically affect annual (or quarterly) averages. understand how individual quarters (or months) specifically affect annual (or quarterly) averages. Such Suchknowledge helps analysts monitor how the economy is performing in a particular year without having every dataknowledge helps analysts monitor how the economy is performing in a particular year without having every datapoint for that year, and understand why a particularly weak or strong first quarter of the year has apoint for that year, and understand why a particularly weak or strong first quarter of the year has adisproportionate impact on that year's annual growth rate.disproportionate impact on that year's annual growth rate.
This paper will explain the principles of growth rate relationships conceptually and mathematically by thoroughlyThis paper will explain the principles of growth rate relationships conceptually and mathematically by thoroughlyexamining the relationship between quarterly growth rates and annual average growth rates. It then applies theseexamining the relationship between quarterly growth rates and annual average growth rates. It then applies theseprinciples to how monthly growth relates to quarterly growth rates as well as to data with other frequencies, suchprinciples to how monthly growth relates to quarterly growth rates as well as to data with other frequencies, suchas monthly growth rates and annual average growth rates and annual average growth rates and decade growthas monthly growth rates and annual average growth rates and annual average growth rates and decade growthrates.rates.
A primer on annual average growthA primer on annual average growth
The annual average growth rate answers the question of what happened during one year relative to the yearThe annual average growth rate answers the question of what happened during one year relative to the yearbefore. It is calculated as the percentage change between two consecutive annual levels. before. It is calculated as the percentage change between two consecutive annual levels. These annual levels These annual levelsare the sum of the four quarterly levels of the two adjacent years, or the average if the data has beenare the sum of the four quarterly levels of the two adjacent years, or the average if the data has beenannualized. annualized. The annual average growth rate does not only reflect what happened during the four quarters of The annual average growth rate does not only reflect what happened during the four quarters ofone calendar year, but is affected by the pattern of quarterly growth in both years.one calendar year, but is affected by the pattern of quarterly growth in both years.
Annual average growth rates are calculated mainly by statistical agencies. For major economic indicators, such asAnnual average growth rates are calculated mainly by statistical agencies. For major economic indicators, such asreal gross domestic product (GDP) and the consumer price index (CPI), annual growth is a baseline measure ofreal gross domestic product (GDP) and the consumer price index (CPI), annual growth is a baseline measure ofhow the economy is performing and how prices are changing. The annual average change in the CPI is the best-how the economy is performing and how prices are changing. The annual average change in the CPI is the best-known annual average, as it is used to index the entire tax and transfer payment system as well as many wageknown annual average, as it is used to index the entire tax and transfer payment system as well as many wagecontracts across the country. Given the significance of the annual average growth of these indicators, it iscontracts across the country. Given the significance of the annual average growth of these indicators, it isimportant to understand the mechanics involved in the calculation of this measure.important to understand the mechanics involved in the calculation of this measure.
Outside of statistical agencies, the year-over-year growth, such as fourth-quarter-over-fourth-quarter orOutside of statistical agencies, the year-over-year growth, such as fourth-quarter-over-fourth-quarter orDecember-over-December change, is the more common measure of growth. Year-over-year growth rates areDecember-over-December change, is the more common measure of growth. Year-over-year growth rates areuniversally used in business reports, and show the change that occurred during the previous four quarters oruniversally used in business reports, and show the change that occurred during the previous four quarters ortwelve months, reflecting only events that occur during the calendar year. Identifying the trend that dominatedtwelve months, reflecting only events that occur during the calendar year. Identifying the trend that dominatedeither the previous four quarters or twelve months is useful for analyzing shorter-term trends, but the trade-off iseither the previous four quarters or twelve months is useful for analyzing shorter-term trends, but the trade-off isthe greater volatility of the year-over-year change. The year-over-year measures are susceptible to irregularthe greater volatility of the year-over-year change. The year-over-year measures are susceptible to irregular
Statistics CanadaStatistics Canada
11
22
33
44
Statistics Canada, Catalogue no. 11-010-X 3

events occurring in either of the two periods being compared, which may distort the identification of theevents occurring in either of the two periods being compared, which may distort the identification of theunderlying trend.underlying trend.
Figure Figure 3.13.1 shows the additional volatility of the year-over-year measure compared to the annual average change shows the additional volatility of the year-over-year measure compared to the annual average changefor the CPI. In September 2005, for example, gasoline prices rose sharply as a result of the disruption of crude oilfor the CPI. In September 2005, for example, gasoline prices rose sharply as a result of the disruption of crude oilproduction in the US following Hurricane Katrina. This price increase affected the year-over-year change in theproduction in the US following Hurricane Katrina. This price increase affected the year-over-year change in theCPI in both September 2005 (when gasoline prices jumped 35%) and September 2006 (prices fell 19% comparedCPI in both September 2005 (when gasoline prices jumped 35%) and September 2006 (prices fell 19% comparedwith their spike a year earlier). While the year-over-year measure can quickly signal a shift in the underlyingwith their spike a year earlier). While the year-over-year measure can quickly signal a shift in the underlyingtrend, it may provide a false signal that prices (or the economy) are accelerating or decelerating when it istrend, it may provide a false signal that prices (or the economy) are accelerating or decelerating when it isactually an irregular event in the data for the current month or in the data for one year earlier that is causing theactually an irregular event in the data for the current month or in the data for one year earlier that is causing thechange.change.
Annual average growth more accurately reflects longer-term economic trends by comparing how all of the currentAnnual average growth more accurately reflects longer-term economic trends by comparing how all of the currentyear relates to the whole year before it. By integrating two full years of data points, the impact of irregular eventsyear relates to the whole year before it. By integrating two full years of data points, the impact of irregular eventsis minimized, thereby emphasizing the underlying trend. In the case of 2005 and 2006, when the monthly year-is minimized, thereby emphasizing the underlying trend. In the case of 2005 and 2006, when the monthly year-over-year change was so volatile, the annual average growth rate of the CPI was remarkably stable at about 2%,over-year change was so volatile, the annual average growth rate of the CPI was remarkably stable at about 2%,versus the swing from 3.2% to 0.7% in the year-over-year measures. versus the swing from 3.2% to 0.7% in the year-over-year measures. It is this greater stability of the It is this greater stability of theunderlying trend that makes the annual average growth rate of the CPI the better measure for indexing wagesunderlying trend that makes the annual average growth rate of the CPI the better measure for indexing wagesand the tax and transfer payment system and the reason why statistical agencies calculate annual growth forand the tax and transfer payment system and the reason why statistical agencies calculate annual growth formost of the major economic indicators. most of the major economic indicators.
Relationship between quarterly growth and annual average growth: the conceptRelationship between quarterly growth and annual average growth: the concept
It is worth studying a hypothetical example to outline some of the basic principles of how annual average growthIt is worth studying a hypothetical example to outline some of the basic principles of how annual average growthrates are determined. Figure rates are determined. Figure 3.23.2 shows sales in a hypothetical industry rising steadily through year 1, shows sales in a hypothetical industry rising steadily through year 1,from $100 billion (at annual rates) in the first quarter to $106 billion in the fourth quarter. The quarterly levelsfrom $100 billion (at annual rates) in the first quarter to $106 billion in the fourth quarter. The quarterly levelsthroughout year 2 remain unchanged, at $106 billion. This demonstrates the difference between annual averagethroughout year 2 remain unchanged, at $106 billion. This demonstrates the difference between annual averagegrowth and fourth-quarter-over-fourth-quarter growth rates: there is zero growth between the fourth quarter ofgrowth and fourth-quarter-over-fourth-quarter growth rates: there is zero growth between the fourth quarter ofyear 1 and the fourth quarter of year 2, but the annual average level of sales of $106 billion in year 2 is 2.9%year 1 and the fourth quarter of year 2, but the annual average level of sales of $106 billion in year 2 is 2.9%above their average level of $103 billion in year 1. This is because the above-average level at the end ofabove their average level of $103 billion in year 1. This is because the above-average level at the end ofyear 1 was maintained throughout year 2.year 1 was maintained throughout year 2.
Figure Figure 3.23.2 was a hypothetical example contrived to demonstrate how developments during a calendar year relate was a hypothetical example contrived to demonstrate how developments during a calendar year relateto the annual average for that year. Figure to the annual average for that year. Figure 3.33.3 shows these features in actual GDP data. Real GDP rose steadily shows these features in actual GDP data. Real GDP rose steadilythroughout the four quarters of 2007. Output then leveled off in the first three quarters of 2008, before a largethroughout the four quarters of 2007. Output then leveled off in the first three quarters of 2008, before a largedrop in the fourth quarter of the year, which left it 0.7% below the level of the fourth-quarter of 2007. Evendrop in the fourth quarter of the year, which left it 0.7% below the level of the fourth-quarter of 2007. Eventhough there were only two quarters during 2008 that posted a gain (totaling 0.3%), the average level of GDPthough there were only two quarters during 2008 that posted a gain (totaling 0.3%), the average level of GDPin 2008 was $1,320 billion, or 0.7% above its average level of $1,311 billion in 2007. This was the result of thein 2008 was $1,320 billion, or 0.7% above its average level of $1,311 billion in 2007. This was the result of therelatively high level of output reached late in 2007 being sustained through most of 2008.relatively high level of output reached late in 2007 being sustained through most of 2008.
Two basic principles are introduced by the examples of annual average growth in Figures 2 and 3. The first, andTwo basic principles are introduced by the examples of annual average growth in Figures 2 and 3. The first, andmost important, is that annual growth rates reflect the pattern of growth in both the year being studied (year 2,most important, is that annual growth rates reflect the pattern of growth in both the year being studied (year 2,or 2008 in the examples) and the previous year (year 1, or 2007, in the examples). The second is that whileor 2008 in the examples) and the previous year (year 1, or 2007, in the examples). The second is that whileindividual quarterly growth rates have an equal impact on the year-over-year change, they do not have an equalindividual quarterly growth rates have an equal impact on the year-over-year change, they do not have an equalimpact on the annual average growth rate; there is a hierarchy for which quarters have the most impact onimpact on the annual average growth rate; there is a hierarchy for which quarters have the most impact onannual average growth.annual average growth.
The hierarchy of the impact of quarterly growth rates on the annual average growth rate is a characteristic ofThe hierarchy of the impact of quarterly growth rates on the annual average growth rate is a characteristic ofgrowth rate dynamics. When an increase (or decrease) occurs in a quarter in either year 1 or 2, it raises (orgrowth rate dynamics. When an increase (or decrease) occurs in a quarter in either year 1 or 2, it raises (orlowers) the level on which all future increases (or decreases) are based. The growth rate of the first quarter oflowers) the level on which all future increases (or decreases) are based. The growth rate of the first quarter ofyear 1 has no effect on the annual growth rate between years 1 and 2 because it affects the levels in both yearsyear 1 has no effect on the annual growth rate between years 1 and 2 because it affects the levels in both years
55
66
Statistics Canada, Catalogue no. 11-010-X 4

(1)(1)
(2)(2)
(3)(3)
equally. A change in the first quarter of year 2 has the largest impact on annual growth, as it raises (or lowers)equally. A change in the first quarter of year 2 has the largest impact on annual growth, as it raises (or lowers)the level on which all future changes within year 2 are based, while having no effect whatsoever on the level inthe level on which all future changes within year 2 are based, while having no effect whatsoever on the level inyear 1. Next to the first quarter of year 2, the growth rates of the two quarters adjacent to the first quarter ofyear 1. Next to the first quarter of year 2, the growth rates of the two quarters adjacent to the first quarter ofyear 2 have the second-largest impact. The impact of quarters on annual average growth declines as they moveyear 2 have the second-largest impact. The impact of quarters on annual average growth declines as they moveaway from the first quarter of year 2 until the second quarter of year 1 and the final quarter of year 2, which haveaway from the first quarter of year 2 until the second quarter of year 1 and the final quarter of year 2, which havethe smallest impact. This hierarchy, which takes the shape of a pyramid, is mathematically demonstrated in thethe smallest impact. This hierarchy, which takes the shape of a pyramid, is mathematically demonstrated in thenext section.next section.
Relationship between quarterly growth and annual average growth: the mathRelationship between quarterly growth and annual average growth: the math
The annual growth rate of year 2 is calculated as the ratio between the sum of the four most recent quarterlyThe annual growth rate of year 2 is calculated as the ratio between the sum of the four most recent quarterlylevels and the sum of the previous four quarterly levels. The four quarterly levels of year 1 are Qlevels and the sum of the previous four quarterly levels. The four quarterly levels of year 1 are Q , Q, Q , Q, Q , and, andQQ ; the four quarterly levels of year 2 are Q; the four quarterly levels of year 2 are Q , Q, Q , Q, Q , and Q, and Q . The annual average growth rate calculated with. The annual average growth rate calculated withlevels can be expressed as:levels can be expressed as:
The level in the first quarter of year 1 (QThe level in the first quarter of year 1 (Q ) can be calculated by multiplying its growth rate (g) can be calculated by multiplying its growth rate (g ) by the quarterly) by the quarterlylevel that preceded it, referred to as Qlevel that preceded it, referred to as Q The level Q The level Q can be calculated by multiplying its growth rate (g can be calculated by multiplying its growth rate (g ) and the) and thegrowth rate in the first quarter of year 1 (g1) by the base level (Qgrowth rate in the first quarter of year 1 (g1) by the base level (Q ). Each quarterly level can therefore be). Each quarterly level can therefore beexpressed in terms of quarterly growth rates multiplied by the level in the base quarter (Qexpressed in terms of quarterly growth rates multiplied by the level in the base quarter (Q ). The quarterly). The quarterlygrowth rates of year 1 are referred to as ggrowth rates of year 1 are referred to as g , g, g , g, g , and g, and g , while the four quarters of year 2 are labeled g, while the four quarters of year 2 are labeled g , g, g ,,gg , and g, and g . The level in the first quarter of year 2, Q. The level in the first quarter of year 2, Q , for example, can therefore be replaced by Q, for example, can therefore be replaced by Q x g x g x g x g x xgg x g x g x g x g , which describes the base level (Q, which describes the base level (Q ) multiplied by the growth rates of the preceding four quarters) multiplied by the growth rates of the preceding four quartersalong with its own growth rate. The quarterly levels Qalong with its own growth rate. The quarterly levels Q thru Q thru Q can be expressed as:can be expressed as:
QQ = Q = Q x g x gQQ = Q = Q xg xg xgxgQQ = Q = Q xgxg xgxg xgxgQQ = Q = Q xgxg xgxg xgxg xgxgQQ = Q= Q xgxg xgxg xgxg xgxg xgxgQQ = Q = Q xgxg xgxg xgxg xgxg xgxg x gx gQQ = Q= Q xgxg xgxg xgxg xg xg xgxg xgxg xgxgQQ = Q= Q xgxg xgxg xgxg xgxg xgxg x gx g xgxg xgxg
This results in the new equation:This results in the new equation:
After factoring out and cancelling the term QAfter factoring out and cancelling the term Q gg (as it appears in each quarterly expression), the final equation (as it appears in each quarterly expression), the final equationshows the make-up of the four quarterly levels of year 2 in the numerator and the three relevant quarterly levelsshows the make-up of the four quarterly levels of year 2 in the numerator and the three relevant quarterly levelsof year 1 in the denominator expressed as growth rates. of year 1 in the denominator expressed as growth rates. Therefore, the algebraic equation of the relationship Therefore, the algebraic equation of the relationshipbetween quarterly growth rates and annual average growth rates that expresses the annual average growth ratebetween quarterly growth rates and annual average growth rates that expresses the annual average growth rateas a function of the quarterly growth rates in year 1 and 2 is as a function of the quarterly growth rates in year 1 and 2 is : :
The hierarchy in which quarterly growth rates contribute to annual average growth is apparent in this equation. InThe hierarchy in which quarterly growth rates contribute to annual average growth is apparent in this equation. Inparticular, the growth rate of the first quarter of the first year (gparticular, the growth rate of the first quarter of the first year (g ) has no effect on the annual average growth) has no effect on the annual average growthrate in year 2, as shown by its disappearance from the equation. The recurrence of the first quarter of year 2 (grate in year 2, as shown by its disappearance from the equation. The recurrence of the first quarter of year 2 (g ))four times in the numerator reflects its primary importance in determining the annual average growth rate, asfour times in the numerator reflects its primary importance in determining the annual average growth rate, ashigher (or lower) growth in this quarter compounds throughout year 2.higher (or lower) growth in this quarter compounds throughout year 2.
11 22 3344 55 66 77 88
11 1100.. 22 22
0000
11 22 33 44 55 6677 88 55 00 11 2233 44 55 00
11 88
11 00 1122 00 11 2233 00 11 22 3344 00 11 22 33 4455 00 11 22 33 44 5566 00 11 22 33 44 55 6677 00 11 22 33 44 55 66 7788 00 11 22 33 44 55 66 77 88
00 11
77
88
1155
Statistics Canada, Catalogue no. 11-010-X 5

g ( ) g q p g yThe impact on annual average growth diminishes according to the distance a quarter is from the first quarter ofThe impact on annual average growth diminishes according to the distance a quarter is from the first quarter ofyear 2 (gyear 2 (g ); this impact is reflected in either the quarters' increased appearance in the denominator (as occurs for); this impact is reflected in either the quarters' increased appearance in the denominator (as occurs forgg , g, g , and g, and g ) or their decreased recurrence in the numerator (g) or their decreased recurrence in the numerator (g , g, g , and g, and g ). The quarterly growth rates on). The quarterly growth rates oneither side of the first quarter of year 2, namely the fourth quarter of year 1 (geither side of the first quarter of year 2, namely the fourth quarter of year 1 (g ) and the second quarter of) and the second quarter ofyear 2 (gyear 2 (g ), have the next-largest impact after g), have the next-largest impact after g . Growth in the fourth quarter of year 1, g. Growth in the fourth quarter of year 1, g , compounds, compoundsthroughout year 2; however, the presence of gthroughout year 2; however, the presence of g in the denominator means that its growth also affects year 1 and in the denominator means that its growth also affects year 1 andreduces the impact of the quarter on growth in year 2. For the second quarter of year 2, greduces the impact of the quarter on growth in year 2. For the second quarter of year 2, g , the compounding is, the compounding isnot as prevalent as for gnot as prevalent as for g as a result of its later placement in the year; it repeats only three times in the as a result of its later placement in the year; it repeats only three times in theequation. The impact continues to decline for the third quarter of year 1, gequation. The impact continues to decline for the third quarter of year 1, g , and for the third quarter in year 2,, and for the third quarter in year 2,gg , as a result of the repetition of g, as a result of the repetition of g in the denominator and g in the denominator and g compounding only for the last two quarters of compounding only for the last two quarters ofyear 2. The second quarter of year 1 (gyear 2. The second quarter of year 1 (g ) appears only one more time in the numerator than the denominator, as) appears only one more time in the numerator than the denominator, asits growth affects year 1 nearly as much as year 2, while the fourth quarter of year 2 (gits growth affects year 1 nearly as much as year 2, while the fourth quarter of year 2 (g ) appears only once in) appears only once inthe numerator; therefore, these two quarters have the least impact in determining the annual growth rate inthe numerator; therefore, these two quarters have the least impact in determining the annual growth rate inyear 2.year 2.
The algebraic equation highlights that there is a hierarchy to the impact of the quarterly growth rate on annualThe algebraic equation highlights that there is a hierarchy to the impact of the quarterly growth rate on annualaverage growth, but it does not show the specific impact that each quarter has on the annual average growthaverage growth, but it does not show the specific impact that each quarter has on the annual average growthrate. However, the impact can be calculated by inputting into the equation a 1% quarterly growth raterate. However, the impact can be calculated by inputting into the equation a 1% quarterly growth ratesequentially into all 7 quarters into the equation and setting growth at zero in all other quarters. The resultingsequentially into all 7 quarters into the equation and setting growth at zero in all other quarters. The resultingchange to annual average growth in year 2 is shown in Table change to annual average growth in year 2 is shown in Table 3.13.1. .
In the hypothetical scenarios set out in Table In the hypothetical scenarios set out in Table 3.13.1, a 1% increase in the first quarter of year 1 results in annual, a 1% increase in the first quarter of year 1 results in annualaverage growth in year 2 remaining at zero; there is no impact on the annual growth rate in year 2. If the 1%average growth in year 2 remaining at zero; there is no impact on the annual growth rate in year 2. If the 1%increase occurs in the second quarter of year 1, the annual growth rate in year 2 is 0.25%, indicating that one-increase occurs in the second quarter of year 1, the annual growth rate in year 2 is 0.25%, indicating that one-quarter of the 1% gain was passed on to the annual growth rate. quarter of the 1% gain was passed on to the annual growth rate. This continues to increase each quarter by This continues to increase each quarter byincrements of 25% until the maximum pass-through of 100% is attained in the first quarter of year 2, gincrements of 25% until the maximum pass-through of 100% is attained in the first quarter of year 2, g . The. Thepass-through then falls by increments of 25% until the fourth quarter of year 2. Figure pass-through then falls by increments of 25% until the fourth quarter of year 2. Figure 3.43.4 shows the pyramid- shows the pyramid-shaped hierarchy of the impact of quarterly growth on the annual growth rate and highlights the rate at whichshaped hierarchy of the impact of quarterly growth on the annual growth rate and highlights the rate at whichgrowth is passed through from the individual quarters to the annual growth rate, which determines thegrowth is passed through from the individual quarters to the annual growth rate, which determines theimpact. impact.
If the 1% growth occurred in every one of these quarters, as shown in Table If the 1% growth occurred in every one of these quarters, as shown in Table 3.23.2, the result would be an annual, the result would be an annualaverage growth rate of 4.1%. By observing the change in the annual growth rate after the addition of just oneaverage growth rate of 4.1%. By observing the change in the annual growth rate after the addition of just onemore quarterly growth rate into the equation, the share of the annual growth rate accounted for by that quartermore quarterly growth rate into the equation, the share of the annual growth rate accounted for by that quartercan be calculated. The first quarter of year 2 accounts for 25% of the annual average growth rate, the largestcan be calculated. The first quarter of year 2 accounts for 25% of the annual average growth rate, the largestweight of any quarter. The share falls steadily by about 6 percentage points a quarter as the quarters move awayweight of any quarter. The share falls steadily by about 6 percentage points a quarter as the quarters move awayfrom the first quarter of year 2. At the end of the second quarter of year 2, the cumulative share shows that 81%from the first quarter of year 2. At the end of the second quarter of year 2, the cumulative share shows that 81%of the annual growth rate has been determined, even though the year is only half over. of the annual growth rate has been determined, even though the year is only half over. Once the third quarter Once the third quarterof year 2 is known, 94% of the annual growth rate has been determined, as shown in Figure of year 2 is known, 94% of the annual growth rate has been determined, as shown in Figure 3.53.5. .
Relationship between monthly growth rates and quarterly growth ratesRelationship between monthly growth rates and quarterly growth rates
A similar fixed statistical relationship exists between monthly growth rates and quarterly growth rates. QuarterlyA similar fixed statistical relationship exists between monthly growth rates and quarterly growth rates. Quarterlygrowth rates reflect the pattern of monthly growth in both the quarter being measured (quarter 2) and thegrowth rates reflect the pattern of monthly growth in both the quarter being measured (quarter 2) and theprevious quarter (quarter 1) to which it is being compared. There is a hierarchy for the impact of the individualprevious quarter (quarter 1) to which it is being compared. There is a hierarchy for the impact of the individualmonthly growth rates on the quarterly growth rate, with the first month of quarter 2 having the largest impact onmonthly growth rates on the quarterly growth rate, with the first month of quarter 2 having the largest impact on
5522 33 44 66 77 88
4466 55 44
4466
5533
77 33 7722
88
99
1010
55
1111
12121313
Statistics Canada, Catalogue no. 11-010-X 6

(4)(4)
the growth in quarter 2. The months on either side have the next-largest impact, and the months next to thosethe growth in quarter 2. The months on either side have the next-largest impact, and the months next to thosehave the least impact. Growth in the first month of quarter 1 has no impact on growth in quarter 2.have the least impact. Growth in the first month of quarter 1 has no impact on growth in quarter 2.
With gWith g representing the second month in quarter 1's growth rate, g representing the second month in quarter 1's growth rate, g the final month in quarter 1's growth rate,the final month in quarter 1's growth rate,gg the first month of quarter 2's growth rate, g the first month of quarter 2's growth rate, g the second month of quarter 2's growth rate, and g the second month of quarter 2's growth rate, and g the final the finalmonth of quarter 2's growth rate, the equation for quarterly growth using monthly growth rates is:month of quarter 2's growth rate, the equation for quarterly growth using monthly growth rates is:
By isolating a 1% increase in each month, the specific impact of the individual months on quarterly growth can beBy isolating a 1% increase in each month, the specific impact of the individual months on quarterly growth can bedivided into thirds: 100% of the growth rate of the first month of quarter 2 passes through to the quarterlydivided into thirds: 100% of the growth rate of the first month of quarter 2 passes through to the quarterlygrowth rate in quarter 2; 66% of the growth rate of the third month of quarter 1 and the second month ofgrowth rate in quarter 2; 66% of the growth rate of the third month of quarter 1 and the second month ofquarter 2 passes through to the quarterly growth rate in quarter 2; and 33% of the growth rate in the secondquarter 2 passes through to the quarterly growth rate in quarter 2; and 33% of the growth rate in the secondmonth of quarter 1 and the third month of quarter 2 is passed on to the quarterly growth rate in quarter 2. Themonth of quarter 1 and the third month of quarter 2 is passed on to the quarterly growth rate in quarter 2. Thepyramid-shaped hierarchy of impact of monthly growth on quarterly growth (measured by the rate at whichpyramid-shaped hierarchy of impact of monthly growth on quarterly growth (measured by the rate at whichgrowth is passed through from the monthly to the quarterly growth rate) is shown in Figure growth is passed through from the monthly to the quarterly growth rate) is shown in Figure 3.63.6. The share of the. The share of thequarterly growth rate accounted for by the first month of quarter 2 is 33%; this figure falls by 11 percentagequarterly growth rate accounted for by the first month of quarter 2 is 33%; this figure falls by 11 percentagepoint intervals equally to right and left as the months move away from this pivotal month. As shown in Figurepoint intervals equally to right and left as the months move away from this pivotal month. As shown in Figure3.73.7, the result is that, after growth in the first month of quarter 2 is published, two-thirds of the quarterly growth, the result is that, after growth in the first month of quarter 2 is published, two-thirds of the quarterly growthrate has been determined: after the second month of the quarter 2 growth rate is known, 89% of the quarterlyrate has been determined: after the second month of the quarter 2 growth rate is known, 89% of the quarterlygrowth rate of quarter 2 has been determined. Only a large change in growth in the final month of the secondgrowth rate of quarter 2 has been determined. Only a large change in growth in the final month of the secondquarter will significantly alter quarterly growth (although it helps set the table for growth in the next quarter).quarter will significantly alter quarterly growth (although it helps set the table for growth in the next quarter).
In order to illustrate the difference that can be made by the timing of growth in the first month ofIn order to illustrate the difference that can be made by the timing of growth in the first month ofquarter 2 relative to that of other months, Figure quarter 2 relative to that of other months, Figure 3.83.8 and Figure and Figure 3.93.9 show quarterly sales in a hypothetical show quarterly sales in a hypotheticalindustry under two scenarios. In scenario 1, there is 1% growth in every month, with the exception of a 10%industry under two scenarios. In scenario 1, there is 1% growth in every month, with the exception of a 10%increase in June, the final month of quarter 2, when an incentive to purchase was offered to customers. Salesincrease in June, the final month of quarter 2, when an incentive to purchase was offered to customers. Salesduring quarter 1 averaged $101 billion (at annual rates), while sales during quarter 2 averaged $107.2 billion,during quarter 1 averaged $101 billion (at annual rates), while sales during quarter 2 averaged $107.2 billion,leaving quarterly growth up 6.1%. In scenario 2, the incentive is offered in April, the first month of quarter 2;leaving quarterly growth up 6.1%. In scenario 2, the incentive is offered in April, the first month of quarter 2;there is 1% growth in every other month but April, in which the 10% increase occurs. While sales duringthere is 1% growth in every other month but April, in which the 10% increase occurs. While sales duringquarter 1 were $101 billion (at annual rates) and reached $114.5 billion in the final month of quarter 2 in bothquarter 1 were $101 billion (at annual rates) and reached $114.5 billion in the final month of quarter 2 in bothscenarios, total sales for quarter 2 were $113.3 billion when the incentive boosted sales in April, and quarterlyscenarios, total sales for quarter 2 were $113.3 billion when the incentive boosted sales in April, and quarterlygrowth was 12.2%, twice the quarterly growth when the incentive boosted sales in June.growth was 12.2%, twice the quarterly growth when the incentive boosted sales in June.
Growth rate relationships: SummaryGrowth rate relationships: Summary
The same basic principles that have applied to monthly and quarterly, and quarterly and annual average growthThe same basic principles that have applied to monthly and quarterly, and quarterly and annual average growthrates, apply to a variety of other frequencies. For example, the same dynamic exists between monthly growthrates, apply to a variety of other frequencies. For example, the same dynamic exists between monthly growthrates and annual average growth rates. In the two years being compared, there are 24 monthly growth rates. Therates and annual average growth rates. In the two years being compared, there are 24 monthly growth rates. Thegrowth rate for the first month of year 1 has no impact on the annual growth rate of year 2.growth rate for the first month of year 1 has no impact on the annual growth rate of year 2.Consequently, 23 monthly growth rates play a role in the annual growth rate. The growth rate for the first monthConsequently, 23 monthly growth rates play a role in the annual growth rate. The growth rate for the first monthof year 2 has the largest impact on annual growth, more than any other individual month. The month's impact onof year 2 has the largest impact on annual growth, more than any other individual month. The month's impact onannual growth increases incrementally from the second month in year 1 to the first month of year 2 and thenannual growth increases incrementally from the second month in year 1 to the first month of year 2 and thendeclines each month until the end of year 2.declines each month until the end of year 2.
22 3344 55 66
Statistics Canada, Catalogue no. 11-010-X 7
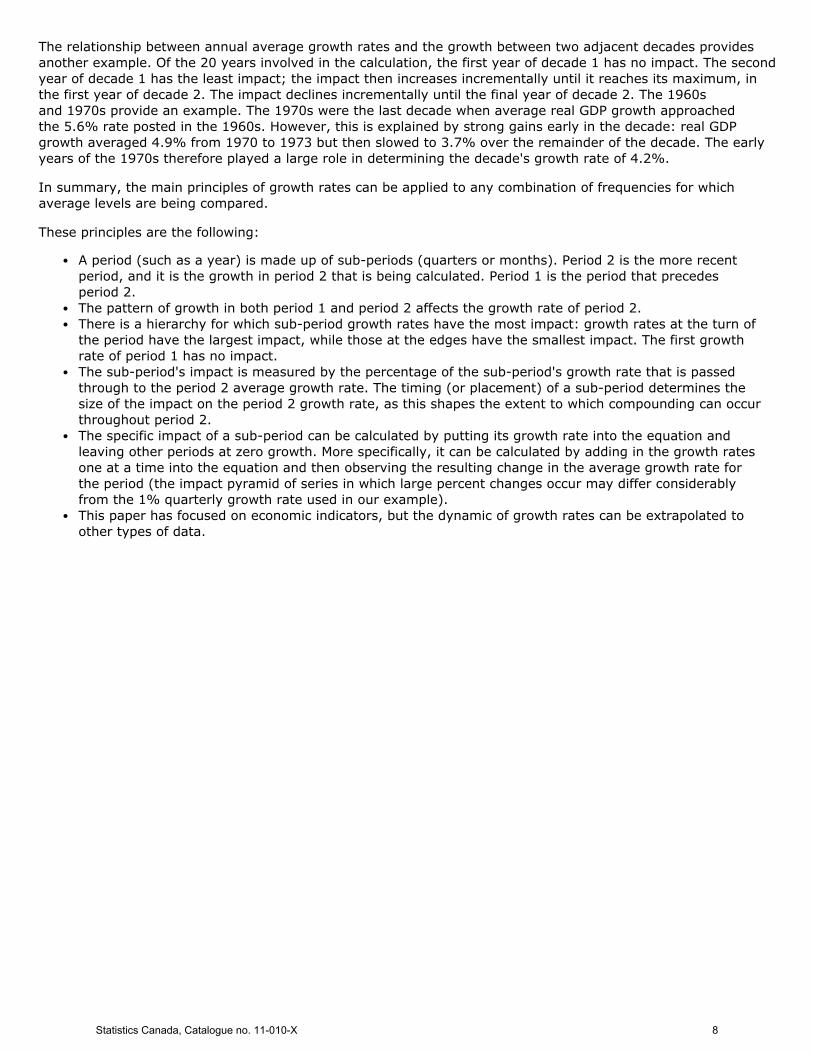
The relationship between annual average growth rates and the growth between two adjacent decades providesThe relationship between annual average growth rates and the growth between two adjacent decades providesanother example. Of the 20 years involved in the calculation, the first year of decade 1 has no impact. The secondanother example. Of the 20 years involved in the calculation, the first year of decade 1 has no impact. The secondyear of decade 1 has the least impact; the impact then increases incrementally until it reaches its maximum, inyear of decade 1 has the least impact; the impact then increases incrementally until it reaches its maximum, inthe first year of decade 2. The impact declines incrementally until the final year of decade 2. The 1960sthe first year of decade 2. The impact declines incrementally until the final year of decade 2. The 1960sand 1970s provide an example. The 1970s were the last decade when average real GDP growth approachedand 1970s provide an example. The 1970s were the last decade when average real GDP growth approachedthe 5.6% rate posted in the 1960s. However, this is explained by strong gains early in the decade: real GDPthe 5.6% rate posted in the 1960s. However, this is explained by strong gains early in the decade: real GDPgrowth averaged 4.9% from 1970 to 1973 but then slowed to 3.7% over the remainder of the decade. The earlygrowth averaged 4.9% from 1970 to 1973 but then slowed to 3.7% over the remainder of the decade. The earlyyears of the 1970s therefore played a large role in determining the decade's growth rate of 4.2%.years of the 1970s therefore played a large role in determining the decade's growth rate of 4.2%.
In summary, the main principles of growth rates can be applied to any combination of frequencies for whichIn summary, the main principles of growth rates can be applied to any combination of frequencies for whichaverage levels are being compared.average levels are being compared.
These principles are the following:These principles are the following:
A period (such as a year) is made up of sub-periods (quarters or months). Period 2 is the more recentA period (such as a year) is made up of sub-periods (quarters or months). Period 2 is the more recentperiod, and it is the growth in period 2 that is being calculated. Period 1 is the period that precedesperiod, and it is the growth in period 2 that is being calculated. Period 1 is the period that precedesperiod 2.period 2.The pattern of growth in both period 1 and period 2 affects the growth rate of period 2.The pattern of growth in both period 1 and period 2 affects the growth rate of period 2.There is a hierarchy for which sub-period growth rates have the most impact: growth rates at the turn ofThere is a hierarchy for which sub-period growth rates have the most impact: growth rates at the turn ofthe period have the largest impact, while those at the edges have the smallest impact. The first growththe period have the largest impact, while those at the edges have the smallest impact. The first growthrate of period 1 has no impact.rate of period 1 has no impact.The sub-period's impact is measured by the percentage of the sub-period's growth rate that is passedThe sub-period's impact is measured by the percentage of the sub-period's growth rate that is passedthrough to the period 2 average growth rate. The timing (or placement) of a sub-period determines thethrough to the period 2 average growth rate. The timing (or placement) of a sub-period determines thesize of the impact on the period 2 growth rate, as this shapes the extent to which compounding can occursize of the impact on the period 2 growth rate, as this shapes the extent to which compounding can occurthroughout period 2.throughout period 2.The specific impact of a sub-period can be calculated by putting its growth rate into the equation andThe specific impact of a sub-period can be calculated by putting its growth rate into the equation andleaving other periods at zero growth. More specifically, it can be calculated by adding in the growth ratesleaving other periods at zero growth. More specifically, it can be calculated by adding in the growth ratesone at a time into the equation and then observing the resulting change in the average growth rate forone at a time into the equation and then observing the resulting change in the average growth rate forthe period (the impact pyramid of series in which large percent changes occur may differ considerablythe period (the impact pyramid of series in which large percent changes occur may differ considerablyfrom the 1% quarterly growth rate used in our example).from the 1% quarterly growth rate used in our example).This paper has focused on economic indicators, but the dynamic of growth rates can be extrapolated toThis paper has focused on economic indicators, but the dynamic of growth rates can be extrapolated toother types of data.other types of data.
Statistics Canada, Catalogue no. 11-010-X 8

Current Analysis (613-951-4886). The idea for this paper came from discussions with Philip Smith, former Assistant ChiefCurrent Analysis (613-951-4886). The idea for this paper came from discussions with Philip Smith, former Assistant ChiefStatistician, Statistics Canada.Statistician, Statistics Canada.Several analysts have discussed growth rates and touched on the potential relationship between growth rates of differentSeveral analysts have discussed growth rates and touched on the potential relationship between growth rates of differentfrequencies: Stephen Gordon, Université de Laval economics professor, posted a discussion on growth rates on the Worthwhilefrequencies: Stephen Gordon, Université de Laval economics professor, posted a discussion on growth rates on the WorthwhileCanadian Initiative blog, May 3, 2009: Canadian Initiative blog, May 3, 2009: http://worthwhile.typepad.com/worthwhile_canadian_initi/2009/05/a-http://worthwhile.typepad.com/worthwhile_canadian_initi/2009/05/a-preliminary-estimate-for-canadian-2009q1-gdp-growth.htmlpreliminary-estimate-for-canadian-2009q1-gdp-growth.html. A short discussion on fourth-quarter-over-fourth-quarter. A short discussion on fourth-quarter-over-fourth-quartergrowth and annual average growth is in Gene Epstein, "The Upward Slog Continues," Barron's, March 12, 2011:growth and annual average growth is in Gene Epstein, "The Upward Slog Continues," Barron's, March 12, 2011:http://online.barrons.com/article/SB50001424052970203594204576194791734188776.html#articleTabs%3Darticlehttp://online.barrons.com/article/SB50001424052970203594204576194791734188776.html#articleTabs%3DarticleThis relationship is also alluded to in Bank of Canada, "Monetary Policy: Measuring Economic Growth"This relationship is also alluded to in Bank of Canada, "Monetary Policy: Measuring Economic Growth"((http://www.bankofcanada.ca/monetary-policy-introduction/measuring-economic-growth/http://www.bankofcanada.ca/monetary-policy-introduction/measuring-economic-growth/), and in Bruce Little "To), and in Bruce Little "Tounderstand growth figures, look to the past," The Globe and Mail,understand growth figures, look to the past," The Globe and Mail,October 8, 2001 (October 8, 2001 (https://secure.globeadvisor.com/servlet/WireFeedRedirect?https://secure.globeadvisor.com/servlet/WireFeedRedirect?cf=sglobeadvisor/config&date=20011008&slug=RAMAZ&archive=gamcf=sglobeadvisor/config&date=20011008&slug=RAMAZ&archive=gam).).Annual average growth rates can also be closely approximated as the average of the year-over-year growth rates for all fourAnnual average growth rates can also be closely approximated as the average of the year-over-year growth rates for all fourquarters (or 12 months) of the year.quarters (or 12 months) of the year.For example, annual GDP is the sum of four raw quarterly levels, and the annual CPI is the average of the twelve monthlyFor example, annual GDP is the sum of four raw quarterly levels, and the annual CPI is the average of the twelve monthlylevels.levels.The annual average growth rate and the fourth-quarter-over-fourth-quarter growth may produce the same number in a givenThe annual average growth rate and the fourth-quarter-over-fourth-quarter growth may produce the same number in a givenyear, but, in light of the different dynamics discussed in this article, it becomes evident that this is simply coincidence.year, but, in light of the different dynamics discussed in this article, it becomes evident that this is simply coincidence.The annual average growth rate of the leading indicator, in contrast, is not important as the purpose of this indicator is toThe annual average growth rate of the leading indicator, in contrast, is not important as the purpose of this indicator is toexamine short-term trends.examine short-term trends.Quarterly growth rates must be entered into the equation in the form of 1.10 for a 10% increase and 0.90 for a 10% decrease inQuarterly growth rates must be entered into the equation in the form of 1.10 for a 10% increase and 0.90 for a 10% decrease inorder for the equation to yield the annual average growth rate.order for the equation to yield the annual average growth rate.The seven relevant growth rates of 2007 and 2008 (as shown in Figure The seven relevant growth rates of 2007 and 2008 (as shown in Figure 3.33.3) are entered into the equation as follows: Annual) are entered into the equation as follows: Annualaverage growth rate average growth rate (((1.008 x 1.006 x 1.005 x 0.999) + (1.008 x 1.006 x 1.005 x 0.999 x 1.001) + (((1.008 x 1.006 x 1.005 x 0.999) + (1.008 x 1.006 x 1.005 x 0.999 x 1.001) +(1.008 x 1.006 x 1.005 x 0.999 x 1.001 x 1.002) + (1.008 x 1.006 x 1.005 x 0.999 x 1.001 x 1.002 x 0.991)) / (1+ 1.008 +(1.008 x 1.006 x 1.005 x 0.999 x 1.001 x 1.002) + (1.008 x 1.006 x 1.005 x 0.999 x 1.001 x 1.002 x 0.991)) / (1+ 1.008 +(1.008 x 1.006) + (1.008 x 1.006 x 1.005)) – 1) =1.007 = 0.7%(1.008 x 1.006) + (1.008 x 1.006 x 1.005)) – 1) =1.007 = 0.7%A second (and slightly more exact method as it reflects the effect of compounding) is to input the quarterly growth rates one atA second (and slightly more exact method as it reflects the effect of compounding) is to input the quarterly growth rates one ata time into the equation and calculate the difference in the annual average growth rate resulting from each subsequent growtha time into the equation and calculate the difference in the annual average growth rate resulting from each subsequent growthrate addition. The difference between the resulting growth rates offers a sense of how much the additional impact each quarterlyrate addition. The difference between the resulting growth rates offers a sense of how much the additional impact each quarterlygrowth rate divided by the quarters' growth rate has on the annual average growth rate. As the impact may vary slightlygrowth rate divided by the quarters' growth rate has on the annual average growth rate. As the impact may vary slightlyaccording to the growth rates in the two adjacent years, it is useful to repeat this exercise for several years to estimate theaccording to the growth rates in the two adjacent years, it is useful to repeat this exercise for several years to estimate theimpact (as measured by the pass-through rate) of each quarter on annual growth.impact (as measured by the pass-through rate) of each quarter on annual growth.When the quarterly growth rates were inputted into the equation sequentially and the difference noted, the rates of impact forWhen the quarterly growth rates were inputted into the equation sequentially and the difference noted, the rates of impact forthis hypothetical example were 25%, 50%, 75%, 101%, 77%, 52%, and 26%.this hypothetical example were 25%, 50%, 75%, 101%, 77%, 52%, and 26%.These are approximations for large percent changes, due to the asymmetric impact of large percentage changes on levels.These are approximations for large percent changes, due to the asymmetric impact of large percentage changes on levels.A 50% decrease in sales of $1000 in one month will not recover its previous level with a 50% increase in sales the followingA 50% decrease in sales of $1000 in one month will not recover its previous level with a 50% increase in sales the followingmonth. The initial 50% drop will leave sales at $500 and the 50% increase will raise sales to $750. Large percentage increasesmonth. The initial 50% drop will leave sales at $500 and the 50% increase will raise sales to $750. Large percentage increasesand decreases or alternating increases and decreases over the seven relevant quarters will show a very different impact pyramidand decreases or alternating increases and decreases over the seven relevant quarters will show a very different impact pyramidthan the 1% growth in each quarter example provided. A sequence of 25% declines, for example, leaves the last periods' levelthan the 1% growth in each quarter example provided. A sequence of 25% declines, for example, leaves the last periods' levelso low that it has almost no impact on the annual average.so low that it has almost no impact on the annual average.The share of annual average growth accounted for by the different quarters becomes less clear in cases in which quarterlyThe share of annual average growth accounted for by the different quarters becomes less clear in cases in which quarterlygrowth rates switch between positive and negative growth.growth rates switch between positive and negative growth.The magnitude of revisions for a series has an impact on the equation's calculations of annual average growth rate. RevisionsThe magnitude of revisions for a series has an impact on the equation's calculations of annual average growth rate. Revisionscan alter the monthly or quarterly growth rates and therefore have a large impact on the annual average growth rate, accordingcan alter the monthly or quarterly growth rates and therefore have a large impact on the annual average growth rate, accordingto the months or quarters in which the revisions are concentrated. The equation can be useful, however, in determining how theto the months or quarters in which the revisions are concentrated. The equation can be useful, however, in determining how thequarterly revisions affected the annual average growth rate.quarterly revisions affected the annual average growth rate.
NotesNotes
Statistics CanadaStatistics Canada
1.1.
2.2.
3.3.
4.4.
5.5.
6.6.
7.7.
8.8.
2008 =2008 =
9.9.
10.10.
11.11.
12.12.
13.13.
Statistics Canada, Catalogue no. 11-010-X 9

Chart 3.1Chart 3.1 Consumer price indexConsumer price index
Statistics CanadaStatistics Canada
Statistics Canada, Catalogue no. 11-010-X 10

Chart 3.2Chart 3.2 Industry salesIndustry sales
Statistics CanadaStatistics Canada
Statistics Canada, Catalogue no. 11-010-X 11

Chart 3.3Chart 3.3 Real GDPReal GDP
Note(s): Note(s): ( ) equals quarterly growth rate. ( ) equals quarterly growth rate.
Statistics CanadaStatistics Canada
Statistics Canada, Catalogue no. 11-010-X 12
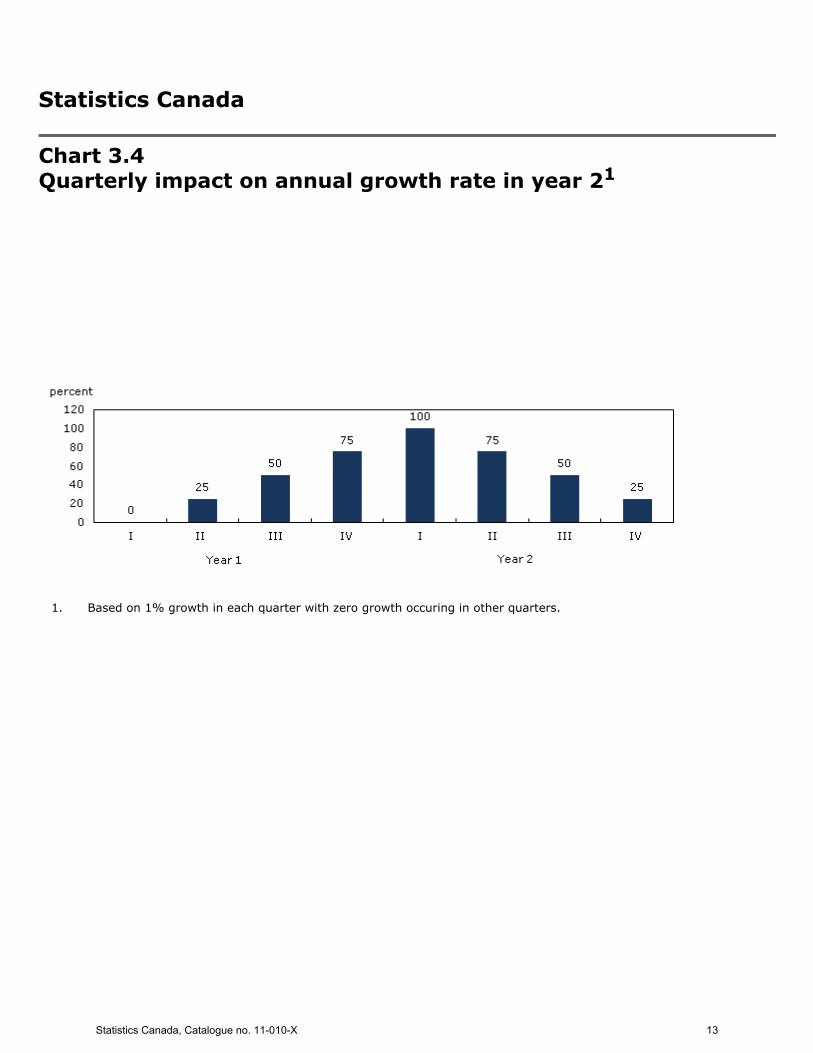
1.1. Based on 1% growth in each quarter with zero growth occuring in other quarters.Based on 1% growth in each quarter with zero growth occuring in other quarters.
Chart 3.4Chart 3.4 Quarterly impact on annual growth rate in year 2Quarterly impact on annual growth rate in year 2
Statistics CanadaStatistics Canada
11
Statistics Canada, Catalogue no. 11-010-X 13

1.1. Based on 1% growth added to each quarter in succession.Based on 1% growth added to each quarter in succession.
Chart 3.5Chart 3.5 Individual and cumulative share of annual growth rateIndividual and cumulative share of annual growth rateaccounted for by specific quartersaccounted for by specific quarters
Statistics CanadaStatistics Canada
11
Statistics Canada, Catalogue no. 11-010-X 14

1.1. Based on 1% growth in each month with zero growth occuring in other months.Based on 1% growth in each month with zero growth occuring in other months.
Chart 3.6Chart 3.6 Monthly impact on quarterly growth rateMonthly impact on quarterly growth rate
Statistics CanadaStatistics Canada
11
Statistics Canada, Catalogue no. 11-010-X 15

1.1. Based on 1% growth added to each month in succession.Based on 1% growth added to each month in succession.
Chart 3.7Chart 3.7 Individual and cumulative share of quarterly growth rateIndividual and cumulative share of quarterly growth rateaccounted for by specific monthsaccounted for by specific months
Statistics CanadaStatistics Canada
11
Statistics Canada, Catalogue no. 11-010-X 16

Chart 3.8Chart 3.8 Industry sales, scenario 1Industry sales, scenario 1
Statistics CanadaStatistics Canada
Statistics Canada, Catalogue no. 11-010-X 17

Chart 3.9Chart 3.9 Industry sales, scenario 2Industry sales, scenario 2
Statistics CanadaStatistics Canada
Statistics Canada, Catalogue no. 11-010-X 18

Note(s):Note(s):
Text table Text table 3.13.1 Impact of quarterly growth on annual average growthImpact of quarterly growth on annual average growth
QuartersQuarters Average annual growth rate inAverage annual growth rate inyear 2year 211 22 33 44 55 66 77 88
percentpercentScenario of 1% growthScenario of 1% growthfor:for:
g1g1 11 00 00 00 00 00 00 00 0.000.00g2g2 00 11 00 00 00 00 00 00 0.250.25g3g3 00 00 11 00 00 00 00 00 0.500.50g4g4 00 00 00 11 00 00 00 00 0.750.75g5g5 00 00 00 00 11 00 00 00 1.001.00g6g6 00 00 00 00 00 11 00 00 0.750.75g7g7 00 00 00 00 00 00 11 00 0.500.50g8g8 00 00 00 00 00 00 00 11 0.250.25
g stands for growth.g stands for growth.
Statistics CanadaStatistics Canada
Statistics Canada, Catalogue no. 11-010-X 19

Note(s):Note(s):
Text table Text table 3.23.2 Share of annual average growth accounted for by quarterShare of annual average growth accounted for by quarter
QuartersQuarters AnnualAnnual
growthgrowthrate forrate for
year 2year 2
IndividualIndividualquarter share ofquarter share of
annual growthannual growthraterate
Cumulative shareCumulative shareof quarters inof quarters in
annual growthannual growthraterate11 22 33 44 55 66 77 88
percentpercent
ScenarioScenarioof 1%of 1%growth for:growth for:
g1g1 11 00 00 00 00 00 00 00 0.000.00 00g1 and g2g1 and g2 11 11 00 00 00 00 00 00 0.250.25 66 66g2 and g3g2 and g3 11 11 11 00 00 00 00 00 0.750.75 1212 1818g2, g3 and g4g2, g3 and g4 11 11 11 11 00 00 00 00 1.501.50 1919 3737g2, g3,g2, g3,g4 and g5g4 and g5
11 11 11 11 11 00 00 00 2.502.50 2525 6262
g2, g3, g4,g2, g3, g4,g5 and g6g5 and g6
11 11 11 11 11 11 00 00 3.283.28 1919 8181
g2, g3, g4,g2, g3, g4,g5, g6 and g7g5, g6 and g7
11 11 11 11 11 11 11 00 3.803.80 1313 9494
g2, g3, g4,g2, g3, g4,g5, g6,g5, g6,g7 and g8g7 and g8
11 11 11 11 11 11 11 11 4.064.06 66 100100
g stands for growth.g stands for growth.
Statistics CanadaStatistics Canada
Statistics Canada, Catalogue no. 11-010-X 20


![[Entry/Exit] Standard Capacity Contract for [Monthly ...Entry/Exit] Standard . Capacity Contract . for [Monthly/Quarterly/Yearly] Capacity Products . Published on 29.12.2016 ([Code](https://img.dokumen.tips/doc/110x75/5b2a3ff27f8b9a44468b45c9/entryexit-standard-capacity-contract-for-monthly-entryexit-standard-.jpg)


