Embed Size (px)
Citation preview

Doing things better!
Annual Report, 2017-18

Forward-looking statement This document contains statements about expected future events and financial and operating results of UPL, which are forward-looking. By their nature, forward-looking statements require the Company to make assumptions and are subject to inherent risks and uncertainties. There is significant risk that the assumptions, predictions and other forward-looking statements will not prove to be accurate. Readers are cautioned not to place undue reliance on forward-looking statements as a number of factors could cause assumptions, actual future results and events to differ materially from those expressed in the forward-looking statements. Accordingly, this document is subject to the disclaimer and qualified in its entirety by the assumptions, qualifications and risk factors referred to in the management’s discussion and analysis of the UPL Annual Report 2017-18.
Financial performance, 2017-18Particulars FiguresRevenue (H crore) 17,920EBITDA (H crore) 3,920Net profit (H crore) 2,022EBITDA margin (%) 21.9Net profit margin (%) 11.3Cash profit (H crore) 2,980ROCE (%) 23.4Enterprise value (H crore) 40,937Earnings per share (H) 39.79Promoter’s holding (%) 27.72Institutional holding (%) 50.64Market capitalisation (H crore) 37,131

Inside the document
5
Highlights, 2017-18
22
Chairman’s overview
5752
Management discussion and analysis
Business Review
68
Corporate information
230
Consolidated fi nancial statements
6
6 things you need to know about UPL
14UPL’s business addresses diet-critical products. Enhancing food security.
16 18UPL. Present where customers are. Resulting in a wide global footprint.
UPL. Consistently outperforming. Enriching farmers. Enhancing stakeholder value.
26
7869
160
CEO’s business review
Directors’ reportNotice
Standalone fi nancial statements
30
Our seven business priorities
48How we run our business: The UPL business model explained
8What we have achieved over the last fi ve decades
46How UPL has addressed a moving goalpost


‘DOING THINGS BETTER’.
More than a phrase, a philosophy instead.
Not just enunciated. But lived as well.
Helping develop faster. Expand effi ciently.
Widen portfolio. Optimise costs.
Secure resources. Market deeper.
Trade responsibly. Enhance value.
Enrich stakeholders.
Addressing everything.

When the global crop protection chemicals industry passed through one of its most challenging phases, it would have been
reasonable to seek growth cues from the marketplace.
At UPL, we sought our cues from within.
We expanded existing downstream capacities; we built new plants in India and Brazil.
We commissioned capacities to manufacture key raw materials
The result is in our outperformance.
We invested within to increase operating effi ciency
UPL. Outperformer
UPL Limited Annual Report, 2017-18 4

UPL GREW
7%REINFORCING
ITS POSITION AS ONE OF THE MOST EXCITING GENERIC CROP PROTECTION
CHEMICALS COMPANIES.
WE ENHANCED CONSUMER CHOICE; LAUNCHED
101PRODUCTS
WE STRENGTHENED THE PIPELINE
FILED
247PRODUCT REGISTRATIONS
AND
169PATENTS
THE GLOBAL CROP PROTECTION CHEMICALS
INDUSTRY GREW
0.2% IN 2017
Highlights, 2017-18
Overview
Strategyreview Performance Governance Financials
5

6 things you need to know about UPL
1The Company is led by visionary invested promoters. The Company was founded by Mr. Rajju Shroff in the late Sixties, who is an industry statesman. The promoters invested ahead of the curve, built large and integrated capacities, generating economies of scale at one end and manufacturing economies at the other. The result is that UPL did not just emerge as India’s largest crop protection chemicals company but one of the fastest growing in the global crop protection chemicals sector. The Company is actively managed by Jai Shroff , Global CEO, and a team of competent professionals.
Promoters
3UPL has graduated from crop protection chemicals into a complete agro solutions provider (seeds, crop protection chemicals, biologicals, soil nutrients and post-harvest solutions). The Company’s product basket comprises off erings for multiple crops, fruits and vegetables, insulating from an excessive dependence on any one segment. The Company is the second largest post-patent global player in the crop protection market. Its broad portfolio addresses >10 major crop sectors. Its product range addresses crops with relevance across seasons, de-risking it from seasonality.
Products
2UPL (incorporated in 1969) commenced with the manufacture of phosphorous-based industrial chemicals. Between 1980 and 2000, it diversifi ed into crop protection chemicals and specialty chemicals. Between 2000 and 2018, it transformed itself from a local to global player with more than 25 international acquisitions. The core of the Company’s product selection has centred around products enjoying robust demand even after going off -patent. UPL markets products in 130+ countries.
Global presence
UPL in numbers
2ndGLOBAL RANKING AS
A POST-PATENT CROP PROTECTION CHEMICALS
COMPANY
35NUMBER OF
MANUFACTURING FACILITIES
130+NUMBER OF COUNTRIES IN WHICH THE COMPANY
SELLS ITS PRODUCTS
7,435NUMBER
OF GLOBAL EMPLOYEES
UPL Limited Annual Report, 2017-18 6

4Over the years, UPL has grown its share in whichever market it has selected to be present in. This has been a result of a keen ground-level understanding of farm realities, recognising market gaps, launching relevant products around superior price-value and enhancing farm viability. The result is that the Company accounts for a 14.3% share of India’s organised crop protection chemicals sector, the largest market for the Company.
Growing market share
5UPL’s growth has been driven by brands that have enhanced farmer trust. These brands have delivered the following attributes: enhanced eff ectiveness in line with desired objectives, reinforced farm viability, strengthened functional ease and evolved from a product into a friend. The eff ectiveness has been refl ected in multi-year growth from these brands and a disproportionate share of markets.
Confi dence-enhancing brands
6UPL has been driven by over-arching values, enhancing organisational and stakeholder clarity.Driven by
values
Vision: To be a world-class organisation by enhancing value for customers and other stakeholders, by caring for employees to inspire their engagement as a motivated team in an open and learning environment, by setting new performance standards and by focusing on total quality control, innovation and responsive care towards the environment.
Mission: Manufacturing and supplying crop protection and specialty chemicals worldwide, by providing solutions to optimise farm productivity for the farmer through innovative and cost-eff ective products, to provide the customer with better value for money.
6,181NUMBER OF PRODUCT
REGISTRATIONS ACROSS COUNTRIES
241NUMBER OF PATENTS
AWARDED TO THE COMPANY
25+ACQUISITIONS IN MORE
THAN TWO DECADES
Overview
Strategyreview Performance Governance Financials
7

2010 Leveraged the global sales
and marketing network for the rice segment with the acquisition of RiceCo Diversifi ed into the Manzate
fungicide business via dedicated manufacturing facilities
2012 Acquired DVA Agro and
SIB in Brazil to access the Brazilian market
2014 Crossed H100 billion in
revenues Introduced Unizeb Gold
1969 Started
manufacturing red phosphorus
1976 Entered the crop
protection chemicals sector Started exporting
products
1980 Started production
of yellow phosphorus at Ankleshwar
1994 Acquired the
UK-based MTM Agrochemical to gain access to the European herbicides market Commenced
operations at the Jhagadia plant, UPL’s largest manufacturing site with a cumulative capacity of 240,000 metric tonnes per annum
What we have achieved
UPL Limited Annual Report, 2017-18 8

2016 Crossed USD 2 billion in
revenues Crossed 5,000 mark in
registrations Merged with Advanta
2017 Issued bonds of USD500
million from an overseas subsidiary – UPL Corporation, under Rule 144A and Regulation S with an Investment Grade rating from Moody’s, S&P and Fitch
2018 Issued bonds of
USD300 million from an overseas subsidiary - UPL Corporation, under Regulation S with an Investment Grade rating from S&P and Fitch
1996 Acquired Devrinol
to gain access into the American, Japanese and rest of the world markets Operationalised
a caustic chlorine manufacturing plant
2005 Acquired SWAL
to bolster scale and distribution effi ciency in India Registered the fi rst
EMR (Saaf)
2006 Acquired Reposo to
access the Argentina market Acquired Advanta to
foray into the seeds business
2007 Acquired Cerexagri
to enhance global revenues
across the last fi ve decades
Overview
Strategyreview Performance Governance Financials
9

The contrarian world of UPL.
1. It would have been easy focusing on India, one of the largest agricultural economies globally. We widened our footprint instead.
2. It would have been simpler focusing on one large crop segment. We selected to focus on a diversifi ed basket instead.
FY 19940
10
20
30
40
50
Insecticides 52% Others 48%
FY20030
10
20
30
40
50
Insecticides 44% Herbicides 24% Fungicides 5% Others 27%
3. UPL could have focused its attention on one segment of the product basket. We widened our attention across a range of the business, emerging as a broad-based company across the value-chain instead.
Geography-wise performance
Region Latin America
India North America
Europe Rest of the World
Sales (H crore) 5,692 3,189 3,083 2,305 3,109
Human resources 1,155 4,784 291 479 726
Product registrations 1,455 940 363 1,460 1,963
UPL Limited Annual Report, 2017-18 10

Doing things better.
4. It would have been easier investing our resources across a handful of brands, deepening our presence through them. We widened our basket instead, moderating an excessive dependence on few brands.
Key brands across geographies
Latin America India North America Europe Rest of the WorldManzate, Vondozeb, Unizeb, Lancer, Quickphos, Unizeb Gold, Clorin, Zartan, Danado, Imida Gold, Lancer Gold and Glory
Ulala, Phoskill, Lancer Gold, Saaf, Saathi, Starthene, Atabron, Dissect, Wuxal, Avancer Glow, Cuprofi x, Iris, Lagam, Eros and Patela
Manzate, Microthiol, Cuprofi x, Weevilcide, Super Tin, Blazer, Surfl an, Tricor and Banter
Devrinol, Microthiol, Penncozeb, Cuprofi x, Metafol and Beet Up
Penncozeb, Kinalux, Quickphos, Microthiol, Vondozeb, Ulala and Asulox
FY20090
10
20
30
40
50
Insecticides 28% Herbicides 21% Fungicides 33% Others 18%
FY20140
10
20
30
40
50
Insecticides 28% Herbicides 27% Fungicides 25% Others 20%
FY20180
10
20
30
40
50
Insecticides 25% Herbicides 29% Fungicides 26% Others 11% Seeds 9%
FY14 25% FY18 87%
Consistent increase in share of branded product sales
Overview
Strategyreview Performance Governance Financials
11

UPL’s business comprises a complete agro-solution. It is more than a company; it is an integrated solutions provider
UPL Limited Annual Report, 2017-18 12

Seeds Herbicides Insecticides Fungicides Fumigants and storage
Specialty post-harvest product
Primary use Provide added value to farmers through superior genetics
Prevent or reduce weeds, which hamper crop growth and harvest
Control insect pests, which reduce crop yields and quality
Prevent and cure fungal plant diseases
Pest control in warehouses
Technical applications like special coatings
Key products Sorghum, Corn, Canola, Sunfl ower, Vegetables
Propanil, Metribuzin, Glufosinate, Pendimethalin, S-Metolachlor, Asulam
Acephate, Imidacloprid, Bifenazate, Flonicamid, Bifenthrin
Mancozeb, Copper, Sulphur
Aluminum Phosphide (ALP) Magnesium Phosphide
Natural coatings CIPC
Key brands Advanta, Alta, Pacifi c, Golden, Nutrisun
Stam, Devrinol Tricor, Fascinate, Lifeline, Satellite, Lagaam, Saathi, Moccasin, Eros Gold, Asulox
Lancer Gold, Ulala, Phoskill, Batus Gold, Banter, Sperto, Perito
Manzate, Vondozeb, Microthial, Unizeb Gold, Glory, BB20, TBCS40, Saaf, Elixir, Triziman, Tridium
Weevilcide, Quickphos
Oorja
Seed and seed treatment
Crop protection
Storage solutions
Post-harvest
Innovation rate
FY2013-14
2.5%FY2014-15
5%FY2015-16
14%FY2016-17
15%FY2017-18
19%• Ulala• Atabron• Acephate 97 DF
• Iris• Eros
• Unizeb Gold• Glory• Lifeline• Satellite• Interline
• Elixir• Banter• Avancer Gold• Moccasin• Wuxal
• Tripzin• Moccasin• Sperto• Triziman• Macarena• Gainexa FC
Overview
Strategyreview Performance Governance Financials
13

UPL’s business addresses diet-critical products. Enhancing food security. RiceA USD 5.2 billion global opportunity
Insecticide Fungicide Herbicide
Sucking Pest
Black Bug / Stink
Bug / Leaf Folder
Stem Borer
Blast
Counter Plus • UlalaLancer • Imida Gold
Lancer Gold • Buprolord
UstaadChix, Akito
Invade • Disect
KaardonUniproDimpoLancer
Umet
SamarPinnacle
Uthane • SaafCuprofi x
Cougar Conquer PlusGlory
Stam • StampyrSatellite Plus
Holdown • SathiEros • Eros gold
Pre Emergence
Post Emergence
Sheath Blight
Leaf Spot
WheatA USD 8.7 billion global opportunity
Insecticide Fungicide Herbicide
Sucking Pest
Lepidopteran Pest
Rust
Phoskill
Uniron
Manzate
Avancer Glow
Dost
TotalVestaShagunFirmup
Lifeline / Fascinate / Tarang
Septoria Leaf spot
Pre Emergence
Post Emergence
Chemical fallow / Burn down /
Pre-sowing
CornA USD 5.8 billion global opportunity
Insecticide Fungicide Herbicide
Sucking Pest
Thrips
Maize Rust
White Spot
Leaf Blight
Chemical Fallow
Post Emergence
Post Emergence - GT Corn
Pre-emergence
Lepidopteran
Ulala • Lancer goldPhoskill
Lancer GoldPhoskill
Invade • SpolitAtabron • Uniron
Lance • BisectPulsar / Pulsar
Gold
Uthane
Glory
GloryLifeline Fascinate
MotifMoccasin
InterlineTarangLifeline GTInter MOC
StrimMoccasinCoyote
CottonA USD 1.6 billion global opportunity
Insecticide Fungicide Herbicide
Aphid Assid
Thrips
Whitterfl y
LepidopteraAlternaria
Grey Mildew
Post Emergence - GT Cotton
Pre Emergence
Invade • SpolitAtabron • UnironGlory
Glory
InterlineInter MOC
Ulala • Lancer GoldPhoskill
Lancer GoldPhoskill
Lancer GoldPhoskill
BattusPerito
Dost SuperSatellite
UPL Limited Annual Report, 2017-18 14

SoybeanA USD 8.2 billion global opportunity
Insecticide Fungicide Herbicide
Lepidopteran
Coleopteran
Sucking Pest
Leaf Spot
Rust
Chemical Fallow
Post Emergence
Post Emergence
- Gt Soybean
Pre Emergence
Phoskill • Invade • Atabron Bisect • Uniron
Pulsar / Pulsar Gold
Phoskill
UlalaPeritoBattus
Unizeb Glory
Unizeb GloryUnizeb Gold
Strim • Mocassin • UnimarkSatellite • Shutdown MTZMoccasin MTZTripzin ZC
LifelineFascinateLifeline GT
TricorUltrablazerStormGalaxyInter MOC
Interline
PotatoA USD 1.5 billion global opportunity
Insecticide Fungicide Herbicide
Lepidopteran
Sucking Pest
Early Blight
Late Blight
Black Scurf
Post Emergence
Pre Emergence
Atabron
SaafGlory
PulsarElixir
Pulsar
Unimark • TricorAvert • Shagun
Dost Super Satellite
Vine A USD 1.6 billion global opportunity
Insecticide Fungicide Herbicide
Lepidopteran
Sucking Pest
Mites
Angular Leaf Spot / Downy Mildew /
Anthracnose
Post Emergence
Pre Emergence
Atabron
Banter
SaafUthane
Lifeline
SatelliteDevrinol
SugarcaneA USD 1.3 billion global opportunity
Insecticide Herbicide
Soil Pests
Sucking Pest
Post Emergence
Pre Emergence
Imida Gold
RenovaImida GoldAsulox
UpstageUnipik
Overview
Strategyreview Performance Governance Financials
15

UPL. Present where customers are. Resulting in a wide global footprint.
UPL Limited Annual Report, 2017-18 16

India 16
Argentina 3
Brazil 1
Colombia 1
France 3
Italy 1
Netherlands 2
China 1
Turkey 1
UK 1
USA 2
Vietnam 1
Australia 1
Thailand 1
Manufacturing locations
Overview
Strategyreview Performance Governance Financials
17

UPL. Consistently outperforming. Enriching farmers. Enhancing stakeholder value.
10,9
02 12,0
88
14,6
60
17,12
4
17,9
20
2013
-14
2014
-15
2015
-16
2016
-17
2017
-18
Revenues (H crore)
Defi nitionRevenues (including Other Income)Why is this measured?To measure the Company’s ability in comprehending global demand trends, enhancing supply chain effi ciency and strengthening product acceptance What does it mean?Aggregate sales increased by 5% to reach H17,920 crore in FY2017-18 due to increasing demand for existing products and strategic launch of new ones. Value impactImproved product off take and enhanced the Company’s sectoral reputation.
2013
-14
2014
-15
2015
-16
2016
-17
2017
-18
2,15
1 2,36
0 2,71
1
3,42
9 3,92
0
EBITDA (H crore)
Defi nitionEarning (including other income) before the deduction of fi xed expenses (interest, depreciation, extraordinary items and tax)Why is this measured?It is an index that showcases the Company’s ability to optimise operating costs despite infl ationary pressures and can be easily compared with sectoral peers. What does it mean?Helps create a robust growth engine and allows the Company to build profi ts in a sustainable manner. Value impactThe Company’s EBIDTA grew every single year through the last 5 years. The Company reported a 14% increase in its EBIDTA in FY2017-18 – an outcome of painstaking eff orts in improving operational effi ciency.
2013
-14
2014
-15
2015
-16
2016
-17
2017
-18
Net profi t (H crore)
950 1,1
44
940
1,727
2,02
2
Defi nitionProfi t earned during the year after deducting all expenses and provisionsWhy is this measured?It highlights the strength in the business model in generating value for its shareholders. What does it mean?Ensures that adequate cash is available for reinvestment and allows the Company’s growth engine to sustain. Value impactThe Company reported a 17% increase in its net profi t in FY2017-18 – refl ecting the robustness and resilience of the business model in growing shareholder value despite external vagaries.
UPL Limited Annual Report, 2017-18 18

2013
-14
2014
-15
2015
-16
2016
-17
2017
-18
EBIDTA margin (%)
19.7%
19.5%
18.5% 20
.0% 21.9
%
Defi nition EBITDA margin is a profi tability ratio used to measure a company’s pricing strategy and operating effi ciencyWhy is this measured?The EBIDTA margin gives an idea of how much a company earns (before accounting for depreciation, amortisation interest and taxes) on each rupee of sales. What does it mean?Demonstrates adequate buff er in the business, which, when multiplied by scale, enhances surpluses.Value impactThe Company reported a 185 bps increase in EBIDTA margin during FY2017-18.
Defi nitionIt is a fi nancial ratio that measures a company’s profi tability and the effi ciency with which its capital is employed in the businessWhy is this measured?ROCE is a useful metric for comparing profi tability across companies based on the amount of capital they use – especially in capital-intensive sectors.What does it mean?Enhanced ROCE can potentially drive valuations and perception.Value impactThe Company reported a 23 bps increase/in ROCE during FY2017-18.
2013
-14
2014
-15
2015
-16
2016
-17
2017
-18
ROCE (%)
18.9
%
19.6
%
18.0
%
23.2
%
23.4
%
Defi nitionThis is derived through the ratio of net debt to net worth (less revaluation reserves)Why is this measured?This is one of the defi ning measures of a company’s fi nancial health, indicating the ability of the Company to remunerate shareholders over debt providers (the lower the gearing the better). In turn, it indicates the ability of the Company to sustain growth in profi ts, margins and shareholder value.What does it mean?Adds value in the hands of the shareholders by keeping the equity side constant and boosts fl exibility by progressively moderating debt costs. Value impactThe Company’s gearing stood at 0.42 in FY2017-18 compared to 0.47 in FY2016-17. This ratio should ideally be read in conjunction with net debt/operating profi t (a reduction indicating greater ease in terms of servicing debt).
2013
-14
2014
-15
2015
-16
2016
-17
2017
-18
Gearing (x)
0.44
0.40
0.69
0.47
0.42
Defi nitionThis is derived through the division of EBIDTA by interest outfl owWhy is this measured?Interest cover indicates the Company’s comfort in servicing interest – the higher the better. What does it mean?A company’s ability to meet its interest obligations, an aspect of its solvency, is arguably one of the most important factors in guaranteeing sizeable returns to shareholders. Value impactThe Company strengthened its interest cover from 6.82 in FY2016-17 to 8.23 in FY2017-18.
2013
-14
2014
-15
2015
-16
2016
-17
2017
-18
Interest cover (x)
7.19 7.8
2
6.09
6.82
8.23
Overview
Strategyreview Performance Governance Financials
19

UPL’s outlook appears as relevant as when the Company started out in the late Sixties
(Source: FAO, Agrivi, Statista, IBEF, World Bank, Economic Times)
India attractively placed • The world’s fourth-largest producer of crop protection chemicals• India’s crop protection chemicals market estimated at USD 7.5 billion by FY19 (exports ~50% of revenues)• Emerged as one of the largest crop protection chemical exporters (2015)
Finite arable area• 48.93 million square kilometres of available global agricultural land • Of the total land area across the world, 37.51% is fi t for agriculture• ~10.92% of the total land across the globe is cultivated • Arable land per person across the globe stood at 0.1954 hectares
Increasing incomes• Rising farmers’ income and their aff ordability for crop protection chemicals• Demand for processed food rising concurrently with growing disposable incomes, urbanisation and nuclear families • Per capita incomes in India expected to expand at a CAGR of 8.09% till 2019
More mouths to feed• Projected global population of 9.8 billion in 2050, up by 31% from 7.5 billion • ~84.21 million people being annually added to the global population • 4x global population growth over the last century• 1.09% global population growth in 2018 • India’s projected population of 1.67 billion by 2067 (1.34 bn today)
India dependent on agriculture • The largest producer of spices, pulses, milk, tea, cashew and jute• The second-largest producer of wheat, rice, fruits and vegetables, sugarcane, cotton, oilseeds, fruits and vegetables• Accounts for the second-largest agricultural land in the world (157.35 million hectares)• ~285 new irrigation projects to be undertaken in 2018 to provide irrigation across 18.8 million hectares
India’s food security at stake• India loses 15-25% of its crop output due to pests, weeds and diseases• Demand for cereals is projected to reach ~3 billion tonnes by 2050 (2.1 billion tonnes today)• Global food production will need to increase 70% to feed India in 2050• Annual cereal production would need to grow by almost a billion tonnes by 2050• Food production levels in developing countries would need to almost double by 2050
UPL Limited Annual Report, 2017-18 20

Overview
Strategyreview Performance Governance Financials
21

More than a mantra at UPL. It is a way of life showcased in workplace every single day
‘Doing things better’.
A number of people have attempted to examine the reasons behind our sustained outperformance even when we are not an inventor. Th e answer comes down to a simple reality: we do things others do not or cannot; we do things better.
Dear shareholders,
The year 2018 marked the completion of our 49th year. As we embark on the 50th year, I must reiterate that UPL continues to stand for what it had always stood for in the past: Doing things better.
‘Doing things better’ is more than a mantra at UPL; it is something that we live every single day. We engage in R&D to off er innovative and eff ective products, we produce cost-eff ectively, we are engaged continuously in widening markets, we focus on enhancing profi tability, we mitigate business risks and, in doing all there, we help enhance food security for the world.
A number of people have attempted to examine the reasons behind our sustained outperformance even when we are not an inventor. The answer comes down to a simple
reality: we do things others do not or cannot; we do things better.
Even as we have not been product inventors, UPL did something contrarian: the Company continued to invest signifi cantly in its research and development. The Company invests 2.2% of its revenues on research; even as we are not an inventor of products, we are a research-driven Company on how products can be evolved and adapted to diverse customer needs the world over. This research-driven last mile focus has helped widen our brand portfolio and strengthened our understanding of how eff ectively to plug market gaps. The eff ectiveness is not only derived from the quantum of research spending; it is also derived from the eff ectiveness of our research systems. Our research and development eff orts are focused
UPL Limited Annual Report, 2017-18 22
Chairman’s overview

Overview
Strategyreview Performance Governance Financials
23
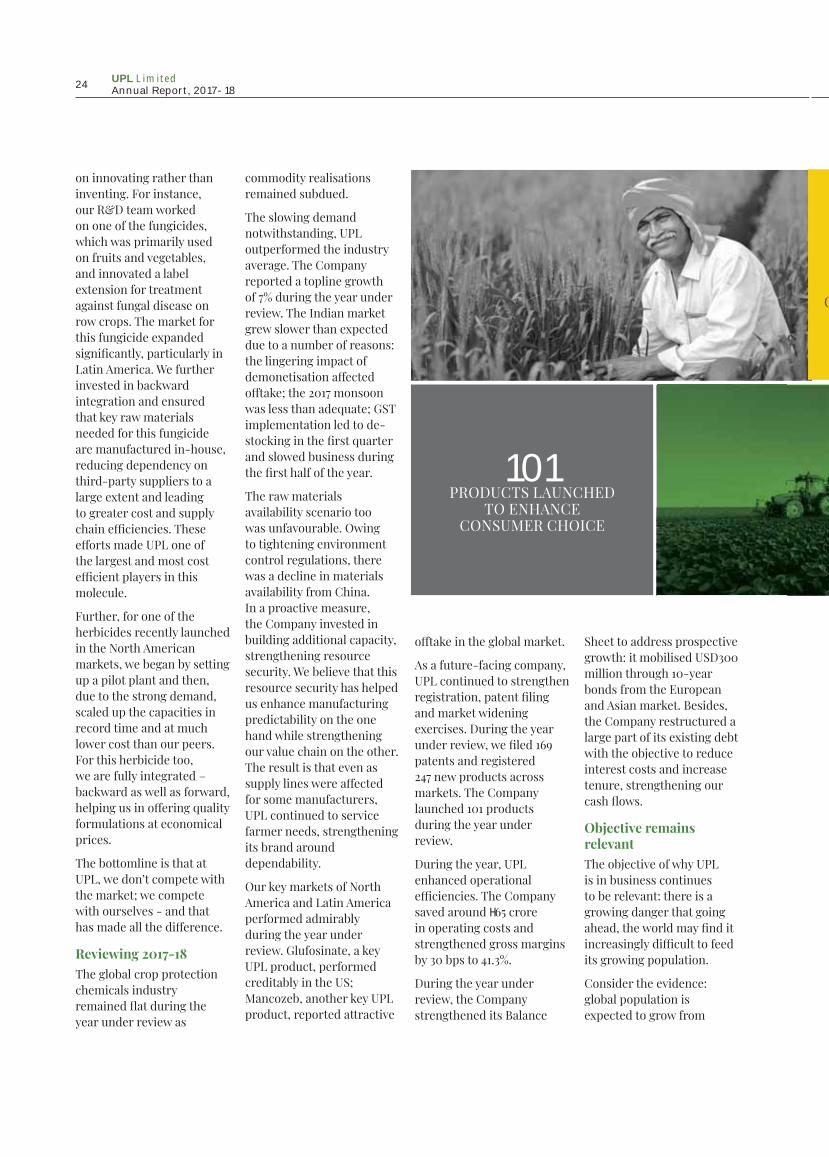
on innovating rather than inventing. For instance, our R&D team worked on one of the fungicides, which was primarily used on fruits and vegetables, and innovated a label extension for treatment against fungal disease on row crops. The market for this fungicide expanded signifi cantly, particularly in Latin America. We further invested in backward integration and ensured that key raw materials needed for this fungicide are manufactured in-house, reducing dependency on third-party suppliers to a large extent and leading to greater cost and supply chain effi ciencies. These eff orts made UPL one of the largest and most cost effi cient players in this molecule.
Further, for one of the herbicides recently launched in the North American markets, we began by setting up a pilot plant and then, due to the strong demand, scaled up the capacities in record time and at much lower cost than our peers. For this herbicide too, we are fully integrated – backward as well as forward, helping us in off ering quality formulations at economical prices.
The bottomline is that at UPL, we don’t compete with the market; we compete with ourselves - and that has made all the diff erence.
Reviewing 2017-18 The global crop protection chemicals industry remained fl at during the year under review as
commodity realisations remained subdued.
The slowing demand notwithstanding, UPL outperformed the industry average. The Company reported a topline growth of 7% during the year under review. The Indian market grew slower than expected due to a number of reasons: the lingering impact of demonetisation aff ected off take; the 2017 monsoon was less than adequate; GST implementation led to de-stocking in the fi rst quarter and slowed business during the fi rst half of the year.
The raw materials availability scenario too was unfavourable. Owing to tightening environment control regulations, there was a decline in materials availability from China. In a proactive measure, the Company invested in building additional capacity, strengthening resource security. We believe that this resource security has helped us enhance manufacturing predictability on the one hand while strengthening our value chain on the other. The result is that even as supply lines were aff ected for some manufacturers, UPL continued to service farmer needs, strengthening its brand around dependability.
Our key markets of North America and Latin America performed admirably during the year under review. Glufosinate, a key UPL product, performed creditably in the US; Mancozeb, another key UPL product, reported attractive
off take in the global market.
As a future-facing company, UPL continued to strengthen registration, patent fi ling and market widening exercises. During the year under review, we fi led 169 patents and registered 247 new products across markets. The Company launched 101 products during the year under review.
During the year, UPL enhanced operational effi ciencies. The Company saved around H65 crore in operating costs and strengthened gross margins by 30 bps to 41.3%.
During the year under review, the Company strengthened its Balance
Sheet to address prospective growth: it mobilised USD300 million through 10-year bonds from the European and Asian market. Besides, the Company restructured a large part of its existing debt with the objective to reduce interest costs and increase tenure, strengthening our cash fl ows.
Objective remains relevant The objective of why UPL is in business continues to be relevant: there is a growing danger that going ahead, the world may fi nd it increasingly diffi cult to feed its growing population.
Consider the evidence: global population is expected to grow from
101 PRODUCTS LAUNCHED
TO ENHANCE CONSUMER CHOICE
C
UPL Limited Annual Report, 2017-18 24

7.5 billion to 9.8 billion by 2050, requiring the world to produce at least 70% more food, when one factors the plugging of prevailing and prospective gaps.
Even as this reality is by itself daunting, there are concerns of fi nite arable area, plateauing yields and climate change impacting agricultural productivity. With emerging economies entering an era of unprecedented economic prosperity, there is a gradual shift in dietary preferences. More people are consuming dairy and poultry products, increasing fodder demand.
Even as this is already placing a larger pressure on arable land, the reality is that the world is losing a substantial crop quantity in pre-harvest and post-harvest losses owing to pest attacks. In India, ~15-25% of the potential crop output is lost on this count.
UPL optimism UPL is the right company at the right time.
The Company continues to work in the pre-harvest and post-harvest spaces, helping protect a sizeable crop output. The Company’s wide products range covers the entire crop cycle, protecting farm viability. The Company extended its business model beyond core products to solutions, providing customers allied services (crop protection chemicals spraying, price trends and ancillary products supply). The Company also off ers innovative products that help conserve ground water, particularly relevant in
drought conditions.
UPL’s advantage lies in its deep product chemistry competence. The Company invested proactively to build expertise, resulting in timely product launches. The Company emerged as one of the largest players in the post-patent space. The Company strengthened its position as a cost leader.
Five-pronged strategyGoing ahead, UPL intends to leverage a fi ve-pronged strategy to grow its business:
UPL’s sustained R&D investment will empower it to alter formulations and launch new products capable of overcoming pest resistance more eff ectively
UPL’s revenue from branded products increased from 25% of overall sales in FY2014 to 87% in FY2018. The Company will strengthen its branding, generating signifi cant shares in branded sales in the geographies of its presence, especially Latin America and North America.
UPL fi led 378 patents (58 patents granted) over FY2014-18. The revenue from innovative products in three years increased from 5% of revenues in FY2015 to 19% in FY2018. Going ahead, UPL will leverage its in-depth knowledge of registration requirements to enter new markets and introduce new products, strengthening revenues.
UPL aims to make the most of the impending opportunity in the generics space, as a number of
products (~USD 3 billion) are going off -patent over CY2017-20. Despite the dominance of existing MNCs in Latin America, Europe and North America, UPL has been able to make signifi cant inroads in these markets on the back of its distinctive products and robust distribution network, an initiative that will be sustained.
The Company will continue to improve profi ts by optimising product mix, rationalising costs and enhancing operational effi ciency.
Outlook The global crop protection chemicals sector passed through two consecutive years of contraction and one year of fl at growth. The scenario is gradually improving with crop protection chemical inventories declining and realisations stabilising. UPL’s range of products and deep distribution bandwidth should address a growing demand for cost-eff ective generic crop protection chemicals.
In the last fi ve decades, the Company invested proactively and the foreseeable future now appears more exciting than ever.
R.D. Shroff Chairman
UPL fi led 378 patents (58 patents granted) over FY2014-18. Th e revenue from innovative products in three years increased from 5% of revenues in FY2015 to 19% in FY2018
UPL’S ADVANTAGE LIES IN ITS
DEEP PRODUCT CHEMISTRY COMPETENCE.
Overview
Strategyreview Performance Governance Financials
25

CEO’s business review
Q&A
How do you assess the Company’s performance in FY2018?FY 2018 was one of the most challenging years for the global crop protection chemicals industry with industry revenues remaining practically fl at over FY 2017. Commodity realisations continued to decline that led farmers to move towards post-patent products. Given this reality, when most players either reported lower growth at best or contracted in line with the prevailing sectoral average, the Company’s performance was striking: consolidated revenues improved 5% from H17,124 crore in FY17 to H17,920 crore in FY18, EBIDTA reported a 14% growth from H3,429 crore in FY17 to H3,920 crore in FY18 and PAT grew 17% from H1,727 crore in FY17 to H2,022 crore in FY18 profi table growth for the Company. I am pleased to report that the Company continued to strengthen margins: EBIDTA margin strengthened 185 bps over FY17 and net profi t margin improved 121 bps over FY17.
The result was complete outperformance: UPL’s revenue growth was 5% while the global crop protection chemicals industry growth was practically fl at.
What were the reasons that translated into this outperformance?UPL continued to do things better in various ways. One, we enhanced operational effi ciency that made it possible to moderate costs. During the year under review, we saved close to H65 crore through various initiatives. Two, we saw our key global markets stage a much-awaited recovery during the course of the year. We reported good traction for our products in North America, Latin America and Europe following the removal of quotas on sugar production. Three, the Company mobilised USD300 million by off ering US dollar-denominated bonds to international investors at 4.5% (173 bps spread over the US benchmark treasury yields). Around three-fourths of this mobilisation will be used to refi nance high-cost and long-term overseas loans while the rest will help
We have a deep on-fi eld marketing presence in most of markets while in other areas we rely on dedicated marketing agents We possess ample capacities to
address demand surges
We are focusing on branded generics to fetch better returns Our new launches have already
shown promising growth in key markets
We provide a one-stop solution in a world marked by a growing need for convenience Our value-added services enhance
farm productivity and farmer incomes
At UPL, we are attractively positioned to capitalise on sectoral realities:
UPL Limited Annual Report, 2017-18 26

The complement of the realities provide me with the optimism that the coming year will be a landmark, when we continue to outperform the industry on the one hand and enhance shareholder value on the other.
repay high-cost and short-term debt. Although the initial pricing guidance was ~200 bps spread over the US benchmark yields, robust investor demand of about USD1.7 billion helped to tighten the spread by 27 bps. Four, UPL strengthened its global presence with the introduction of 101 products in the markets of India, Europe, North America, Latin America and Rest of World, while sustaining brand performance across respective markets.
What were some of the Company’s performance highlights?Despite a sectoral slowdown, UPL continued to strengthen its business. During the year, the Company invested H239 crore in 247 new registrations, enhancing our tally of registered products to 6,181 by the end of the year. Our working capital management improved from 91 days of turnover equivalent as on 31st March 2017 to 84 days as on 31st March 2018. This indicates that the heart of the business engine continued to be in good shape even during a challenging year.
What challenges did UPL counter during the year? The major challenge was the slowdown in the Indian market, a region accounting for 18% of our consolidated revenues. The lingering impact of demonetisation in the fi rst half of the year dampened sales. No sooner had we recovered that we were aff ected by GST, which created dealer uncertainty translating into de-stocking. The dispersion of rainfall was uneven across the country, with some southern states suff ering from defi cient rainfall.On the positive side, wheat, a key driver of herbicide revenues, drove growth in Q3. The products that we launched late last year gained immediate acceptance; a couple of fungicides performed exceptionally well.Australia, a key market for the Company, went through a dry spell following which crop protection chemicals demand declined. Raw material supply from China was adversely impacted as regulators in that country imposed restrictions from the environmental control standpoint, resulting in a shortage and consequent spike in prices.
What were some of the other bright spots of the Company’s working?We recognised that as the markets moved out of a slowdown there would be a need for enhanced production. In view of this, the Company scaled capacities at its plants in Gujarat; it commissioned a new plant in Brazil for an investment of ~H30 crore in less than a year (a similar-sized plant usually would have required ~18-24 months). In a strategic move to venture into profi table niches, we launched three products in the bio-pesticides segment in the Indian market, which proved to be timely and successful.
What makes you optimistic of the sector’s prospects? Although the past three years were marked by contraction, the sector appears to have bottomed out for two reasons: declining crop protection chemicals pipeline across the globe and steadying commodity prices. I believe that 2018 will be the year when the industry will rebound, strengthening our prospects.
Overview
Strategyreview Performance Governance Financials
27

The crop protection chemicalsindustry was marked by challenges
Sectoral challenges High inventory at the beginning of the year Softening commodity prices Hardening raw material prices owing to supply
scarcity Macroeconomic factors Sub-optimal monsoons
Impact: Demand slowdown, softening margins, slower off take and decelerated growth
UPL’s response Widened operational footprint Strengthened off take in North America, Europe, Latin
America Deepened distribution network in key geographies Focus on branded products Commissioned new plant in Brazil Introduced 101 products Undertook cost-reduction initiatives Reduced adverse environment impact Filed 247 new registrations Started captive manufacture of key raw materials
UPL Limited Annual Report, 2017-18 28

The resultNew plants New registrations Industry growth vs.
UPL growthShare of revenues accounted for
by branded products 9 in India and 1 in Brazil 247 0.2% vs. 7% 87%
The spirit of UPL Changing the game Fostering a passion for
excellence Nurturing the environment Energising employees
• Challenge the status quo• Anticipate the future and be adaptive to change• Develop innovative solutions for customers• Ensure lowest-cost manufacturing operations across the globe
• Set high standards in everything we do• Strive to achieve qualitative excellence• Maximise productivity through effi cient processes• Respond promptly to customer needs
• Ensure high standards of compliance and safety• Follow sustainable environmental practices
• Provide a stimulating environment to help employees learn and grow• Promote teamwork • Focus on competency development and career growth• Respect people and care for them
Overview
Strategyreview Performance Governance Financials
29

Our seven business prioritiesUPL’s growth is directly infl uenced and dependent on farmer prosperity. With population and food demand growing, the need of the hour is to improve food productivity and security. At UPL, we are seized of this global priority. We have selected to address this need through seven priorities:
Redu
ce d
epen
denc
e
Strengthen Diversify Scale capacities
on th
ird p
artie
s
product portfolio proactively com
petitivelyOptim
ise costs footprint
levels
Reduce carbon Enhance s
afety
Our business strategy
UPL Limited Annual Report, 2017-18 30

We are investing in captive capacities to become self-reliant and emerge as a ‘backward integration’ pioneer. We are one of few global companies to manufacture complex organo-phosphorus compounds.
By delivering quality and aff ordable products to farmers, we expected to enhance revenues and customer loyalty.
We will consistently launch innovative branded products in sync with evolving scenarios that effi caciously address emerging farmer needs over the world.
Being eco-friendly for UPL is not merely complying with predetermined regulations. The Company will extend beyond the call of duty through a series of measures to conserve environment resources.
The success of a company is not defi ned by entering a particular sector; it is defi ned by making our presence felt. UPL intends to do precisely that in the lucrative market for branded generics.
To service the growing global demand for crop protection chemicals, UPL will vigorously expand capacities - at competitive costs.
UPL not only lays down the guidelines on systems, policy and training but also monitors compliance, maintains and disseminates information on laws and regulations. To monitor the progress against projected improvement numbers, performance levels will be periodically reviewed at facility, divisional and corporate levels.
Reduce dependence on third parties
Strengthen product portfolio
Diversify proactively
Scale capacities competitively
Optimise costs
Enhance safety levels
Reduce carbon footprint
The projected outcome
Effi cient growth Consistent value creation Enhanced credibility Inspired employees Sustained
outperformance
Overview
Strategyreview Performance Governance Financials
31

Doing things better is about controlling as many variables as one can
UPL Limited Annual Report, 2017-18 32

UPL addressed this reality with the objective to reduce as many variables as it could through a progressive increase in in-house manufacture. The Company commissioned 11 new plants during the last 3 years, strengthening integration.
11NEW PLANTS
COMMISSIONED DURING THE LAST 3 YEARS
Overview
Strategyreview Performance Governance Financials
33

Doing things better is about being able to provide exactly what the farmer needsIn an evolving world where even climatic patterns are changing, infl uencing pest action on crops, there is a premium on the need to develop products that completely and eff ectively address these ever-changing requirements.
Over the years, the Company evolved its positioning: from an crop protection chemicals manufacturer to a complete solutions provider. In view if this, UPL invested in brand-building and new product development. The result: EBITDA margin improved from 18.8% during FY2009-10 to 21.9% during FY2017-18 as branded products commanded higher margins than commoditised products. The revenue share of branded products increased from 25% in FY2014 to 87% in FY2018. The Company fi led 378 patents (58 patents granted) between FY2014 and FY2018. Global product registrations increased from 4,692 in FY2015 to 6,181 in FY2018. Revenue contribution from innovative products launched in four years grew from 5% in FY2015 to 19% in FY2018. The result is the UPL has steadily improved its revenue mix with value-added products accounting for an incremental share of overall revenues.
19%PROPORTION OF REVENUES DERIVED FROM INNOVATIVE
PRODUCTS LAUNCHED IN FOUR YEARS
UPL Limited Annual Report, 2017-18 34

Overview
Strategyreview Performance Governance Financials
35

Doing things better is about diversifying proactively
UPL Limited Annual Report, 2017-18 36

UPL is a specialised generic crop protection chemicals manufacturer. The generic crop protection chemicals account for ~66% of the global crop protection market, while proprietary off -patent and patented crop protection chemicals account for the rest.
In recent years, declining farm realisations and deteriorating profi tability drove American and Latin American farmers towards inexpensive generic products. The US and Latin American markets accounted for sizeable shares (~27% and ~17%) of the global crop protection chemicals market. The gradual shift to generic crop protection chemicals and products going off -patent are expected to open up attractive growth avenues (worth ~USD 3 billion between CY17 and CY20).
Products worth USD 3.7 billion have already gone off -patent between CY15 and CY17. While this could result in a contraction in the US and Latin American markets in value terms, it could widen opportunities for UPL. The Company has carved out a niche for itself in the branded generics space which off ers the same quality but costs less.
ResultBranded generics account for 87% share of UPL revenues and the Company has emerged as one of the most reliable manufacturers of generic crop protection chemicals in the world.
87%SHARE OF REVENUES
FROM BRANDED PRODUCTS
Overview
Strategyreview Performance Governance Financials
37
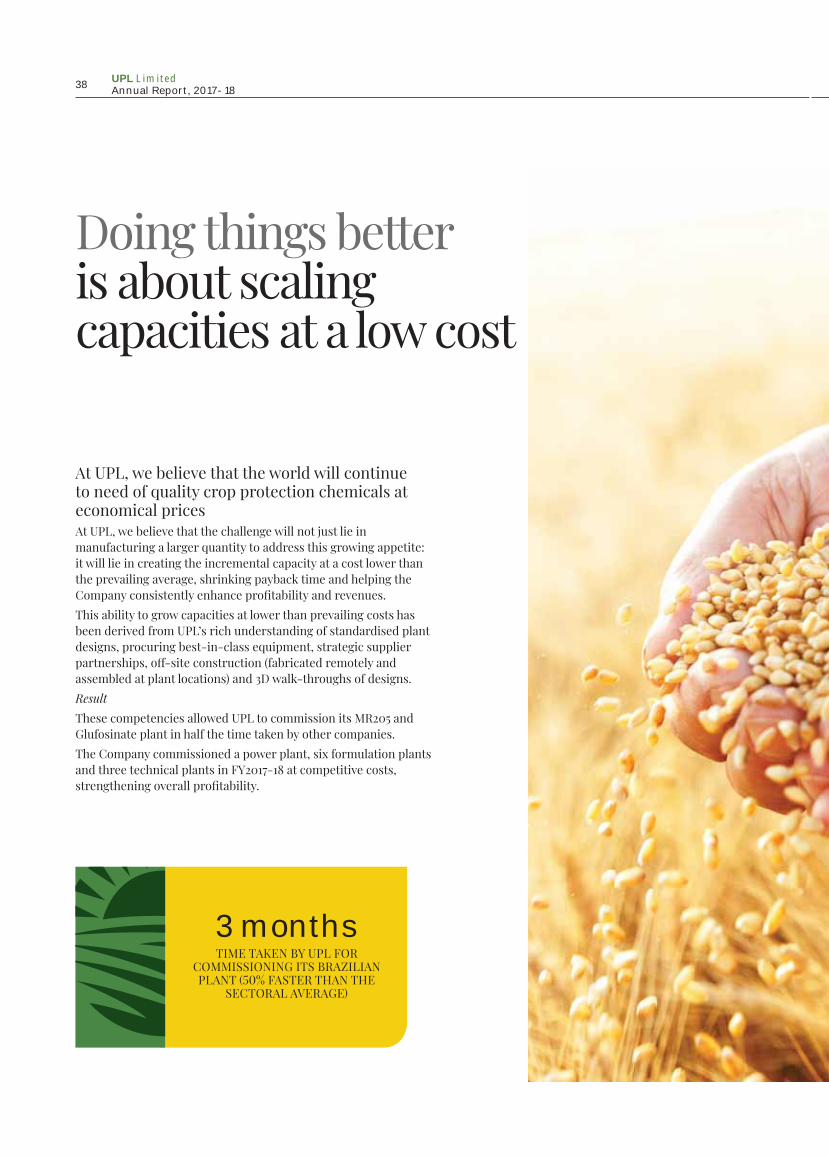
Doing things better is about scaling capacities at a low cost
At UPL, we believe that the world will continue to need of quality crop protection chemicals at economical prices At UPL, we believe that the challenge will not just lie in manufacturing a larger quantity to address this growing appetite: it will lie in creating the incremental capacity at a cost lower than the prevailing average, shrinking payback time and helping the Company consistently enhance profi tability and revenues. This ability to grow capacities at lower than prevailing costs has been derived from UPL’s rich understanding of standardised plant designs, procuring best-in-class equipment, strategic supplier partnerships, off -site construction (fabricated remotely and assembled at plant locations) and 3D walk-throughs of designs.ResultThese competencies allowed UPL to commission its MR205 and Glufosinate plant in half the time taken by other companies. The Company commissioned a power plant, six formulation plants and three technical plants in FY2017-18 at competitive costs, strengthening overall profi tability.
3 monthsTIME TAKEN BY UPL FOR
COMMISSIONING ITS BRAZILIAN PLANT (50% FASTER THAN THE
SECTORAL AVERAGE)
UPL Limited Annual Report, 2017-18 38
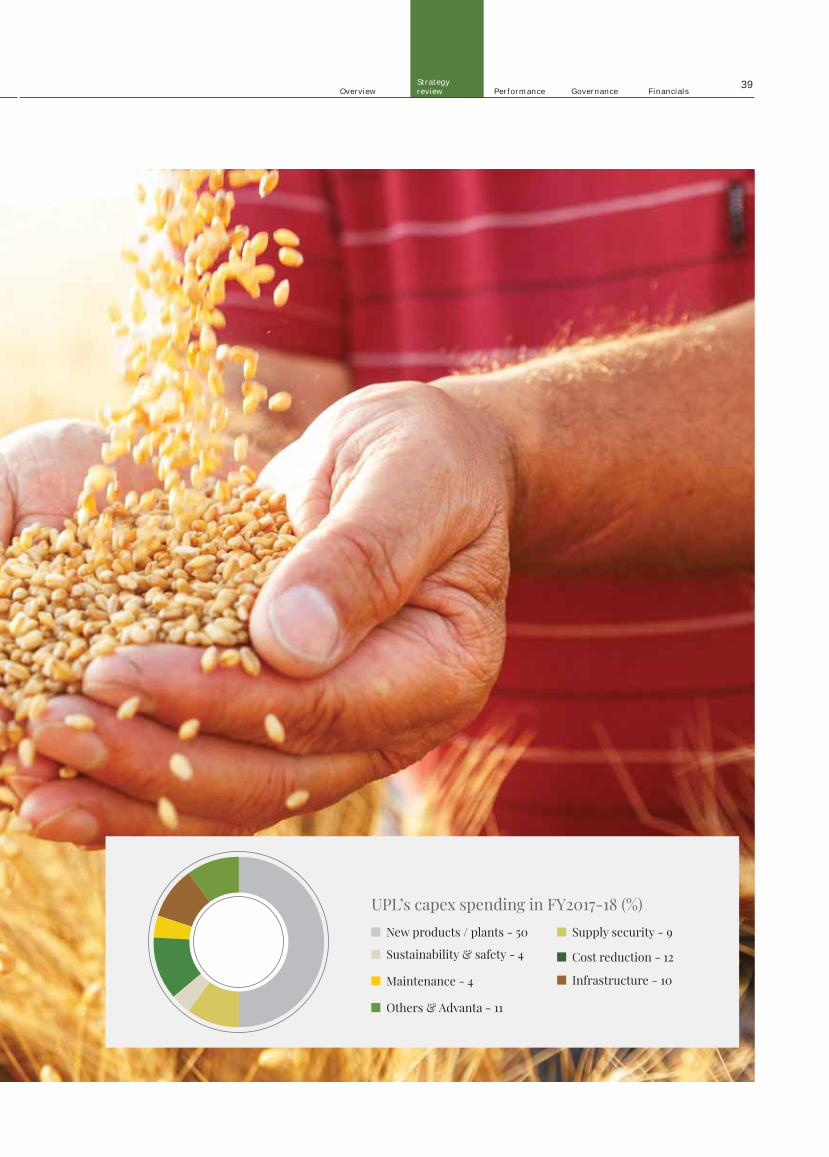
UPL’s capex spending in FY2017-18 (%) New products / plants - 50
Cost reduction - 12
Others & Advanta - 11
Supply security - 9
Maintenance - 4
Sustainability & safety - 4
Infrastructure - 10
Overview
Strategyreview Performance Governance Financials
39

Doing things better is about optimising costs
UPL Limited Annual Report, 2017-18 40

UPL believes that the truly sustainable company of the future will be one with lower costs.
Over the years, the Company embarked on a programme of cost moderation.
UPL standardised products and plants by utilising variability reduction measures as a part of its TQM programme. The Company invested in state-of-the-art manufacturing technologies to automate processes and robotised packaging lines to enhance quality.
Result Customer complaints declined 40% during FY2017-18. UPL executed a supply chain excellence programme to moderate costs by >H50 crore during FY2017-18. Process intensifi cation helped increase throughput of six to seven products by 10-40% against minimal investment. UPL’s material conversion cost now stands at one of the lowest in the industry.
H155 croreCUMULATIVE SAVINGS EARNED
THROUGH OPERATIONAL EFFICIENCY-ENHANCING
INITIATIVES BETWEEN FY13 AND FY18
Overview
Strategyreview Performance Governance Financials
41

Doing things better is about reducing our carbon footprintIn the modern world, respect is derived through two concurrent achievements: increase in profi ts and reduction in carbon footprint.
Over the years, UPL invested substantial resources in reducing energy and fossil fuel consumption. The Company invested in the reverse osmosis technology to treat and reuse wastewater. At UPL, this commitment extends beyond compliance with the statutory. Even as the permissible effl uents discharge limit is 100 kilolitres per day, the Company is already at a lower benchmark and expects this to be substantially lower across the foreseeable future. Result UPL moderated its carbon footprint 5%, raw water use 2% and waste water use 15% during the year under review – and set a target to shrink this by 30% by FY2020-21.
25ENVIRONMENTAL SUSTAINABILITY-
RELATED AWARDS RECEIVED BY UPL IN FY2017-18
UPL Limited Annual Report, 2017-18 42

Overview
Strategyreview Performance Governance Financials
43

Doing things better is about putting safety fi rst
UPL Limited Annual Report, 2017-18 44

At UPL, we believe that business sustainability is derived from putting safety fi rst.
It is no coincidence that the most profi table companies are also the safest.
At UPL, we have consistently invested in safety-enhancing professionals, practices and plants – an overarching culture of safety.
In FY2017-18, the Company initiated an asset transformation and zero leakage programmes to eliminate leaks of water, air, steam and chemicals. This helped increase workplace safety and enhance process effi ciencies.
The Company embraced the Japanese 5S philosophy (sort, stand in order, shine, standardise and sustain) to enhance operational uniformity with no corrosion, waste or leakage – key tenets of a certifi ed 5S unit.
The Company incorporated the sixth ‘S’ - safety - into this paradigm through intense training spanning fi ve-days per person per year, underlining its commitment.
Result UPL reported a signifi cant reduction in untoward workplace incidents during the year under review.
68%DECLINE IN UNTOWARD INCIDENTS
AT THE WORKPLACE DURING THE PAST FIVE YEARS
Overview
Strategyreview Performance Governance Financials
45

How UPL has addressed
The Company focused on the insecticides segment in the crop protection chemicals space
The Company ventured into other segments (herbicides, fungicides and rodenticides, among others)
The Company extended its footprint to cover a host of crop protection solutions ranging from seeds to post-harvest products
The Company’s operations were restricted to India until 1994 The Company ventured into global geographies thereafter The Company’s marketing presence is in 130+ countries
through 88 subsidiaries The Company has 19 international manufacturing units
across 13 countries in 4 continents 82% of the Company’s consolidated revenues are derived
from international markets
The Company started as manufacturer of phosphorus-based industrial chemicals
It ventured into crop protection chemicals and specialty chemicals 38 years ago
The Company enhanced its presence in patented, proprietary and post-patent products
The Company is now the 8th largest crop protection chemicals company in the world
UPL was largely an industrial chemicals company until 1980
UPL was largely a insecticides company
UPL was largely an India-focused company
UPL Limited Annual Report, 2017-18 46

a moving goalpost
A majority of UPL revenues was derived from unbranded generics till mid-nineties
The Company invested in cutting-edge R&D to develop innovative products
The Company combined diff erent molecules to create more effi cient products.
The Company started investing in branding 87% of the Company’s revenues were derived from branded
generics in FY2018
The UPL sourced a majority of its raw materials from third-parties
The Company invested in building captive capacities to secure raw materials access
The Company invested in a 36-megawatt plant for supplying 65% of the Company’s power requirements
The Company’s India facilities possess capabilities in manufacturing the entire range from APIs to formulations, whereas the global ones are engaged in manufacturing formulations specifi c to nearby markets
> 11% of the Company’s raw materials was derived from captive sources
The Company used to be a product-driven company until the late nineties
The Company forayed into the allied services segment The Company’s Unimart stores provide farmers with products
and advice The Company’s Kisan Call Centres provide critical inputs
to farmers pertaining to commodity price trends and climatic conditions, among others
UPL was dependent on third-party suppliers for raw materials
UPL was largely a manufacturer of me-too products
UPL was mainly a product-driven company
Overview
Strategyreview Performance Governance Financials
47

How we run our business: The UPL business model explained
The Company provides seeds, seed treatment solutions, pre-harvest and post-harvest solutions and allied services. The Company’s products and services ensure crop output on the one hand and enhanced farmer prosperity on the other. The Company’s diverse portfolio encompasses crops, pests and geographies. The Company’s extensive integration (backward and forward), dispersed manufacturing locations and deep marketing penetration helps UPL mitigate diverse business risks.
Growing sectoral relevance Increasing need for food security: Food
output needs to increase 70% to feed a growing global population. Consequently, the demand for crop protection chemicals will continue to rise
Evolving dietary preferences: With increasing prosperity across emerging economies, dietary preferences are shifting: people are progressively consuming more poultry and dairy-based food. To ensure adequate supply, fodder cultivation needs to increase to feed a growing cattle population.
Shrinking acreages: Rapid urbanisation has had a detrimental impact on land availability. The need of the hour is to produce more from less, brightening prospects of farm productivity-enhancing inputs.
Mounting crop losses: Pest attacks across various stages of crop life-cycles are aff ecting farmers the world over. Reduction in crop loss can result in signifi cant farm gains owing to higher production levels and farm prosperity.
Changing climatic conditions: Erratic climatic conditions are impacting crop output. Farms need an array of inputs to protect crops from adverse climatic realities.
UPL delivers crop protection chemicals products and related services to ensure food security for people across the world.
UPL Limited Annual Report, 2017-18 48

1.09%GLOBAL ANNUAL
POPULATION GROWTH
70%ADDITIONAL FARM OUTPUT REQUIRED
TO FEED FUTURE POPULATION
9.8 billion ESTIMATED GLOBAL POPULATION BY 2050
13%CROP LOST WORLD OVER OWING TO PEST ATTACKS
Overview
Strategyreview Performance Governance Financials
49

H28.50 croreINVESTMENT IN ENVIRONMENT
CONSERVATION INITIATIVES IN THE LAST THREE YEARS
H155 croreCUMULATIVE SAVINGS
EARNED IN THE LAST THREE YEARS
35MANUFACTURING
LOCATIONS ACROSS 14 COUNTRIES
UPL Limited Annual Report, 2017-18 50

How UPL is addressing the evolving sectoral landscape Long-term: At UPL, we have built the business around long-term sustainability rather short-term profi tability. The Company invested in raw material supply assurance, enhanced process effi ciency and environment conservation initiatives. Credible: At UPL, we have embraced the highest degree of corporate governance and transparency. We have built a portfolio of responsible products providing optimal returns to farmers. Our proactive investment towards
guaranteeing workplace safety has reinforced our business commitment. Strategic: At UPL, we believe that strategic clarity represents the foundation of our business model. We have created manufacturing units in India as well as 13 global locations to leverage cost arbitrage on the one hand and enhance customer proximity on the other. We continuously undertake cost optimisation to strengthen competitiveness.
Integrated: To become an effi cient manufacturer with a strong control on quality and pricing, we invested in the captive manufacture of key raw materials, including power generation. Stable: We believe effi cient management of that the funds is crucial in boosting business sustainability. We focus on strengthening our Balance Sheet to create long-term stability. We consistently refi nanced high-cost debt with low-cost alternatives to enhance viability.
Brand: Over the decades, the Company generated a distinctive recall: ethical (fairness and compliance), reliable (consistent delivery) and dependable (stakeholder welfare).
Innovation: The Company established a reputation for being a pioneer. The Company was the fi rst to manufacture groundbreaking products like Zeba.
Research: The Company invested in reinforcing R&D capabilities coupled with focusing on off -patent molecules. The Company has fi led 500+ patents globally for products and processes.
Technology: UPL embraced cutting-edge technologies to enhance operating effi ciency. The Company was among the fi rst in the industry to focus on optimising output quality and emerge leakage-free.
UPL’s foundation of intangibles
People: The Company’s pool of knowledgeable functional experts across areas (chemical engineering, project management, operations, farmer engagement, supply chain management, quality control, marketing, strategic direction and fi nancial management) has allowed it to stay ahead of the curve. The Company had 7,435 employees on its payroll as on 31st March 2018 with a >95% retention rate at the managerial level.
Overview
Strategyreview Performance Governance Financials
51
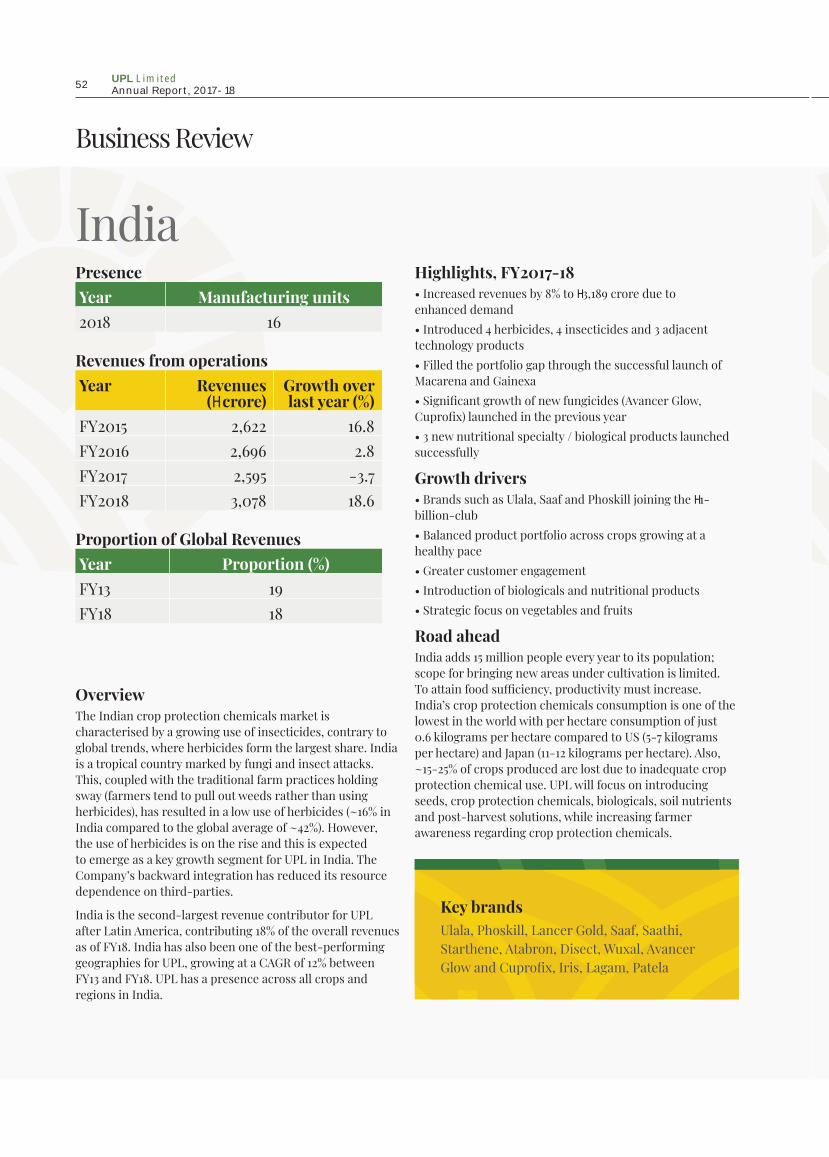
Business Review
OverviewThe Indian crop protection chemicals market is characterised by a growing use of insecticides, contrary to global trends, where herbicides form the largest share. India is a tropical country marked by fungi and insect attacks. This, coupled with the traditional farm practices holding sway (farmers tend to pull out weeds rather than using herbicides), has resulted in a low use of herbicides (~16% in India compared to the global average of ~42%). However, the use of herbicides is on the rise and this is expected to emerge as a key growth segment for UPL in India. The Company’s backward integration has reduced its resource dependence on third-parties.
India is the second-largest revenue contributor for UPL after Latin America, contributing 18% of the overall revenues as of FY18. India has also been one of the best-performing geographies for UPL, growing at a CAGR of 12% between FY13 and FY18. UPL has a presence across all crops and regions in India.
Highlights, FY2017-18• Increased revenues by 8% to H3,189 crore due to enhanced demand • Introduced 4 herbicides, 4 insecticides and 3 adjacent technology products • Filled the portfolio gap through the successful launch of Macarena and Gainexa • Signifi cant growth of new fungicides (Avancer Glow, Cuprofi x) launched in the previous year• 3 new nutritional specialty / biological products launched successfully
Growth drivers • Brands such as Ulala, Saaf and Phoskill joining the H1-billion-club• Balanced product portfolio across crops growing at a healthy pace • Greater customer engagement• Introduction of biologicals and nutritional products• Strategic focus on vegetables and fruits
Road aheadIndia adds 15 million people every year to its population; scope for bringing new areas under cultivation is limited. To attain food suffi ciency, productivity must increase. India’s crop protection chemicals consumption is one of the lowest in the world with per hectare consumption of just 0.6 kilograms per hectare compared to US (5-7 kilograms per hectare) and Japan (11-12 kilograms per hectare). Also, ~15-25% of crops produced are lost due to inadequate crop protection chemical use. UPL will focus on introducing seeds, crop protection chemicals, biologicals, soil nutrients and post-harvest solutions, while increasing farmer awareness regarding crop protection chemicals.
Key brandsUlala, Phoskill, Lancer Gold, Saaf, Saathi, Starthene, Atabron, Disect, Wuxal, Avancer Glow and Cuprofi x, Iris, Lagam, Patela
PresenceYear Manufacturing units2018 16
Revenues from operationsYear Revenues
(H crore)Growth over last year (%)
FY2015 2,622 16.8FY2016 2,696 2.8FY2017 2,595 -3.7FY2018 3,078 18.6
Proportion of Global RevenuesYear Proportion (%)FY13 19FY18 18
India
UPL Limited Annual Report, 2017-18 52

OverviewThe Latin American region is an important net exporter of food and agricultural commodities, accounting for 16% of the global food and agriculture exports and 4% of the global food and agriculture imports. Fruits such as avocado, pineapple, papaya and guava are also native to tropical South America. Brazil is the world’s largest exporter of coff ee and the sixth-largest producer of cacao. Corn is produced throughout the temperate climates and soybeans have become an increasingly lucrative crop in the Pampas. Heavily irrigated crops, such as rice and cotton, are grown in desert oases. UPL enjoys a large presence in Latin America, especially in soybeans, oil crops, corn, cotton, coff ee, sugarcane and fruits and vegetables. The key countries in the region are Brazil, Argentina, Columbia and Mexico. UPL will launch its Glufosinate brands in Latin America, which has the potential to replace glyphosate that has developed weed resistance. The largest revenue contributor from the geography is Brazil, with half the revenues in the country accounted for by the North and the other half by the South. Most farmers in the northern part of Brazil export their produce. Though crop protection chemical sales in the northern part of
Brazil are in Brazilian Real, they are pegged to the US dollar, creating a natural hedge. Sales in the Southern part of Brazil are in Brazilian Real. However, most of the materials are imported in Brazil in US dollar terms. Thus, 50% of UPL’s sales in Brazil are exposed to currency volatility. The Company uses a forward cover to mitigate this risk. UPL has collaborated with Bayer to promote fungicides targeting Asian Rust in Brazil. While UPL will cross-market Bayer’s Fox, Bayer will cross-market UPL’s Unizeb (Mancozeb). When applied together, these products will ensure greater protection. Although the demand for Unizeb had been good, limited distribution had constrained sales. The tie-up will allow UPL to gain access to Bayer’s robust distribution network and catalyse off take.
Highlights, FY2017-18• Increased revenues by 5% to reach H5,692 crore despite a market contraction of 4%• Contributed 33% to UPL’s overall revenues, growing at a healthy CAGR of 18% between FY13 and FY18• Launched 6 herbicides, 13 fungicides, 7 insecticides, 2 seed treatment products and an adjacent technology product• Successfully launched Sperto (insecticide) in Brazil
Growth drivers • Launch of new products• Focus on fi ghting weed resistance• Manufacturing soybean and oilseed-specifi c products• Robust distribution network
Road aheadLatin America is the largest contributor to UPL’s revenues, it will continue being a key market. The market is showing an increased preference for inexpensive branded generic products and the Company will deepen its presence in the region through the launch of new products. It will widen its customer reach by collaborating with Bayer.
PresenceYear Manufacturing units2018 5
Revenues from operationsYear Revenues
(H crore)Growth over last year (%)
FY2015 3,406 19.3FY2016 4,273 25.4FY2017 5,396 26.3FY2018 5,692 5.5
Proportion of Global RevenuesYear Proportion (%)FY13 27FY18 33
Latin America
Key brandsManzate, Vondozeb, Unizeb, Lancer, Quickphos, Unizeb Gold, Clorin, Zartan, Danado, Imida Gold, Lancer Gold, Glory
Overview
Strategyreview Performance Governance Financials
53

OverviewEurope is an important region for the global agricultural industry in terms of arable lands and crop output. The region has been aff ected by wet weather in the North, resulting in a diseased output of potatoes. Dry weather in the South reduced disease incidence (for vine and vegetable crops), impacting the consumption of fungicides. Despite the market declining by 2%, UPL posted a steady growth of 7% in revenues. UPL diversifi ed its presence across Europe to reduce dependence on a specifi c nation. The Company diversifi ed its presence across crops – sugar beet, oilseeds, fruit (grapes and others) and vegetables – even as there is a gap related to cereals. Europe is one of the most challenging markets from the perspective of registration approval (takes ~5 years to complete). UPL proactively aggregated registrations
expected to be registered over the next couple of years. The EU abolished the quota system for sugar from October 2017 to make European agriculture more market-oriented. To support European farmers and processors, the sugar sector was originally subject to production quotas and a minimum price. Most of the EU’s sugar beet is grown in Northern Europe, where the climate is more suited to growing sugar beet.Sugar beet is a key crop for UPL. Hence, the policy change could drive UPL European revenues.
Highlights, FY2017-18• Increased revenues by 7% to reach H2,305 crore despite market contraction of 2%• Business in Germany rebounded to show good growth• Launched 4 herbicides, 9 fungicides, 2 insecticides and 3 adjacent technology products
Growth drivers • Herbicide portfolio on sugar beet – low opening inventories and increased area• Abolished quota for sugar production and export• Strong presence in major crops• Launch of new products
Road aheadThe liberalisation of the sugar production policy and UPL’s strategic focus on sugar beet bodes well. The herbicide portfolio for sugar beet will be the growth driver in Europe, aided by a low opening inventory and increased acreage. The Company will focus on improving its market presence and introduce new products.
Key brandsDevrinol, Microthiol, Penncozeb, Cuprofi x, Metafol, BeetUp
PresenceYear Manufacturing units2018 7
Revenues from operationsYear Revenues
(H crore)Growth over last year (%)
FY2015 2,032 0.8FY2016 1,925 (5.3)FY2017 2,148 11.6FY2018 2,305 7.3
Proportion of Global RevenuesYear Proportion (%)FY13 19FY18 13
Europe
UPL Limited Annual Report, 2017-18 54

OverviewNorth America benefi ts greatly from its fertile soil, plentiful freshwater, oil and mineral deposits and forests. The major crops in the region comprise soybean, corn, potato and grapes, among others. UPL off ers a wide array of products for key crops like rice, fruits and vegetables. The Company gained a foothold in aquatics (crop protection chemicals used to counter weeds in fresh water lakes), horticulture, and post-harvest segments. UPL’s subsidiary Riceco in North America served as an ally in the area of rice. The estimated size of this crop segment is USD 5.9 billion and UPL enjoys steady demand
for key brands like Eros Gold, Stam and Londax. In 2014, UPL launched two brands of the herbicide Glufosinate for soybean and corn to address portfolio gaps. The Lifeline brand was targeted at regions outside the Midwest. The other brand Interline focused on the Midwest, given the quantum of area under soybean and corn cultivation in the region. Glufosinate competed with glyphosate. The size of the market for glyphosate is estimated at ~USD 4.5 billion. With several weeds having developed resistance to Glyphosate, the prospects for Glufosinate appear bright.
Highlights, FY2017-18• Increased revenues by 7% to reach H3,083 crore, outperforming industry the growth of 3%• Launched 6 herbicides, 2 fungicides, 3 insecticides, a seed treatment product and 4 adjacent technology products• Potato / vegetables supported growth of key fungicides
Growth drivers • Focus on fruits and vegetables • Presence in key markets• Herbicide portfolio – Interline, Blazer, Shutdown and Satellite• Signifi cant increase in cotton planted area and improved insecticide performance
Road aheadUPL will plug gaps in the market and launch new products to enhance its market presence
PresenceYear Manufacturing units2018 2
Revenues from operationsYear Revenues
(H crore)Growth over last year (%)
FY2015 2,259 6.5FY2016 2,612 15.6FY2017 2,888 10.6FY2018 3,083 6.8
Proportion of Global RevenuesYear Proportion (%)FY13 20FY18 18
North America
Key brandsInterline, Manzate, Microthiol, Cuprofi x, Weevilcide, Super Tin, Ultra Blazer, Surfl an, Tricor, Banter, Satellite
Overview
Strategyreview Performance Governance Financials
55
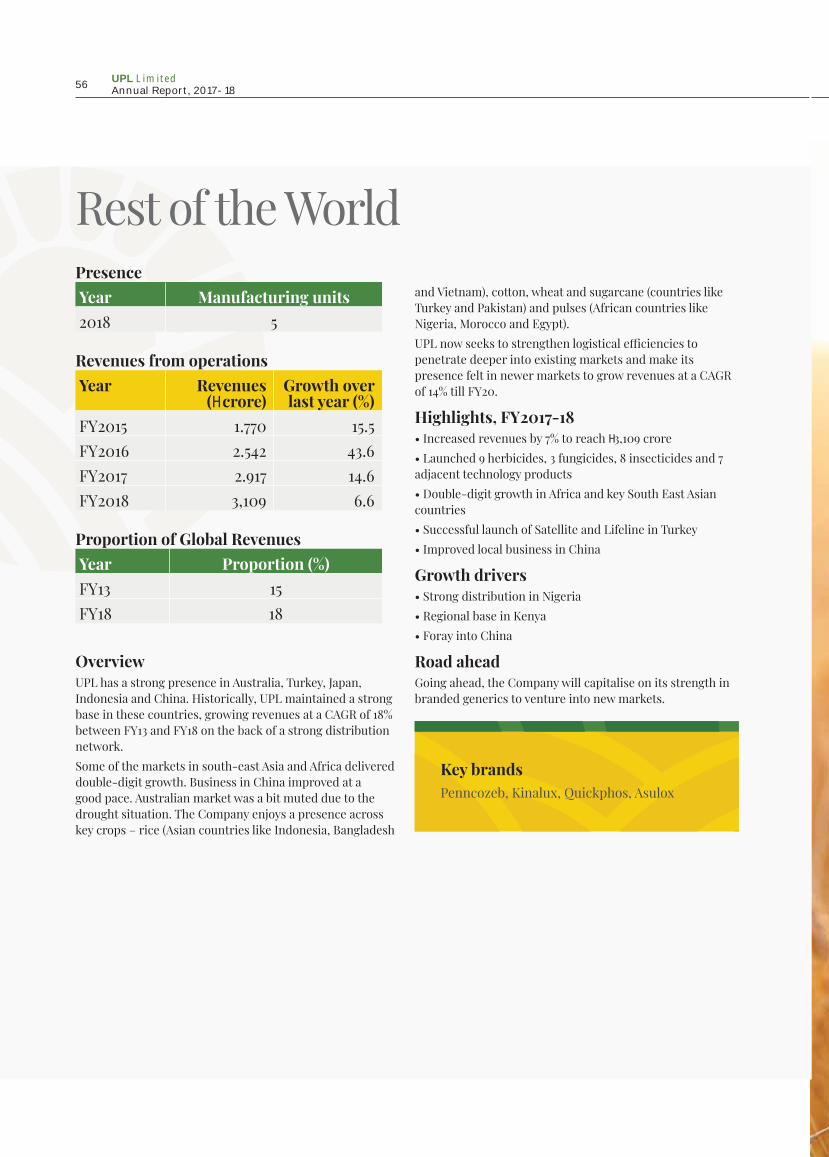
OverviewUPL has a strong presence in Australia, Turkey, Japan, Indonesia and China. Historically, UPL maintained a strong base in these countries, growing revenues at a CAGR of 18% between FY13 and FY18 on the back of a strong distribution network. Some of the markets in south-east Asia and Africa delivered double-digit growth. Business in China improved at a good pace. Australian market was a bit muted due to the drought situation. The Company enjoys a presence across key crops – rice (Asian countries like Indonesia, Bangladesh
and Vietnam), cotton, wheat and sugarcane (countries like Turkey and Pakistan) and pulses (African countries like Nigeria, Morocco and Egypt). UPL now seeks to strengthen logistical effi ciencies to penetrate deeper into existing markets and make its presence felt in newer markets to grow revenues at a CAGR of 14% till FY20.
Highlights, FY2017-18• Increased revenues by 7% to reach H3,109 crore • Launched 9 herbicides, 3 fungicides, 8 insecticides and 7 adjacent technology products• Double-digit growth in Africa and key South East Asian countries• Successful launch of Satellite and Lifeline in Turkey• Improved local business in China
Growth drivers • Strong distribution in Nigeria• Regional base in Kenya• Foray into China
Road aheadGoing ahead, the Company will capitalise on its strength in branded generics to venture into new markets.
Key brandsPenncozeb, Kinalux, Quickphos, Asulox
PresenceYear Manufacturing units2018 5
Revenues from operationsYear Revenues
(H crore)Growth over last year (%)
FY2015 1.770 15.5FY2016 2.542 43.6FY2017 2.917 14.6FY2018 3,109 6.6
Proportion of Global RevenuesYear Proportion (%)FY13 15FY18 18
Rest of the World
UPL Limited Annual Report, 2017-18 56

Management discussion and analysis
In 2017, a decade after the global economy spiraled into a meltdown, a revival became visible. Every major economy expanded and a growth wave created jobs. This reality was marked by ongoing eurozone growth, modest growth in Japan, late revival in China and improving realities in Russia and Brazil leading to an estimated 3.7% global economic growth in 2017, some 60 bps higher than the previous year. Crude oil prices increased in 2017, the prices at the beginning of the year were $54.13 per barrel, declining to a low of $46.78 per barrel in June 2017 and closing the year at $61.02 per barrel, the highest since 2013.
Global economic overview
Overview
Strategyreview Performance Governance Financials
57

Global economic growth for 6 years
Year 2014 2015 2016 2017 (e) 2018 (f) 2019 (f)Real GDP Growth (%) 3.5 3.2 3.1 3.7 3.9 3.0
[Source: World Economic Outlook, January 2018] e: estimated f: forecasted
A review of the various national economies is provided below: The US: The world’s largest economy entered its ninth straight year of growth in 2017 (2.3% compared to 1.6% in 2016) catalysed by the spillover arising out of government spending by the previous administration coupled with USD1.5 trillion worth of tax cuts stimulating investments. Private consumption continued to grow at a robust pace from 1.5% in 2016 to 2.2% in 2017.Eurozone: This region experienced the upside arising out of cheap money provided by the central bank. In 2017, Euro zone is estimated to grow 2.4% compared with 1.8% in 2016, the broad-based growth visible in all eurozone economies and sectors. (Source: WEO January 2018, Focus Economics)China: The Chinese economy grew faster than expected in the fourth quarter (October to December) of 2017 at 6.8%, aided by a recovery in exports. For the full year, China’s growth is estimated at 6.9%, its highest since 2010. Private fi rm investments rose 6% in 2017 from 3.2% in 2016. Disposable income growth picked up to 7.3% in 2017 from 6.3% in 2016. Consumption should outpace investment and demand for services could remain
strong (52% of economic output). China’s exports rose 6.9% from the previous year to $188.98 billion in October 2017. (Source: WEO, NBS)Emerging Asia: Emerging Asia GDP is estimated at 6.5% in 2017. Cambodia, Laos and Myanmar are projected to grow the fastest in the ASEAN, while Philippines and Vietnam are expected to lead growth in ASEAN-5 (Indonesia, Malaysia, Philippines, Thailand and Vietnam). The region is being driven by infrastructure spending and stable economies.GCC: GCC countries were aff ected by the oil price decline (~60% since 2013), resulting in macro-economic instability that aff ected job creation and growth. GDP growth remained subdued at 1.8% in 2017 despite eff orts to boost the non-oil private sector economy. Regional growth is projected to increase steadily after 2017, to 3% in 2018 and 3.2% by 2020, following acceleration among oil exporters and importers, moderated geopolitical tension and rise in oil prices. (Source: World Bank)Russia: The economy appeared to have exited a two-year recession that, thanks to the authorities’ eff ective policy response and existence of robust buff ers, proved shallower-
than-past downturns. In 2017, Russia was estimated to grow 1.9% following negative growth of 0.6% in 2016 (WEO) and a projected GDP growth of 1.8% in 2018. (Source: MOMR)Brazil: In 2017, Brazil grew at 1.1% following a deceleration of 3.5% in 2016. The recovery in the GDP was boosted mainly by the agricultural sector which grew by 13%. According to the Brazilian Institute of Geography and Statistics (IBGE), a decline in infl ation (infl ation was 3.5% in 2017 as compared to 8.7% in 2016) also contributed to economic growth.
Outlook The outlook for advanced economies improved, notably for the Euro area, but in many countries infl ation remained weak, indicating that slack was yet to be eliminated, and prospects for growth in GDP per capita were held back by weak productivity growth and rising old-age dependency ratios. Global growth forecasts for 2018 and 2019 were revised upward by 20 bps to 3.9%, refl ecting improved momentum and the impact of tax policy changes in the US. (Source: WEO, IMF)
Indian economic overviewAfter registering GDP growth of over 7% for the third year in succession in 2016-17, the Indian economy headed for slower growth estimated at 6.7% in 2017-18. Even with this lower growth for 2017-18, GDP growth averaged 7.3% for the period 2014-15 to 2017-18, achieved through lower infl ation, improved current account balance
and reduction in fi scal defi cit to GDP. The year under review was marked by various structural reforms by the Government. In addition to GST introduction, the year witnessed signifi cant resolution of problems associated with bank non-performing assets, FDI liberalisation, bank recapitalisation and privatisation of
coal mines. After remaining in negative territory for a couple of years, export growth rebounded during 2016-17 and strengthened in 2017-18; foreign exchange reserves rose to USD 414 billion as on January 2018. (Source: CSO, economic survey 2017-18)
UPL Limited Annual Report, 2017-18 58

Indian agricultural sector overviewAgriculture is the primary source of livelihood for about 58% of India’s population and the sector accounts for 16% of the overall economy. At 157.35 million hectares, India holds the second-largest agricultural land
in the world. Ministry of Agriculture is targeting to achieve 274.55 million tonnes production of food grains, during 2017-18 as compared to 275.68 million tonnes in FY17. India’s agriculture sector is pegged to grow at
2.1% in 2017-18. India is among the top-15 exporters of agricultural products in the world. The Central Government has made doubling farm incomes as one of its priorities. To this end, it has taken a
India estimate for the FY2017-18 Vs FY 2016-17 2017-18* 2016-17GDP growth 6.7% 7.1%GVA growth 6.4% 9.0%Farm growth 3% 9.0%Manufacturing growth 5.1% 9.3%Power and Gas growth 7.3% 6.5%Mining growth 3% 1.9%Construction growth 4.3% 3.5%Trade, hotel, transport, telecom growth 8.3% 9.8%Financials, realty growth 7.2% 9.8%Public, admin, defence growth 10.1% 16.6%Per capita income growth 8.3% 9.7%
*Estimated(Source: http://pib.nic.in/newsite/PrintRelease.aspx?relid=163287)
World Economic Forum’s Global Competitiveness Report 2017 ranked India at an impressive 23 in the Global Competitiveness Index from 39 in 2016.Demonetisation dampened short-term growth, but could prove benefi cial over the long-term. Some government initiatives comprised:• Bank recapitalisation scheme: The Central Government announced capital infusion of H2.1 lac crore in public sector banks. • Expanding road network: The Government of India announced a H6.9 lac crore investment to construct 83,677 kilometres of roads across fi ve years. • Improving ecosystem: The country was ranked at the hundredth position, an improvement of 30 places in the World Bank’s Ease of Doing Business 2017 report, a result of the Central Government’s pro-reform agenda, comprising measures like the passing
of Insolvency and Bankruptcy Code, simplifying tax computation and merging applications for PAN and TAN. In addition, Aadhaar-based identifi cation approach could streamline the regulatory regime. (Source: KPMG)• Goods and Services Tax: The Government of India launched GST in July 2017, with the vision of creating a unifi ed market. Under this regime, various goods and services are taxed as per fi ve slabs (28%, 18%, 12%, 5% and zero tax). • Foreign Direct Investment: Foreign direct investment increased from approximately USD 24 billion in FY2012 to approximately USD 60 billion in FY2017, an all-time high.• Coal mining opened for private sector: Ending state monopoly, the government opened coal mining to private sector fi rms for commercial use, the most ambitious sectoral
reform since nationalisation in 1973. (Source: The Hindu, Business Today)• Doubling farm incomes: The government initiated a seven-point action plan to double farm incomes by 2022.
OutlookWorld Bank projected India’s economic growth to accelerate to 7.3% in 2018-19 and 7.5% in 2019-20. Strong private consumption and services are expected to continue to support economic activity. Private investment is expected to revive as soon as the corporate sector adjusts to GST. The recapitalisation package for public sector banks announced by the Government of India is expected to strengthen banking sector Balance Sheets, enhance credit availability and spur investment. (Source: IMF, World Bank)
Key government initiatives
Overview
Strategyreview Performance Governance Financials
59

number of important policy actions to boost agriculture: instituting soil health cards, ensuring effi cient irrigation, strengthening government procurement of pulses, introducing neem-coating of urea, building more assets under MGNREGS, expanding
crop insurance for farmers and building a common agricultural e-market via e-NAM. (Source: CSO)
OutlookThe productivity of most crops in India is below the global productivity
average. Farm productivity can be improved through better irrigation, technology improvement, crop diversifi cation, increased value-addition (fruits, vegetables, spices, condiments), and increasing crop intensity.
Annual real GVA and GDP growth (%)GVA at basic prices 2014-15 2015-16 2016-17 2017-18 (1st AE)Agriculture, forestry & fi shing -0.2 0.7 4.9 2.1
(Source: CSO)
Demand• Population and income growth• Increasing exports• Favourable demographics
Supply• Hybrid and genetically modifi ed seeds• Favourable climate for agriculture• Wide variety of crops• Growing mechanisation• Improving irrigational facilities• Green revolution in Eastern India
Policy support• Growing institutional credit• Increasing MSP• Introduction of new schemes like Paramparagat Krishi Vikas Yojana,
Pradhan Mantri Gram Sinchai Yojana, Sansad Adarsh Gram Yojana• Opening up of exports of wheat and rice• Approval of National Mission on Food Processing
Budgetary measures• To double farmer incomes, the Central Government proposed an increase in the MSP to one-and-a-half times the production cost for a majority of rabi and kharif crops.• The Central Government will create an institutional mechanism, with participation of all concerned Ministries, to develop appropriate policies and practices for price and demand forecasts, use of futures and options market, expansion of warehouse depository system and
take decisions about specifi c exports and import-related measures.• An Agro-Market Infrastructure Fund (corpus of H2,000 crore) will be set up for developing and upgrading agricultural marketing infrastructure in the 22,000 Grameen Agricultural Markets (GrAMs) and 585 APMCs.• Prime Minister Gram Sadak Yojana Phase III will include major link routes, which connect habitations to agricultural and rural markets (GrAMs). This will ease the supply of raw material to manufacturing locations.• The government increased the volume of institutional credit for the agriculture sector to enhance agricultural produce.
Ploughing of land
Sowing seeds Fertilisers
Farming and
irrigation
Crop Protection Chemicals
Stages of agriculture inputs
Source: CARE
Growth drivers
UPL Limited Annual Report, 2017-18 60

Modern agriculture is a USD3 trillion industry and as the world population moves to a projected 9 billion people by 2050, investment in safe, eff ective agricultural chemicals will only continue to expand. The ever-increasing need to grow more food on less land, with minimal impact on human health and the environment, creates a vast market for eff ective synthetic crop protection chemicals and fertilisers. Crop protection chemicals, in terms of revenue, are expected to grow at a CAGR of 5.5% from 2017 to 2025 due to rising
occurrences of pest and rodent attacks damaging crops. On the production side, 90% of the growth in crop production globally (80% in developing countries) is expected to come from higher yields and increased cropping intensity, with the remainder coming from land expansion. Arable land would expand by ~70 million hectares (or <5%), with the expansion in developing countries by about 120 million hectares (or 12%) being off set by a decline of some 50 million hectares (or 8%) in the developed countries. Almost all of the
land expansion in developing countries would take place in sub-Saharan Africa and Latin America. (Source: Allied Market Research, FAO)
OutlookCrop yields would continue to grow but at a slower rate. On average, annual crop yield growth rate over the projected period would be about half (0.8%) its historical growth rate (1.7%; 0.9 and 2.1% for the developing countries). To feed the rising population, production needs to be increased, creating a case for more agro-inputs.
India is the fourth-largest global producer of crop protection chemicals after the US, Japan and China. The industry is set to grow at a signifi cant pace led by an increasing population, decreasing per capita availability of arable land and focus on increasing agricultural yields. The industry is dominated by insecticides, accounting for 60% of the overall demand, followed by fungicides and herbicides contributing 18% and 16%, respectively. With 355 million
metric tonnes per annum of food grain requirement by 2030, effi cient usage of crop protection products and solutions for Indian agriculture are the need of the hour. In India farmers are highly dependent on the monsoons and irrigation facilities. The situation becomes especially critical when one considers that ~15-25% of the potential crop production is lost to pests, weeds and diseases. In order to meet the growing demand borne out of increasing population,
the productivity of crops and effi cient utilisation of arable land become essential factors. In order to enhance productivity, the usage of crop protection chemicals plays a vital role. Crop protection chemicals companies in India witnessed revenues grow at a CAGR of 10% till FY17. ~50% of this growth was based on exports. India’s crop protection chemicals consumption is one of the lowest in the world with per hectare consumption of just 0.6
Global crop protection chemicals market
Indian crop protection chemicals market overview
Global crop protection chemicals market by value (USD million)
Year Crop protection chemical usage
Non-crop chemical usage
Total crop protection chemicals
usage2010 45,462 5,715 51,1772011 50,871 6,076 56,9472012 53,869 6,264 60,1332013 58,026 6,404 64,4302014 60,940 6,491 67,4312015 56,151 6,237 62,3882016 55,089 6,458 61,5472017P 55,330 6,568 61,898
Note: P= Preliminary value (Source: agropages.com)
Overview
Strategyreview Performance Governance Financials
61

Exhibit 56: Global crop protection market expected to grow at a CAGR of 4% over 2016-2020
60
49.9
58.7
Source: Philip McDougall
USD
bn
55
50
45
35
30
40
1980
1981
1982
1983
1984
1985
1986
1987
1988
1989
1990
1991
1992
1993
1994
1995
1996
1997
1998
1999
2000
2001
2002
2003
2004
2005
2006
2007
2008
2009
2010
2011
2012
2013
2014
2015
2016
2017
2018
E20
19E
2020
E
Exports of Crop protection chemicals* (USD billion)
(Source: IBEF)
1.05 1.82
1.38 1.9
8
1.15 1.9
5
1.66 2.21
6.30
0
3
1
FY10
FY12
FY14
FY16
FY11
FY13
FY15
FY17
FY18
4
6
2
5
7 CAGR 13.18%
kilograms compared to US (5-7 kilograms per hectare) and Japan (11-12 kilograms per hectare). In India, paddy accounts for the maximum share of crop protection chemicals consumption around (26%-28%) followed by cotton (18% -20%). The eight states including Andhra Pradesh, Maharashtra, Punjab, Madhya Pradesh, Chhattisgarh, Gujarat, Tamil Nadu and Haryana account for usage of >70% of the crop protection chemicals used in India. Andhra Pradesh is a leading consumer of crop protection chemicals with a market share of 24%.
Generic crop protection chemicals: A promising opportunityGeneric crop protection chemicals account for ~60% of the global crop protection market, while proprietary off -patent and patented crop protection chemicals account for the remaining share. Of late, falling agricultural commodity prices, and in turn, falling profi tability have been driving US and Latin American farmers towards less expensive generic products. The US and Latin American markets account for ~18% and ~27% of the global crop protection chemicals market, respectively,
and the shift to generic crop protection chemicals coupled with multitude of products going off -patent is expected to open up attractive avenues of growth (estimated to be worth ~USD 3 billion between CY17 and CY20) for the generics industry. Products worth USD 3.7 billion have already gone off -patent between CY15 and CY17. While this would result in a contraction in the American and Latin American markets in value terms, it would widen opportunities for Indian crop protection chemicals companies.
Exhibit 8: ~USD3b opportunity size as products go off -patent over 2017-2020
Source: FICCI & Tata Strategic & Management report
Crop protection chemicals going off -patent (USD bn)
1.3
2014 2016 20182015 2017 2019 2020
0.9
1.2
1.6
0.4
0.7
0.2
UPL Limited Annual Report, 2017-18 62
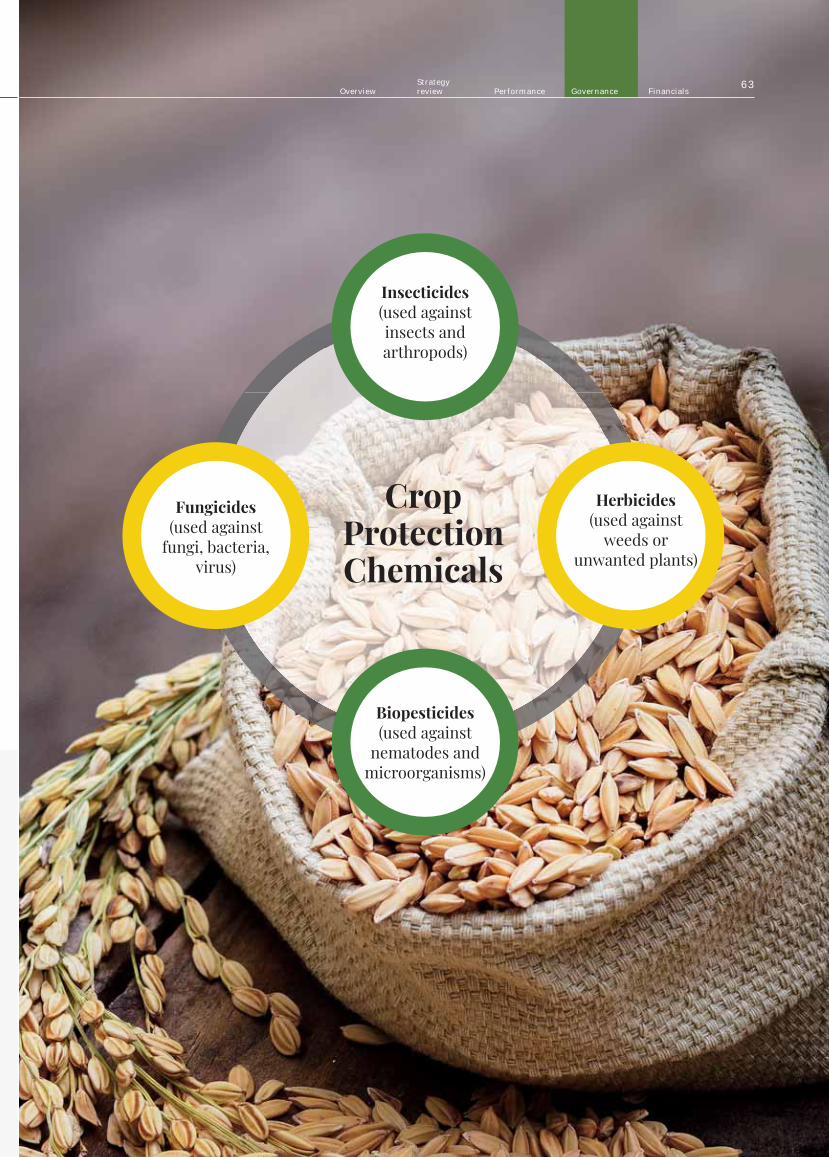
Crop Protection Chemicals
Insecticides (used against insects and arthropods)
Herbicides(used against
weeds or unwanted plants)
Biopesticides(used against
nematodes and microorganisms)
Fungicides(used against
fungi, bacteria, virus)
Overview
Strategyreview Performance Governance Financials
63

Demand drivers • Growth in demand for food grains: India has ~16% of the world’s population and <2% of the total landmass. Increasing population and high emphasis on achieving food grain self-suffi ciency, is expected to drive growth.• Limited farmland availability and growing exports: India has 157 million hectares of gross cultivated area and the scope for bringing new areas under cultivation is severely limited. Available arable land per capita has been reducing globally and is expected to reduce further. The pressure is therefore to increase yield per hectare which can be achieved through increased usage of crop protection chemicals. • Increasing awareness: ~15-25% of potential crop production is lost due to non-usage of crop protection chemicals. Companies are increasingly training farmers regarding the right use of crop protection chemicals in terms of quantity to be used, the right application methodology and appropriate chemicals to be used for identifi ed pest problems. With increasing awareness, the use of crop protection chemicals is expected to increase.
Challenges• High research costs: Research activities to develop a new crop
protection chemicals molecule takes an average of nine years and Indian companies typically have not focused on developing newer molecules and will face challenges in building these capabilities, while continuing to remain cost competitive.• Threat from genetically-modifi ed seeds: Genetically-modifi ed seeds possess immunity against natural adversaries and thus adversely impact the business of crop protection chemicals.• Need for effi cient distribution systems: Since the number of end users is large and widespread, eff ective distribution via retailers is essential to ensure product availability. Lately, companies have been directly dealing with retailers by cutting the distributor from the value chain thereby reducing distribution costs, educating retailers on product usage and off ering competitive prices to farmers.• Support for integrated pest management and rising demand for organic farming: Promotion of integrated pest management, zero-budget farming and usage of bio-pesticides by the Indian Government and NGOs has hampered crop protection chemicals demand growth. As such, crop protection chemicals companies will have to address concerns pertaining to the negative impact of crop protection chemicals usage.
Opportunities• Scope for increase in usage: With lower proportion of the total farmland under the coverage of crop protection chemicals, there is a signifi cant unserved market that can be tapped into. By educating farmers and conducting special training programmes regarding the need to use crop protection chemicals, Indian companies can hope to increase crop protection chemicals consumption.• Huge export potential: The excess production capacity is a perfect opportunity to increase exports by utilising India’s low-cost manufacturing capabilities. • Product portfolio expansion: Threats like genetically-modifi ed seeds, integrated pest management and organic farming, among others, can be turned into opportunities if the industry reorients itself to better address the needs of its consumers and broadens its product off ering to include a range of inputs instead of only crop protection chemicals. • Off -patent products: A multitude of products going off -patent would unleash a generics opportunity worth ~USD 3 billion between CY17 and CY20. By leveraging the strength of top-notch R&D and integrated manufacturing facilities, sectoral players can grab this imminent opportunity in the generics market.
SWOT analysisStrengths• Global manufacturing facilities• Robust supply chain• In-depth R&D capabilities• Wide product portfolio • Seamless quality control• Strong backward integration• Deep marketing reach
Opportunities• USD 3 billion worth of crop protection chemicals to go off -patent by 2020• Labour shortages
Weaknesses• Competitive market• High working capital requirement• Cumbersome product registration process
Threats• Unfavourable governmental policies• Falling commodity prices• Currency volatilities• Climate change
OPPORTUNITIES
STRENGTHS
S
T
W
THREATS
WEAKNESSES
O
UPL Limited Annual Report, 2017-18 64

Operational reviewUPL has 35 manufacturing locations across the globe (16 in India and 19 in various countries). The Company embraced the tenets laid down under the 5S philosophy across its plants to bolster effi ciency levels and practically nullify leakages. UPL is one of the low cost producers in the world. The Company’s Indian plants are capable of manufacturing the entire range of products from AIs to formulations while the global plants are responsible for manufacturing local geography-specifi c formulations. Indian plants are ~30-40% cheaper than its global counterparts and enjoy lower labour costs.
Technology competence The Company invested in state-of-the-art technology to produce trailblazing products. Procedural excellence and a strong technology background allow the Company to produce products better than inventing.
Quality focusUPL has focused on standardising operating procedures across the plants which has helped reduce quality variations and thereby signifi cantly bring down customer complaints.
Highlights, 2017-18 • Initiated a variability reduction programme by laying down uniform SOP
• Built 9 plants in India and one in Brazil in half the time taken by sectoral peers• Installed robotised packing machines to ensure standardised packaging • Initiated various programmes to reduce fossil fuel consumption • Saved around H65 crore through various farsighted initiatives• Kick started a TQM initiative partially at its plants
Outlook The Company will continue to undertake initiatives that would help it to reduce operating costs. The Company will also ensure the complete implementation of TQM across the organisation.
Operating cost as a proportion of total revenues (%)
FY2016 FY2017 FY2018
48.1% 47.6% 47.0%
Declining customer complaints
FY2016 FY2017 FY2018
680 453 398
Health UPL regularly checks the health of its employees, across plants. Employees exposed to hazardous gases are taken for compulsory health checkups. All the units of the Company have health centres manned round-the-clock by competent doctors and nurses.
Safety The Company embraced the tenets laid down under the 5S philosophy across its plants to bolster effi ciency levels and practically nullify leakages. All units start operations with a session on safety. Every single employee is provided with minimum fi ve man-days of safety training.
Each department appoints one plant safety representative responsible for managing unit safety. The Company witnessed a 30% drop in untoward incidents at the workplace during the year under review. UPL has dedicated emergency response team to attend to such incidents. The team also helps in attending emergency situations in the surrounding areas of
Segmental review • Agro activities: This is the main area of the Company’s operations and includes the manufacture and marketing of conventional crop protection chemicals products, seeds and related products. Revenues from the segment increased at a rate of 5% y-o-y to reach H16,734 crore.• Non-agro activities: Non-agro activities include the manufacture and marketing of industrial chemicals and related products. Revenues from the segment increased at a rate of 17% y-o-y to reach H772 crore.
Overview
Strategyreview Performance Governance Financials
65

the plants. The Company followed a strict incident reporting system with even minor incidents being logged into the MIS of the safety department. Each incident is analysed for their root-causes and required precautions are taken to prevent recurrences. Each project undertaken by the Company is made to undergo HAZOP studies before commencement. All plant-setting changes were fi rst cleared by the HAZOP team before
being implemented. The safety team regularly conducts safety awareness programmes across plants to achieve continuous improvement in terms of workplace safety and behavioural transformation.
Environment UPL has been consistently undertaking initiatives to eliminate emissions, reduce effl uent discharge and ensure
safe waste disposal. The Company has deployed dedicated green cells, across units. The Company invested in RO plants across to recycle water and reuse it for operations. The Company invested in process intensifi cation to reduce chemical oxygen demand at the source. The Company developed bacteria for chemical culture and waste reduction. UPL also installed best-in-class scrubbers to minimise emission of chemicals, fumes and dust.
Key ratios
Particulars 2017-18 2016-17EBIDTA/Turnover 22.7% 20.9%EBIDTA/Net interest (number of times) 8.23 6.81Net Debt-equity ratio 0.42 0.47Return on equity (%) 22.1% 23.4%Book value per share (H) 180 146Earnings per share (H) 39.79 34.07
Mitigating risks at UPLIndustry slowdown might result in low stock turnover and reduced revenue growthMitigation strategy: According to UN, the current world population of 7.5 billion is expected to reach 8.5 billion by 2030 and 9.8 billion in 2050 strengthening food demand without a commensurate increase in land area availability. This will increase the need for high-yielding crops (supported by a growing use of crop protection chemicals). The diversifi ed UPL portfolio and presence across the globe
will help the Company in reducing its dependence on a single crop or segment or a particular region.
Increased competition might impact prices and thus aff ect profi tability Mitigation strategy: To achieve success in a competitive marketplace, companies require the ability to manufacture competitively, get the right registrations, engage with distributors in all markets, provide a large product range and keep evolving that product range in response to evolving consumer requirements. UPL possesses all these competencies (as opposed to some competitors who
possess only a few), graduating it to one of the world’s fastest-growing crop protection chemicals companies.
Not introducing innovative products might result in losing out in the competitive business scenario that might translate in lower revenue growthMitigation strategy: UPL’s 305-member research and development team keeps continuously working on introducing innovative and diff erentiated products and processes. The Company also collaborated with universities and technical institutions to formulate new products.
Financial analysisRevenue from operationsRevenues earned during the year stood at H17,506 crore, growing by 5% compared to H16,680 crore in FY2016-17.
Finance costsFinance costs increased by 6% during the year primarily on account of mark-to-market losses.
Profi t before taxThe Company registered a profi t before tax of H2,305 crore compared to H1,922 crore in the previous year.
Profi t after taxThe Company registered a profi t after tax of H2,030 crore compared to H1,733 crore in the previous year.
UPL Limited Annual Report, 2017-18 66

The Company’s product might be out priced in the competitive marketplace resulting in losing out to competitorsMitigation strategy: UPL has strategically capitalised on the cost-eff ective availability of labour and its sizeable production capacity that provides UPL with economies- of-scale.
Currency value fl uctuations might impact the earnings of the CompanyMitigation strategy: The Company has businesses across the globe. Its crop protection chemicals are marketed in 130 countries. It also imports intermediates from diff erent countries. Thus it is exposed to fl uctuations in exchange rates of multiple currencies. The Company mitigates this risk by remaining hedged. Wherever possible, exports act as natural hedge against imports. In all other cases, the Company uses forward covers to hedge against volatility.
Droughts and reduced pest attacks can lower demand for crop protection chemicals Mitigation strategy: The demand for UPL’s products depends on weather patterns and pest attacks. Demand for crop protection chemicals is adversely impacted by drought and fewer pest attacks, resulting in inventory buildup. To mitigate this risk, UPL has strengthened its supply chain and product portfolio, and has diversifi ed across geographies. Its product portfolio has expanded year after year, ensuring regular supply of products for diverse applications.
Resistance development reduces life of product and might result in product obsolescenceMitigation strategy: The eff ective life of crop protection chemicals gets reduced over time, as the targeted pests develop resistance against them. Constant innovation and regular introduction of diff erentiated formulations is essential for eff ectively addressing pest attacks. To mitigate this risk, UPL has set up a capable R&D team, comprising chemists, chemical engineers and other experts to work constantly on developing new products and processes. The Company protects its innovative products by getting them patented promptly.
Inability to procure adequate raw material at the right cost could impact viability.Mitigation strategy: ~39% of UPL’s production is backed by captive raw material access to phosphorus, chloralkali and power. A dedicated procurement team evaluates raw material costs from existing and alternative vendors.
Internal control systems and their adequacyThe Company has adequate internal controls in place across various business units and functions. Internal controls improve the effi ciency, management eff ectiveness and safeguards assets of the organisation. At UPL, internal control is implemented through the following initiatives: • Accurate and timely recording of transactions with multi-layered system of checks and balances
• Implementation of ERP enabling real time data access • Implementation of accounting policies in line with prescribed standards• Periodic reviews of long-term plans and annual budgets • Implementation of business intelligence to measure consumer preference • Constant monitoring of processes and routine audits
Best HR practicesUPL’s strong HR practices helped reinforce our market leadership and cross-functional coordination across 40+ countries. We employ professionals from 36 countries around the world. We invest in formal and informal training as well as on the- job learning. We transferred key executives across geographies to enrich our international leadership pool. We reinforced engagements with employees across levels by providing an enriched workplace, challenging job profi le and ongoing dialogue. The result: we enjoyed one of the highest employee retention rates in the industry.
Cautionary statementThe statements in the management discussion and analysis section with regard to projections, estimates and expectations have been made in good faith. The achievement of results is subject to risks, uncertainties and even less than accurate assumptions. Market data and information are gathered from various published and unpublished reports. Their accuracy, reliability and completeness cannot be assured.
Overview
Strategyreview Performance Governance Financials
67

UPL Limited Annual Report, 2017-18 68
Corporate information
Board of Directors
Mr. R. D. Shroff - Chairman & Managing Director
Mrs. S. R. Shroff - Vice Chairman
Mr. J. R. Shroff - Global CEO of the Group
Mr. V. R. Shroff - Executive Director
Mr. A. C. Ashar - Director – Finance
Mr. K. Banerjee - Whole - Time Director
Mr. Pradeep Goyal
Dr. Reena Ramachandran
Mr. Pradip Madhavji (Resigned w.e.f. 27th April, 2018)
Mr. Vinod Sethi
Mr. Hardeep Singh
Mr. Vasant P. Gandhi
Chief Financial OfficerMr. Anand Vora
Company SecretaryMr. M. B. Trivedi
Auditors
B S R & Co. LLP
Chartered Accountants
Administrative Office
UPL House, 610 B/2, Bandra Village,
Off Western Express Highway, Bandra (East)
Mumbai - 400 051
Phone: 91 22 7152 8000, Fax: 91 22 7152 8886
Registered Office
3-11, G.I.D.C., Vapi,Dist. : Valsad, Gujarat-396 195.Tel.: 0260-2400717, Fax: 0260-2401823
Bankers
Dena Bank
Bank of Baroda
State Bank of India
Canara Bank
IDBI Bank Ltd.
The Karur Vysya Bank Ltd.
Axis Bank Ltd.
Andhra Bank
ICICI Bank Ltd.
Kotak Mahindra Bank Ltd.
Secretarial Department
Uniphos House, C.D. Marg, Khar (West)
Mumbai - 400 052
Phone: 91 22 2646 8000, Fax: 91 22 2604 1010
Debenture Trustees
IDBI Trusteeship Services Limited
Asian Building, Ground Floor
17. R. Kamani Marg Ballard Estate
Mumbai - 400 001

Overview
Strategyreview Performance Governance Financials
69
UPL LIMITED(CIN: L24219GJ1985PLC025132)
NoticeNOTICE is hereby given that 34th ANNUAL GENERAL MEETING of
the Members of UPL LIMITED will be held on Thursday, 23rd August,
2018 at 11.00 a. m. at Hotel Green View Hall, National Highway No. 8,
Vapi - 396 195, to transact the following business:
ORDINARY BUSINESS:
1. To consider and adopt:
a) The audited standalone financial statements of the
Company for the financial year ended on 31st March, 2018
and the Reports of the Board of Directors and Auditors
thereon.
b) The audited consolidated financial statements of the
Company for the financial year ended on 31st March, 2018
and the Report of the Auditors thereon.
2. (a) To declare dividend on equity shares.
(b) To ratify payment of dividend on Preference Shares.
3. To appoint a Director in place of Mr. Vikram Rajnikant Shroff
(DIN: 00191472), Non-Executive Director, who retires by
rotation and being eligible, offers himself for re-appointment.
4. To appoint a Director in place of Mr. Arun Chandrasen Ashar
(DIN: 00192088), Whole-time Director, who retires by rotation
and being eligible, offers himself for re-appointment.
SPECIAL BUSINESS:
5. To approve the remuneration of the Cost Auditors for the
financial year ending March 31, 2019
To consider and if thought fit, to pass, the following resolution
as an Ordinary Resolution:
“RESOLVED THAT pursuant to the provisions of Section 148 and
all other applicable provisions of the Companies Act, 2013 and
the Companies (Audit and Auditors) Rules, 2014 (including any
statutory modification(s) or re-enactment thereof, for the time
being in force), M/s. RA & Co., (Firm Registration No. 000242),
Cost Accountants appointed as Cost Auditors by the Board
of Directors of the Company, to conduct the audit of the cost
records of the Company for the financial year ending March 31,
2019, be paid remuneration amounting to H 7,00,000/- (Rupees
Seven Lakhs Only) plus tax, as applicable, and out of pocket
expenses if any."
6. Private placement of Non-Convertible Debentures
To consider and if thought fit, to pass, the following resolution
as a Special Resolution:
“RESOLVED THAT pursuant to the provisions of Sections 42, 71
and other applicable provisions, if any, of the Companies Act,
2013 and the Rules made thereunder, as amended from time
to time, consent of the Company be and is hereby accorded
to the Board of Directors (hereinafter referred to as the “Board”,
which term shall be deemed to include any Committee of
the Board constituted to exercise its powers, including the
powers conferred by this Resolution) for making offer(s) or
invitation(s) to subscribe to Non-Convertible Debentures on
private placement basis, in one or more tranches, such that the
total amount does not exceed H 3,000 crores (Three Thousand
Crores only) during a period of one year from the date of
passing of this Resolution and that the said borrowing is within
the overall borrowing limits of the Company.
RESOLVED FURTHER that the Board be and is hereby
authorized to take all such steps as may be necessary, proper
and expedient to give effect to this Resolution.”
7. To consider and re-appoint Mr. Rajnikant Devidas Shroff (DIN:
00180810) as Chairman and Managing Director and if thought
fit, to pass the following resolution as a Special Resolution:
“RESOLVED THAT in accordance with the provisions of
Sections 196, 197, 198 and 203 read with Schedule V and all
other applicable provisions, if any, of the Companies Act, 2013
(“the Act”) and Rules made thereunder (including any statutory
modification(s) or re-enactment thereof, for the time being
in force), the relevant provisions of the Articles of Association
of the Company and all applicable guidelines issued by
the Central Government from time to time and subject to
such other approvals, as may be necessary, consent of the
members of the Company be and is hereby accorded to the re-
appointment of Mr. Rajnikant Devidas Shroff (DIN: 00180810)
as Chairman and Managing Director of the Company, for a
further period of 5 (five) years from the expiry of his present
term of office, i.e., with effect from 1st October, 2018, on the
terms and conditions including remuneration as set out in
the Statement annexed to the Notice, with further liberty to

UPL Limited Annual Report, 2017-18 70
the Board of Directors of the Company (hereinafter referred
to as “the Board” which term shall be deemed to include any
Committee constituted / to be constituted by the Board) from
time to time to alter and vary the terms and conditions of the
re-appointment and/or remuneration of Mr. Rajnikant Devidas
Shroff in the best interest of the Company and subject to the
same not exceeding the limits specified in Schedule V to the
Act, including any statutory modification or re-enactment
thereof for the time being in force or as may hereafter be made
by the Central Government in that behalf from time to time, or
any amendments thereto as may be agreed to between the
Board and Mr. Rajnikant Devidas Shroff.
RESOLVED FURTHER THAT Mr. Rajnikant Devidas Shroff shall
not be subject to retirement by rotation during his tenure as the
Managing Director of the Company. So long as Mr. Rajnikant
Devidas Shroff functions as the Managing Director, he shall not
be paid any fees for attending the meetings of the Board or any
Committee(s) thereof of the Company.
RESOLVED FURTHER THAT the Board be and is hereby
authorized to do all acts and take all such steps as may be
necessary, proper or expedient to give effect to this resolution.”
8. To consider and re-appoint Mr. Arun Chandrasen Ashar (DIN:
00192088) as Whole-time Director designated as Director-
Finance and if thought fit, to pass the following resolution as a
Special Resolution:
“RESOLVED THAT in accordance with the provisions of
Sections 196, 197, 198 and 203 read with Schedule V and all
other applicable provisions, if any, of the Companies Act, 2013
(“the Act”) and Rules made thereunder (including any statutory
modification(s) or re-enactment thereof, for the time being in
force), the relevant provisions of the Articles of Association of
the Company and all applicable guidelines issued by the Central
Government from time to time and subject to such other
approvals, as may be necessary, consent of the members of the
Company be and is hereby accorded to the re-appointment
of Mr. Arun Chandrasen Ashar (DIN: 00192088) as Whole-time
Director designated as Director-Finance of the Company, for a
further period of 5 (five) years from the expiry of his present
term of office, i.e., with effect from 1st October, 2018, on the
terms and conditions including remuneration as set out in
the Statement annexed to the Notice, with further liberty to
the Board of Directors of the Company (hereinafter referred
to as “the Board” which term shall be deemed to include any
Committee constituted / to be constituted by the Board) from
time to time to alter and vary the terms and conditions of the
re-appointment and/or remuneration of Mr. Arun Chandrasen
Ashar in the best interest of the Company and subject to the
same not exceeding the limits specified in Schedule V to the
Act, including any statutory modification or re-enactment
thereof for the time being in force or as may hereafter be made
by the Central Government in that behalf from time to time, or
any amendments thereto as may be agreed to between the
Board and Mr. Arun Chandrasen Ashar.
RESOLVED FURTHER THAT Mr. Arun Chandrasen Ashar shall
not be subject to retirement by rotation during his tenure as
the Whole-time Director of the Company. So long as Mr. Arun
Chandrasen Ashar functions as the Whole-time Director, he
shall not be paid any fees for attending the meetings of the
Board or any Committee(s) thereof of the Company.
RESOLVED FURTHER THAT the Board be and is hereby
authorized to do all acts and take all such steps as may be
necessary, proper or expedient to give effect to this resolution.”

Overview
Strategyreview Performance Governance Financials
71
1. A MEMBER ENTITLED TO ATTEND AND VOTE AT THE MEETING IS ENTITLED TO APPOINT A PROXY TO ATTEND AND VOTE INSTEAD OF HIMSELF AND SUCH PROXY NEED NOT BE A MEMBER. The instrument appointing proxy in order to be effective should be duly stamped, completed and signed and should be deposited at the Registered Office of the Company not later than 48 hours before the time fixed for the meeting.
A person can act as a proxy on behalf of members not exceeding fifty and holding in the aggregate not more than ten percent of the total share capital of the Company carrying voting rights. A member holding more than ten percent of the total share capital of the Company carrying voting rights may appoint a single person as proxy and such person shall not act as a proxy for any other person or shareholder.
2. All documents referred to in the accompanying Notice are open for inspection at the Registered Office of the Company on all working days except Saturdays between 11.00 a.m. and 1.00 p.m. up to the date of 34th Annual General Meeting.
3. Corporate members intending to send their authorized representatives to attend the Meeting are requested to send to the Company a certified true copy of the Board Resolution authorizing their representative to attend and vote on their behalf at the Meeting.
4. Members/Proxies should bring the Attendance Slip duly filled in for attending the meeting.
5. The Register of Members and The Share Transfer Books of the Company will remain closed from Saturday, 11th August, 2018 to Thursday, 23rd August, 2018 (both days inclusive).
6. The Members are requested to kindly send all their correspondence relating to the change of address, transfer of shares, etc. directly to the Company’s Registrar & Transfer Agents – Link Intime India Ltd., Unit: UPL Limited, C 101, 247 Park, L B S. Marg, Vikhroli (West), Mumbai 400 083, quoting their Folio Number and in case their shares are held in dematerialised form, the intimation of change of address should be passed on to their respective Depository Participants.
7. Payment of dividend as recommended by the Directors, if declared at the Meeting, will be made on or after 28th August, 2018 to the Members whose names stand in the Company's Register of Members on 23rd August, 2018 and to the Beneficiary Holders as per the Beneficiary List provided for the purpose by the National Securities Depository Limited and Central Depository Services (India) Limited.
8. Members seeking any information with regard to Accounts are requested to write to the Company at an early date so as to enable the management to keep the information ready.
9. Pursuant to the provisions of Section 205A of the Companies Act, 1956, unclaimed dividend for the financial year 1994-95 has been transferred to the General Revenue Account of the
Central Government as required by the Companies Unpaid Dividend (Transfer to General Revenue Account of the Central Government) Rules, 1978. Members who have not encashed the Dividend Warrants pertaining to the said period may make their claims to the Registrar of Companies, Gujarat, Ahmedabad by submitting an application in prescribed form.
10. Pursuant to the provisions of Section 205A(5) of the Companies Act, 1956/ Section 124(5) of the Companies Act, 2013 , as amended-
(a) Dividend for the year 1996-97 and from 2003-04 to 2009-10 which remained unclaimed for a period of seven years from the date of transfer of same to the unpaid dividend account of the Company have been transferred to the Investor Education and Protection Fund established by the Central Government pursuant to Section 205C of the Companies Act, 1956/ Section 125(1) of the Companies Act, 2013.
(b) Dividend / Interim Dividend for the years 2010-11 to 2016-17 which remain unclaimed for a period of seven years from the date of transfer of same to the unpaid dividend account of the Company will be transferred to the Investor Education and Protection Fund established by the Central Government pursuant to Section 125(1) of the Companies Act, 2013.
Pursuant to the provisions of Investor Education and Protection Fund (Uploading of information regarding unpaid and unclaimed amounts lying with companies) Rules, 2012, the Company has uploaded the details of unpaid and unclaimed amounts lying with the Company as on 8th July, 2017, on the website of the Company i.e. www.uplonline.com and also on the website of the Ministry of Corporate Affairs.
10A. a) Adhering to the various requirements set out in the Investor Education and Protection Fund Authority (Accounting, Audit, Transfer and Refund) Rules, 2016, as amended, the Company has, during financial year 2017-18, transferred to the IEPF Authority all shares in respect of which dividend had remained unpaid or unclaimed for seven consecutive years or more as on the due date of transfer, i.e. 30th November, 2017. Details of shares transferred to the IEPF Authority are available on the website of the Company and the same can be accessed through the link https://www.uplonline.com/pdf/policies/IEPF_News.pdf . The said details have also been uploaded on the website of the IEPF Authority and the same can be accessed through the link www.iepf.gov.in
(b) Members may note that shares as well as unclaimed dividends transferred to IEPF Authority can be claimed back from them. Concerned members/investors are advised to visit the web link http://iepf.gov.in/IEPFA/refund.html or contact Link Intime India Pvt. Ltd. for lodging claim for refund of shares and / or dividend from the IEPF Authority.
11. Members who have not registered their e-mail addresses so far, are requested to register their e-mail address for receiving all
NOTES:

UPL Limited Annual Report, 2017-18 72
communication including Annual Report, Notices, Circulars, etc. from the Company electronically.
12. Voting Options (1) Voting through Electronic Means: Pursuant to provisions of Section 108 of the Companies
Act, 2013 and Rule 20 of the Companies (Management and Administration) Rules, 2014, as amended by the Companies (Management and Administration) Amendment Rules, 2015 and Regulation 44 of Securities and Exchange Board of India (Listing Obligations and Disclosure Requirements) Regulations, 2015 and Secretarial Standard-2 (SS-2) on “General Meetings” issued by the Institutes of Company Secretaries of India, the Company is pleased to provide members facility to exercise their right to vote at the General Meeting by electronic means and the business may be transacted through e-Voting Services. The facility of casting the votes by the members using an electronic voting system from a place other than venue of the General Meeting (“remote e-voting”) will be provided by National Securities Depository Limited (NSDL).
The Company has approached NSDL for providing remote e-voting services through e-voting platform. In this regard, your Demat Account/Folio Number has been enrolled by the Company for your participation in remote e-voting on resolutions placed by the Company on remote e-Voting system.
The Notice of the 34th Annual General Meeting of the Company inter alia indicating the process and manner of remote e-Voting process along with printed Attendance Slip and Proxy Form can be downloaded from the link https://www.evoting.nsdl.com or link https://www.uplonline.com
The remote e-voting period commences on August 20, 2018 (9:00 am) and ends on August 22, 2018 (5:00 pm). During this period, shareholders of the Company, holding shares either in physical form or in dematerialized form, as on the cut-off date of 16th August, 2018, may cast their vote by remote e-voting. The remote e-voting module shall be disabled by NSDL for voting thereafter. Once the vote on a resolution is cast by the shareholder, the shareholder shall not be allowed to change it subsequently.
The voting rights of members shall be in proportion to their shares of the paid up equity share capital of the Company as on the cut-off date i.e. August 16, 2018.
Subject to receipt of requisite number of votes, the Resolutions shall be deemed to be passed on the date of the Meeting, i.e. 23rd August, 2018.
The process and manner for remote e-voting are as under:
A. In case a Member receives an email from NSDL [for members whose email IDs are registered with the Company/Depository Participants(s)] :
i) Open email and open PDF file viz; “UPL remote e-voting.pdf” with your Client ID or Folio No. as password. The said PDF file contains your user ID and password/PIN for remote e-voting. Please note that the password is an initial password.
ii) Launch internet browser by typing the following URL: https://www.evoting.nsdl.com/
iii) Click on Shareholder - Login
iv) Enter user ID and password as initial password/PIN noted in step (i) above. Click Login.
v) Password change menu appears. Change the password/PIN with new password of your choice with minimum 8 digits/characters or combination thereof. Note new password. It is strongly recommended not to share your password with any other person and take utmost care to keep your password confidential.
vi) Home page of remote e-voting opens. Click on remote e-voting: Active Voting Cycles.
vii) Select “EVEN” of “UPL Limited”.
viii) Now you are ready for remote e-voting as Cast Vote page opens.
ix) Cast your vote by selecting appropriate option and click on “Submit” and also “Confirm” when prompted.
x) Upon confirmation, the message “Vote cast successfully” will be displayed.
xi) Once you have voted on the resolution, you will not be allowed to modify your vote.
xii) Institutional shareholders (i.e. other than individuals, HUF, NRI etc.) are required to send scanned copy (PDF/JPG Format) of the relevant Board Resolution/ Authority letter etc. together with attested specimen signature of the duly authorized signatory(ies) who are authorized to vote, to the Scrutinizer through e-mail to [email protected] with a copy marked to [email protected]
B. In case a Member receives physical copy of the Notice of Annual General Meeting [for members whose email IDs are not registered with the Company/Depository Participant(s) or requesting physical copy]
(i) Initial password is provided as below/at the bottom of the Attendance Slip for the Annual General Meeting.
EVEN (Remote e-voting Event Number) USER ID PASSWORD/PIN
(ii) Please follow all steps from Sl. No. (ii) to (xii) above, to cast vote.
(2) Voting at AGM: The Chairman shall, at the 34th Annual General Meeting, at
the end of discussion on the resolutions on which voting is to be held, allow voting with the assistance of scrutinizer, by use of ballot paper for all those members who are present at the General Meeting but have not cast their votes by availing the remote e-voting facility.
Please note the following: A member may participate in the 34th Annual General Meeting
even after exercising his right to vote through remote e-voting

Overview
Strategyreview Performance Governance Financials
73
but shall not be allowed to vote again at the General Meeting.
A person, whose name is recorded in the register of members or in the register of beneficial owners maintained by the depositories as on the cut-off date i.e. August 16, 2018 only shall be entitled to avail the facility of remote e-voting as well as voting at the General Meeting through ballot paper.
The Board of Directors have appointed Mr. Jawahar Thacker, Chartered Accountant (Membership No. FCA 030646), as the Scrutinizer to scrutinize the voting and remote e-voting process in a fair and transparent manner.
The Scrutinizer shall after the conclusion of voting at the general meeting, will first count the votes cast at the meeting and thereafter unblock the votes cast through remote e-voting in the presence of at least two witnesses not in the employment of the Company and shall make, not later than 48 hours of the conclusion of the General Meeting, a consolidated scrutinizer’s report of the total votes cast in favour or against, if any, to the Chairman or a person authorized by him in writing, who shall countersign the same and declare the result of the voting forthwith.
The results of voting will be declared and the same along with the Scrutinizers Report will be published on the website of the Company (www.uplonline.com) and the website of NSDL (www.nsdl.com) immediately after the declaration of result by the Chairman and the same will also be communicated to BSE Limited and the National Stock Exchange of India Limited within 48 hours from the conclusion of the Annual General Meeting.
Other information: Login to remote e-voting website will be disabled upon five
unsuccessful attempts to key-in the correct password. In such an event, you will need to go through 'Forgot Password' option available on the site to reset the same.
Your login id and password can be used by you exclusively for remote e-voting on the resolutions placed by the companies in which you are the shareholder.
It is strongly recommended not to share your password with any other person and take utmost care to keep it confidential.
Any person, who acquires shares of the Company and becomes member of the Company after dispatch of the notice and holding shares as on the cut-off date i.e. August 16, 2018, may obtain the login ID and password by sending a request at [email protected] or contact Company’s Registrar & Transfer Agent.
However, If you are already registered with NSDL for remote e-voting then you can use your existing user ID and password/PIN for casting your vote. If you forgot your password, you can reset your password by using “Forgot User Details/Password” option available on www.evoting.nsdl.com or contact NSDL at the toll free no.: 1800-222-990.
You can also update your mobile number and e-mail id in the user profile details of the folio which may be used for sending future communication(s).
In case of any queries, you may refer to the Frequently Asked Questions (FAQs) for members and remote e-voting user manual for members available at the Downloads sections of https://www.evoting.nsdl.com or contact NSDL at the toll free no.: 1800-222-990.
Name of the Director Mr. Rajnikant Devidas Shroff
Director Identification Number 00180810
Date of joining the Board 1st October, 1992
Profile of the Director Mr. R. D. Shroff is Chairman and Managing Director of the Company. He has been associated with the group
since inception. He has extensive experience in the chemical industry and has been closely involved with
the Research and Development of all the Group’s products. His technical expertise was instrumental in
erstwhile United Phosphorus Limited winning the Government’s Gold Shield Award. He has held various
important positions in commercial, educational and social fields. He is Hon. Consul of Mexico.
No. of shares held in the
Company
10000
Directorships and Committee
memberships in other
companies*
1. Uniphos Enterprises Limited
2. Shroffs United Chemicals Limited
3. Nivi Trading Limited, Member, Audit Committee.
4. Uniphos International Limited
5. Enviro Technology Limited
6. Agri Net Solutions Limited
7. SWAL Corporation Limited
8. Bharuch Enviro Infrastructure Limited
13. The information of Directors being appointed/ re-appointed as required under Regulation 36(3) of SEBI (Listing Obligations and Disclosure
Requirements) Regulations, 2015:

UPL Limited Annual Report, 2017-18 74
Name of the Director Mr. Vikram Rajnikant Shroff
Director Identification Number 00191472
Date of joining the Board 22nd April, 2006
Profile of the Director Mr. Vikram Rajnikant Shroff is a science graduate from University of Mumbai. Earlier he was having
independent charge of HR Functions, Purchase, Commercial, marketing (local), production and
implementation of SAP system. Now, he is looking after all these functions on global level.
No. of shares held in the
Company
4502883
Directorships and Committee
memberships in other
companies*
1. Agrinet Solutions Limited
2. Shroffs United Chemicals Limited
3. Mrugal Properties Limited
4. Agraja Properties Limited
Name of the Director Mr. Arun Chandrasen Ashar
Director Identification Number 00192088
Date of joining the Board 1st March, 1993
Profile of the Director Mr. A. C. Ashar is a Chartered Accountant. He was associated with the group in the capacity of
consultant prior to his joining of the Board. He looks after the financial functions of the Company and
has been instrumental in raising finance for various projects of the Company.
No. of shares held in the
Company
263152
Directorships and Committee
memberships in other
companies*
1. Uniphos Enterprises Limited, Member – Audit Committee and Stakeholders Relationship Committee
2. Agri Net Solutions Limited
3. Bharuch Enviro Infrastructure Limited, Member, Audit Committee.
4. Enviro Technology Limited, Member, Audit Committee.
5. Tatva Global Environment (Deonar) Limited
6. Shivalik Solid Waste Management Limited, Chairman, Audit Committee.
7. Kerala Enviro Infrastructure Limited
*Directorships and Committee memberships in UPL Limited and its Committees are not included in the aforesaid disclosure. Also, directorships
in Private Limited Companies, Foreign Companies and Section 8 companies and their Committee memberships are excluded. Membership and
Chairmanship of Audit Committees and Stakeholders Relationship Committees of only public Companies have been included in the aforesaid
table.
Mumbai: 27th April, 2018 By Order of the Board of Directors
For UPL LIMITED
Registered Office:
3-11, G.I.D.C., Vapi, Dist. Valsad, Gujarat, Rajnikant Devidas Shroff
Pin - 396 195. Chairman and Managing Director
CIN: L24219GJ1985PLC025132 (DIN: 00180810)

Overview
Strategyreview Performance Governance Financials
75
The Explanatory Statement for Item Nos. 5 to 8 of the accompanying
Notice set out hereinabove is as under:
Item No. 5:
The Board, on the recommendation of the Audit Committee, has
approved the appointment and remuneration of M/S. RA & Co., Cost
Auditors to conduct the audit of the cost records of the Company
for the financial year ending March 31, 2019.
In accordance with the provisions of Section 148 of the Companies
Act, 2013 read with the Companies (Audit and Auditors) Rules, 2014,
the remuneration payable to the Cost Auditors has to be ratified by
the shareholders of the Company.
Accordingly, consent of the members is sought for passing
an Ordinary Resolution as set out at Item No. 5 of the Notice for
ratification of the remuneration payable to the Cost Auditors for the
financial year ending March 31, 2019.
None of the Directors / Key Managerial Personnel of the Company
/ their relatives are, in any way, concerned or interested, financially
or otherwise, in the resolution set out at Item No. 5 of the Notice.
The Board commends the Ordinary Resolution set out at Item No.
5 of the accompanying Notice for approval by the Members of the
Company.
Item No.6:
As per Sections 42 and 71 of the Act, read with the Rules framed
thereunder, a company offering or making an invitation to subscribe
to Non-Convertible Debentures (NCDs) on a private placement
basis, is required to obtain the prior approval of the Members by
way of a Special Resolution. Such an approval can be obtained once
a year for all the offers and invitations to be made for such NCDs
during the year.
NCDs, issued on private placement basis, are a significant source of
borrowings for the Company. The approval of the Members is being
sought by way of a Special Resolution under Sections 42 and 71 of the
Act read with the Rules made thereunder, to enable the Company
to offer or invite subscriptions of NCDs on a private placement basis,
in one or more tranches for an amount not exceeding H 3,000 crores
(Rupees Three Thousand Crores Only) during the period of one
year from the date of passing of the Resolution at Item No.6, within
the overall borrowing limits of the Company, as approved by the
Members from time to time.
The Board commends the Special Resolution at Item No.6 of the
accompanying Notice for approval by the Members of the Company.
None of the Directors / Key Managerial Personnel of the Company
/ their relatives are, in any way, concerned or interested, financially
or otherwise, in the resolution set out at Item No. 6 of the Notice.
Item Nos. 7 and 8
The Board of Directors of the Company (“the Board”) at its meeting
held on 27th April, 2018 have, subject to approval of members of the
Company, re-appointed Mr. Rajnikant Devidas Shroff (DIN: 00180810)
as Chairman and Managing Director and Mr. Arun Chandrasen Ashar
(DIN: 00192088) as Whole-time Director designated as Director-
Finance for further period of 5 (Five) years from the expiry of their
present term of office, i.e., with effect from 1st October, 2018 on
terms and conditions including remuneration as recommended
by the Nomination and Remuneration Committee of the Board and
approved by the Board.
As per the first proviso of Section 196(3)(a) of the Act read with Part-
1 of Schedule V provides that no Company shall appoint any person
as Managing Director, Whole-time Director or Manager who has
attained the age of 70 years unless it is approved by the Shareholders
as Special Resolutions in General Meeting. Mr. Rajnikant Devidas
Shroff and Mr. Arun Chandrasen Ashar are over 70 years of age on
the date of re-appointment.
It is proposed to seek the approval of the members of the Company
for the re-appointment of and remuneration payable to aforesaid
two Directors of the Company, in terms of the applicable provisions
of the Act.
Mr. Rajnikant Devidas Shroff has rich and varied experience in the
Industry and has been involved in the operations of the Company
over a long period of time. Mr. Rajnikant Devidas Shroff has provided
dedicated and meritorious services and significant contribution
to the overall growth of the Company and guided the Company
since inception of the Company and through five decades of
diversification and growth, the Company has emerged as one of
the most competitive total crop solutions Company and one of the
world's top companies in the agro industry. Keeping this in view, it
would be in the interest of the Company to re-appoint Mr. Rajnikant
Devidas Shroff, as Chairman and Managing Director. Mr. Rajnikant
Devidas Shroff is a science graduate and has been at the helm of
UPL Group since 1969.
Mr. Arun Chandrasen Ashar is a Chartered Accountant and has rich
and varied experience in the Industry and has been involved in the
operations of the Company over a long period of time He has provided
dedicated and meritorious services and significant contribution to
the overall growth of the Company. Keeping this in view, it would be
in the interest of the Company to re-appoint Mr. Arun Chandrasen
Ashar, as Whole-time Director designated as Director-Finance.
EXPLANATORY STATEMENT PURSUANT TO SECTION 102(1) OF THE COMPANIES ACT, 2013.

UPL Limited Annual Report, 2017-18 76
The broad particulars of remuneration payable to and the terms of
the respective re-appointments of Mr. Rajnikant Devidas Shroff and
Mr. Arun Chandrasen Ashar during the tenure of their respective re-
appointments are as under:
a) Salary, Perquisites and Allowances per month:
Name Designation Salary per month
H
Mr. Rajnikant
Devidas Shroff
Chairman and
Managing Director
45,00,000/-
Mr. Arun
Chandrasen Ashar
Director-Finance 11,00,000/-
b) Remuneration based on net profits:
In addition to the salary, perquisites and allowances, Mr.
Rajnikant Devidas Shroff and Mr. Arun Chandrasen Ashar shall
be entitled to receive remuneration based on net profits. Such
remuneration based on net profits payable to above Directors
of the Company will be determined by the Board and / or any
Committee constituted / to be constituted by the Board for
each financial year as may be permissible at law.
c) Long-term Incentive Compensation / Employee Stock Option
as per the plan applicable to Executive Directors and/or Senior
Executives of the Company / UPL Group, including that of any
parent / subsidiary company as may be decided by the Board.
It is clarified that employees stock options granted / to be
granted to aforesaid Directors, from time to time, shall not
be considered as a part of perquisites and that the perquisite
value of stock options exercised shall be in addition to the
remuneration under (a) above.
d) Perquisites:
Perquisites as follows shall be allowed in addition to the
salary and remuneration based on net profits to each of the
re-appointees. The said perquisites and allowances will be
evaluated, wherever applicable, as per the provisions of Income-
tax Act 1961 or rules framed thereunder or any statutory
modification(s) or re-enactment(s) thereof; in the absence of
any such rules, perquisites and allowances shall be evaluated at
actual cost:
i) Housing: Free accommodation (furnished or otherwise) or
house rent allowance in lieu thereof;
ii) Reimbursement of expenses on actuals pertaining to
utilisation of electricity, gas, water and other reasonable
expenses for the upkeep and maintenance in respect of
such accommodation;
iii) Medical Expenses Reimbursement: Reimbursement
of all medical expenses incurred for self and family at
actuals (including domiciliary and medical expenses and
insurance premium for medical and hospitalisation policy
as applicable), as per Company’s policy ;
iv) Leave Travel Expenses: Leave Travel Expenses for self and
family in accordance with the policy of the Company;
v) Club Fees: Fees of clubs subject to a maximum of two
clubs. However, life membership and admission fees, shall
not be paid by the Company;
vi) Personal accident Insurance Premium: Personal accident
Insurance of an amount, the annual premium of which
shall not exceed H 4,000/-;
vii) Contribution towards Provident Fund and Superannuation
Fund or Annuity Fund: as per the policy of the Company;*
viii) Gratuity and / or contribution to the Gratuity Fund of
Company: as per the policy of the Company and the same
will not be included in the perquisite; *
* For the purposes of Gratuity, Provident Fund,
Superannuation and other like benefits, if any, the service
of aforesaid Directors will be considered as continuous
service with the Company from the date of their joining
the UPL Group.
ix) Car: Cars with driver shall be provided for use on
company's business and the same will not be considered
as perquisites; use of car for private purposes shall
however, be billed by the Company;
x) Telephones at residence and mobile telephones will
be provided and the same will not be considered as
perquisite but personal long distance calls shall be billed
by the Company;
xi) Other Allowances / benefits, perquisites - any other
allowances, benefits and perquisites as per the Rules
applicable to the Senior Executives of the Company and /
or which may become applicable in the future and / or any
other allowance, perquisites as the Board may from time
to time decide.
xii) Any other one time / periodic retirement allowances /
benefits as may be decided by the Board at the time of
retirement.
xiii) Reimbursement of entertainment and all other expenses
incurred for the business of the Company as per the policy
of the Company.
E. Subject as aforesaid, the aforesaid Directors shall be governed

Overview
Strategyreview Performance Governance Financials
77
by such other Rules as are applicable to the Senior Executives of
the Company from time to time.
F. The aggregate of the remuneration and perquisites as aforesaid
in any financial year shall not exceed the limit from time to time
under Section 197, Section 198 and other applicable provisions
of the Act and Rules made thereunder, read with Schedule V
of the said Act or any statutory modification(s) or re-enactment
thereof for the time being in force, or otherwise as may be
permissible at law.
G. When in any financial year, the Company has no profits or
its profits are inadequate, the remuneration including the
perquisites as aforesaid will be paid to aforesaid Directors in
accordance with the applicable provisions of Schedule V of the
Act, and subject to the approval of the Central Government, if
required.
H. General:
i) The aforesaid Managing Director and the Whole-time
Director will perform their duties as such with regard to all
work of the Company and will manage and attend to such
business and carry out the orders and directions given by
the Board from time to time in all respects and conform to
and comply with all such directions and regulations as may
from time to time be given and made by the Board and
the functions of the Whole-time Director will be under the
overall authority of the Managing Director.
ii) The Managing Director and the Whole-time Director shall
act in accordance with the Articles of Association of the
Company and shall abide by the provisions contained in
Section 166 of the Act with regard to duties of directors.
iii) The Managing Director and the Whole-time Director shall
adhere to the Company’s Code of Conduct.
iv) The office of the Managing Director and the Whole-time
Director may be terminated by the Company or by them by
giving the other 3 (three) months’ prior notice in writing.
The aforesaid Directors satisfy all the conditions set out in Part-I of
Schedule V to the Act as also conditions set out under subsection (3)
of Section 196 of the Act for being eligible for their re-appointment.
They are not disqualified from being appointed as Director in terms
of Section 164 of the Act.
The above may be treated as a written memorandum setting out
the terms of re-appointment of Mr. Rajnikant Devidas Shroff and Mr.
Arun Chandrasen Ashar under Section 190 of the Act.
Details of Mr. Rajnikant Devidas Shroff and Mr. Arun Chandrasen
Ashar are in the “Annexure” to the Notice pursuant to provisions of
(i) the Securities and Exchange Board of India (Listing Obligations
and Disclosure Requirements) Regulations, 2015 and (ii) Secretarial
Standard-2 (SS-2) on “General Meetings”, issued by the Council of
the Institute of Company Secretaries of India.
Mr. Rajnikant Devidas Shroff and Mr. Arun Chandrasen Ashar are
interested in the resolutions which pertain to their respective re-
appointments and remuneration payable to each of them. Further,
Mrs. Sandra Rajnikant Shroff, Mr. Jaidev Rajnikant Shroff and Mr.
Vikram Rajnikant Shroff may also be deemed to be interested in
the resolution pertaining to the re-appointment and remuneration
payable to Mr. Rajnikant Devidas Shroff as they are related to each
other. The other relatives of the aforesaid Directors may also be
deemed to be interested in the resolutions set out at Item Nos. 7
and 8 of the Notice, to the extent of their shareholding interest, if
any, in the Company.
Save and except the above, none of the other Directors / Key
Managerial Personnel of the Company / their relatives are, in any
way, concerned or interested, financially or otherwise, in the
resolutions set out at Item Nos. 7 and 8 of the Notice.
As per the first proviso of Section 196(3)(a) of the Companies,
Act, 2013, the re-appointment of aforesaid Directors and the
remuneration payable to them are required to be approved by the
members in General Meeting by passing special resolutions as they
have attained the age of 70 years.
Your Directors commends the Special Resolutions at Item Nos. 7
and 8 of the accompanying Notice for approval by the Members of
the Company.
Mumbai: 27th April, 2018 By Order of the Board of Directors
For UPL LIMITED
Registered Office:
3-11, G.I.D.C., Vapi,
Dist. Valsad, Gujarat, Rajnikant Devidas Shroff
Pin - 396 195. Chairman and Managing Director
CIN: L24219GJ1985PLC025132 (DIN: 00180810)

UPL Limited Annual Report, 2017-18 78
Your Directors have pleasure in presenting their report and audited accounts for the year ended on 31st March, 2018.
To,
The members of
UPL Limited
FINANCIAL RESULTS (H In crores)
Consolidated StandaloneCurrent Year Previous Year Current Year Previous Year
Total Revenue 17920 17124 7809 7602Earnings before interest, tax, depreciation, amortisation,
exceptionals, prior period adjustments and minority interest
3919 3429 1384 1268
Depreciation/amortisation 675 672 666 655
Finance Cost 783 735 135 149
Exceptional items 63 81 7 46
Loss from Associates 93 19 - -
Profit before tax 2305 1922 576 418
Provision for taxation
Current tax 311 293 180 89
Adjustments of tax relating to earlier years (79) 5 (83) -
Deferred tax 43 (109) (69) 84
Profit after tax 2030 1733 548 245
Minority interest 8 6 - -
Net profit for the year 2022 1727 548 245
OPERATIONAL PERFORMANCE
The Company had another year recording satisfactory results.
While most of the peers in the industry had a negative growth, the
Company recorded a decent growth of about 7%.
Some of the highlights of the Company’s global performance are
as under:
A. Revenue from operations increased by 5% to H 17,506 crores.
B. EBIDTA improved by 14% to H 3,919 crores.
C. Profit before taxes have gone up by 20% to H 2,305 crores.
D. Profit after taxes have gone up by 17% to H 2,029 crores.
Region wise performance highlights are as under:
In India, the market for agrochemicals was fairly flat and grew by
just 7%. During the year, the country recorded below normal rainfall
of about 95% of long period average. In the months of June and
July, there were exceptionally good spells of rain in most parts of
country. But subsequently, prolonged dry spells across the country
were seen. This resulted in decline in sale of fungicides. The southern
states suffered from deficit rains and received good rains only at the
end of the season. Worst floods were witnessed in Gujarat, Rajasthan
and Mumbai. There were heavy floods in Assam, Bihar, Uttar
Pradesh and Odisha. The rabi season was not very encouraging
for agrochemicals, due to low temperatures and higher humidity,
making the crops resistant to pest attacks. At the beginning of the
year, the introduction of GST and confusion in the market prevailing
due to this had significantly adverse effect on Company’s sales. The
channel stopped fresh purchases and old inventory was returned.
Subsequently, the market has adjusted to this new tax regime and
it is expected that in coming years, higher sales can be expected.
Directors Report

Overview
Strategyreview Performance Governance Financials
79
During the year, some of the key brands of the Company did
good business. Significant growth was noticed in business of new
fungicides launched in the earlier year. The Company launched new
speciality/ biological products successfully. Some of the initiatives
like Adarsh Kisan centres taken by the Company in earlier years
were well appreciated by farming community and this helped the
Company to improve its sales.
In North America, some of the herbicides of the Company recorded
very good growth. The western states came out of spells of dry
weather and had bountiful rains. The sale of fungicides for potato
and vegetable market grew. Sale of insecticides also went up as
the cotton planted area increased. However, the commodity prices
remained subdued. The situation is likely to improve in future.
In Latin America, including Brazil, the new insecticide launched got
a very encouraging response. The fungicide business continued to
grow and more areas were treated with Company’s fungicides. At
the beginning of the year, there were delayed rains in north Brazil
and dry season in south Cone and Argentina.
The European market has started improving. Summer heatwaves
prevailed across Southern Europe. Though overall market scenario
was not so favorable, the Company’s performance showed lot of
improvement. It is expected that in coming years, the Company’s
business will continue to grow in Europe. During the year, herbicides
sales grew in sugar beet farming. The Company introduced new
herbicides and fungicides in the market. Business in Germany
rebounded with higher growth. However, due to low disease
pressure in dry weather of Italy and Spain, usage of fungicides
reduced there.
As regards rest of the world, double digit growth was recorded in
Africa and some of the South East Asian countries. In turkey, new
herbicides were successfully launched. The Company continues to
introduce new products in different countries. Business has improved
in China. In Australia, severe summer heat and drought conditions
continue to prevail resulting in low usage of agrochemicals.
FUTURE OUTLOOK
This year, normal monsoons are predicted in India. Onset of timely
monsoon will result in on time sowing thereby ensuring increase in
overall planting acreages in Kharif crops like Rice, Cotton, Soybean
and Corn. This will fuel economic growth by enhancing the farm
productivity. The growth in farm sector income will affirmatively
trigger the usage of Agrochemicals.
The special focus of Union Budget on Indian Agriculture is further
expected to accelerate the growth in the farming sector. The
announcements of various favorable policies like linking MSP to
production costs, e-NAM (Online Market Place), 100% Tax deduction
on profits to Farmers Producers Organizations (FPO) with a turnover
below INR 100 crores and increase in the Agricultural Credit target
by 10 % to INR 11 Lakh Crores will spur the economic growth of
farmers. Focused impetus for Crop Insurance, Micro-irrigation, Food
Processing and Agricultural exports will further lead to progress
in the sector with a vision towards achieving the Government
mandate of doubling farm Income by 2022. These policies will result
in increasing the purchasing power of growers to go for higher
investments anticipating better yields.
The global acceptability and demand of Company’s products is
increasing at a fair pace due to the growing need and innovation
driven products providing solutions in crop protection. Overall
Agrochemical markets in Europe seems to be stable for this year
without any drastic fluctuation. Markets in US and North America
are showing signs of growth in terms of better value realization.
With reduction in surfeit of inventory and rising commodity prices,
Latin America could potentially see growth in 2018. Inroads of the
Company portfolio into smaller markets of Africa and South East
Asia with the help of stronger distribution will support further
growth in these untapped markets. Company is building portfolio
and investing in manufacturing to insulate itself from the growing
crisis of crunch in supply and production in China because of policy
changes. With the Company growing faster than the market, it
augurs possibility of an overall promising year ahead.
DIVIDEND
Your Directors have recommended dividend of 400% i.e. H 8 per
Equity Share of H 2 each for the financial year ended 31st March,
2018, which if approved at the forthcoming Annual General Meeting,
will be paid to all those Equity Shareholders of the Company whose
names appear in the Register of Members as on 23rd August, 2018
and whose names appear as beneficial owners as per the beneficiary
list furnished for the purpose by National Securities Depository
Limited and Central Depository Services (India) Limited.
DIVIDEND DISTRIBUTION POLICY
Pursuant to Regulation 43A of the SEBI (Listing Obligations and
Disclosure Requirements) Regulations, 2015 (“LODR”) the Company
has formulated its Distribution Policy and the same has been
uploaded on the website of the Company which can be accessed at
https://www.uplonline.com/policies-compliances-announcements.
FINANCE
(a) Fixed Deposits
The Company has not accepted fixed deposits during the year.
There are no fixed deposits outstanding as at 31st March, 2018.
(b) Particulars of Loans, Guarantees or Investments
The details of Loans, Guarantees or Investments are given in the
notes to the Financial Statements.

UPL Limited Annual Report, 2017-18 80
(c) Changes in Paid-up Share Capital
During the year the Company has issued and allotted the
following shares:
(i) 22,24,287 equity shares of H 2 each on conversion of
Convertible Preference Shares and
(ii) 91,676 equity shares of H 2 each to Employees under
Employee Stock Option Plan of the Company.
CREDIT RATING
The Company enjoys a good reputation for its sound financial
management and ability to meet its financial commitments.
Company’s bank facilities have been rated by CARE as CARE
AA+ (Stable) for long term facilities and CARE A1+ for short term
facilities and by CRISIL as CRISIL AA+ (Stable) for long term facilities
and CRISIL A1+ for short term facilities. Company’s Commercial
papers are rated by CARE as CARE A1+ and by CRISIL as CRISIL A1+.
Company’s Non-Convertible Debentures are rated by CARE as CARE
AA+ (Stable) and by Brickwork Ratings as BWR AA+ (Stable).
UPL Corporation Ltd., a wholly owned subsidiary of the Company, has
been rated by S&P as BBB- (Positive), Moody’s Baa3 (Positive) & Fitch
BBB- (Stable). It has issued 5 year USD 500 mn USD Denominated
Senior Notes under 144A / Reg S in October 2016 and issued a 10
year USD 300 mn USD Denominated Senior Notes under Reg S in
February / March 18.
ESOP
The details as required to be disclosed under the SEBI (Share Based
Employee Benefits) Regulation, 2014 has been uploaded on the
Company’s website at the link https://www.uplonline.com/policies-
compliances-announcements
SAFETY AND ENVIRONMENT
Health and Safety
Health and safety remains to be a core area of importance for the
Company with a motto of each person working for and on behalf of
the Company “Alive and Well at the end of the Day”.
Your Company has improved its safety performance in terms of the
TRFR reduction by 42%, Lost Time Injuries by 42%, Process Safety
Incidents by 60%, and Severity Index by 40%. However, this is not
the end and The Company continues to work in pursuit of Achieving
UPL Safety Vision – “To become one of the Best and Safest Chemical
Manufacturing Companies in the world and achieve best in class in
Safety by making Safety a way of Life”. It will be heartening to note
eleven units of the Company were incident free for the year 2017-18.
Your Company has heavily invested in the infrastructure investment
in its old plants to ensure the structural safety of the plants. Company
has achieved marked improvements in its green field and brown
field projects through various new initiatives under Construction
and Contractor Safety Management System.
While New initiatives like Zero Leak Programme, Mistake proofing
through Poka-yoke, Safety Abnormality reporting, 5S relaunch
have helped safety performance improvement immensely, the
Process Safety Management, Capacity Building through level 0,
1 & 2 training and several employee engagement initiatives are
continuously being strengthened. Level 0, 1 & 2 trainings are training
for safety and functional capacity building, an employee can take
charge only after he/she has successfully passed the assessment.
Your Company has a system of Internal & external safety audit
and average compliances on 2nd and 3rd party audit have been a
significant 94+%.
The testimony of performance reflects through several awards
in EHS performance from reputed institutions like OSHAI, Frost &
Sullivan, CII Green Business Centre, IGMC, FICCI, Golden Peacock
to name a few. All the Indian units have been accredited with ISO
14001-2015 standard.
Transport Safety Management System: Since the Company receives
and dispatches large number of Chemical Consignments either
in Tankers or Trucks, the Company is pursuing to undertake risk
assessment in this area. Company is working at a very advance
stages with a third party expert to design the entire scheme for
handling hazardous chemicals transport management system for
the Company.
The Company believes that Sustainability is the best opportunity
for business to drive smarter innovation and profitable growth.
Sustainability ensure a fair society, living within environmental
limits and creating a sustainable profitable business. The Company
is constantly working to reduce environmental footprint and find
innovative product solutions that benefit the environment. The
Company's environmental standards apply worldwide.
The Company's commitment to environmental protection extends
beyond the scope of legal requirements. The Company is committed
to the chemical industry’s Responsible Care™ initiative and have
set out the basic principles of this commitment in the Company's
Global Environmental Footprint Reduction Plan. Certified HSEQ
management systems control its operational implementation.
This year Company has released Sustainability Report as per GRI
guidelines. UPL Sustainable Development Plan is fully aligned with
UN Sustainable Development Goals.

Overview
Strategyreview Performance Governance Financials
81
The Company has taken following initiatives this year to make our
operating plant sustainable:
Specific Water Reduction Initiatives
Sustainable industrial water management plays a vital role in achieving
future water security in a world where water stress will increase. The
optimum utilization of all natural resources is an integral part of
the Company's commitment to sustainable development. Aiming
to decrease abstracted water demand in our operating plants,
following initiatives has been taken this year:
• Reduced the water consumption in ALP Red Phosphorus
production in Vapi Unit 0.
• Reduced the water consumption in Clomazone, Devrinol
production in Ankleshwar Unit 2.
• Utilized the hot water bath water in drum detoxification in
Ankleshwar Unit 3.
• Enhanced the ROwater utilization by 57% in last two years at
Jhagadia Unit 5.
• Implemented water efficient equipment in manufacturing
processes.
• Implementedmetering,monitoring&targeting(MMT)toensure
the efficient performance of system.
• Dedicatedtechnologygroupworkedtoreducewaterdemand.
Specific Carbon Emissions Reduction Initiatives
Greenhouse gases trap heat and make the planet warmer. Human
activities are responsible for almost all of the increase in greenhouse
gases in the atmosphere. Climate change due to greenhouse
gas emissions will have a growing impact on business. Aiming to
decrease carbon emissions in the Company's operating plants,
following initiatives has been taken this year:
• Reduced30%CO2emissionsby changingenergymix andby
reducing specific energy consumption as compared to baseline
2015-16.
• Implemented energy efficient equipment in manufacturing
processes.
• Implementedmetering,monitoring&targeting(MMT)toensure
the efficient performance of system.
• Dedicated technology group worked to reduce energy
consumption as well as CO2 emissions.
Specific Waste Reduction Initiatives
The Company has taken special care to reduce, recycle and eliminate
hazardous as well as non-hazardous solid waste. Aiming to decrease
waste disposal from the Company's operating plants, following
initiatives has been taken this year:
• Reduced25%specificwastedisposalascompared tobaseline
2015-16 from the Company's operating plants by operational
excellency.
• ConvertedtheprocesswasteofPendimethalinandGlufocinate
plant into sellable by-products in Jhagadia Unit 5.
• Reducedspecificwastedisposalby increasingtheyieldofPMP
and UPH production in Vapi Unit 0.
• Implemented waste segregation practices for efficient waste
management
• Implemented the practices of 4R (reduce, recycle, reuse,
reprocess) concept in Hazardous waste management
• Recoveredvalueaddedproductsfromwaste.
Specific Wastewater Reduction Initiatives
Aiming to decrease wastewater discharge from our operating
plants, following initiatives has been taken this year:
• Reduced 38% specific wastewater discharge from 2015-16
baseline by operational excellency.
• ReductionofeffluentdischargeinUnit05atJhagadiabywayof
segregation and better recycling of different effluent streams.
Thisisexpectedtoresultinbettereffluentmanagementspecially
during the monsoon seasons.
Reducing Environmental Impact
The target is to reduce 30% environmental footprint in our manufacturing plants by 2020 compared to 2015-16.
Water Consumption Carbon Emissions Waste Disposal Wastewater Discharge
Target Target Target Target
30% reduction in specific
water consumption in our
manufacturing plants by 2020.
30% reduction in specific CO2
emissions in our manufacturing
plants by 2020.
30% reduction in specific waste
disposal in our manufacturing
plants by 2020.
30% reduction in specific
wastewater discharge in our
manufacturing plants by 2020.
Performance Performance Performance Performance
In 2017-18, water consumption
per tonne of production in the
Company's manufacturing plants
reduced by 20% compared to
2015-16.
In 2017-18, CO2 emissions per
tonne of production in the
Company's manufacturing plants
reduced by 30% compared to
2015-16.
In 2017-18, waste disposal per
tonne of production in the
Company's manufacturing plants
reduced by 25% compared to
2015-16.
In 2017-18, wastewater discharge
per tonne of production in the
Company's manufacturing plants
reduced by 38% compared to
2015-16.

UPL Limited Annual Report, 2017-18 82
• Adoptednewtechnologieswhichusecontinuousmanufacturing
processes as against the current batch mode of manufacturing
reactions. This not just reduces the footprint and consequent
capex spends of the plant but also results in significant reduction
inthequantityofeffluentgenerated.
• Commercialised the volute technology for efficient dewatering
of sludge. This will help us in efficient management of sludge
generated from our wastewater treatment plants.
• Implementedmetering,monitoring&targeting(MMT)toensure
the efficient performance of system.
• Dedicated technology group worked to enhance the
environmental compliances and management standards thereby
resulting in reduction of the utility and environmental footprint.
RESEARCH AND DEVELOPMENT
In order to fulfil the vision and the mission, Company has created
multiple Research and Development Centres which are located in
different countries spread across the Globe to provide services to
the farmers at a pace which is required to overcome the problems
faced by them. These Research and Development Centres are very
effective in providing solutions to the regional as well as Global pest
management issues.
The Research and Development Centres are equipped with state-of
art facilities and highly qualified scientists. Company is engaged in
developing technical products in a highly cost effective way and
in providing pre-mix formulations which are more effective and
economical to the farmer, safe to handle and environment friendly.
Every year Company introduces many new products in the market
which are the result of the tireless work by the skilled scientists who
develop these products. The products are designed following Green
Chemistry Principles and desired safety considerations.
Company is very innovative in introducing pre-mix combinations
of two or more active ingredients as effective pest-management
and resistance management solutions. Scientists working on the
projects develop these products at a fast pace to make the projects
successful and quick market introduction of the products.
The formulations are tested extensively for bio-efficacy at the
development stage before going to the market launch. Care is
taken to develop safe, easy to handle and environmentally friendly
formulations keeping in the mind “The Farmer First” motto of
Company.
The Research and Development Centres also work on the existing
products and processes been commercialized to make them more
cost-effective or to improve the quality.
Company respects Intellectual Property of others and creates its
own Intellectual property for the products and processes developed
by the Research and Development Centres. Patents are obtained
in the countries of interest and appropriate measures are taken to
safeguard the IP.
Technical and formulation registration requires data generation like
chemical composition, physico-chemical properties, toxicity and
impurity profile, bio-efficacy, residue and packaging and so on. The
required data is generated at Research and Development Centres
and then gets the products tested at GLP laboratory to generate the
data for submission to the regulatory authority in various countries.
Company is also giving importance to for Speciality and Industrial
Chemicals for which the industrial processes are developed in
the Research and Development Centres. R&D scientists are able
to provide safe and economical processes which are successfully
implemented for commercial production.
CORPORATE SOCIAL RESPONSIBILITY
‘Doing Things Better’ is core to the Company's DNA. Three simple
words, which lie at the heart of the Company's philosophy have
been the guiding force in all community interventions. All of the
Company's CSR programs are driven by the belief that humankind
is one community, where each member is responsible for the
wellbeing of the other. Hence the Company's interventions are not
restricted to the development of the neighboring communities
alone, but the Company works on programs that cater to the
wider national interest too! Though the Company's CSR efforts are
focused in Gujarat, they have also touched lives in many other states
including but not restricted to Maharashtra, West Bengal, Kashmir,
Tamil Nadu and Himachal Pradesh.
In neighborhoods the Company's focus is to work on the needs,
strengths and growth priorities of the community. Hence in Dang
district which is primarily an agricultural economy, the main focus
is on providing sustainable livelihood from improved agricultural
practices. Multiple interventions have been designed and
implemented with the support of farmers groups at the village
level. UPL Centre for Agricultural Excellence provides the much
needed training support to the farmers. AKRSP SRI, Dang Paddy
Development Program, BoriBagicha, use of mini drip irrigation,
animal husbandry, providing water harvesting structure like dams
and wells etc. have improved the productivity of the land thereby
making agriculture more sustainable and profitable for more than
15,000 farmers.
The need assessment survey of the Company had brought out the
fact that the per capita availability of land was small which led to
disguised unemployment. Many youth and women in the region
were not productively employed. The Company's employment
and entrepreneurship initiatives are focused on providing this
segment with knowledge, skills and the motivation to take up

Overview
Strategyreview Performance Governance Financials
83
entrepreneurship as an income generating opportunity. Skill based
entrepreneurship development program provides training to start
both farm and non-farm based enterprises. Four UPL Niyojaniy
Kendra’s are providing training to youth in the region on industrial
skills like welding, fitting, electrical etc. Once trained these youth get
gainfully employed in the neighboring industries. UPL Udyamita
with more than 1300 women members is another intervention that
focuses on making women financially independent through self-
help groups.
Another focus area for the Company is the conservation and
preservation of flora and fauna. UPL Social Forestry aims at
afforestation and rehabilitating the degraded forest and common
lands with active support from the community. Under UPL Social
Forestry a total 71,351 plants were planted and is being properly
maintained at different community sites which covers 163.73
acres of community land. The Company has also planted 1,20,000
Mangrove plants spread across 60 acres of land in the coastal belt
in Vagra block, DAHEJ. Innovatively, the Company adopted different
participatory approach to execute the UPL Social Forestry that has
led to sustain the plantation and project. Sarus Conservation project
has made some impressive progress since inception 3 years back.
Sarus protection groups are actively working towards protection
of nests, eggs and juvenile Sarus. Around 80 Eco Clubs have made
thousands of children aware about the importance of nature
preservation.
The Company has built 36 toilet blocks in community school/public
places under UPL School Sanitation Project and are driving hygenic
behavior through toilet blocks. Girls safety, Home safety, Industrial
safety and Road safety programs make the target population
(more than 10,000 till date) aware of the safety measures to avoid
untoward incidents.
UPL Unnati program has been taken up to help community
based organizations of Mumbai to improve their capabilities and
thereby work with the community in a better way. The Company
is supporting Global Parli project (Maharashtra) which is working
to make Parli tehsil a model for others to follow. Vandri cluster
development program is another initiative that is working towards
improving the quality of life of villagers in Vandri which is a very
remote village in Gujarat not equipped with basic facilities.
The Company also support the relief efforts of the government in
times of natural disasters. Last year the Company provided food
packets to the flood affected people in Banaskantha district of
Gujarat. Similarly the Company donated INR 25 lacs for rehabilitation
of flood victims in Assam.
The Company's international subsidiaries and sister concerns share
development ethos. UPL Brazil works on a complimentary education
program empowering the local youth to lead meaningful lives. UPL
Colombia is responding to surrounding communities “whole life
cycle” need by promoting the social and economic development
through education, entrepreneurship and the conservation of the
environment. UPL Argentina has establishing Social Security office
at plant for every neighbour community (in the past they need to
travel 46 km to have access to social security office). UPL Mexico
has been collecting and distributing winter clothing to the poorest
of the poor since 2015. UPL Tanzania has been supporting small
farmers who are totally dependent on Sunflower farming for their
existence.
The Annual Report on CSR activities is annexed to this report as
"Annexure 1".
VIGIL MECHANISM / WHISTLEBLOWER POLICY
The Company has in place whistleblower policy to deal with
any fraud, irregularity, or mismanagement in the Company. The
Company has posted this policy on its website and the link is https://
www.uplonline.com/policies-compliances-announcements.
The Chairman of the Audit Committee oversees this policy. As per
the policy, any employee or director can directly communicate
with the Chairman of the Audit Committee to report any actual/
suspected fraud or non-compliance.
In earlier year, the Company made all efforts to create awareness
among the employees about the Policy. The Company also
made all efforts to create awareness about the policy among the
employees, who have joined during the year. The policy ensures
complete protection and no victimization or discrimination to the
whistleblower. Total confidentiality of the proceedings of the policy
is maintained.
PREVENTION OF SEXUAL HARASSMENT OF WOMEN AT THE
WORKPLACE
The Company has implemented a policy as required under the Sexual
Harassment of Women at the Workplace (Prevention, Prohibition
and Redressal) Act, 2013 and the Rules framed thereunder. This
policy covers all women-permanent, temporary or contractual
workers. The policy is very strictly enforced by the Company. The
Policy is communicated to all the employees by placing it on the
website of the Company and all the employees have confirmed
their abidance.
During the year, the workshops were arranged, conducted by an
esteemed agency, to educate the employees, who have joined
during the year, across the Company to uphold dignity of their
colleagues at the workplace and prevent sexual harassment.
An internal committee, consisting of mainly women staff and one
woman from an NGO, is formed to attend and redress complaints
relating to sexual harassment. At each unit of the Company, sub-
committees are formed to receive any such complaints and address

UPL Limited Annual Report, 2017-18 84
and redress the same, in consultation with the main committee.
Strict implementation of the policy is to ensure women staff to work
with dignity in a safe environment free from sexual harassment at
the workplace and provide equality in working conditions. During
the year, the Company has not received any complaint of sexual
harassment.
INTERNAL CONTROL SYSTEMS AND THEIR ADEQUACY
The Company has robust systems for internal audit, risk assessment
and mitigation and has an independent Internal Audit Department
with well-established internal control and risk management
processes both at the business and corporate levels.
Internal Audit function plays a key role in providing to both the
operating management and to the Audit Committee of the Board,
an objective view and re-assurance of the overall internal control
systems and effectiveness of the Risk Management processes
and the status of compliances with operating systems, internal
policies and regulatory requirements across the company including
its subsidiaries. Internal Audit also assesses opportunities for
improvement in business processes, systems and controls and
provides recommendations designed to add value to the operations.
The scope and authority of the Internal Audit Department is derived
from the Annual Audit Plan approved by the Audit Committee at the
beginning of the year. Internal Audits are performed by an in-house
team of qualified professionals on the basis of comprehensive risk-
based audit plan. Every quarter, the Audit Committee is presented
with key internal controls issues/audit observations and action
taken update on the internal controls issues/audit observations
highlighted in the previous Audit Committee presentations.
Internal Controls over Financial Reporting:
Exercise for evaluating the adequacy of Internal Financial Controls
and their Operating Effectiveness is carried out every year. This
activity includes understanding and testing of Internal Financial
Controls and evaluating their operating effectiveness based on
the assessed risk factors. During the year, the effectiveness of the
controls was validated. No reportable material weaknesses in design
and effectiveness was observed.
From time to time, the Company’s systems of internal controls
covering financial, operational, compliance, IT applications, etc. are
reviewed by external experts too. Presentations are made to the
Audit Committee on the findings of such reviews.
RISK MANAGEMENT FRAMEWORK
The Company has a robust Risk Management Framework to identify
and evaluate various business risks faced by the Company. Pursuant
to Regulation 21 of the SEBI (Listing Obligations and Disclosure
Requirements) Regulations, 2015, a Risk Management Committee
is appointed, consisting of three Executive/Promoter Directors of
the Company. Regular Committee meetings are held every quarter.
Inputs are taken from senior executives and thereafter various risks
are identified and mitigating plans are developed to resolve such
risks.
Some of the key business risks viz., Industry Risks, R&D Risk, Currency
Fluctuation Risk and their mitigation plans were included in the
Directors’ Report of 2016-17. Some of the additional key business
risks identified during the year and their mitigation plans are as
under:
Liquidity Risks: The Company requires very sound base of working
capital. During the off-season the Company cannot afford to have
huge inventory and receivables as this will result into delayed
payment to the creditors. It is very important that the Company
enjoys a fair amount of liquidity of funds. Liquidity risks could impact
the debt repayment capabilities of the Company and thereby the
Company’s name in the market will be affected. To mitigate this
risk, the Company’s business enjoys adequate liquidity. It has a very
comfortable debt equity position. The Company is earning cash
profit of more than H 2500 crores. The working capital management
is also very sound and at present the Company’s net working capital
stands at 90 days of turnover. Considering all this, the Company
does not expect liquidity to be a major concern.
HR Risks: The Company has a huge workforce. Globally it employs
around 5000 people who are from diverse nationalities, geographies
and varied culture. The function of HR therefore becomes very
important. A poor HR policy could impact productivity and
profitability of the Company. To mitigate this risk, the present
HR strategy has fostered cross functional coordination across all
countries. Even though large number of workforce is employed in
different countries they all follow the same corporate culture of the
Company. The senior management team is visiting various plants
and offices of the Company regularly and relations at all these places
is very cordial and tension free. In fact, the Company is certified as a
“Great Place to Work” in India as well as in Brazil. The Company will
continue to put in more efforts and see that HR functions are carried
out properly and professionally.
Cyber Security Risks: In the hyper connected world the Company
has provided its employees mobiles, laptops and tablets to enable
them to perform their functions effectively. However there are lots
of security threats to the data of the Company and the confidential
data may go to unauthorized persons by way of hacking of mobile,
laptops and tablets. It is pointed out there is no such thing as
perfect protection. The bigger the organization and more complex
in nature, it becomes a target for data security risks. It is necessary
to provide for preventive measures to ensure lower risks, early
detection of risks and cost effective data security systems. The
goal is to build a sustainable cyber security program that governs

Overview
Strategyreview Performance Governance Financials
85
protection and ensures enablement to employees and others in
right proportion. To mitigate this risk, the control measures taken
by the Company include continuous monitoring of data security
systems, providing access only to required staff, security incidents
and event monitoring and prevention of loss of data. Continuous
risk assessment and monitoring is necessary. The various layered
security controls have been established.
Recently there have been cyber threats all over the world.
Ransomware had affected some of the global organizations,
however there was no impact on the Company. This was because
of the mitigating steps taken by the Company such as blocking
vulnerable ports and services, communicating throughout the
organization by sending awareness mailers etc.
Reputation Risks: Due to a large organization set up and employing
many people across the globe as also non-observance of the policies
and pre-determined procedures and SOPs can result at times into
risk of damage to the reputation of the Company. The Company
deals with various stakeholders and if they are not attended
properly and are not provided with quality products and services,
Company’s image will get spoilt. If suppliers are not paid in time or
the employees who are leaving the organization do not get their
dues in time the Company suffers the risk of reputation. To mitigate
this risk, the finance department and the HR department take care
to see that the suppliers are paid in time and all government dues
are cleared on time. The collection are made in time and there is
no overtrading. All the employees of the Company are required
to sign integrity policy when they join. This ensures that there
are no chances of corruption or favoritism against any employee.
The Company follows this policy diligently. The Company’s share
department along with Registrar and Transfer Agents ensure that
quality services are provided to the shareholders and all their
genuine complaints are attended properly.
The Company carries out lots of social activities, contributes
to various NGO’s and educates the farmers continuously. The
Company is conscious of the fact about the negative image of
the Agro Chemical industry in the society and to safeguard the
interest of the Company the Company takes various awareness
measures and makes timely representations to various authorities.
The Company ensures that all its products are of the right quality.
The Company ensures that at all plants there is no pollution and
environment protection assurance is the top most priority. If
required, the Company legally fights against some motivated NGO’s
to see that there are no false allegations against the Company and
its reputation does not get damaged.
SUBSIDIARY COMPANIES / ASSOCIATE COMPANIES
Shroffs United Chemicals Limited:
This is engaged in trading activities in a very limited way.
SWAL Corporation Limited:SWAL Corporation limited is engaged in distribution and marketing of
agro chemical formulations and organic fertilizers in India. The Sales
Turnover for the year is H 666 Cr and the Profit before tax is H 44 Cr.
Optima Farm Solutions Ltd:Optima farm solutions ltd is engaged in the manufacture of
agrochemicals in Jammu. The Company has made sales of H 174 Cr
in the current year.
UPL Europe Ltd.: UPL Europe is engaged in the production and distribution of
Agrochemicals in UK & Europe. The company has a formulation
production site at Sandbach, UK and a sales office at Warrington,
UK. The Turnover for the year ended 31st March 2018 is H 866 Cr and
the Profit before tax is H 67 Cr.
UPL Deutschland GmbH:UPL Deutschland GmbH is engaged in the distribution of formulated
products in Germany & Austria. The Turnover for the year is H 331 Cr
and the Profit before tax is H 10 Cr.
UPL Polska Sp z o o: UPL Polska is engaged in the sales and marketing of formulated
products in Poland. The business in this Company has been on a
very low scale.
UPL Benelux B.V.: UPL Benelux BV is engaged in the distribution of formulated
products in Benelux and Switzerland. The Turnover for the year is
H 336 Cr and the Profit before tax is H 23 Cr.
Cerexagri B.V. – Netherlands: Cerexagri BV is a manufacturing entity specializing in EBDC based
fungicides. It has a technical and formulation facility based in
Rotterdam. The Sales Turnover for the year ended 31st March 2018 is
H 975 Cr and the Profit before tax is H 27 Cr.
Blue star BV: Blue Star BV is the Holding company for Neo Fog SA.
United Phosphorus Holdings Cooperatief U.A.: United Phosphorus Holdings Cooperatief U.A. is the holding
company for United Phosphorus Holdings B V Netherlands.
United Phosphorus Holdings B.V, Netherlands: United Phosphorus Holdings BV is the holding company for entities
in Europe & Rest of the world.
United Phosphorus Switzerland Limited:United Phosphorus Switzerland is providing management services
and holding investments and registrations for the Company’s
products.
Decco Worldwide Post-Harvest Holdings Cooperatief U.A.:
Decca Worldwide Post-harvest Holdings Coöperatief UA is the
holding company for Decco Worldwide Post-Harvest Holdings BV.

UPL Limited Annual Report, 2017-18 86
United Phosphorus Holding, Brazil B.V. (Formerly known as
Regentstreet B.V.):
United Phosphorus Holdings Cooperatief U.A. is the holding
company in Brazil.
UPL Italia S.R.L.:
UPL Italia S.R.L is engaged in the distribution of formulated products
in Italy. The Turnover is H 329 Cr and the Profit before tax for the year
ended 31st March 2018 is H 14 Cr.
UPL IBERIA, SOCIEDAD ANONIMA:
UPL Iberia is engaged in the distribution of formulated products in
Spain & Portugal. The Turnover is H 145 Cr and the Profit before tax
is H 7 Cr.
Decco Worldwide Post-Harvest Holdings B.V.:
This is the holding company for other Decco entities, and holds
registrations for these entities.
Transterra Invest, S. L. U. Spain:
Transterra Invest, S L is the holding company for group entities in
Spain and Latin America.
Cerexagri S.A.S. :
Cerexagri SAS is a supply chain company for the group with 3 key
production facilities in France involved in the production of Copper
& Sulphur based fungicides. It has a formulation facility at Bassens
to formulate herbicides and insecticides. The Sales Turnover for the
year ended 31st March 2018 is H 451 Cr and the Profit before tax is
H 27 Cr.
Neo-Fog S.A.:
Neo-Fog S.A is engaged in the distribution of Anti-sprouting
herbicides in the French domestic market. The Turnover for the year
ended 31st March 2018 is H 38 Cr and the Profit before tax is H 6
Cr.
UPL France:
UPL France SAS is engaged in the distribution of formulated
products in France. Products are sourced from UPL's manufacturing
facilities in Europe and India, as well as locally formulated in toll
manufacturing facilities. The Turnover is H 403 Cr and the Profit
before tax is H 32 Cr.
UPL Corporation Limited, Mauritius:
UPL Corporation does trading business and also holds investments
for the group. The Turnover is H 2386 Cr and the Profit before tax is
H 197 Cr.
Decco Iberica Postcosecha, S.A.U., Spain:
Decco Iberica is involved in fabrication & commercialization of
chemical products, waxes & fungicides, as well as the machinery
used for their application. The Turnover is H 117 Cr and the Profit
before tax is H 15 Cr.
Limited Liability Company UPL:
Limited Liability Company UPL is engaged in the distribution of
technical and formulated products in Russia and other CIS countries.
The Turnover for the year ended 31st March 2018 is H 28 Cr and the
Profit before tax is H 2 Cr.
United Phosphorus Inc., U.S.A.:
United Phosphorus Inc is engaged in the distribution of AI's as
well as formulated products in the United States and Canada. UPI
also provides technologies for pest management, aquatics, Turf &
Ornamental as well as fumigants for grain storage. The Turnover is
H 2,883 Cr and the Profit before tax is H 55 Cr.
Canegrass:
Canegrass is Company for the distribution of Asulam (Sugarcane
Herbicide) in the USA.
RiceCo LLC:
RiceCo LLC is dedicated to meet specific technology needs of rice
farmers in the USA. Its turnover during the year is H 242 Cr and Profit
before tax is H 11 Cr.
Decco US Post Harvest Inc, USA:
Decco US Post Harvest Inc is engaged in the production and selling
of post harvest products and fumigants for use in the treatment
of fresh agricultural produce. It has manufacturing facilities in
Monrovia, CA and Yakima WA. Turnover for the year is H 247 Cr and
Profit Before Tax is H 8 Cr.
RiceCo International, Inc. Bahamas:
RiceCo International is a rice focused company operating mainly in
Asia and Latin America. The Turnover for the year is H 249 Cr and the
Profit before tax is H 29 Cr.
UPL Limited, MAURITIUS:
UPL Mauritius does Trading business. The Turnover for the year is
H 960 Cr and the Profit before tax is H 306 Cr.
UPL LIMITED, Gibraltar:
UPL Limited Gibraltar does Trading operations. The Turnover for the
year is H 2969 Cr and the Profit before tax is H 299 Cr.
United Phosphorus Cayman Limited:
United Phosphorus Cayman Ltd, is a holding Company. The Turnover
for the year is H 300 Cr and the Profit before tax is H 8 Cr.
UPL Agro SA DE CV:
UPL Agro SA DE CV is engaged in sales and marketing of branded
formulations in Mexico. This entity received the ESR award on
parameters of business ethics, environment and community
engagement. The Turnover for the year is H 436 Cr and the Profit
before tax for the year is H – 3 Cr.
Decco Jifkins Mexico Sapi:
Decco Jifkins Mexico, SAPI De CV is primarily engaged in purchase,

Overview
Strategyreview Performance Governance Financials
87
sale, distribution and import of goods and service in post harvest for
fruits and vegetables in Mexico. The Turnover for the year is H 9 Cr.
and the Profit before tax for the year is H – 2.
Uniphos Industria e Comercio de Produtos Quimicos Ltda:
This is a holding company of UPL Do Brasil-Industria e Comercio de
Insumos Agropecuarios S.A..
UPL Do Brasil - Industria e Comércio de Insumos Agropecuários
S.A.:
United Phosphorus do Brazil Ltda has a strong distribution network
in Brazil for its AI's as well as formulated sales. It is located in Campinas
and also has a manufacturing facility in Ituverava. The Sales Turnover
for the year is H 3,594 Cr and the Profit before tax for the year is H 52
Cr.
UPL Costa Rica S.A.:
UPL Costa Rica SA is engaged in marketing and distribution of Agro
chemicals in Costa Rica. It also provides value added services such
as contract spraying. The Turnover for the year is H 330 Cr and the
Profit before tax for the year is H -10 Cr.
UPL Bolivia S.R.L:
UPL Bolivia is engaged in the sales and marketing of agro chemicals
in Bolivia. The Turnover for the year is H 37 Cr and the Profit before
tax for the year is H 5 Cr.
Icona Sanluis S A – Argentina:
Icona Sanluis SA is a manufacturing and marketing company for
selling formulated products in Argentina. It has a manufacturing
plant in San Luis, Argentina. The Turnover for the year is H Nil and the
Profit before tax for the year is H -4 Cr.
DVA Technology Argentina S.A.:
DVA Technology Argentina holds registrations in Argentina.
UPL Argentina S A:
The company is a manufacturing and marketing company for selling
formulated products in Argentina. It has a manufacturing facility in
Abott, Argentina. The Turnover for the year is H 393 Cr and the Profit
before tax for the year is H -90 Cr.
Decco Chile SpA:
Decco Chile SpA provides post harvest solutions to maintain the
quality of fresh fruits and vegetables. The Turnover for the year is
H 44 Cr and the Profit before tax for the year is H 8 Cr.
UPL Colombia SAS:
UPL Colombia is engaged in sales and marketing of agro chemicals
for the Andean markets - Venezuela, Ecuador, Peru and Colombia.
The Turnover for the year is H 143 Cr and the Profit before tax for the
year is H -10 Cr.
UP Aviation Limited, Cayman Island:
UP Aviation Ltd owns the aircraft for Business purposes.
UPL Management DMCC:
UPL Management DMCC provides management services. The
Turnover for the year is H 96 Cr and the Profit before tax for the year
is H 26 Cr.
UPL Australia Limited:UPL Australia is engaged in sales and marketing of branded agro
chemicals in Australia. It holds the registrations as well as inventory
for prompt supply of material to service local demand. The Turnover
for the year is H 143 Cr and the Profit before tax for the year is H 10 Cr.
UPL New Zealand Limited:
UPL New Zealand is engaged in distribution of Agro Chemicals
in New Zealand. It holds the registrations as well as inventory for
prompt supply of material to service local demand. The Turnover
for the year is H 7 Cr and the Profit before tax for the year is H 1 Cr.
UPL Shanghai Ltd:
UPL Shanghai is engaged in distribution of Company’s products
in China. It has purchased office in Shanghai and is engaged in
purchase of actives and intermediates required by manufacturing
facilities globally.
UPL Limited Korea:
UPL Korea was formed to grow UPL's agro chemical and fumigation
business in Korea. The Turnover for the year is H 3 Cr and the Profit
before tax for the year is H 1 Cr.
PT.UPL Indonesia:
UPL Indonesia is doing business in Indonesia. It mainly caters to
the requirements of strategic partners like Nufarm, FMC ad other
top local companies as well as semi-government organization. The
Turnover for the year is H 87 Cr and the Profit before tax for the year
is H 6 Cr.
PT Catur Agrodaya Mandiri, Indonesia:
The major business is branding and distribution of formulated
products through a network of distributors in Indonesia. The
company holds 50 plus registrations and has successfully
commercialized most of these. The Turnover for the year is H 49 Cr
and the Profit before tax for the year is H -2 Cr.
UPL Limited, Hong Kong:
UPL Hong Kong is engaged in the sales and marketing of agro
chemicals in Hong Kong. It also acts as a supply source of raw
material purchases of the manufacturing facilities. The Turnover
31st March 2018 is H 555 Cr and the Profit before tax is H 21 Cr.
UPL Philippines Inc.:
UPL Philippines is engaged in the distribution of agro chemicals
in Philippines. It holds registrations and inventory for servicing
domestic demand. It also provides value added services to
plantation business in Philippines. The Turnover is H 93 Cr and the
Profit before tax is H 1 Cr.

UPL Limited Annual Report, 2017-18 88
UPL Vietnam Co. Ltd.:
UPL Vietnam is engaged in the manufacturing and marketing of
branded agro chemical formulations in Vietnam. It also exports its
production to Australia, South East Asia and few African countries as
well, other than catering to local demand.The Turnover is H 185 Cr
and the Profit before tax is H 27 Cr.
UPL Limited, Japan:
This entity is for registering and selling UPL products in Japan. The
local presence in Japan has boosted access to Japanese technology
and expertise, and built relations with other Japanese companies.
UPL Japan sells both AI's as well as branded products which are
formulated and repacked locally. It has a JV with Hodogaya Chemical
Co Ltd with headquarters in Tokyo and research laboratory center at
Tsukuba. The Turnover is H 196 Cr and the Profit before tax is H 3 Cr.
Anning Decco Fine Chemical Co. Limited, China:
Anning Decco is a joint venture in China. The company is engaged
in the production and distribution of Shellac. The Turnover for the
year is H 23 Cr and the Profit before tax is H Nil.
UPL Ziraat Ve Kimya Sanayi Ve Ticaret Limited Sirketi:
The Company has a strong distribution network as well as brand
presence in Turkey (mainly western region). The Turnover is H 157 Cr
and the Profit before tax is H -20 Cr.
UPL Agromed Tohumculuk Sa,Turkey:
UPL Agromed has a strong marketing presence in the eastern part
of Turkey. It also has a manufacturing and repacking facility in Turkey.
The Turnover is H 110 Cr and the Profit before tax is H -4 Cr.
Safepack Products Limited, Israel:
Safepack is engaged in the production and distribution of Post-
Harvest Products in Israel and export to neighboring countries. The
Turnover is H 36 Cr and the Profit before tax is H -4 Cr.
Citrashine (Pty) Ltd, South Africa:
Citrashine is engaged in the manufacturing and distribution of
chemicals and waxes for the post harvest treatment of fruits and
vegetables and operates primarily in South Africa. The Turnover is
H 32 Cr and the Profit before tax is H -1 Cr.
Decco Portugal Post Harvest, Unipessoal LDA (formerly known
as UPL Portugal Unipessoal LDA):
Decco Portugal Unipessoal LDA is a new entity which will start
operations shortly.
Decco Italia SRL, Italy:
Decco Italia SRL is engaged in the production and selling of post-
harvest products and fumigants for use in the treatment of fresh
agricultural produce. The Turnover is H 43 Cr and the Profit before
tax is H 5 Cr.
UPL Paraguay S.A.:
UPL Paraguay is engaged in the sales and marketing of agro
chemicals in Paraguay. The Turnover is H 29 Cr and the Profit before
tax is H -5 Cr.
UPL Africa SARL:
UPL Africa is established for sales in African region. It holds
registration for sales in CILSS countries in Africa.
Advanta Seeds International, Mauritius:
Advanta Seeds International is engaged in distribution and
marketing of seeds in the various countries. The Sales Turnover for
the year is H 697 Cr and the Profit before tax is H 75 Cr.
Advanta Seeds DMCC (formerly known as Advanta Seeds JLT):
Advanta Seeds DMCC is engaged in distribution and marketing of
seeds in the UAE. The Sales Turnover for the year is H 34 Cr and the
Profit before tax is H -9 Cr.
PT Advanta Seeds, Indonesia:
PT Advanta Seeds is engaged in distribution and marketing of field
Corn and Sweet Corn seeds in Indonesia. The Sales Turnover for the
year is H 70 Cr and the Profit before tax is H 16 Cr.
Advanta Holdings B.V., Netherlands:
Advanta Holdings B.V. is engaged in distribution and marketing of
seeds in Europe. The Sales Turnover for the year is H Nil and the Profit
before tax is H -17 Cr.
Advanta Semillas SAIC:
Advanta Semillas is engaged in distribution and marketing of
Sorghum corn sunflower seeds in Argentina. The Sales Turnover for
the year is H 193 Cr and the Profit before tax is H -37 Cr
Advanta Netherlands Holding B.V.:
Advanta Netherlands Holding B.V. is engaged in distribution and
marketing of and research and technical solutions to farmers &
breeders into seeds in the Netherlands and Europe. The Sales
Turnover for the year is H 32 Cr and the Profit before tax is H -6 Cr,
Pacific Seeds Holdings (Thailand) Limited:
Pacific Seeds Holdings is holding Company. The Profit before tax is
H Nil, largely contributed by other income.
Pacific Seeds (Thai) Limited:
Pacific Seeds (Thai) is engaged in distribution and marketing of
seeds in Thailand. The Sales Turnover for the year is H 360 Cr and the
Profit before tax is H 110 Cr
Advanta Comercio De Sementas Ltda.:
Advanta Comercio is engaged in distribution and marketing of
Sorghum Soyabean Canola Corn seeds in Brazil. The Sales Turnover
for the year is H 89 Cr and the Profit before tax is H-92 Cr.
Overview
Strategyreview Performance Governance Financials
89
Advanta Seeds Pty Ltd (Formerly, Pacific Seeds Pty Ltd):
Advanta Seeds Pty Ltd is engaged in distribution and marketing of
Sorghum, Corn and Canola seeds in Australia. The Sales Turnover for
the year is H 253 Cr and the Profit before tax is H 23 Cr.
Advanta US LLC (formerly known as Advanta US Inc):
Advanta US LLC is engaged in distribution and marketing of Hybrids
of Corn, forage sorghum,Grain sorghum seeds in the US and Mexico.
The Sales Turnover for the year is H 137 Cr and the Profit before tax
is H -57 Cr.
Details of companies which have become or ceased to be its
subsidiaries, joint ventures or associate companies during the year:
a) New subsidiaries:
1. UPL Jiangsu Limited
2. UPL Agro Limited Mauritius
3. Riceco International Bangladesh Ltd
4. Uniphos Malaysia Sdn Bhd
b) New associate:
1. Serra Bonita Sementes S.A.
c) Cessation of subsidiaries:
1. UPL Africa SARL
2. UPL Limited Mauritius
MATERIAL SUBSIDIARY
The Company does not have any material subsidiary as per the
parameters laid down by the Companies Act, 2013.
RELATED PARTY TRANSACTIONS
All Related Party Transactions entered into during the year were on
arm’s length basis and were in the ordinary course of business. There
are no materially significant related party transactions made by the
Company with Promoters, Directors, Key Managerial Personnel or
other designated persons which may have a potential conflict with
the interest of the Company at large.
All Related Party Transactions are approved by the Audit Committee.
Prior omnibus approval is obtained from the Audit Committee in
respect of the transactions which are repetitive in nature. The
transactions entered into pursuant to the omnibus approval so
granted are reviewed on a quarterly basis by the audit committee.
The policy on Related Party Transactions as approved by the
Board is uploaded on the Company’s website. The same can be
accessed on https://www.uplonline.com/ policies-compliances-
announcements.
INSURANCE
All the properties and operations of the Company have been
adequately insured.
SIGNIFICANT AND MATERIAL ORDERS PASSED BY THE
REGULATORS OR COURTS
There are no significant and material order passed by the Regulators
or Courts.
AUDITORS
a) Statutory Auditors
At the 33rd Annual General Meeting of the Company held on
8th July, 2017, the Members of the Company have approved
the appointment of B S R & Co. LLP, Chartered Accountants
(ICAI Firm Registration Number 101248W/W-100022) as the
Statutory Auditors of the Company pursuant to Section 139
of the Companies Act, 2013 for a term of 5 (five) years from
the Company’s financial year 2017-18, to hold office from the
conclusion of 33rd Annual General Meeting of the Company
(subject to ratification of their appointment at every Annual
General Meeting, if required under the Act).
However, pursuant to the Companies Amendment Act, 2017
which was notified on May 7, 2018, the provision related to
ratification of appointment of auditors by Members at every
Annual General Meeting has been done away with.
The report of the Statutory Auditors along with the Notes to
Schedules forms part of the Annual Report and contains an
Unmodified Opinion without any qualification, reservation or
adverse remark.
b) Cost Auditors
Pursuant to Section 148 of the Companies Act, 2013 read
with The Companies (Cost Records and Audit) Amendment
Rules, 2014, the cost account records maintained by the
Company are required to be audited. Your Directors had, on the
recommendation of the Audit Committee, appointed Messrs
RA & Co., Cost Accountants to audit the cost accounts of the
Company for the financial year 2018-19 on a remuneration of
H 7.00 lakhs. The Cost Auditors have submitted a certificate
of their eligibility for such appointment. As required under
the Companies Act, 2013, the remuneration payable to the
cost auditor is required to be placed before the Members in a
general meeting for their ratification. Accordingly, a Resolution
seeking Member’s ratification for the remuneration payable to
Messrs RA & Co., Cost Auditors is included at Item No. 5 of the
Notice convening the Annual General Meeting.
For the year 2017-18, the due date for filing the Cost Audit
Report is 27th September, 2018 and the same will be filed in
due course. The Cost Audit Report for the year 2016-17 was filed
on 28th August, 2017.
c) Secretarial Auditors
Pursuant to the provisions of Section 204 of the Companies Act,

UPL Limited Annual Report, 2017-18 90
2013 and The Companies (Appointment and Remuneration of
Managerial Personnel) Rules, 2014, the Company has appointed
Messrs N.L. Bhatia & Associates, a firm of Company Secretaries in
Practice to undertake the Secretarial Audit of the Company. The
Secretarial Audit Report is annexed herewith as “Annexure 2”.
REPORTING OF FRAUD
The Auditors of the Company have not reported any fraud as
specified under section 143 (12) of the Companies Act, 2013.
DEPOSITORY SYSTEM
98.91% of the total paid-up equity shares of the Company are
dematerialised as on 31st March, 2018.
DIRECTORS
In accordance with the provisions of section 152 of the Companies
Act, 2013, and Articles of Association of the Company, Mr. Vikram
Rajnikant Shroff (DIN: 00191472) and Mr. Arun Chandrasen Ashar
(DIN: 00192088), Directors of the Company, retire by rotation at the
forthcoming Annual General Meeting of the Company and being
eligible, offer themselves for re-appointment.
The earlier appointments of Mr. Rajnikant Devidas Shroff (DIN:
00180810) as Chairman and Managing Director of the Company and
Mr. Arun Chandrasen Ashar (DIN: 00192088) as Whole-time Director
designated as Director-Finance expire on 30th September, 2018. The
Board of Directors has re-appointed Mr. Rajnikant Devidas Shroff
(DIN: 00180810) as Managing Director and Mr. Arun Chandrasen
Ashar (DIN: 00192088) as Whole-time Director designated as
Director-Finance for further period of 5 (five) years, with effect from
1st October, 2018 and subject to the approval of the Members and
upon the terms and conditions as set out in the notice convening
the 34th Annual General Meeting of the Company.
The special resolutions seeking approval of the Members of the
Company for the re-appointment of Mr. Rajnikant Devidas Shroff
and Mr. Arun Chandrasen Ashar have been incorporated in the
notice of the 34th Annual General Meeting of the Company along
with brief details about them.
The information of Directors seeking re-appointment as required
pursuant to Regulation 36(3) of SEBI (Listing Obligations and
Disclosure Requirements) Regulations, 2015, is provided in the
notice convening the Annual General Meeting of the Company.
During the year, Mr. Pradip Madhavji (DIN: 00549826), Independent
Director has resigned from the Board of Directors of the Company
with effect from 27th April, 2018 for personal reasons. During his
tenure, he was Lead Independent Director and was Chairman of
Audit Committee and Stakeholders Relationship Committee. The
Board wishes to place on record its appreciation for his valuable
advice and efficient discharge of his duties during the period of
almost last fifteen years. The Company acknowledges his pragmatic
approach and immense contribution in handling various issues
diligently.
All the independent directors have given declaration that they meet
the criteria of independence laid down under the Companies Act,
2013 and SEBI (Listing Obligations and Disclosure Requirements)
Regulations, 2015.
EVALUATION OF THE BOARD’S PERFORMANCE
Pursuant to the provisions of the Companies Act, 2013 and
Regulations 17 (10) and 25(4)(a) of the Listing Regulations,
the evaluation process for performance of the Board, various
committees and directors was carried out. Each director was
provided a questionnaire to be filled up, providing feedback on
the overall functioning of the Board and the committees. The
questionnaire covered various parameters such as composition,
execution of specific duties, quality and timeliness of flow of
information, discussions and deliberations of different items of
agenda, independence of judgments, etc. The directors were also
asked to provide their suggestions for areas of improvement to
ensure higher degree of engagement with the management.
Evaluation of individual director was also carried out and parameters
such as contribution, attendance, expertise, decision making and
other related factors were considered in this exercise.
The Independent Directors held a meeting on 25th January, 2018 to
review the performance of evaluation of the Non-independent/Non-
promoter Directors and the entire Board including the Chairman.
The Independent Directors expressed complete satisfaction of the
professionally managed overall functioning of the Board, various
committees as well as all the directors of the Company. They
appreciated the knowledge and expertise of the Chairman and
his exemplary leadership qualities which demonstrate positive
attributes in following the highest standards of corporate values
and culture of the Company.
REMUNERATION POLICY
The Board has on the recommendation of the Nomination and
Remuneration Committee framed and adopted the Policy for
selection and appointment of directors, senior management
and their remuneration. The Board recognizes that the various
Committees of the Board have very important role to play to ensure
highest standards of corporate governance. The Chairman of the
Board and other Executive Directors form broad policies and ensure
their implementation in the best interests of the Company.
The Criteria for selection of directors and senior management are
mainly qualifications, experience, integrity, independence of the
directors, etc.
The remuneration to Non-executive Directors consists of sitting
fees for attending Board/Committee meetings, commission and

Overview
Strategyreview Performance Governance Financials
91
other reimbursements. As per the approval given by the members,
the said commission shall not exceed 1% of the net profits of the
Company. All the Non-executive, Non-Promoter Directors are paid
commission on uniform basis. The Independent directors are not
entitled to any stock options under the Stock Option Scheme of the
Company.
The remuneration to the Managing Director and other Executive
Directors consist of monthly salary, allowances, perquisites,
commission and other retirement benefits. The remuneration
payable to them is subject to the approval of the members of the
Company. The overall managerial remuneration payable to them
shall not exceed 10% of the net profits of the Company.
In respect of senior management, the remuneration is based
on the performance, company’s performance, targets achieved,
industry benchmark and compensation trends in the industry. Their
remuneration consists of monthly salary, bonus, perquisites, KPI and
other retirement benefits.
FAMILIARIZATION PROGRAMME FOR THE INDEPENDENT
DIRECTORS
Pursuant to the SEBI regulations the Company has worked out a
Familiarization programme for the Independent Directors, with a
view to familiarize them with their role, rights and responsibilities
in the Company, nature of Industry in which the Company operates,
business model of the Company, etc.
Through the Familiarization programme, the Company apprises
the independent directors about the business model, corporate
strategy, business plans and operations of the Company. These
directors are also informed about the financial performance, annual
budgets, internal control system, statutory compliances etc. They
are also familiarized with Company’s vision, core values, ethics and
corporate governance practices.
At the time of appointment of independent director, a formal letter
of appointment is given to him, which explains his role, responsibility
and rights in the Company.
Subsequently they are appraised of the Company’s policies on CSR,
nomination and remuneration, plant safety, HR, succession policy
for directors and senior management. They are updated with global
business scenario, marketing strategies, legislative changes etc.
Factory visits are arranged to appraise them of various operational
and safety aspects of the plants to get complete understanding of
the activities of the Company. Eminent personalities are invited to
educate the independent directors about the latest happenings
relevant to the duties, rights and responsibilities of the independent
directors.
Details of Familiarization programme of Independent Directors with
the Company are available on the website of the Company https://
www.uplonline.com/ policies-compliances-announcements.
PERSONNEL
As on 31st March, 2018, the Company has 3865 employees in India,
and 4784 employees globally.
The Company has always believed that its people are its biggest
asset. The year 2017-18 saw several key initiatives to nurture on our
core values.
The initiatives taken during the year
1. SUPPLY CHAIN ACADEMY
The Supply Chain Academy launched in the year 2016 saw a
tremendous response. Total 1263 employees were covered
under this training initiative where the employees were given
training in Safety, Skill Upgradation and other behaviour aspects.
2. SAKSHAM PRPJECT
Saksham Project launched for conducting Development
Centres for the Sales Workforce. 497 employees. The aim was
to impart Functional and Technical Competencies to the Sales
Workforce and building capability
3. GLOBAL LEADERSHIP PROGRAM
Global Leadership Program – Winning in the Market Place
launched for the Global Leaders who have potential to grow
along with the organization. The aim is to enable identified
individuals to unlock their full potential and be effective leaders
and contribute in building the strategy.
PARTICULARS OF EMPLOYEES
The information required under Section 197(12) of the Companies
Act, 2013 read with Rule 5(1) and 5(2) of the Companies
(Appointment and Remuneration of Managerial Personnel) Rules,
2014 are given in the Annexures 3 and 4 hereunder and forms part
of this Report.
ENERGY CONSERVATION, TECHNOLOGY ABSORPTION AND
FOREIGN EXCHANGE EARNINGS AND OUTGO
The particulars relating to energy conservation, technology
absorption, foreign exchange earnings and outgo, as required to be
disclosed under sections 134(3)(m) of the Companies Act, 2013 read
with Rule 8(3) of the Companies (Accounts) Rules, 2014 are provided
in Annexure 5 to this Report.
DIRECTORS RESPONSIBILITY STATEMENT
To the best of their knowledge and belief and according to the
information and explanations obtained by them, the directors
make the following statements in terms of Section 134(3)(c) of the
Companies Act, 2013:
a) That in the preparation of the annual financial statements for
the year ended 31st March, 2018, the applicable accounting
standards have been followed alongwith proper explanation
relating to material departures, if any.

UPL Limited Annual Report, 2017-18 92
b) That such accounting policies as mentioned in Note 2.1 of the
Notes to the Financial Statements have been selected and
applied consistently and judgement and estimates have been
made that are reasonable and prudent so as to give a true and
fair view of the state of affairs of the Company as at March 31,
2018 and of the profit of the Company for the year ended on
that date.
c) That proper and sufficient care has been taken for the
maintenance of adequate accounting records in accordance
with the provisions of the Companies Act, 2013 for safeguarding
the assets of the Company and for preventing and detecting
fraud and other irregularities.
d) That the annual financial statements have been prepared on a
going concern basis.
e) That proper internal financial controls were in place and that the
financial controls were adequate and were operating effectively.
f ) That systems to ensure compliance with the provisions of all
applicable laws were in place and were adequate and operating
effectively.
CORPORATE GOVERNANCE
Your Company and its Board has been complying with Corporate
Governance practices as set out in a separate report, in pursuance
of requirement of para C of Schedule V of SEBI (Listing Obligations
and Disclosure Requirements) Regulations, 2015. The Management
Discussions and Analysis Report forms part of this Report. Auditor’s
certificate confirming compliance of the Corporate Governance as
stipulated under the said Regulations is also attached to this Report.
Dealing with securities which have remained unclaimed
Members are hereby informed that as per Regulation 39(4) read
with Schedule VI of the SEBI Regulations, the Company is in the
process of sending reminders to those Members whose share
certificates have remained unclaimed, to contact the Company
immediately in the matter. The Registrar and Transfer Agent M/s
Link Intime India Pvt. Ltd. is in the process of compiling the data for
unclaimed shares. The Company, now after following the prescribed
procedure will dematerialize unclaimed shares which are retained
with the Company. These shares would be held by the Company
on behalf of the holders of such shares in an “Unclaimed Suspense
Account” to be opened with a depository. At the end of seven years,
hereof, these shares shall be transferred by the Company to the IEPF.
Dividends remaining unclaimed in respect of such shares shall also
be held in a separate suspense account and would likewise be
transferred to IEPF at the end of seven years.
Members may note that the lawful claimant in respect of these
shares / dividend will be able to claim such shares dividend from
the Company till such time they remain in the unclaimed suspense
account as aforesaid.
BUSINESS RESPONSIBILITY REPORTING
A separate section of Business Responsibility forms part of this
Annual Report as required under Regulation 34(2)(f ) of SEBI (Listing
Obligations and Disclosure Requirements) Regulations, 2015.
CONSOLIDATED FINANCIAL STATEMENTS
Consolidated Financial statements are prepared for the year 2017-18
in compliance with the provisions of the Companies Act, applicable
Accounting Standards and as prescribed under the SEBI regulations.
The consolidated statements are prepared on the basis of audited
financial statements of the Company, its subsidiaries, associates and
joint ventures. These consolidated financial statements along with
the Auditors Report thereon form part of the Company’s Annual
Report. They are also put up on the website of the Company https://
www.uplonline.com/upl-financial-reports.
EXTRACT OF ANNUAL RETURN
The details forming part of the extract of the Annual Return in form
MGT 9 is annexed herewith as “Annexure 6”.
LISTING OF THE COMPANY’S EQUITY SHARES
The equity shares of your Company are listed on the BSE Ltd. and
National Stock Exchange of India Ltd. There is no default in paying
annual listing fees.
ACKNOWLEDGEMENT
Your Directors are thankful to all the stakeholders and various
government agencies and ministries for their continued support.
CAUTIONARY STATEMENT
Statements in the Director’s Report and the Management Discussion
and Analysis describing the Company’s objectives, expectations
or predictions, may be forward looking within the meaning of
applicable securities laws and regulations. Actual results may differ
materially from those expressed in the statement. Important factors
that could influence the Company’s operations include: global and
domestic demand and supply conditions, availability of critical
materials and their cost, changes in government policies and tax
laws, economic development of the country, and other factors
which are material to the business operations of the Company.
Mumbai On behalf of the Board of Directors
27th April, 2018
Registered Office:
3-11, G.I.D.C., Vapi Rajnikant Devidas Shroff
Dist. Valsad, Gujarat Chairman & Managing Director
Pin: 396195. (DIN: 00180810)

Overview
Strategyreview Performance Governance Financials
93
12
34
56
78
Sr
No.
CSR
proj
ect/
activ
ity id
entifi
edSe
ctor
in w
hich
the
proj
ect i
s co
vere
dPr
ojec
ts/
Prog
ram
mes
Am
ount
ou
tlay
(bud
get)
pr
ojec
t/pr
ogra
mm
e w
ise
Am
ount
spe
nt o
n th
e pr
ogra
mm
e/pr
ojec
tCu
mul
ativ
e sp
end
upto
the
repo
rtin
g pe
riod
Am
ount
sp
ent D
irect
or
thro
ugh
impl
emen
ting
agen
cy*
Sche
dule
Dis
crip
tion
1.Lo
cal
area
s/ot
hers
2.Sp
ecify
th
e st
ate/
dist
rict
1. D
irect
Ex
pens
es2.
Ove
r he
ads
1Sm
t. Sa
ndra
ben
Shro
ff G
nyan
D
ham
Sc
hool
(S
SSG
DS)
, a
Co-e
duca
tiona
l sc
hool
est
ablic
hed
in
year
197
2, a
ffilia
ted
to C
BSE
sylla
bus
for c
omm
unity
in
indu
stria
l tow
n of
Vap
i.
http
s://
ww
w.s
rsgn
yand
ham
.org
/
Cate
gory
(ii
)Pr
omot
ion
of E
duca
tion
AT &
P -
Vapi
39
6195
Dis
tric
t - V
alsa
d,
Guj
arat
045
,00,
000
--45
,00,
000
Gny
an D
ham
Va
pi C
harit
able
Tr
ust
2Ek
lavy
a M
odel
Res
iden
tial S
choo
ls (
EMRS
) un
der
PPP
to p
rovi
de q
ualit
y ed
ucat
ion
to m
erito
rious
tr
ibal
chi
ldre
n.
Cate
gory
(ii
)Pr
omot
ion
of E
duca
tion
At &
P –
A
hwa
Dis
tric
t –
Dan
gs,
Guj
arat
00
--0
Gny
an D
ham
Va
pi C
harit
able
Tr
ust
3Sh
roff
S. R
. Rot
ary
Inst
itute
of C
hem
ical
Tech
nolo
gy
(SRI
CT)
an
in
stitu
tion
spec
ializ
ing
in
chem
ical
te
chno
logy
to
prov
ide
the
spec
ific
need
s of
the
C
hem
ical
Indu
stry
in G
ujar
at.
http
://w
ww
.sric
t.in/
Cate
gory
(ii
)Pr
omot
ion
of E
duca
tion
At &
P –
Va
taria
39
3135
Tal –
Val
ia
Dis
tric
t –
Bhar
uch,
G
ujar
at
4,00
,00,
000
5,87
,82,
091
--5,
87,8
2,09
1A
nkle
shw
ar
Rota
ry E
duca
tion
Soci
ety
4Sa
ndra
Shr
off R
ofel
Col
lege
of N
ursi
ng st
ands
with
th
e de
sire
to n
urtu
re u
p th
e m
inds
of t
heir
stud
ents
th
at c
an b
e a
reas
on fo
r a s
mile
on
the
mill
ions
they
ha
d an
d w
ill c
ome
in c
onta
ct w
ith in
thei
r aca
dem
ics,
clin
ical
and
com
mun
ity a
rea.
Cate
gory
(ii
)Pr
omot
ion
of E
duca
tion
AT &
P -
Vapi
39
6195
Dis
tric
t - V
alsa
d,
Guj
arat
4,00
,00,
000
4,50
,00,
000
--4,
50,0
0,00
0G
nyan
Dha
m
Vapi
Cha
ritab
le
Trus
t
Ann
exur
e 1
to D
irect
ors
Repo
rt
(c)
Man
ner i
n w
hich
the
amou
nt s
pent
dur
ing
the
finan
cial
yea
r is
deta
iled
belo
w.
ANN
UAL
REPO
RT O
N C
ORP
ORA
TE S
OCI
AL R
ESPO
NSI
BILI
TY (C
SR) A
CTIV
ITIE
S1.
A
brie
f out
line
of th
e co
mpa
ny’s
CSR
polic
y, in
clud
ing
over
view
of p
roje
cts o
r pro
gram
s pr
opos
ed t
o be
und
erta
ken
and
a re
fere
nce
to t
he w
eb-li
nk t
o th
e CS
R po
licy
and
proj
ects
or p
rogr
ams.
C
SR P
olic
y is
sta
ted
here
in b
elow
.
W
eblin
k: h
ttp:
//w
ww
.upl
onlin
e.co
m/c
srpo
licy.
2.
The
Com
posi
tion
of th
e CS
R Co
mm
ittee
.
Mrs
. San
dra
R. S
hroff
(Cha
irman
)
M
r. Pr
adee
p G
oyal
(Ind
epen
dent
Dire
ctor
)
M
r. Vi
kram
R. S
hroff
(Dire
ctor
)
3.
Aver
age
net p
rofit
of t
he c
ompa
ny fo
r las
t thr
ee fi
nanc
ial y
ears
A
vera
ge N
et P
rofit
: H 2
96.9
3 C
rore
s
4.
Pres
crib
ed C
SR E
xpen
ditu
re (t
wo
per c
ent.
of th
e am
ount
as
in it
em 3
abo
ve)
Th
e Co
mpa
ny is
requ
ired
to s
pend
H5.
94 c
rore
s to
war
ds C
SR
5.
Det
ails
of C
SR s
pent
dur
ing
the
finan
cial
yea
r.
(a
) To
tal a
mou
nt s
pent
for t
he fi
nanc
ial y
ear;H
20.3
6 C
rore
s
(b
) A
mou
nt u
nspe
nt ,
if an
y; N
il

UPL Limited Annual Report, 2017-18 94
12
34
56
78
Sr
No.
CSR
proj
ect/
activ
ity id
entifi
edSe
ctor
in w
hich
the
proj
ect i
s co
vere
dPr
ojec
ts/
Prog
ram
mes
Am
ount
ou
tlay
(bud
get)
pr
ojec
t/pr
ogra
mm
e w
ise
Am
ount
spe
nt o
n th
e pr
ogra
mm
e/pr
ojec
tCu
mul
ativ
e sp
end
upto
the
repo
rtin
g pe
riod
Am
ount
sp
ent D
irect
or
thro
ugh
impl
emen
ting
agen
cy*
Sche
dule
Dis
crip
tion
1.Lo
cal
area
s/ot
hers
2.Sp
ecify
th
e st
ate/
dist
rict
1. D
irect
Ex
pens
es2.
Ove
r he
ads
5U
PL P
raga
ti to
cre
ate
sust
aina
ble
livel
ihoo
d w
ith
a sh
arpe
r fo
cus
on f
arm
ing
com
mun
ity,
unsk
illed
yo
uth
and
wom
en t
o im
prov
e th
e qu
ality
of
life
in
the
long
term
. Als
o fo
cus
on c
onse
rvat
ion
of n
atur
al
reso
urce
s fo
r su
stai
nabl
e liv
elih
ood.
The
Str
ateg
y en
visa
ged
for o
pera
tiona
lizin
g un
der U
PL P
raga
ti fo
r th
e su
stai
nabl
e liv
elih
ood
has
four
pill
ars.
1. S
kill
deve
lopm
ent t
hru
UPL
Niy
ojan
iy.
2. E
ntre
pren
eurs
hip
thru
UPL
Udy
amita
.
3. A
gric
ultu
re d
evel
opm
ent t
hru
UPL
Khe
dutP
raga
ti
4. N
atur
e co
nser
vatio
n th
ru U
PL V
asud
ha
http
://sr
sat.o
rg/
Cate
gory
(i)
, (ii)
, (iii
), (v
i), (v
ii), (
x)
i)
erad
icat
ing
extr
eme
hung
er a
nd p
over
ty;
ii)
prom
otio
n of
ed
ucat
ion;
iii)
prom
otin
g ge
nder
eq
ualit
y an
d em
pow
erin
g w
omen
;
vi)
ensu
ring
envi
ronm
enta
l su
stai
nabi
lity;
vii)
em
ploy
men
t en
hanc
ing
voca
tiona
l sk
ills;
x)
Rura
l Dev
elop
men
t /
Slum
Dev
elop
men
t
AT &
P -
Vapi
AT &
P -
Ank
elsh
war
&
Jhag
adia
Villa
ges
in
Dan
g
Dis
tric
t -
Vals
ad
Dis
tric
t -
Bhar
uch,
G
ujar
at
Dis
tric
t –
Dan
gs,
Guj
arat
4,00
,00,
000
3,15
,00,
000
--3,
15,0
0,00
0S.
R. S
hroff
A
ajiv
ika
Trus
t (S
RSAT
)
6G
loba
l Pa
rli,
is a
Nat
ion
Build
ing
proj
ect
thro
ugh
Revi
val a
nd E
mpo
wer
men
t of t
he V
illag
es o
f Ind
ia. 1
5 vi
llage
s ha
ve b
een
sele
cted
in d
roug
ht-p
rone
Par
li te
hsil
in M
arat
haw
ada
for 3
60 d
egre
e de
velo
pmen
t. Th
is w
ould
be
a “m
odel
” de
velo
pmen
t to
cre
ate
prog
ress
ive,
eco
nom
ical
ly v
iabl
e an
d pr
ospe
rous
ru
ral
Indi
a. T
his
will
se
rve
as
an
tran
sfor
mat
ive
proc
ess
that
can
be
repl
icat
ed a
cros
s th
e co
untr
y fo
r a
pros
pero
us In
dia.
http
s://
ww
w.g
loba
lpar
li.or
g/
Cate
gory
(i)
, (ii)
, (iii
), (v
i), (v
ii), (
x)
i)
erad
icat
ing
extr
eme
hung
er a
nd p
over
ty;
ii)
prom
otio
n of
ed
ucat
ion;
iii)
prom
otin
g ge
nder
eq
ualit
y an
d em
pow
erin
g w
omen
;
vi)
ensu
ring
envi
ronm
enta
l su
stai
nabi
lity;
vii)
em
ploy
men
t en
hanc
ing
voca
tiona
l sk
ills;
x)
Rura
l Dev
elop
men
t /
Slum
Dev
elop
men
t
15 v
illag
es
in P
arli,
Bee
d di
stric
t in
Mah
aras
htra
Dis
tric
t Be
ed -
Mah
aras
htra
60,0
0,00
01,
17,0
0,00
0--
1,17
,00,
000
UPL
Lim
ited
in
part
ners
hip
with
M
anav
Sev
a M
anda
l

Overview
Strategyreview Performance Governance Financials
951
23
45
67
8
Sr
No.
CSR
proj
ect/
activ
ity id
entifi
edSe
ctor
in w
hich
the
proj
ect i
s co
vere
dPr
ojec
ts/
Prog
ram
mes
Am
ount
ou
tlay
(bud
get)
pr
ojec
t/pr
ogra
mm
e w
ise
Am
ount
spe
nt o
n th
e pr
ogra
mm
e/pr
ojec
tCu
mul
ativ
e sp
end
upto
the
repo
rtin
g pe
riod
Am
ount
sp
ent D
irect
or
thro
ugh
impl
emen
ting
agen
cy*
Sche
dule
Dis
crip
tion
1.Lo
cal
area
s/ot
hers
2.Sp
ecify
th
e st
ate/
dist
rict
1. D
irect
Ex
pens
es2.
Ove
r he
ads
7U
PL S
choo
l San
itatio
n Pr
ojec
t to
fac
ilita
te h
ealth
y an
d hy
gien
ic b
ehav
ior
in s
tude
nts
by c
onst
ruct
ion
of g
ood
qual
ity a
nd e
nviro
nmen
t fri
endl
y to
ilets
in
scho
ol. T
he p
roje
ct o
bjec
tive
is t
o pr
ovid
e ac
cess
to
toi
let
faci
lity
and
empo
wer
stu
dent
s to
use
the
se
rvic
es h
ygie
nica
lly &
sus
tain
ably
, Inc
reas
ed a
cces
s to
& h
ygie
nic
use
of s
anita
tion
faci
lity
and
Educ
ate
com
mun
ity b
y m
akin
g sc
hool
toile
t blo
ck a
s hu
b fo
r go
od s
anita
tion
prac
tice
in c
omm
unity
.
Cate
gory
(i)
SAN
ITAT
ION
, inc
ludi
ng
cont
ribut
ion
to th
e Sw
ach
Bhar
at K
osh
set-
up b
y th
e Ce
ntra
l Gov
ernm
ent
for t
he p
rom
otio
n of
sa
nita
tion.
AT &
P -
Vapi
AT &
P -
Ank
elsh
war
&
Jhag
adia
Dis
tric
t -
Vals
ad
Dis
tric
t -
Bhar
uch,
G
ujar
at
2,00
,00,
000
68,6
0,44
5--
68,6
0,44
5D
irect
by
Com
pany
8LO
CAL
ARE
A N
EED
-
Dev
elop
men
t Su
ppor
t to
co
mm
unity
aro
und
fact
ory
loca
tion.
Sup
port
lik
e Sc
hool
bag
and
boo
k pr
ovis
ioni
ng,
Infra
stru
ctur
e su
ppor
t, M
edic
al
Supp
ort
etc.
A
lso
prov
idin
g de
velo
pmen
t Su
ppor
t fo
r loc
al a
rea
to o
rgan
isat
ion
like
Dee
p D
arsh
an S
choo
l
Him
Jyo
ti Sc
hool
Khar
Res
. Ass
Lib
rary
Seva
Yag
na S
amit
For M
orta
llity
Rat
e
Jhag
adia
Indu
stria
l Ass
ocia
tion
Ank
lesh
war
Indu
stria
l Dev
elop
men
t Soc
iety
(Mob
ile
Educ
atio
n)
Carm
elite
Sis
ters
Of C
harit
y
Cate
gory
(i)
, (ii)
, (iii
), (v
i), (v
ii), (
x)
i)
erad
icat
ing
extr
eme
hung
er a
nd p
over
ty;
ii)
prom
otio
n of
ed
ucat
ion;
iii)
prom
otin
g ge
nder
eq
ualit
y an
d em
pow
erin
g w
omen
;
vi)
ensu
ring
envi
ronm
enta
l su
stai
nabi
lity;
vii)
em
ploy
men
t en
hanc
ing
voca
tiona
l sk
ills;
x)
Rura
l Dev
elop
men
t /
Slum
Dev
elop
men
t
AT &
P -
Vapi
AT &
P -
Ank
elsh
war
&
Jhag
adia
Dis
tric
t -
Vals
ad
Dis
tric
t -
Bhar
uch,
G
ujar
at
50,0
0,00
085
,03,
275
--85
,03,
275
Dire
ct b
y Co
mpa
nyA
lso
with
loca
l N
GO
's w
orki
ng
in a
rea
as
men
tione
d in
co
lum
n B

UPL Limited Annual Report, 2017-18 96
12
34
56
78
Sr
No.
CSR
proj
ect/
activ
ity id
entifi
edSe
ctor
in w
hich
the
proj
ect i
s co
vere
dPr
ojec
ts/
Prog
ram
mes
Am
ount
ou
tlay
(bud
get)
pr
ojec
t/pr
ogra
mm
e w
ise
Am
ount
spe
nt o
n th
e pr
ogra
mm
e/pr
ojec
tCu
mul
ativ
e sp
end
upto
the
repo
rtin
g pe
riod
Am
ount
sp
ent D
irect
or
thro
ugh
impl
emen
ting
agen
cy*
Sche
dule
Dis
crip
tion
1.Lo
cal
area
s/ot
hers
2.Sp
ecify
th
e st
ate/
dist
rict
1. D
irect
Ex
pens
es2.
Ove
r he
ads
9N
ATIO
NA
L N
EED
-
Dev
elop
men
t Su
ppor
t fo
r N
atio
nal c
ause
to o
rgan
isat
ion
like
Frie
nds
Of T
ribal
Soc
iety
Prav
ara
Rura
l Edu
catio
n So
ciet
yJa
nsev
a Fo
unda
tion
Vive
kana
nd R
esea
rch
& Tr
ng In
stitu
teD
eep
Dar
shan
Sch
ool
Him
alay
an S
choo
l Soc
iety
Wom
en &
Chi
ld C
are
Him
Jyo
ti Sc
hool
Man
av U
ttha
n Se
va S
amiti
Sneh
a (S
oc N
utrit
uion
, Edu
, Hea
lth)
Sam
ast P
atid
ar A
arig
ya T
rust
Vs
pm A
cade
my
Hig
her E
duca
tion
Apa
da R
ahat
Kos
h -
Biha
r Flo
od R
elie
fC
hief
Min
iste
r Rel
ief F
und
Sr.C
itize
n Sa
ntac
urz
Sans
tha(
Cem
etry
)Th
e C
harit
abal
Tru
st O
f Rot
ary
Clu
bSt
.Tho
mas
Aca
dem
y Ed
ucat
ion
Fund
80G
Kam
araj
Chi
ldre
n Ed
u.Tr
ust
Care
Chi
ld &
Old
Age
Fou
ndat
ion
The
Rota
ry F
ound
atio
n (In
dia)
Wom
en &
Chi
ld C
are
Mk
Educ
atio
nal S
ocie
tyCa
re P
arva
rish
Foun
datio
n Bh
abha
Hos
pita
l - B
io G
as P
roje
ctKh
ar R
es. A
ss L
ibra
ryKh
ar L
ibra
ry-A
quag
uard
Cate
gory
(i)
, (ii)
, (iii
), (v
i), (v
ii), (
x)
i)
erad
icat
ing
extr
eme
hung
er a
nd p
over
ty;
ii)
prom
otio
n of
ed
ucat
ion;
iii)
prom
otin
g ge
nder
eq
ualit
y an
d em
pow
erin
g w
omen
;
vi)
ensu
ring
envi
ronm
enta
l su
stai
nabi
lity;
vii)
em
ploy
men
t en
hanc
ing
voca
tiona
l sk
ills;
x)
Rura
l Dev
elop
men
t /
Slum
Dev
elop
men
t
2,25
,00,
000
3,67
,77,
342
--3,
67,7
7,34
2Th
roug
h N
GO
’s m
entio
ned
in
colu
mn
B
Tota
l17
,35,
00,0
0020
,36,
23,1
530
20,3
6,23
,153

Overview
Strategyreview Performance Governance Financials
97
We, UPL Limited and our subsidiaries (together constituting the UPL
Group), take initiative to contribute to harmonious and sustainable
development of the society through all our business activities that
we carry out in various countries across the globe. We recognize
that business enterprises are economic organs of society that
draw on various societal resources for its functioning and growth,
It is our core belief therefore that a company’s performance must
be measured not only by its bottom line but also with respect to
the social contributions made by the company while achieving its
financial goals.
A. CSR Vision
To be a catalyst for a more equitable and inclusive society by
supporting long term sustainable transformation and social
integration.
B. CSR Mission
We will achieve our vision by
Implementing need based projects through participatory
approach.
Focusing on building capacity to make community Self-Reliance
Developing partnership.
Transferring knowledge
C. CSR ValuesThe values that will govern to achiev our vision are
Care,
Excellence and
Sustainability
D. CSR focus areas
Our CSR initiative is called as UPL Pragati which means PROGRESS
and is in line with our stated Vision. Our CSR activities will focus not
just around our Factory and offices, but also in other geographies
based on the needs of the communities. The Six CSR focus areas for
community to progress are:
1. Education and Empowerment Education is a basic human right pivotal to personal and
societal development and so is an integral part of our CSR
work. Under education we will work and support promotion of
education, including primary education, higher education and
employment oriented course especially among women, elderly,
and the differently abled.
2. Employability and Entrepreneurship A major factor contributing to rural youth underemployment is
skills mismatch with huge skills deficit in limited job growth and
expansion. We will work on enhancing vocation skills especially
among youths, women, and the differently abled. We will also
work on livelihood enhancement projects through Self Help
Group and Entrepreneurship development Programme with
women and economically backward groups.
3. Agriculture Development Agriculture in India is both, a source of livelihood and food
security for a vast majority of vulnerable sections of society.
A higher priority to agriculture will be given under livelihood
enhancement rural development projects so as to achieve the
goals of reducing poverty and malnutrition as well as of inclusive
growth. We will adopt a framework of UPL KhedutPragati
Programme for our Agriculture development intervention
and will work on farmers Capacity building, Lab to land and
Technology intervention.
Under Nature conservation we will work on UPL Vasudha
Project by nurturing and strengthening Eco and Environment
club in schools, Tree Plantation, Species conservation, Soil
& Water Conservation etc. Our Environment and Nature
conservation activities will lead to environmental sustainability,
ecological balance, protection of flora and fauna, animal welfare,
agroforestry, conservation of natural resources and maintaining
quality of soil, air and water;
5. Health and Sanitation We will work on providing better healthcare facilities by partially
funding and running hospital, health projects, public health
programmes, Health awareness programmes, health check-up
programme, Blood donation programme, provision of medicine
& treatment facilities, program for preventing diseases and
building immunity etc
We will also work on aspects of water, sanitation and hygiene
because of which the health and financial burden on poor
people is high. We will work on awareness programme,
construction of toilet in schools and construction of toilet for
general needy community.
6. National / Local area need We will work on specific local area needs around our Factory
locations.
We will respond to national need, which also include relief or
rebuild which can arise from natural calamities.
E. CSR Implementation In accordance with sub-section (1) of section 135 of the
Companies Act 2013, UPL has set up a CSR committee to advise
on the company’s CSR policy, and monitor the CSR activities
of UPL Limited. All projects are identified as per needs of
community.
F. CSR Resource contribution Minimum 2% of the average of net profit made by the Company
during immediately preceding three financial years as per
Companies Act 2013.
CSR POLICY

UPL Limited Annual Report, 2017-18 98
We have conducted the secretarial audit of the compliance
of applicable statutory provisions and the adherence to good
corporate practices by UPL Limited (hereinafter called the company).
Secretarial Audit was conducted in a manner that provided us a
reasonable basis for evaluating the corporate conducts/statutory
compliances and expressing my opinion thereon.
Based on our verification of the company’s books, papers, minute
books, forms and returns filed and other records maintained by the
company and also the information provided by the Company, its
officers, agents and authorized representatives during the conduct
of secretarial audit, We hereby report that in our opinion, the
company has, during the audit period covering the financial year
ended on March 31, 2018 complied with the statutory provisions
listed hereunder and also that the Company has proper Board-
processes and compliance mechanism in place to the extent, in the
manner and subject to the reporting made hereinafter:
We have examined the books, papers, minute books, forms and
returns filed and other records maintained by the Company for the
financial year ended on March 31, 2018 according to the provisions
of:
(1) The Companies Act, 2013 (the Act) and the Rules made
thereunder;
(2) The Securities Contracts (Regulation) Act, 1956 (‘SCRA’) and the
Rules made thereunder;
(3) The Depositories Act, 1996 and the Regulations and bye-laws
framed thereunder;
(4) Foreign Exchange Management Act, 1999 and the Rules and
Regulations made thereunder to the extent of Foreign Direct
Investment;
(5) The following Regulations and Guidelines prescribed under the
Securities and Exchange Board of India Act, 1992 (‘SEBI Act’):-
a) The Securities and Exchange Board of India (Substantial
Acquisition of Shares and Takeovers) Regulations, 2011;
b) The Securities and Exchange Board of India (Prohibition of
Insider Trading) Regulations, 2015;
c) The Securities and Exchange Board of India (Issue of
Capital and Disclosure Requirements) Regulations, 2009,
Not Applicable.
d) The Securities and Exchange Board of India (Issue and
Listing of Debt Securities) Regulations, 2008,
e) The Securities and Exchange Board of India (Share Based
Employee Benefits) Regulations, 2014.
f ) The Securities and Exchange Board of India (Listing
Obligation and Disclosure Requirement) Regulations, 2015.
6) Other Laws applicab le to the Company;
a) Narcotic Drugs and Psychotropic Substances Act, 1985
b) The Insecticides Act,1968
c) Factories Act, 1948 and Rules made thereunder
d) Explosives Act, 1889 - Gas Cylinder Rules, 1981
e) Petroleum Act, 1934, Rules, 1976
f ) Industrial Employment (Standing Orders)Act, 1946 &
Rules 1957
g) Payment of Bonus Act 1965, & Rules, 1965
h) Maternity Benefit Act 1961 & Rules
i) Employees Compensation Act, 1923 & Rules.
j) Minimum Wages Act, 1948, M.W(C) Rules, 1950
k) Child Labour (P&R) Act 1986 & Rules.
l) Air (Prevention and Control of Pollution) Act 1981
m) Water(Prevention and Control of Pollution) Act 1974
n) The Noise (Regulation and Control) Rules 2000
o) Ozone Depleting Substances (Regulation & Control)Rules
2000
SECRETARIAL AUDIT REPORTFORM NO. MR-3
For the Financial Year ended March 31, 2018[Pursuant to Section 204(1) of the Companies Act, 2013 and Rule No. 9 of the Companies
(Appointment and Remuneration of Managerial Personnel) Rules, 2014]
To,
The Members,
UPL Limited
Annexure 2 to Directors Report
N.L. Bhatia & associates
Company Secretaries
507, Skyline Wealth Space, 5th Floor, C2 Wing, Skyline Oasis Complex, Premier Road, Near Vidyavihar Station, Ghatkopar (West), Mumbai 400086
tel.: 91-022-2510 0718, 91-022-2510 0698 e-mail : [email protected]

Overview
Strategyreview Performance Governance Financials
99
p) The Chemical Accidents (Emergency Planning,
Preparedness and Response) Rules 1996
q) Payment of Wages Act 1936
r) Employees State Insurance Act 1948 and Rules and
Regulations
s) Employees PF & Miscellaneous Provisions Act 1952
&Employees Pension Scheme 1952
t) Employees PF & Miscellaneous Provisions Act 1952
&Employees Provident Fund Scheme 1952
u) Contract Labour (Regulation & Abolition) Act 1970
v) Legal Metrology Act, 2009
w) Industrial Disputes Act, 1947 and Rules made thereunder
x) Indian Contract Act, 1872
y) Environment Protection Act, 1986 and other
environmental laws
z) Payment of Gratuity Act, 1972
aa) Sexual Harassment of Women at Workplace (Prevention,
Prohibition and Redressal) Act, 2013
bb) The States Shops and Establishments Act.
cc) Apprentice Act 1961 and Rules made thereunder
dd) The Employees Deposit Linked Insurance Scheme 1976.
ee) The Employment Exchange (Compulsory Notification of
Vacancies) Act, 1959 and Rules made thereunder
ff ) The Equal Remuneration Act 1976 and Rules made
thereunder
gg) The Food Safety and Standard Act, 2006 & The Food
Safety and Standard Rules, 2011
hh) The prevention of Food Adulteration Act, 1954 and the
Rules made thereunder
ii) The Bio-Medical Waste Management & The Handling
rules, 1998
jj) The Bureau of Indian Standards Act, 1986 and the Rules
and Regulations made thereunder
kk) The Chemical weapon convention Act 2000, and the
Rules made thereunder
ll) The Explosive Act 1884 and the Static and Mobile
Pressure Vessels (Unfired) Rules 1981
mm) The Indian Standard code of Practice for selection,
Installation and Maintenance of Portable First Aid Fire
Extinguishers
nn) The Electricity Act 2003 and the Indian Electricity Rules
1956
oo) The Indian Boilers Act, 1923 & The Indian Boilers
Regulations 1950
We have also examined compliance with the applicable clauses of
the following:
a) Secretarial Standards issued by The Institute of Company
Secretaries of India.
During the period under review the Company has complied with
the provisions of the Act, Rules, Regulations, Guidelines, Standards,
etc. mentioned above.
We further report that The Board of Directors of the Company is
duly constituted with proper balance of Executive Directors, Non-
Executive Directors and Independent Directors. The changes in
the composition of the Board of Directors that took place during
the period under review were carried out in compliance with the
provisions of the Act.
Adequate notice is given to all directors to schedule the Board
Meetings, agenda and detailed notes on agenda were sent at least
seven days in advance, and a system exists for seeking and obtaining
further information and clarifications on the agenda items before
the meeting and for meaningful participation at the meeting.
Majority decision is carried through while the dissenting members’
views are captured and recorded as part of the minutes. All the
decisions have been taken unanimously and no dissent recorded.
We further report that there are adequate systems and processes
in the Company commensurate with the size and operations of the
Company to monitor and ensure compliance with applicable laws,
rules, regulations and guidelines.
For N. L. Bhatia & Associates
Practicing Company Secretaries
UIN: P1996MH055800
N. L. Bhatia
Managing Partner
Place: Mumbai FCS: 1176
Date: April 19, 2018 CP. No. 422
UPL Limited Annual Report, 2017-18 100
To,
The Members,
UPL Limited
Our report of even date is to be read along with this letter.
(1) Maintenance of Secretarial record is the responsibility of the management of the Company. Our responsibility
is to express an opinion on these secretarial records based on our audit.
(2) We have followed the audit practices and processes as were appropriate to obtain reasonable assurance
about the correctness of the contents of the secretarial records. The verification was done on test
basis to ensure that correct facts are reflected in secretarial records. We believe that the processes
and practices , we followed provide a reasonable basis for our opinion
(3) We have not verified the correctness and appropriate of financial records and Books of Accounts of the
Company.
(4) Wherever required we have obtained the Management representation about the compliance of Laws, Rules
and Regulations and happening of events etc.
(5) The compliance of the provisions of Corporate and Other Applicable Laws, Rules, Regulations, Standard
is the responsibility of Management. Our examination was limited to the verification of procedures on test
basis.
(6) The Secretarial Audit report is neither an assurance as to the future viability of the Company nor the efficacy
or effectiveness with which the Management has conducted the affairs of the Company.
For N. L. Bhatia & Associates
Date: April 19, 2018 Company Secretaries
Place: Mumbai UIN: P1996MH055800
N. L. Bhatia
Managing Partner
FCS: 1176
CP. No. 422
N.L. Bhatia & associates
Company Secretaries
507, Skyline Wealth Space, 5th Floor, C2 Wing, Skyline Oasis Complex, Premier Road, Near Vidyavihar Station, Ghatkopar (West), Mumbai 400086
tel.: 91-022-2510 0718, 91-022-2510 0698 e-mail : [email protected]

Overview
Strategyreview Performance Governance Financials
101
Disclosure required under Section 197(12) of the Companies Act, 2013 read with Rule 5(1) of the Companies
(Appoinment and Remuneration of Manegerial Personnel) Rules, 2014.
FORMING PART OF THE DIRECTORS' REPORT FOR THE YEAR ENDED 31ST MARCH, 2018.
1 The ratio of the remuneration of each director to the median
remuneration of the employees of the company for the financial
year
1020953 R. D. Shroff 181x
1020957 Arun Ashar 46x
1020955 K M Banerjee 12x
2 The percentage increase in remuneration of each director, Chief
Financial Officer, Chief Executive Officer, Company Secretory or
Manager, if any, in the financial year
1020953 R D Shroff -36%
1020957 Arun Ashar -11%
1020955 K M Banerjee -6%
1000007 M B Trivedi 11%
1203524 Anand Kantilal Vora 73%
3 The percentage increase in the median remuneration of
employees in the financial year
8%
4 The number of permanent employees on the rolls of company 3865
5 Average percentile increase already made in the salaries of
employees other than the managerial personnel in the last
financial year and its comparison with the percentile increase in
the managerial remuneration and justification thereof and point
out if there are any exceptional circumstances for increase in the
managerial remuneration
Average percentile increased in salaries other
than Key Managerial personnel in the last f.year
1.50%
Percentil increse in the Managerial remuneration 3.48%
6 The ratio of the remuneration of the highest paid director to that
of the employee who are not directors but receive remuneration
in excess of the highest paid director during the year
N/A
7 Affirmation that the remuneration is as per the remuneration
policy of the company
Annexure 3 to Directors Report

UPL Limited Annual Report, 2017-18 102
Stat
emen
t pur
suan
t to
sect
ion
197(
12) o
f the
Com
pani
es A
ct, 2
013
read
with
the
Com
pani
es
(app
oinm
ent a
nd re
mun
erat
ion
of m
aneg
eria
l per
sonn
el) r
ules
, 201
4 an
d fo
rmin
g pa
rt o
f the
dire
ctor
s' re
port
for t
he y
ear e
nded
31s
t mar
ch, 2
018.
Not
e:1)
G
ross
rem
uner
atio
n sh
own
abov
e is
sub
ject
to ta
x an
d co
mpr
ises
sal
ary,
allo
wan
ces,
com
mis
sion
, inc
entiv
es, m
onet
ary
valu
e of
per
quis
ites,
com
pany
's co
ntrib
utio
n to
pro
vide
nt fu
nd a
nd s
uper
annu
atio
n fu
nd.
In
add
tion
to th
e ab
ove,
em
ploy
ees
are
also
ent
itled
to g
ratu
ity, m
edic
al b
enefi
ts e
tc. i
n ac
cord
ance
with
Com
pany
's ru
les.
2)
Non
e of
the
abov
e em
ploy
ee, a
long
with
the
spou
se a
nd d
epen
dant
chi
ldre
n ho
ld m
ore
than
2%
of t
he e
quity
sha
res
of th
e Co
mpa
ny.
3)
Mr.
R. D
. Shr
off is
a re
lativ
e of
the
Dire
ctor
s of
the
Com
pany
nam
ely,
Mrs
. S. R
. Shr
off, M
r. J.
R. S
hroff
and
Mr.
V. R
. Shr
off
4)
All
empl
oees
are
per
man
ent e
mpl
oyee
s of
the
Com
pany
5)
* Em
ploy
ed fo
r the
par
t of t
he y
ear.
Ann
exur
e 4
to D
irect
ors
Repo
rt
Sr.
No.
Nam
eD
esig
natio
nRe
mun
erat
ion
Qua
lifica
tion
Dat
e of
Jo
inin
gAg
eLa
st E
mpl
oyem
ent
1Fa
rokh
N H
illoo
Glo
bal S
ales
Dire
ctor
3756
3980
B.A
, Dip
lom
a in
Impo
rt E
xpor
t Man
agem
ent
08/0
7/19
9156
Indi
an C
omm
erci
al C
ompa
ny L
td.
2R
D S
hroff
Chai
rman
& M
anag
ing
Dire
ctor
9873
2783
B.Sc
., 29
/05/
1969
85N
il
3A
run
Asha
r D
irect
or -
Fina
nce
2690
2938
B.Co
m., A
CA01
/07/
1994
70Ex
cel I
ndus
trie
s Lt
d.
4K
R Sr
ivas
tava
CEO
- Sp
ecia
lty C
hem
ical
s32
3616
16B.
Chem
., PG
DBM
A (I
IM),
DSM
20/0
7/19
9961
Phar
mac
eutic
al P
rodu
cts
of In
dia
Ltd.
5As
huto
sh K
umar
Aw
asth
iCh
ief E
xecu
tive
Offi
cer
2822
3324
B.Te
ch., M
BA11
/06/
2008
49Pi
ram
al G
lass
Ltd
.
6Ro
hit K
umar
Vi
ce P
resi
dent
- Le
gal
1915
3289
LLB
01/0
7/20
1040
Free
hills
7Vi
dya
Saga
r Kau
shik
Pres
iden
t - C
orpo
rate
Affa
irs a
nd In
dust
ry R
elat
ions
3510
2514
B.Sc
., PG
DM
01/0
4/20
1166
Baye
r Ag.
8Ra
j Kum
ar T
iwar
iG
loba
l Dire
ctor
- Su
pply
Cha
in &
Man
ufac
turin
g14
1512
69B.
Tech
., PG
PX06
/09/
2011
48CE
AT T
yres
9N
itin
Achy
ut K
olha
tkar
Vice
Pre
side
nt -
Fina
nce
1417
9984
M.C
om, I
CW
A11
/10/
2011
54A
rshi
ya In
d. L
td.
10Sw
apni
l Onk
ar G
anvi
rEx
ecut
ive
Pilo
t12
6727
68B.
Com
15/0
6/20
1240
Air
Indi
a Ex
pres
s
11M
ahes
h Vi
jay
Wat
aney
Dire
ctor
- In
dust
rial C
hem
ical
Bus
ines
s10
1649
90BE
, MM
S04
/03/
2013
50Ka
nsai
New
tac
12A
nand
Kan
tilal
Vor
a
Chie
f Fin
anci
al O
ffice
r29
1778
81B.
Com
, CA
05/0
8/20
1354
Bung
e In
dia
13Ki
shor
e G
urbu
x Ch
andi
ram
ani
Dire
ctor
- G
loba
l Ins
titut
iona
l Bus
ines
s18
0887
88B.
Sc., M
MM
01/0
4/20
1455
Gha
rda
Chem
ical
s Li
mite
d
14Ja
naki
ram
an R
ajar
aman
D
irect
or -
Glo
bal P
rocu
rem
ent
1622
0764
BE, M
BA01
/07/
2014
51H
einz
Indi
a
15Ja
yara
m P
hilk
ana
Ch
ief H
uman
Res
ourc
e O
ffice
r29
3729
91B.
Com
, PG
D -
Pers
onne
l Man
agem
ent &
IR01
/09/
2014
48CA
RGIL
L - S
inga
pore
16A
Bal
aji
Chie
f Inf
orm
atio
n O
ffice
r14
1000
68B.
Com
, A.C
.A25
/03/
2015
50Pi
ram
al E
nter
pris
e Lt
d
17A
jit P
rem
nath
CO
O &
Glo
bal B
usin
ess
Hea
d - C
rop
Prot
ectio
n40
4610
93M
.Sc.
, MBA
( M
arke
ting
) 01
/08/
2015
60U
PL E
urop
Ltd
.
18Pr
asha
nt B
Bel
gam
war
Busi
ness
Dire
ctor
- So
uth
Asia
, Adv
anta
1139
2975
B.Sc
. M
.Sc.
09/0
9/20
1654
Syng
enta
Indi
a Li
mite
d
19Sa
mee
r Tan
don
Re
gion
al D
irect
or -
Indi
a15
5192
37BE
.01
/12/
2016
49O
rient
Ele
ctric
lim
ited
20Ra
mes
h Ch
eruk
u
Supp
ly C
hain
Lea
d - A
sia
1673
3551
B. S
C..A
gri
04/0
6/20
1552
Syng
enta
Indi
a Li
mite
d
21Pa
rmes
war
an P
N *
Vice
Pre
side
nt -
Envi
ronm
ent
1027
2104
M.Te
ch.(
Chem
ical
Eng
g.),
MBA
, PhD
31/0
1/19
9564
Gha
rda
Chem
ical
s Li
mite
d
22N
avee
n Ch
ahal
*D
irect
or -
New
Bus
ines
sses
& C
EO o
f UPD
T28
7923
56BE
/PG
DM
03/0
8/20
1555
Mos
aic
Indi
a Pv
t.Ltd
23D
ebab
rata
Gup
ta *
Chie
f Ope
ratin
g O
ffice
r - S
uppl
y Ch
ain
& M
anuf
actu
ring
4206
4736
B Te
ch (H
ons)
02/0
5/20
1655
USV
Lim
ited

Overview
Strategyreview Performance Governance Financials
103
A. Conservation of Energy 2017-18 i. The following Energy conservation measures were
taken during the year 2017-18
The Company has dedicated ‘Energy Cell’, who is
continuously working for Energy Cell, by identifying
new and innovative measures, implementing across
Company’s plants, The Team also closely monitors specific
energy consumption pattern across all manufacturing
sites. We conducted Periodic Internal & external energy
audits to improve energy performance. This resulted in
reduction in energy footprint of products. Last year Key
Focus area has been on heat integration in processes and
waste heat recovery. Some Major Energy saving initiatives
are mentioned below;
1. Fully automated waste heat recovery from Fume
incinerator installed for hot water generation which
eliminated fresh steam requirement in adjacent plant.
2. Installation of Back pressure turbine which generate
Electrical Energy by utilizing Kinetic energy of
pressure reducing station. Here substantial energy
cost saving is achieved.
3. Developed in-house online condenser ball cleaning
system which help to sustain Heat transfer coefficient
of condenser & coefficient of performance of
refrigeration system.
4. Steam and power reduction through reflux
optimization in cooking stage of reaction by close
loop control.
5. Substitution of conventional furnace oil (FO) with low
Sulphur FO in process steam boiler which is having
good impact on reducing GHG emission.
6. Reduced specific power consumption upto 12% by
reducing condensing temperature by 4 Deg C in
refrigeration plants.
7. Added CO-GEN plant at Unit 05, which has increased
overall efficiency of Power Plant.
8. Adopted new concept of smokeless & flameless
induction cooking appliances in canteen.
9. Installation of Super Energy Efficient fans.
The Company has been awarded by ISO 50001 certification
for Unit-2, Ankleshwar which as per Bureau Veritas is the
First Agrochemical plant.
ii. Steps taken by the company to utilize alternate source & reduce energy consumption:
1. We have 760 KWH Roof top Solar photo voltaic power generation proposal for one of largest site at Jhagadia with investment of 6 Crores. This will utilize building and warehouse roofs for solar power generation.
2. We are already entered in to agreement for sourcing Wind power @ 45 lac units per annum for our plant 01. We have also planned for purchasing Wind energy @ 40 lac units per annum for plant 05.
3. For our upcoming mega site at Dahej Gujarat, we have considered to integrate with Solar Photo voltaic power generation.
4. We have planned to capture most of Steam Pressure reducing systems to recover Kinetic energy to generate power through Back pressure Turbine. This will reduce conventional energy consumption. This year we have installed 3 such Turbines, and 5 more are under progress. With this measure UPL will reduce Total conventional power of 14 MW, last year we achieved @ 6 MW.
5. We have installed Rain Water Harvesting system at Unit 01, Unit 10, and under progress in all other plants. This will not only harvest rain water but also save pumping power.
6. UPL had initiated several Energy consumption reduction program through innovative measures, like process pinch, Heat integration, achieving higher overall efficiency, Closed loop condensate & Flash recovery system and Heat recovery through Heat Pipe.
7. We have started harvesting natural day light through light pipe and translucent sheets in security, offices, canteens and ware-houses.
8. We have reduced @0.65 MW load through conversion of Lighting to LED lights.
iii. Capital Investment on energy conservation equipment’s:
1. A total of 27 Crores was invested into installation of energy efficient equipment. All future projects are being evaluated and approved based on the lowest energy and carbon foot print.
2. The Company’s units have been recipients of multiple awards as a recognition of our energy conservation
measures and Sustainability.
Conservation of Energy, Technology Absorption, Adaptation and Foreign Exchange Earnings and Outgo
SECTION 134(3)(m) OF THE COMPANIES ACT, 2013 READ WITH RULE 8(3) OF THE COMPANIES (ACCOUNTS) RULES, 2014
Annexure 5 to Directors Report

UPL Limited Annual Report, 2017-18 104
B. Technology Absorption, Adaptation and Innovation i. Following initiatives were taken by the company
towards the technology absorption, adaptation and innovation:
1. A plant for the production of a widely used herbicide
was commissioned. The product of desired quality
and cost effectiveness is now produced on regular
basis.
2. An auxiliary chemical used in a leading herbicide
formulation product started to be manufactured
indigenously to ensure supply of the chemical with
desired quality and reduced cost.
3. A safener used for herbicide formulations was
manufactured indigenously to meet with the market
requirement.
4. Twelve new pesticide formulations were
commercialized for launch both in the domestic and
international markets.
5. Processes for five active ingredients were developed
successfully at Research and Development Centres.
6. One hundred formulations of various active
ingredients were successfully developed in the
Research and Development Centres for future
introduction.
7. Processes were developed for the intermediates of
three technicals as an initiative to be self-dependent.
8. Some of the marketed formulation products were
worked upon resulting in the cost reduction.
9. The quality of many actives and formulation products
were improved and the process implemented in the
plant.
10. A non-agro application of Superabsorbent Polymer
(SAP) was developed.
11. Continued collaboration with outside agencies like
universities, research institutes and scientists in their
individual capacity has resulted into innovations and
new technology implementation or upgradation of
the existing technologies.
ii. Benefits derived by the company:
i. An herbicide production plant was commissioned.
This will result in self-dependency and quality
product.
ii. A safener required for the said herbicide is
manufactured indigenously which will result in cost
benefit and reduce dependency on other suppliers.
iii. An herbicide auxiliary chemical for the marketed
herbicide was produced indigenously which will
result in reduction in the cost of the formulated
product and foreign exchange saving.
iv. New products introduced globally, resulting in
business expansion.
v. Accomplishment of process development for several
active ingredients will be helpful in the future
implementation in the plants at commercial scale.
vi. Industrial process development and execution will
result in expansion in revenue.
vii. Process development for key intermediates for
technical will result in cost effectiveness, and quality
product.
viii. Several pre-mix formulations have been developed
for future product launches.
ix. For the existing technical products, improvement in
quality and/or increase in yield have been worked
out.
x. The marketed formulations have been worked upon
for improved quality and cost effectiveness.
xi. Patent protection for the products and processes will
help in reduced competition
xii. There have been increasing number of regulatory
approvals in many countries for many products
which will help in faster product launches.
iii Expenditure incurred on R & D:
Capital H 644.62 Lacs
Recurring H 16136.39 Lacs
Total H 16781.01 Lacs
Total R & D expenditure 2.27% (as a percentage of
turnover)
C. Foreign Exchange Earnings and Outgo:
1. Total Foreign Exchange earned H395,575 Lacs
2. Total Foreign Exchange outgo H244,604 Lacs
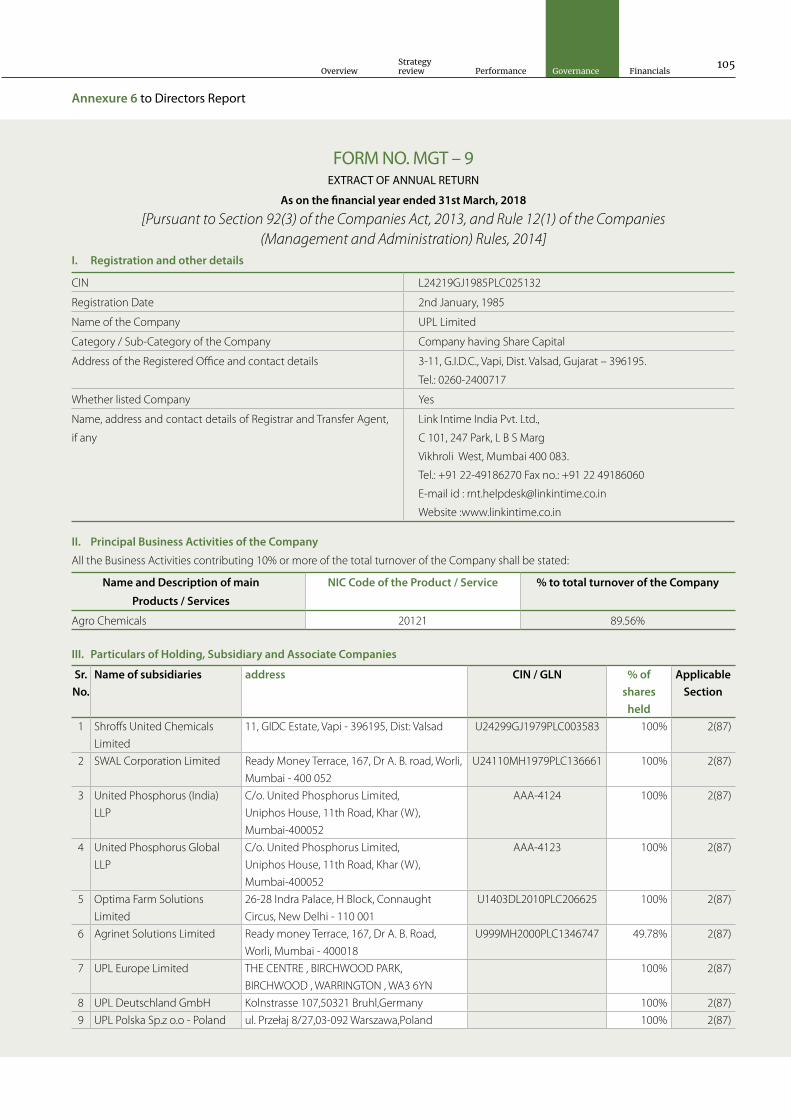
Overview
Strategyreview Performance Governance Financials
105
FORM NO. MGT – 9EXTRACT OF ANNUAL RETURN
As on the financial year ended 31st March, 2018
[Pursuant to Section 92(3) of the Companies Act, 2013, and Rule 12(1) of the Companies (Management and Administration) Rules, 2014]
I. Registration and other details
II. Principal Business Activities of the Company
All the Business Activities contributing 10% or more of the total turnover of the Company shall be stated:
III. Particulars of Holding, Subsidiary and Associate Companies
CIN L24219GJ1985PLC025132
Registration Date 2nd January, 1985
Name of the Company UPL Limited
Category / Sub-Category of the Company Company having Share Capital
Address of the Registered Office and contact details 3-11, G.I.D.C., Vapi, Dist. Valsad, Gujarat – 396195.
Tel.: 0260-2400717
Whether listed Company Yes
Name, address and contact details of Registrar and Transfer Agent,
if any
Link Intime India Pvt. Ltd.,
C 101, 247 Park, L B S Marg
Vikhroli West, Mumbai 400 083.
Tel.: +91 22-49186270 Fax no.: +91 22 49186060
E-mail id : [email protected]
Website :www.linkintime.co.in
Name and Description of main
Products / Services
NIC Code of the Product / Service % to total turnover of the Company
Agro Chemicals 20121 89.56%
Sr.No.
Name of subsidiaries address CIN / GLN % of shares
held
Applicable Section
1 Shroffs United Chemicals
Limited
11, GIDC Estate, Vapi - 396195, Dist: Valsad U24299GJ1979PLC003583 100% 2(87)
2 SWAL Corporation Limited Ready Money Terrace, 167, Dr A. B. road, Worli,
Mumbai - 400 052
U24110MH1979PLC136661 100% 2(87)
3 United Phosphorus (India)
LLP
C/o. United Phosphorus Limited,
Uniphos House, 11th Road, Khar (W),
Mumbai-400052
AAA-4124 100% 2(87)
4 United Phosphorus Global
LLP
C/o. United Phosphorus Limited,
Uniphos House, 11th Road, Khar (W),
Mumbai-400052
AAA-4123 100% 2(87)
5 Optima Farm Solutions
Limited
26-28 Indra Palace, H Block, Connaught
Circus, New Delhi - 110 001
U1403DL2010PLC206625 100% 2(87)
6 Agrinet Solutions Limited Ready money Terrace, 167, Dr A. B. Road,
Worli, Mumbai - 400018
U999MH2000PLC1346747 49.78% 2(87)
7 UPL Europe Limited THE CENTRE , BIRCHWOOD PARK,
BIRCHWOOD , WARRINGTON , WA3 6YN
100% 2(87)
8 UPL Deutschland GmbH Kolnstrasse 107,50321 Bruhl,Germany 100% 2(87)
9 UPL Polska Sp.z o.o - Poland ul. Przełaj 8/27,03-092 Warszawa,Poland 100% 2(87)
Annexure 6 to Directors Report

UPL Limited Annual Report, 2017-18 106
Sr.No.
Name of subsidiaries address CIN / GLN % of shares
held
Applicable Section
10 UPL Benelux B.V. Koopvaardijweg 9,4906 CV
Oosterhout,Postbus 295,4900 AG
Oosterhout,Netherlands
100% 2(87)
11 Cerexagri B.V. Tankhoofd 10,3196 KE Vondelingenplaat,The
Netherlands
100% 2(87)
12 Blue Star B.V. Tankhoofd 10,3196 KE Vondelingenplaat,The
Netherlands
100% 2(87)
13 United Phosphorus Holdings
Cooperatief U.A.
Tankhoofd 10,3196 KE Vondelingenplaat,The
Netherlands
100% 2(87)
14 United Phosphorus Holdings
B.V.
Tankhoofd 10,3196 KE Vondelingenplaat,The
Netherlands
100% 2(87)
15 Decco Worldwide Post-
Harvest Holdings Cooperatief
U.A.
Tankhoofd 10,3196 KE Vondelingenplaat,The
Netherlands
100% 2(87)
16 Decco Worldwide Post-
Harvest Holdings B.V.
Tankhoofd 10,3196 KE Vondelingenplaat,The
Netherlands
100% 2(87)
17 United Phosphorus Holding,
Brazil B.V.
Tankhoofd 10,3196 KE Vondelingenplaat,The
Netherlands
100% 2(87)
18 UPL Italia S.R.L. Via Terni, 275 - 47522 Cesena (FC) - Italy 100% 2(87)
19 UPL Iberia, S.A. Avda. Josep Tarradellas, 20-30,floor 3, door
7-8,
100% 2(87)
20 Decco Iberica Postcosecha,
S.A.U.
Poligono Fuente del Jarro,C/ Villa de Madrid
num. 54,46988 Paterna (Valencia),Spain
100% 2(87)
21 Transterra Invest, S. L. U. Avda. Josep Tarradellas, 20-30,floor 3, door
7-8,
100% 2(87)
22 Cerexagri S.A.S. 10,avenue de l'enterpise Parc,St Cristophe
95863 Cergy Pontoise, France
100% 2(87)
23 Neo-Fog S.A. 3 rue Ampère ,ZA,59236 FRELINGHIEN France 100% 2(87)
24 UPL France 132/190 Boulevard de Verdun,92400
COURBEVOIE,France
100% 2(87)
25 United Phosphorus
Switzerland Limited
C/o Testatoris AG,Topferstrasse 5,6004
Luzern,Switzerland
100% 2(87)
26 Agrodan, ApS GAMMEL POSTVEJ 11,NORDBY,6720
FANO,DENMARK
100% 2(87)
27 Decco Italia SRL Bivio Aspro Zona Industriale Piano Tavola 100% 2(87)
28 Limited Liability Company
"UPL"
16/18, building 1, office 25,Balshaya
Sukharevskaya Square,Moscow ,
107045,Russian Federation
100% 2(87)
29 Decco Portugal Post Harvest,
Unipessoal LDA (formerly
known as UPL Portugal
Unipessoal LDA)
Beloura Office Park, Ed. 7 – 1º Escritorio
1.4,2710 693 Sintra – Lisboa,Portugal
100% 2(87)
30 United Phosphorus Inc. 630 Freedom Business Center, Suite 402,King
of Prussia, PA 19406
100% 2(87)
31 UPI Finance LLC 630 Freedom Business Center, Suite 402,King
of Prussia, PA 19406
100% 2(87)
32 Cerexagri, Inc. (PA) 630 Freedom Business Center, Suite 402,King
of Prussia, PA 19406
100% 2(87)
33 UPL Delaware, Inc. 630 Freedom Business Center, Suite 402,King
of Prussia, PA 19406
100% 2(87)

Overview
Strategyreview Performance Governance Financials
107
Sr.No.
Name of subsidiaries address CIN / GLN % of shares
held
Applicable Section
34 Canegrass LLC 630 Freedom Business Center, Suite 402,King
of Prussia, PA 19406
70% 2(87)
35 Decco US Post-Harvest Inc 1713 South California Avenue,Monrovia, CA
91016
100% 2(87)
36 RiceCo LLC 5100,Poplar Avenue,Suite 2428, Memphis, TN
38137
100% 2(87)
37 Riceco International, Inc. 5100,Poplar Avenue,Suite 2428, Memphis, TN
38137
100% 2(87)
38 UPL Corporation Limited 5TH Floor Newport Building,Louis Pasteur
Street,Port Louis,Mauritius
100% 2(87)
39 UPL Management DMCC Mazaya Business Avenue -Tower AA1, 11th
Floor,First Al Khail St, Dubai, U.A.E. P.O. Box:
33421
100% 2(87)
40 UPL Limited, Gibraltar Suite 10, Watergardens 5,Waterport Road,
Gibraltar
100% 2(87)
41 UPL Agro S.A. de C.V. Gabriel Mancera 1815, int 402 Col Del Valle
Delg. Benito Juarez C.P. 03100 Ciudad de
Mexico
100% 2(87)
42 Decco Jifkins Mexico Sapi Franz Schubert #5126,Colonia Residencial La
Estancia,Zapopan, Jalisco, Mexico
100% 2(87)
43 Uniphos Industria e Comercio
de Produtos Quimicos Ltda.
Rua Fernando de Albuquerque nº31 cj 72 -
São Paulo - SP - CEP 01309-030
100% 2(87)
44 Upl do Brasil Industria e
Comércio de Insumos
Agropecuários S.A.
Av Maeda sem nº Distrito Industrial -
Ituverava - SP - CEP 14.500-000
100% 2(87)
45 UPL Costa Rica S.A San Rafael de Alajuela, Potrerillos Street,
Industrial Zone Flexipark
100% 2(87)
46 UPL Bolivia S.R.L Av. Cristo Redentor Nro 3731 Mzno: 03 Zona
Norte. Santa Cruz de la Sierra, Bolivia.
100% 2(87)
47 UPL Paraguay S.A. Avenida Los Mingueros C/Juana de Lara;
Ciudad de Minga Guazú; Departamento de
Alto Paraná; República del Paraguay.
100% 2(87)
48 Icona Sanluis S A Maipú 1199 – (5700) - Ciudad de San Luis –
Provincia de San Luis, Argentina
100% 2(87)
49 DVA Technology Argentina
S.A.
Cervino Av 4634 B S T M Piso 2 (1425) - Capital
Federal
100% 2(87)
50 UPL Argentina S A Viamonte 1342, 5to Piso E. CABA, Buenos
Aires, Argentina
100% 2(87)
51 Decco Chile SpA Parque del Este 2451, Villa del Este, Rancagua,
Chile
100% 2(87)
52 UPL Colombia SAS CR 1 NO. 4 - 02 IN 1 AL 21 100% 2(87)
53 United Phosphorus Cayman
Limited
C/o Genesis Trust & Corporate Services
Ltd,2nd Floor, Elgin Court, Elgin Avenue,PO
Box 448, Grand Cayman,Cayman Islands
100% 2(87)
54 UP Aviation Limited C/o Genesis Trust & Corporate Services
Ltd,2nd Floor, Elgin Court, Elgin Avenue,PO
Box 448, Grand Cayman,Cayman Islands
100% 2(87)
55 UPL Australia Limited Suite 416, Level 4, 14 Lexington Drive,Bella
Vista NSW 2153.
100% 2(87)

UPL Limited Annual Report, 2017-18 108
Sr.No.
Name of subsidiaries address CIN / GLN % of shares
held
Applicable Section
56 UPL New Zealand Limited C/o Crowe Horwath (NZ) Limited,Level 29,
188 Quay Street , Auckland Central,Auckland
1010,New Zealand
100% 2(87)
57 UPL Shanghai Limited Rm 1712, Longemont YES tower, No
399, Kaixuan Rd,Shanghai 200051
China,P:021-62131830
100% 2(87)
58 UPL Limited (Korea) 301, Seolleung B/D, 555, Seolleung-ro,
Gangnam-gu, Seoul, 135-916, Korea
100% 2(87)
59 PT.UPL Indonesia PALMA ONE BUILDING, 6TH FLOOR, SUITE 609,
JL. HR RASUNA SAID, KAV.X-2 NO.4,JAKARTA
12950, INDONESIA
100% 2(87)
60 PT Catur Agrodaya Mandiri PALMA ONE BUILDING, 6TH FLOOR, SUITE 609,
JL. HR RASUNA SAID, KAV.X-2 NO.4,JAKARTA
12950, INDONESIA
100% 2(87)
61 UPL Limited,Hong Kong 18A, 18/F, Two Chinachem Plaza, 68
Connaught Road Central, Hong Kong
100% 2(87)
62 UPL Philippines Inc Unit 1506, 15th Floor Jollibee Plaza
Condominium,F. Ortigas Jr. Road, Ortigas
Center,1605 Pasig City, Metro Manila
100% 2(87)
63 UPL Vietnam Co. Limited Amata Road, Long Binh IP (Amata), Long
Binh ward, Bien Hoa city, Dong Nai province,
Vietnam
100% 2(87)
64 UPL Limited, Japan 30F, Ark Mori Building, 1-12-32, Akasaka,
Minato-ku, Tokyo 107-6030, Japan
100% 2(87)
65 Anning Decco Fine Chemical
Co. Limited
Changpo, Anning, Kunming City, Yunnn
Province
55% 2(87)
66 UPL Ziraat Ve Kimya Sanayi Ve
Ticaret Limited Sirketi
Adalet Mahallesi Manas Bulvarı Folkart Towers
No:47/B,A KULE K:31 D:3107-3110,
100% 2(87)
67 UPL Agromed Tarim Ilaclari ve
Tohumculuk Sanayi ve Ticaret
A.S.
Cumhuriyet(incirlik) Mh. Incirlik Blv No.316/Z-
01,Yuregir/Adana Turkey,35530 BAYRAKLI/
IZMIR-TURKEY
100% 2(87)
68 Safepack Products Limited 7 Asteria Meir St.,IZ Hadera,Isarel 100% 2(87)
69 Citrashine (Pty) Ltd 75 2nd street, Booysens
Reserve,Johannesburg 2091 – South Africa
100% 2(87)
70 Prolong Limited MEIR ASTORIA 7 HADERA 100% 2(87)
71 Perrey Participações S.A Rua Líbero Badaró nº 293 - 21ºandar, cj 21D,
sala 46 = São Paulo - SP - CEP 01009-000
100% 2(87)
72 Advanta Netherlands Holding
B.V.
Tankhoofd 10,3196 KE Vondelingenplaat,The
Netherlands
100% 2(87)
73 Advanta Semillas SAIC 25 de Mayo 749. Piso 1, Dpto 3. CABA, Buenos
Aires, Argentin
100% 2(87)
74 Advanta Holdings B.V. Tankhoofd 10,3196 KE Vondelingenplaat,The
Netherlands
100% 2(87)
75 Advanta Seeds International 5TH Floor Newport Building,Louis Pasteur
Street,Port Louis,Mauritius
100% 2(87)
76 Pacific Seeds Holdings
(Thailand) Limited
1 Moo 13, Phaholyothin Road, Tumbol
Praphuttabat, Amphur Praphuttabat, Saraburi.
100% 2(87)
77 Pacific Seeds (Thai) Limited 1 Moo 13, Phaholyothin Road, Tumbol
Praphuttabat, Amphur Praphuttabat, Saraburi.
100% 2(87)

Overview
Strategyreview Performance Governance Financials
109
Sr.No.
Name of subsidiaries address CIN / GLN % of shares
held
Applicable Section
78 Advanta Seeds Pty Ltd 268 Anzac Avenue,Toowoomba QLD
4350,Australia
100% 2(87)
79 Advanta US LLC( formerly
known as Advanta US.Inc)
201 E. John Carpenter Fwy. Suite 660,Irving,
Tx 75062
100% 2(87)
80 Advanta Comercio De
Sementes LTDA.
Av Maeda sem nº Distrito Industrial -
Ituverava - SP - CEP 14.500-000
100% 2(87)
81 PT Advanta Seeds Indonesia Gedung Palma One Lt. 6 Suite 609 Jalan
HR. Rasuna Said Kav X-2 No. 4, Kelurahan
Kuningan Timur, Kecamatan Setiabudi,
Jakarta Selatan.
100% 2(87)
82 Advanta Seeds DMCC Mazaya Business Avenue – Tower AA1,First Al
Khail St, Dubai – U.A.E. P.O Box 33421.
100% 2(87)
83 Essentiv LCC 160, Green Tree Dr.,Ste.101,Dover,DE 19904 50% 2(87)
84 Advanta Seeds Ukraine LLC 1/27 MARRI PRYIMACHENKO BOULEVARD
OFFICE 304/2 KYIV 01042 UKRAINE
100% 2(87)
85 UPL Jigansu Limited No.1 Shilian Avenue Salinization New Material
Industrial Park, Huaian City, Jiangsu Province,
P. R. China
70% 2(87)
86 UPL Agro Limited UPL Agro Limited:4100, 5th Floor New port
Building, Louis Pasteur Street, Port Louis,
Mauritius
100% 2(87)
87 Riceco Inetnational
Bangladesh Ltd.
HM plaza, 12th Floor, Uttara, Dhaka-1230
Bangladesh
100% 2(87)
88 Uniphos Malaysia Sdn Bhd Level 21, Suite 2101, The Gardens South
Tower, Mid Valley City, Lingkaran Syed Putra,
59200, Kuala Lumpur
100% 2(87)
Sr.No.
Name of subsidiaries address CIN / GLN % of shares
held
Applicable Section
ASSOCIATES COMPANY1 Weather Risk Management
Private Ltd
97, NEHRU PARK,
JODHPUR,RAJASTHAN-342001
U67200RJ2004PTC019775 27.36% 2(6)
2 Kerala Enviro Infrastructure
Limited
Common TSDF Projects, Inside FACT CD
Campus, Ambalamedu, Kochi - 682303
U24129KL2005PLC017973 27.52% 2(6)
3 Polycoat Technologies 2010
Limited
7 Astoria Meir St, IZ Hadera, Izrael 20% 2(6)
4 3SB Produtos Agricolas S.A. Rua Lajes, 961, Bairro Primavera IV, Primavera
do Leste – MT, CEP 78850-000
49% 2(6)
5 Sinagro Produtos
Agropecuarios S.A.
Rua Rio de Janeiro, 2583, Primavera do Leste
– MT, CEP 78850-000
49% 2(6)
6 Chemisynth (Vapi) Limited Plot No 27, GIDC, Vapi - 396195, Dist. Valsad U24110GJ1986PLC008634 30% 2(6)7 Hodagaya UPL Co. Limited 2-4-1, Yaesu, Chuo-ku, Tokyo 104-0028,
Japan
40% 2(6)
8 Longreach Plant Breeders
Management Pty Limited
268 Anzac Ave, P O Box 337, Toowoomba
QLD 4350
70% 2(6)
9 United Phosphorus
(Bangladesh) Limited
Paragon House, 5 Mohkhali C/A, Dhaka 50% 2(6)
10 Sera Bonita Sementes S. A. Rod MG 400KM 03 S/N- Fazenda Sao
Miguel, Zonal Rural, In the municipality of
Buritis, MG
33% 2(6)

UPL Limited Annual Report, 2017-18 110
IV. SHAREHOLDING PATTERN (Equity Share Capital Breakup as percentage of Total Equity)
I) Category-wise Shareholding
Sr.
No.
Category of Shareholders No. of Shares held at the beginning of the
year
(As on 01-04-2017)
No. of Shares held at the end of the year
(As on 31-03-2018)
%
Change
during
the yearDemat Physical Total % of
Total
Shares
Demat Physical Total % of
Total
Shares
(A) Shareholding of Promoter and
Promoter Group
(1) Indian
(a) Individuals/H.U.F 3394956 0 3394956 0.73 2923490 0 2923490 0.0.57 -0.16
(b) Central/State Government(s) 0 0 0 0.00 0 0 0 0.00 0.00
( c) Bodies Corporate 127932775 0 127932775 27.54 128279292 0 128279292 25.20 -2.34
(d) Financial Institutions/Banks 0 0 0 0.00 0 0 0 0.00 0.00
(e) Any Other (specify) 0 0 0 0.00 0 0 0 0.00 0.00
Sub-Total (A)(1) 131327731 0 131327731 28.27 131202782 0 131202782 25.77 -2.50
(2) Foreign
(a) Non Resident Individuals/ Foreign
Nationals
9310000 0 9310000 2.00 9902992 0 9902992 1.95 -0.05
(b) Bodies Corporate 0 0 0 0.00 0 0 0 0.00 0.00
( c) Institutions 0 0 0 0.00 0 0 0 0.00 0.00
(d) Qualified Foreign Investor 0 0 0 0.00 0 0 0 0.00 0.00
(e) Any Other (specify) 0 0 0 0.00 0 0 0 0.00 0.00
Sub_Total (A)(2) 0 0 0 0.00 0 0 0 0.00 0.00
Total holding of Promoter and
Promoter Group (A)=(A)(1)+(A)(2)
140637731 0 140637731 30.27 141105774 0 141105774 27.72 -2.55
(B) Public Shareholding3
(1) Institutions
(a) Mutual Fund/UTI 50463256 0 50463256 10.86 48138841 0 48138841 9.46 -1.40
(b) Financial Institutions/Banks 3107344 0 3107344 0.67 3937072 0 3937072 0.77 0.10
( c) Central/State Government(s) 987951 0 987951 0.21 987951 0 987951 0.19 -0.02
(d) Venture Capital Funds 0 0 0 0.00 0 0 0 0.00 0.00
Alternate Investment fund 0 0 0 0.00 60000 0 60000 0.01 0.01
(e) Insurance Companies 0 0 0 0.00 0 0 0 0.00 0.00
( f ) Foreign Portfolio Investors 213202105 18500 213220605 45.89 205656337 0 205656337 40.40 -5.49
(g) Foreign Venture Cap. Inv 0 0 0 0.00 0 0 0 0.00 0.00
(h) Qualified Foreign Investor 0 0 0 0.00 0 0 0 0.00 0.00
(i) Any Other (specify) 0 0 0 0.00 0 0 0 0.00 0.00
Foreign Bank 18000 23000 41000 0.01 18000 15000 33000 0.01 0.00
Sub-Total (B)(1) 267778656 41500 267820156 57.64 258798201 15000 258813201 50.84 -6.80
(2) Non Institutions
(a) Bodies Corporate 15995310 0 15995310 3.44 22235207 0 22235207 4.51 1.07
(b) Individuals
i) Holding nominal share capital
upto H 2 lakh
22299140 4414230 26713370 5.75 25554210 3680637 29234847 5.74 -0.01
ii) Holding nominal share capital in
excess of H 2 lakh.
4287933 0 4287933 0.92 4372881 0 4372881 0.86 -0.06

Overview
Strategyreview Performance Governance Financials
111
ii) Shareholding of Promoters
Sr.No.
Shareholders Name Shareholding at the beginning of the year (As on 01-04-2017)
Shareholding at the end of the year(As on 31-03-2018)
No. of Shares
% of total shares of the
Company
% of Shares Pledged /
encumbered to total shares
No. of Shares
% of total shares of the
Company
% of Shares Pledged /
encumbered to total shares
% change in shareholding
during the year
1 NERKA CHEMICALS PVT LTD 101256245 21.8 0 101523324 19.94 0.45 -1.86
2 UNIPHOS ENTERPRISES
LIMITED
25537060 5.5 0 25549798 5.02 0.00 -0.48
3 R SHROFF CONSULTANTS
PVT LTD
92260 0.02 0 92260 0.02 0.00 0.00
4 ARCHANA OVERSEAS PVT
LTD
843500 0.13 0 897226 0.18 0.00 0.05
5 DEMURIC HOLDINGS PVT
LTD
97925 0.02 0 104162 0.02 0.00 0.00
Sr.
No.
Category of Shareholders No. of Shares held at the beginning of the
year
(As on 01-04-2017)
No. of Shares held at the end of the year
(As on 31-03-2018)
%
Change
during
the yearDemat Physical Total % of
Total
Shares
Demat Physical Total % of
Total
Shares
( c) Qualified Foreign Investor 0 0 0 0.00 0 0 0 0.00 0.00
( d) Any Other(specify)
Overseas Corporate Bodies 0 6740 6740 0.00 0 1660 1660 0.00 0.00
Non Resident Individuals 3002892 2114570 5117462 1.11 3411535 1884145 5295680 1.05 -0.06
Foreign Banks 0 0 0 0.00 0 0 0 0.00
Trust 2055095 0 2055095 0.44 3129762 0 3129762 0.61 0.17
Foreign Nationals 280335 0 280335 0.06 182395 0 182395 0.04 -0.02
Hindu Undivided Family 496446 0 496446 0.11 653548 0 653548 0.13 0.02
Foreign Companies 68193 0 68193 0.01 68193 0 68193 0.01 0.00
Clearing Member 1177285 0 1177285 0.25 1160407 0 1160407 0.23 -0.02
IEPF 0 0 0 0.00 726464 0 726464 0.14 0.14
Overseas Depositories (holding
DRs)
0 0 0 0.00 42103942 0 42103942 8.27 8.27
Sub-Total (B)(2) 49662629 6535540 56198169 12.09 103598544 5566442 109164986 21.44 9.35
Total Public shareholding (B)=(B)
(1)+(B)(2)
317441285 6577040 324018325 69.73 362396745 5581442 367978187 72.28 2.55
TOTAL (A)+(B) 458079016 6577040 464656056 100.00 503502519 5581442 509083961 99.95 -0.05
( C) Shares held by Custodians and
against which Depository Receipts
have been issued
1 Promoter and Promoter Group 0 0 0 0.00 0 0 0 0.00 0.00
2 Public 0 0 0 0.00 0 0 0 0.00 0.00
3 Non Promoter –Non Public 42353062 8000 42361062 0.00 249120 0 249120 0.05 0.0
GRAND TOTAL (A)+(B)+( C) 500432078 6585040 507017118 100.00 503751639 5581442 509333081 100.00

UPL Limited Annual Report, 2017-18 112
Sr.No.
Shareholders Name Shareholding at the beginning of the year (As on 01-04-2017)
Shareholding at the end of the year(As on 31-03-2018)
No. of Shares
% of total shares of the
Company
% of Shares Pledged /
encumbered to total shares
No. of Shares
% of total shares of the
Company
% of Shares Pledged /
encumbered to total shares
% change in shareholding
during the year
6 ESTHETIC FINVEST PVT LTD 105785 0.02 0 112522 0.02 0.00 0.00
7 JAIDEV RAJNIKANT SHROFF 5076750 1.09 0 5400109 1.06 0.00 -0.03
8 VIKRAM RAJNIKANT SHROFF 4233250 0.91 0 4502883 0.88 0.00 -0.03
9 RAJJU D SHROFF 10000 0 0 10000 0 0.00 0.00
10 SHILPA P SAGAR 2887841 0.62 0 2419462 0.48 0.00 -0.14
11 JYOTSNA J BHATT 448750 0.10 0 448750 0.09 0.00 -0.01
12 VARUN JAIDEV SHROFF 26500 0.01 0 27296 0.01 0.00 0.00
13 TANIA JAIDEV SHROFF 15385 0 0 15982 0 0.00 0.00
14 PRADIP N SAGAR 4480 0 0 0 0 0.00 0.00
15 MEKHALA VIKRAM SHROFF 2000 0 0 2000 0 0.00 0.00
Total 140637731 30.27 0 141105774 27.72 0.45 -2.55
iii) Change in Promoters’ Shareholding (Please specify, if there is no change)
Sr.
No.
Name of
shareholder
Shareholding Date Increase /
Decrease in
shareholding
Reason Cumulative
Shareholding
during the year
(01.04.2017 to
31.03.2018)
No. of
shares at the
beginning
(01.04.2017)
/ end of
the year
31.03.2018
% of total
shares
of the
Company
Demat % of
Total
Shares
1 NERKA CHEMICALS
PVT LTD
101256245 19.88 01.04.2017
101523324 19.93
05.05.2017 167079 Allotment Due to
conversion of preference
share of the Company.
16.03.2018 100000 Purchase
101523324 19.93 31.03.2018
2 UNIPHOS
ENTERPRISES LIMITED
25537060 5.01 01.04.2017
25549798 5.02
05.05.2017 12738 Allotment Due to
conversion of preference
share of the Company.
25549798 5.02 31.03.2018
3 R SHROFF
CONSULTANTS PVT
LTD
92260 0.02 01.04.2017 0 NIL movement during the
year
92260 0.0292260 0.02 31.03.2018

Overview
Strategyreview Performance Governance Financials
113
Sr.
No.
Name of
shareholder
Shareholding Date Increase /
Decrease in
shareholding
Reason Cumulative
Shareholding
during the year
(01.04.2017 to
31.03.2018)
No. of
shares at the
beginning
(01.04.2017)
/ end of
the year
31.03.2018
% of total
shares
of the
Company
Demat % of
Total
Shares
4 ARCHANA OVESEAS
PVT LTD
843500 0.17 01.04.2017
05.05.2017 53726 Allotment Due to
conversion of preference
share of the Company.
897226 0.18897226 0.18 31.03.2018
5 ESTHETIC FINVEST
PVT LTD
105785 0.02 01.04.2017
112522 0.02
05.05.2017 6737 Allotment Due to
conversion of preference
share of the Company.
112522 0.02 31.03.2018
6 DEMURIC HOLDINGS
PVT LTD
97925 0.02 01.04.2017
104162 0.02
05.05.2017 6237 Allotment Due to
conversion of preference
share of the Company.
104162 0.02 31.03.2018
7 TANIA JAIDEV SHROFF 15385 0.00 01.04.2017
15982 0.00
31.03.2018 597 Allotment Due to
conversion of preference
share of the Company.
15982 0.00 31.03.2018
8 SHILPA P SAGAR 2887841 0.57 01.04.2017
05.05.2017 318 Allotment Due to
conversion of preference
share of the Company. 2888159 0.57
29.12.2017 -1000 sale 2887159 0.57
02.02.2018 -5000 sale 2882159 0.57
09.02.2018 -5000 sale 2877159 0.56
23.02.2018 -68800 sale 2808359 0.55
02.03.2018 -139000 sale 2669359 0.52
09.03.2018 -113897 sale 2555462 0.50
16.03.2018 -133000 sale 2422462 0.48
23.03.2018 -3000 sale 2419462 0.47
2419462 0.47 31.03.2018

UPL Limited Annual Report, 2017-18 114
Sr.
No.
Name of
shareholder
Shareholding Date Increase /
Decrease in
shareholding
Reason Cumulative
Shareholding
during the year
(01.04.2017 to
31.03.2018)
No. of
shares at the
beginning
(01.04.2017)
/ end of
the year
31.03.2018
% of total
shares
of the
Company
Demat % of
Total
Shares
9 PRADIP N SAGAR 4480 0 01.04.2017
07.04.2017 -1500 Sale 2980 0
21.04.2017 -1750 Sale 1230 0
05.05.2017 1752 Allotment Due to
conversion of preference
share of the Company. 2982 0
12.05.2017 -750 Sale 2232 0
19.05.2017 -482 Sale 1750 0
26.05.2017 -500 Sale 1250 0
02.06.2017 -1250 Sale 0 0
0 0 31.03.2018
10 JYOTSNA J BHATT 448750 0.10 01.04.2017 0 NIL movement during the
year
448750 0.09448750 0.09 31.03.2018
11 JAIDEV RAJNIKANT
SHROFF
5076750 0.99 01.04.2017
5400109 1.06
05.05.2017 323359 Allotment Due to
conversion of preference
share of the Company.
5400109 1.06 31.03.2018
12 VARUN JAIDEV
SHROFF
26500 0.01 01.04.2017
27296 0.01
31.03.2018 796 Allotment Due to
conversion of preference
share of the Company.
27296 0.01 31.03.2018
13 RAJJU D SHROFF 10000 0 01.04.2017 0 NIL movement during the
year
10000 010000 0 31.03.2018
14 VIKRAM RAJNIKANT
SHROFF
4233250 0.83 01.04.2017
4502883 0.88
05.05.2017 269633 Allotment Due to
conversion of preference
share of the Company
4502883 0.88 31.03.2018 0
15 MEKHALA VIKRAM
SHROFF
2000 0 01.04.2017 0 NIL movement during the
year 2000 02000 0 31.03.2018 0

Overview
Strategyreview Performance Governance Financials
115
iv) Shareholding Pattern of Top Ten Shareholders (Other than Directors, Promoters and Holders of GDRs and ADRs)
Sr.
No.
Name of
shareholder
Shareholding Date Increase /
Decrease in
shareholding
Reason Cumulative
Shareholding
during the year
(01.04.2017 to
31.03.2018)
No. of
shares at the
beginning
(01.04.2017)
/ end of
the year
31.03.2018
% of total
shares
of the
Company
Demat % of
Total
Shares
1 GOVERNMENT
PENSION
FUND GLOBAL
11448976 2.25 01-Apr-17 11448976 2.25
05-Jan-18 -4561 Transfer 11444415 2.25
12-Jan-18 -159500 Transfer 11284915 2.22
26-Jan-18 785000 Transfer 12069915 2.37
02-Feb-18 318520 Transfer 12388435 2.44
09-Feb-18 870496 Transfer 13258931 2.61
23-Feb-18 266900 Transfer 13525831 2.66
02-Mar-18 622596 Transfer 14148427 2.78
09-Mar-18 63715 Transfer 14212142 2.79
14212142 2.79 31-Mar-18 14212142 2.79
2 GOVERNMENT
OF SINGAPORE
7065831 1.39 01-Apr-17 7065831 1.39
07-Apr-17 -483059 Transfer 6582772 1.30
14-Apr-17 -15307 Transfer 6567465 1.30
21-Apr-17 -3732 Transfer 6563733 1.29
28-Apr-17 -1644 Transfer 6562089 1.29
05-May-17 -99824 Transfer 6462265 1.27
26-May-17 -4377 Transfer 6457888 1.27
02-Jun-17 254487 Transfer 6712375 1.32
09-Jun-17 16835 Transfer 6729210 1.32
16-Jun-17 11417 Transfer 6740627 1.32
23-Jun-17 -3968 Transfer 6736659 1.32
07-Jul-17 43228 Transfer 6779887 1.33
14-Jul-17 78 Transfer 6779965 1.33
18-Aug-17 -4624 Transfer 6775341 1.33
01-Sep-17 -104315 Transfer 6671026 1.31
08-Sep-17 -191126 Transfer 6479900 1.28
15-Sep-17 11876 Transfer 6491776 1.28
06-Oct-17 26039 Transfer 6517815 1.28
03-Nov-17 43096 Transfer 6560911 1.29
17-Nov-17 -2350 Transfer 6558561 1.29
01-Dec-17 -156321 Transfer 6402240 1.26
08-Dec-17 -88327 Transfer 6313913 1.24

UPL Limited Annual Report, 2017-18 116
Sr.
No.
Name of
shareholder
Shareholding Date Increase /
Decrease in
shareholding
Reason Cumulative
Shareholding
during the year
(01.04.2017 to
31.03.2018)
No. of
shares at the
beginning
(01.04.2017)
/ end of
the year
31.03.2018
% of total
shares
of the
Company
Demat % of
Total
Shares
22-Dec-17 8218 Transfer 6322131 1.24
29-Dec-17 203577 Transfer 6525708 1.28
05-Jan-18 349128 Transfer 6874836 1.35
12-Jan-18 -11606 Transfer 6863230 1.35
19-Jan-18 101609 Transfer 6964839 1.37
26-Jan-18 65523 Transfer 7030362 1.38
02-Feb-18 29150 Transfer 7059512 1.39
09-Feb-18 -11771 Transfer 7047741 1.39
23-Feb-18 -21290 Transfer 7026451 1.38
02-Mar-18 -128374 Transfer 6898077 1.36
09-Mar-18 -104052 Transfer 6794025 1.33
6893708 1.35 31-Mar-18 99683 Transfer 6893708 1.35
3 ICICI PRUDENTIAL
LIFE INSURANCE
COMPANY LIMITED
6219838 1.22 01-Apr-17 6219838 1.18
07-Apr-17 43 Transfer 6219881 1.23
14-Apr-17 -3157 Transfer 6216724 1.22
21-Apr-17 -1633 Transfer 6215091 1.22
28-Apr-17 -90931 Transfer 6124160 1.21
05-May-17 1936 Transfer 6126096 1.21
12-May-17 -9215 Transfer 6116881 1.20
19-May-17 -11057 Transfer 6105824 1.20
26-May-17 39 Transfer 6105863 1.20
02-Jun-17 -1893 Transfer 6103970 1.20
09-Jun-17 -2982 Transfer 6100988 1.20
16-Jun-17 -29599 Transfer 6071389 1.20
23-Jun-17 722 Transfer 6072111 1.20
30-Jun-17 4798 Transfer 6076909 1.20
07-Jul-17 105800 Transfer 6182709 1.22
14-Jul-17 1551 Transfer 6184260 1.22
21-Jul-17 -45133 Transfer 6139127 1.21
28-Jul-17 -11466 Transfer 6127661 1.21
04-Aug-17 -37376 Transfer 6090285 1.20
11-Aug-17 -4526 Transfer 6085759 1.20
18-Aug-17 162142 Transfer 6247901 1.23
25-Aug-17 1546 Transfer 6249447 1.23

Overview
Strategyreview Performance Governance Financials
117
Sr.
No.
Name of
shareholder
Shareholding Date Increase /
Decrease in
shareholding
Reason Cumulative
Shareholding
during the year
(01.04.2017 to
31.03.2018)
No. of
shares at the
beginning
(01.04.2017)
/ end of
the year
31.03.2018
% of total
shares
of the
Company
Demat % of
Total
Shares
01-Sep-17 -57029 Transfer 6192418 1.22
08-Sep-17 6838 Transfer 6199256 1.22
15-Sep-17 7184 Transfer 6206440 1.22
22-Sep-17 3697 Transfer 6210137 1.22
29-Sep-17 5291 Transfer 6215428 1.22
06-Oct-17 116184 Transfer 6331612 1.25
13-Oct-17 5885 Transfer 6337497 1.25
20-Oct-17 18160 Transfer 6355657 1.25
27-Oct-17 3482 Transfer 6359139 1.25
03-Nov-17 37208 Transfer 6396347 1.26
10-Nov-17 3097 Transfer 6399444 1.26
17-Nov-17 -24204 Transfer 6375240 1.25
24-Nov-17 2793 Transfer 6378033 1.25
01-Dec-17 -74515 Transfer 6303518 1.24
08-Dec-17 2843 Transfer 6306361 1.24
15-Dec-17 3568 Transfer 6309929 1.24
22-Dec-17 8204 Transfer 6318133 1.24
29-Dec-17 35540 Transfer 6353673 1.25
05-Jan-18 -31545 Transfer 6322128 1.24
12-Jan-18 -30372 Transfer 6291756 1.24
19-Jan-18 -5120 Transfer 6286636 1.24
26-Jan-18 97923 Transfer 6384559 1.26
02-Feb-18 4052 Transfer 6388611 1.26
09-Feb-18 1588 Transfer 6390199 1.26
16-Feb-18 -21797 Transfer 6368402 1.25
23-Feb-18 13751 Transfer 6382153 1.26
02-Mar-18 -3755 Transfer 6378398 1.25
09-Mar-18 3453 Transfer 6381851 1.25
16-Mar-18 559 Transfer 6382410 1.25
23-Mar-18 103387 Transfer 6485797 1.27
6593432 1.29 31-Mar-18 107635 Transfer 6593432 1.29

UPL Limited Annual Report, 2017-18 118
Sr.
No.
Name of
shareholder
Shareholding Date Increase /
Decrease in
shareholding
Reason Cumulative
Shareholding
during the year
(01.04.2017 to
31.03.2018)
No. of
shares at the
beginning
(01.04.2017)
/ end of
the year
31.03.2018
% of total
shares
of the
Company
Demat % of
Total
Shares
4 MAWER
INTERNATIONAL
EQUITY FUND
2409099 0.47 01-Apr-17 2409099 0.47
23-Jun-17 1585 Transfer 2410684 0.47
07-Jul-17 352704 Transfer 2763388 0.54
14-Jul-17 413040 Transfer 3176428 0.63
21-Jul-17 342072 Transfer 3518500 0.69
28-Jul-17 64981 Transfer 3583481 0.71
04-Aug-17 276983 Transfer 3860464 0.76
11-Aug-17 306857 Transfer 4167321 0.82
18-Aug-17 256244 Transfer 4423565 0.87
25-Aug-17 179594 Transfer 4603159 0.91
29-Sep-17 68434 Transfer 4671593 0.92
13-Oct-17 33132 Transfer 4704725 0.93
27-Oct-17 513295 Transfer 5218020 1.03
03-Nov-17 273318 Transfer 5491338 1.08
17-Nov-17 1779 Transfer 5493117 1.08
24-Nov-17 19366 Transfer 5512483 1.09
26-Jan-18 516804 Transfer 6029287 1.19
02-Feb-18 361547 Transfer 6390834 1.25
6390834 1.25 31-Mar-18
5 VANGUARD
EMERGING MARKETS
STOCK INDEX
FUND, A SERIES
OF VANGUARD
INTERNATIONAL
EQUITY INDEX FUNDS
0 0 01-Apr-17 0 0
23-Mar-18 6177883 Transfer 6177883 1.21
31-Mar-18 -31100 Transfer 6146783 1.21
6146783 1.21 31-Mar-18
6 SBI BLUE CHIP FUND
5006262 0.98 01-Apr-17 5006262 0.98
18-Aug-17 34000 Transfer 5040262 0.99
03-Nov-17 500000 Transfer 5540262 1.09
5540262 1.09 31-Mar-18

Overview
Strategyreview Performance Governance Financials
119
Sr.
No.
Name of
shareholder
Shareholding Date Increase /
Decrease in
shareholding
Reason Cumulative
Shareholding
during the year
(01.04.2017 to
31.03.2018)
No. of
shares at the
beginning
(01.04.2017)
/ end of
the year
31.03.2018
% of total
shares
of the
Company
Demat % of
Total
Shares
7 VANGUARD TOTAL
INTERNATIONAL
STOCK INDEX FUND
4381911 0.86 01-Apr-17 4381911 0.86
21-Apr-17 42319 Transfer 4424230 0.87
26-May-17 38745 Transfer 4462975 0.88
14-Jul-17 53453 Transfer 4516428 0.89
08-Sep-17 38737 Transfer 4555165 0.90
10-Nov-17 97430 Transfer 4652595 0.92
26-Jan-18 50042 Transfer 4702637 0.93
02-Feb-18 21922 Transfer 4724559 0.93
02-Mar-18 108728 Transfer 4833287 0.95
4833287 0.95 31-Mar-18
8 BLACKROCK
GLOBAL FUNDS -
ASIAN GROWTH
LEADERS FUND
2955296 0.58 01-Apr-17
09-Jun-17 147216 Transfer 3102512 0.61
23-Jun-17 536985 Transfer 3639497 0.72
14-Jul-17 393140 Transfer 4032637 0.79
21-Jul-17 32499 Transfer 4065136 0.80
11-Aug-17 39986 Transfer 4105122 0.81
25-Aug-17 407164 Transfer 4512286 0.89
01-Sep-17 78427 Transfer 4590713 0.90
13-Oct-17 50140 Transfer 4640853 0.91
27-Oct-17 85973 Transfer 4726826 0.93
01-Dec-17 78046 Transfer 4804872 0.94
4804872 0.94 31-Mar-18
9 BLACKROCK GLOBAL
FUNDS ASIAN
DRAGON FUND
3722320 0.73 01-Apr-17 3722320 0.73
02-Jun-17 50141 Transfer 3772461 0.74
23-Jun-17 96390 Transfer 3868851 0.76
14-Jul-17 40173 Transfer 3909024 0.77
21-Jul-17 71346 Transfer 3980370 0.78
11-Aug-17 89103 Transfer 4069473 0.80
20-Oct-17 77871 Transfer 4147344 0.82
05-Jan-18 48070 Transfer 4195414 0.83
12-Jan-18 40144 Transfer 4235558 0.83
26-Jan-18 70262 Transfer 4305820 0.85
02-Feb-18 30118 Transfer 4335938 0.85

UPL Limited Annual Report, 2017-18 120
Sr.
No.
Name of
shareholder
Shareholding Date Increase /
Decrease in
shareholding
Reason Cumulative
Shareholding
during the year
(01.04.2017 to
31.03.2018)
No. of
shares at the
beginning
(01.04.2017)
/ end of
the year
31.03.2018
% of total
shares
of the
Company
Demat % of
Total
Shares
02-Mar-18 101170 Transfer 4437108 0.87
23-Mar-18 93175 Transfer 4530283 0.89
4530283 0.89 31-Mar-18
10 COPTHALL
MAURITIUS
INVESTMENT LIMITED
5334092 1.05 01-Apr-17 5334092 1.05
07-Apr-17 84000 Transfer 5418092 1.07
14-Apr-17 27139 Transfer 5445231 1.07
28-Apr-17 -102766 Transfer 5342465 1.05
05-May-17 -130600 Transfer 5211865 1.03
12-May-17 -114019 Transfer 5097846 1
19-May-17 1329 Transfer 5099175 1
26-May-17 -23800 Transfer 5075375 1
09-Jun-17 -19200 Transfer 5056175 1
23-Jun-17 13080 Transfer 5069255 1
30-Jun-17 8366 Transfer 5077621 1
14-Jul-17 -31049 Transfer 5046572 0.99
21-Jul-17 -211290 Transfer 4835282 0.95
28-Jul-17 114076 Transfer 4949358 0.97
04-Aug-17 102856 Transfer 5052214 0.99
11-Aug-17 54130 Transfer 5106344 1.01
18-Aug-17 -75735 Transfer 5030609 0.99
25-Aug-17 23661 Transfer 5054270 0.99
01-Sep-17 -81039 Transfer 4973231 0.98
08-Sep-17 84362 Transfer 5057593 1
15-Sep-17 -38177 Transfer 5019416 0.99
22-Sep-17 55686 Transfer 5075102 1
29-Sep-17 -268143 Transfer 4806959 0.95
06-Oct-17 445394 Transfer 5252353 1.03
13-Oct-17 -182593 Transfer 5069760 1
20-Oct-17 35803 Transfer 5105563 1
27-Oct-17 -442938 Transfer 4662625 0.92
03-Nov-17 -31597 Transfer 4631028 0.91
10-Nov-17 57074 Transfer 4688102 0.92
17-Nov-17 11569 Transfer 4699671 0.92
24-Nov-17 17742 Transfer 4717413 0.93
01-Dec-17 -144040 Transfer 4573373 0.9

Overview
Strategyreview Performance Governance Financials
121
Sr.
No.
Name of
shareholder
Shareholding Date Increase /
Decrease in
shareholding
Reason Cumulative
Shareholding
during the year
(01.04.2017 to
31.03.2018)
No. of
shares at the
beginning
(01.04.2017)
/ end of
the year
31.03.2018
% of total
shares
of the
Company
Demat % of
Total
Shares
08-Dec-17 24595 Transfer 4597968 0.90
15-Dec-17 -8092 Transfer 4589876 0.90
22-Dec-17 6212 Transfer 4596088 0.90
29-Dec-17 -36750 Transfer 4559338 0.90
05-Jan-18 -412222 Transfer 4147116 0.82
12-Jan-18 -1808 Transfer 4145308 0.82
19-Jan-18 8430 Transfer 4153738 0.82
26-Jan-18 87567 Transfer 4241305 0.83
02-Feb-18 25494 Transfer 4266799 0.84
23-Feb-18 -212400 Transfer 4054399 0.80
09-Mar-18 -43097 Transfer 4011302 0.79
16-Mar-18 -400 Transfer 4010902 0.79
23-Mar-18 -128640 Transfer 3882262 0.76
3882262 0.76 31-Mar-18
11 VANGUARD
EMERGING MARKETS
STOCK INDEX
FUND, ASERIES
OF VANGUARD
INTERNATIONAL
EQUITY INDE X FUND
5699108 1.12 01-Apr-17 5699108 1.12
07-Apr-17 72267 Transfer 5771375 1.14
28-Apr-17 6630 Transfer 5778005 1.14
05-May-17 53040 Transfer 5831045 1.15
12-May-17 16575 Transfer 5847620 1.15
19-May-17 35802 Transfer 5883422 1.16
02-Jun-17 14586 Transfer 5898008 1.16
14-Jul-17 39780 Transfer 5937788 1.17
04-Aug-17 14586 Transfer 5952374 1.17
11-Aug-17 19227 Transfer 5971601 1.18
01-Sep-17 23868 Transfer 5995469 1.18
08-Sep-17 33813 Transfer 6029282 1.19
15-Sep-17 30498 Transfer 6059780 1.19
06-Oct-17 19890 Transfer 6079670 1.20
13-Oct-17 20553 Transfer 6100223 1.20
20-Oct-17 15249 Transfer 6115472 1.20
27-Oct-17 13923 Transfer 6129395 1.21
22-Dec-17 -8294 Transfer 6121101 1.20
26-Jan-18 29986 Transfer 6151087 1.21
02-Feb-18 26796 Transfer 6177883 1.22

UPL Limited Annual Report, 2017-18 122
Sr.
No.
Name of
shareholder
Shareholding Date Increase /
Decrease in
shareholding
Reason Cumulative
Shareholding
during the year
(01.04.2017 to
31.03.2018)
No. of
shares at the
beginning
(01.04.2017)
/ end of
the year
31.03.2018
% of total
shares
of the
Company
Demat % of
Total
Shares
23-Mar-18 -6177883 Transfer 0 0
0 0 31-Mar-18
12 RELIANCE
CAPITAL TRUSTEE
COMPANY LIMITED
A/C RELIANCE
GROWTH FUND
5001633 0.98 01-Apr-17 5001633 0.98
21-Apr-17 -50000 Transfer 4951633 0.97
28-Apr-17 -50000 Transfer 4901633 0.96
23-Jun-17 -25000 Transfer 4876633 0.96
07-Jul-17 -150000 Transfer 4726633 0.93
28-Jul-17 -25000 Transfer 4701633 0.93
01-Sep-17 -100000 Transfer 4601633 0.91
08-Sep-17 100000 Transfer 4701633 0.93
15-Sep-17 -408000 Transfer 4293633 0.85
22-Sep-17 -200000 Transfer 4093633 0.81
29-Sep-17 -620000 Transfer 3473633 0.68
06-Oct-17 -200000 Transfer 3273633 0.64
13-Oct-17 -370000 Transfer 2903633 0.57
20-Oct-17 -420000 Transfer 2483633 0.49
27-Oct-17 -160000 Transfer 2323633 0.46
26-Jan-18 -460000 Transfer 1863633 0.37
02-Feb-18 -652000 Transfer 1211633 0.24
09-Feb-18 -515000 Transfer 696633 0.14
16-Feb-18 -250000 Transfer 446633 0.09
23-Feb-18 -257000 Transfer 189633 0.04
02-Mar-18 -189633 Transfer 0 0
0 0 31-Mar-18
13 JOHN HANCOCK
FUNDS III
INTERNATIONAL
GROWTH FUND
4860175 0.95 01-Apr-17 4860175 0.95
21-Apr-17 204413 Transfer 5064588 1
19-May-17 206324 Transfer 5270912 1.04
02-Jun-17 176997 Transfer 5447909 1.07
23-Jun-17 152826 Transfer 5600735 1.10
14-Jul-17 225487 Transfer 5826222 1.15
25-Aug-17 -598554 Transfer 5227668 1.03
01-Sep-17 -876488 Transfer 4351180 0.86
08-Sep-17 -673284 Transfer 3677896 0.72

Overview
Strategyreview Performance Governance Financials
123
Sr.
No.
Name of
shareholder
Shareholding Date Increase /
Decrease in
shareholding
Reason Cumulative
Shareholding
during the year
(01.04.2017 to
31.03.2018)
No. of
shares at the
beginning
(01.04.2017)
/ end of
the year
31.03.2018
% of total
shares
of the
Company
Demat % of
Total
Shares
15-Sep-17 -1575185 Transfer 2102711 0.41
22-Sep-17 -834221 Transfer 1268490 0.25
29-Sep-17 -1268490 Transfer 0 0
0 0 31-Mar-18
14 HDFC TRUSTEE
COMPANY LTD
- A/C HDFC MID -
CAPOPPORTUNITIES
FUND
4680000 0.92 01-Apr-17 4680000 0.92
21-Apr-17 100000 Transfer 4780000 0.94
05-May-17 100000 Transfer 4880000 0.96
15-Sep-17 100000 Transfer 4980000 0.98
23-Feb-18 -3300000 Transfer 1680000 0.33
09-Mar-18 -1680000 Transfer 0 0
0 0 31-Mar-18
V. Shareholding of Directors and Key Managerial Personnel
Sr.
No.
Name of
shareholder
Shareholding Date Increase /
Decrease in
shareholding/
preference
Reason Cumulative
Shareholding
during the year
(01.04.2017 to
31.03.2018)
No. of
shares at the
beginning
(01.04.2017)
/ end of
the year
31.03.2018
% of total
shares
of the
Company
Demat % of
Total
Shares
A DIRECTORS:
1 RAJNIKANT DEVIDAS
SHROFF
PROMOTER
AND EXECUTIVE
CHAIRMAN AND
MANAGING
DIRECTOR
10000 0 01.04.2017 0 NIL movement during the
year
10000 0
10000 0 31.03.2018

UPL Limited Annual Report, 2017-18 124
Sr.
No.
Name of
shareholder
Shareholding Date Increase /
Decrease in
shareholding/
preference
Reason Cumulative
Shareholding
during the year
(01.04.2017 to
31.03.2018)
No. of
shares at the
beginning
(01.04.2017)
/ end of
the year
31.03.2018
% of total
shares
of the
Company
Demat % of
Total
Shares
2 SANDRA RAJNIKANT
SHROFF
PROMOTER AND
NON-EXECUTIVE VICE
CHAIRMAN
0 0 01.04.2017 0 NIL Holding and NIL
movement during the
year
0 0
0 0 31.03.2018
3 JAIDEV RAJNIKANT
SHROFF
PROMOTER AND
NON-EXECUTIVE
DIRECTOR
5076750 0.99 01.04.2017
5400109 1.06
05.05.2017 323359 Allotment Due to
conversion of preference
share of the Company.
5400109 1.06 31.03.2018
4 VIKRAM RAJNIKANT
SHROFF
PROMOTER AND
NON-EXECUTIVE
DIRECTOR
4233250 0.83 01.04.2017
4502883 0.88
05.05.2017 269633 Allotment Due to
conversion of preference
share of the Company.
4502883 0.88 31.03.2018
5 KALYAN
ANANDIMOHAN
BANERJEE
NON-PROMOTER
AND EXECUTIVE
DIRECTOR
301320 0.06 01.04.2017 301320 0.06
11.08.2017 15000 SALE 286320 0.06
286320 0.06 31.03.2018
286320 0.06
6 ARUN C. ASHAR
NON-PROMOTER
AND EXECUTIVE
DIRECTOR
262835 0.05 01.04.2017
263152 0.05
05.05.2017 317 Allotment Due to
conversion of preference
share of the Company.
263152 0.05 31.03.2018
7 VASANT P. GANDHI
INDEPENDENT AND
NON-EXECUTIVE
DIRECTOR
0 0 01.04.2017 0 NIL Holding and NIL
movement during the
year
0 00 0 31.03.2018

Overview
Strategyreview Performance Governance Financials
125
Sr.
No.
Name of
shareholder
Shareholding Date Increase /
Decrease in
shareholding/
preference
Reason Cumulative
Shareholding
during the year
(01.04.2017 to
31.03.2018)
No. of
shares at the
beginning
(01.04.2017)
/ end of
the year
31.03.2018
% of total
shares
of the
Company
Demat % of
Total
Shares
8 DR. REENA
RAMACHANDRAN
INDEPENDENT AND
NON-EXECUTIVE
DIRECTOR
0 0 01.04.2017 0 NIL Holding and NIL
movement during the
year
0 0
0 0 31.03.2018
9 PRADIP PRANJIVAN
MADHAVJI
INDEPENDENT AND
NON-EXECUTIVE
DIRECTOR
0 0 01.04.2017 0 NIL Holding and NIL
movement during the
year
0 0
0 0 31.03.2018
10 PRADEEP
VEDPRAKASH GOYAL
INDEPENDENT AND
NON-EXECUTIVE
DIRECTOR
0 0 01.04.2017 0 NIL Holding and NIL
movement during the
year
0 0
0 0 31.03.2018
11 VINOD
RAJINDRANATH SETHI
INDEPENDENT AND
NON-EXECUTIVE
DIRECTOR
0 0 01.04.2017 0 NIL Holding and NIL
movement during the
year
0 0
0 0 31.03.2018
12 HARDEEP SINGH
INDEPENDENT AND
NON-EXECUTIVE
DIRECTOR
32000 0.01 01.04.2017 32000 0.01
02.02.2018 2038 Allotment Due to
conversion of preference
share of the Company.
34038 0.01
34038 0.01 31.03.2018
B KEY MANAGER
PERSONNEL:
1 ANAND K VORA
- CHIEF FINANCIAL
OFFICER
11800 0.00 01.04.2017 NIL movement during the
year
11800 0.00
11800 0.00 31.03.2018
2 MUKUL BHUPENDRA
TRIVEDI - COMPANY
SECRETARY &
COMPLIANCE
OFFICER
280560 0.06 01.04.2017 0 NIL movement during the
year
280560 0.06
280560 0.06 31.03.2018

UPL Limited Annual Report, 2017-18 126
V. INDEBTEDNESS
Indebtedness of the Company including interest outstanding/accrued but not due for payment
VI. REMUNERATION OF DIRECTORS AND KEY MANAGERIAL PERSONNEL
A. Remuneration to Managing Director, Whole-time Directors and/or Manager:
H In lacs
Secured Loans excluding deposits
Unsecured Loans
Deposits Total Indebtedness
Indebtedness at the beginning of the financial year
i) Principal Amount 257 79674 NIL 79931
ii) Interest due but not paid NIL
iii) Interest accrued but not due 5259 NIL 5259
Total (i + ii + iii) 257 84933 NIL 85190
Change in Indebtedness during the financial year
Addition 6261 21057 NIL 27318
Reduction NIL
Net Change 6261 21057 NIL 27318
Indebtedness at the end of the financial year
i) Principal Amount 6518 100731 NIL 107249
ii) Interest due but not paid NIL
iii) Interest accrued but not due 5215 NIL 5215
Total (i+ ii + iii) 6518 105946 NIL 112464
H In lacs
Sr.No.
Particulars of Remuneration Name of MD / WTD / Manager Total Amount
Mr. R. D. ShroffCMD
Mr. A. C. AsharDir.-Finance
Mr. K. BanerjeeWT-Director
1 Gross Salary
(a) Salary as per provisions contained
in Section 17(1) of the Income Tax
Act, 1961
480 120 24 624
(b) Value of perquisites under Section
17(2) Income Tax Act, 1961
153 68 19 240
(c) Profits in lieu of salary under
Section 17(3) Income Tax Act, 1961
2 Stock Options
3 Sweat Equity
4 Commission 225 32 15 272
- as % of profit 0.39 0.06 0.03 0.48
- others, specify
5 Others, please specify 153 38 8 199
Total (A) 1011 258 66 1335
Ceiling as per the Act 5760

Overview
Strategyreview Performance Governance Financials
127
B. Remuneration to other Directors
1. Independent Directors
C. REMUNERATION TO KEY MANAGERIAL PERSONNEL OTHER THAN MD/MANAGER/WTDS
Sr.
No.
Particulars of Remuneration Key Managerial Personnel
Mr. Mukul B.
Trivedi – Company
Secretary
Mr. Anand Vora -
CFO
Total Amount
1 Gross Salary
(a) Salary as per provisions contained in Section 17(1) of the
Income Tax Act, 1961
7709624 28110820 35820444
(b) Value of perquisites under Section 17(2) Income Tax Act,
1961
39600 197061 236661
(c) Profit in lieu of salary under Section 17(3) Income Tax Act,
1961
2 Stock Options
3 Sweat Equity
4 Commission
- as % of profit
- others, specify
5 Others, please specify – Retirals 427920 870000 1297920
Total (C) 8177144 29177881 37355025
2. Other Non Executive Directors H In lacs
Particulars of Remuneration Name of Director Total Amount
Mrs. Sandra
Rajnikant Shroff
(DIN-00189012)
Mr. Jaidev Rajnikant
Shroff
(DIN-00191050)
Mr. Vikram
Rajnikant Shroff
(DIN-00191472)
- Fee for attending Board/ Committee Meetings NIL NIL NIL NIL
- Commission NIL NIL NIL NIL
- Others, please specify NIL NIL NIL NIL
Total (B) (2) NIL NIL NIL NIL
Total (B) = (B)(1) + (B)(2) NIL NIL NIL 67.95
Total Managerial Remuneration 1402.95
Overall Ceiling as per the Act 6336
H In lacs
Particulars of Remuneration Name of Director Total
AmountMr. Pradeep
Vedprakash
Goyal
(DIN-
00008370)
Dr. (Mrs.) Reena
Ramachandran
(DIN-
00212371)
Mr. Pradip
Pranjivan
Madhavji
(DIN-
00549826)
Mr. Vinod
Rajindranath
Sethi
(DIN-
00106598)
Mr. Hardeep
Singh
(DIN-
00088096)
Mr. Vasant
Prakash
Gandhi
(DIN-
00863653)
- Fee for attending Board/
Committee Meetings
4.60 2.50 5.00 1.60 2.50 3.75 19.95
- Commission 8.00 8.00 8.00 8.00 8.00 8.00 48.00
- Others, please specify
Total (B) (1) 67.95
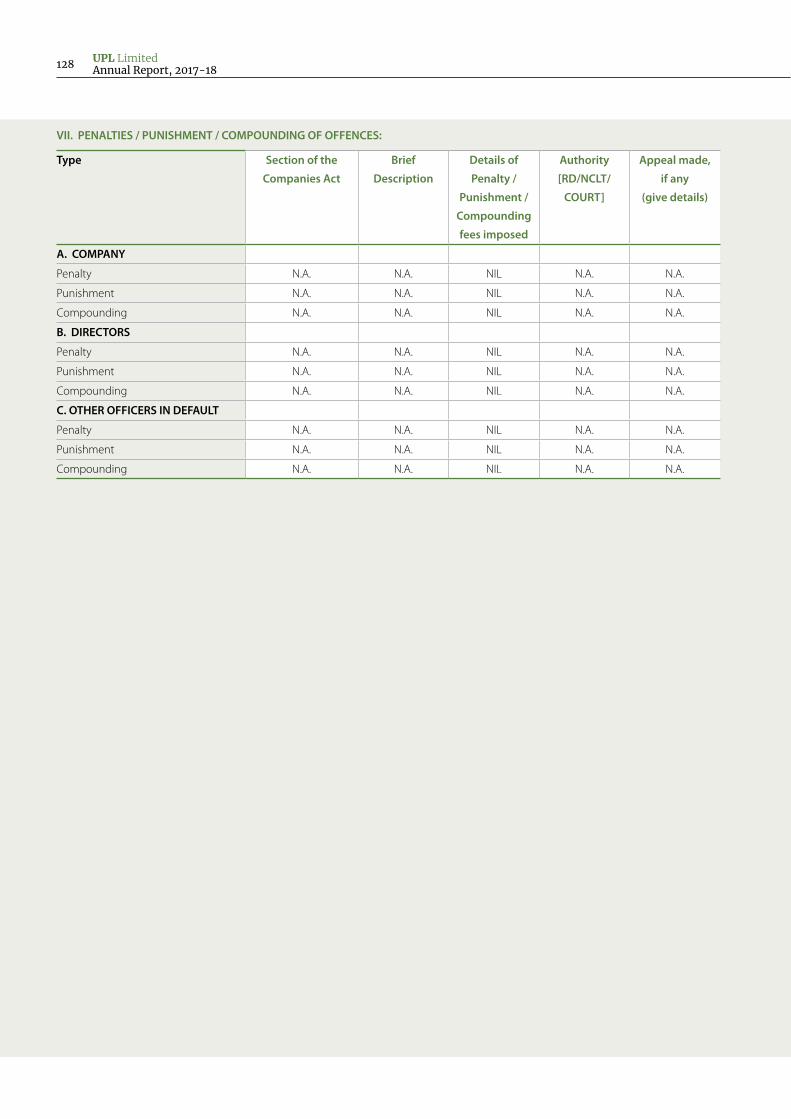
UPL Limited Annual Report, 2017-18 128
VII. PENALTIES / PUNISHMENT / COMPOUNDING OF OFFENCES:
Type Section of the
Companies Act
Brief
Description
Details of
Penalty /
Punishment /
Compounding
fees imposed
Authority
[RD/NCLT/
COURT]
Appeal made,
if any
(give details)
A. COMPANY
Penalty N.A. N.A. NIL N.A. N.A.
Punishment N.A. N.A. NIL N.A. N.A.
Compounding N.A. N.A. NIL N.A. N.A.
B. DIRECTORS
Penalty N.A. N.A. NIL N.A. N.A.
Punishment N.A. N.A. NIL N.A. N.A.
Compounding N.A. N.A. NIL N.A. N.A.
C. OTHER OFFICERS IN DEFAULT
Penalty N.A. N.A. NIL N.A. N.A.
Punishment N.A. N.A. NIL N.A. N.A.
Compounding N.A. N.A. NIL N.A. N.A.

Overview
Strategyreview Performance Governance Financials
129
Corporate Governance1. Company’s Philosophy on Code of Corporate Governance The Company’s philosophy on Corporate Governance relates
to providing maximum service to all its stakeholders. It intends
to enhance shareholder value by undertaking the best possible
Corporate Governance practices. A high standard of Corporate
Governance is maintained by being transparent, accountable
and being in continuous interaction with shareholders,
employees, lending institutions, banks, governmental agencies
and all the dealers.
The Company’s products are marketed not only in India but also
across the globe. The Company is, therefore, conscious of the
fact that the management and the employees need to work
ethically to achieve success.
2. Board of Directors The Board of Directors consists of 12 Directors as on 31st March,
2018.
Five Board Meetings were held during the year, in accordance
with the minimum requirement of four meetings. The dates on
which the meetings were held are as follows: 28th April, 2017,
24th May, 2017, 31st July, 2017, 30th October, 2017 and 25th
January, 2018.
Name of the Director
Category Attendance Particulars
No. of other directorships and Committee member/ chairmanship*
No. of Shares and Convertible
Instruments held By non-executive
directors
Board Meeting
Last AGM
Other Directorships
Committee Memberships
Committee Chairmanships
Mr. Rajnikant Devidas Shroff @
Promoter and Executive Chairman and Managing Director
4 Present 8 1 - N. A
Mrs. Sandra Rajnikant Shroff @
Promoter and Non-Executive Vice Chairman
5 Absent 7 - - Nil
Mr. Jaidev Rajnikant Shroff @
Promoter and Non-Executive Director
4 Present 4 - - 54,00,109 Equity Shares
Mr. Vikram Rajnikant Shroff @
Promoter and Non-Executive Director
4 Absent 4 - - 45,02,883 Equity Shares.
Mr. Arun Chandrasen Ashar
Non-Promoter and Executive Director
5 Present 7 4 1 N.A
Mr. Kalyan Mohan Benerjee
Non-Promoter and Executive Director
4 Present 1 - - N.A
Mr.Pradeep Vedprakash Goyal
Independent and Non-Executive Director
4 Absent 3 2 2 Nil
Dr. Reena Ramachandran
Independent and Non-Executive Director
5 Present 1 1 - Nil
Mr. Pradip Pranjivan Madhavji
Independent and Non-Executive Director
5 Present 2 2 1 Nil
Mr. Vinod Rajindranath Sethi
Independent and Non-Executive Director
4 Present 2 1 - Nil
Mr. Hardeep Singh Independent and Non-Executive Director
5 Present 2 2 1 34,038 Equity Shares.
Mr. Vasant Prakash Gandhi
Independent and Non-Executive Director
5 Present 1 1 1 Nil
Composition and category of Directors, Other Directorships and Committee Memberships as on March 31, 2018:
Notes:
* Excludes Directorship in private limited companies, foreign companies and companies under Section 8 of the Companies Act, 2013.
@ Mr. Rajnikant Devidas Shroff and Mrs. Sandra Rajnikant Shroff are spouse of each other and father and mother respectively of Mr. Jaidev Rajnikant Shroff and
Mr. Vikram Rajnikant Shroff. Mr. Jaidev Rajnikant Shroff and Mr. Vikram Rajnikant Shroff are sons of Mr. Rajnikant Devidas Shroff and Mrs. Sandra Rajnikant
Shroff and brothers of each other.
The details of familiarization programmes imparted to Independent Directors have been disclosed on the Company’s website www.uplonline.com
UPL Limited Annual Report, 2017-18 130
3. Audit Committee Terms of reference: The terms of reference of Audit Committee are as per SEBI
(Listing Obligations and Disclosure Requirements) Regulations,
2015 and Companies Act, 2013. The broad terms of reference of
Audit Committee as adopted by the Board are as under:
1. Oversight of the Company’s financial reporting process and
the disclosure of its financial information to ensure that the
financial statement is correct, sufficient and credible;
2. Recommendation for appointment, remuneration and
terms of appointment of auditors of the Company;
3. Approval of payment to statutory auditors for any other
services rendered by the statutory auditors;
4. Reviewing, with the management, the annual financial
statements and auditor's report thereon before submission
to the board for approval, with particular reference to:
a. Matters required to be included in the Director’s
Responsibility Statement to be included in the Board’s
report in terms of clause (c) of sub-section 3 of section
134 of the Companies Act, 2013;
b. Changes, if any, in accounting policies and practices and
reasons for the same;
c. Major accounting entries involving estimates based on
the exercise of judgment by the management;
d. Significant adjustments made in the financial statements
arising out of audit findings;
e. Compliance with listing and other legal requirements
relating to financial statements;
f. Disclosure of any related party transactions;
g. Modified opinion(s) in the draft audit report;
5. Reviewing, with the management, the quarterly financial
statements before submission to the board for approval;
6. Reviewing, with the management, the statement of uses/
application of funds raised through an issue (public issue,
rights issue, preferential issue, etc.), the statement of funds
utilised for purposes other than those stated in the offer
document/prospectus/notice and the report submitted
by the monitoring agency monitoring the utilisation of
proceeds of a public or rights issue, and making appropriate
recommendations to the Board to take up steps in this
matter;
7. Reviewing and monitoring the auditor’s independence and
performance, and effectiveness of the audit process;
8. Approval or any subsequent modification of transactions of
the Company with related parties;
9. Scrutiny of inter-corporate loans and investments;
10. Valuation of undertakings or assets of the Company,
wherever it is necessary;
11. Evaluation of internal financial controls and risk management
systems;
12. Reviewing, with the management, performance of statutory
and internal auditors and adequacy of the internal control
systems;
13. Reviewing the adequacy of internal audit function, if any,
including the structure of the internal audit department,
staffing and seniority of the official heading the department,
reporting structure coverage and frequency of internal
audit;
14. Discussion with internal auditors of any significant findings
and follow up there on;
15. Reviewing the findings of internal investigations by the
internal auditors into matters where there is suspected
fraud or irregularity or a failure of internal control systems of
a material nature and reporting the matter to the Board;
16. Discussion with statutory auditors, before the audit
commences, about the nature and scope of audit as well as
post-audit discussion to ascertain any area of concern;
17. To look into the reasons for substantial defaults in the
payment to the depositors, debenture holders, shareholders
(in case of non-payment of declared dividends) and
creditors;
18. To review the functioning of the Whistle Blower mechanism;
19. Approval of appointment of Chief Financial Officer after
assessing the qualifications, experience and background,
etc. of the candidate;
20. Carrying out any other function as is mentioned in the
terms of reference of the Audit Committee.
The Audit Committee shall also mandatorily review the following
information:
1. Management discussion and analysis of financial condition
and results of operations;
2. Statement of significant related party transactions
(as defined by the Audit Committee), submitted by
management;
3. Management letters/letters of internal control weaknesses
issued by the statutory auditors;
4. Internal audit reports relating to internal control weaknesses;
and
5. The appointment, removal and terms of remuneration of
the Chief internal auditor shall be subject to review by the
Audit Committee.
6. Statement of deviations:
(a) Quarterly statement of deviation(s) including report of
monitoring agency, if applicable, submitted to Stock
Exchange(s) in terms of Regulation 32(1) of SEBI (Listing
Obligations and Disclosure Requirements) Regulations,
2015.
(b) Annual Statement of funds utilized for purposes other than
those stated in the offer document/prospectus/notice in

Overview
Strategyreview Performance Governance Financials
131
terms of Regulation 32(7) of SEBI (Listing Obligations and
Disclosure Requirements) Regulations, 2015.
The Board of the Company has constituted an Audit Committee,
comprising three Independent and Non-Executive Directors.
Four meetings of the Audit Committee were held on 28th April,
2017, 31st July, 2017, 30th October, 2017 and 25th January, 2018.
Performance evaluation criteria for independent directors: Qualifications, meeting the independence criteria, observing
ethical standards, integrity, exercise of responsibilities,
safeguarding interest of all stakeholders, skills and knowledge
updation, adhering to Company’s Code of conduct, regular
attendance and active participation at the meetings of the
Company, maintaining confidentiality, transparency, assistance
in implementing best corporate governance practices and
absence of conflict of interest with business of the Company.
5. Remuneration of Directors: The Board has, on the recommendation of the Nomination and
Remuneration Committee, framed and adopted the policy for
selection and appointment of Directors, senior management
and their remuneration. The policy lays down criteria for
selection of Directors and senior management such as expertise,
experience and integrity of the Directors, independent nature of
the Directors, personal and professional standing, diversity of the
Board, etc. The remuneration policy lays down the entitlements
of remuneration to Non-Executive Directors such as sitting fees,
commission and other reimbursement. Remuneration to the
Managing Director and other Executive Directors will consist
of monthly salary, allowances, perquisites, bonus, commission
and other retiral benefits. In respect of senior management,
the remuneration will be based on the performance, working
of the Company, targets achieved, KPI, industry benchmark and
current compensation trends in the industry.
The constitution of Audit Committee also meets the
requirements under Section 177 of the Companies Act, 2013.
All the members of Audit Committee are financially literate and
Mr. Pradip Pranjivan Madhavji who has accounting and financial
management expertise has been nominated as the Chairman of
the Audit Committee.
The role and terms of reference stipulated by the Board to the
Audit Committee covers areas specified in Part C of Schedule
II of SEBI (Listing Obligations and Disclosure Requirements)
Regulations, 2015 and Section 177 of the Companies Act, 2013
besides other terms as may be referred by the Board of Directors.
Mr. M. B. Trivedi, Company Secretary acts as the Secretary to the
Audit Committee.
4. Nomination and Remuneration Committee Terms of reference: The broad terms of reference of Nomination and Remuneration
Committee of the Company are as under:
1. Formulation of the criteria for determining qualifications,
positive attributes and independence of a Director
and recommend to the Board a policy, relating to the
remuneration of the Directors, key managerial personnel
and other employees;
2. Formulation of criteria for evaluation of Independent
Directors and the Board of Directors;
3. Devising a policy on diversity of Board of Directors;
4. Identifying qualified candidates for Directorship, who may
be appointed in senior management in accordance with
the criteria laid down, and recommend to the Board their
appointment and removal.
5. Whether to extend or continue the terms of appointment of
Independent directors, on the basis of report of performance
evaluation of Independent Directors.
The Board of the Company has constituted a Nomination
and Remuneration Committee, comprising four Independent
and Non-Executive Directors viz. Dr. Reena Ramachandran,
Chairman, Mr. Pradeep Vedprakash Goyal, Mr. Pradip Pranjivan
Madhavji and Mr. Hardeep Singh
One meeting of the Nomination and Remuneration Committee
was held on 25th January, 2018.
Composition of members of Audit Committee is as follows:
Composition Mr. Pradip Pranjivan Madhavji
Chairman
Mr. Pradeep
Vedprakash Goyal
Mr. Arun
Chandrasen Ashar@
Mr. Vasant Prakash
Gandhi*Meetings attended during the year 4 4 2 3
@ Resigned with effect from 31st July, 2017.* Appointed with effect from 28th April, 2017.
Composition of members of Nomination and Remuneration Committee is as follows:
Composition Dr. (Mrs.) Reena Ramachandran,
Chairman
Mr. Pradeep
Vedprakash Goyal
Mr. Pradip
Pranjivan Madhavji
Mr. Hardeep
Singh
Meeting attended during the year 1 1 1 1

UPL Limited Annual Report, 2017-18 132
Details of the remuneration to all the Directors for the year:
The aggregate value of salary, perquisites and commission for the year ended 31st March, 2018 to three Whole-time Directors is as follows:
H in Lacs
Name of Director Salary Perquisites Retirement Benefits Commission Total
Mr. Rajnikant Devidas Shroff Chairman and Managing Director
480 153 153 225 1011
Mr. Kalyan Mohan BanerjeeWhole-time Director
24 19 8 15 66
Mr. Arun Chandrasen AsharWhole- time Director
120 68 38 32 258
The Company has paid the sitting fees for the year ended 31st
March, 2018 to Independent and Non-Executive Directors
for attending Board Meetings, Audit Committee Meetings,
Remuneration Committee Meetings, CSR Committee Meeting
and Stakeholders Relationship Committee Meeting as follows:
Mr. Pradeep Vedprakash Goyal `4,60,000/-, Dr. Reena
Ramachandran `2,50,000/-, Mr. Pradip Pranjivan Madhavji
`5,00,000/-, Mr. Vinod R. Sethi `1,60,000/-, Mr. Hardeep Singh
`2,50,000/- and Mr. Vasant P. Gandhi `3,75,000/-.
In addition, the Company has paid commission to Independent
and Non-Executive Directors of `8.00 lacs each to Mr. Pradeep
Goyal, Dr. Reena Ramachandran, Mr. Pradip Madhavji, Mr. Vinod
Rajindranath Sethi, Mr. Hardeep Singh and Mr. Vasant Prakash
Gandhi.
Remuneration of the executive directors are broadly divided
into fixed and variable components. The fixed components
comprises of salary, allowances, perquisites, amenities and
retirement benefits. The variable components comprises of
performance based annual commission. The performance
criteria are individual performance based on annual targets,
Company’s performance and recent compensation trends in
the industry.
The appointment of executive directors is for a period of five
years. The service agreement provides for a notice period of
three months on either side.
6. Stakeholders Relationship Committee The Board of the Company has constituted a Stakeholders
Relationship Committee, comprising two Independent and
Non-Executive Directors to look into the redressal of grievances
of security holders including complaints related to transfer of
shares, non-receipt of balance sheet, non-receipt of declared
dividends. One meeting of the Stakeholders Relationship
Committee was held on 25th January, 2018.
Composition of members of Stakeholders Relationship Committee is as follows:
Composition Mr. Pradip Pranjivan Madhavji
Chairman
Mr. Pradeep Vedprakash
Goyal
Meeting attended during
the year
1 1
Compliance Officer: Mr. M. B. Trivedi, Company Secretary
The Company also has its separate shares transfer committee
consisting of Mrs. Sandra Rajnikant Shroff and Mr. Arun
Chandrasen Ashar, Directors and two other senior executives
of the Company. This committee normally meets weekly
to approve transfer of shares, issue of duplicate certificates,
redressal of Stakeholders Grievances, among others. Share
certificates submitted for dematerialisation and request for
rematerialisation were also approved by the committee.
One complaint was pending at the beginning of the year and
the total number of complaints received during the year under
review were 77 of which 78 complaints were addressed to the
satisfaction of shareholders on or before 31st March, 2018 and
no complaint was pending as on or before 31st March, 2018.
Six requests for transfers were pending for approval as on 31st
March, 2018, out of which five were processed under objections
on or before 7th April, 2018 and one was approved and dealt
with on 2nd April, 2018.
7. General Body Meetings
(A) Annual General Meetings:
Location and time for last three Annual General Meetings were:
Year AGM Location Date Time
2014-15 31st AGM Hotel Green View Hall, N. H. No. 8 Vapi, Gujarat - 396 195. 30/07/2015 10.00 a.m.
2015-16 32nd AGM Hotel Green View Hall, N. H. No. 8 Vapi, Gujarat - 396 195. 29/06/2016 10.00 a.m.
2016-17 33rd AGM Hotel Green View Hall, N. H. No. 8, Vapi, Gujarat - 396 195. 08/07/2017 11.00 a.m.

Overview
Strategyreview Performance Governance Financials
133
The following special resolutions were passed by the
members during the last three Annual General Meetings:
2014-15 a) To adopt new Alteration of Articles of Association of the
Company
b) Private placement of Non-Convertible Debentures
2015-16 a) Private placement of Non-Convertible Debentures
2016-17 a) Private placement of Non-Convertible Debentures
b) Approval of UPL Limited -Employees Stock Option Plan
2017.
c) Grant of options to the employees of the Subsidiary
Company(ies) of the Company under Employees Stock
Option Plan 2017.
Details of resolution passed through postal ballot, the
persons who conducted the postal ballot exercise and
details of voting pattern
2017-18 No resolution, pursuant to Section 110 of the Companies
Act, 2013 read with Companies (Management &
Administration) Rules, 2014, was passed through Postal
Ballot during the year.
None of the resolutions, pursuant to Section 110
of the Companies Act, 2013 read with Companies
(Management & Administration) Rules, 2014, are
proposed to be passed in the ensuing Annual General
Meeting which require passing a special resolution
through Postal Ballot.
8. Means of communication The quarterly and annual results are published by the Company
in the English and Gujarati editions of the The Economics
Times/DNA/Business Standard/Business Line/The Financial
Express/Western Times and are also displayed on the corporate
website, www.uplonline.com. The Company’s website also
contains a separate dedicated section called ‘Investors’ wherein
shareholder-related information like the Annual Report of the
Company, shareholding pattern among others, are available.
Official news releases are sent to the Stock Exchanges at BSE
Ltd. and National Stock Exchange of India Ltd., where the equity
shares of the Company are listed.
Further, the Company also holds an Analysts’ meet after the
audited Annual Financial Statements have been adopted by
the Board of Directors, where information is disseminated and
analyzed. The presentation made at this meet has been posted
on the corporate website, www.uplonline.com.
The Management Discussion and Analysis (MD&A) forms a part
of the annual report.
9. General Shareholder Information
9.1. Annual General MeetingDate 23rd August, 2018 at 11.00 a.m.Venue Hotel Green View Hall
N. H. No. 8, Vapi - 396195, Gujarat
9.2. Financial calendarAnnual General Meeting 23rd August, 2018Results for quarter ending June 30th, 2018- On or before 14th August, 2018
September 30th, 2018- On or before 14th November, 2018December 31st, 2018- On or before 14th February, 2019
Results for quarter/ year ending March 31st, 2019- Last week of April, 2019/May, 2019
9.3. Dividend payment date On or after 28th August, 2018
9.4. a) Listing of Equity Shares on
Stock Exchanges at
BSE Limited, Phiroze Jeejeebhoy Towers, Dalal Street, Mumbai – 400 001 and National Stock Exchange of India Ltd. Exchange Plaza, C/1,Block G, Bandra Kurla Complex, Bandra (East), MUMBAI 400 051
b) Listing of GDR on the Stock
Exchange at
42103942 GDR, arising out of amalgamation of erstwhile Advanta Ltd. with the Company, are listed at Singapore Stock Exchange Ltd.
The Company has paid the annual listing fees to each of the stock exchange.
9.5. a) Security Code / Symbol BSE Ltd.: 512070National Stock Exchange of India Ltd.: UPLSingapore Stock Exchange Ltd.: BYS
b) ISIN Number in NSDL & CDSL for Equity Shares of `2/- each INE628A01036
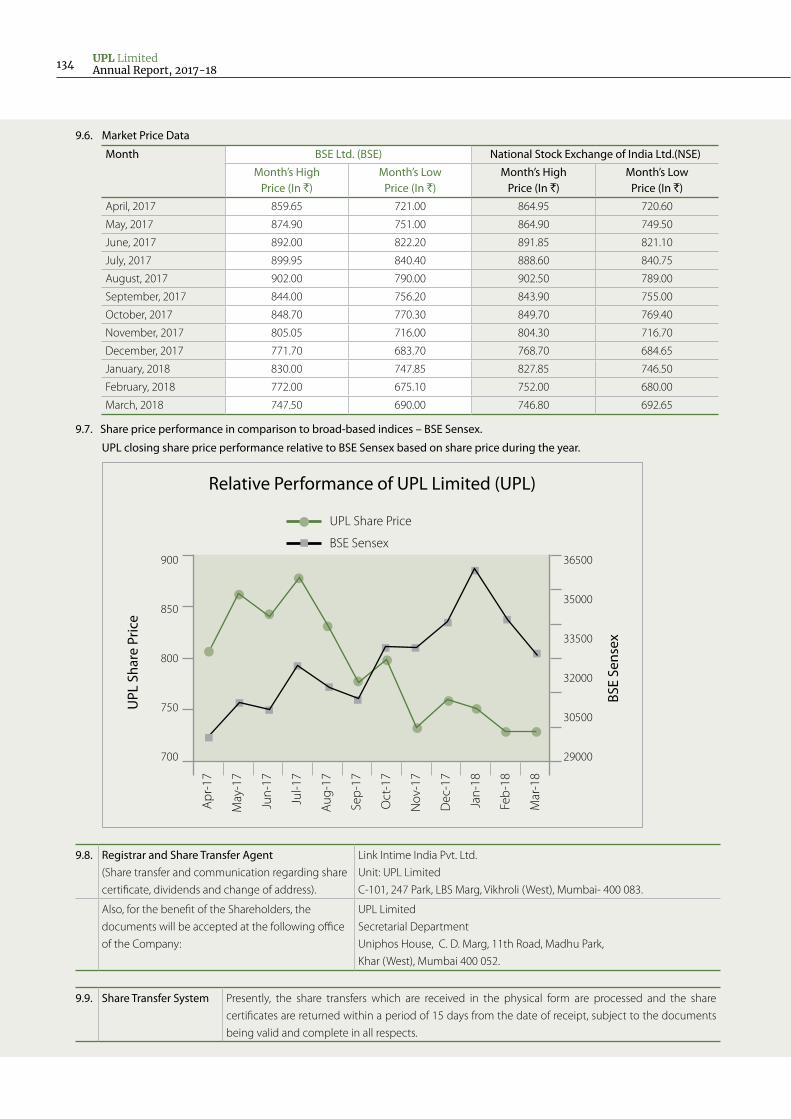
UPL Limited Annual Report, 2017-18 134
9.6. Market Price Data
Month BSE Ltd. (BSE) National Stock Exchange of India Ltd.(NSE)
Month’s HighPrice (In `)
Month’s LowPrice (In `)
Month’s HighPrice (In `)
Month’s LowPrice (In `)
April, 2017 859.65 721.00 864.95 720.60
May, 2017 874.90 751.00 864.90 749.50
June, 2017 892.00 822.20 891.85 821.10
July, 2017 899.95 840.40 888.60 840.75
August, 2017 902.00 790.00 902.50 789.00
September, 2017 844.00 756.20 843.90 755.00
October, 2017 848.70 770.30 849.70 769.40
November, 2017 805.05 716.00 804.30 716.70
December, 2017 771.70 683.70 768.70 684.65
January, 2018 830.00 747.85 827.85 746.50
February, 2018 772.00 675.10 752.00 680.00
March, 2018 747.50 690.00 746.80 692.65
9.8. Registrar and Share Transfer Agent (Share transfer and communication regarding share
certificate, dividends and change of address).
Link Intime India Pvt. Ltd.
Unit: UPL Limited
C-101, 247 Park, LBS Marg, Vikhroli (West), Mumbai- 400 083.
Also, for the benefit of the Shareholders, the
documents will be accepted at the following office
of the Company:
UPL Limited
Secretarial Department
Uniphos House, C. D. Marg, 11th Road, Madhu Park,
Khar (West), Mumbai 400 052.
9.7. Share price performance in comparison to broad-based indices – BSE Sensex.
UPL closing share price performance relative to BSE Sensex based on share price during the year.
UPL Share Price
BSE Sensex36500
35000
33500
30500
32000
29000
900
850
800
750
700
Apr
-17
May
-17
Jun-
17
Jul-1
7
Aug
-17
Sep-
17
Oct
-17
Nov
-17
Dec
-17
Jan-
18
Feb-
18
Mar
-18
UPL
Sha
re P
rice
BSE
Sens
ex
Relative Performance of UPL Limited (UPL)
9.9. Share Transfer System Presently, the share transfers which are received in the physical form are processed and the share
certificates are returned within a period of 15 days from the date of receipt, subject to the documents
being valid and complete in all respects.

Overview
Strategyreview Performance Governance Financials
135
Liquidity: The shares of the Company are among the most liquid and actively traded shares. Relevant data for the average daily turnover for
the financial year 2017–2018 is given below:
BSE Ltd. (BSE)
National Stock Exchange of India Ltd. (NSE)
BSE+NSE
In no. of shares (in thousand) 108.79 2994.60 3103.39
(Source: This information is compiled from the data available from the websites of BSE and NSE)
9.10. Distribution of shareholdings as on 31st March, 2018:
Shareholding of Nominal Value of (`) Shareholders Share Amount
Numbers % of Total Nos. In (`) % of Total Amt.
1 – 1,000 87247 87.72 14473102 1.42
1,001 – 2,000 4466 4.49 7261256 0.71
2,001 – 4,000 3488 3.51 11250892 1.11
4,001 – 6,000 1059 1.06 5296300 0.52
6,001 – 8,000 721 0.72 5317394 0.52
8,001 – 10,000 385 0.39 3525946 0.35
10,001 – 20,000 901 0.91 12537756 1.23
20,001 and above 1192 1.20 959003516 94.14
Total 99459 100 1018666162 100
9.11 Shareholding pattern as on 31st March, 2018:
Promoter
Mutu. Funds/LIC/Banks
Corporate Bodies/Trusts
Indian Public
NRIs/OCBs
FPIs
27.70%
9.41%
10.43%
5.12%40.38%
6.95%
9.12. Dematerialisation of shares 98.91% of the outstanding shares have been dematerialised up to 31st
March, 2018. Trading in Equity Shares of the Company is permitted only in
dematerialised form w.e.f. 28th August, 2000 as per notification issued by
the Securities and Exchange Board of India (SEBI).

UPL Limited Annual Report, 2017-18 136
9.13. Outstanding GDR/Warrants and Convertible
Bonds, their conversion dates and their
likely impact on the equity
As on 31st March, 2018 there are Outstanding GDRs represent 42353062 shares
(8.32%).
9.14. Commodity price risk or Foreign Exchange
Risk and Hedging activities
The Company has exports of finished products and imports by sourcing of raw
materials from outside India. The international trade is primarily in USD and Euro
which are major convertible currencies, and to that extent the exposure to forex
exchange risk exists. However, the Company exports and imports are in same
currencies, there is a natural hedge for these currencies.
To mitigate this foreign exchange risk, the Company works out the net open
position relating to trade operations and such net open positions are hedged
by taking simple Forward Contracts for a period not exceeding twelve months.
Similarly, for exposure on account of capital operations in Foreign Currency,
the net open position is hedged by taking Forward Contracts for a period not
exceeding twelve months.
The Company has a Risk Management Policy in place which as approved by the
Board of Directors, which monitors foreign currency risk on a continuous basis.
The various derivative transactions relating to Foreign Exchange and all the
outstanding Derivative Contracts are periodically reported to and ratified by the
Board of Directors.
9.15. Plant locations The Company’s plants in India are located at Vapi, Ankleshwar, Jhagadia, Halol,
Jammu, Haldia, Tarapore and Hyderabad.
9.16. Address for Correspondence
(i) Investor correspondence For Shares held in Physical Form
Link Intime India Pvt. Ltd.
Unit: UPL Limited
C-101, 247 Park, LBS Marg, Vikhroli (West), Mumbai- 400 083.
Telephone No(s): 91-22-49186270, Fax No.: 91-22-49186060
Email: [email protected], Website: www.linkintime.co.in
Also, for the benefit of the Shareholders, the documents will continue to be
accepted at the following office of the Company:
UPL Limited
Secretarial Department
Uniphos House, C. D. Marg, 11th Road, Madhu Park, Khar (West), Mumbai 400 052.
Telephone No.: 91-22-26468009/10
For Shares held in Demat form
To the Depository Participant(s)
(ii) Any query on Annual Report Mr. M. B. Trivedi, Company Secretary
UPL Limited
Legal & Secretarial Department
Uniphos House, C. D. Marg, Madhu Park, Khar (West), Mumbai 400 052.
E-Mail : [email protected]
(iii) Exclusive e-mail ID of the grievance
redressal division
(iv) Corporate website www.uplonline.com

Overview
Strategyreview Performance Governance Financials
137
10. Other Disclosures: a) Disclosures on materially significant related party
transactions that may have potential conflict with the interests of the Company at large.
During the year, the Company had no materially significant
related party transactions which were considered to have
potential conflict with the interests of the Company at large.
b) Details of non-compliance by the Company, penalties, strictures imposed on the Company by Stock Exchanges or SEBI, or any statutory authority, on any matter related to capital markets, during the last three years.
None.
c) Details of establishment of vigil mechanism, whistle Blower Policy and affirmation that no personnel has been denied access to the audit committee.
The Company has devised an effective whistle blower
mechanism enabling stakeholders, including individual
employees and their representative bodies, to communicate
their concerns about illegal or unethical practices freely.
The Company has also established a vigil mechanism for
directors and employees to report concerns about unethical
behaviour, actual or suspected fraud or violation of the
Company’s code of conduct or ethics policy and placed on
the website of the Company www.uplonline.com and no
personnel has been denied access to the audit committee.
d) Details of compliance with mandatory requirements and adoption of the non-mandatory requirements.
Mandatory Requirements
The Company has complied with the mandatory
requirements of para C (10) (d) of Schedule V SEBI (Listing
Obligations and Disclosure Requirements) Regulation, 2015.
e) Policy for determining ‘material’ subsidiary has been
disclosed on the Company’s website www.uplonline.com.
f ) Policy on dealing with related party transaction has been
disclosed on the Company’s website www.uplonline.com.
11. There are no non-compliance of any requirements of Corporate Governance Report of sub-paras (2) to (10) above.
12. Discretionary Requirements as specified in Part E of Schedule II
A. Chairman of the Board The Chairman of the Board is Executive.
B. Shareholder Rights – Half yearly results As the Company’s half yearly results are published in English
newspapers circulated all over India and in a Gujarati
newspaper (circulated in Gujarat) and also posted on the
website of the company www.uplonline.com, the same
are not sent to the households of the shareholders of the
Company.
C. Modified opinion in audit report There are no modified opinion contained in the Audit
Report.
D. Separate Posts of Chairman and Chief Executive Officer The Posts of Chairman and Managing Director are not
separate.
E. Reporting of Internal Auditors The Internal Auditors of the Company report directly to the
Audit Committee.
13. The Company has complied with Corporate Governance requirements specified in Regulations 17 to 27 and clauses (b) to (i) of sub-regulation (2) of Regulation 46 of SEBI (Listing Obligations and Disclosure Requirements) Regulation, 2015.
On behalf of the Board of Directors
Place: Mumbai, Rajnikant Devidas Shroff Date: April 27, 2018 (Chairman and Managing Director)
DeclarationAs provided under Clause D of Schedule V pursuant to Regulation 34(3) of SEBI (Listing Obligations and Disclosure Requirements) Regulations,
2015, the Members of Board of Directors and Senior Management Personnel have affirmed compliance with the Code of Conduct of Board
of Directors and Senior Management laid down by the Company for the year ended 31st March, 2018.
On behalf of the Board of Directors of UPL Limited
Place: Mumbai Rajnikant Devidas Shroff Date: April 27, 2018 (Chairman & Managing Director)

UPL Limited Annual Report, 2017-18 138
Compliance Certificate
We, Rajnikant Devidas Shroff, Chairman and Managing Director and Anand Vora, Chief Financial Officer do hereby certify that in respect of
annual accounts and cash flow statement for the year 2017-2018.
A. We have reviewed financial statements and the cash flow statement for the year and that to the best of our knowledge and belief:
(1) these statements do not contain any materially untrue statement or omit any material fact or contain statements that might be
misleading;
(2) these statements together present a true and fair view of the Company’s affairs and are in compliance with existing accounting
standards, applicable laws and regulations.
B. There are, to the best of our knowledge and belief, no transactions entered into by the Company during the year which are fraudulent,
illegal or violative of the Company’s code of conduct.
C. We accept responsibility for establishing and maintaining internal controls for financial reporting and that we have evaluated the
effectiveness of internal control systems of the Company pertaining to financial reporting and we have disclosed to the auditors and the
Audit Committee, deficiencies in the design or operation of such internal controls, if any, of which we are aware and the steps we have
taken or propose to take to rectify these deficiencies.
D. We have indicated to the auditors and the Audit Committee
(1) significant changes in internal control over financial reporting during the year;
(2) significant changes in accounting policies during the year and that the same have been disclosed in the notes to the financial
statements; and
(3) instances of significant fraud of which we have become aware and the involvement therein, if any, of the management or an
employee having a significant role in the Company’s internal control system over financial reporting.
Rajnikant Devidas Shroff Anand Vora
Chairman and Managing Director Chief Financial Officer
Pursuant to Regulation 17(8) of SEBI (Listing Obligations and Disclosure Requirements) Regulations, 2015

Overview
Strategyreview Performance Governance Financials
139
Auditors’ CertificateToThe Members of UPL Limited
Independent Auditors’ Certificate on Compliance with the Corporate Governance requirements under SEBI (Listing Obligations and
Disclosure Requirements) Regulations, 2015.
1 This Certificate is issued in accordance with the terms of our agreement dated 06 April 2018.
2 This Report contains details of compliance of conditions of Corporate Governance by UPL Limited (‘the Company’) for the year ended
March 31, 2018 as stipulated in Regulations 17-27, clause (b) to (i) of Regulation 46 (2) and paragraphs C, D and E of Schedule V of
the Securities and Exchange Board of India (Listing Obligations and Disclosure Requirements) Regulations, 2015 (‘Listing Regulations’)
pursuant to the Listing Agreement of the Company with Stock Exchanges.
Management’s Responsibility for compliance with the conditions of Listing Regulations
3. The compliance with the terms and conditions contained in the Corporate Governance is the responsibility of the Management of the
Company including the preparation and maintenance of all relevant supporting records and documents.
Auditors’ Responsibility
4. Our examination was limited to procedures and implementation thereof adopted by the Company for ensuring the compliance of the
conditions of Corporate Governance. It is neither an audit nor an expression of opinion on the financial statements of the Company.
5. Pursuant to the requirements of the Listing Regulations, it is our responsibility to provide a reasonable assurance whether the Company
has complied with the conditions of Corporate Governance as stipulated in Listing Regulations for the year ended 31 March 2018.
6. We conducted our examination in accordance with the Guidance Note on Reports or Certificates for Special Purposes issued by the
Institute of Chartered Accountants of India. The Guidance Note requires that we comply with the ethical requirements of the Code of
Ethics issued by the Institute of Chartered Accountants of India.
7. We have complied with the relevant applicable requirements of the Standard on Quality Control (SQC) 1, Quality Control for Firms that
Perform Audits and Reviews of Historical Financial Information, and Other Assurance and Related Services Engagements.
Opinion
7. In our opinion, and to the best of our information and according to explanations given to us, we certify that the Company has complied
with the conditions of Corporate Governance as stipulated in the above-mentioned Listing Regulations.
8. We state that such compliance is neither an assurance as to the future viability of the Company nor the efficiency or effectiveness with
which the management has conducted the affairs of the Company.
Restriction on use
9. The certificate is addressed and provided to the members of the Company solely for the purpose to enable the Company to comply with
the requirement of the Listing Regulations, and it should not be used by any other person or for any other purpose. Accordingly, we do
not accept or assume any liability or any duty of care for any other purpose or to any other person to whom this certificate is shown or
into whose hands it may come without our prior consent in writing.
For B S R & Co. LLP
Chartered Accountants
ICAI Firm Registration Number: 101248W/W-100022
Bhavesh Dhupelia
Place: Mumbai Partner
Date: 27 April 2018 Membership No: 042070

UPL Limited Annual Report, 2017-18 140
FOR THE YEAR 2017-18 (PURSUANT TO REGULATION 34(2) (f)) OF SECURITIES AND EXCHANGE BOARD OF INDIA
(LISTING OBLIGATIONS AND DISCLOSURE REQUIREMENTS) REGULATIONS, 2015
Section A: General Information about the Company
1. Corporate Identity Number (CIN) of the Company L24219GJ1985PLC025132
2. Name of the company UPL Limited
3. Registered Address 3-11, GIDC, VAPI, DIST VALSAD, GUJARAT
4. Website www.uplonline.com
5. E-mail ID [email protected]
6. Financial year reported April 2017 to March 2018
7. Sector(s) that the Company is engaged in (industrial activity code-wise)
2021 - Agrochemicals
8. List three key products/services that the company manufactures/provides. (as in balance sheet)
- Industrial chemicals- Agrochemicals- Hybrid seeds
9 Total number of locations where business activity is undertaken by the Company: i) Number of International locations 75
ii) Number of National locations 26 Depots & 10 companies
10. Markets served by the company Local/State/National/International
Global Market, 120 countries in the world
Section B: Financial Details of the company
1. Paid Up Capital (INR) H 102 crores
2. Total Turnover (INR) H 7,374 crores
3. Total Profit after Taxes (INR) H 548 crores
4. Total Spending on Corporate Social Responsibility (CSR) as percentage of Profit after Tax (%)
H 20.36 crores (3.7 % of profit after tax)
5. List of activities in which the expenditure in 4 above has been incurred.
• AgricultureDevelopment
• Employability&Entrepreneurship
• Education&Empowerment
• Environment&NatureConservation
• Health&Sanitation
• National&LocalAreaneeds
Section C: Other Details1. Does the company have any Subsidiary Company/Companies? Yes. The company has subsidiaries
2. Do the Subsidiary Company/Companies participate in the BR Initiatives of the parent company? If yes, then indicate the number of such subsidiary company(s)
No. The subsidiaries conduct BR initiatives independently.
3. Do any other entity / entities (e.g Supplier, distributor etc.) that the Company does business with, participate in the BR initiatives of the Company? If yes indicate the percentage of such entities? (less than 30%, 30 – 60% and More than 60%)
Yes. All the Supplier/ Vendors which cater to the needs of UPL in terms of good and services as well as our affiliates globally come under the purview of our Supplier Code of Conduct. These entity include our supplier, contractors, contract manufacturers, tollers and joint venture partners whom share a contractual and commercial relationship with us. The policy specifies lays down our expectations from our value chain partners.
Business Responsibility Report
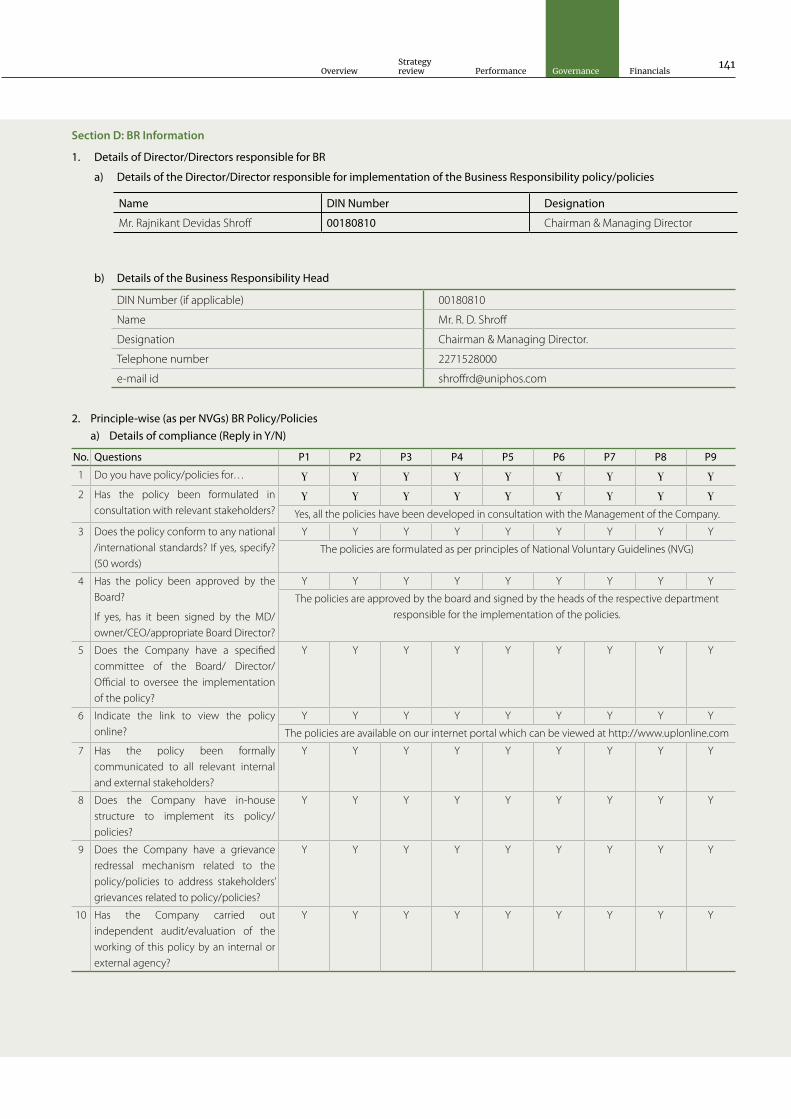
Overview
Strategyreview Performance Governance Financials
141
Section D: BR Information
1. Details of Director/Directors responsible for BR
a) Details of the Director/Director responsible for implementation of the Business Responsibility policy/policies
Name DIN Number Designation
Mr. Rajnikant Devidas Shroff 00180810 Chairman & Managing Director
b) Details of the Business Responsibility Head
DIN Number (if applicable) 00180810
Name Mr. R. D. Shroff
Designation Chairman & Managing Director.
Telephone number 2271528000
e-mail id [email protected]
2. Principle-wise (as per NVGs) BR Policy/Policies a) Details of compliance (Reply in Y/N)
No. Questions P1 P2 P3 P4 P5 P6 P7 P8 P9
1 Do you have policy/policies for… Y Y Y Y Y Y Y Y Y2 Has the policy been formulated in
consultation with relevant stakeholders? Y Y Y Y Y Y Y Y Y
Yes, all the policies have been developed in consultation with the Management of the Company.
3 Does the policy conform to any national /international standards? If yes, specify? (50 words)
Y Y Y Y Y Y Y Y Y
The policies are formulated as per principles of National Voluntary Guidelines (NVG)
4 Has the policy been approved by the Board?
If yes, has it been signed by the MD/owner/CEO/appropriate Board Director?
Y Y Y Y Y Y Y Y Y
The policies are approved by the board and signed by the heads of the respective department responsible for the implementation of the policies.
5 Does the Company have a specified committee of the Board/ Director/Official to oversee the implementation of the policy?
Y Y Y Y Y Y Y Y Y
6 Indicate the link to view the policy online?
Y Y Y Y Y Y Y Y Y
The policies are available on our internet portal which can be viewed at http://www.uplonline.com
7 Has the policy been formally communicated to all relevant internal and external stakeholders?
Y Y Y Y Y Y Y Y Y
8 Does the Company have in-house structure to implement its policy/policies?
Y Y Y Y Y Y Y Y Y
9 Does the Company have a grievance redressal mechanism related to the policy/policies to address stakeholders’ grievances related to policy/policies?
Y Y Y Y Y Y Y Y Y
10 Has the Company carried out independent audit/evaluation of the working of this policy by an internal or external agency?
Y Y Y Y Y Y Y Y Y

UPL Limited Annual Report, 2017-18 142
3. GOVERNANCE RELATED TO BR a) Indicate the frequency with which the Board of Directors,
Committee of the Board or CEO to assess the BR performance of the Company. Within 3 months, 3-6 months, Annually, More than 1 year.
The board of directors meet annually to access the BR related
performance.
b) Does the Company publish a BR or a Sustainability Report? What is the hyperlink for viewing this report? How frequently it is published?
Yes, UPL Ltd publishes a Business Responsibility Report. The
report is part of the annual report of FY 2017-18
Section E: Principle Wise Performance Principle 1: Businesses should conduct and govern themselves with Ethics, Transparency and Accountability
1. Does the policy relating to ethics, bribery and corruption cover only the company? Yes/ No. Does it extend to the Group/Joint Ventures/ Suppliers/Contractors/NGOs /Others?
Yes. Ethics & transparency is in the core of all our business
practices and activities. Being a responsible brand we have
policies in place that establish a robust mechanism to ensure
ethical conduct and transparency. Clauses pertaining to our
anti-bribery, conflict of interest, compliance with Government
rules, intellectual property, confidentiality, advertising, fair
dealings and equal opportunity are covered in our Code of
Conduct. This Code extends to all employees, directors and
senior management personnel. Our strict adherence to ethical
practices trickles down to our value chain through a separate
code of conduct guidance for our suppliers, contractors,
contract manufacturers, tollers and joint venture partners.
This policy guideline lays down principles with respect to
ethics, intellectual property, legal requirements, employment
practices, health, safety, environmental and quality practices,
conflict minerals, procurement from civil war zones,
communications, monitoring and compliance.
2. How many stakeholder complaints have been received in the
past financial year and what percentage was satisfactorily resolved by the management? If so, provide details thereof, in about 50 words or so.
The Company has incorporated a stakeholder relationship
committee which comprises of three independent directors.
UPL’s whistle blower policy is applicable to all our relevant
stakeholders. In the current financial year we have received 01
number of complain and same was resolved.
Principle 2: Businesses should provide goods and services that are safe and contribute to sustainability throughout their life cycle
1. List up to 3 products or services whose design has incorporated social or environmental concerns, risks, and/or opportunities.
UPL understands impacts of its business on environment &
society and takes responsibility to develop its products, favoring
betterment of environment and society. In every action of the
Company, the farmer is at the beginning and in the center
of our activities. UPL invests in cost efficient products for our
beneficiaries. Our products are energy efficient & consumes
lower resources during utilization resulting in creating positive
environmental footprint. Following are the three key products
whose design address social and environmental concerns:
a) Herbicide
b) Insecticide
c) Fungicide
UPL believes in adapting new technologies which has a
positive impact on environment and social dimensions along
with economic dimensions. UPL has an in-house team for the
evaluation and development of new technologies which helps
us to make our processes more efficient.
Following are some technological upgradation adopted by UPL;
1. Back pressure turbine installation in place of PRV station
2. Innovative in-line condenser cleaning system to sustain
and improve Heat transfer coefficient
3. Induction cooking for canteen
4. Low Sulphur Furnace Oil as a fuel
b) If answer against any principle, is ‘No’, please explain why: (Tick up to 2 options):
No. Questions P1 P2 P3 P4 P5 P6 P7 P8 P91 The company has not understood the
principles
2 The company is not at a stage where it finds itself in a position to formulate and implement the policies on specified principles
3 The company does not have financial or manpower resources available for the task
4 It is planned to be done in the next 6 months
5 It is planned to be done in the next year
6 Any other reason (please specify)

Overview
Strategyreview Performance Governance Financials
143
5. Brushless DC electric ceiling fan
6. Corrugated tube exchanger for high heat transfer
coefficient
7. Automated incinerator waste heat recovery
8. In-house online utility condenser cleaning system
9. Reflux optimization by controlling temperature variability
10. Fully automated Waste Heat Recovery from Incinerator
2. For each product, provide the following details in respect of resources (energy, water, raw material etc.) per unit of product.
(i) Reduction during sourcing/production/ distribution achieved since the previous year throughout the value chain?
The Company is actively working on its products to
reduce overall impacts through incorporation of advance
and effective technologies, few of the achievements are
mentioned below.
1. Reduction in power consumption for refrigeration
by 12% through reduced condensation temperature
from 400c to 360c.
2. Process yield improvements in some key products for
reduction in consumption of raw materials and also
reduction in waste generation.
(ii) Reduction during usage by consumers (energy, water) has been achieved since the previous year?
The Company is committed to reduce its environmental
and social footprints through its activities. We thoughtfully
design our products keeping our customers in mind and
their requirements. We train farmers through our CSR
activities on modern agricultural techniques which helps
them to reduce their overall water consumption and
electricity consumption.
3. Does the company have procedures in place for sustainable sourcing (including transportation)? If yes, what percentage of your inputs was sourced sustainably? Provide details thereof, in about 50 words or so.
Yes, the Company has a sustainable procurement policy in
place which is a guidance to our internal team and for suppliers/
vendors before onboarding them. Our internal team performs
audits and our suppliers/ vendors also sign a declaration
on “commitment to sustainability” which is the agreement
from their side to maintain the laws and standards set by the
Company. UPL also has a program “The Green Procurement
Program” which is helps the Company to incorporate a robust
mechanism to procure raw materials and packing materials
through a sustainable source.
The Company is also working with its Global Sustainability team
to design sustainable practices, particularly for its supply chain.
These practices primarily focus on improvements in process
to improve energy efficiency, waste management, water
management, and compliances with regard to sustainability.
4. Has the company taken any steps to procure goods and services from local & small producers, including communities surrounding their place of work? If yes, what steps have been taken to improve their capacity and capability of local and small vendors?
Yes, the Company understands the importance of development
of its local suppliers and vendors and takes special initiatives to
build their capacity and capability. UPL has training calendar in
place on sustainable practices for suppliers and vendors, this
includes physical interactions and online training modules.
We connect with local suppliers and vendors located nearby
our plants to procure most of our packaging materials, this
includes materials as Plastic bottles, Corrugated boxes, Fiber
drums, Flexible laminates, HDPE Woven bags, etc. UPL also
procures raw materials locally such as MnSO4, Salt, Caustic
soda, Chlorine, Hydrated Lime, ZnSO4, 3-4 DCA, Specialized
Starch, China clay, Mg turning, Ethanol, Sulphur, Ammonia,
Chloral, Acids and etc.
5. Does the company have mechanism to recycle products and waste? If yes, what is the percentage of recycling waste and products?
Yes, UPL has mechanisms in place to recycle its waste, most of
our plants are “Zero Liquid Discharge”. We recycled certain waste
by 100%, which includes Ammonium chloride, Ammonium
acetate, Methyl chloride, sodium sulfate, ammonium sulphate,
calcium chloride, hydrochloric acid, MDC residue, HNO3, etc.
Product recoveries are above 95 %, however some products are
recovered 100%.
Other waste are treated as per required process and disposed
safely.
Principle 3: Businesses should promote the wellbeing of all employees
1. Please indicate the total number of employees-
Total number of employees as on 31st March, 2018 is 3,865.
2. Please indicate the total number of employees hired on temporary/ contractual/casual basis –
Total number of employees hired on temporary/ contractual/
casual basis as on 31st March, 2018 is 7,232.
3. Please indicate the number of permanent women employees –
Total number of permanent women employees as on 31st
March, 2018 is 171.
4. Please indicate the number of permanent employees with disability –
Total number of permanent employees with disability as on
31st March, 2018 is 23.

UPL Limited Annual Report, 2017-18 144
5. Do you have an employee association that is recognized by management?
The Company does not has any recognized employee
association.
6. What percentage of your permanent employees are a member of this recognized employee association?
Not Applicable
7. Please indicate the Number of complaints relating to child labour, forced labour, involuntary labour, sexual harassment in the last financial year and pending, as on the end of the financial year.
The Company has implemented a policy on sexual harassment,
UPL has initiated e-learning program for awareness of the
policy and was mandated for employees. The Company has
incorporated a corporate level committee to monitor the
implementation of this policy with a presiding officer along
with a unit level committee at all manufacturing units. This
committee consist of male and female members both.
We also have a Child Labor Policy which is strictly followed and
it is applicable to all contract and permanent workforce.
Category No. of complaints during financial
year
No. of complaints pending at the end of the financial year
Child Labour /
Forced Labour /
Involuntary Labour
Nil Nil
Sexual Harassment Nil Nil
Discriminatory
employment
Nil Nil
8. What percentage of your under mentioned employees were given safety & skill up-gradation training in the last year?
UPL takes safety of its employees very seriously and has
taken up programmes to train our workforce on how to main
occupation health and safety.
Safety – 14 PSM elements are the basis for Safety Processes.
Trainings are provided accordingly to the workforce. Our
internal team has developed few rituals on safety which is
followed with full respect.
• DailySafetyTalk:Dailybriefingonsafetybeforestartofthe
shift.
• Monthlywecoveraparticularsafetythemebytheunitsafety
representative.
The Company also invests in trainings to upgrade the skills
of our employees based on requirements and demand. A
Calendar based training program is published for both behavior
and functional development of the employees. Based on the
availability and nominations the employees are provided with
the trainings and certifications. No employee in manufacturing
functions can take charge of respective activities unless they
have undergone Level 0, 1 & 2 training minimum duration for
which is 23 days. This training basically is intended for safety
and functional expertise including safety in operating related
functions.
Company has several other training programmes which
essentially addresses the areas of safety on various activities
like construction safety, Chemical safety, emergency response,
Process Safety Management, electrical safety etc. UPL does
not differentiate between company employees or contractual
employees.
Principle 4: Businesses should respect the interests of, and be responsive to the needs of all stakeholders, especially those who are disadvantage vulnerable, and marginalized.
1. Has the company mapped its internal and external stakeholders? Yes/No
Yes, UPL has identified and mapped all its stakeholders
2. Out of the above, has the company identified the disadvantaged, vulnerable & marginalized stakeholders?
Yes , UPL has identified its disadvantaged, vulnerable &
marginalized stakeholders.
3. Are there any special initiatives taken by the company to engage with the disadvantaged, vulnerable, and
What are the average
hours of training on:
Total Employees Employees at
Management
level
Employees at
Non-Management
level
Temporary
Employees
Contractual
Employees
Permanent
Employees with
Disabilities
Male Female Male Female Male Female Male Female Male Female Male Female
a) Safety 1263 47 103 3 1160 44 2843 243 23
b) Skill Upgradation 934 4 46 2 888 2
c) Others 623 6 87 2 536 4
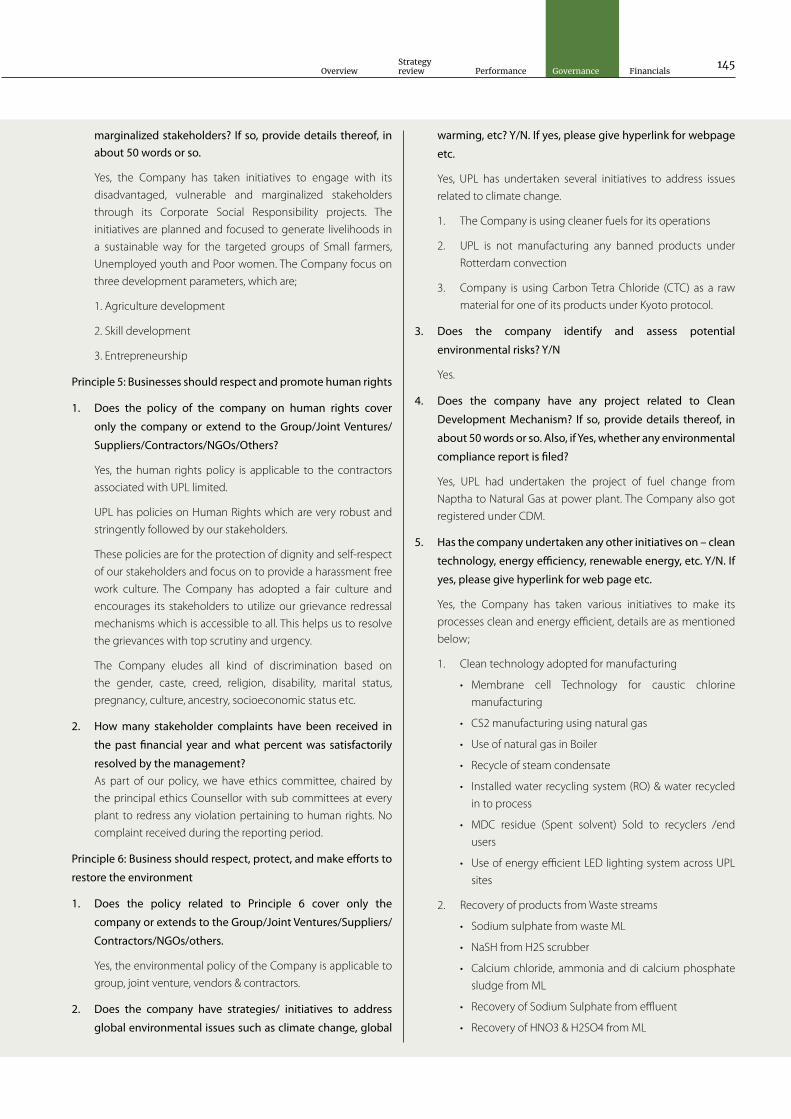
Overview
Strategyreview Performance Governance Financials
145
marginalized stakeholders? If so, provide details thereof, in about 50 words or so.
Yes, the Company has taken initiatives to engage with its
disadvantaged, vulnerable and marginalized stakeholders
through its Corporate Social Responsibility projects. The
initiatives are planned and focused to generate livelihoods in
a sustainable way for the targeted groups of Small farmers,
Unemployed youth and Poor women. The Company focus on
three development parameters, which are;
1. Agriculture development
2. Skill development
3. Entrepreneurship
Principle 5: Businesses should respect and promote human rights
1. Does the policy of the company on human rights cover
only the company or extend to the Group/Joint Ventures/
Suppliers/Contractors/NGOs/Others?
Yes, the human rights policy is applicable to the contractors
associated with UPL limited.
UPL has policies on Human Rights which are very robust and
stringently followed by our stakeholders.
These policies are for the protection of dignity and self-respect
of our stakeholders and focus on to provide a harassment free
work culture. The Company has adopted a fair culture and
encourages its stakeholders to utilize our grievance redressal
mechanisms which is accessible to all. This helps us to resolve
the grievances with top scrutiny and urgency.
The Company eludes all kind of discrimination based on
the gender, caste, creed, religion, disability, marital status,
pregnancy, culture, ancestry, socioeconomic status etc.
2. How many stakeholder complaints have been received in
the past financial year and what percent was satisfactorily
resolved by the management? As part of our policy, we have ethics committee, chaired by
the principal ethics Counsellor with sub committees at every
plant to redress any violation pertaining to human rights. No
complaint received during the reporting period.
Principle 6: Business should respect, protect, and make efforts to
restore the environment
1. Does the policy related to Principle 6 cover only the
company or extends to the Group/Joint Ventures/Suppliers/
Contractors/NGOs/others.
Yes, the environmental policy of the Company is applicable to
group, joint venture, vendors & contractors.
2. Does the company have strategies/ initiatives to address
global environmental issues such as climate change, global
warming, etc? Y/N. If yes, please give hyperlink for webpage
etc.
Yes, UPL has undertaken several initiatives to address issues
related to climate change.
1. The Company is using cleaner fuels for its operations
2. UPL is not manufacturing any banned products under
Rotterdam convection
3. Company is using Carbon Tetra Chloride (CTC) as a raw
material for one of its products under Kyoto protocol.
3. Does the company identify and assess potential
environmental risks? Y/N
Yes.
4. Does the company have any project related to Clean
Development Mechanism? If so, provide details thereof, in
about 50 words or so. Also, if Yes, whether any environmental
compliance report is filed?
Yes, UPL had undertaken the project of fuel change from
Naptha to Natural Gas at power plant. The Company also got
registered under CDM.
5. Has the company undertaken any other initiatives on – clean
technology, energy efficiency, renewable energy, etc. Y/N. If
yes, please give hyperlink for web page etc.
Yes, the Company has taken various initiatives to make its
processes clean and energy efficient, details are as mentioned
below;
1. Clean technology adopted for manufacturing
• Membrane cell Technology for caustic chlorine
manufacturing
• CS2manufacturingusingnaturalgas
• UseofnaturalgasinBoiler
• Recycleofsteamcondensate
• Installedwaterrecyclingsystem(RO)&waterrecycled
in to process
• MDC residue (Spent solvent) Sold to recyclers /end
users
• UseofenergyefficientLEDlightingsystemacrossUPL
sites
2. Recovery of products from Waste streams
• SodiumsulphatefromwasteML
• NaSHfromH2Sscrubber
• Calciumchloride,ammoniaanddicalciumphosphate
sludge from ML
• RecoveryofSodiumSulphatefromeffluent
• RecoveryofHNO3&H2SO4fromML

UPL Limited Annual Report, 2017-18 146
• Manufacture NaSH as by-product from CS2 plant by
utilizing excess H2S gas which was previously sent for
thermal destruction in TGTU
• Mn(OH)2recoveredfromML
• Recycleofdrumsforpackaging
6. Are the Emissions/Waste generated by the company within
the permissible limits given by CPCB/SPCB for the financial
year being reported?
UPL always monitors its waste generation limits, this helps the
Company to ensure that generated waste is within the limits
provided by Central Pollution Control Board (CPCB)/ State
Pollution Control Board (SPCB).
7. Number of show cause/ legal notices received from CPCB/
SPCB which are pending (i.e. not resolved to satisfaction) as
on end of Financial Year.
Nil
Principle 7: Businesses, when engaged in influencing public and
regulatory policy, should do so in a responsible manner
1. Is your company a member of any trade and chamber or
association? If Yes, Name only those major ones that your
business deals with:
Yes, the Company is member of various trade associations
and chambers which helps UPL to identify and understand
the common concerns of the business and its impacts on
the communities. UPL is currently a part of the following
associations:
I. Vapi Industrial Association
II. Indian Merchant Chambers
III. Crop Care Federation of India
IV. Asmechem
V. Centigro Environment of Agriculture
VI. CII
2. Have you advocated/lobbied through above associations for
the advancement or improvement of public good? Yes/No;
if yes specify the broad areas ( drop box: Governance and
Administration, Economic Reforms, Inclusive Development
Policies, Energy security, Water, Food Security, Sustainable
Business Principles, Others)
Yes, the Company lobbies with industry association and also
with Government bodies to resolve the issues related to
chemical and pesticide industry. UPL gets actively involved
at industry forums and with Ministry through meetings and
dialogues providing valuable suggestions favoring business
and public good.
Company has lobbied or advocated through public associations
on the below topics:
I. Problems of Chemical Industries in Gujarat and India
II. Customs and Excise laws effecting faster industrial
development
III. Environment and pollution matters
IV. Agriculture and Agro Chemical inputs
V. Fight against foreign funded NGO’s
VI. Promoting and educating public about advantage of
scientific agriculture and use of agro chemicals
VII. Other matters connected with government policy “Make
in India”
VIII. Removal of hurdles and exports
Principle 8: Businesses should support inclusive growth and
equitable development
1. Does the company have specified programmes/initiatives/
projects in pursuit of the policy related to Principle 8? If yes
details thereof.
‘Doing Things Better’ is core to our DNA. Three simple words,
which lie at the heart of the UPL philosophy have been
the guiding force in all our community interventions. Our
CSR programs are driven by the belief that humankind is
one community, where each member is responsible for
the wellbeing of the other, hence our interventions are not
restricted to the development of our neighboring communities
only. We work on programs that cater to the wider national
interest, our CSR efforts are focused in Gujarat and they have
also touched lives in many other states including Maharashtra,
West Bengal, Kashmir, Tamil Nadu and Himachal Pradesh.
Our studies and commitment to the community have
translated into 6 key focus areas, they are:
• AgricultureDevelopment
• Employability&Entrepreneurship
• Education&Empowerment
• Environment&NatureConservation
• Health&Sanitation
• National&LocalAreaneeds
For more details login to http://www.uplonline.com/CSR
2. Are the programmes/projects undertaken through in-
house team/own foundation/external NGO/government
structures/any other organization?
Yes, the Company has a dedicated in-house experienced
CSR team/ UPL promoted foundation to design and execute
the CSR programmes. UPL also engages with third parties,
Government organizations, NGO’s and CBO’s to perform specific
programmes based on community needs and requirements.

Overview
Strategyreview Performance Governance Financials
147
3. Have you done any impact assessment of your initiative?
Yes, the in-house team performs a need assessment survey
before execution of the programmes/ projects.
One of our need assessment survey had brought out the
fact that the per capita availability of land was small which
led to unemployment in that particular region. Particularly
youth and women in the region were not productively
employed. Our employment and entrepreneurship initiatives
are focused on providing this segment with knowledge,
skills and the motivation to take up entrepreneurship as an
income generating opportunity. Skill based entrepreneurship
development program provides training to start both farm and
non-farm based enterprises.
4 UPL Niyojaniy Kendras are providing training to youth in
the region on industrial skills like welding, fitting, electrical
etc. Once trained these youth get gainfully employed in the
neighboring industries. UPL Udyamita with more than 1300
women members is another intervention that focuses on
making women financially independent through self- help
groups.
4. What is your company’s direct contribution to community
development projects Amount in INR and the details of the
projects undertaken.
Direct contribution to community development projects is
`20.36 crores which is 3.7 % of profit after tax.
Our CSR footprint in India1. Gujarat •VapiCluster
•DangCluster
•AnkleshwarCluster(Bharuch)
•JhagadiaCluster(Bharuch)
•DahejCluster(Bharuch)
•VandriCluster(Narmada)
2. Maharashtra •MumbaiCluster
•MarathwadaCluster
3. Other parts of country •SambainJammu
•HaldiainWestBengal
•TiruvarurinTamilNadu
•KulluinHimachalPradesh
Efforts and impacts at a glaceSustainable livelihoods - through agriculture interventions
• UPLAKRSPSRIProject 5 years
21 villages
1500 farmers
• UPLKhedutPragati@Dang 4 years
12 villages
354 farmers

UPL Limited Annual Report, 2017-18 148
• UPLCentreforAgricultureExcellence 16 years
13,988 Farmers
• UPLBoriBagicha 3 years
18 villages
1282 farmers
• AgricultureDevelopmentprojectwithcooperativesinKapradaBlock (Dist-Valsad)
2 years
16 villages
1000 farmers
• UPLKhedutPragati@Vapi 2 years
10 villages
208 farmers
• UPLKhedutPragati@Ankleshwar 3 years
4 villages
500 farmers
• AnimalHusbandry

Overview
Strategyreview Performance Governance Financials
149
Sustainable livelihood through skill development of youth and women• UPLNiyojaniyKendra 4 years
1074 youth trained
• SkillBasedEntrepreneurialDevelopmentProgram 4 years
854 participants trained
• UPLUdyamita 4 years
34 villages
1307 women members
• Micro enterprise development and Entrepreneurshipdevelopment for tribal women
1 year
Environment and Nature Conservation (UPL VASUDHA)• EcoClubProject 4 years
75 eco clubs
8425 students
• UPLSarusConservation,Vadodara 3 years
25 villages
3021 students & 750 villagers

UPL Limited Annual Report, 2017-18 150
• UPLSocialForestry 2 years
65,595 saplings planted
1,20,000 mangroves planted
• GreenGanesha 50 schools
10000 students
Institution Building- Education and Health • Smt.SandrabenShroffGnyanDhamSchool,Vapi 45 years
1600 students/year
• GnyanDhamEklavyaModelResidentialSchool,Ahwa 6 years
350 students/year
• Sandra Shroff ROFEL College of Nursing, VAPI
14 years
55 students/year
• Shroff S Rotary Institute of Chemical Technology (SRICT),
Vataria, Ankleshwar
5 years
330 students/year

Overview
Strategyreview Performance Governance Financials
151
• GIDC Rajju Shroff ROFEL Institute of Management Studies
(GRIMS), Vapi
19 years
120 students/year
• HariaL.G.RotaryHospital,Vapi
41 years
OPD patient/ year: 45,000- 50,000
IPD patient/year:10,000-12,000
• Shree Sardar Vallabh Bhai Patel Rotary General Hospital,
Ankleshwar
Serves 2 lakh people in Ankleshwar belt
Projects of national interest
• UPLSchoolSanitationProject
3 years
7105 students and 3000 commuters/day
• GlobalParliProject
2 years
15 villages
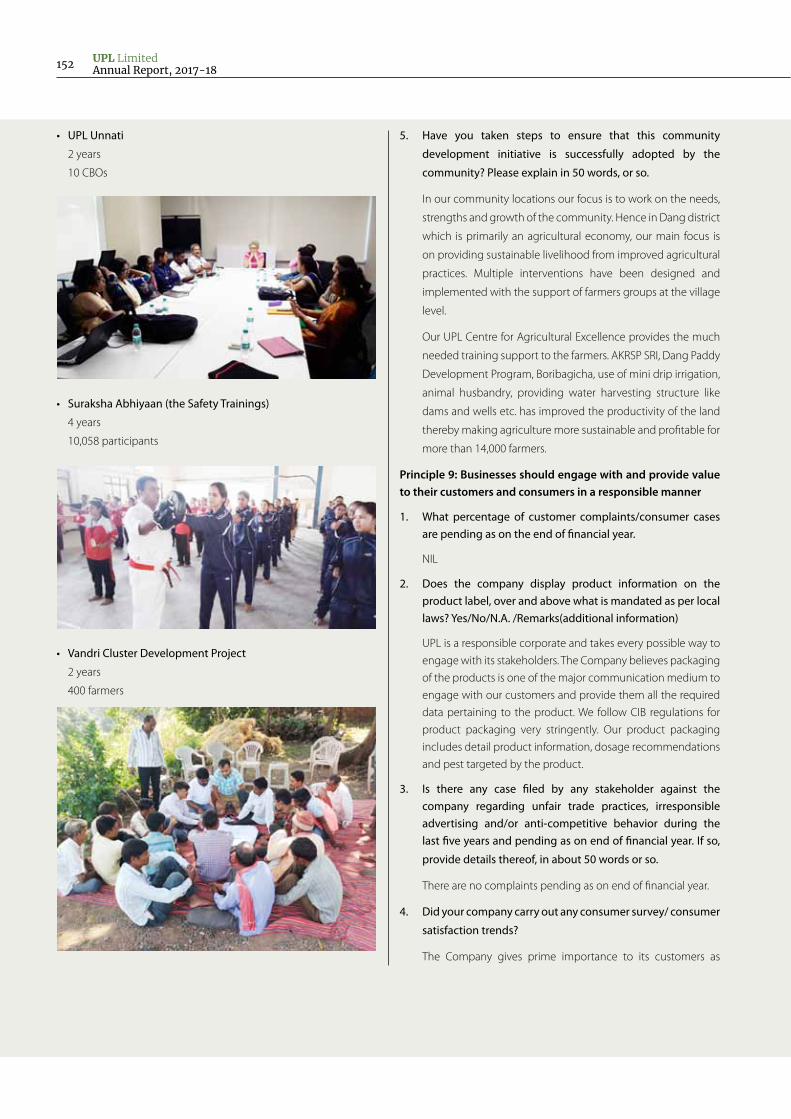
UPL Limited Annual Report, 2017-18 152
• UPLUnnati
2 years
10 CBOs
• SurakshaAbhiyaan(theSafetyTrainings)
4 years
10,058 participants
• VandriClusterDevelopmentProject
2 years
400 farmers
5. Have you taken steps to ensure that this community
development initiative is successfully adopted by the
community? Please explain in 50 words, or so.
In our community locations our focus is to work on the needs,
strengths and growth of the community. Hence in Dang district
which is primarily an agricultural economy, our main focus is
on providing sustainable livelihood from improved agricultural
practices. Multiple interventions have been designed and
implemented with the support of farmers groups at the village
level.
Our UPL Centre for Agricultural Excellence provides the much
needed training support to the farmers. AKRSP SRI, Dang Paddy
Development Program, Boribagicha, use of mini drip irrigation,
animal husbandry, providing water harvesting structure like
dams and wells etc. has improved the productivity of the land
thereby making agriculture more sustainable and profitable for
more than 14,000 farmers.
Principle 9: Businesses should engage with and provide value to their customers and consumers in a responsible manner
1. What percentage of customer complaints/consumer cases are pending as on the end of financial year.
NIL
2. Does the company display product information on the product label, over and above what is mandated as per local laws? Yes/No/N.A. /Remarks(additional information)
UPL is a responsible corporate and takes every possible way to
engage with its stakeholders. The Company believes packaging
of the products is one of the major communication medium to
engage with our customers and provide them all the required
data pertaining to the product. We follow CIB regulations for
product packaging very stringently. Our product packaging
includes detail product information, dosage recommendations
and pest targeted by the product.
3. Is there any case filed by any stakeholder against the company regarding unfair trade practices, irresponsible advertising and/or anti-competitive behavior during the last five years and pending as on end of financial year. If so,
provide details thereof, in about 50 words or so.
There are no complaints pending as on end of financial year.
4. Did your company carry out any consumer survey/ consumer
satisfaction trends?
The Company gives prime importance to its customers as

Overview
Strategyreview Performance Governance Financials
153
they are the stakeholders who uses our products and they can
contribute maximum in products development. UPL performs
post – marketing audits for its specific products, this category
of audit not only acts as a parameter to enhance customer
satisfaction level but also helps company to serve better by
understanding the need to consumer to serve.
The Company has its call centers at various locations in India
like Mumbai, Visakhapatnam and Chandigarh under the brand
of "Adarsh Kisan Center"(AKC). Our customers can connect
with us through a toll free number provided on all product
packaging, they can lodge a complaint against any of our
products or services as well. All the queries and complaints
from customers are taken on priority and resolved. In case if
a customer requires further assistance, the case is escalated
to the field executive team of UPL, a person from our field
team visits the location and resolves the issue personally. We
use our call centers to take feedback from registered farmers
at AKC, this scope of survey is broad which includes product
availability, usage and market access of harvest.
The Company uses AKC as a feedback tool to perform feedback
surveys for registered customers. The survey is based on various
parameters such as availability product in market, usage of the
product, market access of harvest and others. These surveys
helps the Company to identify the gaps in our systems and
resolve them on priority.

UPL Limited Annual Report, 2017-18 154
Stat
emen
t con
tain
ing
salie
nt fe
atur
es o
f the
fina
ncia
l sta
tem
ent o
f sub
sidia
ries
(Pur
suan
t to
first
pro
viso
to s
ub-s
ectio
n (3
) of s
ectio
n 12
9 re
ad w
ith ru
le 5
of C
ompa
nies
(Acc
ount
s) R
ules
, 201
4)
Amou
nt in
cro
res (
H)
S.
No.
Nam
e of
Sub
sidi
ary
Repo
rtin
g pe
riod
for t
he s
ubsi
diar
y co
ncer
ned,
if
diffe
rent
from
th
e ho
ldin
g co
mpa
ny’s
repo
rtin
g pe
riod
Repo
rtin
g cu
rren
cy
Exch
ange
ra
te
(Clo
sing
Ra
te)
Shar
e ca
pita
l Re
serv
es
& s
urpl
usTo
tal a
sset
sTo
tal
Liab
ilitie
s
Inve
stm
ents
(e
xclu
ding
in
vest
men
ts
mad
e in
su
bsid
iarie
s)
Turn
over
Profi
t be
fore
ta
xatio
n
Prov
isio
n fo
r tax
atio
nPr
ofit a
fter
ta
xatio
nPr
opos
ed
Div
iden
d%
of
shar
ehol
ding
1Sh
roffs
Uni
ted
Che
mic
als
Lim
ited
INR
1.0
0 0
0
0
0
-
0
0
(0)
0
- 10
0%
2SW
AL
Corp
orat
ion
Lim
ited
INR
1.0
0 1
9
5 4
38
342
0
6
66
44
(15)
29
- 10
0%
3U
nite
d Ph
osph
orus
(Ind
ia) L
LPIN
R 1
.00
2
14
364
3
48
- 6
69
10
(3)
6
- 10
0%
4U
nite
d Ph
osph
orus
Glo
bal L
LPIN
R 1
.00
0
0
0
0
- -
0
(0)
0
- 10
0%
5O
ptim
a Fa
rm S
olut
ions
Lim
ited
INR
1.0
0 2
2
6 1
58
130
-
174
3
0 (9
) 2
1 -
100%
6U
PL E
urop
e Li
mite
dEU
R 8
0.81
5
61
253
8
50
37
- 8
66
67
(9)
58
- 10
0%
7U
PL D
euts
chla
nd G
mbH
EUR
80.
81
0
21
238
2
17
- 3
31
10
(1)
9
- 10
0%
8U
PL P
olsk
a Sp
z.o
.o.
PLN
19.
21
0
(0)
0
0
- -
(0)
- (0
) -
100%
9U
PL B
enel
ux B
.V.
EUR
80.
81
0
97
208
1
11
- 3
36
23
(6)
17
- 10
0%
10Ce
rexa
gri B
.V.
EUR
80.
81
183
8
8 7
78
507
-
975
2
7 (6
) 2
1 -
100%
11Bl
ue S
tar B
.V.
EUR
80.
81
0
20
20
0
- 3
(0
) -
(0)
- 10
0%
12U
nite
d Ph
osph
orus
Hol
ding
s
Coop
erat
ief U
.A.
EUR
80.
81
2,9
42
7
3,0
07
57
- 5
(2
) 1
(1
) -
100%
13U
nite
d Ph
osph
orus
Hol
ding
s B.
V.EU
R 8
0.81
0
3
,022
6
,158
3
,156
2
1 5
(1
) 1
(1
) -
100%
14D
ecco
Wor
ldw
ide
Post
-Har
vest
Hol
ding
s Co
oper
atie
f U.A
.
EUR
80.
81
30
(0)
30
1
- 3
(0
) -
(0)
- 10
0%
15D
ecco
Wor
ldw
ide
Post
-Har
vest
Hol
ding
s B.
V.
EUR
80.
81
0
43
159
1
16
- 3
2
-
2
- 10
0%
16U
nite
d Ph
osph
orus
Hol
ding
, Bra
zil
B.V.
EUR
80.
81
0
2,3
99
2,6
18
322
1
02
5
(19)
1
(18)
- 10
0%
17U
PL It
alia
S.R
.L.
EUR
80.
81
1
51
355
3
04
- 3
29
14
(6)
8
- 10
0%
18U
PL Ib
eria
, S.A
. EU
R 8
0.81
2
6
5 1
25
58
0
145
7
(2
) 5
-
100%
19D
ecco
Iber
ica
Post
cose
cha,
S.A
.U.
EUR
80.
81
1
89
116
2
5 -
117
1
5 (2
) 1
4 -
100%
20Tr
anst
erra
Inve
st, S
. L. U
.EU
R 8
0.81
7
0 (6
) 4
80
416
-
- (6
5) (0
) (6
5) -
100%
21Ce
rexa
gri S
.A.S
.EU
R 8
0.81
1
07
227
4
78
144
-
451
2
7 2
5 5
2 -
100%
22N
eo-F
og S
.A.
EUR
80.
81
2
18
28
8
- 3
8 6
(2
) 4
-
100%
23U
PL F
ranc
e EU
R 8
0.81
2
8 6
5 2
75
181
-
403
3
2 (1
3) 2
0 -
100%
24U
nite
d Ph
osph
orus
Sw
itzer
land
Lim
ited
CH
F 6
8.52
1
0
1
0
-
- 0
(0
) 0
-
100%
25A
grod
an, A
pSD
KK 1
0.85
3
5
8
0
-
- 0
(0
) 0
-
100%

Overview
Strategyreview Performance Governance Financials
155Am
ount
in c
rore
s (H
)
S.
No.
Nam
e of
Sub
sidi
ary
Repo
rtin
g pe
riod
for t
he s
ubsi
diar
y co
ncer
ned,
if
diffe
rent
from
th
e ho
ldin
g co
mpa
ny’s
repo
rtin
g pe
riod
Repo
rtin
g cu
rren
cy
Exch
ange
ra
te
(Clo
sing
Ra
te)
Shar
e ca
pita
l Re
serv
es
& s
urpl
usTo
tal a
sset
sTo
tal
Liab
ilitie
s
Inve
stm
ents
(e
xclu
ding
in
vest
men
ts
mad
e in
su
bsid
iarie
s)
Turn
over
Profi
t be
fore
ta
xatio
n
Prov
isio
n fo
r tax
atio
nPr
ofit a
fter
ta
xatio
nPr
opos
ed
Div
iden
d%
of
shar
ehol
ding
26D
ecco
Ital
ia S
RLEU
R 8
0.81
8
4
1 6
8 1
9 -
43
5
(1)
4
- 10
0%
27Li
mite
d Li
abili
ty C
ompa
ny "U
PL"
RUB
1.1
3 2
0 (9
) 3
5 2
4 -
28
2
(0)
2
- 10
0%
28D
ecco
Por
tuga
l Pos
t Har
vest
,
Uni
pess
oal L
DA
(for
mer
ly k
now
n as
UPL
Por
tuga
l Uni
pess
oal L
DA
)
EUR
80.
81
0
(0)
0
0
- 1
0
(0
) 0
-
100%
29U
nite
d Ph
osph
orus
Inc.
(Ref
er
Not
e 1)
USD
65.
18
0
48
2,1
18
2,0
77
7
2,8
83
55
(52)
3
- 10
0%
30U
PI F
inan
ce L
LC (R
efer
Not
e 1)
USD
65.
18
- -
- -
- -
- -
- -
100%
31Ce
rexa
gri,
Inc.
(PA
) (Re
fer N
ote
1)U
SD 6
5.18
-
- -
- -
- -
- -
- 10
0%
32U
PL D
elaw
are,
Inc.
(Ref
er N
ote
1)U
SD 6
5.18
-
- -
- -
- -
- -
- 10
0%
33Ca
negr
ass
LLC
(Ref
er N
ote
1)U
SD 6
5.18
-
- -
- -
- -
- -
- 70
%
34D
ecco
US
Post
-Har
vest
Inc
(Ref
er
Not
e 2)
USD
65.
18
0
77
169
9
2 -
247
8
(5
) 2
-
100%
35Es
sent
iv L
CC (R
efer
Not
e 2)
USD
65.
18
- -
- -
- -
- -
- -
50%
36Ri
ceCo
LLC
(Ref
er N
ote
1)U
SD 6
5.18
3
7 6
1 2
98
201
-
242
1
1 -
11
- 10
0%
37Ri
ceco
Inte
rnat
iona
l, In
c.U
SD 6
5.18
0
2
30
300
7
0 -
249
2
9 -
29
- 10
0%
38U
PL C
orpo
ratio
n Li
mite
d (R
efer
Not
e: 9
)
USD
65.
18
89
2,1
77
10,
846
8,6
13
33
2,3
86
197
(8
) 1
89
- 10
0%
39U
PL L
imite
d (R
efer
Not
e: 9
)U
SD 6
5.18
-
- -
- -
960
3
06
- 3
06
- 10
0%
40U
PL M
anag
emen
t DM
CCU
SD 6
5.18
0
1
23
143
2
1 -
96
26
- 2
6 -
100%
41U
PL L
imite
d, G
ibra
ltor
USD
65.
18
0
2,3
41
3,4
91
1,1
50
- 2
,969
2
99
- 2
99
- 10
0%
42U
PL A
gro
S.A
. de
C.V
.M
XN 3
.55
53
(34)
368
3
49
- 4
36
(3)
(1)
(4)
- 10
0%
43D
ecco
Jifk
ins
Mex
ico
Sapi
MXN
3.5
5 0
(8
) 8
1
6 -
9
(2)
- (2
) -
100%
44Pe
rrey
Par
ticip
açõe
s S.
A (
Not
e 3
and
4)
BRL
19.
61
- -
- -
- -
- -
- -
100%
45U
nite
d Ph
osph
orus
do
Bras
il Lt
da
(Not
e 5)
BRL
19.
61
- -
- -
- -
- -
- -
100%
46U
niph
os In
dust
ria e
Com
erci
o de
Prod
utos
Qui
mic
os L
tda.
(Not
e 3
and
4)
BRL
19.
61
2,1
08
(693
) 3
,765
2
,465
1
16
3,5
94
64
(25)
39
- 10
0%
47U
pl d
o Br
asil
Indu
stria
e C
omér
cio
de In
sum
os A
grop
ecuá
rios
S.A
.
(Not
e 3
and
4)
BRL
19.
61
633
5
44
3,4
39
2,4
65
204
3
,594
5
2 (2
4) 2
8 -
100%
48U
PL C
osta
Ric
a S.
A.
CRC
0.1
1 0
(1
5) 2
12
226
0
3
30
(10)
- (1
0) -
100%
49U
PL B
oliv
ia S
.R.L
BO
B 9
.43
4
(3)
74
73
- 3
7 5
-
5
- 10
0%

UPL Limited Annual Report, 2017-18 156
Amou
nt in
cro
res (
H)
S.
No.
Nam
e of
Sub
sidi
ary
Repo
rtin
g pe
riod
for t
he s
ubsi
diar
y co
ncer
ned,
if
diffe
rent
from
th
e ho
ldin
g co
mpa
ny’s
repo
rtin
g pe
riod
Repo
rtin
g cu
rren
cy
Exch
ange
ra
te
(Clo
sing
Ra
te)
Shar
e ca
pita
l Re
serv
es
& s
urpl
usTo
tal a
sset
sTo
tal
Liab
ilitie
s
Inve
stm
ents
(e
xclu
ding
in
vest
men
ts
mad
e in
su
bsid
iarie
s)
Turn
over
Profi
t be
fore
ta
xatio
n
Prov
isio
n fo
r tax
atio
nPr
ofit a
fter
ta
xatio
nPr
opos
ed
Div
iden
d%
of
shar
ehol
ding
50U
PL P
arag
uay
S.A
.PY
G 0
.01
5
(9)
51
56
- 2
9 (5
) -
(5)
- 10
0%
51Ic
ona
Sanl
uis
S.A
.U
SD 6
5.18
2
(1
9) 1
7 3
3 -
- (4
) (1
) (5
) -
100%
52D
VA T
echn
olog
y A
rgen
tina
S.A
.
(Not
e 3
and
4)
BRL
19.
61
- -
- -
- -
- -
- -
100%
53U
PL A
rgen
tina
S A
U
SD 6
5.18
1
97
(208
) 5
23
533
-
393
(9
0) -
(90)
- 10
0%
54D
ecco
Chi
le S
pAC
LP 0
.11
0
12
26
14
- 4
4 8
(2
) 6
-
100%
55U
PL C
olom
bia
SAS
COP
23.
40
1(5
)11
011
4 -
143
(10)
2(8
) -
100%
56U
nite
d Ph
osph
orus
Cay
man
Lim
ited
USD
65.
18
- 6
7 5
66
499
-
300
8
1
9
-
100%
57U
P A
viat
ion
Lim
ited
USD
65.
18
0
8
39
32
- -
4
- 4
-
100%
58U
PL A
ustr
alia
Lim
ited
AUD
50.
05
1
36
100
6
4 -
143
1
0 (3
) 8
-
100%
59U
PL N
ew Z
eala
nd L
imite
d N
ZD 4
7.30
0
3
3
0
-
7
1
(0)
0
- 10
0%
60U
PL S
hang
hai L
imite
d (R
efer
Not
e: 6
)
RMB
10.
36
- -
- -
- -
- -
- -
100%
61U
PL Ji
angs
u Li
mite
d (R
efer
Not
e:
6 &
8)
RMB
10.
36
- -
- -
- -
- -
- -
70%
62U
PL L
imite
d (K
orea
) KR
W 0
.06
0
2
7
5
- 3
1
(0
) 1
-
100%
63PT
.UPL
Indo
nesi
a ID
R 4
.74
05
7570
- 87
6(2
)4
- 10
0%
64PT
Cat
ur A
grod
aya
Man
diri
IDR
4.7
4 1
(13)
5466
- 49
(2)
0(2
) -
100%
65U
PL L
imite
d (R
efer
Not
e: 6
)U
SD 6
5.18
0
2
14
564
3
49
- 5
55
21
- 2
1 -
100%
66U
PL P
hilip
pine
s In
c.PH
P 1
.25
1
4
124
1
18
- 9
3 1
(0
) 1
-
100%
67U
PL V
ietn
am C
o. L
imite
d VN
D 2
.86
477
152
71 -
185
27(4
)22
- 10
0%
68U
PL L
imite
d, Ja
pan
JPY
61.
52
699
7362
9419
63
(1)
1 -
100%
69A
nnin
g D
ecco
Fin
e C
hem
ical
Co.
Lim
ited
RMB
10.
36
8
18
28
2
- 2
3 0
(0
) 0
-
55%
70U
PL Z
iraat
Ve
Kim
ya S
anay
i Ve
Tica
ret L
imite
d Si
rket
i
TRY
16.
31
16
(7)
279
2
71
- 1
57
(20)
5
(16)
- 10
0%
71U
PL A
grom
ed T
arim
Ilac
lari
ve
Tohu
mcu
luk
Sana
yi v
e Ti
care
t A.S
.
TRY
16.
31
14
6
146
1
26
- 1
10
(4)
1
(4)
- 10
0%
72Sa
fepa
ck P
rodu
cts
Lim
ited
ILS
18.
64
- 4
2 6
9 2
7 -
36
(4)
1
(3)
- 10
0%
73C
itras
hine
(Pty
) Ltd
ZAR
5.5
8 0
(6
) 2
7 3
2 -
32
(1)
(0)
(1)
- 10
0%
74U
PL A
frica
SA
RL
XOF
0.1
2 0
(0
) -
0
- -
0
- 0
-
100%
75Pr
olon
g Li
mite
dIL
S 1
8.64
-
1
2
2
- 1
(2
) -
(2)
- 10
0%
76A
grin
et S
olut
ions
Lim
ited
INR
1.0
0 2
1
1
0
2
-
(0)
- (0
) -
50%

Overview
Strategyreview Performance Governance Financials
157Am
ount
in c
rore
s (H
)
S.
No.
Nam
e of
Sub
sidi
ary
Repo
rtin
g pe
riod
for t
he s
ubsi
diar
y co
ncer
ned,
if
diffe
rent
from
th
e ho
ldin
g co
mpa
ny’s
repo
rtin
g pe
riod
Repo
rtin
g cu
rren
cy
Exch
ange
ra
te
(Clo
sing
Ra
te)
Shar
e ca
pita
l Re
serv
es
& s
urpl
usTo
tal a
sset
sTo
tal
Liab
ilitie
s
Inve
stm
ents
(e
xclu
ding
in
vest
men
ts
mad
e in
su
bsid
iarie
s)
Turn
over
Profi
t be
fore
ta
xatio
n
Prov
isio
n fo
r tax
atio
nPr
ofit a
fter
ta
xatio
nPr
opos
ed
Div
iden
d%
of
shar
ehol
ding
77A
dvan
ta H
oldi
ngs
B.V.
EUR
80.
81
498
3
96
2,0
32
1,1
38
- -
(17)
- (1
7) -
100%
78A
dvan
ta N
ethe
rland
s H
oldi
ng B
.V.
EUR
80.
81
0
369
4
28
59
- 3
2 (6
) -
(6)
- 10
0%
79A
dvan
ta U
S LL
C (f
orm
erly
kno
wn
as
Adv
anta
U.S
. Inc
.) (R
efer
Not
e 1)
USD
65.
18
233
(1
58)
363
2
89
- 1
37
(57)
(48)
(105
) -
100%
80A
dvan
ta S
eeds
Inte
rnat
iona
lU
SD 6
5.18
1
4 5
78
1,3
14
721
-
697
7
5 (2
) 7
3 -
100%
81A
dvan
ta S
eeds
DM
CC
AED
17.
74
1
150
2
15
65
- 3
4 (9
) -
(9)
- 10
0%
82A
dvan
ta C
omer
cio
De
Sem
ente
s
LTD
A.
BRL
19.
61
223
(2
32)
181
5
03
312
8
9 (9
2) 6
(8
5) -
100%
83A
dvan
ta S
emill
as S
AIC
ARS
3.2
3 1
28
(114
) 1
67
153
-
193
(3
7) 2
(3
5) -
100%
84A
dvan
ta S
eeds
Pty
Ltd
AU
D 5
0.05
2
5 2
08
360
1
68
42
253
2
3 (7
) 1
6 -
100%
85Pa
cific
See
ds (T
hai)
Lim
ited
THB
2.0
9 1
3 2
60
439
1
66
- 3
60
110
(2
1) 8
9 -
100%
86Pa
cific
See
ds H
oldi
ngs
(Tha
iland
)
Lim
ited
THB
2.0
9 0
1
49
149
0
-
- (0
) -
(0)
- 10
0%
87PT
Adv
anta
See
ds In
done
sia
IDR
4.7
4 5
(23)
4462
- 70
16(4
)12
- 10
0%
88A
dvan
ta S
eeds
Ukr
aine
LLC
UA
H 2
.46
0
(0)
0
0
- -
0
- 0
-
100%
89U
PL A
gro
Lim
ited
Mau
ritiu
s (R
efer
Not
e: 7
)
USD
65.
18
0
271
1
,320
1
,049
-
1,7
44
271
-
271
-
100%
90Ri
ceco
Inte
rnat
iona
l Ban
glad
esh
Ltd
(Ref
er N
ote:
7)
BDT
0.7
8 0
0
4
4
-
3
1
(0)
0
- 10
0%
91U
niph
os M
alay
sia
Sdn
Bhd
(Ref
er
Not
e: 7
)
MYR
16.
88
0
(0)
2
2
- -
0
- 0
-
100%

UPL Limited Annual Report, 2017-18 158
Details of Investments of subsidiary companies:
S.
No.
Name of SubsidiaryINR Crs
1 200 [March 2017: 200] Equity shares fully paid up in Hodogaya UPL Co. Ltd 21
2 5,675 [March 2017: 4,000] Equity Shares fully paid-up in 3SB Produtos Agricolas SA [includes goodwill of H 73
Crores [March 2017 H 64 Crores]
102
3 Equity shares in Amira Nature foods Limited 33
4 201,834,849 [March 31, 2017: Nil] Non-convertible Debentures of BRL 1 each of IBI Brasil Empreendimentos E
Participacoes S.A.
424
5 103,016,215 [March 2017:Nil] Equity shares of H 1 each, fully paid-up in Serra Bonita Sementes S.A.[includes
goodwill of H (14) Crores [March 2017 H Nil]
208
6 11,700,000 [March 2017: 11,700,000 Equity shares fully paid up in Ishihara Sangyo Kaisha Ltd. 94
7 415 [March 2017: 415] Optionally convertible Debentures of H 50,000 each of Bloom Packaging Pvt. Ltd. 2
8 88,223 [March 2017: 88,223] Equity shares of H 1 AUD each fully paid-up in Longreach Plant Breeders
Management Private Limited [includes goodwill of H 18 Crores, [March 2017: H 18 Crores]
42
9 Investment in task force 7
Grand Total 933
Notes:
1 United Phosphorus Inc., U.S.A. results include the results of UPL Delaware, Inc., Cerexagri Inc; Canegrass LLC, Riceco LLC, UPI Finance LLC,
& Advanta US LLC (formerly known as Advanta U.S. Inc.)
2 Decco US Post-Harvest Inc results include the results of Essentiv LCC.
3 Uniphos Industria e Comercio de Produtos Quimicos Ltda. results include the results of UPL do Brasil Industria e Comércio de Insumos
Agropecuários S.A., DVA Technology Argentina and Perry Participiacoes
4 UPL do Brasil Industria e Comércio de Insumos Agropecuários S.A.results include the result DVA Technology Argentina.
5 During the previous year, United Phosphorus do Brasil Ltda was merged with UPL Do Brasil Industria e Comercio de Insumos Agropecuarios
S.A.
6 United Phosphorus Limited, Hongkong results includes the results of United Phosphorus (Shanghai) Company Limited and UPL Jiangsu
Limited.
7 UPL Agro Limited, Riceco Bangladesh and Uniphos Malaysia Sdn Bhd have been acquired during the year.
8 UPL Jiangsu Limited has been formed during the year.
9 UPL Mauritius got merged with UPL Corporation during the year.
10 Exchange rate in INR is per thousand of COP, IDR & VND and for JPY Exchange rate in INR is per hundred.

Overview
Strategyreview Performance Governance Financials
159ST
ATEM
ENT
PURS
UA
NT
TO S
ECTI
ON
129
(3) O
F TH
E CO
MPA
NIE
S AC
T 20
13
RELA
TED
TO
ASS
OCI
ATE
COM
PAN
IES
AN
D JO
INT
VEN
TURE
(Pur
suan
t to
first
pro
viso
to s
ub-s
ectio
n (3
) of s
ectio
n 12
9 re
ad w
ith ru
le 5
of C
ompa
nies
(Acc
ount
s) R
ules
, 201
4)
C In
. Cro
res
S.
No.
Nam
es o
f Ass
ocia
te a
nd Jo
int
vent
ure
Wea
ther
Ris
k M
anag
emen
t Pv
t LTD
Kera
la E
nviro
In
fras
truc
ture
Li
mite
d
Sina
gro
Prod
utos
Ag
rope
cuár
ios
S.A
.
3SB
Prod
utos
Ag
rícol
as S
.A.
Serr
a Bo
nita
Se
men
tes
S.A
.Po
lyco
tLo
ngRe
ach
Plan
t Br
eede
rs P
TY L
tdH
odog
aya
UPL
Co.
Lt
d.
1La
st A
udite
d/Re
view
ed B
alan
ce s
heet
date
31.0
3.20
1831
.03.
2018
31.1
2.20
1731
.12.
2017
31.1
2.20
1731
.12.
2017
31.0
3.20
1831
.03.
2018
2D
ate
on w
hich
the
Ass
ocia
te o
r Joi
nt
Vent
ure
was
ass
ocia
ted
or a
cqui
red
3Sh
ares
of A
ssoc
iate
s/Jo
int v
entu
res
held
by
the
Com
pany
for t
he y
ear e
nd
No.
37,
681
33,
50,0
00
8,7
2,98
,237
5
,765
1
0,30
,16,
215
200
88,
223
200
Am
ount
of I
nves
tmen
t in
Ass
ocia
te/
Join
t ven
ture
10
3
- 1
02
208
-
42
21
Exte
nd o
f Hol
ding
%27
%28
%49
%49
%33
%20
%70
%40
%
4D
escr
iptio
n of
how
ther
e is
sig
nific
ant
influ
ence
By H
oldi
ng
Equa
l to
mor
e
than
20%
shar
es
By H
oldi
ng
Equa
l to
mor
e
than
20%
shar
es
By H
oldi
ng
Equa
l to
mor
e
than
20%
shar
es
By H
oldi
ng
Equa
l to
mor
e
than
20%
shar
es
By H
oldi
ng
Equa
l to
mor
e
than
20%
shar
es
By H
oldi
ng
Equa
l to
mor
e
than
20%
shar
es
By H
oldi
ng E
qual
to m
ore
than
20%
shar
es a
nd a
s Jo
int
vent
ure
Agr
eem
ent
By H
oldi
ng E
qual
to m
ore
than
20%
shar
es a
nd a
s Jo
int
vent
ure
Agr
eem
ent
5Re
ason
why
to a
ssoc
iate
/join
t ven
ture
is n
ot c
onso
lidat
ed
NA
NA
NA
NA
NA
NA
NA
NA
6N
etw
orth
att
ribut
able
to s
hare
hold
ing
as p
er la
test
Aud
ited/
Revi
ewed
Bal
ance
she
et
7
3
(93)
29
221
-
24
21
7Pr
ofit/
(Los
s) f
or th
e ye
ar
iCo
nsid
ered
in c
onso
lidat
ion
(0)
1
(103
) (4
) 1
-
11
1
iiN
ot c
onsi
dere
d in
con
solid
atio
n
Not
e 1
Serr
a Bo
nita
Sem
ente
s S.
A. w
as a
cqui
red
durin
g th
e ye
ar e
nded
31
Mar
ch 2
018

UPL Limited Annual Report, 2017-18 160
Report on the Audit of the Standalone Ind AS Financial StatementsWe have audited the accompanying Standalone Ind AS financial
statements of UPL Limited (“the Company”), which comprise the
Balance Sheet as at 31 March 2018, the Statement of Profit and
Loss (including Other Comprehensive Income), the Statement
of Changes in Equity and Statement of Cash Flows for the year
then ended, and a summary of the significant accounting policies
and other explanatory information (herein after referred to as
“Standalone Ind AS financial statements”).
Management’s Responsibility for the Standalone Ind AS Financial StatementsThe Company’s Board of Directors is responsible for the matters
stated in Section 134(5) of the Companies Act, 2013 (“the Act”)
with respect to the preparation of these Standalone Ind AS
financial statements that give a true and fair view of the state of
affairs, profit (including other comprehensive income), changes
in equity and cash flows of the Company in accordance with the
accounting principles generally accepted in India, including the
Indian Accounting Standards (Ind AS) prescribed under section 133
of the Act.
This responsibility also includes maintenance of adequate
accounting records in accordance with the provisions of the Act
for safeguarding the assets of the Company and for preventing and
detecting frauds and other irregularities; selection and application of
appropriate accounting policies; making judgments and estimates
that are reasonable and prudent; and design, implementation and
maintenance of adequate internal financial controls, that were
operating effectively for ensuring the accuracy and completeness of
the accounting records, relevant to the preparation and presentation
of the Standalone Ind AS financial statements that give a true and
fair view and are free from material misstatement, whether due to
fraud or error.
In preparing the Standalone Ind AS financial statements,
management is responsible for assessing the Company’s ability
to continue as a going concern, disclosing, as applicable, matters
related to going concern and using the going concern basis of
accounting unless management either intends to liquidate the
Company or to cease operations, or has no realistic alternative but
to do so.
Auditors’ ResponsibilityOur responsibility is to express an opinion on these Standalone Ind
AS financial statements based on our audit.
We have taken into account the provisions of the Act, the
accounting and auditing standards and matters which are required
to be included in the audit report under the provisions of the Act
and the Rules made thereunder.
We conducted our audit of the Standalone Ind AS financial
statements in accordance with the Standards on Auditing specified
under Section 143(10) of the Act. Those Standards require that we
comply with ethical requirements and plan and perform the audit
to obtain reasonable assurance about whether the Standalone Ind
AS financial statements are free from material misstatement.
An audit involves performing procedures to obtain audit evidence
about the amounts and the disclosures in the standalone Ind AS
financial statements. The procedures selected depend on the
auditor's judgment, including the assessment of the risks of material
misstatement of the standalone Ind AS financial statements, whether
due to fraud or error. In making those risk assessments, the auditor
considers internal financial control relevant to the Company's
preparation of the standalone Ind AS financial statements that
give a true and fair view in order to design audit procedures that
are appropriate in the circumstances. An audit also includes
evaluating the appropriateness of the accounting policies used
and the reasonableness of the accounting estimates made by the
Company's Directors, as well as evaluating the overall presentation
of the standalone Ind AS financial statements.
We are also responsible to conclude on the appropriateness of
management’s use of the going concern basis of accounting
and, based on the audit evidence obtained, whether a material
uncertainty exists related to events or conditions that may cast
significant doubt on the entity’s ability to continue as a going
concern. If we conclude that a material uncertainty exists, we are
required to draw attention in the auditor’s report to the related
disclosures in the financial statements or, if such disclosures are
inadequate, to modify the opinion. Our conclusions are based on
the audit evidence obtained up to the date of the auditor’s report.
However, future events or conditions may cause an entity to cease
to continue as a going concern.
We believe that the audit evidence we have obtained is sufficient
and appropriate to provide a basis for our audit opinion on the
Standalone Ind AS financial statements.
OpinionIn our opinion and to the best of our information and according
to the explanations given to us, the aforesaid Standalone Ind AS
financial statements give the information required by the Act in the
manner so required and give a true and fair view in conformity with
the accounting principles generally accepted in India, of the state
of affairs of the Company as at 31 March 2018, its profits (including
other comprehensive income), changes in equity and its cash flows
for the year ended on that date.
Emphasis of matterWe draw attention to Note 45 of the standalone Ind AS financial
To the Members of UPL Limited
Independent Auditors’ Report

Overview
Strategyreview Performance Governance Financials
161
statements, relating to the accounting treatment of goodwill
aggregating H3,697 crores arising on amalgamation of erstwhile
Advanta Limited with the Company accounted during the year
ended 31 March 2017 and amortization of the said goodwill arising
therefrom both of which are different from the treatment prescribed
under Indian Accounting Standard (Ind AS) 103 - 'Business
Combinations' for business combination of entities under common
control. Had the accounting treatment prescribed under Ind AS 103
been followed, profit after tax reported for the year ended 31 March
2018 would have been higher by H370 crores. Our opinion is not
modified in respect of this matter.
Other MattersThe audited Standalone Ind AS financial statements of the Company
for the corresponding year ended 31 March 2017 prepared in
accordance with Ind AS included in these standalone Ind AS
financial statements, have been audited by the predecessor auditors
whose audit report dated 28 April 2017 expressed an unmodified
opinion on those audited Standalone Ind AS financial statements.
Our opinion is not modified in respect of this matter.
Report on Other Legal and Regulatory RequirementsAs required by the Companies (Auditor’s Report) Order, 2016 (‘the
Order’), issued by the Central Government of India in terms of
Section 143(11) of the Act, we give in the “Annexure A”, a statement
on the matters specified in the paragraphs 3 and 4 of the Order.
As required by Section 143 (3) of the Act, we report that:
(a) we have sought and obtained all the information and
explanations which to the best of our knowledge and belief
were necessary for the purposes of our audit;
(b) in our opinion, proper books of account as required by law
have been kept by the Company so far as it appears from our
examination of those books;
(c) the Balance Sheet, the Statement of Profit and Loss (including
other comprehensive income), the Statement of Cash Flows
and Statement of Changes in Equity dealt with by this Report
are in agreement with the books of account;
(d) in our opinion, the aforesaid Standalone Ind AS financial
statements comply with the Indian Accounting Standards
prescribed under section 133 of the Act;
(e) on the basis of the written representations received from the
directors as on 31 March 2018 taken on record by the Board of
Directors, none of the directors are disqualified as on 31 March
2018 from being appointed as a director in terms of Section
164(2) of the Act;
(f ) With respect to the adequacy of the internal financial controls
with reference to financial statements of the Company and the
operating effectiveness of such controls, refer to our separate
Report in “Annexure B”; and
(g) With respect to the other matters to be included in the
Auditor's Report in accordance with Rule 11 of the Companies
(Audit and Auditors) Rules, 2014, in our opinion and to the best
of our information and according to the explanations given to
us:
(i) The Company has disclosed the impact of pending
litigations on its financial position in its Standalone Ind AS
financial statements; - Refer Note 35(c) to the Standalone
Ind AS financial statements;
(ii) The Company has made provision, as required under the
applicable law or accounting standards, for material
foreseeable losses, if any, on long-term contracts including
derivative contracts;- Refer Note 15 to the Standalone Ind
AS financial statements.
(iii) There has been no delay in transferring amounts, required
to be transferred, to the Investor Education and Protection
Fund by the Company; and
(iv) The disclosures regarding details of specified bank notes
held and transacted during 8 November 2016 to 30
December 2016 has not been made since the requirement
does not pertain to financial year ended 31 March 2018.
Corresponding amounts as appearing in the audited
Standalone Ind AS financial statements for the year ended
31 March 2017 have been disclosed;- Refer Note 48 to the
Standalone Ind AS financial statements.
For B S R & Co. LLPChartered Accountants
Firm’s Registration No: 101248W/W-100022
Bhavesh DhupeliaPlace : Mumbai Partner
Date: 27 April 2018 Membership No: 042070

UPL Limited Annual Report, 2017-18 162
(i) (a) The Company has maintained proper records showing full
particulars, including quantitative details and situation of
fixed assets.
(b) The Company has a regular programme of physical
verification of its fixed assets by which all fixed assets are
verified in a phased manner over a period of three years.
In our opinion, this periodicity of physical verification is
reasonable having regard to the size of the Company and
the nature of its assets. Pursuant to the programme, certain
fixed assets were physically verified by the management
during the year. In our opinion, and according to the
information and explanations given to us, no material
discrepancies were noticed on such verification.
(c) In our opinion and according to the information and
explanations given to us by the management and on the
basis of an examination of the records of the Company,
the title deed of the immovable properties as disclosed in
Note 3 of the standalone Ind AS financial statements are
held in the name of the Company, except in the case of
leasehold land, freehold land and buildings with a carrying
value of H11 Crores, H2 Crores and H1 Crore (Gross block of
H11 Crores, H2 Crores and H1 Crore) as at 31 March 2018
respectively, wherein as explained to us, the Company is
in process of reconciling fixed assets register with the title
deeds and hence we are unable to comment on the same.
(ii) The inventory, except goods in transit and stocks lying with
third parties, has been physically verified by the management
at reasonable intervals during the year. In our opinion, the
frequency of such verification is reasonable. For stocks lying
with third parties at the year-end, written confirmations have
been obtained and in respect of goods-in-transit, subsequent
goods receipts have been verified or confirmations have
been obtained from the parties. The discrepancies noticed
on verification between the physical stocks and the book
records were not material and have been dealt with in books of
account.
(iii) The Company has granted unsecured loans to two companies
covered in the register maintained under Section 189 of the
Act. There are no firms/Limited Liability Partnership/other
parties covered in the register maintained under Section 189 of
the Act.
(a) In respect of the aforesaid loans, the terms and conditions
under which such loans were granted are not prejudicial
to the Company’s interest.
(b) In respect of one loan, the schedule of repayment of
principal and payment of interest has been stipulated, and
the party is repaying the principal amounts, as stipulated,
and is also regular in payment of interest as applicable. In
respect of an another loan, which is repayable on demand,
we are informed that the amount of interest and principal
demanded by the Company has been paid during the
year and thus, there has been no default on the part of the
parties to whom the money has been lent.
(c) There are no amount overdue for more than ninety days at
the balance sheet date
(iv) In our opinion and according to the information and
explanation given to us, the Company has complied with
provisions of Section 185 and 186 of the Act in respect of grant
of loans, making investments and providing guarantees, and
securities, as applicable.
(v) In our opinion, and according to the information and
explanations given to us, the Company has not accepted
any deposit from the public during the year in terms of the
provisions of Sections 73 to 76 or any other relevant provisions
of the Act and the rules framed thereunder. Accordingly,
reporting under clause 3(v) of the Order is not applicable to the
Company.
(vi) We have broadly reviewed the books of account maintained
by the Company as specified under Section 148(1) of the Act,
for maintenance of cost records in respect of the products
manufactured by the Company, and are of the opinion that
prima facie, the prescribed accounts and records have been
made and maintained. However, we have not, made a detailed
examination of cost records with a view to determine whether
they are accurate or complete.
(vii) (a) According to the information and explanations given to
us and on the basis of our examination of the records of
the Company, amounts deducted/accrued in the books of
account in respect of undisputed statutory dues including
Provident fund, Employees' State Insurance, Income-tax,
Sales-tax, Value added tax, Duty of excise, Service tax, Duty
of Excise, Goods and Service tax, Duty of customs, Cess
and other material statutory dues have generally been
regularly deposited during the year by the Company with
the appropriate authorities though there has been slight
delay in a few cases.
According to the information and explanations given
to us, no undisputed amounts payable in respect of
Provident fund, Employees' State Insurance, Income-tax,
Sales-tax, Duty of excise, Service tax, Goods and Service
tax, Duty of customs, Value added tax, Cess and other
material statutory dues were in arrears as at 31 March 2018
for a period of more than six months from the date they
became payable.
(Referred to in our report of even date)
Annexure A to the Independent Auditors’ Report – 31 March 2018

Overview
Strategyreview Performance Governance Financials
163
(b) According to the information and explanations given to us and based on our examination of the records of the Company, there are
no dues of Income-tax, Sales Tax, Service tax, Duty of customs, Excise duty and Value added tax as at 31 March 2018, which have not
been deposited with the appropriate authorities on account of any dispute, except as stated below:
Nature of the Statute Nature of dues Amount (in Crores)
Amount paid under protest
(in Crores)
Period to which
amounts relates
Forum where dispute is pending
Income tax Act, 1961 Income tax demands 5 - 1995-96, 1997-98 and
2004-05
Income-tax Appellate
Tribunal
Sales tax Act Sales tax demands 22 9 1985-86, 1995-96 to
2005-06
Supreme Court, Jt
Commissioner of Sales
tax, Sales tax Tribunal
Central Excise/Finance
Act
Excise duty/Service
tax demands
68 1 1989-90, 1994-2004 and
2007-2015
Commissioner (Appeals)
Central Excise and Service
tax Appellate Tribunal
Custom Act Custom duty
demands
34 - 1992 to 1997, 2000,
2001 and 2004
Commissioner (Appeals)
Central Excise and Service
tax Appellate Tribunal
Foreign Trade
(Development and
regulation) Act
Fiscal Penalty 33 - 1992 to 1997 Bombay High Court
(viii) In our opinion and according to the information and
explanations given to us, the Company has not defaulted in
repayment of loans or borrowings to financial institution, bank
or dues to debenture holders. The Company does not have any
loans or borrowings from the government during the year.
(ix) According to the information and explanations given to us,
the Company did not raise money by way of initial public offer
or further public offer (including debt instruments) and term
loans during the year. Accordingly, reporting under the clause
3(ix) of the Order is not applicable to the Company.
(x) To the best of our knowledge and according to the information
and explanations given to us, no fraud by the Company and
no fraud on the Company by its officers or employees has
been noticed or reported during the year nor have we been
informed of such case by the management.
(xi) According to the information and explanations given to us,
the managerial remuneration has been paid / provided in
accordance with the requisite approvals mandated by the
provisions of section 197 read with Schedule V to the Act.
(xii) According to the information and explanations given to us, the
Company is not a Nidhi company as prescribed under Section
406 of the Act. Accordingly, reporting under clause 3(xii) of the
Order is not applicable to the Company.
(xiii) According to the information and explanations given to us, all
transactions with the related parties are in compliance with
provisions of Section 177 and 188 of the Act, where applicable
and the details have been disclosed in the Standalone Ind
AS financial statements as required by the applicable Indian
accounting standards.
(xiv) According to the information and explanations given to us and
based on our examination of the records of the Company, the
Company has not made any preferential allotment or private
placement of shares or fully or partly convertible debentures
during the year. Accordingly, reporting under the clause 3(xiv)
of the Order is not applicable to the Company.
(xv) According to the information and explanations given to us
and based on our examination of the records of the Company,
the Company has not entered into any non-cash transactions
with directors or persons connected with them. Accordingly,
reporting under the clause 3(xv) of the Order is not applicable
to the Company.
(xvi) According to the information and explanations given to us, the
Company is not required to be registered under Section 45-IA
of the Reserve Bank of India Act, 1934. Accordingly, reporting
under the clause 3(xvi) of the Order is not applicable to the
Company.
For B S R & Co. LLPChartered Accountants
Firm’s Registration No: 101248W/W-100022
Bhavesh DhupeliaPlace : Mumbai Partner
Date: 27 April 2018 Membership No: 042070

UPL Limited Annual Report, 2017-18 164
We have audited the internal financial controls with reference to
financial statements of UPL Limited (“the Company”) as at 31 March
2018 in conjunction with our audit of the Standalone Ind AS financial
statements of the Company for the year ended on that date.
Management’s Responsibility for Internal Financial ControlsThe Company’s management is responsible for establishing and
maintaining internal financial controls based on the internal
financial controls with reference to financial statements criteria
established by the Company considering the essential components
of internal control stated in the Guidance Note on Audit of Internal
Financial Controls over Financial Reporting issued by the Institute of
Chartered Accountants of India (“ICAI”). These responsibilities include
the design, implementation and maintenance of adequate internal
financial controls that were operating effectively for ensuring the
orderly and efficient conduct of its business, including adherence
to company’s policies, the safeguarding of its assets, the prevention
and detection of frauds and errors, the accuracy and completeness
of the accounting records, and the timely preparation of reliable
financial information, as required under the Act.
Auditors’ ResponsibilityOur responsibility is to express an opinion on the Company's internal
financial controls with reference to financial statements based on
our audit. We conducted our audit in accordance with the Guidance
Note on Audit of Internal Financial Controls Over Financial Reporting
(the “Guidance Note”) and the Standards on Auditing issued by ICAI
and deemed to be prescribed under section 143 (10) of the Act,
to the extent applicable, to an audit of internal financial controls,
both applicable to an audit of Internal Financial Controls and, both
issued by the ICAI. Those Standards and the Guidance Note require
that we comply with ethical requirements and plan and perform
the audit to obtain reasonable assurance about whether adequate
internal financial controls with reference to financial statements was
established and maintained and if such controls operated effectively
in all material respects.
Our audit involves performing procedures to obtain audit evidence
about the adequacy of the internal financial controls system with
reference to financial statements and their operating effectiveness.
Our audit of internal financial controls with reference to financial
statements included obtaining an understanding of internal
financial controls with reference to financial statements, assessing
the risk that a material weakness exists and testing and evaluating
the design and operating effectiveness of internal control based
on the assessed risk. The procedures selected depend on the
auditors’ judgment, including the assessment of the risks of material
misstatement of the financial statements, whether due to fraud or
error.
We believe that the audit evidence we have obtained is sufficient
and appropriate to provide a basis for our audit opinion on the
Company’s internal financial controls with reference to financial
statements.
Meaning of Internal Financial Controls with reference to financial statements.A company's internal financial control with reference to financial
statements is a process designed to provide reasonable assurance
regarding the reliability of financial reporting and the preparation
of financial statements for external purposes in accordance with
generally accepted accounting principles. A company's internal
financial control with reference to financial statements includes
those policies and procedures that (1) pertain to the maintenance
of records that, in reasonable detail, accurately and fairly reflect
the transactions and dispositions of the assets of the Company;
(2) provide reasonable assurance that transactions are recorded
as necessary to permit preparation of financial statements in
accordance with generally accepted accounting principles, and that
receipts and expenditures of the company are being made only in
accordance with authorizations of management and directors
of the company; and (3) provide reasonable assurance regarding
prevention or timely detection of unauthorized acquisition, use, or
disposition of the company's assets that could have a material effect
on the financial statements.
Inherent Limitations of Internal Financial Controls with reference to financial statements.Because of the inherent limitations of internal financial controls
with reference to financial statements, including the possibility of
collusion or improper management override of controls, material
misstatements due to error or fraud may occur and not be detected.
Also, projections of any evaluation of the internal financial controls
with reference to financial statements to future periods are subject
(Referred to in our report of even date)
Report on the Internal Financial Controls under Clause (i) of Sub-section 3 of Section 143 of the Companies Act, 2013 (“the Act”)
Annexure B to the Independent Auditors’ Report – 31 March 2018

Overview
Strategyreview Performance Governance Financials
165
to the risk that the internal financial control with reference to
financial statements may become inadequate because of changes
in conditions, or that the degree of compliance with the policies or
procedures may deteriorate.
OpinionIn our opinion, the Company has, in all material respects, an adequate
internal financial controls with reference to financial statements
and such internal financial controls with reference to financial
statements were operating effectively as at 31 March 2018, based
on the internal control with reference to financial statements criteria
established by the Company considering the essential components
of internal control stated in the Guidance Note on Audit of Internal
Financial Controls with reference to financial statements issued by
the ICAI.
For B S R & Co. LLPChartered Accountants
Firm’s Registration No: 101248W/W-100022
Bhavesh DhupeliaPlace : Mumbai Partner
Date: 27 April 2018 Membership No: 042070

UPL Limited Annual Report, 2017-18 166
As per our report of even date attached.
For B S R & Co. LLP For and on behalf of the Board of Directors of UPL Limited Chartered Accountants CIN No.-L24219GJ1985PLC025132 Firm's registration No: 101248W/W-100022
Bhavesh Dhupelia R.D. Shroff A.C. AsharPartner Chairman and Managing Director Whole-time DirectorMembership no.: 042070 Din No.-00180810 Din No.- 00192088 Place: Mumbai Place: Mumbai
Anand Vora M.B. Trivedi Chief Financial Officer Company Secretary Membership no.: ACS4250Place: Mumbai Place: Mumbai Place: San FranciscoDate: April 27, 2018 Date: April 27, 2018
Standalone Balance Sheet as at March 31, 2018
INR CroresNotes As at
March 31, 2018As at
March 31, 2017AssetsNon-current assetsProperty, plant and equipment 3 1,947 1,733 Capital work-in-progress 3 624 249 Goodwill 4 2,595 2,965 Other intangible assets 4 360 418 Intangible assets under development 4 39 23 Financial assets(i) Investments 5 594 593 (ii) Loans 6 905 941 (iii) Other financial assets 7 35 60 Income tax assets (Net) 166 148 Other non-current assets 8 224 215
7,489 7,345 Current assetsInventories 9 1,452 1,355 Financial assets(i) Trade receivables 10 2,017 1,957 (ii) Cash and cash equivalents 11 93 59 (iii) Bank balances other than cash and cash equivalents 11A 33 12 (iv) Loans 6 105 128 (v) Other financial assets 7 174 127 Other current assets 8 687 364
4,561 4,002 Total Assets 12,050 11,347
Equity and liabilitiesEquityEquity share capital 12 102 101 Compulsorily convertible preference shares 12A - 82 Share capital suspense 12B - - Other equity 13(i) Securities premium 4,607 4,498 (ii) Retained earnings 1,143 968 (iii) Other reserves (including items of other comprehensive income) 2,117 2,101
7,969 7,750 LiabilitiesNon-current liabilities:Financial liabilities(i) Borrowings 14 682 756 (ii) Trade payables 17 - 9 (iii) Other financial liabilities 15 139 146 Deferred tax liabilities (net) 19 64 133
885 1,044 Current liabilities:Financial liabilities(i) Borrowings 14 313 40 (ii) Trade payables
- Outstanding dues of micro and small enterprises 18 17 1 - Outstanding dues of other than micro and small enterprises 18 2,336 2,187
(iii) Other financial liabilities 15 377 148 Other current liabilities 16 62 94 Provisions 20 68 66 Net employee defined benefit liabilities 33 23 17
3,196 2,553 Total equity and liabilities 12,050 11,347 Summary of significant accounting policies 2.2See accompanying notes to the financial statements 3-49

Overview
Strategyreview Performance Governance Financials
167
As per our report of even date attached.
For B S R & Co. LLP For and on behalf of the Board of Directors of UPL Limited Chartered Accountants CIN No.-L24219GJ1985PLC025132 Firm's registration No: 101248W/W-100022
Bhavesh Dhupelia R.D. Shroff A.C. AsharPartner Chairman and Managing Director Whole-time DirectorMembership no.: 042070 Din No.-00180810 Din No.- 00192088 Place: Mumbai Place: Mumbai
Anand Vora M.B. Trivedi Chief Financial Officer Company Secretary Membership no.: ACS4250Place: Mumbai Place: Mumbai Place: San FranciscoDate: April 27, 2018 Date: April 27, 2018
Standalone Statement of Profit and Loss for the year ended March 31, 2018
INR Crores
Notes Year ended March 31, 2018
Year ended March 31, 2017
REVENUE
Revenue from operations 21 7,374 7,277
Other income 22 435 325
TOTAL INCOME 7,809 7,602
EXPENSES
Cost of materials consumed 23 3,517 3,029
Purchases of stock-in-trade 404 701
Changes in inventories of finished goods (including stock-in-trade) and work-in-progress 24 2 (108)
Excise duty 111 338
Employee benefits expenses 25 486 445
Finance costs 26 135 149
Depreciation and amortisation expenses 27 666 655
Other expenses 28 1,905 1,929
TOTAL EXPENSES 7,226 7,138
Profit before exceptional items and tax 583 464
Exceptional items 43 7 46
Profit before tax 576 418
Tax expenses
Current tax 19 180 89
Adjustments of tax relating to earlier years 19 (83) -
Deferred tax (credit)/charge 19 (69) 84
Total tax expenses 28 173
PROFIT FOR THE YEAR 548 245
Other Comprehensive Income (OCI) 30
(i) Items that will not be reclassified to profit or loss 3 (2)
(ii) Income tax relating to items that will not be reclassified to profit or loss 0 1
Total Other Comprehensive Income for the year, net of tax 3 (1)
Total Comprehensive Income for the year 551 244
Earnings per equity share (In INR)
Basic (Face value of H2 each) 31 10.78 4.84
Diluted (Face value of H2 each) 31 10.78 4.81
Summary of significant accounting policies 2.2
See accompanying notes to the financial statements 3-49

UPL Limited Annual Report, 2017-18 168
Standalone Statement of Cash Flows for the year ended March 31, 2018
INR Crores
Year ended March 31, 2018
Year ended March 31, 2017
Cash flow from operating activities
Profit before exceptional items and tax 583 464
Adjustments for
Depreciation of property, plant and equipment 226 205
Amortization of intangible assets 440 450
Gain on disposal of property, plant and equipment - (10)
Assets written off 9 4
Interest Income (69) (63)
Profit on sale of Investment - (5)
Fair value gain/(loss) on financial instruments at fair value through profit or loss 7 (12)
Dividend Income on Long-term investments in Subsidiary (356) (216)
Share in profit from investment in LLP (6) (8)
Allowances for doubtful debts and advances (net) 8 6
Finance costs 135 149
Unrealised exchange difference (net) 1 (15)
Manufacturing expenses capitalised (26) (22)
Liabilities / provisions no longer required written back (net) (45) (28)
Working capital adjustments
(Increase)/decrease in trade receivables (51) (102)
(Increase)/decrease in inventories (97) (71)
(Increase)/decrease in non-current and current financial assets 2 18
(Increase)/decrease in other non-current and current assets (299) (78)
Increase/(decrease) in other non-current and current trade payables 151 501
Increase/(decrease) in other non-current and current financial liabilities 1 (9)
Increase/(decrease)in other current liabilities (32) (8)
Increase/(decrease) in provisions and Net employee defined benefit liabilities 11 17
593 1,167
Income tax paid (including TDS) (net) (115) (100)
Cash Flow Before Exceptional items 478 1,067
Exceptional Items (7) (46)
Net cash flows from / (used in) operating activities 471 1,021
Cash flow from investing activities
Purchase of property, plant and equipment (including CWIP) (715) (439)
Purchase of intangible assets (including CWIP) (28) (26)
Proceeds from sale of property, plant and equipment - 28
Purchase / subscription of optionally convertible bonds - (2)
Redemption of optionally convertible bonds - 21
Redemption of Preference shares of subsidiary - 7
Profit on sale of Mutual funds - 3
Proceeds from sale of investments - 2
Purchase of current and non current investments - (10)
Dividend on investments 356 216
Interest received 50 64
Sundry loans - Given (12) -
Sundry loans - Repayment received 9 4
Fixed deposits and margin money (net) (21) (2)

Overview
Strategyreview Performance Governance Financials
169
Standalone Statement of Cash Flows for the year ended March 31, 2018
INR Crores
Year ended March 31, 2018
Year ended March 31, 2017
Advances and loans to subsidiaries - Given (102) (258)
Advances and loans to subsidiaries - Repayment received 184 660
Net cash flows from / (used in) investing activities (279) 268
Cash flow from financing activities
Interest and finance cost paid (95) (264)
Proceeds from borrowings 425 2,281
Repayments of borrowings (127) (3,099)
Redemption of Optionally convertible preference shares (2) -
Proceeds from exercise of share options 1 -
Payment of dividend (360) (213)
Net cash flows from / (used in) financing activities (158) (1,295)
Net increase / (decrease) in cash and cash equivalents 34 (6)
Cash and cash equivalents at the beginning of the year (Refer note 11) 59 65
Cash and cash equivalents at the end (Refer note 11) 93 59
Reconciliation between the opening and closing balances in the balance sheet for liabilities arising from financing activities.
Particulars Non-cash changes
Notes March 31, 2017
Cash flows Accquisition Foreign exchange
movement
Fair value change
Other adjustments
March 31, 2018
Unsecured Redeemable Non convertible Debentures (NCDs)
14 and 15 808 - - - 1 - 809
Cash credit, packing credit and working capital demand loan accounts
14 16 297 - - - - 313
Liability component of Optionally Convertible preference shares
14 24 2 - - - 22 -
Total liabilities from financing activities
848 299 - - 1 22 1,122
Notes: i. The amalgamation of Advanta Limited (refer note 45) with the Company is a non cash transaction and hence, has no impact on the
Company's cash flow for the year.
ii. The cash flow statement has been prepared under the indirect method as set out in Indian Accounting Standard (IND AS 7) Statement
of Cash Flows.
The accompanying notes are an integral part of these standalone financial statements.
As per our report of even date attached.
For B S R & Co. LLP For and on behalf of the Board of Directors of UPL Limited Chartered Accountants CIN No.-L24219GJ1985PLC025132 Firm's registration No: 101248W/W-100022
Bhavesh Dhupelia R.D. Shroff A.C. AsharPartner Chairman and Managing Director Whole-time DirectorMembership no.: 042070 Din No.-00180810 Din No.- 00192088 Place: Mumbai Place: Mumbai
Anand Vora M.B. Trivedi Chief Financial Officer Company Secretary Membership no.: ACS4250Place: Mumbai Place: Mumbai Place: San FranciscoDate: April 27, 2018 Date: April 27, 2018

UPL Limited Annual Report, 2017-18 170
Standalone Statement of Changes in Equity for the year ended March 31, 2018
A. Equity Share Capital INR Crores
Equity shares of INR 2 each Compulsorily Convertible Preference Shares (CCPS)
Nos. INR Crores Nos. INR Crores
Issued, subscribed and fully paid
As at April 1, 2016 42,86,04,274 86 - -
Changes during the year 7,84,12,844 15 8,19,40,125 82
At March 31, 2017 50,70,17,118 101 8,19,40,125 82
Changes during the year 23,15,963 1 (8,19,40,125) (82)
At March 31, 2018 50,93,33,081 102 - -
C. Other Equity for the year ended March 31, 2018 INR Crores
Reserve and Surplus Equity Instruments
through Other Comprehensive
Income
Total Equity
Capital redemption
reserve
Capital reserve
Debenture redemption
reserve
Securities premium
reserve
Share Based
Payment reserve
General reserve
Equity Component
of convertible preference
shares
Retained earnings
As at April 1, 2017 36 86 127 4,498 2 1,848 0 968 2 7,567
Profit for the year - - - - - - - 548 - 548
Other comprehensive income (refer note 30)
- - - - - - - 0 3 3
Total comprehensive income
Dividends paid during the year (refer note 12c)
- - - - - - - (357) - (357)
Share options received (refer note 34)
- - - 4 (2) - - - - 2
Conversion of Optionally convertible preference shares and Compulsorily convertible preference shares
- - - 105 - - (0) - - 104
Transfer from retained earnings
2 - 14 - - - - (16) - -
As at 31 March 2018 38 86 141 4,607 0 1,848 - 1,143 5 7,867
B. Share Capital Suspense Account (Refer Note 45 of the standalone financial statements) INR Crores
INR Crores
As at April 1, 2016 3,797
Changes during the year (3,797)
At March 31, 2017 -
Changes during the year -
At March 31, 2018 -

Overview
Strategyreview Performance Governance Financials
171
Standalone Statement of Changes in Equity for the year ended March 31, 2018
C. Other Equity for the year ended March 31, 2017 INR Crores
Reserve and Surplus Equity Instruments
through Other Comprehensive
Income
Total Equity
Capital redemption
reserve
Capital reserve
Debenture redemption
reserve
Securities premium
reserve
Share Based Payment
reserve
General reserve
Equity Component
of convertible preference
shares
Retained earnings
As at April 1, 2016 36 86 140 822 2 1,848 - 929 1 3,864
Profit for the year - - - - - - - 245 - 245
Other comprehensive income (refer note 30)
- - - - - - - (2) 1 (1)
Total comprehensive income
Dividends paid during the year (refer note 12c)
- - - - - - - (214) - (214)
Allotment of shares pursuant to scheme of Amalgamation with Advanta Limited (Refer note 45)
- - - 3,673 - - 0 - - 3,673
Conversion of Optionally convertible preference shares and Compulsorily convertible preference shares
- - - 2 - - - - - 2
Dividend distribution tax on dividends paid
- - - - - - - (3) - (3)
Transfer to retained earnings - - (15) - - - - 15 - -
Transfer from retained earnings
- - 2 - - - - (2) - -
Share options exercised - - - 1 - - - - - 1
Shares based compensation - - - - 0 - - - - 0
As at 31 March 2017 36 86 127 4,498 2 1,848 0 968 2 7,567
The accompanying notes are an integral part of these standalone financial statements
As per our report of even date attached.
For B S R & Co. LLP For and on behalf of the Board of Directors of UPL Limited
Chartered Accountants CIN No.-L24219GJ1985PLC025132
Firm's registration No: 101248W/W-100022
Bhavesh Dhupelia R.D. Shroff A.C. AsharPartner Chairman and Managing Director Whole-time Director
Membership no.: 042070 Din No.-00180810 Din No.- 00192088
Place: Mumbai Place: Mumbai
Anand Vora M.B. Trivedi Chief Financial Officer Company Secretary
Membership no.: ACS4250
Place: Mumbai Place: Mumbai Place: San Francisco
Date: April 27, 2018 Date: April 27, 2018
UPL Limited Annual Report, 2017-18 172
Notes to standalone financial statements for the year ended March 31, 2018
1. Corporate Information UPL Limited (the Company) is a public company domiciled in India and is incorporated under the provisions of the companies act
applicable in India. Its shares are listed on two recognised stock exchanges in India. The registered office of the company is located at
3-11, G.I.D.C., Vapi, Dist- Valsad, Gujarat.
The Company is principally engaged in the business of agrochemicals, industrial chemicals, chemical intermediates, speciality chemicals
and production and sale of field crops and vegetable seeds.
The standalone financial statements were authorised for issue in accordance with the resolution of the directors on April 27, 2018.
2.1 Basis of Preparation The standalone financial statements of the Company have been prepared in accordance with Indian Accounting Standards (Ind AS)
notified under the Companies (Indian Accounting Standards) Rules, 2015 notified under section 133 of the Companies Act 2013 ("the
Act") as amended thereafter and other relevant provision of the Act.
The standalone financial statements have been prepared on an accrual basis and under the historical cost convention, except for the
following assets and liabilities which have been measured at fair value:
- Derivative financial instruments
- Certain financial assets and liabilities measured at fair value (refer accounting policy regarding financial instruments),
The standalone financial statements are presented in Indian Rupees ('INR') or ('H') which is also the Company's functional currency and all
values are rounded to the nearest crores, except when otherwise indicated. Wherever an amount is represented as H'0' (zero) it construes
a value less than rupees fifty lakhs.
Significant accounting estimates, assumptions and judgements The preparation of the Company’s standalone financial statements requires management to make estimates and assumptions that
affect the reported amounts of revenues, expenses, assets and liabilities, and the accompanying disclosures, and the disclosure of
contingent liabilities. Uncertainty about these assumptions and estimates could result in outcomes that require a material adjustment
to the carrying amount of assets or liabilities effected in future periods.
Estimates and assumptions The key assumptions concerning the future and other key sources of estimation uncertainty at the reporting date, that have a significant
risk of causing a material adjustment to the carrying amounts of assets and liabilities within the next financial year, are described below.
The Company based its assumptions and estimates on parameters available when the standalone financial statements were prepared.
Existing circumstances and assumptions about future developments, however, may change due to market changes or circumstances
arising that are beyond the control of the Company. Such changes are reflected in the assumptions when they occur.
Taxes There are many transactions and calculations undertaken during the ordinary course of business for which the ultimate tax determination
is uncertain. Where the final tax outcome of these matters is different from the amounts initially recorded, such differences will impact
the current and deferred tax provisions in the period in which the tax determination is made. The assessment of probability involves
estimation of a number of factors including future taxable income.
Defined benefit plans (gratuity benefits) A liability in respect of defined benefit plans is recognised in the balance sheet, and is measured as the present value of the defined
benefit obligation at the reporting date less the fair value of the plan’s assets. The present value of the defined benefit obligation is based
on expected future payments at the reporting date, calculated annually by independent actuaries. Consideration is given to expected
future salary levels, experience of employee departures and periods of service. Refer note 33 for details of the key assumptions used in
determining the accounting for these plans.
Fair value measurement of financial instruments When the fair values of financial assets and financial liabilities recorded in the balance sheet cannot be measured based on quoted prices
in active markets, their fair value is measured using valuation techniques including the DCF model. The inputs to these models are taken
from observable markets where possible, but where this is not feasible, a degree of judgement is required in establishing fair values.
Judgements include considerations of inputs such as liquidity risk, credit risk and volatility. Changes in assumptions about these factors
could affect the reported fair value of financial instruments. See Note 39 and 40 for further disclosures.

Overview
Strategyreview Performance Governance Financials
173
Notes to standalone financial statements for the year ended March 31, 2018
Provision against obsolete and slow-moving inventories The Company reviews the condition of its inventories and makes provision against obsolete and slow-moving inventory items which are
identified as no longer suitable for sale or use. Company estimates the net realisable value for such inventories based primarily on the
latest invoice prices and current market conditions. The Company carries out an inventory review at each balance sheet date and makes
provision against obsolete and slow-moving items. The Company reassesses the estimation on each balance sheet date.
Impairment of financial assets The Company assesses impairment based on expected credit losses (ECL) model on trade receivables. The Company uses a provision
matrix to determine impairment loss allowance on the portfolio of trade receivables. The provision matrix is based on its historically
observed default rates over the expected life of the trade receivable and is adjusted for forward looking estimates. At every reporting
date, the historical observed default rates are updated and changes in the forward-looking estimates are analysed.
Impairment of non- financial assets The Company assesses at each reporting date whether there is an indication that an asset may be impaired. If any indication exists, or
when annual impairment testing for an asset is required, the Company estimates the asset’s recoverable amount. An asset’s recoverable
amount is the higher of an asset’s fair value less costs of disposal and its value in use. It is determined for an individual asset, unless the
asset does not generate cash inflows that are largely independent of those from other assets or group of assets. Where the carrying
amount of an asset exceeds its recoverable amount, the asset is considered impaired and is written down to its recoverable amount. In
assessing value in use, the estimated future cash flows are discounted to their present value using a pre- tax discount rate that reflects
current market assessment of the time value of money and the risk specific to the asset. In determining fair value less cost of disposal,
recent market transactions are taken into account. If no such transactions can be identified, an appropriate valuation model is used.
These calculations are corroborated by valuation multiples, quoted share price for publicly traded subsidiaries or other available fair
value indicators.
2.2 Summary of significant accounting policiesa. Current versus non-current classification
The Company presents assets and liabilities in the balance sheet based on current/non-current classification.
An asset is treated as current when it is:
- Expected to be realised or intended to be sold or consumed in normal operating cycle
- Held primarily for the purpose of trading
- Cash or cash equivalent unless restricted from being exchanged or used to settle a liability for at least twelve months after the
reporting period.
All other assets are classified as non-current.
A liability is current when:
- It is expected to be settled in normal operating cycle
- It is held primarily for the purpose of trading
- There is no unconditional right to defer the settlement of the liability for at least twelve months after the reporting period
The Company classifies all other liabilities as non-current.
Deferred tax assets and liabilities are classified as non-current assets and liabilities.
Based on the nature of products and the time between acquisition of assets for processing and their realisation in cash and cash
equivalents, the Company has identified twelve months as its operating cycle for the purpose of current / non current classification of
assets and liabilities.
b. Revenue recognition Revenue is recognised to the extent that it is probable that the economic benefits will flow to the Company and the revenue can be
reliably measured, regardless of when the payment is being made. Revenue is measured at the fair value of the consideration received
or receivable, taking into account contractually defined terms of payment and excluding taxes or duties collected on behalf of the
government.
Revenue is stated inclusive of excise duty and excludes sales tax/ value added tax (VAT)/Goods and Service Tax (GST).
The specific recognition criteria described below must also be met before revenue is recognised.

UPL Limited Annual Report, 2017-18 174
Sale of goods Revenue from the sale of goods is recognised when the significant risks and rewards of ownership of the goods have passed to the
buyer, usually on delivery of the goods. Revenue from the sale of goods is measured at the fair value of the consideration received or
receivable, net of returns and allowances, trade discounts, volume rebates and cash discounts.
Rendering of services Income from services are recognized as and when the services are rendered.
Interest income For all debt instruments measured either at amortised cost or at fair value through other comprehensive income, interest income is
recorded using the effective interest rate (EIR). EIR is the rate that exactly discounts the estimated future cash payments or receipts over
the expected life of the financial instrument or a shorter period, where appropriate, to the gross carrying amount of the financial asset
or to the amortised cost of a financial liability. When calculating the effective interest rate, the Company estimates the expected cash
flows by considering all the contractual terms of the financial instrument (for example prepayment, extension, call and similar options)
but does not consider the expected credit losses. Interest income is included in other income in the statement of profit and loss.
Export Incentive Duty free imports of raw materials under Advance License for Imports as per the Export and Import Policy are matched with the exports
made against the said licenses and the benefit / obligation is accounted by making suitable adjustments in raw material consumption.
The benefit accrued under the Duty Drawback scheme and other schemes as per the Export and Import Policy in respect of exports
made under the said Schemes is included under the head “Revenue from Operations” as ‘Export Incentive’.
Dividends and Royalties Dividend income is recognised when the Company’s right to receive the payment is established, which is generally when shareholders
approve the dividend. Royalty income is recognized on an accrual basis in accordance with the substance of the relevant agreement.
c. Property, Plant and Equipment Items of Property, plant and equipment including capital-work in-progress are stated at cost, net of accumulated depreciation and
accumulated impairment losses, if any. Cost comprises the purchase price and any attributable cost of bringing the asset to its working
condition for its intended use. Such cost includes the cost of replacing part of the plant and equipment and borrowing costs for long-
term construction projects if the recognition criteria are met. Subsequent expenditure related to an item of fixed asset is added to its
book value only if it increases the future benefits from the existing asset beyond its previously assessed standard of performance. When
significant parts of plant and equipment are required to be replaced at intervals, the Company depreciates them separately based on
their specific useful lives. All other repair and maintenance costs are recognised in statement of profit or loss as incurred. In respect of
additions to /deletions from the Fixed Assets, depreciation is provided on pro-rata basis with reference to the month of addition/deletion
of the Assets.
The company, based on technical assessment made by technical expert and management estimate, depreciates certain items of plant
and equipment over estimated useful lives which are different from the useful life prescribed in Schedule II to the Companies Act, 2013.
The management believes that these estimated useful lives are realistic and reflect fair approximation of the period over which the assets
are likely to be used.
Estimated useful life's of the assets are as follows:
Nature of tangible Assets Useful Life (years)
Plant & Equipment's 3 to 25
Building 30 to 60
Laboratory Equipment's 10
Office Equipment's 5
Furniture, Fixtures & Equipment's 10
Vehicles 8
Leasehold improvements over the period of lease
Leasehold Land: No depreciation is provided for leasehold land since as per the lease agreements, the leases are renewable at the option of the Company
for a further period of 99 years at the end of the lease period of 99 years, without / with marginal payment of further premium.
Notes to standalone financial statements for the year ended March 31, 2018

Overview
Strategyreview Performance Governance Financials
175
The residual values, useful lives and methods of depreciation of property, plant and equipment are reviewed at each financial year end
and adjusted prospectively, if appropriate.
d. Intangible assets i. Goodwill a) Goodwill arising on amalgamation in accordance with court scheme.
Goodwill arising on amalgamation of Advanta Limited has been recognised in accordance with court scheme. Said goodwill
has been amortised in accordance with the court scheme for which Company has estimated useful life of 10 years. (Refer
note 45)
b) Goodwill other than mentioned above
- Goodwill is initially measured at cost, being the excess of the aggregate fair value of the consideration transferred over the
net of fair value of identifiable assets acquired and liability assumed.
- Subsequent measurement is at cost less any accumulated impairment losses.
- Goodwill is not amortised and is tested for impairment annually.
ii. Other intangible assets Intangible assets acquired separately are measured on initial recognition at cost. Following initial recognition, intangible assets
with finite life are carried at cost less any accumulated amortisation and accumulated impairment losses. Internally generated
intangibles, excluding capitalised development costs, are not capitalised and the related expenditure is reflected in statement of
profit or loss in the period in which the expenditure is incurred.
The amortisation period and the amortisation method for an intangible asset with a finite useful life is reviewed at least at the end
of each reporting period.
Gains or losses arising from de-recognition of an intangible asset are measured as the difference between the net disposal proceeds
and the carrying amount of the asset and are recognised in the statement of profit or loss when the asset is de-recognised.
Research costs are expensed as incurred. Development expenditures on an individual project are recognised as an intangible asset
when the Company can demonstrate technical and commercial feasibility of making the asset available for use or sale.
Following initial recognition of the development expenditure as an asset, the asset is carried at cost less any accumulated
amortisation and accumulated impairment losses. Amortisation of the asset begins when development is complete and the asset
is available for use. It is amortised over the period of expected future benefit. Amortisation expense is recognised in the statement
of profit and loss unless such expenditure forms part of carrying value of another asset.
A summary of the policies applied to the Company’s intangible assets is as follows
Intangible Assets Useful Life (years) Amortisation method used
Product Acquisitions Fifteen years Amortised on straight-line basis from the month of additions to match their future economic benefits
Germ plasm Ten to fifteen years Amortised on straight-line basis
Other Intangible assets Five years Amortised on straight-line basis
e. Borrowing costs Borrowing costs directly attributable to the acquisition, construction or production of an asset that necessarily takes a substantial period
of time to get ready for its intended use or sale are capitalised as part of the cost of the asset. All other borrowing costs are expensed
in the period in which they occur. Borrowing costs consist of interest and other costs that an entity incurs in connection with the
borrowing of funds. Borrowing cost also includes exchange differences to the extent regarded as an adjustment to the borrowing costs.
f. Foreign Currency Transactions and balances Transactions in foreign currency are recorded applying the exchange rate at the date of transaction. Monetary assets and liabilities
denominated in foreign currency remaining unsettled at the end of the year, are translated at the closing rates prevailing on the Balance
Sheet date. Non-monetary items which are carried in terms of historical cost denominated in foreign currency are reported using the
exchange rate at the date of transaction. Exchange differences arising as a result of the above are recognized as income or expenses
in the statement of profit and loss. Exchange difference arising on the settlement of monetary items at rates different from those at
which they were initially recorded during the year, or reported in previous standalone financial statements, are recognised as income or
expenses in the year in which they arise.
Notes to standalone financial statements for the year ended March 31, 2018

UPL Limited Annual Report, 2017-18 176
Foreign exchange difference on foreign currency borrowings, loans given, settlement gain/loss and fair value gain/loss on derivative
contract relating to borrowings are accounted and disclosed under finance cost. Such exchange difference does not include foreign
exchange difference regarded as an adjustment to the borrowings cost and capitalised with cost of assets.
g. Fair value measurement The Company measures financial instruments, such as, derivatives at fair value at each balance sheet date on a portfolio basis.
Fair value is the price that would be received to sell an asset or paid to transfer a liability in an orderly transaction between market
participants at the measurement date. The fair value measurement is based on the presumption that the transaction to sell the asset or
transfer the liability takes place either:
- In the principal market for the asset or liability, or
- In the absence of a principal market, in the most advantageous market for the asset or liability
The principal or the most advantageous market must be accessible by the Company.
The fair value of an asset or a liability is measured using the assumptions that market participants would use when pricing the asset or
liability, assuming that market participants act in their economic best interest.
A fair value measurement of a non-financial asset takes into account a market participant’s ability to generate economic benefits by
using the asset in its highest and best use or by selling it to another market participant that would use the asset in its highest and best
use.
The Company uses valuation techniques that are appropriate in the circumstances and for which sufficient data are available to measure
fair value, maximizing the use of relevant observable inputs and minimizing the use of unobservable inputs.
'All assets and liabilities for which fair value is measured or disclosed in the standalone financial statements are categorised within the
fair value hierarchy, described as follows, based on the lowest level input that is significant to the fair value measurement as a whole:
- Level 1 — Quoted (unadjusted) market prices in active markets for identical assets or liabilities
- Level 2 — Valuation techniques for which the lowest level input that is significant to the fair value measurement is directly or
indirectly observable
- Level 3 — Valuation techniques for which the lowest level input that is significant to the fair value measurement is unobservable
For assets and liabilities that are recognised in the standalone financial statements on a recurring basis, the Company determines
whether transfers have occurred between levels in the hierarchy by re-assessing categorisation (based on the lowest level input that is
significant to the fair value measurement as a whole) at the end of each reporting period.
For the purpose of fair value disclosures, the Company has determined classes of assets and liabilities on the basis of the nature,
characteristics and risks of the asset or liability and the level of the fair value hierarchy as explained above.
This note summaries accounting policy for fair value. Other fair value related disclosures are given in the relevant notes.
- Quantitative disclosures of fair value measurement hierarchy (note 40)
- Financial instruments (including those carried at amortised cost) (note 5, 6, 7, 10, 11, 11A, 14, 15, 17,18, 38, 39, 40 and 41)
h. Leases The determination of whether an arrangement is (or contains) a lease is based on the substance of the arrangement at the inception of
the lease. The arrangement is, or contains, a lease if fulfilment of the arrangement is dependent on the use of a specific asset or assets
and the arrangement conveys a right to use the asset or assets, even if that right is not explicitly specified in an arrangement.
For arrangements entered into prior to 1 April 2015, the company has determined whether the arrangement contain lease on the basis
of facts and circumstances existing on the date of transition.
Company as a lessee A lease is classified at the inception date as a finance lease or an operating lease. A lease that transfers substantially all the risks and
rewards incidental to ownership to the Company is classified as a finance lease.
Finance leases are capitalised at the commencement of the lease at the inception date fair value of the leased property or, if lower, at the
present value of the minimum lease payments. Lease payments are apportioned between finance charges and reduction of the lease
Notes to standalone financial statements for the year ended March 31, 2018

Overview
Strategyreview Performance Governance Financials
177
liability so as to achieve a constant rate of interest on the remaining balance of the liability. Finance charges are recognised in finance
costs in the statement of profit and loss, unless they are directly attributable to qualifying assets, in which case they are capitalized in
accordance with the Company’s general policy on the borrowing costs. Contingent rentals are recognised as expenses in the periods in
which they are incurred.
A leased asset is depreciated over the useful life of the asset. However, if there is no reasonable certainty that the Company will obtain
ownership by the end of the lease term, the asset is depreciated over the shorter of the estimated useful life of the asset and the lease
term.
Operating lease payments are recognised as an expense in the statement of profit and loss on a straight-line basis over the lease
term.
Company as a lessor Leases in which the Company does not transfer substantially all the risks and rewards of ownership of an asset are classified as operating
leases. Rental income from operating lease is recognised on a straight-line basis over the term of the relevant lease.
Leases are classified as finance leases when substantially all of the risks and rewards of ownership transfer from the Company to the lessee.
Amounts due from lessees under finance leases are recorded as receivables at the Company’s net investment in the leases. Finance lease
income is allocated to accounting periods so as to reflect a constant periodic rate of return on the net investment outstanding in respect
of the lease.
i. Inventories Stores and spares, packing materials and raw materials are valued at lower of cost or net realisable value. Cost is determined on moving
weighted average basis. The aforesaid items are valued below cost if the finished products in which they are to be incorporated are
expected to be sold at a loss.
Work in progess, finished products and by-products are valued at lower of cost or net realisable value. Cost is determined on standard cost
basis which approximates the actual cost. Cost of finished goods includes excise duty, as applicable. Variances, exclusive of abnormally
low volume and operating performance, are adjusted to inventory.
Traded goods are valued at lower of cost and net realizable value. Cost includes cost of purchase and other costs incurred in bringing
the inventories to their present location and condition. Cost is determined on a weighted average basis.
Net realisable value is the estimated selling price in the ordinary course of business, less estimated costs of completion and the estimated
costs necessary to make the sale.
j. Impairment of non-financial assets The Company assesses, at each reporting date, whether there is an indication that an asset may be impaired. If any indication exists, or
when annual impairment testing for an asset is required, the Company estimates the asset’s recoverable amount. An asset’s recoverable
amount is the higher of an asset’s or cash-generating unit’s (CGU) fair value less costs of disposal and its value in use. Recoverable
amount is determined for an individual asset, unless the asset does not generate cash inflows that are largely independent of those from
other assets or groups of assets. When the carrying amount of an asset or CGU exceeds its recoverable amount, the asset is considered
impaired and is written down to its recoverable amount.
In assessing value in use, the estimated future cash flows are discounted to their present value using a pre-tax discount rate that reflects
current market assessments of the time value of money and the risks specific to the asset. In determining fair value less costs of disposal,
recent market transactions are taken into account. If no such transactions can be identified, an appropriate valuation model is used.
These calculations are corroborated by valuation multiples, quoted share prices for publicly traded companies or other available fair
value indicators.
For assets excluding goodwill, an assessment is made at each reporting date to determine whether there is an indication that previously
recognised impairment losses no longer exist or have decreased. If such indication exists, the Company estimates the asset’s or CGU’s
recoverable amount. A previously recognised impairment loss is reversed only if there has been a change in the assumptions used to
determine the asset’s recoverable amount since the last impairment loss was recognised. The reversal is limited so that the carrying
amount of the asset does not exceed its recoverable amount, nor exceed the carrying amount that would have been determined, net of
depreciation, had no impairment loss been recognised for the asset in prior years. Such reversal is recognised in the statement of profit
or loss.
Notes to standalone financial statements for the year ended March 31, 2018

UPL Limited Annual Report, 2017-18 178
Goodwill is tested for impairment annually as at 31 March and when circumstances indicate that the carrying value may be impaired.
Impairment is determined for goodwill by assessing the recoverable amount of each CGU (or group of CGUs) to which the goodwill
relates. When the recoverable amount of the CGU is less than its carrying amount, an impairment loss is recognised. Impairment losses
relating to goodwill are not reversed in future periods.
Intangible assets with indefinite useful lives are tested for impairment annually as at 31 March at the CGU level, as appropriate, and when
circumstances indicate that the carrying value may be impaired.
k. Provisions Provisions are recognised when the Company has a present obligation (legal or constructive) as a result of a past event, it is probable
that an outflow of resources embodying economic benefits will be required to settle the obligation and a reliable estimate can be
made of the amount of the obligation. When the Company expects some or all of a provision to be reimbursed, for example, under
an insurance contract, the reimbursement is recognised as a separate asset, but only when the reimbursement is virtually certain. The
expense relating to a provision is presented in the statement of profit and loss net of any reimbursement.
If the effect of the time value of money is material, provisions are discounted using a current pre-tax rate that reflects, when appropriate,
the risks specific to the liability. When discounting is used, the increase in the provision due to the passage of time is recognised as a
finance cost. Provisions are reviewed at each balance sheet and adjusted to reflect the current best estimates.
l. Retirement and other employee benefits Provident Fund is a defined contribution scheme established under a State Plan. The contributions to the scheme are charged to the
statement of profit and loss in the year when employee rendered related services.
Superannuation Fund is a defined contribution scheme and contributions to the scheme are charged to the statement of profit and
loss in the year when the contributions are due. The scheme is funded with an insurance Company in the form of a qualifying insurance
policy.
The Company has a defined benefit gratuity plan. Every employee who has completed five years or more of service gets a gratuity on
post employment at 15 days salary (last drawn salary) for each completed year of service as per the rules of the Company. The aforesaid
liability is provided for on the basis of an actuarial valuation on projected unit credit method made at the end of the financial year. The
scheme is funded with an insurance Company in the form of a qualifying insurance policy.
The Company has other long-term employee benefits in the nature of leave encashment. The liability in respect of leave encashment is
provided for on the basis of an actuarial valuation on projected unit credit method made at the end of the financial year. The aforesaid
leave encashment is funded with an insurance Company in the form of a qualifying insurance policy.
Re-measurements, comprising of actuarial gains and losses, the effect of asset ceiling, excluding amounts included in the net interest
on the net defined benefit liability and the return on plan assets (excluding amounts included in net interest on the net defined benefit
liability), are recognised immediately in the balance sheet with a corresponding debit or credit to retained earnings through OCI in the
period in which they occur. Re-measurements are not reclassified to statement of profit or loss in subsequent periods.
m. Financial instruments A financial instrument is any contract that gives rise to a financial asset of one entity and a financial liability or equity instrument of
another entity.
Financial assets Initial recognition and measurement All financial assets are recognised initially at cost and then measured at fair value at each reporting date plus, in the case of financial
assets not recorded at fair value through profit or loss, transaction costs that are attributable to the acquisition of the financial asset.
Debt instruments at amortised cost A ‘debt instrument’ is measured at the amortised cost if both its following conditions are met:
a) The asset is held within a business model whose objective is to hold assets for collecting contractual cash flows, and
b) Contractual terms of the asset give rise on specified dates to cash flows that are solely payments of principal and interest (SPPI) on
the principal amount outstanding.
After initial measurement, such financial assets are subsequently measured at amortised cost using the effective interest rate (EIR)
method. Amortised cost is calculated by taking into account any discount or premium on acquisition and fees or costs that are an
Notes to standalone financial statements for the year ended March 31, 2018

Overview
Strategyreview Performance Governance Financials
179
integral part of the EIR. The EIR amortisation is included in other income in the statement of profit or loss. The losses arising from
impairment are recognised in the statement of profit or loss.
Debt instrument at FVTOCI A ‘debt instrument’ is classified at FVTOCI if both of the following criteria are met:
a) The objective of the business model is achieved both by collecting contractual cash flows and selling the financial assets, and
b) The asset’s contractual cash flows represent SPPI.
Debt instruments included within the FVTOCI category are measured initially as well as at each reporting date at fair value. Fair
value movements are recognized in the other comprehensive income (OCI). However, the company recognizes interest income,
impairment losses & reversals and foreign exchange gain or loss in the Profit and Loss. On de-recognition of the asset, cumulative
gain or loss previously recognised in OCI is reclassified from the equity to Profit and Loss. Interest earned whilst holding FVTOCI debt
instrument is reported as interest income using the EIR method.
Debt instrument at FVTPL FVTPL is a residual category for debt instruments. Any debt instrument, which does not meet the criteria for categorization as at
amortized cost or as FVTOCI, is classified as at FVTPL.
In addition, the company may elect to designate a debt instrument, which otherwise meets amortized cost or FVTOCI criteria, as
at FVTPL. However, such election is allowed only if doing so reduces or eliminates a measurement or recognition inconsistency
(referred to as ‘accounting mismatch’). The company has designated certain debt instrument as at FVTPL.
Debt instruments included within the FVTPL category are measured at fair value with all changes recognized in the statement of
profit and loss.
Equity investments All equity investments in the scope of Ind AS 109 are measured at fair value. Equity instruments which are held for trading
are classified as at FVTPL. For all other equity instruments, the company may make an irrevocable election to present in other
comprehensive income subsequent changes in the fair value. The company makes such election on an instrument-by-instrument
basis. The classification is made on initial recognition and is irrevocable.
If the company decides to classify an equity instrument as at FVTOCI, then all fair value changes on the instrument, excluding
dividends, are recognized in the OCI. There is no recycling of the amounts from OCI to statement of profit and loss, even on sale of
investment. However, the company may transfer the cumulative gain or loss within equity.
Equity instruments included within the FVTPL category are measured at fair value with all changes recognized in the statement of
profit and loss.
De-recognition A financial asset (or, where applicable, a part of a financial asset or part of a company of similar financial assets) is primarily de-
recognised (i.e. removed from the Company’s balance sheet) when:
- The rights to receive cash flows from the asset have expired, or
- The company has transferred its rights to receive cash flows from the asset or has assumed an obligation to pay the received
cash flows in full without material delay to a third party under a ‘pass-through’ arrangement; and either (a) the company
has transferred substantially all the risks and rewards of the asset, or (b) the company has neither transferred nor retained
substantially all the risks and rewards of the asset, but has transferred control of the asset.
When the company has transferred its rights to receive cash flows from an asset or has entered into a pass-through arrangement,
it evaluates if and to what extent it has retained the risks and rewards of ownership. When it has neither transferred nor retained
substantially all of the risks and rewards of the asset, nor transferred control of the asset, the company continues to recognise the
transferred asset to the extent of the Company’s continuing involvement. In that case, the company also recognises an associated
liability. The transferred asset and the associated liability are measured on a basis that reflects the rights and obligations that the
Company has retained.
Continuing involvement that takes the form of a guarantee over the transferred asset is measured at the lower of the original
carrying amount of the asset and the maximum amount of consideration that the company could be required to repay.
Notes to standalone financial statements for the year ended March 31, 2018

UPL Limited Annual Report, 2017-18 180
Impairment of financial assets In accordance with Ind AS 109, the company applies expected credit loss (ECL) model for measurement and recognition of
impairment loss on the following financial assets and credit risk exposure:
a) Financial assets that are debt instruments, and are measured at amortised cost e.g., loans, debt securities, deposits, trade
receivables and bank balance
b) Financial assets that are debt instruments and are measured as at FVTOCI
c) Lease receivables under Ind AS 17
d) Trade receivables or any contractual right to receive cash or another financial asset that result from transactions that are within
the scope of Ind AS 18 (referred to as ‘contractual revenue receivables’ in these standalone financial statements)
e) Financial guarantee contracts which are not measured as at FVTPL
The company follows ‘simplified approach’ for recognition of impairment loss allowance on:
- Trade receivables and
- Other receivables
The application of simplified approach does not require the company to track changes in credit risk. Rather, it recognises impairment
loss allowance based on lifetime ECLs at each reporting date, right from its initial recognition.
For recognition of impairment loss on other financial assets and risk exposure, the company determines that whether there has
been a significant increase in the credit risk since initial recognition. If credit risk has not increased significantly, 12-month ECL is
used to provide for impairment loss. However, if credit risk has increased significantly, lifetime ECL is used. If, in a subsequent period,
credit quality of the instrument improves such that there is no longer a significant increase in credit risk since initial recognition,
then the entity reverts to recognising impairment loss allowance based on 12-month ECL.
Lifetime ECL are the expected credit losses resulting from all possible default events over the expected life of a financial instrument.
The 12-month ECL is a portion of the lifetime ECL which results from default events that are possible within 12 months after the
reporting date.
ECL is the difference between all contractual cash flows that are due to the company in accordance with the contract and all the
cash flows that the entity expects to receive (i.e., all cash shortfalls), discounted at the original EIR. When estimating the cash flows,
an entity is required to consider:
- All contractual terms of the financial instrument (including prepayment, extension, call and similar options) over the expected
life of the financial instrument. However, in rare cases when the expected life of the financial instrument cannot be estimated
reliably, then the entity is required to use the remaining contractual term of the financial instrument.
- Cash flows from the sale of collateral held or other credit enhancements that are integral to the contractual terms.
- Financial assets measured as at amortised cost, contractual revenue receivables and lease receivables: ECL is presented as an
allowance, i.e., as an integral part of the measurement of those assets in the balance sheet. The allowance reduces the net
carrying amount. Until the asset meets write-off criteria, the company does not reduce impairment allowance from the gross
carrying amount.
n. Financial liabilities Initial recognition and measurement Financial liabilities are classified, at initial recognition, as financial liabilities at fair value through profit or loss, loans and borrowings, or
payables, as appropriate.
All financial liabilities are recognised initially at fair value and, in the case of loans and borrowings and payables, net of directly attributable
transaction costs.
The Company’s financial liabilities include trade and other payables, loans and borrowings including bank overdrafts, financial guarantee
contracts and derivative financial instruments.
Notes to standalone financial statements for the year ended March 31, 2018

Overview
Strategyreview Performance Governance Financials
181
Subsequent measurement The measurement of financial liabilities depends on their classification, as described below:
Financial liabilities at fair value through profit or loss Financial liabilities at fair value through profit or loss include financial liabilities held for trading and financial liabilities designated upon
initial recognition as at fair value through profit or loss. Financial liabilities are classified as held for trading if they are incurred for the
purpose of repurchasing in the near term. This category also includes derivative financial instruments entered into by the company that
are not designated as hedging instruments in hedge relationships as defined by Ind AS 109.
Gains or losses on liabilities held for trading are recognised in the statement of profit and loss.
Loans and borrowings
This is the category most relevant to the company. After initial recognition, interest-bearing loans and borrowings are subsequently
measured at amortised cost using the EIR method. Gains and losses are recognised in profit or loss when the liabilities are de-recognised
as well as through the EIR amortisation process.
Amortised cost is calculated by taking into account any discount or premium on acquisition and fees or costs that are an integral part of
the EIR. The EIR amortisation is included as finance costs in the statement of profit and loss.
This category generally applies to borrowings. For more information refer Note 14.
Financial guarantee contracts Financial guarantee contracts issued by the company are those contracts that require a payment to be made to reimburse the holder
for a loss it incurs because the specified debtor fails to make a payment when due in accordance with the terms of a debt instrument.
Financial guarantee contracts are recognised initially as a liability at fair value, adjusted for transaction costs that are directly attributable
to the issuance of the guarantee. Subsequently, the liability is measured at the higher of the amount of loss allowance determined as
per impairment requirements of Ind AS 109 and the amount recognised less cumulative amortisation.
De-recognition A financial liability is derecognised when the obligation under the liability is discharged or cancelled or expires. When an existing financial
liability is replaced by another from the same lender on substantially different terms, or the terms of an existing liability are substantially
modified, such an exchange or modification is treated as the de-recognition of the original liability and the recognition of a new liability.
The difference in the respective carrying amounts is recognised in the statement of profit and loss.
Offsetting of financial instruments Financial assets and financial liabilities are offset and the net amount is reported in the balance sheet if there is a currently enforceable
legal right to offset the recognised amounts and there is an intention to settle on a net basis, to realise the assets and settle the liabilities
simultaneously.
o. Derivative financial instruments Initial recognition and subsequent measurement The Company uses derivative financial instruments, such as forward currency contracts, full currency swaps and interest rate swaps
contracts to hedge its foreign currency risks and interest rate risks respectively. Such derivative financial instruments are initially
recognised at fair value on the date on which a derivative contract is entered into and are subsequently re-measured at fair value.
Derivatives are carried as financial assets when the fair value is positive and as financial liabilities when the fair value is negative. Fair value
changes are recognised in the statement of profit and loss.
p. Cash and cash equivalents Cash and cash equivalents in the balance sheet comprise cash at banks and on hand and short-term deposits with an original maturity
of three months or less, which are subject to an insignificant risk of changes in value.
For the purpose of the statement of cash flows, cash and cash equivalents consist of cash and short-term deposits, as defined above, net
of outstanding bank overdrafts as they are considered an integral part of the Company’s cash management.
q. Cash dividend The Company recognises a liability to make cash distributions to equity holders when the distribution is authorised and the distribution
is no longer at the discretion of the Company. As per the corporate laws in India, a distribution is authorised when it is approved by the
shareholders. A corresponding amount is recognised directly in equity.
Notes to standalone financial statements for the year ended March 31, 2018

UPL Limited Annual Report, 2017-18 182
r. Taxes Current income tax Current income tax assets and liabilities are measured at the amount expected to be recovered from or paid to the taxation authorities
in accordance with the Income-tax Act, 1961. The tax rates and tax laws used to compute the amount are those that are enacted or substantively enacted, at the reporting date.
Current income tax relating to items recognised outside profit or loss is recognised outside profit or loss (either in other comprehensive income or in equity). Current tax items are recognised in correlation to the underlying transaction either in OCI or directly in equity. Management periodically evaluates positions taken in the tax returns with respect to situations in which applicable tax regulations are subject to interpretation and establishes provisions where appropriate.
Deferred tax Deferred tax is provided using the liability method on temporary differences between the tax bases of assets and liabilities and their
carrying amounts for financial reporting purposes at the reporting date.
Deferred tax liabilities are recognised for all taxable temporary differences, except:
- When the deferred tax liability arises from the initial recognition of goodwill or an asset or liability in a transaction that is not a business combination and, at the time of the transaction, affects neither the accounting profit nor taxable profit or loss
- In respect of taxable temporary differences associated with investments in subsidiaries, associates and interests in joint ventures, when the timing of the reversal of the temporary differences can be controlled and it is probable that the temporary differences will not reverse in the foreseeable future
Deferred tax assets are recognised for all deductible temporary differences, the carry forward of unused tax credits and any unused tax losses are recognised to the extent that it is reasonably certain that taxable profit will be available against which the deductible temporary differences, and the carry forward of unused tax credits and unused tax losses can be utilised, except:
- When the deferred tax asset relating to the deductible temporary difference arises from the initial recognition of an asset or liability in a transaction that is not a business combination and, at the time of the transaction, affects neither the accounting profit nor taxable profit or loss
The carrying amount of deferred tax assets is reviewed at each reporting date and reduced to the extent that it is no longer probable that sufficient taxable profit will be available to allow all or part of the deferred tax asset to be utilised. Unrecognised deferred tax assets are re-assessed at each reporting date and are recognised to the extent that it has become reasonably certain that future taxable profits will allow the deferred tax asset to be recovered.
Deferred tax assets and liabilities are measured at the tax rates that are expected to apply in the year when the asset is realised or the liability is settled, based on tax rates (and tax laws) that have been enacted or substantively enacted at the reporting date
Deferred tax relating to items recognised outside profit or loss is recognised outside profit or loss (either in other comprehensive income or in equity). Deferred tax items are recognised in correlation to the underlying transaction either in OCI or directly in equity.
Minimum Alternate Tax (MAT) Minimum Alternate Tax (MAT) paid as per Indian Income Tax Act, 1961 is in the nature of unused tax credit which can be carried
forward and utilised when the Company will pay normal income tax during the specified period. Deferred tax assets on such tax credit is recognised to the extent that it is probable that the unused tax credit can be utilised in the specified future period. The net amount of tax recoverable from, or payable to, the taxation authority is included as part of receivables or payables in the balance sheet.
s. Government grants Government grants are recognised where there is reasonable assurance that the grant will be received and all attached conditions will
be complied with. When the grant relates to an expense item, it is recognised as income on a systematic basis over the periods that the related costs, for which it is intended to compensate, are expensed. When the grant relates to an asset, it is recognised as income in equal amounts over the expected useful life of the related assets.
Export Benefits: Duty free imports of raw materials under Advance License for imports as per the Import and Export Policy are matched with the exports
made against the said licenses and the net benefit/obligation has been accounted by making suitable adjustments in raw material consumption.
The benefit accrued under the Duty Drawback, Merchandise Export Incentive Scheme and other schemes as per the Import and Export Policy in respect of exports made under the said schemes is included as ‘Export Incentives' under the head ‘Other operating revenue'.
Notes to standalone financial statements for the year ended March 31, 2018
Overview
Strategyreview Performance Governance Financials
183
t. Convertible preference shares Convertible preference shares are separated into liability and equity components based on the terms of the contract.
On issuance of the convertible preference shares, the fair value of the liability component is determined using a market interest rate for an equivalent non-convertible instrument. This amount is classified as a financial liability measured at amortised cost (net of transaction costs) until it is extinguished on conversion or redemption.
The remainder of the proceeds are allocated to the conversion option that is recognised and included in equity if the conversion option meets Ind AS 32 criteria for fixed to fixed classification. Transaction costs are deducted from equity, net of associated income tax. The carrying amount of the conversion option is not remeasured in subsequent years.
Transaction costs are apportioned between the liability and equity components of the convertible preference shares based on the allocation of proceeds to the liability and equity components when the instruments are initially recognised.
u. Earnings Per Share: Basic earnings per share are calculated by dividing the net profit or loss for the period attributable to equity shareholders by the weighted average number of equity shares outstanding during the period.
For the purpose of calculating diluted earnings per share, the net profit or loss for the period attributable to equity shareholders and the weighted average number of shares outstanding during the period are adjusted for the effects of all dilutive potential equity shares.
v. Segment Reporting: Based on "Management Approach" as defined in Ind AS 108 -Operating Segments, the Chief Operating Decision Maker evaluates the
Company's performance and allocates the resources based on an analysis of various performance indicators by business segments. Inter segment sales and transfers are reflected at market prices.
Unallocable items includes general corporate income and expense items which are not allocated to any business segment.
Segment Policies:
The Company prepares its segment information in conformity with the accounting policies adopted for preparing and presenting the standalone financial statements of the Company as a whole. Common allocable costs are allocated to each segment on an appropriate basis.
w. Contingent Liability and Contingent assets A contingent liability is a possible obligation that arises from past events whose existence will be confirmed by the occurrence or
non—occurrence of one or more uncertain future events not wholly within the control of the Company or a present obligation that is not recognized because it is not probable that an outflow of resources will be required to settle the obligation. A contingent liability also arises in extremely rare cases where there is a liability that cannot be recognized because it cannot be measured reliably. The Company does not recognize a contingent liability but discloses its existence in the standalone financial statements.
A contingent asset is not recognised unless it becomes virtually certain that an inflow of economic benefits will arise. When an inflow of economic benefits is probable, contingent asset are disclosed in the standalone financial statements.
Contingent liabilities and contingent assets are reviewed at each balance sheet date.
x. Share Based Payments: Measurement and disclosure of the employee share based payment plans is done in accordance with Ind AS 102, Share Based Payment.
The Company measures compensation cost relating to employee stock options using the fair value method. Compensation expense is amortised over the vesting period of the option on a straight line basis.
y. Standards issued but not yet effective In March 2018, the Ministry of Corporate Affairs issued the Companies (Indian Accounting Standards) Amendment Rules, 2018, notifying
Ind As 115 ‘Revenue from Contracts with Customers’, which replaces Ind AS 11 ‘Construction Contracts’ and Ind As 18 ‘Revenue’. Except for the disclosure requirements, the new standard will not materially impact the Company’s standalone financial statements.
Amendment to Ind AS 21: Also Appendix B to Ind AS 21, foreign currency transactions and advance consideration was notified along with the same notification
which clarifies the date of the transaction for the purpose of determining the exchange rate to use on initial recognition of the related asset, expense or income, when an entity has received or paid advance consideration in a foreign currency.
The company has evaluated the effect of these on the stadalone financial statements and the impact is not material. These amendments will come into force from April 1, 2018.
Notes to standalone financial statements for the year ended March 31, 2018

UPL Limited Annual Report, 2017-18 184
Stan
dalo
ne S
tate
men
t of c
ash
flow
s fo
r the
yea
r end
ed M
arch
31,
201
8
3. P
rope
rty,
pla
nt a
nd e
quip
men
tIN
R C
rore
s
Lan
d -
Free
hold
L
and
- Le
aseh
old
Bui
ldin
g P
lant
and
Eq
uipm
ent
Lab
orat
ory
Equi
pmen
t's
Offi
ce
Equi
pmen
t's
Fur
nitu
re,
Fixt
ures
and
Eq
uipm
ent's
Veh
icle
s L
ease
hold
Im
prov
emen
ts
Cap
ital W
ork
in P
rogr
ess
Tota
l
Cost
or v
alua
tion
At
Mar
ch 3
1, 2
016
101
1
39
154
2
,106
2
3 4
5 5
0 2
7 5
4 1
90
2,8
89
Add
ition
s -
12
29
307
8
7
4
6
2
1
85
560
Dis
posa
ls
(8)
(0)
(4)
(17)
(2)
(1)
(0)
(0)
- -
(32)
Tran
sfer
/cap
italis
ed
- -
- -
- -
- -
- (1
26)
(126
)
At M
arch
31,
201
7 9
3 1
51
179
2
,396
2
9 5
1 5
4 3
3 5
6 2
49
3,2
91
Add
ition
s -
- 3
5 3
97
5
6
6
1
- 5
61
1,0
11
Dis
posa
ls
- -
(1)
(71)
(0)
(0)
(0)
(0)
- -
(73)
Tran
sfer
/cap
italis
ed
- -
- -
- -
- -
- (1
86)
(186
)
At M
arch
31,
201
8 9
3 1
51
213
2
,722
3
4 5
7 6
0 33
56
624
4
,043
Accu
mul
ated
Dep
reci
atio
n
At
Mar
ch 3
1, 2
016
- -
42
955
6
3
3 3
1 2
0 2
7 -
1,1
14
Dep
reci
atio
n (re
fer n
ote
27)
- -
6
171
3
1
0 7
4
4
-
205
Dis
posa
ls
- -
(0)
(7)
(2)
(1)
(0)
(0)
- -
(10)
At M
arch
31,
201
7 -
- 4
8 1
,119
7
4
2 3
8 2
4 3
1 -
1,3
09
Dep
reci
atio
n (re
fer n
ote
27)
- -
7
196
3
7
6
3
4
-
226
Dis
posa
ls
- -
(1)
(61)
0
(1)
(0)
(0)
- -
(63)
At M
arch
31,
201
8 -
- 5
4 1
,254
1
0 4
8 4
4 2
7 3
5 -
1,4
72
Net
boo
k va
lue
At M
arch
31,
201
8 9
3 1
51
159
1
,468
2
4 9
1
6 6
2
1 6
24
2,5
71
At M
arch
31,
201
7 9
3 1
51
131
1
,277
2
2 9
1
6 9
2
5 2
49
1,9
82
INR
Cro
res
Net
boo
k va
lue
Year
end
ed
Mar
ch 3
1, 2
018
Year
end
ed
Mar
ch 3
1, 2
017
Plan
t, pr
oper
ty a
nd e
quip
men
t 1
,947
1
,733
Capi
tal w
ork
in p
rogr
ess
624
2
49
2,5
71
1,9
82
Capi
tal W
ork
in P
rogr
ess
Capi
tal w
ork
in p
rogr
ess
as a
t Mar
ch 3
1, 2
018
and
Mar
ch 3
1, 2
017
com
pris
es e
xpen
ditu
re fo
r the
pla
nt a
nd b
uild
ing
in th
e co
urse
of c
onst
ruct
ion.

Overview
Strategyreview Performance Governance Financials
185St
anda
lone
Sta
tem
ent o
f cas
h flo
ws
for t
he y
ear e
nded
Mar
ch 3
1, 2
018
4. I
ntan
gibl
e as
sets
INR
Cro
res
Oth
er In
tang
ible
Ass
ets
Inta
ngib
le
asse
t und
er
deve
lopm
ent
Tota
l
Goo
dwill
*D
ata
Acce
ss
Fees
Prod
uct
Regi
stra
tions
Prod
uct
Acqu
isiti
ons
Task
For
ce
Expe
nses
Soft
war
e/
Lice
nse
Fees
Bran
ds/
Trad
e M
arks
Tech
nica
l Kn
owho
wG
erm
plas
m
Cost
or v
alua
tion
At
Mar
ch 3
1, 2
016
3,7
04
97
167
6
03
23
21
63
11
13
19
4,7
21
Add
ition
s -
- 1
7 -
- 4
-
- -
10
31
Tran
sfer
/cap
italis
ed -
- -
- -
- -
- -
(6)
(6)
At M
arch
31,
201
7 3
,704
9
7 1
84
603
2
3 2
5 6
3 1
1 1
3 2
3 4
,746
Add
ition
s -
0
8
- -
4
- -
- 1
7 2
9
Dis
posa
ls -
- -
- -
0
- -
- -
0
Tran
sfer
/cap
italis
ed -
- -
- -
- -
- -
(1)
(1)
At M
arch
31,
201
8 3
,704
9
7 1
92
603
2
3 2
9 6
3 1
1 1
3 3
9 4
,774
Am
ortis
atio
n
At
Mar
ch 3
1, 2
016
370
9
4 9
2 2
38
11
12
56
10
7
- 8
90
Am
ortis
atio
n (re
fer n
ote
27)
369
0
2
6 4
1 3
4
6
0
1
-
450
At M
arch
31,
201
7 7
39
94
118
2
79
14
16
62
10
8
- 1
,340
Am
ortis
atio
n (re
fer n
ote
27)
370
1
2
2 4
0 3
4
0
-
0
- 4
40
At M
arch
31,
201
8 1
,109
9
5 1
40
319
1
7 2
0 6
2 1
0 8
-
1,7
80
Net
boo
k va
lue
At M
arch
31,
201
8 2
,595
2
5
2 2
84
6
9
1
1
5
39
2,9
94
At M
arch
31,
201
7 2
,965
3
6
6 3
24
9
9
1
1
5
23
3,4
06
INR
Cro
res
Net
boo
k va
lue
Year
end
ed
Mar
ch 3
1, 2
018
Year
end
ed
Mar
ch 3
1, 2
017
Goo
dwill
2,5
95
2,9
65
Oth
er in
tang
ible
ass
ets
360
4
18
Inta
ngib
le a
sset
s un
der d
evel
opm
ent
39
23
2,9
94
3,4
06
*Goo
dwill
aris
ing
on A
mal
gam
atio
nG
oodw
ill in
clud
es g
oodw
ill a
risin
g on
am
alga
mat
ion
of A
dvan
ta L
imite
d fu
lly d
escr
ibed
in n
ote
45 o
f the
fina
ncia
l sta
tem
ents
.
Goo
dwill
is t
este
d fo
r im
pairm
ent
on a
nnua
l bas
is a
nd w
hene
ver
ther
e is
an
indi
catio
n th
at t
he r
ecov
erab
le a
mou
nt is
less
tha
n its
car
ryin
g am
ount
bas
ed o
n a
num
ber
of fa
ctor
s in
clud
ing
busi
ness
pla
n, o
pera
ting
resu
lts, f
utur
e ca
sh fl
ows
and
econ
omic
con
ditio
ns. T
he re
cove
rabl
e am
ount
is d
eter
min
ed b
ased
on
high
er o
f val
ue in
use
and
fair
valu
e le
ss c
ost t
o se
ll.Th
e Co
mpa
ny g
ener
ally
use
s di
scou
nted
cas
h flo
ws
met
hod
to d
eter
min
e th
e re
cove
rabl
e am
ount
. The
se d
isco
unte
d ca
sh fl
ow c
alcu
latio
ns u
se fi
ve-y
ear p
roje
ctio
ns th
at a
re b
ased
on
finan
cial
fo
reca
sts.
Cash
flow
pro
ject
ions
take
into
acc
ount
pas
t exp
erie
nce
and
repr
esen
t man
agem
ents
' bes
t est
imat
e ab
out f
utur
e de
velo
pmen
ts.

UPL Limited Annual Report, 2017-18 186
5. Investments INR Crores
March 31, 2018 March 31, 2017
Investment stated at Cost
(A) Investments in Equity Instruments a. Investment in Subsidiaries (Unquoted)(i) 136,000 (March 31, 2017: 136,000) Ordinary Shares of US $ 100 each fully paid-
up in UPL Corporation Limited (formerly known as Bio-Win Corporation Ltd) 77 77
(ii) 3,053 (March 31, 2017: 3,053) equity shares of Euro 100 each, fully paid-up in Advanta Holdings B.V., Netherlands
171 171
(iii) 50,007 (March 31, 2017: 50,007) Equity Shares of H10 each fully paid-up in Shroff's United Chemicals Limited
0 0
(iv) 99,000 (March 31, 2017 : 99,000) equity shares of $ 1 each, fully paid-up in PT Advanta Indonesia
1 1
(v) 1,000,007 (March 31,2017: 1,000,007) Equity Shares of H10 each fully paid-up in SWAL Corporation Limited
17 17
(vi) 1,000,000 (March 31, 2017: 1,000,000) ordinary shares of $ 1 each, fully paid-up in Advanta Seed International, Mauritius
0 0
(vii) 1,000,000 (March 31, 2017: 1,000,000) Equity Shares of H10 each fully paid-up in Agrinet Solutions Limited
2 2
(viii) United Phosphorus (India) LLP - Capital Contribution in LLP 15 9
Name of Partners: UPL Limited
SWAL Corporation Limited
Total Capital of the firm: H15,300,000
Share of each partner: UPL Limited - 95%
SWAL Corporation Limited - 5%(ix) United Phosphorus (Global) LLP - Capital Contribution in LLP 0 0
Name of Partners: UPL Limited
SWAL Corporation Limited
Total Capital of the firm: H1,000,000
Share of each partner: UPL Limited - 95%
SWAL Corporation Limited - 5%b. Investment in Associates (Unquoted)
(i) 921,000 (March 31, 2017: 921,000) Equity Shares of H10 each fully paid-up in Chemiesynth
(Vapi) Limited
0 0
(ii) 3,350,000 (March 31, 2017: 3,350,000) Equity Shares of H10 each fully paid-up in Kerala
Enviro Infrastructure Limited
3 3
(iii) 37,681 (March 31, 2017: 37,681) equity shares of H10 each, fully paid-up in Weather Risk Management Services Pvt Ltd
10 10
(B) Investments in Preference Instruments in subsidiaries (Unquoted)6,393 (March 31, 2017: 6,393) Preference shares of Euro 5,000 each, fully paid-up in Advanta Holdings B.V., Netherlands
Investment stated at Amortised Cost 210 210
Investments in Government or trust securities (Unquoted)
Indira Vikas Patra [Face Value: Current Year: H0.06 lac.[March 31, 2017: H0.06 lac]] 0 0
National Saving Certificates [Face Value: Current Year: H0.06 lac. [March 31, 2017: H0.06 lac]]
0 0
Notes to standalone financial statements for the year ended March 31, 2018

Overview
Strategyreview Performance Governance Financials
187
Notes to standalone financial statements for the year ended March 31, 2018
Aggregate book value and Market value of quoted investments 5 3 Aggregate amount of unquoted investments 589 590 Impairment of Investments - -
Impairment of Investments
Investment at fair value through Profit and loss (fully paid) reflect investment in debt
instruments. Refer note 39 for determination of their fair values.
Investment at fair value through OCI (fully paid) reflect investment in quoted equity securities.
Refer note 39 for determination of their fair values.
5. Investments INR Crores
March 31, 2018 March 31, 2017
Investments stated at Fair Value through OCI
Investments in Equity Instruments (Quoted)
28,100 [March 31, 2017: 28,100] Equity Shares of H10 each fully paid—up in Gujarat State Financial Corporation
0 1
50,000 [March 31, 2017: 50,000] Equity Shares of H10 each fully paid—up in Nivi Trading Limited
0 0
41,150 [March 31, 2017: 41,150] Equity Shares of H10 each fully paid—up in Transpek Industry Limited
5 2
5,307 [March 31, 2017: 5,307] Equity Shares of H10 each fully paid—up in IDFC Limited
0 0
5,307 [March 31, 2017: 5,307] Equity Shares of H10 each fully paid—up in IDFC Bank Limited.
0 0
17,990 [March 31, 2017: 17,990] Equity Shares of H2 each fully paid—up in Bank of Baroda Limited
0 0
Investments stated at Fair Value through Profit and Loss
a. Investments in Optionally Convertible Bonds (Unquoted)
6,855 [March 31, 2017: 6,855] Optionally Convertible Bonds of H1.00,000 each in Tatva
Global Environment Private Limited
76 83
b. Investment in Others (Unquoted)
10,000 (March 31, 2017:10,000) Equity Shares of H10 each fully paid-up in Janakalyan
Sahakari Bank Limited
0 0
1,000,000 (March 31, 2017: 1,000,000) Equity Shares of H10 each fully paid-up in Uniphos
International Limited
0 0
45,000 (March 31, 2017: 45,000) Equity Shares of H10 each fully paid-up in Bloom
Packaging Private Limited
1 1
19,025 (March 31, 2017: 19,025) Equity Shares of H10 each fully paid-up in Bench Bio
Private Limited
1 1
240,000 (March 31, 2017: 240,000) Equity shares of H10 each fully paid-up in UPL
Investment Private Limited
2 2
57 [March 31, 2017: 57] Ordinary Shares of 1 Rand each fully paid-up in Cropserve [PTY]
Limited
0 0
3,435,070 [March 31, 2017: 3,435,070] Equity Shares of H10 each fully paid-up in Narmada
Clean Tech Limited
3 3
Total Non-Current Investments 594 593
(Contd.)

UPL Limited Annual Report, 2017-18 188
Notes to standalone financial statements for the year ended March 31, 2018
5. Investments (Contd.)
Extent of equity interest in subsidiaries, joint venture and associates
Name and Country of Incorporation % of equity interestMarch 31, 2018 March 31, 2017
a. Subsidiaries
UPL Corporation Limited (formerly known as Bio-Win Corporation 100% 100%
Ltd), Mauritius"
Advanta Holdings B.V., Netherlands 100% 100%
PT Advanta Indonesia 100% 100%
SWAL Corporation Limited, India 100% 100%
Advanta Seed International, Mauritius 100% 100%
Agrinet Solutions Limited, India 50% 50%
Shroffs United Chemicals Limited, India 100% 100%
United Phosphorus (India) LLP 95% 95%
United Phosphorus (Global) LLP, India 95% 95%
b. Associates
Chemiesynth (Vapi) Limited, India 30% 30%
Kerala Enviro Infrastructure Limited, India 28% 28%
Weather Risk Management Services Pvt Ltd, India 27% 27%
6. Loans INR Crores
Non-current CurrentMarch 31, 2018 March 31, 2017 March 31, 2018 March 31, 2017
(A) Security Deposit
a. Unsecured, Considered good
- to related parties (refer note 36) 15 5 - -
- to other than related parties 59 74 - -
b. Unsecured, Considered doubtful 2 2 - -
Less: Allowance for doubtful security deposit (2) (2) - -
74 79 - -
(B) Loans and Advances to related parties (refer note 32 and 36)
a. Unsecured, Considered good 831 859 98 127
831 859 98 127
(C) Loans to employees
a. Unsecured, Considered good - 3 7 1
- 3 7 1
(D) Sundry loans
Unsecured, Considered doubtful 2 2 - -
Less: Allowance for doubtful sundry loans (2) (2) - -
Total loans 905 941 105 128
Loans and receivables are non-derivative financial assets which generate a fixed or variable interest income for the Company.

Overview
Strategyreview Performance Governance Financials
189
Notes to standalone financial statements for the year ended March 31, 2018
7. Other Financial Assets INR Crores
Non-current CurrentMarch 31, 2018 March 31, 2017 March 31, 2018 March 31, 2017
(A) Interest receivable
a. Unsecured, Considered good - - 24 5
b. Unsecured, Considered doubtful - - 0 0
Less: Allowance for doubtful Interest receivable - - (0) (0)
- - 24 5
(B) Receivables from related parties (refer note 36)
a. Unsecured, Considered good - - 68 47
- - 68 47
(C) Export Benefits receivables
Unsecured, Considered good 35 60 82 75
35 60 82 75
(D) Other receivables
Unsecured, Considered doubtful - - 2 2
Less: Allowance for doubtful other financial assets - - (2) (2)
Total Other Financial Assets 35 60 174 127
8. Other Assets INR Crores
Non-current CurrentMarch 31, 2018 March 31, 2017 March 31, 2018 March 31, 2017
(i) Capital advances 66 32 - -
(ii) Statutory receivables 158 179 606 300
(iii) Prepaid Expense - 4 46 25
(vi) Other Advances - - 35 39
224 215 687 364
9. Inventories(Valued at lower of cost and net realisable value) INR Crores
March 31, 2018 March 31, 2017
a. Raw materials and components [includes goods in transit: H22 crores (March 31, 2017: H9
crores)]
519 404
b. Work in progress 147 148
c. Finished goods 638 647
d. Traded goods [includes goods in transit: H3 crores (March 31, 2017: H5 crores)] 80 91
e. Store and spares [including fuel] 40 31
f. Packing Material 25 28
g. By products 3 6
1,452 1,355

UPL Limited Annual Report, 2017-18 190
Notes to standalone financial statements for the year ended March 31, 2018Notes to standalone financial statements for the year ended March 31, 2018
10. Trade receivables INR Crores
March 31, 2018 March 31, 2017
Unsecured, Considered good 2,017 1,957
Unsecured, Considered doubtful 77 69
Less: Allowance for doubtful trade receivable (77) (69)
Total trade receivables 2,017 1,957
No trade or other receivable are due from directors or other officers of the company either severally or jointly with any other person. There are
no trade or other receivable are due from firms or private companies respectively in which any director is a partner, a director or a member.
For terms and conditions relating to related party receivables, refer Note 36.
Trade receivables are non-interest bearing and are generally on terms of 45 to 270 days.
The Company has entered into an agreement to sell and assign its receivables to certain banks. In connection therewith, the Company sells
its receivables to these banks on a non recourse basis. When the Company sells its receivables to these banks the transfer is treated as a "true
sale" for both legal and financial reporting purposes. As such, the assets once transferred to these banks are not reflected on the balance
sheet date of the Company. As at March 31, 2018, the Company sold receivables which have been derecognised amounting to H48 crores.
(March 31, 2017: H147 crores). For explanations on the Company’s credit risk management processes, refer note 41.
11. Cash and cash equivalents INR Crores
March 31, 2018 March 31, 2017
Balances with banks
- Current accounts 93 59
Cash on Hand 0 0
Total Cash and cash equivalents 93 59
12. Share Capital Authorised Share Capital
Equity Shares of INR 2 each No. INR Crores
At April 1, 2016 1,27,50,00,000 255
Increase/(decrease) during the year (3,75,00,000) (7)
At March 31, 2017 1,23,75,00,000 248
Increase/(decrease) during the year - -
At March 31, 2018 1,23,75,00,000 248
11A. Other Bank Balances INR Crores
March 31, 2018 March 31, 2017
- Unclaimed Dividend accounts 7 6
- Margin money deposit ** 14 5
- Deposits with original maturity for more than 3 months but less than 12 months 12 1
Total Other Bank Balances 33 12
** Margin money deposits given as security against Bank Guarantees
For the purpose of the statement of cash flows, cash and cash equivalents comprise the following: INR Crores
March 31, 2018 March 31, 2017
Balances with banks:
-Current accounts 93 59
Cash on Hand 0 0
Total Cash and cash equivalents 93 59

Overview
Strategyreview Performance Governance Financials
191
Notes to standalone financial statements for the year ended March 31, 2018Notes to standalone financial statements for the year ended March 31, 2018
Issued equity capitalEquity shares of INR 2 each issued, subscribed and fully paid
Equity Shares of INR 2 each No. INR Crores
At April 1, 2016 42,86,04,274 86
Increase/(decrease) during the year 7,84,12,844 15
At March 31, 2017 50,70,17,118 101
Increase/(decrease) during the year 23,15,963 1
At March 31, 2018 50,93,33,081 102
Terms/ rights attached to equity sharesThe Company has one class of equity shares having par value of H2 per share. Each holder of equity shares is entitled to one vote per share.
The Company declares and pays dividends in Indian rupees. The dividend proposed by the Board of Directors is subject to the approval of the
shareholders in the ensuing Annual General Meeting.
In the event of liquidation of the Company, the holders of equity shares will be entitled to receive the remaining assets of the Company,
after distribution of all preferential amounts. The distribution will be in proportion to the number of equity shares held by the shareholders.
During the year ended March, 2018, the amount of per share dividend proposed as distributions to equity shareholders is H8 (March, 2017: H7)
Details of shareholders holding more than 5% shares in the companyName of the shareholder
March 31, 2018 March 31, 2017No. in crores % holding
in the classNo. in crores % holding
in the classEquity shares of INR 2 each fully paid
Nerka Chemicals Private Limited 10 19.94% 10 19.98%
Uniphos Enterprises Limited 3 5.01% 3 5.03%
As per records of the Company, including its register of shareholders/ members and other declarations received from shareholders regarding
beneficial interest, the above shareholding represents both legal and beneficial ownerships of shares.
Aggregate number of equity shares issued as bonus, shares issued for consideration other than cash and shares bought back during the
period of five years immediately preceding the reporting date:
March 31, 2018 March 31, 2017
INR Crores
Equity shares bought back by the Company. 3 3
There are 42,353,062 shares (March 31, 2017: 42,361,062) underlying equity shares of the Company in respect of GDR's traded on Luxemburg
Stock Exchange and against conversion of each GDR ten equity shares were issued.
There are NIL shares (March 31, 2017: 42,103,942) underlying equity shares of the Company in respect of GDR's listed on Singapore Stock
Exchange were issued pursuant to scheme of amalgamation of Advanta Limited with the Company (refer note 45).
12A. Preference Share CapitalAuthorised Share Capital
Optionally Convertible Preference Shares (OCPS) of INR 100 each
Compulsorily Convertible Preference Shares (CCPS) of
INR 100 each No. INR Crores No. INR Crores
At April 1, 2016 1,40,00,000 140 50,00,000 5
Increase/(decrease) during the year (1,40,00,000) (140) 22,45,00,000 225
At March 31, 2017 - - 22,95,00,000 230
Increase/(decrease) during the year - - - -
At March 31, 2018 - - 22,95,00,000 230
12. Share Capital (Contd.)
UPL Limited Annual Report, 2017-18 192
Notes to standalone financial statements for the year ended March 31, 2018Notes to standalone financial statements for the year ended March 31, 2018
Issued Preference Share Capital
Optionally Convertible Preference Shares
Compulsorily Convertible Preference Shares
No. INR Crores No. INR Crores
At April 1, 2016 - - - -
Increase/(decrease) during the year 2,46,42,786 25 8,19,40,125 82
At March 31, 2017 2,46,42,786 25 8,19,40,125 82
Debt portion of OCPS considered as part of Short term
borrowings
- 24 - -
Equity portion of OCPS considered as part of other Equity - 1 - -
At March 31, 2017 2,46,42,786 25 8,19,40,125 82
Increase/(decrease) during the year (2,46,42,786) (25) (8,19,40,125) (82)
At March 31, 2018 - - - -
Terms/ rights attached to preference sharesEach Compulsory convertible preference share (CCPS) has a par value of INR 10 and is convertible at the option of the shareholders into Equity
shares of the Company starting within 18 months from the date of allotment i.e. from August 08, 2016 on the basis of ten new equity shares
of INR 2 for every four hundred and seventy one CCPS held. If the CCPS are not converted within 18 months from the date of allotment, then
the CCPS shall be automatically converted into equity shares of the Company at the end of 18 months from the date of allotment. The CCPS
carry a dividend of 5% per annum, payable annually, subject to deduction of taxes at source, if applicable. The CCPS shall be non-cumulative
and non-participating in nature. The holder of CCPS shall have right to vote in accordance with Section 47 of the Companies Act, 2013.
Each Optionally convertible preference share (OCPS) has a par value of INR 10 and is convertible at the option of the shareholders into Equity
shares of the Company starting within 18 months from the date of allotment i.e. from August 08, 2016 on the basis of ten new equity shares
of INR 2 for every four hundred and seventy one OCPS held. If the OCPS are not converted within 18 months from the date of allotment, then
the OCPS shall be automatically redeemed at par. The OCPS carry a dividend of 5% per annum, payable annually, subject to deduction of
taxes at source, if applicable. The OCPS shall be non-cumulative and non-participating in nature. The holder of OCPS shall have right to vote
in accordance with Section 47 of the Companies Act, 2013. The presentation of the liability and equity portions of these shares is explained
in the summary of significant accounting policy.
12B. Share Capital Suspense During the year March 31, 2017, the Company had allotted Equity Shares, Compulsorily Convertible Preference Shares and Optionally
Convertible Preference Shares to the shareholders of erstwhile Advanta Limited, pursuant to Scheme of Amalgamation as described in detail
in Note 45. Accordingly , the balance lying in Share Capital Suspense Account was transferred to respective Equity / Liability Account.
12C. Distribution made & proposed INR Crores
March 31, 2018 March 31, 2017
Cash dividends on Equity shares declared and paid:
Final dividend for the year 31 March 2017: H7 per share (31 March 2016: H5 per share) 357 214
Proposed dividends on Equity shares:
Proposed cash dividend for the year 31 March 2018: H8 per share (March 31, 2017: H7 per share) 407 355
Proposed dividend on equity shares is subject to approval at the annual general meeting and is not recognised as a liability as at the year end.
12D. Shares reserved for issue under optionsFor details of shares reserved for issue under the Employee Stock Option Plan (ESOP) of the Company (refer note 34)
12A. Preference Share Capital (Contd.)
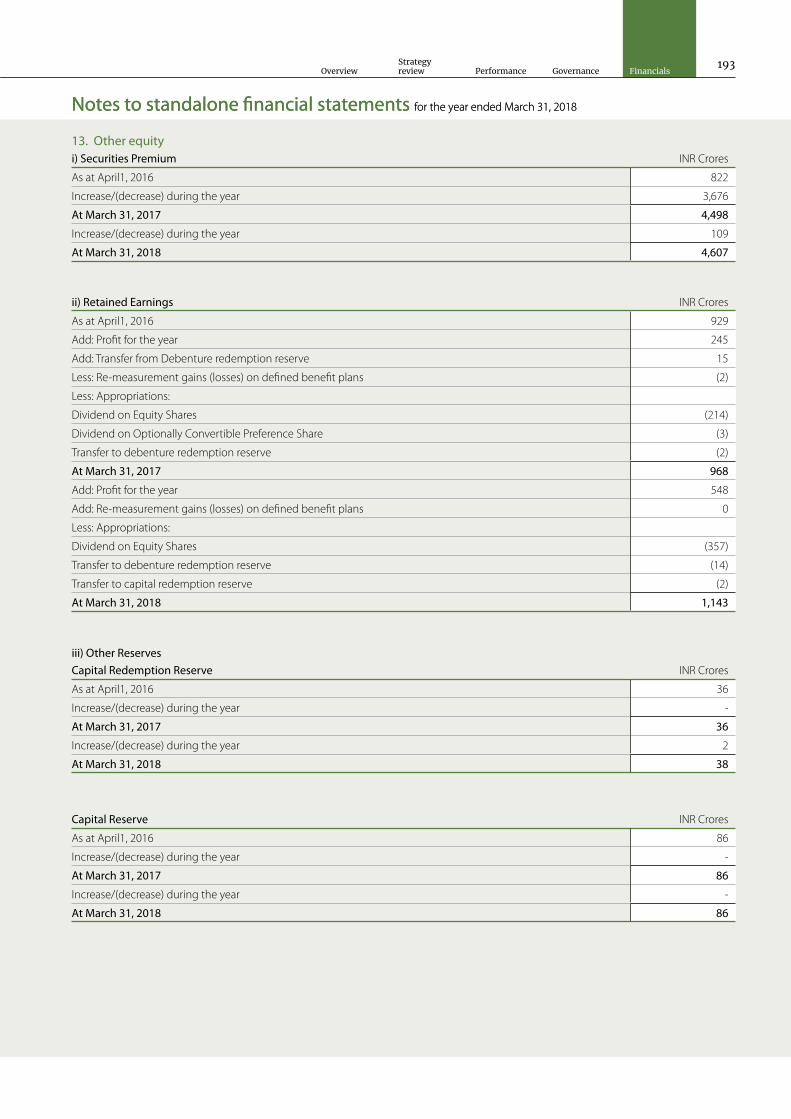
Overview
Strategyreview Performance Governance Financials
193
Notes to standalone financial statements for the year ended March 31, 2018Notes to standalone financial statements for the year ended March 31, 2018
13. Other equityi) Securities Premium INR Crores
As at April1, 2016 822
Increase/(decrease) during the year 3,676
At March 31, 2017 4,498
Increase/(decrease) during the year 109
At March 31, 2018 4,607
iii) Other ReservesCapital Redemption Reserve INR Crores
As at April1, 2016 36
Increase/(decrease) during the year -
At March 31, 2017 36
Increase/(decrease) during the year 2
At March 31, 2018 38
Capital Reserve INR Crores
As at April1, 2016 86
Increase/(decrease) during the year -
At March 31, 2017 86
Increase/(decrease) during the year -
At March 31, 2018 86
ii) Retained Earnings INR Crores
As at April1, 2016 929
Add: Profit for the year 245
Add: Transfer from Debenture redemption reserve 15
Less: Re-measurement gains (losses) on defined benefit plans (2)
Less: Appropriations:
Dividend on Equity Shares (214)
Dividend on Optionally Convertible Preference Share (3)
Transfer to debenture redemption reserve (2)
At March 31, 2017 968
Add: Profit for the year 548
Add: Re-measurement gains (losses) on defined benefit plans 0
Less: Appropriations:
Dividend on Equity Shares (357)
Transfer to debenture redemption reserve (14)
Transfer to capital redemption reserve (2)
At March 31, 2018 1,143

UPL Limited Annual Report, 2017-18 194
Notes to standalone financial statements for the year ended March 31, 2018Notes to standalone financial statements for the year ended March 31, 2018
Debenture Redemption Reserve INR Crores
As at April1, 2016 140
Add: Amount transferred from retained earnings 2
Less: Amount transferred to retained earnings (15)
At March 31, 2017 127
Add: Amount transferred from retained earnings 14
Less: Amount transferred to retained earnings -
At March 31, 2018 141
Share based payment reserve INR Crores
As at April1, 2016 2
Increase/(decrease) during the year 0
At March 31, 2017 2
Increase/(decrease) during the year (2)
At March 31, 2018 0
General Reserve INR Crores
As at April1, 2016 1,848
Increase/(decrease) during the year -
At March 31, 2017 1,848
Increase/(decrease) during the year -
At March 31, 2018 1,848
Equity Component of convertible preference shares INR Crores
As at April1, 2016 -
Increase/(decrease) during the year 0
At March 31, 2017 0
Increase/(decrease) during the year (0)
At March 31, 2018 -
Equity Instruments through Other Comprehensive Income INR Crores
As at April1, 2016 1
Increase/(decrease) during the year 1
At March 31, 2017 2
Increase/(decrease) during the year 3
At March 31, 2018 5
Securities Premium Reserve - Where the Company issues shares at a premium, whether for cash or otherwise, a sum equal to the aggregate
amount of the premium received on those shares shall be transferred to “Securities Premium Reserve”. The Company may issue fully paid-up
bonus shares to its members out of the securities premium reserve and the Company can use this reserve for buy-back of shares.
Capital Redemption Reserve - Capital Redemption Reserve was created for buy-back of shares and can be utilised for issuance of fully paid
up bonus shares.
Capital Reserve - The Company recognizes profit or loss on purchase, sale, issue or cancellation of the Company’s own equity instruments to
capital reserve.
13. Other equity (Contd.)

Overview
Strategyreview Performance Governance Financials
195
Notes to standalone financial statements for the year ended March 31, 2018Notes to standalone financial statements for the year ended March 31, 2018
13. Other equity (Contd.)
Debenture Redemption Reserve (DRR) - The Company has issued redeemable non-convertible debentures. Accordingly, the Companies
(Share capital and Debentures) Rules, 2014 (as amended), require the company to create DRR out of profits of the Company available for
payment of dividend. DRR is required to be created for an amount which is equal to 25% of the value of debentures issued.
Share Based Payment Reserve - The Company has an employee stock option scheme under which the option to subscribe for the companies
share have been granted to the key employees and directors. The share-based payment reserve is used to recognize the value of equity-
settled share-based payments provided to the key employees as part of their remuneration. Refer to Note 34 for further details of the scheme.
General Reserve - General Reserve is created out of the profits earned by the Company by way of transfer from surplus in the statement of
profit and loss. The Company can use this reserve for payment of dividend subject to compliance with declaration of dividend out of reserve
rules and issue of fully paid-up and not paid-up bonus shares.
Other reserves INR Crores
March 31, 2018 March 31, 2017
Capital Redemption Reserve 38 36
Capital Reserve 86 86
Debenture Redemption Reserve 141 127
Share based payment reserve 0 2
General Reserve 1,848 1,848
Equity Component of convertible preference shares - 0
Equity Instruments through Other Comprehensive Income 5 2
Total other reserves 2,118 2,101
14. Borrowings INR CroresEffective interest
rateMaturity March 31, 2018 March 31, 2017
Debentures
Unsecured Redeemable Non convertible Debentures
(NCDs) (Refer note a below)
10.44% to 10.85% 2018-2026 682 756
Current maturities of Non- current Debentures 127 52
Total Non-current Borrowings 809 808
Less: Amount clubbed under “other current financial
liabilities” (refer note 15)
(127) (52)
Net Non-current Borrowings 682 756
Aggregate Secured loans (non-current) - -
Aggregate Unsecured loans (non-current) 682 756
Current Borrowings INR Crores
Maturity March 31, 2018 March 31, 2017
Loans repayable On Demand
From Banks
Cash credit, packing credit and working capital demand loan accounts (Refer note b below)
- Secured (MCLR+50bsp and 6 months LIBOR+50bps) On demand 65 3
- Unsecured (6 months LIBOR+05 to 50bps and 1month GSEC+5bps) On demand 248 13
Liability component of compound financial instrument
Optionally Convertible preference shares (unsecured) (refer note 12A) - 24
Total current Borrowings 313 40
Aggregate Secured loans (current) 65 3
Aggregate Unsecured loans (current) 248 37

UPL Limited Annual Report, 2017-18 196
a. Unsecured Redeemable Non-Convertible Debentures (NCD's)
i) The Borrowings and current maturities of long term borrowings include H49 crores (March,31 2017: H48 crores) pertaining to interest
accrued but not due on account of recognition of Debentures at amortised cost as per EIR method.
ii) NCDs of face value amounting to H300 crores (March 31, 2017: H300 crores) have been issued under two series and are redeemable
at par at the end of 10th year H150 crores i.e June, 2022 and 7th year H150 crores i.e June, 2019 from the date of allotment. Out of
the above, NCDs amounting to H90 crores have been bought back by the Company.
iii) NCDs of face value amounting to H250 crores (March 31, 2017: H250 crores) are redeemable at par at the end of 15th year i.e July 2026
from the date of allotment . The NCDs carry a call option at the end of 10th year from the date of allotment.
iv) NCDs of face value aggregating to H300 crores (March 31, 2017: H300 crores) have been issued under four series and are redeemable
at par of H75 crores each at the end of 12th year, 11th year, 9th year and 8th year i.e. October 2022, October 2021, October 2019 and
October 2018 respectively from the date of allotment.
v) NCDs mentioned above carry a coupon rate ranging from 10.25% to 10.70%.
b. Secured Loan repayable on demand from Banks Outstanding loan is secured by hypothecation of inventories, bills receivables, book debts and all movable assets of the Company both
present and future, wherever situated.
14. Borrowings (Contd.)
Notes to standalone financial statements for the year ended March 31, 2018Notes to standalone financial statements for the year ended March 31, 2018
15. Other financial liabilities INR Crores
Non-current CurrentMarch 31, 2018 March 31, 2017 March 31, 2018 March 31, 2017
Financial liabilities at fair value through profit or loss
Derivatives contract (net) 135 142 36 -
Total financial liabilities at fair value through profit or loss 135 142 36 -
Other financial liabilities carried at amortised Cost
Current maturities of long-term borrowings (note 14) - - 127 52
Trade Deposits - - 51 51
Creditors for capital goods - - 154 38
Interest accrued on borrowings - - 1 -
Unpaid dividend - - 7 6
Others 4 4 1 1
Total other financial liabilities carried at amortised Cost 4 4 341 148
Total other financial liabilities 139 146 377 148
16. Other current liabilities INR Crores
March 31, 2018 March 31, 2017
Advances against Orders 52 49
Statutory Liabilities 7 41
Other liabilities 3 4
Total other current liabilities 62 94
17. Trade payables INR Crores
Non-current
March 31, 2018 March 31, 2017
Trade payables - 9
- 9

Overview
Strategyreview Performance Governance Financials
197
Notes to standalone financial statements for the year ended March 31, 2018Notes to standalone financial statements for the year ended March 31, 2018
18. Trade payables INR Crores
Current
March 31, 2018 March 31, 2017
- Outstanding dues of micro and small enterprises 17 1
- Outstanding dues of other than micro and small enterprises 2,336 2,187
2,353 2,188
Terms and conditions of the above financial liabilities:
Trade payables are non-interest bearing and are normally settled on 90-360 days terms
For terms and conditions with related parties, refer note 36
For explanations on the Company’s credit risk management processes, refer note 41
19. Income taxes a) The major components of income tax expense for the year are as under:i) Income tax expenses recognised in the statement of profit and loss: INR Crores
March 31, 2018 March 31, 2017
Current tax:
In respect of current year 180 89
Adjustments of tax relating to earlier years (83) -
Deferred tax:
In respect of current year (69) 84
28 173
ii) Income tax expenses recognised in OCI: INR Crores
March 31, 2018 March 31, 2017
Deferred tax expenses on remesurement of defined benfit plan 0 1
0 1
b) Reconciliation of tax expense and the accounting profit for the year is as under: INR Crores
March 31, 2018 March 31, 2017
Accounting profit before income tax 576 418
Statutory income tax rate of 34.608% (March 31, 2017: 34.608%) 199 144
Dividend Income from Subsidiary (123) (75)
Investment Allowance on new Plant & Machinery - (16)
Additional deduction on expenditure on Research & Development (11) (15)
Amortisation of goodwill in books considered as not deductible in provision for tax 128 128
Agricultural Income exempt from tax (19) -
MAT credit of earlier years* (63) -
Others 0 6
111 173
Adjustments of tax relating to earlier years* (83) -
Income tax expense reported in the statement of profit and loss 28 173
* Pursuant to the completion of assessments for the past years, the Company has written back excess provision of tax of H83 crores and
recognised minimum alternate tax credit entitlement of H63 crores.

UPL Limited Annual Report, 2017-18 198
Notes to standalone financial statements for the year ended March 31, 2018Notes to standalone financial statements for the year ended March 31, 2018
19. Income taxes (Contd.)
c) Deferred taxThe major components of Deferred tax assets/ (liablities) arising on account of temprory difference are as follows: INR Crores
Balance Sheet Statement of profit and lossMarch 31, 2018 March 31, 2017 March 31, 2018 March 31, 2017
Accelerated depreciation for tax purposes (205) (189) 16 18
Debentures carried at amortised cost 1 (2) (3) (0)
Minimum tax credit 63 - (63) 75
Provision for doubtful debts and advances 42 32 (10) 3
Gratuity 8 6 (2) (2)
Leave Encashment 24 22 (2) (4)
Unwinding of interest cost of trade payables (3) (7) (4) (1)
Others 7 5 (2) (5)
Net deferred tax assets/(liabilities) (64) (133) - -
Deferred tax expense/(income) - (69) 84
Reflected in the balance sheet as follows: INR Crores
Balance SheetMarch 31, 2018 March 31, 2017
Deferred tax assets 144 65
Deferred tax liabilities: (208) (198)
Deferred tax liabilities, net (64) (133)
Reconciliation of deferred tax liabilities (net): INR Crores
Balance SheetMarch 31, 2018 March 31, 2017
Opening balance as of 1 April (133) (49)
Tax income/(expense) during the year recognised in profit or loss 69 (84)
Tax income/(expense) during the year recognised in OCI 0 (1)
Tax income/(expense) during the year recognised in Equity - 1
Closing balance as at 31 March (64) (133)
The Company offsets tax assets and liabilities if and only if it has a legally enforceable right to set off current tax assets and current tax liabilities
and the deferred tax assets and deferred tax liabilities relate to income taxes levied by the same tax authority.
Given that the Company does not have any intention to dispose investments in subsidiaries and associates in the forseeable future, deferred
tax asset on indexation benefit in relation to such investments has not been recognised. Similarly, the Company does not have any intention
to dispose of its free hold and lease hold land in the forseeable future, therefore, deferred tax asset on indexation benefit in relation to these
assets has not been recognised.
20. Provisions INR Crores
March 31, 2018 March 31, 2017
Leave encashment
Dividend on CCPS
Total Leave encashment
Dividend on CCPS
Total
Opening 63 3 66 51 - 51
Arising during the year 5 - 5 20 3 23
Utilised - (3) (3) (8) - (8)
Closing 68 - 68 63 3 66

Overview
Strategyreview Performance Governance Financials
199
Notes to standalone financial statements for the year ended March 31, 2018Notes to standalone financial statements for the year ended March 31, 2018
21. Revenue from operations INR Crores
March 31, 2018 March 31, 2017
Sale of products (including excise duty) 7,168 7,107
Sale / rendering of services
Job-work income 20 16
Management service fees 13 8
Others 1 1
Other operating revenues -
Export Incentives 86 88
Refund of statutory receivable 14 29
Excess Provisions in respect of earlier years written back (net) 38 23
Royalty Income 24 1
Miscellaneous Receipts 10 4
Total Revenue from operations 7,374 7,277
The Government of India introduced the Goods and Services Tax (GST) with effect from 1st July 2017, consequently revenue from operations
for the period from July 31, 2017 upto March 31, 2018 is net of GST. However revenue for the quarter ended 30th June 2017 included in the
year ended March 31, 2018 and for the year ended March 31, 2017 is inclusive of excise duty. The Net Revenue from Operations (Net of GST/
Excise Duty) as applicable are stated below:
22. Other income INR Crores
March 31, 2018 March 31, 2017
Interest income on
Bank deposits 1 2
Loans and others 68 61
Dividend Income on
Long-term investments in Subsidiary (refer note 36) 356 216
Other non-operating income
Fair value gain/(loss) on financial instruments at fair value through profit or loss (7) 12
Rent received 4 4
Profit on sale of assets (net) - 10
Profit on sale of Investments - 5
Sundry Credit Balances written back (net) 7 5
Share in profit from investment in LLP 6 8
Miscellaneous Income 0 2
Total Other Income 435 325
INR Crores
March 31, 2018 March 31, 2017
Revenue from operations 7,374 7,277
Less: Excise Duty (111) (338)
Net Revenue from operations 7,263 6,939

UPL Limited Annual Report, 2017-18 200
Notes to standalone financial statements for the year ended March 31, 2018Notes to standalone financial statements for the year ended March 31, 2018
23. Cost of raw material and components consumed INR Crores
March 31, 2018 March 31, 2017
Inventory at the beginning of the year 404 370
Add: Purchases 3,632 3,063
4,036 3,433
Less: inventory at the end of the year 519 404
Cost of raw material and components consumed 3,517 3,029
24. (Increase)/Decrease in inventory INR Crores
March 31, 2018 March 31, 2017
Inventories at the end of the year
Finished goods 638 647
By-products 3 6
Work in progress 147 148
Traded goods 80 91
868 892
Inventories at the beginning of the year
Finished goods 647 656
By-products 6 10
Work in progress 148 166
Traded goods 91 25
892 857
(Increase)/Decrease in inventory 24 (35)
Less: Excise duty on stocks (22) (73)
2 (108)
25. Employee benefits expense INR Crores
March 31, 2018 March 31, 2017
Salaries, wages and bonus 391 354
Contribution to provident and other funds (refer note 33) 25 21
Share based payments to employees (refer note 34) 0 0
Retirement benefits (refer note 33) 21 26
Staff welfare expenses 49 44
486 445
26. Finance costs INR Crores
March 31, 2018 March 31, 2017
Interest:
- On Debentures 81 81
- On cash Credit and Working capital demand loans 25 47
- On Others 15 38
Exchange Difference (net) (21) 39
(Gain)/Loss on Derivatives Instruments (10) (97)
Unwinding of Interest cost on Trade Payable 35 31
Other Financial Charges 10 10
135 149

Overview
Strategyreview Performance Governance Financials
201
Notes to standalone financial statements for the year ended March 31, 2018Notes to standalone financial statements for the year ended March 31, 2018
28. Other expense INR Crores
March 31, 2018 March 31, 2017
Power and fuel 237 287
Containers & packing materials consumed 286 302
Transport Charges 244 237
Sub-contracting expenses 316 230
Sales Commission 46 127
Rent (Refer note: 35) 76 83
Effluent Disposal Charges 70 79
Travelling and conveyance 74 74
Advertising and sales promotion 72 87
Legal and professional fees 83 69
Consumption of stores and spares 65 53
Repairs and maintenance
Plant and machinery 32 32
Buildings 3 4
Others 32 30
Rates and taxes 18 23
Exchange differences (net) 9 22
Charity and Donations [(includes H22 crores (31 March 2017: H25 crores) paid to Satya
Electoral Trust for political purpose)]
30 27
CSR expenses (Refer note 46) 20 24
Insurance 13 13
Allowances for doubtful debts and advances (net) 8 6
Assets written off 9 4
Payment to auditor (Refer details below) 2 3
Directors’ sitting fees 0 0
Other Expenses 160 113
1,905 1,929
Payment to Auditors INR Crores
March 31, 2018 March 31, 2017
Audit fee 2 3
Other services (certification fees)* 0 0
Reimbursement of expenses* 0 0
2 3
* Amount less than a Crore
27. Depreciation and amortization expense INR Crores
March 31, 2018 March 31, 2017
Depreciation of tangible assets 226 205
Amortization of intangible assets 440 450
666 655
29. Research and development costsResearch and Development costs, as certified by the Management
INR Crores
March 31, 2018 March 31, 2017
a) Revenue expenses debited to appropriate heads of account. 91 73
b) Capital Expenditure 5 21

UPL Limited Annual Report, 2017-18 202
Notes to standalone financial statements for the year ended March 31, 2018Notes to standalone financial statements for the year ended March 31, 2018
30. Components of Other Comprehensive Income (OCI), net of taxThe disaggregation of changes to OCI by each type of reserve in equity is shown below: INR Crores
March 31, 2018 March 31, 2017
FVTOCI reserve
Retained earnings
Total FVTOCI reserve
Retained earnings
Total
Re-measurement gains (losses) on defined benefit plans - 0 0 - (2) (2)
Gain/(loss) on FVTOCI financial assets 3 - 3 1 - 1
3 0 3 1 (2) (1)
31. Earnings per share (EPS) INR Crores
March 31, 2018 March 31, 2017
Profit attributable to equity holders for basic earnings 548 245
Weighted average number of Equity shares for basic EPS* 50,82,06,912 50,70,17,118
Effect of dilution:
Convertible preference shares - 22,62,904
Employee Stock options 91,176 75,973
Weighted average number of Equity shares adjusted for the effect of dilution * 50,82,98,088 50,93,55,995
33. Gratuity and other post-employment benefit plans INR Crores
March 31, 2018 March 31, 2017
Gratuity Plan 23 17
The gratuity plan is governed by the Payment of Gratuity Act, 1972. Under the act, employee who has completed five years of service is
entitled to specific benefit. The level of benefits provided depends on the member’s length of service and salary at retirement age.
The following tables summarise the components of net benefit expense recognised in the statement of profit or loss and the funded status
and amounts recognised in the balance sheet for the respective plans:
Earnings per equity share ( in Rupees)
Basic (Face value of H2 each) 10.78 4.84
Diluted (Face value of H2 each) 10.78 4.81
* There have been no other transactions involving Equity shares or potential Equity shares between the reporting date and the date of
authorisation of these financial statements.
32. Details of Loans & Investment as required u/s 186 of Companies Act, 2013 INR Crores
March 31, 2018 March 31, 2017Loan given Outstanding Loan given Outstanding
Loan given and proposed to be utilised for business
operations by recipient -
Tatva Global Environment (Deonar) Limited - 0 - 0
Bharuch Enviro Infrastructure Limited - - - 1
Loan given to subsidiaries for working capital / business
operations
UPL Corporation Limited (foreign currency loan) - 929 - 903
Advanta Holdings BV - - 168 -
SWAL Corporation Limited 102 - 90 83
Rate of interest charged on loans given in INR is 13% p.a and in case of foreign currency loan at 6 months LIBOR +200 to 250 bps.
Investments Details required u/s 186 have been disclosed in note 5 of the financial statements.

Overview
Strategyreview Performance Governance Financials
203
Notes to standalone financial statements for the year ended March 31, 2018Notes to standalone financial statements for the year ended March 31, 2018
INR Crores
GratuityMarch 31, 2018 March 31, 2017
Current service cost 9 5
Interest cost on benefit obligation 3 3
Return on plan assets (2) (2)
Amount included under the head Employee Benefit Expense in Note 25 10 6
Actuarial changes arising from changes in financial assumptions (2) 2
Remeasurements recognised in Other Comprehensive Income(OCI) (2) 2
Total Expenses recognised in the statement of Profit & Loss 8 8
Actual return on plan assets 2 2
(ii) Defined Contribution Plan INR Crores
Provident Fund March 31, 2018 March 31, 2017
Current service cost included under the head Employee Benefit Expense 16 14
The amounts recognised in the Balance Sheet are as follows: INR Crores
March 31, 2018 March 31, 2017
Present value of funded obligation 51 44
Less: Fair value of plan assets 28 27
Net Liability 23 17
Changes in the present value of the defined benefit obligation representing reconciliation of opening and closing balance thereof are as follows:
INR Crores
GratuityMarch 31, 2018 March 31, 2017
Opening defined benefit obligation 44 37
Interest cost 3 3
Current service cost 9 5
Benefits paid (2) (3)
Actuarial changes arising from changes in financial assumptions (3) 2
Closing defined benefit obligation 51 44
Changes in the fair value of plan assets are as follows: INR Crores
GratuityMarch 31, 2018 March 31, 2017
Opening fair value of plan assets 27 24
Return on plan assets 2 2
Actuarial changes arising from changes in financial assumptions (1) 1
Closing fair value of plan assets 28 27
INR Crores
Superannuation FundMarch 31, 2018 March 31, 2017
Current service cost included under the head Employee Benefit Expense 9 7
The amounts recognised in the statement of Profit and Loss are as follows:
(i) Defined Benefit Plan

UPL Limited Annual Report, 2017-18 204
Notes to standalone financial statements for the year ended March 31, 2018Notes to standalone financial statements for the year ended March 31, 2018
Expected contribution to defined benefit plan for the year 2018-19 INR Crores
GratuityMarch 31, 2018 March 31, 2017
Expected contribution to defined benefit plan 24 18
The major categories of plan assets as a percentage of the fair value of total plan assets are as follows: INR Crores
GratuityMarch 31, 2018 March 31, 2017
Investments with insurer under: % %
Funds managed by insurer 100 100
The principal actuarial assumptions at the Balance Sheet date. INR Crores
March 31, 2018 March 31, 2017
Discount rate 7.70% 6.85 - 7.29%
Return on plan assets 7.70% 6.85 - 7.29%
Mortality Rate Indian Assured Lives
Mortality (2006-08)
Ult.
Indian Assured Lives
Mortality (2006-08)
Ult.
Annual increase in Salary costs 7% 7%
Attrition Rate 8% 8%
A quantitative sensitivity analysis for significant assumption as at 31 March 2018 is as shown below: INR Crores
Sensitivity Level 1% increase 1% decrease
Impact on defined benefit obligation
Discount rate (3) 3
Future salary increases 3 (3)
Withdrawal rate - (0)
The sensitivity analyses above have been determined based on a method that extrapolates the impact on defined benefit obligation as a
result of reasonable changes in key assumptions occurring at the end of the reporting period.
34. Share based payment
During the year ended March 31, 2018, the following employee stock option plan (ESOPs) were in existence. The relevant details of the
scheme and the grant are as follows:
A. Employees stock option and share plan 2006The Company instituted an Employees Stock Option Scheme (“ESOPs”) for certain employees as approved by the shareholders on September
20, 2006 which provides for a grant of 840,000 options (each option convertible into share) to employees.
March 31, 2018 March 31, 2017
Number of options granted (net of options lapsed) 5,08,390 5,08,390
Method of settlement (Cash/Equity) Equity Equity
Vesting period Spread over 4 years
and 6 months
Spread over 4 years
and 6 months
Contractual life of options 10 years 10 years

Overview
Strategyreview Performance Governance Financials
205
Notes to standalone financial statements for the year ended March 31, 2018Notes to standalone financial statements for the year ended March 31, 2018
The details of the activity have been summarized below
(No. of equity shares)
March 31, 2018 March 31, 2017
Outstanding at the beginning of the year 52,250 1,88,055
Exercisable at the beginning of the year 52,250 1,12,195
Forfeited during the year - 6,075
Exercised during the year 35,750 89,575
Vested during the year - 69,785
Expired during the year - 40,155
Outstanding at the end of the year 16,500 52,250
Exercisable at the end of the year* 16,500 52,250
Weighted average remaining contractual life (in years) 3.91 4.91
For options excercised during the current period, the weighted average share price at the exercise date was H833 (Mar 31, 2017: H616.48).
Stock options grantedThe Black Scholes valuation model has been used for computing the weighted average fair value considering the following inputs:
March 31, 2018 March 31, 2017
Weighted average share price/market price 68.75 68.75
Exercise price (Hper share) 57.00 57.00
Expected volatility 64.49% 64.49%
Life of the options granted (vesting and exercise period) in years Vesting period + 18 months
i.e. 3 years, 4 years, 5 years,
and 6 years, for each Vesting
tranche of 25%
Vesting period + 18 months
i.e. 3 years, 4 years, 5 years,
and 6 years, for each Vesting
tranche of 25%
Expected dividends 0.30% per annum 0.30% per annum
Average risk-free interest rate 8.04% per annum 8.04% per annum
B. Employees stock option plan (ESOP) 2013The Company instituted an Employees Stock Option Scheme (“ESOPs”) for certain employees as approved by the shareholders on December
03, 2013 which provides for a grant of 1,300,000 options (each option convertible into share) to employees.
Particulars March 31, 2018
Dates of grant 30-Jan-14 27-May-14 27-May-14
Dates of board approval 30-Jan-14 27-May-14 27-May-14
Date of shareholders approval 03-Dec-13 03-Dec-13 03-Dec-13
Number of options granted 7,11,752 35,000 35,000
Method of settlement (Cash / Equity) Equity Equity Equity
Vesting period Spread over 4 years
Exercise period 60 months from the date of grant

UPL Limited Annual Report, 2017-18 206
Notes to standalone financial statements for the year ended March 31, 2018Notes to standalone financial statements for the year ended March 31, 2018
The details of the activity have been summarized below
Particulars (No. of equity shares)
March 31, 2018 March 31, 2017
Outstanding at the beginning of the year 23,723 4,15,792
Exercisable at the beginning of the year 2,814 55,695
Granted during the year - -
Forfeited during the year - 3,19,685
Exercised during the year 9,047 72,384
Vested during the year 19,502 19,503
Expired during the year - -
Outstanding at the end of the year 14,676 23,723
Exercisable at the end of the year* 13,269 2,814
Weighted average remaining contractual life (in years) 1.02 1.95
For options excercised during the current period, the weighted average share price at the exercise date was H703.8 (Mar 31, 2017: H538.72).
Stock options grantedThe Black Scholes valuation model has been used for computing the weighted average fair value considering the following inputs:
Particulars March 31, 2018 March 31, 2017
Weighted average share price/market price (H per share) 112.81 112.81
Exercise price (H per share) Grant 1 H103.80 Grant 1 H103.80
Grant 2 H262.75 Grant 2 H262.75
Grant 3 H319.70 Grant 3 H319.70
Expected volatility 49.17% 49.17%
Life of the options grantwed (vesting and exercise period) in years Vesting period + 6
months
Vesting period + 6
months
Expected dividends 0.00% 0.00%
Average risk-free interest rate 8.71% per annum 8.71% per annum
*Eligible Employees holding 1 Option shall be entitled to purchase 1.06 new equity shares as per the scheme of Amalgamation.
C. Employees stock option plan (ESOP) 2017 The Company instituted an Employees Stock Option Scheme (“ESOPs”) for certain employees as approved by the shareholders on July 08,
2017 which provides for a grant of 2,500,000 options (each option convertible into share) to employees.
Particulars March 31, 2018
Dates of grant 25-Jan-18
Dates of board approval 25-Jan-17
Number of options granted 60,000
Method of settlement (Cash / Equity) Equity
Vesting period Spread over 2 years
Contractual life of Option 5 years
Vesting conditions Grant Date Number of Options
Contractual life of Options
1 year from grant date 25-Jan-18 20,000 4 years
2 years from grant date 25-Jan-18 40,000 5 years

Overview
Strategyreview Performance Governance Financials
207
Notes to standalone financial statements for the year ended March 31, 2018Notes to standalone financial statements for the year ended March 31, 2018
The details of the activity have been summarized below
Particulars March 31, 2018
Outstanding at the beginning of the year -
Exercisable at the beginning of the year -
Granted during the year 60,000
Forfeited during the year -
Exercised during the year -
Vested during the year -
Expired during the year -
Outstanding at the end of the year 60,000
Exercisable at the end of the year* -
Weighted average remaining contractual life (in years) 4.49
The Black Scholes valuation model has been used for computing the weighted average fair value considering the following inputs:
Particulars March 31, 2018
Weighted average share price/market price (H per share) 824
Exercise price (H per share) 784
Expected volatility 21.49%
Life of the options granted (vesting and exercise period) in years 2 to 3.25 years
Expected dividends -
Average risk-free interest rate 7.22% per annum
D. Effect of the employee option plan on the Statement of Profit and Loss and on its financial position INR Crores
March 31, 2018 March 31, 2017
Total employee compensation cost pertaining to stock option plan 0 0
Liability for employee stock option plan outstanding as at the year end 0 2
INR Crores
March 31, 2018 March 31, 2017
Within one year 21 20
After one year but more than five years 90 88
More than five years 15 38
b. Commitments INR Crores
March 31, 2018 March 31, 2017
Estimated amount of contracts remaining to be executed on capital account and not provided
for (net of advances)
72 134
35. Commitments and contingenciesa. Leases- Operating lease commitments — Company as lesseeLease rent debited to statement of profit and loss is H76 crores (March 31, 2017: H83 crores)
The Company has entered into operating lease arrangements for its office premises, vehicles, machinery, storage locations and residential
premises.
Future minimum rentals payable under non-cancellable operating leases as at 31 March are, as follows:

UPL Limited Annual Report, 2017-18 208
Notes to standalone financial statements for the year ended March 31, 2018Notes to standalone financial statements for the year ended March 31, 2018
35. Commitments and contingencies (Contd.)
c. Contingent liabilities INR Crores
March 31, 2018 March 31, 2017
Disputed Income-Tax Liability (excluding interest) 26 26
Disputed Excise Duty / Service Tax liability (excluding interest) 203 173
Disputed Sales Tax liability 31 28
Disputed Custom Duty liability 34 36
Disputed Fiscal Penalty for cancellation of licenses 33 33
Disputed penalty levied by Competition Commission of India for Cartelization of prices* - 252
Disputed penalty on Water Tax - 2
(In respect of the above matters, future cash outflows in respect of contingent liabilities are
determinable only on receipt of judgements pending at various forums / authorities)
Claims against the Company not acknowledged as debts 4 6
* The Competition Commission of India (CCI) had levied a penalty of H252 crores on the Company for alleged violation of section 3(3) (b) and
3(3) (d) of the Competition Act 2002. The order of the CCI was challenged before the Competition Appellate Tribunal (COMPAT) which by its
order dated 29th October, 2013 has reduced the penalty to H7 crores and the same has been confirmed by the Hon'ble Supreme Court in its
order. During the year ended 31 March 2018, the Company had received notice from CCI to deposit the interest of H4.17 crores for delay of
40 months in payment as per Regulation 5 of CCI (Manner of Recovery of Monetary Penalty) Regulations, 2011. The Company had filed their
reply to the above notice on 24 October 2017. The Company does not expect the outcome of the proceedings to have a materially adverse
impact on standalone financial statements.
36. Related party transactions (a) Names of the related parties where control exists irrespective of whether transactions have occurred or not (i) Name of the Subsidiary Companies: Shroffs United Chemicals Limited SWAL Corporation Limited United Phosphorus (India) LLP United Phosphorus Global LLP Optima Farm Solutions Limited UPL Europe Limited UPL Deutschland GmbH UPL Polska Sp z.o.o. UPL Benelux B.V. Cerexagri B.V. Blue Star B.V. United Phosphorus Holdings Cooperatief U.A. United Phosphorus Holdings B.V. Decco Worldwide Post-Harvest Holdings Cooperatief U.A. Decco Worldwide Post-Harvest Holdings B.V. United Phosphorus Holding, Brazil B.V. UPL Italia S.R.L. UPL Iberia, S.A. Decco Iberica Postcosecha, S.A.U. Transterra Invest, S. L. U. Cerexagri S.A.S. Neo-Fog S.A. UPL France United Phosphorus Switzerland Limited Agrodan, ApS Decco Italia SRL Limited Liability Company "UPL" Decco Portugal Post Harvest, Unipessoal LDA (formerly known as UPL Portugal Unipessoal LDA)

Overview
Strategyreview Performance Governance Financials
209
Notes to standalone financial statements for the year ended March 31, 2018Notes to standalone financial statements for the year ended March 31, 2018
36. Related party transactions (Contd.)
United Phosphorus Inc. UPI Finance LLC Cerexagri, Inc. (PA) UPL Delaware, Inc. Canegrass LLC Decco US Post-Harvest Inc Rice Co LLC Riceco International, Inc. UPL Corporation Limited UPL Limited (merged in UPL Corporation Limited, Mauritius) UPL Management DMCC UPL Limited UPL Agro S.A. de C.V. Decco Jifkins Mexico Sapi United Phosphorus do Brasil Ltd Uniphos Industria e Comercio de Produtos Quimicos Ltd. Upl do Brasil Industria e Comércio de Insumos Agropecuários S.A. UPL Costa Rica S.A. UPL Bolivia S.R.L UPL Paraguay S.A. Icona Sanluis S.A. DVA Technology Argentina S.A. UPL Argentina S A Decco Chile SpA UPL Colombia SAS United Phosphorus Cayman Limited UP Aviation Limited UPL Australia Limited UPL New Zealand Limited UPL Shanghai Limited UPL Limited (Korea) PT.UPL Indonesia PT Catur Agrodaya Mandiri UPL Limited UPL Philippines Inc. UPL Vietnam Co. Limited UPL Limited, Japan Anning Decco Fine Chemical Co. Limited UPL Ziraat Ve Kimya Sanayi Ve Ticaret Limited Sirketi UPL Agromed Tarim Ilaclari ve Tohumculuk Sanayi ve Ticaret A.S. Safepack Products Limited Citrashine (Pty) Ltd UPL Africa SARL (divested during the year) Prolong Limited Perrey Participações S.A Agrinet Solutions Limited Advanta Netherlands Holding B.V. Advanta Semillas SAIC Advanta Holdings B.V. Advanta Seeds International Pacific Seeds Holdings (Thailand) Limited Pacific Seeds (Thai) Limited Advanta Seeds Pty Ltd Advanta US Inc.

UPL Limited Annual Report, 2017-18 210
Notes to standalone financial statements for the year ended March 31, 2018Notes to standalone financial statements for the year ended March 31, 2018
Advanta Comercio De Sementes LTDA. PT Advanta Seeds Indonesia Advanta Seeds DMCC Essentiv LCC UPL Agro Limited Mauritius (acquired during the year) UPL Jiangsu Limited (formed during the year) Riceco International Bangladesh Ltd (acquired during the year) Uniphos Malaysia Sdn Bhd (acquired during the year) Advanta Seeds Ukraine LLC (b) Names of the other related parties with whom transactions have taken place during the year (i) Name of Associate Companies: Chemisynth (Vapi) Limited Weather Risk Management Services Private Ltd Ingen Technologies Private Limited (ii) Joint Venture Companies: United Phosphorus (Bangladesh) Limited (upto 22nd September, 2016) (iii) Enterprises over which key management personnel and their relatives have significant influence: Bharuch Enviro Infrastructure Limited Bloom Packaging Private Limited Bloom Seal Containers Private Limited Daman Ganga Pulp and Papers Private Limited Demuric Holdings Private Limited Enviro Technology Limited Gharpure Engineering and Construction Private Limited Uniphos Envirotronic Private Limited Jai Trust Pot Plants Sanguine Holdings Private Limited Tatva Global Environment Private Limited (formerly Tatva Global Environment Limited) Tatva Global Environment (Deonar) Limited Ultima Search Uniphos International Limited Uniphos Enterprises Limited UPL Environmental Engineers Limited Vikram Farm (iv) Key Management Personnel and their relatives : Directors and their relatives Mr. Rajnikant.D. Shroff Mrs. Sandra R. Shroff * Mr. Kalyan Banerjee Mr. Jaidev R. Shroff * Mr. Arun C. Ashar Mr. Vikram R. Shroff * Mrs. Asha Ashar * Mr. Navin Ashar * Mr. Hardeep Singh Mr. Vasant Gandhi Mr. Pradeep Goyal Mr. Vinod Sethi Dr. Reena Ramchandran Mr. Pradip Madhavji Mr. Anand K Vora - Chief Financial Officer Mr. Mukul B Trivedi - Company Secretary * Relatives of Key management personnel.
36. Related party transactions (Contd.)

Overview
Strategyreview Performance Governance Financials
211N
otes
to s
tand
alon
e fin
anci
al s
tate
men
ts fo
r the
yea
r end
ed M
arch
31,
201
8
36.
Rela
ted
part
y tr
ansa
ctio
ns (C
ontd
.)
(c) T
he fo
llow
ing
tran
sact
ions
wer
e ca
rrie
d ou
t with
rela
ted
part
ies
in th
e or
dina
ry c
ours
e of
bus
ines
s:IN
R C
rore
s
RELA
TIO
NSH
IP S
UBS
IDA
RIES
ASS
OCI
ATES
JOIN
T VE
NTU
REEN
TERP
RISE
S O
VER
WH
ICH
KEY
M
AN
AGEM
ENT
PERS
ON
NEL
H
AVE
SIG
NIF
ICA
NT
INFL
UEN
CE
GRA
ND
TO
TAL
31-M
ar-1
831
-Mar
-17
31-M
ar-1
831
-Mar
-17
31-M
ar-1
831
-Mar
-17
31-M
ar-1
831
-Mar
-17
31-M
ar-1
831
-Mar
-17
NAT
URE
OF
TRA
NSA
CTI
ON
S:
1IN
COM
E
(A)
SALE
S:
(i)G
OO
DS
4,0
34
3,8
82
- -
7
5
6
2
4,04
7 3
,889
UPL
Cor
pora
tion
Ltd.
880
920
-
- -
- -
- 8
80
920
UPL
Lim
ited
Gib
ralta
r1,
028
1,0
25
- -
- -
- -
1,0
28
1,0
25
SWA
L Co
rpor
atio
n Li
mite
d51
2 4
04
- -
- -
- -
512
4
04
UPL
Ltd
. - M
aurit
ius
282
836
-
- -
- -
- 2
82
836
Uni
ted
Phos
phor
us (I
ndia
) LLP
642
425
-
- -
- -
- 6
42
425
Oth
ers
690
272
-
- 7
5
6
2
7
02
279
(ii)
FIXE
D A
SSET
S -
8
- -
- -
- -
- 8
UN
ITED
PH
OSP
HO
RUS
(IND
IA) L
LP 7
-
- -
- -
- -
7
Oth
ers
1
- -
- -
- -
- 1
(B)
DIV
IDEN
D R
ECEI
VED
356
2
16
- -
- -
- -
356
2
16
UPL
Cor
pora
tion
Ltd.
356
216
-
- -
- -
- 3
56
216
(C)
MA
NAG
EMEN
T FE
ES /
OTH
ER S
ERVI
CES
7
1
- -
- -
8
7
15
8
Tatv
a G
loba
l Env
ironm
ent P
rivat
e Li
mite
d -
- -
- -
- 2
3
2
3
Bhar
uch
Envi
ro In
frast
ruct
ure
Lim
ited
- -
- -
- -
1
1
1
1
Gha
rpur
e En
gine
erin
g an
d Co
nstr
uctio
n Pr
ivat
e Li
mite
d -
- -
- -
- 4
2
4
2
Uni
phos
Ent
erpr
ises
Ltd
- -
- -
- -
1
1
1
1
Uni
ted
Phos
phor
us (I
ndia
) LLP
7 1
-
- -
- -
- 7
1
Oth
ers
- -
- -
- -
0
0
0
0
(D)
REN
T R
ECEI
VED
2
2
- -
- -
0
0
2
2
Uni
phos
Env
irotr
onic
Pvt
. Ltd
. -
- -
- -
- 0
0
0
0
Uni
ted
Phos
phor
us (I
ndia
) LLP
2
2
- -
- -
- 2
2
Oth
ers
- -
- -
- -
0
0
0
0
(E)
ROYA
LTY
INCO
ME
29
2
- -
- -
- -
29
2
Uni
ted
Phos
phor
us (I
ndia
) LLP
29 2
-
- -
- -
- 2
9 2
(F)
COM
MIS
SIO
N O
N G
UA
RAN
TEE
GIV
EN /
RECE
IVED
6
1
- -
- -
- -
6
1
Adv
anta
See
ds P
TY L
td.
-
0
- -
- -
- -
- 0

UPL Limited Annual Report, 2017-18 212
Notes to standalone financial statements for the year ended March 31, 2018Notes to standalone financial statements for the year ended March 31, 2018
Not
es to
sta
ndal
one
finan
cial
sta
tem
ents
for t
he y
ear e
nded
Mar
ch 3
1, 2
018
36.
Rela
ted
part
y tr
ansa
ctio
ns (C
ontd
.)
(c) T
he fo
llow
ing
tran
sact
ions
wer
e ca
rrie
d ou
t with
rela
ted
part
ies
in th
e or
dina
ry c
ours
e of
bus
ines
s:IN
R C
rore
s
RELA
TIO
NSH
IP S
UBS
IDA
RIES
ASS
OCI
ATES
JOIN
T VE
NTU
REEN
TERP
RISE
S O
VER
WH
ICH
KEY
M
AN
AGEM
ENT
PERS
ON
NEL
H
AVE
SIG
NIF
ICA
NT
INFL
UEN
CE
GRA
ND
TO
TAL
31-M
ar-1
831
-Mar
-17
31-M
ar-1
831
-Mar
-17
31-M
ar-1
831
-Mar
-17
31-M
ar-1
831
-Mar
-17
31-M
ar-1
831
-Mar
-17
Adv
anta
See
d In
tern
atio
nal M
aurit
ius
- 1
-
- -
- -
- -
1
UPL
Eur
ope
Ltd
2
- -
- -
- -
- 2
-
UPL
Ital
ia S
RL 1
-
- -
- -
- -
1
-
Cere
xagr
i SA
S 1
-
- -
- -
- -
1
-
Cere
xagr
i BV
1
- -
- -
- -
- 1
-
UPL
Arg
entin
a SA
. 1
-
- -
- -
- -
1
-
(G)
Mar
kup
on re
imbu
rsem
ent o
f exp
ense
s re
ceiv
ed -
0
- -
- -
- -
- 0
Adv
anta
Net
herla
nds
Hol
ding
s BV
- 0
-
- -
- -
- -
0
2EX
PEN
SES
(A)
PURC
HA
SES
(i)G
OO
DS
347
2
55
- -
- -
48
57
395
3
12
UPL
Ltd
, Hon
g Ko
ng14
0 1
56
- -
- -
- 1
40
156
Bloo
m S
eal C
onta
iner
s Pv
t Ltd
, Vap
i -
- -
- -
- 2
9 3
4 2
9 3
4
Opt
ima
Farm
Sol
utio
ns L
td.
122
70
- -
- -
- 1
22
70
Oth
ers
85
29
- -
- -
18
23
103
5
2
(ii)
PURC
HA
SE O
F LI
CEN
CES
16 -
- -
- -
- -
16
-
Uni
ted
Phos
phor
us In
dia
LLP
15 -
- -
- -
- -
15
-
Oth
ers
0 -
- -
- -
- -
0
-
(iii)
FIXE
D A
SSET
S 0
0
0
-
- -
0
0
1
0
UPL
Env
ironm
enta
l Eng
g. L
td.
- -
- -
- -
- -
- -
Cere
xagr
i BV
0 0
-
- -
- -
- 0
0
Uni
phos
Env
irotr
onic
Pvt
. Ltd
. -
- -
- -
- 0
0
0
0
Bhar
uch
Envi
ro In
frast
ruct
ure
Ltd.
- -
- -
- -
- 0
-
0
Che
mie
Syn
th (V
api)
Ltd
- -
0
- -
- -
- 0
-
(iv)
INTA
NG
IBLE
ASS
ETS
3
2
- -
- -
- -
3
2
UPL
Ltd
. Jap
an1
2
- -
- -
- -
1
2
UPL
Eur
ope
1 -
- -
- -
- -
1
-
UPL
Lim
ited
Kore
a1
- -
- -
- -
- 1
-
(v)
INTA
NG
IBLE
ASS
ETS
- UN
DER
-CW
IP 0
0
-
- -
- -
- 0
0
UPL
Lim
ited
Japa
n0
0
- -
- -
- -
0
0

Overview
Strategyreview Performance Governance Financials
213
Notes to standalone financial statements for the year ended March 31, 2018Notes to standalone financial statements for the year ended March 31, 2018
Not
es to
sta
ndal
one
finan
cial
sta
tem
ents
for t
he y
ear e
nded
Mar
ch 3
1, 2
018
36.
Rela
ted
part
y tr
ansa
ctio
ns (C
ontd
.)
(c) T
he fo
llow
ing
tran
sact
ions
wer
e ca
rrie
d ou
t with
rela
ted
part
ies
in th
e or
dina
ry c
ours
e of
bus
ines
s:IN
R C
rore
s
RELA
TIO
NSH
IP S
UBS
IDA
RIES
ASS
OCI
ATES
JOIN
T VE
NTU
REEN
TERP
RISE
S O
VER
WH
ICH
KEY
M
AN
AGEM
ENT
PERS
ON
NEL
H
AVE
SIG
NIF
ICA
NT
INFL
UEN
CE
GRA
ND
TO
TAL
31-M
ar-1
831
-Mar
-17
31-M
ar-1
831
-Mar
-17
31-M
ar-1
831
-Mar
-17
31-M
ar-1
831
-Mar
-17
31-M
ar-1
831
-Mar
-17
(vi)
OTH
ERS
- -
- -
- -
0
0
0
0
Vikr
am F
arm
- -
- -
- -
0
0
0
0
Pot P
lant
s -
- -
- -
- 0
0
0
0
Oth
ers
- -
- -
- -
0
0
0
0
(B)
SERV
ICES
1
0
0
0
- -
79
84
80
84
Bhar
uch
Envi
ro In
frast
ruct
ure
Lim
ited
- -
- -
- -
77
82
77
82
Oth
ers
1 0
0
0
-
- 2
2
3
2
(C)
REN
T -
- -
- -
- 1
1
1
1
Sang
uine
Hol
ding
s Pv
t. Lt
d. -
- -
- -
- 0
0
0
0
Bloo
m P
acka
ging
Pvt
. Ltd
. -
- -
- -
- 0
0
0
0
Ulti
ma
Sear
ch -
- -
- -
- 0
0
0
0
Jai T
rust
- -
- -
- -
0
0
0
0
Oth
ers
- -
- -
- -
0
1
0
1
(D)
COM
MIS
SIO
N O
N E
XPO
RTS
31
106
-
- -
- -
- 3
1 1
06
UPL
Cor
pora
tion
Ltd.
31 1
06
- -
- -
- -
31
106
Oth
ers
- -
- -
- -
- -
- -
(E)
RESE
ARC
H &
DEV
ELO
PMEN
T EX
PEN
SES
1
- -
- -
- -
- 1
-
Cere
xagr
i B V
1
- -
- -
- -
- 1
-
(F)
WRI
TE B
ACK
OF
PAYA
BLES
0
4
- -
- -
- -
0
4
UPL
Cor
pora
tion
Ltd.
0
0
- -
- -
- -
0
0
UPL
Ltd
Gib
ralta
r -
4
- -
- -
- -
- 4
Oth
ers
- 0
-
- -
- -
- -
0
(G)
WRI
TE O
FF O
F RE
CEIV
ABL
ES -
0
- -
- -
0
- 0
0
Envi
ro T
echn
olog
y Lt
d -
- -
- -
- 0
-
Safe
pack
Pro
duct
s Lt
d. -
0
- -
- -
- -
- 0
Oth
er
- 0
-
- -
- 0
-
0
0

UPL Limited Annual Report, 2017-18 214
(c) T
he fo
llow
ing
tran
sact
ions
wer
e ca
rrie
d ou
t with
rela
ted
part
ies
in th
e or
dina
ry c
ours
e of
bus
ines
s:IN
R C
rore
s
RELA
TIO
NSH
IP S
UBS
IDA
RIES
ASS
OCI
ATES
JOIN
T VE
NTU
REEN
TERP
RISE
S O
VER
WH
ICH
KEY
M
AN
AGEM
ENT
PERS
ON
NEL
H
AVE
SIG
NIF
ICA
NT
INFL
UEN
CE
GRA
ND
TO
TAL
31-M
ar-1
831
-Mar
-17
31-M
ar-1
831
-Mar
-17
31-M
ar-1
831
-Mar
-17
31-M
ar-1
831
-Mar
-17
31-M
ar-1
831
-Mar
-17
(H)
CON
TRIB
UTI
ON
TO
C.S
.R.
- -
- -
- -
0
0
0
0
Vikr
am F
arm
- -
- -
- -
- 0
-
0
Bhar
uch
Envi
ro In
frast
ruct
ure
Ltd.
- -
- -
- -
0
0
0
0
3FI
NA
NCE
(A)
LOA
N /
INTE
R CO
RPO
RATE
DEP
OSI
TS G
IVEN
102
2
58
- -
- -
- -
102
2
58
SWA
L Co
rpor
atio
n Li
mite
d 1
02
90
- -
- -
- -
102
9
0
Adv
anta
Hol
ding
s BV
Net
herla
nds
- 1
68
- -
- -
- -
- 1
68
(B)
INTE
REST
REC
EIVE
D 4
3 5
7 -
- -
- 0
0
4
3 5
8
UPL
Cor
pora
tion
Ltd.
35
32
- -
- -
- -
35
32
SWA
L Co
rpor
atio
n Li
mite
d 8
1
2 -
- -
- -
- 8
1
2
Adv
anta
Hol
ding
s BV
Net
herla
nd -
13
- -
- -
- -
- 1
3
Oth
ers
0
- -
- -
- 0
0
0
0
(C)
ALL
OTM
ENT/
PU
RCH
ASE
OF
BON
DS
- -
- -
- -
- 2
-
2
Tatv
a G
loba
l Env
ironm
ent P
rivat
e Li
mite
d -
- -
- -
- -
2
- 2
(D)
ALL
OTM
ENT/
PU
RCH
ASE
OF
SHA
RES
- -
- 1
0 -
- -
- -
10
Wea
ther
Ris
k M
anag
emen
t Ser
vice
s Pr
ivat
e Li
mite
d -
- -
10
- -
- -
- 1
0
(E)
SALE
/RED
EMPT
ION
OF
SHA
RES/
NCD
/CO
MM
ERCI
AL
PAPE
RS -
9
- -
- -
- 1
5 -
24
Swal
Cor
pora
tion
Ltd.
- 7
-
- -
- -
- -
7
UPL
Inve
stm
ent I
ndia
Pvt
. Ltd
. -
- -
- -
- 1
5 -
15
Oth
ers
2
- -
- -
- -
- 2
(F)
REPA
YMEN
T AG
AIN
ST L
OA
N G
IVEN
184
6
58
- -
- -
1
4
185
6
62
UPL
Cor
pora
tion
Ltd.
- 2
20
- -
- -
- -
- 2
20
SWA
L Co
rpor
atio
n Li
mite
d 1
84
49
- -
- -
- -
184
4
9
Adv
anta
Hol
ding
s BV
Net
herla
nd -
390
-
- -
- -
- -
390
Oth
ers
- -
- -
- -
1
4
1
4
(G)
GU
ARA
NTE
ES C
AN
CELL
ED D
URI
NG
TH
E YE
AR
309
-
- -
- -
- -
309
-
UPL
Eur
ope
Ltd.
291
-
- -
- -
- -
291
-
Oth
ers
18
- -
- -
- -
- 1
8 -
Not
es to
sta
ndal
one
finan
cial
sta
tem
ents
for t
he y
ear e
nded
Mar
ch 3
1, 2
018
36.
Rela
ted
part
y tr
ansa
ctio
ns (C
ontd
.)
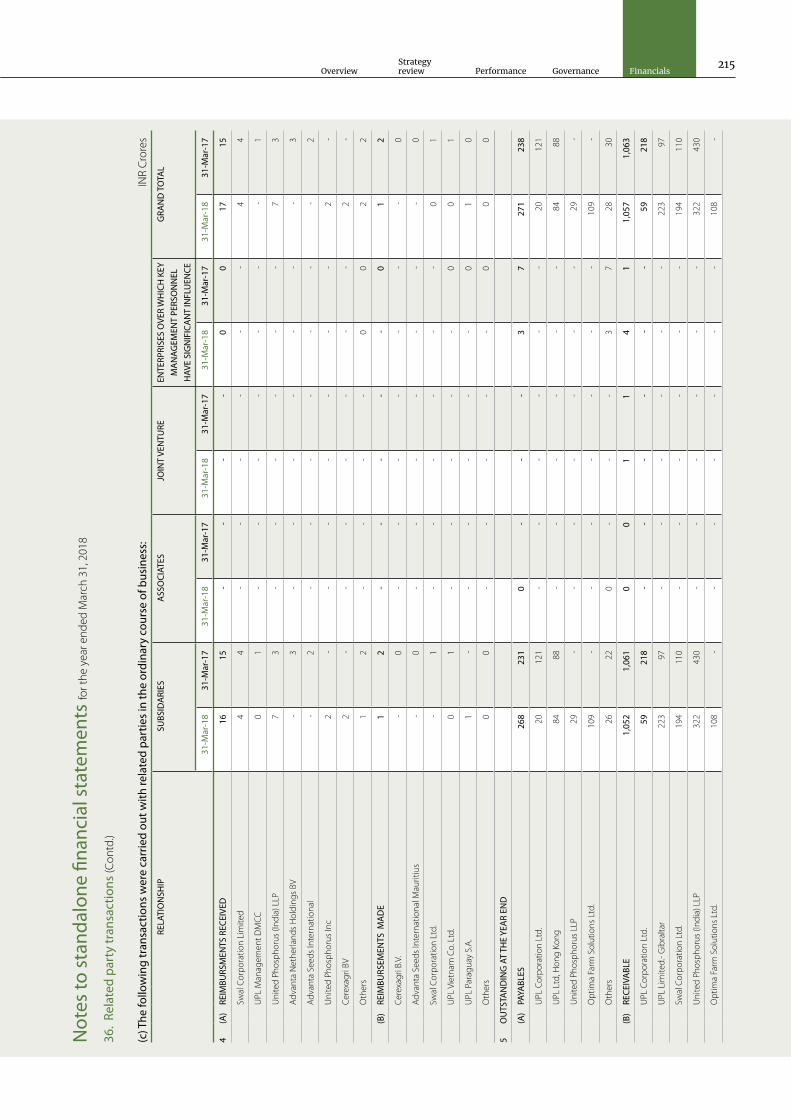
Overview
Strategyreview Performance Governance Financials
215N
otes
to s
tand
alon
e fin
anci
al s
tate
men
ts fo
r the
yea
r end
ed M
arch
31,
201
8
36.
Rela
ted
part
y tr
ansa
ctio
ns (C
ontd
.)
(c) T
he fo
llow
ing
tran
sact
ions
wer
e ca
rrie
d ou
t with
rela
ted
part
ies
in th
e or
dina
ry c
ours
e of
bus
ines
s:IN
R C
rore
s
RELA
TIO
NSH
IP S
UBS
IDA
RIES
ASS
OCI
ATES
JOIN
T VE
NTU
REEN
TERP
RISE
S O
VER
WH
ICH
KEY
M
AN
AGEM
ENT
PERS
ON
NEL
H
AVE
SIG
NIF
ICA
NT
INFL
UEN
CE
GRA
ND
TO
TAL
31-M
ar-1
831
-Mar
-17
31-M
ar-1
831
-Mar
-17
31-M
ar-1
831
-Mar
-17
31-M
ar-1
831
-Mar
-17
31-M
ar-1
831
-Mar
-17
4(A
)RE
IMBU
RSM
ENTS
REC
EIVE
D 1
6 1
5 -
- -
- 0
0
1
7 1
5
Swal
Cor
pora
tion
Lim
ited
4 4
-
- -
- -
- 4
4
UPL
Man
agem
ent D
MCC
0
1
- -
- -
- -
- 1
Uni
ted
Phos
phor
us (I
ndia
) LLP
7
3
- -
- -
- -
7
3
Adv
anta
Net
herla
nds
Hol
ding
s BV
- 3
-
- -
- -
- -
3
Adv
anta
See
ds In
tern
atio
nal
- 2
-
- -
- -
- -
2
Uni
ted
Phos
phor
us In
c 2
-
- -
- -
- -
2
-
Cere
xagr
i BV
2
- -
- -
- -
- 2
-
Oth
ers
1
2
- -
- -
0
0
2
2
(B)
REIM
BURS
EMEN
TS M
AD
E 1
2
-
- -
- -
0
1
2
Cere
xagr
i B.V
. -
0
- -
- -
- -
- 0
Adv
anta
See
ds In
tern
atio
nal M
aurit
ius
- 0
-
- -
- -
- -
0
Swal
Cor
pora
tion
Ltd.
- 1
-
- -
- -
- 0
1
UPL
Vie
tnam
Co.
Ltd
. 0
1
-
- -
- -
0
0
1
UPL
Par
agua
y S.
A.
1
- -
- -
- -
0
1
0
Oth
ers
0 0
-
- -
- -
0
0
0
5O
UTS
TAN
DIN
G A
T TH
E YE
AR
END
(A)
PAYA
BLES
268
2
31
0
- -
- 3
7
2
71
238
UPL
Cor
pora
tion
Ltd.
20
121
-
- -
- -
- 2
0 1
21
UPL
Ltd
, Hon
g Ko
ng 8
4 8
8 -
- -
- -
- 8
4 8
8
Uni
ted
Phos
phor
us L
LP 2
9 -
- -
- -
- -
29
-
Opt
ima
Farm
Sol
utio
ns L
td.
109
-
- -
- -
- -
109
-
Oth
ers
26
22
0
- -
- 3
7
2
8 3
0
(B)
RECE
IVA
BLE
1,0
52
1,0
61
0
0
1
1
4
1
1,0
57
1,0
63
UPL
Cor
pora
tion
Ltd.
59 2
18
- -
- -
- -
59
218
UPL
Lim
ited.
- Gib
ralta
r22
3 9
7 -
- -
- -
- 2
23
97
Swal
Cor
pora
tion
Ltd.
194
110
-
- -
- -
- 1
94
110
Uni
ted
Phos
phor
us (I
ndia
) LLP
322
430
-
- -
- -
- 3
22
430
Opt
ima
Farm
Sol
utio
ns L
td.
108
-
- -
- -
- -
108
-

UPL Limited Annual Report, 2017-18 216
Oth
ers
146
2
06
0
0
1
1
4
1
151
2
08
(C)
LOA
NS
AN
D A
DVA
NCE
S G
IVEN
929
9
85
- -
- -
0
1
929
9
86
UPL
Cor
pora
tion
Ltd.
929
903
-
- -
- -
- 9
29
903
Adv
anta
Hol
ding
s BV
Net
herla
nd -
- -
- -
- -
- -
-
Oth
ers
- 8
2 -
- -
- 0
1
0
8
3
(D)
INTE
REST
REC
EIVA
BLE
7
5
- -
- -
0
0
7
5
UPL
Cor
pora
tion
Ltd.
7 5
-
- -
- -
- 7
5
Oth
ers
- -
- -
- -
0
0
0
0
(E)
MA
NAG
EMEN
T FE
ES R
ECEI
VABL
E -
- -
- -
- 1
0 8
1
0 8
Tatv
a G
loba
l Env
ironm
ent P
rivat
e Li
mite
d -
- -
- -
- 1
4
1
4
Bhar
uch
Envi
ro In
frast
ruct
ure
Ltd.
- -
- -
- -
- 0
-
0
Gha
rpur
e En
gine
erin
g an
d Co
nstr
uctio
n Pr
ivat
e Li
mite
d -
- -
- -
- 8
4
8
4
Oth
ers
- -
- -
- -
1
0
1
0
(F)
GU
ARA
NTE
ES G
IVEN
ON
BEH
ALF
OF
COM
PAN
IES.
497
8
65
- -
- -
- -
497
8
65
UPL
Eur
ope
Ltd.
- 2
91
- -
- -
- -
- 2
91
Cere
xagr
i BV
186
1
59
- -
- -
- -
186
1
59
UPL
Ital
ia S
RL 1
33
114
-
- -
- -
- 1
33
114
Cere
xagr
i SA
S 1
78
153
-
- -
- -
- 1
78
153
UPL
Arg
entin
a SA
- 1
30
- -
- -
- -
- 1
30
Oth
ers
- 1
8 -
- -
- -
- -
18
(G)
DEP
OSI
T G
IVEN
- -
- -
- -
13
5
13
5
Bloo
m P
acka
ging
Pvt
Ltd
- -
- -
- -
1
1
1
1
Dam
an G
anga
Pul
p A
nd P
aper
s -
- -
- -
- 4
4
4
4
Bhar
uch
Envi
ro In
frast
rure
Ltd
. -
- -
- -
- 8
0
8
0
Oth
ers
- -
- -
- -
0
0
0
0
(Abo
ve fi
gure
s are
gro
ss o
f tax
)
Not
es to
sta
ndal
one
finan
cial
sta
tem
ents
for t
he y
ear e
nded
Mar
ch 3
1, 2
018
36.
Rela
ted
part
y tr
ansa
ctio
ns (C
ontd
.)
(c) T
he fo
llow
ing
tran
sact
ions
wer
e ca
rrie
d ou
t with
rela
ted
part
ies
in th
e or
dina
ry c
ours
e of
bus
ines
s:IN
R C
rore
s
RELA
TIO
NSH
IP S
UBS
IDA
RIES
ASS
OCI
ATES
JOIN
T VE
NTU
REEN
TERP
RISE
S O
VER
WH
ICH
KEY
M
AN
AGEM
ENT
PERS
ON
NEL
H
AVE
SIG
NIF
ICA
NT
INFL
UEN
CE
GRA
ND
TO
TAL
31-M
ar-1
831
-Mar
-17
31-M
ar-1
831
-Mar
-17
31-M
ar-1
831
-Mar
-17
31-M
ar-1
831
-Mar
-17
31-M
ar-1
831
-Mar
-17
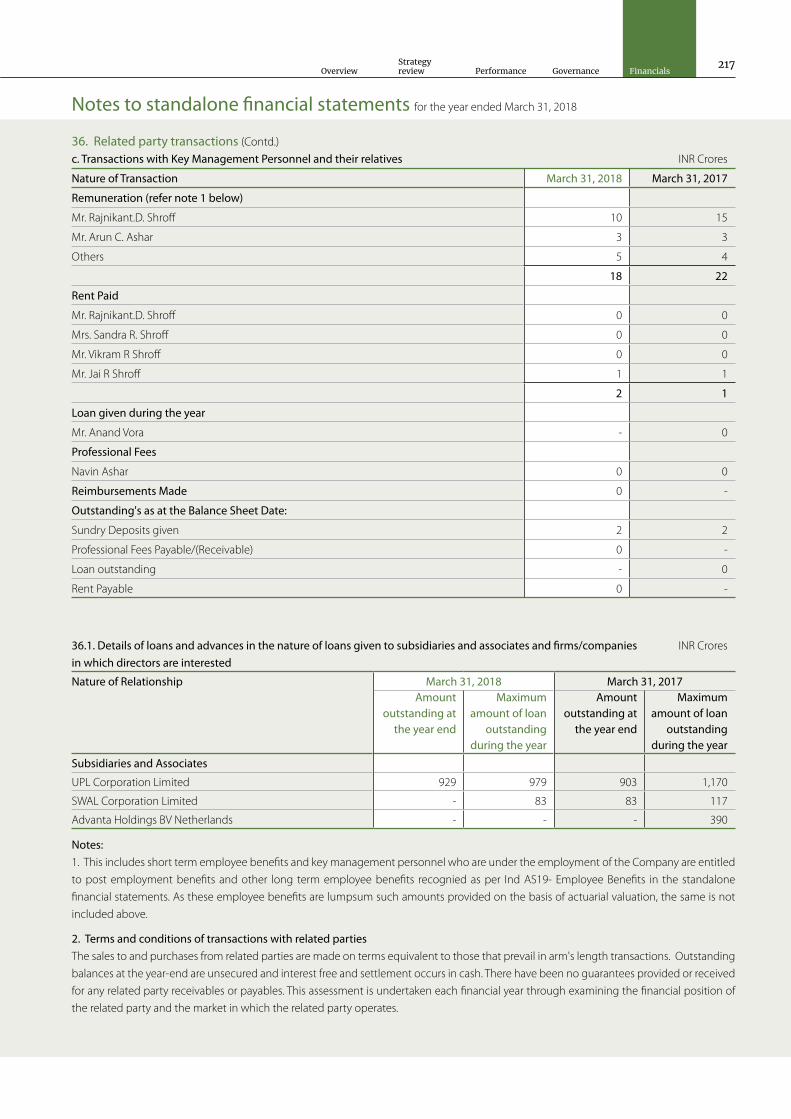
Overview
Strategyreview Performance Governance Financials
217
36. Related party transactions (Contd.)
c. Transactions with Key Management Personnel and their relatives INR Crores
Nature of Transaction March 31, 2018 March 31, 2017
Remuneration (refer note 1 below)
Mr. Rajnikant.D. Shroff 10 15
Mr. Arun C. Ashar 3 3
Others 5 4
18 22
Rent Paid
Mr. Rajnikant.D. Shroff 0 0
Mrs. Sandra R. Shroff 0 0
Mr. Vikram R Shroff 0 0
Mr. Jai R Shroff 1 1
2 1
Loan given during the year
Mr. Anand Vora - 0
Professional Fees
Navin Ashar 0 0
Reimbursements Made 0 -
Outstanding's as at the Balance Sheet Date:
Sundry Deposits given 2 2
Professional Fees Payable/(Receivable) 0 -
Loan outstanding - 0
Rent Payable 0 -
36.1. Details of loans and advances in the nature of loans given to subsidiaries and associates and firms/companies in which directors are interested
INR Crores
Nature of Relationship March 31, 2018 March 31, 2017Amount
outstanding at the year end
Maximum amount of loan
outstanding during the year
Amount outstanding at
the year end
Maximum amount of loan
outstanding during the year
Subsidiaries and Associates
UPL Corporation Limited 929 979 903 1,170
SWAL Corporation Limited - 83 83 117
Advanta Holdings BV Netherlands - - - 390
Notes: 1. This includes short term employee benefits and key management personnel who are under the employment of the Company are entitled
to post employment benefits and other long term employee benefits recognied as per Ind AS19- Employee Benefits in the standalone
financial statements. As these employee benefits are lumpsum such amounts provided on the basis of actuarial valuation, the same is not
included above.
2. Terms and conditions of transactions with related parties The sales to and purchases from related parties are made on terms equivalent to those that prevail in arm's length transactions. Outstanding
balances at the year-end are unsecured and interest free and settlement occurs in cash. There have been no guarantees provided or received
for any related party receivables or payables. This assessment is undertaken each financial year through examining the financial position of
the related party and the market in which the related party operates.
Notes to standalone financial statements for the year ended March 31, 2018

UPL Limited Annual Report, 2017-18 218
37. Capitalization of expenditureDuring the year, the Company has capitalized the following expenses of revenue nature to the cost of property, plant and equipment
/ capital work-in-progress (CWIP). Consequently, expenses disclosed under the respective notes are net of amounts capitalized by the
Company.
INR Crores
Nature of Transaction March 31, 2018 March 31, 2017
Employee cost & other expenses 26 22
38. Hedging activities and derivatives
Derivatives not designated as hedging instrumentsThe Company uses full currency interest rate swap and foreign exchange forward contracts to manage some of its transaction exposures.The
foreign exchange forward contracts are not designated as cash flow hedges and are entered into for periods consistent with foreign currency
exposure of the underlying transactions.
The Company enters into foreign exchange forward contracts with the intention to reduce the foreign exchange risk of expected sales and
purchases, these contracts are not designated in hedge relationships and are measured at fair value through profit or loss.
Currency March 31, 2018 March 31, 2018 March 31, 2017 March 31, 2017 Purpose
(In. '000) (INR Crores) (In. '000) (INR Crores)
Nature of Instrument
Forward contract - Buy USD 22,520 147 23,856 155 Hedging
Derivative contracts
Full Currency Interest Rate Swap
contracts - Buy
USD 1,11,179 725 1,11,179 550 Hedging-refer
note below
Full Currency Interest Rate Swap
contracts - Buy
EUR 25,667 207 25,667 210 Hedging-refer
note below
Note:Hedging against the underlying INR borrowings by which:
- Company will receive principal in INR and pay in foreign currency
- Company will receive fixed interest in INR and pay fixed / floating interest in foreign currency
Un-hedged Foreign Currency balances:
Currency March 31, 2018 March 31, 2018 March 31, 2017 March 31, 2017
(In. '000) (INR Crores) (In. '000) (INR Crores)
Payables USD 2,44,823 1,596 2,78,940 1,809
EUR 2,166 18 27,804 193
GBP 183 2 195 2
JPY - - 97 0
AUD 3 0 2 0
CHF - - 1 0
AED 60 0 - -
Receivable USD 2,39,793 1,563 2,52,573 1,638
EUR 39,192 317 24,408 169
AUD 554 3 782 4
GBP - - 35 0
CHF 199 1 - -
JPY 821 0 968 0
Notes to standalone financial statements for the year ended March 31, 2018Notes to standalone financial statements for the year ended March 31, 2018

Overview
Strategyreview Performance Governance Financials
219
39. Catergory-wise classification of financial instruments INR Crores
Particulars Notes Non-current Current
March 31, 2018 March 31, 2017 March 31, 2018 March 31, 2017
(A) Accounting, classification and fair values
Financial assets measured at fair value through profit or loss (FVTPL)
Investments in unquoted equity shares 5 7 7 - -
Investments in unquoted optionally convertible
bonds
5 76 83 - -
83 90 - -
Financial assets measured at fair value through
other comprehensive income (FVTOCI)
Investments in quoted equity shares 5 5 3 - -
5 3 - -
(A) Accounting, classification and fair values:
Financial assets measured at amortised cost
Security Deposits 6 74 79 - -
Loans and Advances to related parties 6 831 859 98 127
Loans to employees 6 - 3 7 1
Interest Receivable 7 - - 24 5
Receivables from related parties 7 - - 68 47
Export Benefits receivables 7 35 60 82 75
Trade receivable 10 - - 2,017 1,957
Cash and cash equivalents 11 93 59
Other Bank balance 11A 33 12
940 1,001 2,422 2,283
Financial liabilities measured at fair value through profit or loss (FVTPL)
Derivative contracts 15 135 142 36 -
135 142 36 -
Financial liabilities measured at amortised cost
Unsecured Redeemable Non convertible
Debentures (NCDs)
14 and 15 682 756 127 52
Loans repayable on demand
- Secured 14 - - 65 3
- Unsecured 14 - - 248 13
Trade Deposits 15 - - 51 51
Creditors for capital goods 15 - - 154 38
Interest accrued on borrowings 15 - - 1 -
Unpaid dividend 15 - - 7 6
Others 15 4 4 1 1
Trade payables (non-current) 17 - 9 - -
Trade payables (current) 18 - - 2,353 2,188
686 769 3,007 2,352
Notes to standalone financial statements for the year ended March 31, 2018Notes to standalone financial statements for the year ended March 31, 2018

UPL Limited Annual Report, 2017-18 220
(B) Measurement of fair value: Valuation techniques and significant unobservable inputs:
(i) Financial instruments measured at fair valueThe fair value of the financial assets and liabilities is included at the amount at which the instrument could be exchanged in a current
transaction between willing parties, other than in a forced or liquidation sale. The following methods and assumptions were used to estimate
the fair values:
- The fair value of unquoted instruments, loans from banks and other financial liabilities, as well as other non-current financial liabilities is
estimated by discounting future cash flows using rates currently available for debt on similar terms, credit risk and remaining maturities.
In addition to being sensitive to a reasonably possible change in the forecast cash flows or the discount rate, the fair value of the equity
instruments is also sensitive to a reasonably possible change in the growth rates. Management regularly assesses a range of reasonably
possible alternatives for those significant unobservable inputs and determines their impact on the total fair value.
-The fair values of the unquoted equity shares have been estimated using a DCF model. The valuation requires management to make certain
assumptions about the model inputs, including forecast cash flows, discount rate, credit risk and volatility. The probabilities of the various
estimates within the range can be reasonably assessed and are used in management’s estimate of fair value for these unquoted equity
investments.
- The fair values of the remaining FVTOCI financial assets are derived from quoted market prices in active markets.
- The fair values of the Company’s interest-bearing borrowings and loans are determined by using DCF method using discount rate that
reflects the issuer’s borrowing rate as at the end of the reporting period. The own non-performance risk as at 31 March 2018 was assessed to
be insignificant.
The discount for lack of marketability represents the amounts that the Company has determined that market participants would take into
account when pricing the investments.
(ii) Financial instrument measured at amortized cost:The carrying amount of financial assets and financial liability measured at amortized cost in the financial statements are a resonable
approximation of their fair value since the Company does not anticipate that the carrying amounts would be significantly different from the
value that would eventually be received or settled.
Notes to standalone financial statements for the year ended March 31, 2018
40. Fair Value hierarchy
The following table provides the fair value measurement hierarchy of the Company’s assets and liabilities.
Quantitative disclosures fair value measurement hierarchy for assets as at 31 March 2018: INR Crores
Fair value measurement using
Date of valuation
Total Quoted prices in active markets
Significant observable
inputs
Significant unobservable
inputs
(Level 1) (Level 2) (Level 3)
Assets measured at fair value:
FVTOCI financial investments (Note 5):
Quoted equity shares Mar 31, 2018 5 5 - -
FVTPL financial investments (Note 5):
Unquoted equity shares Mar 31, 2018 7 - - 7
Unquoted optionally convertible bonds Mar 31, 2018 76 - 76 -
There have been no transfers between Level 1 and Level 2 during the period.
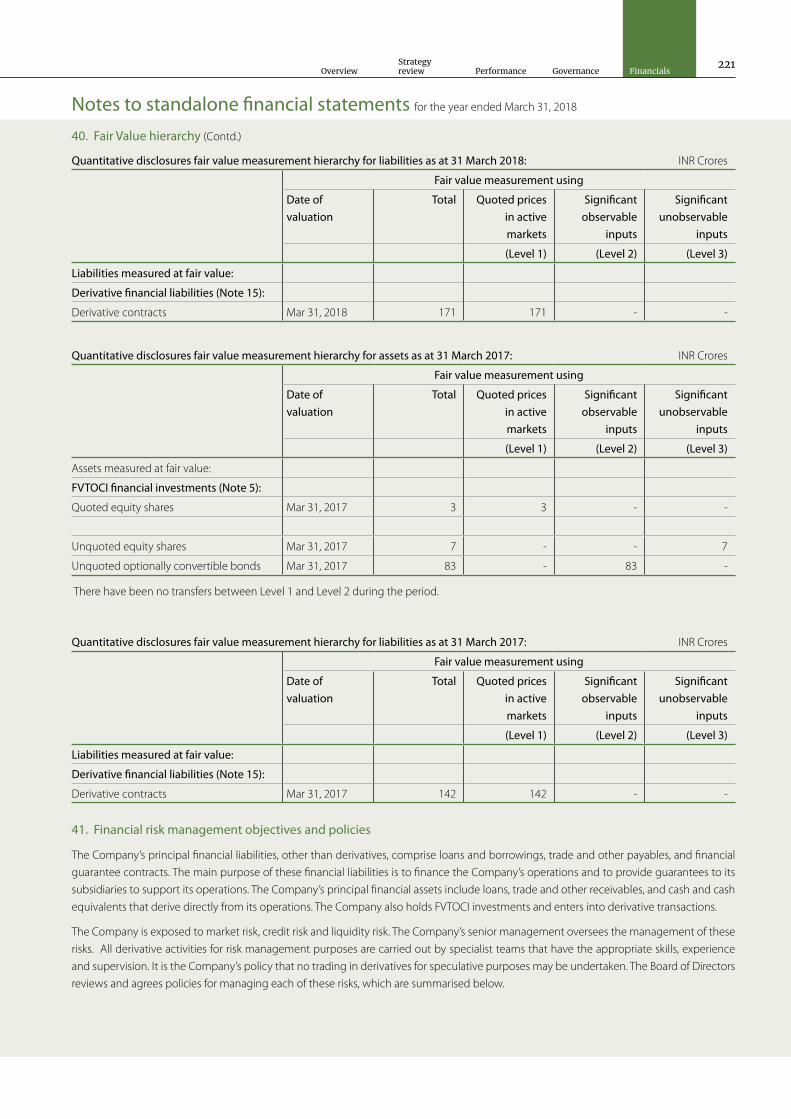
Overview
Strategyreview Performance Governance Financials
221
Notes to standalone financial statements for the year ended March 31, 2018
40. Fair Value hierarchy (Contd.)
Quantitative disclosures fair value measurement hierarchy for liabilities as at 31 March 2018: INR Crores
Fair value measurement using
Date of valuation
Total Quoted prices in active markets
Significant observable
inputs
Significant unobservable
inputs
(Level 1) (Level 2) (Level 3)
Liabilities measured at fair value:
Derivative financial liabilities (Note 15):
Derivative contracts Mar 31, 2018 171 171 - -
Quantitative disclosures fair value measurement hierarchy for liabilities as at 31 March 2017: INR Crores
Fair value measurement using
Date of valuation
Total Quoted prices in active markets
Significant observable
inputs
Significant unobservable
inputs
(Level 1) (Level 2) (Level 3)
Liabilities measured at fair value:
Derivative financial liabilities (Note 15):
Derivative contracts Mar 31, 2017 142 142 - -
Quantitative disclosures fair value measurement hierarchy for assets as at 31 March 2017: INR Crores
Fair value measurement using
Date of valuation
Total Quoted prices in active markets
Significant observable
inputs
Significant unobservable
inputs
(Level 1) (Level 2) (Level 3)
Assets measured at fair value:
FVTOCI financial investments (Note 5):
Quoted equity shares Mar 31, 2017 3 3 - -
Unquoted equity shares Mar 31, 2017 7 - - 7
Unquoted optionally convertible bonds Mar 31, 2017 83 - 83 -
There have been no transfers between Level 1 and Level 2 during the period.
41. Financial risk management objectives and policies
The Company’s principal financial liabilities, other than derivatives, comprise loans and borrowings, trade and other payables, and financial
guarantee contracts. The main purpose of these financial liabilities is to finance the Company’s operations and to provide guarantees to its
subsidiaries to support its operations. The Company’s principal financial assets include loans, trade and other receivables, and cash and cash
equivalents that derive directly from its operations. The Company also holds FVTOCI investments and enters into derivative transactions.
The Company is exposed to market risk, credit risk and liquidity risk. The Company’s senior management oversees the management of these
risks. All derivative activities for risk management purposes are carried out by specialist teams that have the appropriate skills, experience
and supervision. It is the Company’s policy that no trading in derivatives for speculative purposes may be undertaken. The Board of Directors
reviews and agrees policies for managing each of these risks, which are summarised below.
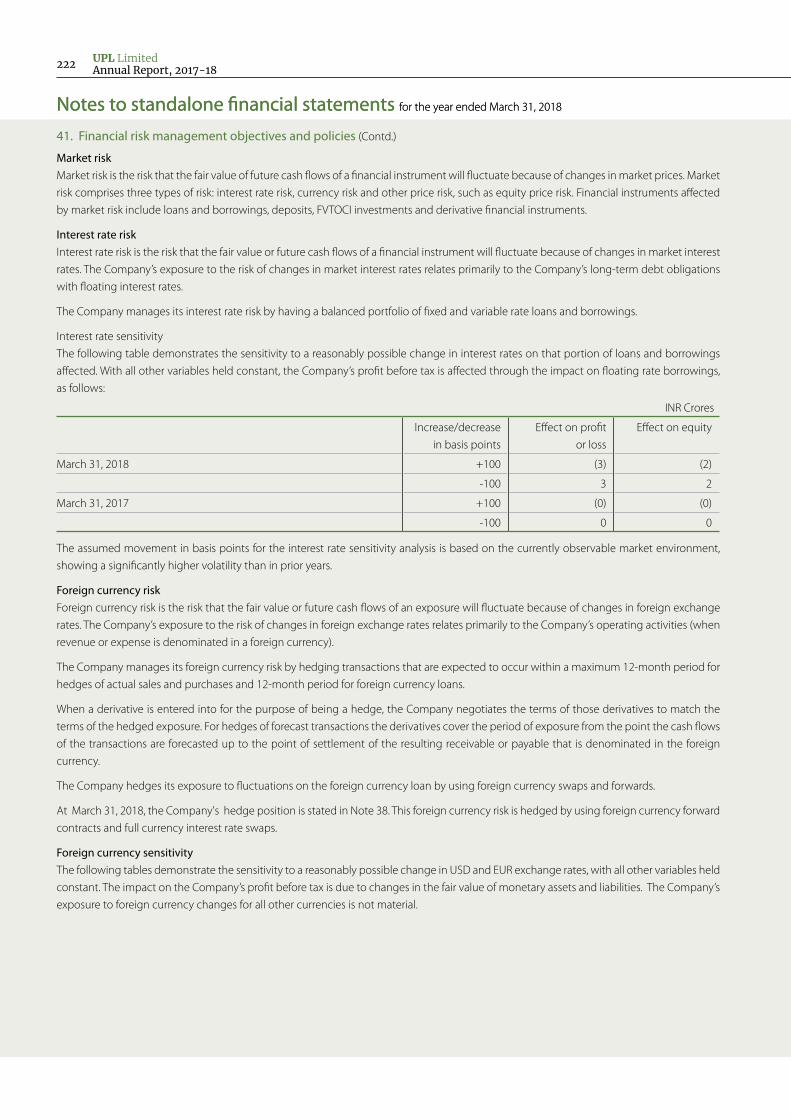
UPL Limited Annual Report, 2017-18 222
Notes to standalone financial statements for the year ended March 31, 2018Notes to standalone financial statements for the year ended March 31, 2018
Market riskMarket risk is the risk that the fair value of future cash flows of a financial instrument will fluctuate because of changes in market prices. Market
risk comprises three types of risk: interest rate risk, currency risk and other price risk, such as equity price risk. Financial instruments affected
by market risk include loans and borrowings, deposits, FVTOCI investments and derivative financial instruments.
Interest rate riskInterest rate risk is the risk that the fair value or future cash flows of a financial instrument will fluctuate because of changes in market interest
rates. The Company’s exposure to the risk of changes in market interest rates relates primarily to the Company’s long-term debt obligations
with floating interest rates.
The Company manages its interest rate risk by having a balanced portfolio of fixed and variable rate loans and borrowings.
Interest rate sensitivity
The following table demonstrates the sensitivity to a reasonably possible change in interest rates on that portion of loans and borrowings
affected. With all other variables held constant, the Company’s profit before tax is affected through the impact on floating rate borrowings,
as follows:
INR Crores
Increase/decrease
in basis points
Effect on profit
or loss
Effect on equity
March 31, 2018 +100 (3) (2)
-100 3 2
March 31, 2017 +100 (0) (0)
-100 0 0
The assumed movement in basis points for the interest rate sensitivity analysis is based on the currently observable market environment,
showing a significantly higher volatility than in prior years.
Foreign currency risk Foreign currency risk is the risk that the fair value or future cash flows of an exposure will fluctuate because of changes in foreign exchange
rates. The Company’s exposure to the risk of changes in foreign exchange rates relates primarily to the Company’s operating activities (when
revenue or expense is denominated in a foreign currency).
The Company manages its foreign currency risk by hedging transactions that are expected to occur within a maximum 12-month period for
hedges of actual sales and purchases and 12-month period for foreign currency loans.
When a derivative is entered into for the purpose of being a hedge, the Company negotiates the terms of those derivatives to match the
terms of the hedged exposure. For hedges of forecast transactions the derivatives cover the period of exposure from the point the cash flows
of the transactions are forecasted up to the point of settlement of the resulting receivable or payable that is denominated in the foreign
currency.
The Company hedges its exposure to fluctuations on the foreign currency loan by using foreign currency swaps and forwards.
At March 31, 2018, the Company's hedge position is stated in Note 38. This foreign currency risk is hedged by using foreign currency forward
contracts and full currency interest rate swaps.
Foreign currency sensitivity The following tables demonstrate the sensitivity to a reasonably possible change in USD and EUR exchange rates, with all other variables held
constant. The impact on the Company’s profit before tax is due to changes in the fair value of monetary assets and liabilities. The Company’s
exposure to foreign currency changes for all other currencies is not material.
41. Financial risk management objectives and policies (Contd.)

Overview
Strategyreview Performance Governance Financials
223
Notes to standalone financial statements for the year ended March 31, 2018Notes to standalone financial statements for the year ended March 31, 2018
41. Financial risk management objectives and policies (Contd.)
INR Crores
Change in USD Rate
Effect on profit or loss
Effect on equity
March 31, 2018 1% (0) (0)
-1% 0 0
March 31, 2017 1% (2) (1)
-1% 2 1
INR Crores
Change in USD Rate
Effect on profit or loss
Effect on equity
March 31, 2018 1% 3 2
-1% (3) (2)
March 31, 2017 1% 0 0
-1% (0) (0)
The movement in the pre-tax effect is a result of a change in the fair value of of monetary assets and liabilities denominated in US dollars,
where the functional currency of the entity is a currency other than US dollars. Although the derivatives have not been designated in a hedge
relationship, they act as an economic hedge and will offset the underlying transactions when they occur.
Equity price risk The Company’s listed and non-listed equity securities are susceptible to market price risk arising from uncertainties about future values of the
investment securities. The investment in listed and unlisted equity securities are not significant.
Credit risk Credit risk is the risk that counterparty will not meet its obligations under a financial instrument or customer contract, leading to a financial
loss. The Company is exposed to credit risk from its operating activities (primarily trade receivables) and from its financing activities, including
deposits with banks and financial institutions, foreign exchange transactions and other financial instruments.
Financial instruments and cash depositsCredit risk from balances with banks and financial institutions is managed by the Company’s treasury department. Investments of surplus
funds are made only with approved counterparties and within credit limits assigned to each counterparty. The limits are set to minimise the
concentration of risks and therefore mitigate financial loss through counterparty’s potential failure to make payments.
The Company’s maximum exposure to credit risk for the components of the balance sheet at March 31, 2018, 31 March 2017 is the carrying
amounts as illustrated in Note 10 except for financial guarantees and derivative financial instruments.
Liquidity risk Liquidity risk is the risk that the Company will not be able to meet its financial obligations as they fall due. The Company's approach to
managing liquidity is to ensure, as far as possible, that it will always have sufficient liquidity to meet its liabilities when due, under both normal
and stressed conditions, without incurring unacceptable losses or risking damage to the Company's reputation.
The Company manages liquidity risk by maintaining adequate reserves, by continuously monitoring forecast and actual cash flows and
matching the maturity profiles of the financial assets and liabilities.
The table below summarises the maturity profile of the Company’s financial liabilities based on contractual undiscounted payments.

UPL Limited Annual Report, 2017-18 224
Notes to standalone financial statements for the year ended March 31, 2018
INR Crores
March 31, 2018
Less than 1 year 1 to 5 years > 5 years Total
Borrowings (other than convertible preference
shares) (refer note 14)
313 413 269 995
Convertible preference shares (refer note 15) - - - -
Other financial liabilities (refer note 15) 341 4 - 345
Trade and other payables (refer note 17 and 18) 2,353 - - 2,353
Derivative contracts (refer note 15) 36 135 - 171
3,043 552 269 3,864
INR Crores
March 31, 2017
Less than 1 year 1 to 5 years > 5 years Total
Borrowings (other than convertible preference
shares) (refer note 14)
16 344 412 772
Convertible preference shares (refer note 15) 24 - - 24
Other financial liabilities (refer note 15) 148 4 - 152
Trade and other payables (refer note 17 and 18) 2,188 9 - 2,197
Derivative contracts (refer note 15) - 117 25 142
2,376 474 437 3,287
41. Financial risk management objectives and policies (Contd.)
42. Capital management
Capital includes equity attributable to the equity holders to ensure that it maintains an efficient capital structure and healthy capital ratios
in order to support its business and maximise shareholder value. The Company manages its capital structure and makes adjustments to it, in
light of changes in economic conditions or its business requirements. To maintain or adjust the capital structure, the Company may adjust
the dividend payment to shareholders, return capital to shareholders or issue new shares. No changes were made in the objectives, policies
or processes during the year ended March 31, 2018 and March 31, 2017.
The Company monitors capital using a gearing ratio, which is net debt divided by total capital plus net debt. Net debt is calculated as loans
and borrowings less cash and cash equivalents.
INR Crores
March 31, 2018 March 31, 2017
Borrowings other than convertible preference shares (Note 14 and 15) 1,122 824
Less: cash and cash equivalents (Note 11) (93) (59)
Net debt 1,029 765
Optionally Convertible preference shares (Note 14) - 24
Equity (Note 12 and 13) 7,969 7,750
Total capital 7,969 7,774
Capital and net debt 8,998 8,539
Gearing ratio 11% 9%
In order to achieve this overall objective, the Company’s capital management, amongst other things, aims to ensure that it meets financial
covenants attached to the interest-bearing loans and borrowings that define capital structure requirements. Breaches in meeting the financial
covenants would permit the bank to immediately call loans and borrowings. There have been no breaches in the financial covenants of any
interest-bearing loans and borrowing in the current period.

Overview
Strategyreview Performance Governance Financials
225
Notes to standalone financial statements for the year ended March 31, 2018
INR Crores
43. Exceptional items March 31, 2018 March 31, 2017
Amount payable on settlement of a contract in respect of earlier years - 14
Provision of Stamp duty on merger of Advanta - 32
Amount payable as per final order of The Competition Commission of India 7 -
7 46
44. Foreign Exchange Management Act
In January 2013, the Company had received a show cause notice from the Directorate of Enforcement, alleging that the Company had
contravened certain provisions of Foreign Exchange Management Act, 1999 with regard to foreign direct investment made and utilisation of
proceeds of FCCB / ECB. The Company had replied to the show cause notice and had personal hearings to represent their matter and filed
written submissions on the basis of which Directorate of Enforcement vide order dated 28th February, 2018 has dropped all the charges
levied against the Company.
45. Amalgamation with Advanta Limited
The Hon'ble High Court of Gujarat vide its order dated 23rd June, 2016 has sanctioned the Scheme of Amalgamation of Advanta Limited, a
subsidiary as per Ind AS, with the Company with an appointed date of 1st April, 2015. The Scheme has become effective on 20th July, 2016,
pursuant to its filing with Registrar of Companies.
In accordance with the provisions of the aforesaid scheme the Company had in prior year accounted for the amalgamation under the
"Purchase Method" as prescribed by the Accounting Standard 14 - Accounting for Amalgamations, which is different from Ind AS 103 "
Business Combinations". Accordingly the accounting treatment had been given as under:
a. The amalgamation has been accounted under the “Purchase Method” as prescribed by Accounting Standard 14 - Accounting for
Amalgamations which is different from Ind AS 103 "Business Combinations". Accordingly, the accounting treatment has been given as
under:-
(i) The assets and liabilities of Advanta Limited as at 1 April 2015 have been incorporated at their book values in the financial statements
of the Company.
(ii) All inter-corporate balances and obligations (including investments held by the Company in Advanta Limited, deposits, loans and
advances, outstanding balances or other obligations) between the Company and Advanta Limited stands cancelled.
b. The excess of fair value of equity shares and preference shares over the book value of assets and liabilities transferred and cancellation of
Investments in Advanta held by the Company amounting to H3,697 crores has been recorded as goodwill arising on amalgamation.
c. Consideration for amalgamation discharged by way of issuance of new Equity Shares has been recorded at fair value and Preference
Shares has been recorded at face value. As the shares have been allotted subsequent to the March 31, 2016, the same has been disclosed
under Share Capital Suspense account till the date of allotment.
d. In accordance with scheme, the goodwill recorded on amalgamation has been amortised and the Company has estimated its useful life
of 10 years. Accordingly, amortisation for the year amounting to H370 crores (31 March, 2016: H370 Crores) has been recognised in the
statement of profit and loss.

UPL Limited Annual Report, 2017-18 226
Notes to standalone financial statements for the year ended March 31, 2018
Book value of assets and liabilities acquired from Advanta Limited are as under:
Assets INR Crores
Non Current Assets 645
Current Assets 81
Total Assets (A) 726
Liabilities
Non-Current Liabilities 6
Current Liabilities 86
Total Liabilities (B) 92
Net Assets taken over (C)=(A-B) 634
Cancellation of Investments in Advanta Limited held by the Company (D) 539
Purchase consideration (E) 3,797
Less: Other adjustments (F) (5)
Goodwill on amalgamation (G)=(E-F-C+D) 3,697
45. Amalgamation with Advanta Limited (Contd.)
46. CSR expenditure:Details of CSR expenditure: INR Crores
March 31, 2018 March 31, 2017
Gross amount required to be spent by the company during the year 6 8
6 8
INR Crores
March 31, 2018
In cash Yet to be paid in Cash
Total
Amount spent during the year
Construction/acquisition of any asset - - -
On purposes other than above 19 1 20
19 1 20
INR Crores
March 31, 2017
In cash Yet to be paid in Cash
Total
Amount spent during the year
Construction/acquisition of any asset - - -
On purposes other than above 23 1 24
23 1 24

Overview
Strategyreview Performance Governance Financials
227N
otes
to s
tand
alon
e fin
anci
al s
tate
men
ts fo
r the
yea
r end
ed M
arch
31,
201
8
47. S
egm
ent i
nfor
mat
ion
1. I
nfor
mat
ion
abou
t Ope
ratin
g Bu
sine
ss S
egm
ents
IN
R C
rore
s
Mar
ch 3
1, 2
018
Mar
ch 2
017
Agr
o Ac
tivity
N
on A
gro
Activ
ity
Una
lloca
ted
Tota
l A
gro
Activ
ity
Non
Agr
o Ac
tivity
U
nallo
cate
d To
tal
Reve
nue
Exte
rnal
6,7
87
574
1
3 7
,374
6
,794
4
65
18
7,2
77
Inte
r seg
men
t (1
83)
183
-
- (1
83)
183
-
-
Tota
l rev
enue
6,6
04
757
1
3 7
,374
6
,611
6
48
18
7,2
77
Segm
ent R
esul
ts
Cont
ribut
ion
741
2
9 -
770
7
25
55
- 7
80
Add
: Int
er s
egm
ent p
rofit
(37)
37
- -
(37)
37
- -
Tota
l seg
men
t res
ults
704
6
6 -
770
6
88
92
- 7
80
Una
lloca
ted
expe
nses
net
of u
nallo
cate
d in
com
e-
- 5
2 1
67
Fina
nce
cost
s-
- 1
35
149
Exce
ptio
nal i
tem
s (re
fer n
ote
43)
7
46
Profi
t bef
ore
taxa
tion
576
4
18
Prov
isio
n fo
r:
Curr
ent t
ax-
--
180
8
9
Adj
ustm
ents
of t
ax re
latin
g to
ear
lier y
ears
--
- (8
3) -
Def
erre
d ta
x (6
9) 8
4
Net
pro
fit a
fter
tax
548
2
45
Oth
er in
form
atio
n
Segm
ent a
sset
s 9
,148
7
38
2,1
64
12,
050
8,6
91
623
2
,032
1
1,34
6
Segm
ent l
iabi
litie
s 2
,458
1
76
1,4
47
4,0
81
2,2
95
152
1
,149
3
,596
Capi
tal e
xpen
ditu
re 6
65
65
13
743
4
24
21
21
466
Dep
reci
atio
n 1
87
27
12
226
1
53
39
14
206
Am
ortis
atio
n 4
20
0
20
440
4
02
0
48
450
Non
cas
h ex
pens
es o
ther
than
dep
reci
atio
n 1
7 0
7
2
4 9
1
0
1
0

UPL Limited Annual Report, 2017-18 228
Notes to standalone financial statements for the year ended March 31, 2018
2. Information about Geographical Business Segments INR Crores
March 31, 2018 March 31, 2017 India Outside
India Total India Outside
India Total
Revenue by Geographical Market
External 3,392 3,982 7,374 3,114 4,163 7,277
Carrying amount of Non Current Operating Assets 5,453 336 5,789 5,213 390 5,603
3. Notes (i) The business of the Company is divided into two business segments. These segments are the basis for management control and hence
form the basis for reporting. The business of each segment comprises of:
a) Agro activity – This is the main area of the Company’s operation and includes the manufacture and marketing of conventional
agrochemical products, seeds and other agricultural related products.
b) Non-agro activity – Non agro activities includes manufacture and marketing of industrial chemical and other non agricultural
related products.
(ii) Segment Revenue in the above segments includes sales of products net of taxes.
(iii) Inter Segment Revenue is taken as comparable third party average selling price for the year.
(iv) Segment Revenue in the geographical segments considered for disclosure are as follows:
a) Revenue within India includes sales to customers located within India.
b) Revenue outside India includes sales to customers located outside India
(v) Segment Revenue, Results, Assets and Liabilities include the respective amounts identifiable to each of the segments and amounts
allocated on a reasonable basis.
(vi) The Company does not have any customer (other than related parties), with whom revenue from transactions is more than 10% of
Company's total revenue.
(vii) Based on the "management approach" defined in Ind AS 108 - Operating Segments, the Chief Operating Decision Maker evaluates
the company's performance and allocate resources based on an analysis of various performance indicators by business segments.
Accordingly information has been presented along these segments.
47. Segment information (Contd.)
48. Details of Specified bank notes (SBN)
The disclosures regarding details of specified bank notes held and transacted during 8 November 2016 to 30 December 2016 has not been
made since the requirement does not pertain to financial year ended 31 March 2018. Corresponding amounts as appearing in the audited
Standalone Ind AS financial statements for the period ended 31 March 2017 have been disclosed as under:
INR Crores
Particulars SBN Other denominations
Total
Closing cash balance as on 08.11.2016 73,82,500 12,46,120 86,28,620
Add: Permitted receipts
Amount withdrawn from Banks - 61,25,495 61,25,495
Less: Permitted payments (2,54,500) - (2,54,500)
Less: Amount deposited in banks (71,28,000) - (71,28,000)
Expenditure incurred - (48,38,173) (48,38,173)
Closing cash balance as on 30.12.2016 - 25,33,442 25,33,442

Overview
Strategyreview Performance Governance Financials
229
Notes to standalone financial statements for the year ended March 31, 2018
49. Details of dues to micro and small enterprises as defined under the MSMED Act, 2006 INR Crores
March 31, 2018 March 31, 2017
The principal amount and interest due thereon remaining unpaid to any supplier as at the end
of each accounting year:
Principal amount due to micro and small enterprises 17 1
Interest due on above, current year H0 (March 31, 2017: HNil) 0 -
Total 17 1
The amount of interest paid by the buyer in terms of section 16 of the MSMED Act 2006 along
with the amounts of the payment made to the supplier beyond the appointed day during
each accounting year
- -
The amount of interest due and payable for the period of delay in making payment (which
have been paid but beyond the appointed day during the year) but without adding the
interest specified under the MSMED Act, 2006.
- -
The amount of interest accrued and remaining unpaid at the end of each accounting year,
current year H0 (March 31, 2017: HNil)
- -
The amount of further interest remaining due and payable even in the succeeding years, until
such date when the interest dues as above are actually paid to the small enterprise for the
purpose of disallowance as a deductible expenditure u/s 23 of MSMED Act, 2006.
- -
Note: The information has been given in respect of such vendors to the extent they could be identified as Micro, and Small enterprises on the
basis of information available with the Company.
As per our report of even date attached.
For B S R & Co. LLP For and on behalf of the Board of Directors of UPL Limited
Chartered Accountants CIN No.-L24219GJ1985PLC025132
Firm registration number: 101248W/W-100022
Bhavesh Dhupelia R.D. Shroff A.C. AsharPartner Chairman & Managing Director Whole-time Director
Membership no.: 042070 Din No.-00180810 Din No.- 00192088
Place: Mumbai Place: Mumbai
Anand Vora M.B. Trivedi Chief Financial Officer Company Secretary
Membership no.: ACS4250
Place: Mumbai Place: Mumbai Place: San Francisco
Date: April 27, 2018 Date: April 27, 2018 Date: April 27, 2018

UPL Limited Annual Report, 2017-18 230
Report on the Audit of the Consolidated Ind AS Financial StatementsWe have audited the accompanying Consolidated Ind AS financial
statements of UPL Limited (hereinafter referred to as ‘the Holding
Company’) and its subsidiaries (the Holding Company and its
subsidiaries together referred to as ‘the Group’), its associates and
joint ventures as listed in Annexure-I, comprising of the Consolidated
Balance Sheet as at 31 March 2018, the Consolidated Statement
of Profit and Loss (including Other Comprehensive Income), the
Consolidated Statement of Changes in Equity and the Consolidated
Cash Flow Statement, for the year then ended, including a summary
of significant accounting policies and other explanatory information
(hereinafter referred to as “the Consolidated Ind AS financial
statements”).
Management’s Responsibility for the Consolidated Ind AS Financial StatementsThe Holding Company’s Board of Directors is responsible for the
preparation of these Consolidated Ind AS financial statements in
terms of the requirements of the Companies Act, 2013 (hereinafter
referred to as “the Act”) that give a true and fair view of the
consolidated state of affairs, consolidated profit (including other
comprehensive income), consolidated cash flows and consolidated
statement of changes in equity of the Group including its associates
and joint ventures in accordance with the accounting principles
generally accepted in India, including the Indian Accounting
Standards (Ind AS) prescribed under Section 133 of the Act. The
respective Board of Directors of the companies included in
the Group, its associates and joint ventures are responsible for
maintenance of adequate accounting records in accordance with
the provisions of the Act for safeguarding the assets of the Group,
its associates and joint ventures and for preventing and detecting
frauds and other irregularities; the selection and application of
appropriate accounting policies; making judgments and estimates
that are reasonable and prudent; and design, implementation and
maintenance of adequate internal financial controls that were
operating effectively for ensuring the accuracy and completeness of
the accounting records, relevant to the preparation and presentation
of the consolidated Ind AS financial statements that give a true and
fair view and are free from material misstatement, whether due to
fraud or error which have been used for the purpose of preparation
of the consolidated Ind AS financial statements by the Directors of
the Holding Company, as aforesaid.
In preparing the Consolidated Ind AS financial statements, the
respective Board of Directors of the companies included in the
Group, its associates and joint ventures are responsible for assessing
the ability of the Group, its associates and joint ventures to continue
as a going concern, disclosing, as applicable, matters related to
going concern and using the going concern basis of accounting
unless management either intends to liquidate the Group its
associates and joint ventures or to cease operations, or has no
realistic alternative but to do so.
Auditors’ Responsibility Our responsibility is to express an opinion on these Consolidated
Ind AS financial statements based on our audit. While conducting
the audit, we have taken into account the provisions of the Act, the
accounting and auditing standards and matters which are required
to be included in the audit report under the provisions of the Act
and the Rules made thereunder.
We conducted our audit in accordance with the Standards on
Auditing specified under Section 143 (10) of the Act. Those
Standards require that we comply with ethical requirements and
plan and perform the audit to obtain reasonable assurance about
whether the consolidated Ind AS financial statements are free from
material misstatement.
An audit involves performing procedures to obtain audit evidence
about the amounts and the disclosures in the Consolidated Ind
AS financial statements. The procedures selected depend on the
auditor’s judgment, including the assessment of the risks of material
misstatement of the Consolidated Ind AS financial statements,
whether due to fraud or error. In making those risk assessments, the
auditor considers internal financial control relevant to the Holding
Company’s preparation of the Consolidated Ind AS financial
statements that give a true and fair view in order to design audit
procedures that are appropriate in the circumstances. An audit also
includes evaluating the appropriateness of the accounting policies
used and the reasonableness of the accounting estimates made, as
well as evaluating the overall presentation of the Consolidated Ind
AS financial statements.
We are also responsible to conclude on the appropriateness of
management’s use of the going concern basis of accounting
and, based on the audit evidence obtained, whether a material
uncertainty exists related to events or conditions that may cast
significant doubt on the ability of Group, its associates and joint
ventures to continue as a going concern. If we conclude that a
material uncertainty exists, we are required to draw attention in
the auditors’ report to the related disclosures in the Consolidated
Ind AS financial statements or, if such disclosures are inadequate,
to modify the opinion. Our conclusions are based on the audit
evidence obtained up to the date of our auditors’ report. However,
future events or conditions may cause Group, its associates and joint
ventures to cease to continue as a going concern.
We believe that the audit evidence obtained by us and the audit
evidence obtained by the other auditors in terms of their reports
referred to in sub-paragraph 1 of the Other Matters paragraph
To the Members of UPL Limited
Independent Auditors’ Report
Overview
Strategyreview Performance Governance Financials
231
below, is sufficient and appropriate to provide a basis for our audit
opinion on the Consolidated Ind AS financial statements.
Opinion In our opinion and to the best of our information and according
to the explanations given to us and based on the consideration of
reports of other auditors on separate financial statements and on
the other financial information of the subsidiaries, its associates and
joint ventures, the aforesaid Consolidated Ind AS financial statements
give the information required by the Act in the manner so required
and give a true and fair view in conformity with the accounting
principles generally accepted in India, of the consolidated state of
affairs of the Group, its associates and joint ventures as at 31 March
2018, and their consolidated profit (including other comprehensive
income), their consolidated statement of changes in equity and
consolidated cash flows for the year ended on that date.
Other Matters 1. We did not audit the financial statements and other financial
information of 90 subsidiaries, included in the Consolidated
Ind AS financial statements, whose financial statements reflects
total assets of H53,417 crores and net assets of H23,244 crores
as at 31 March 2018; total revenue of H25,492 crores and net
cash outflows amounting to H66 crores for the year ended on
that date, as considered in the Consolidated Ind AS financial
statements. The Consolidated Ind AS financial statements also
include the Group’s share of net loss of H93 crores for the year
ended 31 March 2018, as considered in the Consolidated Ind
AS financial statements, in respect of 8 associates and 3 joint
ventures, whose financial statements have not been audited
by us. These financial statements of the subsidiaries, associates
and joint ventures have been audited by other auditors whose
reports have been furnished to us by the Management and
our opinion on the Consolidated Ind AS financial statements,
in so far as it relates to the amounts and disclosures included in
respect of these subsidiaries, its associates and joint ventures,
and our report in terms of Section 143 (3) of the Act, in so far
as it relates to the aforesaid subsidiaries, its associates and joint
ventures is based solely on the reports of the other auditors.
Certain of these subsidiaries, associates and joint ventures are
located outside India whose financial statements and other
financial information have been prepared in accordance with
accounting principles generally accepted in their respective
countries and which have been audited by other auditors
under generally accepted auditing standards applicable in their
respective countries. The Holding Company’s management
has converted the financial statements of such subsidiaries,
associates and joint ventures located outside India from
accounting principles generally accepted in their respective
countries to accounting principles generally accepted in
India. We have audited these conversion adjustments made
by the Holding Company’s management. Our opinion in so
far as it relates to the balances and affairs of such subsidiaries,
associates and joint ventures located outside India is based on
the report of other auditors and the conversion adjustments
prepared by the management of the Holding Company and
audited by us.
2. The audited consolidated Ind AS financial statements of the
Group, its associates and joint ventures for the corresponding
year ended 31 March 2017 prepared in accordance with Ind
AS included in these Consolidated Ind AS financial statements,
have been audited by the predecessor auditor whose audit
report dated 28 April 2017 expressed an unmodified opinion
on those audited Consolidated Ind AS financial statements.
3. Our opinion above on the Consolidated Ind AS financial
statements, and our report on Other Legal and Regulatory
Requirements below, is not modified in respect of the above
matters with respect to our reliance on the work done and the
reports of the other auditors.
Report on Other Legal and Regulatory Requirements1 As required by Section 143 (3) of the Act, based on our audit
and on the consideration of report of other auditors on
separate financial statements and other financial information
of subsidiaries, its associates and joint ventures, as noted in the
‘Other matters’ paragraph, we report, to the extent applicable,
that:
(a) We have sought and obtained all the information and
explanations, which to the best of our knowledge and
belief, were necessary for the purposes of our audit of the
aforesaid Consolidated Ind AS financial statements;
(b) In our opinion, proper books of account as required by law
relating to preparation of the aforesaid Consolidated Ind
AS financial statements have been kept so far as it appears
from our examination of those books and the reports of
the other auditors;
(c) The consolidated Balance Sheet, the consolidated
Statement of Profit and Loss (including other
comprehensive income), the consolidated Statement
of Changes in Equity and the consolidated Cash Flow
Statement dealt with by this report are in agreement with
the relevant books of account maintained for the purpose
of preparation of the Consolidated Ind AS financial
statements;
(d) in our opinion, the aforesaid Consolidated Ind AS financial

UPL Limited Annual Report, 2017-18 232
statements comply with the Indian Accounting Standards
(Ind AS) prescribed under Section 133 of the Act;
(e) on the basis of the written representations received from
the directors of the Holding Company as on 31 March 2018
taken on record by the Board of Directors of the Holding
Company and the reports of the statutory auditors of its
subsidiary companies, its associates companies and joint
ventures incorporated in India, none of the directors of
the Group Companies, its associate companies and joint
ventures incorporated in India are disqualified as on 31
March 2018 from being appointed as a director in terms of
Section 164 (2) of the Act;
(f ) with respect to adequacy of the internal financial
controls with reference to financial statements of the
Holding Company, its subsidiary companies, its associates
companies and joint ventures incorporated in India and
the operating effectiveness of such controls, refer to our
separate Report in “Annexure A”;
(g) with respect to the other matters to be included in
the Auditors’ Report in accordance with Rule 11 of the
Companies (Audit and Auditors) Rules, 2014, in our opinion
and to the best of our information and according to the
explanations given to us and based on the consideration
of the report of the other auditors on separate financial
statements as also the other financial information of the
subsidiaries, associates and joint ventures, as noted in the
‘Other Matters’ paragraph:
i. the consolidated Ind AS financial statements disclose
the impact of pending litigations on the consolidated
financial position of the Group, its associates and joint
ventures – Refer Note 37 to the Consolidated Ind AS
financial statements;
ii. the Group, its associates and jointly controlled entities
has made provision, as required under the applicable
law or Ind AS, for material foreseeable losses, if any,
on long-term contracts including derivative contracts
– Refer Note 16 to the Consolidated Ind AS financial
statements in respect of such items as it relates to the
Group, its associates and joint ventures;
iii. there has been no delay in transferring amounts,
required to be transferred, to the Investor Education
and Protection Fund by the Holding Company, its
subsidiary companies, its associate companies and
joint ventures incorporated in India during the year
ended 31 March 2018; and
iv. the disclosures regarding details of specified bank
notes held and transacted during 8 November 2016
to 30 December 2016 has not been made since
the requirement does not pertain to financial year
ended 31 March 2018. Corresponding amounts
as appearing in the audited Consolidated Ind AS
financial statements for the year ended 31 March
2017 have been disclosed.
For B S R & Co. LLPChartered Accountants
Firm’s Registration No: 101248W/W-100022
Bhavesh DhupeliaPlace : Mumbai Partner
Date: 27 April 2018 Membership No: 042070
Report on the Internal Financial Controls under Clause (i) of Sub-section 3 of Section 143 of the Companies Act, 2013 (“the Act”)In conjunction with our audit of the Consolidated Ind AS financial
statements of UPL Limited as of and for the year ended 31 March
2018, we have audited the internal financial controls with reference
to financial statements of UPL Limited (“hereinafter referred to as
“the Holding Company”) and its subsidiary companies, its associate
companies and joint ventures, which are companies incorporated
in India, as of that date.
Management’s Responsibility for Internal Financial ControlsThe respective Board of Directors of the Holding Company, its
subsidiary companies, its associate companies and joint ventures
which are companies incorporated in India, are responsible for
establishing and maintaining internal financial controls based on
the internal financial controls with reference to financial statements
criteria established by the Holding Company considering the
essential components of internal control stated in the Guidance
Note on Audit of Internal Financial Controls over Financial Reporting
issued by the Institute of Chartered Accountants of India (‘ICAI’).
These responsibilities include the design, implementation and
maintenance of adequate internal financial controls that were
operating effectively for ensuring the orderly and efficient conduct
of its business, including adherence to respective company’s
policies, the safeguarding of its assets, the prevention and detection
of frauds and errors, the accuracy and completeness of the
accounting records, and the timely preparation of reliable financial
information, as required under the Act.
Auditors’ ResponsibilityOur responsibility is to express an opinion on the Holding Company’s
internal financial controls with reference to financial statements
Annexure A to the Independent Auditors’ Report – 31 March 2018

Overview
Strategyreview Performance Governance Financials
233
based on our audit. We conducted our audit in accordance with the
Guidance Note on Audit of Internal Financial Controls Over Financial
Reporting (the “Guidance Note”) and the Standards on Auditing,
issued by ICAI and deemed to be prescribed under Section 143(10)
of the Act, to the extent applicable to an audit of internal financial
controls, both applicable to an audit of Internal Financial Controls
and, both issued by the ICAI. Those Standards and the Guidance
Note require that we comply with ethical requirements and plan
and perform the audit to obtain reasonable assurance about
whether adequate internal financial controls with reference to
financial statements was established and maintained and if such
controls operated effectively in all material respects.
Our audit involves performing procedures to obtain audit evidence
about the adequacy of the internal financial controls system with
reference to financial statements and their operating effectiveness.
Our audit of internal financial controls with reference to financial
statements included obtaining an understanding of internal
financial controls with reference to financial reporting, assessing
the risk that a material weakness exists, and testing and evaluating
the design and operating effectiveness of internal control based on
the assessed risk. The procedures selected depend on the auditor’s
judgement, including the assessment of the risks of material
misstatement of the financial statements, whether due to fraud or
error.
We believe that the audit evidence we have obtained and the audit
evidence obtained by the other auditors in terms of their reports
referred in to in Other Matters paragraph below, is sufficient and
appropriate to provide a basis for our audit opinion on the internal
financial controls with reference to financial statements.
Meaning of Internal Financial Controls with reference to financial statementsA company's internal financial control with reference to financial
statements is a process designed to provide reasonable assurance
regarding the reliability of financial reporting and the preparation
of financial statements for external purposes in accordance with
generally accepted accounting principles. A company's internal
financial control with reference to financial statements includes
those policies and procedures that (1) pertain to the maintenance
of records that, in reasonable detail, accurately and fairly reflect
the transactions and dispositions of the assets of the company;
(2) provide reasonable assurance that transactions are recorded
as necessary to permit preparation of financial statements in
accordance with generally accepted accounting principles, and that
receipts and expenditures of the company are being made only in
accordance with authorizations of management and directors
of the company; and (3) provide reasonable assurance regarding
prevention or timely detection of unauthorised acquisition, use, or
disposition of the company's assets that could have a material effect
on the financial statements.
Inherent Limitations of Internal Financial Controls with reference to financial statementsBecause of the inherent limitations of internal financial controls
with reference to financial statements, including the possibility of
collusion or improper management override of controls, material
misstatements due to error or fraud may occur and not be detected.
Also, projections of any evaluation of the internal financial controls
with reference to financial statements to future periods are subject
to the risk that the internal financial control with reference to
financial statements may become inadequate because of changes
in conditions, or that the degree of compliance with the policies or
procedures may deteriorate.
OpinionIn our opinion and to the best of our information and according
to the explanations given to us and based on consideration of
reporting of the other auditors as mentioned in the Other Matter
paragraph below, the Holding Company, its subsidiary companies,
its associates companies and joint ventures, which are companies
incorporated in India, have, in all material respects, an adequate
internal financial controls system with reference to financial
statements and such internal financial controls with reference to
financial statements were operating effectively as at 31 March 2018,
based on the internal control with reference to financial statements
criteria established by the Holding Company considering the
essential components of internal control stated in the Guidance
Note on Audit of Internal Financial Controls Over Financial Reporting
issued by the ICAI.
Other MattersOur aforesaid report under Section 143(3)(i) of the Act on the
adequacy and operating effectiveness of the internal financial
controls with reference to financial statements insofar as it
relates to 4 subsidiary companies and its 2 associate companies
which are companies incorporated in India, is based solely on
the corresponding reports of the auditors of such subsidiary and
associate companies incorporated in India.
For B S R & Co. LLPChartered Accountants
Firm’s Registration No: 101248W/W-100022
Bhavesh DhupeliaPlace : Mumbai Partner
Date: 27 April 2018 Membership No: 042070

UPL Limited Annual Report, 2017-18 234
Annexure-1
The financial statement includes the following entities
Names of the Entities
Subsidiaries: Shroffs United Chemicals Limited
SWAL Corporation Limited
United Phosphorus (India) LLP
United Phosphorus Global LLP
Optima Farm Solutions Limited
UPL Europe Limited
UPL Deutschland GmbH
United Phosphorus Polska Sp.z o.o
UPL Benelux B.V.
Cerexagri B.V.
Blue star B.V.
United Phosphorus Holdings Cooperatief U.A.
United Phosphorus Holdings B.V
Decco Worldwide Post-Harvest Holdings Cooperatief U.A.
Decco Worldwide Post-Harvest Holdings B.V.
United Phosphorus Holding, Brazil B.V
UPL Italia S.R.L
UPL Iberia, S.A
Decco Iberica Postcosecha, S.A.U.
Transterra Invest, S. L. U.
Cerexagri S.A.S.
Neo-Fog S.A.
UPL France
United Phosphorus Switzerland Limited.
Agrodan, ApS
Decco Italia SRL
Limited Liability Company “UPL”
Decco Portugal Post Harvest LDA
United Phosphorus Inc.
UPI Finance LLC
Cerexagri, Inc. (PA)
UPL Delaware, Inc.
Canegrass LLC
Decco US Post-Harvest Inc.
Essentiv LCC
RiceCo LLC
Riceco International, Inc.
UPL Corporation Limited
UPL Limited, Mauritius (merged with UPL Corporation Limited w.e,f. 28 February 2018)
UPL Management DMCC
UPL Limited, Gibraltar
UPL Agro SA DE CV.
Decco Jifkins Mexico Sapi
Perrey Participações S.A
Uniphos Industria e Comercio de Produtos Quimicos Ltda.
UPL Do Brasil - Industria e Comércio de Insumos Agropecuários S.A.
UPL Costa Rica S.A.
UP Bolivia S.R.L
UPL Paraguay S.A.

Overview
Strategyreview Performance Governance Financials
235
Icona Sanluis S.A DVA Technology Argentina S.A. UPL Argentina S.A. Decco Chile SpA UPL Colombia SAS United Phosphorus Cayman Limited UP Aviation Limited UPL Australia Limited UPL New Zealand Limited UPL Shanghai Limited UPL Limited Korea Co., Ltd PT.UPL Indonesia PT Catur Agrodaya Mandiri UPL Limited, Hong Kong UPL Philippines Inc. UPL Vietnam Co. Limited UPL Limited, Japan Anning Decco Fine Chemical Co. Limited UPL Ziraat Ve Kimya Sanayi Ve Ticaret Limited Sirketi UPL Agromed Tarim Ilaclari ve Tohumculuk Sanayi ve Ticaret Anonim Sirketi Safepack Products Limited Citrashine (Pty) Ltd UPL Africa SARL (Divested w.e.f. 9 March 2018) Prolong Limited Agrinet Solutions Limited Advanta Holdings B.V. Advanta Netherlands Holdings B.V. Advanta US LLC (Formerly known as Advanta U.S. Inc) Advanta Seeds International Advanta Seeds DMCC Advanta Commercio De Sementes LTDA Advanta Semillas SAIC Advanta Seeds Pty Ltd Pacific Seeds (Thai) Ltd Pacific Seeds Holdings (Thai) Limited PT Advanta Seeds Indonesia Advanta Seeds Ukraine LLCUPL Jiangsu LimitedUPL Agro Limited, MauritiusRiceco International Bangladesh Limited (w.e.f 2 October 2017)Uniphos Malaysia Sdn Bhd (w.e.f 2 January 2018)Associates :Kerala Enviro Infrastructure Limited Polycot Technologies 2010 Limited3SB Produtos Agrícolas S.A. Sinagro Produtos Agropecuários S.A. Serra Bonita Sementes S.A (w.e.f 5 July 2017)Chemisynth (Vapi) Limited Universal Pestochem (Industries) Limited Weather Risk Management Services Private LtdJoint Ventures :Hodogaya UPL Co. LimitedLongreach Plant Breeders Management Pty LtdUnited Phosphorus (Bangladesh) Limited

UPL Limited Annual Report, 2017-18 236
As per our report of even date attached.
For B S R & Co. LLP For and on behalf of the Board of Directors of UPL LimitedChartered Accountants CIN No.-L24219GJ1985PLC025132Firm's registration No: 101248W/W-100022
Bhavesh Dhupelia R.D. Shroff A.C.AsharPartner Chairman and Managing Director Whole-time DirectorMembership No.: 042070 Din No.-00180810 Din No.- 00192088 Place: Mumbai Place: Mumbai
Anand Vora M.B.Trivedi Chief Financial Officer Company Secretary Membership No.: ACS4250Place: Mumbai Place: Mumbai Place: San FranciscoDate: April 27, 2018 Date: April 27, 2018 Date: April 27, 2018
Consolidated Balance Sheet as at March 31, 2018
INR CroresNotes As at
March 31, 2018As at
March 31, 2017ASSETSNon-current assetsProperty, plant and equipment 3 2,874 2,483 Capital work-in-progress 3 1,090 633 Goodwill 4 432 419 Other intangible assets 4 1,131 1,169 Intangible assets under development 4 229 159 Investments accounted for using the equity method 5 386 174 Financial assets(i) Investments 5 641 204 (ii) Loans 6 151 225 (iii) Trade receivables 10 1 0 (iv) Other financial assets 7 35 60 Income tax assets (net) 194 212 Deferred tax assets (net) 18 529 670 Other non-current assets 8 319 275 Total non-current assets 8,012 6,683 Current assetsInventories 9 4,538 4,156 Financial assets(i) Investments 5 7 0 (ii) Trade receivables 10 6,056 5,656 (iii) Cash and cash equivalents 11 2,859 2,880 (iv) Bank balances other than cash and cash equivalents 11A 35 15 (v) Loans 6 147 119 (vi) Other financial assets 7 167 164 Income tax assets (net) 27 12 Other current assets 8 1,175 656 Total current assets 15,011 13,658 Assets held for sale 20 40 Total Assets 23,043 20,381 Equity and liabilitiesEquityEquity share capital 12 102 101 Compulsorily convertible preference share 12A - 82 Share capital suspense 12B - - Other equity 13 9,067 7,214 Equity attributable to owners of the parent 9,169 7,397 Non-controlling interests 19 33 Total Equity 9,188 7,430
LIABILITIESNon-current liabilities:Financial liabilities(i) Borrowings 15 5,873 5,350 (ii) Trade payables 19 - 10 (iii) Other financial liabilities 16 232 378 Provisions 17 20 16 Deferred tax liabilities (net) 18 88 169 Total non-current liabilities 6,212 5,923 Current liabilities:Financial liabilities(i) Borrowings 15 634 708 (ii) Trade payables 19 5,675 4,875 (iii) Other financial liabilities 16 755 802 Provisions 17 91 93 Other current liabilities 20 357 414 Net employee defined benefit liabilities 35 73 60 Current tax liabilities (net) 57 76
7,642 7,028 Total liabilities 13,855 12,951 Total equity and liabilities 23,043 20,381 Summary of significant accounting policies 2.3The accompanying notes are an integral part of these consolidated financial statements. 3 - 48

Overview
Strategyreview Performance Governance Financials
237
As per our report of even date attached.
For B S R & Co. LLP For and on behalf of the Board of Directors of UPL Limited Chartered Accountants CIN No.-L24219GJ1985PLC025132Firm's registration No: 101248W/W-100022
Bhavesh Dhupelia R.D. Shroff A.C.AsharPartner Chairman and Managing Director Whole-time DirectorMembership No.: 042070 Din No.-00180810 Din No.- 00192088 Place: Mumbai Place: Mumbai
Anand Vora M.B.Trivedi Chief Financial Officer Company Secretary Membership No.: ACS4250Place: Mumbai Place: Mumbai Place: San FranciscoDate: April 27, 2018 Date: April 27, 2018 Date: April 27, 2018
Consolidated Statement of Profit and Loss for the year ended March 31, 2018
INR Crores
Notes Year ended March 31, 2018
Year ended March 31, 2017
REVENUERevenue from operations 21 17,506 16,680 Other income 22 414 444 TOTAL INCOME 17,920 17,124 EXPENSESCost of materials and components consumed (including (increase)/decrease in inventory of finished goods, work-in-progress and traded goods and purchase of stock-in-trade)
8,112 7,816
Excise duty 128 368 Employee benefits expenses 23 1,713 1,627 Finance costs 24 783 735 Depreciation and amortisation expenses 25 675 672 Other expenses 26 4,048 3,884 TOTAL EXPENSES 15,459 15,102Profit before share of loss of equity accounted investee,exceptional items and tax 2,461 2,022 Share of loss of equity accounted investees (net of income tax) 33 & 34 93 19 Profit before exceptional items and tax 2,368 2,003 Exceptional items 27 63 81 Profit before tax 2,305 1,922 Tax expenses 275 189 Current tax 18 311 293 Adjustments of tax relating to earlier years 18 (79) 5 Deferred tax 18 43 (109)Profit for the year 2,030 1,733 Other Comprehensive Income (OCI)A (i) Items that will not be reclassified subsequently to profit or loss 28 8 23 (ii) Income tax relating to items that will not be reclassified to profit or loss 28 (5) 0 B (i) Items that will be reclassified subsequently to profit or loss 28 67 0 (ii) Income tax relating to items that will be reclassified to profit or loss 28 0 0 Total Other Comprehensive Income for the year, net of tax 70 23 Total Comprehensive Income for the year 2,100 1,756Profit for the year 2,030 1,733 Attributable to:
Owners of the parent 2,022 1,727 Non-controlling interests 8 6
Total comprehensive income for the year 2,100 1,756 Attributable to:
Owners of the parent 2,092 1,750 Non-controlling interests 8 6
Earnings per equity share (in INR) 29Basic (Face value of H2 each) 39.79 34.07 Diluted (Face value of H2 each) 39.78 33.92
Summary of significant accounting policies 2.3 The accompanying notes are an integral part of these consolidated financial statements. 3 - 48

UPL Limited Annual Report, 2017-18 238
Consolidated Statement of Changes in Equity for the year ended March 31, 2018
A. Equity Share Capital INR Crores
Equity shares of INR 2 each Compulsorily Convertible Preference Shares (CCPS)
Nos. INR Crores Nos. INR Crores
As at April 1, 2016 42,86,04,274 86 - -
Changes during the year 7,84,12,844 15 8,19,40,125 82
At March 31, 2017 50,70,17,118 101 8,19,40,125 82
Changes during the year 23,15,963 1 (8,19,40,125) (82)
At March 31, 2018 50,93,33,081 102 - -
B. Other Equity INR CroresFor the year ended March 31, 2018
Attributable to the owners of the parent Non-controlling
interest
Total other equityEquity
component of
convertible preference
shares
Reserve and Surplus Items of OCI Total
Capital redemp-
tion reserve
Capital reserve
Securities premium
Debenture redemp-
tion reserve
General reserve
Share-based
payment reserve
Non-controlling
interest reserve
Retained earnings
Equity Instruments
through other
compreh-ensive
income
Exchange differences
on translation
of a foreign
operation
As at 1st April 2017 0 36 171 4,498 127 1,848 2 (3,693) 4,303 (54) (24) 7,214 33 7,247
Profit for the year - - - - - - - - 2,022 - - 2,022 8 2,030
Other comprehensive
income(net of tax)
- - - - - - - - (7) 10 67 70 - 70
Total comprehensive income
Dividends paid during
the year
- - - - - - - - (357) - - (357) (12) (369)
Conversion of optionally
convertible preference
shares and compulsorily
convertible preference
shares
- - - 105 - - - - - - - 105 - 105
Capital reserve of an
associate
- - 18 - - - - - - - - 18 - 18
Transfer from retained
earnings
- 9 - - 14 - - - (23) - - - - -
Shares options exercised - - - 4 - - (2) - - - - 2 - 2
Acquisition of non
controlling interest
- - - - - - - - (11) - - (11) (11) (22)
Foreign exchange
impact
- - 4 - - - - - - - - 4 2 6
As at 31 March 2018 - 45 193 4,607 141 1,848 - (3,693) 5,927 (44) 43 9,067 19 9,086
A1. Share capital suspense (Refer note 30) INR Crores
INR Crores
As at April 1, 2016 3,797
Changes during the year (3,797)
At March 31, 2017 -
Changes during the year -
At March 31, 2018 -

Overview
Strategyreview Performance Governance Financials
239
Consolidated Statement of Changes in Equity for the year ended March 31, 2018
The accompanying notes are an integral part of these consolidated financial statements
As per our report of even date attached.
For B S R & Co. LLP For and on behalf of the Board of Directors of UPL Limited
Chartered Accountants CIN No.-L24219GJ1985PLC025132Firm's registration No: 101248W/W-100022
Bhavesh Dhupelia R.D. Shroff A.C.AsharPartner Chairman and Managing Director Whole-time Director
Membership No.: 042070 Din No.-00180810 Din No.- 00192088
Place: Mumbai Place: Mumbai
Anand Vora M.B.Trivedi Chief Financial Officer Company Secretary
Membership No.: ACS4250
Place: Mumbai Place: Mumbai Place: San Francisco
Date: April 27, 2018 Date: April 27, 2018 Date: April 27, 2018
Other Equity INR CroresFor the year ended March 31, 2017
Attributable to the owners of the parent Non-controlling
interest
Total other equity
Equity component
of convertible preference
shares
Reserve and Surplus Items of OCI Total
Capital redemp-
tion reserve
Capital reserve
Securities premium
Debenture redemp-
tion reserve
General reserve
Share-based
payment reserve
Non-controlling
interest reserve
Retained earnings
Equity Instruments
through other
compreh-ensive
income
Exchange differences
on translation
of a foreign
operation
As at 1st April 2016 - 36 172 822 140 1,848 2 (3,693) 2,779 (76) (24) 2,006 44 2,050
Profit for the year - - - - - - - - 1,727 - - 1,727 6 1,733
Other comprehensive income(net of tax)
- - - - - - - - 1 22 0 23 - 23
Total comprehensive income
Dividends paid during the year
- - - - - - - - (214) - - (214) (16) (230)
Dividend distribution tax on preference dividend
- - - - - - - - (3) - - (3) - (3)
Allotment of shares pursuant to scheme of amalgamation with Advanta Limited (Refer Note 30)
0 - - 3,673 - - - - - - - 3,673 - 3,673
Conversion of optionally convertible preference shares and Compulsorily convertible preference shares
- - 2 - - - - - - - 2 - 2
Transfer to retained earnings
- - - - (15) - - - 15 - - - - -
Transfer from retained earnings
- - - - 2 - - - (2) - - - - -
Shares options exercised - - - 1 - - - - - - - 1 - 1
Share based compensation
- - - - - - 0 - - - - 0 - 0
Foreign exchange impact
- - (1) - - - - - - - - (1) (1) (2)
As at 31 March 2017 0 36 171 4,498 127 1,848 2 (3,693) 4,303 (54) (24) 7,214 33 7,247

UPL Limited Annual Report, 2017-18 240
Consolidated Statement of Cash Flows for the year ended March 31, 2018
INR Crores
Sr. No
Particulars Year ended March 31, 2018 Year ended March 31, 2017
A Cash flow from operating activitiesProfit before exceptional items and tax 2,461 2,022 Adjustments for
Depreciation and amortization expense 675 672
Finance costs 783 735
Allowance for doubtful debts and advances (net) 17 (4)
Assets written off 10 5
Bad debts written off 2 16
Gain on disposal of property, plant and equipment (2) (13)
Fair value gain on financial instruments at fair value through profit or loss - (12)
Interest Income (132) (150)
Unwinding of interest on trade receivables (282) (249)
Manufacturing cxpenses capitalised (26) (23)
Excess provisions in respect of earlier years written back (net) (57) (40)
Sundry credit balances written off (net) 15 (2)
Loss/(Gain) on sale of current and non current investments (net) 7 (12)
1,010 923 Operating profit before working capital changes 3,472 2,945 Working capital adjustments(Increase) in inventories (383) (387)
(Increase) in non current and current trade receivables (138) (316)
(Increase) in other non current and current assets (502) (79)
(Increase)/ Decrease in other non current and current financial assets (12) 5
Increase in non current and current trade payables 663 841
Increase in non current and current provisions and net employee defined benefit liabilities
16 12
(Decrease) in other current liabilities (57) (144)
Increase in other non current and current financial liabilities 90 112
(322) 44 Cash generated from operations 3,150 2,989
Income taxes paid (net) (249) (341)
Cash flow before exceptional items 2,902 2,648
Exceptional items (63) (63)
Net cash flow from operating activities 2,839 2,585 B Cash flow from investing activities
Purchase of Property,plant and equipment including Capital-work-in-progress and capital advances
(1,092) (883)
Purchase of intangible assets including assets under development (321) (376)
Proceeds from sale of property, plant and equipment 9 56
Payment for acquisition of additional stake in subsidiary (22) -
Payment of contingent consideration (126) (31)
Purchase of equity shares of equity accounted investees (300) (10)
Purchase of investments (423) -
Sundry loans given (14) (134)
Sundry loans repayment received 85 247
Fixed deposit, margin money and dividend accounts (net) (21) (3)
Profit on sale of investment in mutual funds/bonds (7) 12
Interest income 140 123
Net cash flow (used in) investing activities (2,093) (999)
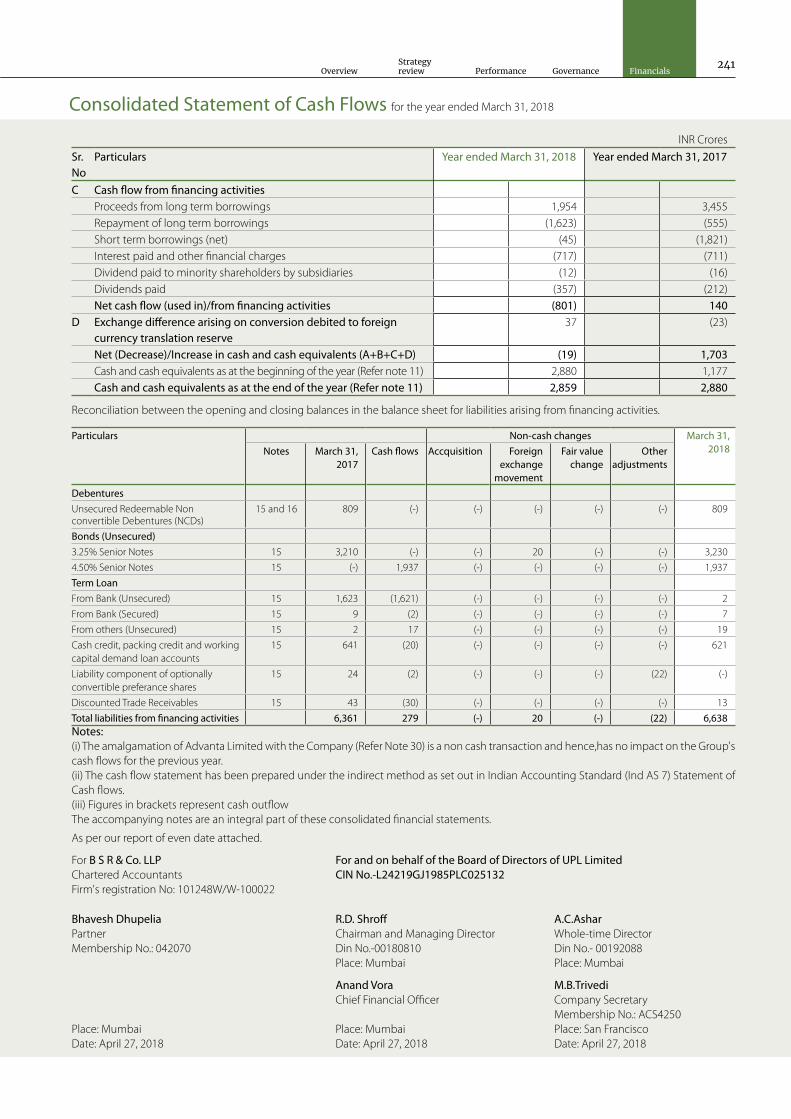
Overview
Strategyreview Performance Governance Financials
241
As per our report of even date attached.
For B S R & Co. LLP For and on behalf of the Board of Directors of UPL Limited Chartered Accountants CIN No.-L24219GJ1985PLC025132Firm's registration No: 101248W/W-100022
Bhavesh Dhupelia R.D. Shroff A.C.AsharPartner Chairman and Managing Director Whole-time DirectorMembership No.: 042070 Din No.-00180810 Din No.- 00192088 Place: Mumbai Place: Mumbai
Anand Vora M.B.Trivedi Chief Financial Officer Company Secretary Membership No.: ACS4250Place: Mumbai Place: Mumbai Place: San FranciscoDate: April 27, 2018 Date: April 27, 2018 Date: April 27, 2018
Consolidated Statement of Cash Flows for the year ended March 31, 2018
INR Crores
Sr. No
Particulars Year ended March 31, 2018 Year ended March 31, 2017
C Cash flow from financing activitiesProceeds from long term borrowings 1,954 3,455 Repayment of long term borrowings (1,623) (555)Short term borrowings (net) (45) (1,821)Interest paid and other financial charges (717) (711)Dividend paid to minority shareholders by subsidiaries (12) (16)Dividends paid (357) (212)Net cash flow (used in)/from financing activities (801) 140
D Exchange difference arising on conversion debited to foreign currency translation reserve
37 (23)
Net (Decrease)/Increase in cash and cash equivalents (A+B+C+D) (19) 1,703 Cash and cash equivalents as at the beginning of the year (Refer note 11) 2,880 1,177 Cash and cash equivalents as at the end of the year (Refer note 11) 2,859 2,880
Reconciliation between the opening and closing balances in the balance sheet for liabilities arising from financing activities.
Particulars Non-cash changes March 31, 2018 Notes March 31,
2017 Cash flows Accquisition Foreign
exchange movement
Fair value change
Other adjustments
DebenturesUnsecured Redeemable Non convertible Debentures (NCDs)
15 and 16 809 (-) (-) (-) (-) (-) 809
Bonds (Unsecured) 3.25% Senior Notes 15 3,210 (-) (-) 20 (-) (-) 3,230
4.50% Senior Notes 15 (-) 1,937 (-) (-) (-) (-) 1,937
Term Loan From Bank (Unsecured) 15 1,623 (1,621) (-) (-) (-) (-) 2
From Bank (Secured) 15 9 (2) (-) (-) (-) (-) 7
From others (Unsecured) 15 2 17 (-) (-) (-) (-) 19
Cash credit, packing credit and working capital demand loan accounts
15 641 (20) (-) (-) (-) (-) 621
Liability component of optionally convertible preferance shares
15 24 (2) (-) (-) (-) (22) (-)
Discounted Trade Receivables 15 43 (30) (-) (-) (-) (-) 13
Total liabilities from financing activities 6,361 279 (-) 20 (-) (22) 6,638 Notes: (i) The amalgamation of Advanta Limited with the Company (Refer Note 30) is a non cash transaction and hence,has no impact on the Group's cash flows for the previous year.(ii) The cash flow statement has been prepared under the indirect method as set out in Indian Accounting Standard (Ind AS 7) Statement of Cash flows.(iii) Figures in brackets represent cash outflowThe accompanying notes are an integral part of these consolidated financial statements.

UPL Limited Annual Report, 2017-18 242
Notes to consolidated financial statements for the year ended March 31, 2018
1. Corporate Information UPL Limited (the Company) is a public Company domiciled in India and is incorporated under the provisions of the Companies Act
applicable in India. Its shares are listed on two recognised stock exchanges in India. The registered office of the Company is located at
3-11, G.I.D.C., Vapi, Dist.- Valsad, Gujarat. The consolidated financial statements comprise the financial statements of UPL Limited ('the
Company' or 'the holding Company' or "the parent") and its subsidiaries (collectively, 'the Group'), its associates and joint ventures as at
and for the year ended 31 March 2018.
The Group is principally engaged in the business of agrochemicals, industrial chemicals, chemical intermediates, speciality chemicals
and production and sale of field crops and vegetable seeds. Information on the Group’s structure is provided in Note 31.
The consolidated financial statements were authorised for issue in accordance with the resolution of the directors on April 27,2018.
2 Accounting Policies 2.1 Basis of Preparation The consolidated financial statements of the Group have been prepared in accordance with Indian Accounting Standards (Ind AS)
notified under the Companies (Indian Accounting Standards) Rules, 2015 notified under Section 133 of the Companies Act, 2013 (''the
Act") as amended thereafter and other relevant provision of the Act.
The consolidated financial statements have been prepared on an accrual basis and under the historical cost convention, except for the
following assets and liabilities which have been measured at fair value:
- Derivative financial instruments,
- Certain financial assets and liabilities measured at fair value (refer accounting policy regarding financial instruments), and
- Contingent consideration.
The consolidated financial statements are presented in Indian Rupees ('INR') or ('H) which is also the Company's functional currency
and all values are rounded to the nearest crores, except when otherwise indicated. Wherever an amount is represented as H'0' (zero),it
construes a value less than rupees fifty lakhs.
Significant accounting estimates, assumptions and judgements The preparation of the Group’s consolidated financial statements requires management to make estimates and assumptions that affect
the reported amounts of revenues, expenses, assets and liabilities, and the accompanying disclosures, and the disclosure of contingent
liabilities.Uncertainty about these assumptions and estimates could result in outcomes that require a material adjustment to the carrying
amount of assets or liabilities affected in future periods.
Estimates and assumptions The key assumptions concerning the future and other key sources of estimation uncertainty at the reporting date, that have a significant
risk of causing a material adjustment to the carrying amounts of assets and liabilities within the next financial year, are described below.
The Group based its assumptions and estimates on parameters available when the consolidated financial statements were prepared.
Existing circumstances and assumptions about future developments, however, may change due to market changes or circumstances
arising that are beyond the control of the Group. Such changes are reflected in the assumptions when they occur.
Taxes There are many transactions and calculations undertaken during the ordinary course of business for which the ultimate tax determination
is uncertain. Where the final tax outcome of these matters is different from the amounts initially recorded, such differences will impact
the current and deferred tax provisions in the period in which the tax determination is made. Deferred tax assets are recognised for
unused tax losses to the extent that it is probable that taxable profit will be available against which the losses can be utilised. Significant
management judgement is required to determine the amount of deferred tax assets that can be recognised, based upon the likely
timing and the level of future taxable profits together with future tax planning strategies.
Defined benefit plan (gratuity benefits) A liability in respect of defined benefit plans is recognised in the balance sheet, and is measured as the present value of the defined
benefit obligation at the reporting date less the fair value of the plan assets. The present value of the defined benefit obligation is based
on expected future payments at the reporting date, calculated annually by independent actuaries. Consideration is given to expected
future salary levels, experience of employee departures and periods of service. Refer note 35 for details of the key assumptions used in
determining the accounting for these plans.

Overview
Strategyreview Performance Governance Financials
243
Notes to consolidated financial statements for the year ended March 31, 2018
Fair value measurement of financial instruments When the fair values of financial assets and financial liabilities recorded in the balance sheet cannot be measured based on quoted prices
in active markets, their fair value is measured using valuation techniques including the DCF model. The inputs to these models are taken
from observable markets where possible, but where this is not feasible, a degree of judgement is required in establishing fair values.
Judgements include considerations of inputs such as liquidity risk, credit risk and volatility. Changes in assumptions about these factors
could affect the reported fair value of financial instruments. See Note 45 and 46 for further disclosures.
Provision against obsolete and slow-moving inventories The Group reviews the condition of its inventories and makes provision against obsolete and slow-moving inventory items which are
identified as no longer suitable for sale or use. Group estimates the net realisable value for such inventories based primarily on the latest
invoice prices and current market conditions. The Group carries out an inventory review at each balance sheet date and makes provision
against obsolete and slow-moving items. The Group reassesses the estimation on each balance sheet date.
Impairment of financial assets The Group assesses impairment based on expected credit losses (ECL) model on trade receivables.
The Group uses a provision matrix to determine impairment loss allowance on the portfolio of trade receivables. The provision matrix
is based on its histroically observed default rates over the expected life of the trade receivable and is adjusted for forward looking
estimates. At every reporting date, the historical observed default rates are updated and changes in the forward-looking estimates are
analysed.
Impairment of non-financial assets Impairment exists when the carrying value of an asset or cash generating unit exceeds its recoverable amount, which is the higher of its
fair value less costs of disposal and its value in use. The fair value less costs of disposal calculation is based on available data from binding
sales transactions, conducted at arm’s length, for similar assets or observable market prices less incremental costs for disposing of the
asset. The value in use calculation is based on a DCF model. The cash flows are derived from the budget for the next five years and do
not include restructuring activities that the Group is not yet committed to or significant future investments that will enhance the asset’s
performance of the CGU being tested. The recoverable amount is sensitive to the discount rate used for the DCF model as well as the
expected future cash-inflows and the growth rate used for extrapolation purposes. These estimates are most relevant to goodwill and
other intangibles with indefinite useful lives recognised by the Group.
2.2 Basis of consolidation The consolidated financial statements comprise the financial statements of the Company and its subsidiaries, associates and joint
venture as at 31 March 2018. Control is achieved when the Group is exposed, or has rights, to variable returns from its involvement with
the investee and has the ability to affect those returns through its power over the investee.
Subsidiaries are entities controlled by the Group. Consolidation of a subsidiary begins when the Group obtains control over the subsidiary
and ceases when the Group loses control of the subsidiary. Assets, liabilities, income and expenses of a subsidiary acquired or disposed
off during the year are included in the consolidated financial statements from the date the Group gains control and until the date the
Group ceases to control the subsidiary.
Consolidated financial statements are prepared using uniform accounting policies for like transactions and other events in similar
circumstances. If a member of the group uses accounting policies other than those adopted in the consolidated financial statements for
like transactions and events in similar circumstances, appropriate adjustments are made to that group member’s financial statements in
preparing the consolidated financial statements to ensure conformity with the group’s accounting policies.
The financial statements of each of the subsidiaries, associates and joint ventures, other than Polycoat Technologies 2010 Limited, Sinagro
Produtos Agropecuarios SA. Group, 3SB Produtos Agricolas SA and Serra Bonita Sementes SA used for the purpose of consolidation are
drawn up to same reporting date as that of the Company, i.e., year ended on 31 March. The audited consolidated financial statements
of Sinagro Produtos Agropecuarios SA. Group, audited financial statements of 3SB Produtos Agricolas SA,Serra Bonita Sementes SA and
Polycoat Tecnologies 2010 Limited for the year ended 31st December 2017 have been considered for the purpose of consolidation after
making necessary adjustments for the effects of significant transactions or events, if any that occur till the reporting date of the group
i.e. March 31.
Consolidation procedure: (a) Combine like items of assets, liabilities, equity, income, expenses and cash flows of the parent with those of its subsidiaries. For
this purpose, income and expenses of the subsidiary are based on the amounts of the assets and liabilities recognised in the
consolidated financial statements at the acquisition date.

UPL Limited Annual Report, 2017-18 244
(b) Offset (eliminate) the carrying amount of the parent’s investment in each subsidiary and the parent’s portion of equity of each
subsidiary. The Business combinations policy explains how the group accounts for any related goodwill.
(c) Eliminate in full intragroup assets and liabilities, equity, income, expenses and cash flows relating to transactions between entities
of the group (profits or losses resulting from intragroup transactions that are recognised in assets, such as inventory and fixed
assets, are eliminated in full). Intragroup losses may indicate an impairment that requires recognition in the consolidated financial
statements. Ind AS12 Income Taxes applies to temporary differences that arise from the elimination of profits and losses resulting
from intragroup transactions.
Profit or loss and each component of other comprehensive income (OCI) are attributed to the equity holders of the parent of the
Group and to the non-controlling interests, even if this results in the non-controlling interests having a deficit balance. When necessary,
adjustments are made to the financial statements of subsidiaries to bring their accounting policies into line with the Group’s accounting
policies. All intra-group assets and liabilities, equity, income, expenses and cash flows relating to transactions between members of the
Group are eliminated in full on consolidation.
When the Group loses control over a subsidiary, it derecognises the assets and liabilities of the subsidiary, and any realted non controlling
interest and other components of equity. Any interest retained in the form of subsidiary is measured at fair value at the date the control
is lost. Any resulting gain or loss is recognised in the statement of profit and loss.
2.3 Summary of significant accounting policies a Business combinations and goodwill
Business combinations are accounted for using the acquisition method. The cost of an acquisition is measured as the aggregate of the
consideration transferred measured at acquisition date fair value and the amount of any non-controlling interests in the acquiree. For
each business combination, the Group elects whether to measure the non-controlling interests in the acquiree at fair value or at the
proportionate share of the acquiree’s identifiable net assets. Acquisition-related costs are expensed as incurred.
At the acquisition date, the identifiable assets acquired and the liabilities assumed are recognised at their acquisition date fair values.
The consideration transferred does not include amount related to the settlement of pre-existing relationships with the acquiree. Such
amounts are generally recognised in the statement of profit and loss.
Any contingent consideration to be transferred by the acquirer is recognised at fair value at the acquisition date. Contingent consideration
classified as an asset or liability that is a financial instrument and within the scope of Ind AS 109 Financial Instruments, is measured at fair
value with changes in fair value recognised in statement of profit and loss. If the contingent consideration is not within the scope of Ind
AS 109, it is measured in accordance with the appropriate Ind AS. Contingent consideration that is classified as equity is not re-measured
at subsequent reporting dates and any difference subsequent its settlement is accounted for within equity.
Goodwill is initially measured at cost, being the excess of the aggregate of the consideration transferred and the amount recognised for
non-controlling interests, and any previous interest held, over the fair value of identifiable assets acquired net of fair value of liabilities
assumed. Any gain on a bargain purchase is recognised in OCI and accumulated in equity as capital reserve if there exists clear evidence,
of the underlying reasons for classifying the business combination as resulting in a bargain purchase; otherwise the gain is recognised
directly in equity as capital reserve.
After initial recognition, goodwill is measured at cost less any accumulated impairment losses. For the purpose of impairment testing,
goodwill acquired in a business combination is, from the acquisition date, allocated to each of the Group’s cash-generating units that are
expected to benefit from the combination, irrespective of whether other assets or liabilities of the acquiree are assigned to those units.
A cash generating unit to which goodwill has been allocated is tested for impairment annually, or more frequently when there is an
indication that the unit may be impaired. If the recoverable amount of the cash generating unit is less than its carrying amount, the
impairment loss is allocated first to reduce the carrying amount of any goodwill allocated to the unit and then to the other assets of
the unit pro rata based on the carrying amount of each asset in the unit. Any impairment loss for goodwill is recognised in statement of
profit and loss. An impairment loss recognised for goodwill is not reversed in subsequent periods.
Where goodwill has been allocated to a cash-generating unit and part of the operation within that unit is disposed of, the goodwill
associated with the disposed operation is included in the carrying amount of the operation when determining the gain or loss on
disposal. Goodwill disposed in these circumstances is measured based on the relative values of the disposed operation and the portion
of the cash-generating unit retained.
Notes to consolidated financial statements for the year ended March 31, 2018

Overview
Strategyreview Performance Governance Financials
245
b. Investment in associates and joint ventures The group's interest in equity in investees comprise interests in associates and joint ventures.
An associate is an entity in which the group has significant influence, but not control or joint control, over the financial and operating
policies. A joint venture is an arrangement in which the group has joint control and has right to the net assets of the arrangement, rather
than the right to its assets and obligations for its liabilities.
Interests in associates and joint ventures are accounted for using the equity method. They are initially recognised at cost which includes
transaction costs. Subsequent to intial recognition the consolidated financial statements include the groups share of profit and loss and
OCI of equity accounted investee until the date on which significant influence or joint control ceases.
c. Current versus non-current classification The Group presents assets and liabilities in the balance sheet based on current/ non-current classification. An asset is treated as current
when it is:
- Expected to be realised or intended to be sold or consumed in normal operating cycle
- Held primarily for the purpose of trading
- Cash or cash equivalent unless restricted from being exchanged or used to settle a liability for at least twelve months after the
reporting period
All other assets are classified as non-current.
A liability is current when:
- It is expected to be settled in normal operating cycle
- It is held primarily for the purpose of trading
- There is no unconditional right to defer the settlement of the liability for at least twelve months after the reporting period
The Group classifies all other liabilities as non-current.
Deferred tax assets and liabilities are classified as non-current.
Based on the nature of products and the time between acquisition of assets for processing and their realisation in cash and cash
equivalents, the Group has identified twelve months as its operating cycle for the purpose of current / non current classification of assets
and liabilities.
d. Revenue recognition Revenue is recognised to the extent that it is probable that the economic benefits will flow to the Group and the revenue can be
reliably measured, regardless of when the payment is being made. Revenue is measured at the fair value of the consideration received
or receivable, taking into account contractually defined terms of payment and excluding taxes or duties collected on behalf of the
government.
Revenue is stated inclusive of excise duty and excludes sales tax/value added tax (VAT)/Goods and Services Tax (GST).
The specific recognition criteria described below must also be met before revenue is recognised.
Sale of goods Revenue from the sale of goods is recognised when the significant risks and rewards of ownership of the goods have passed to the
buyer, usually on delivery of the goods. Revenue from the sale of goods is measured at the fair value of the consideration received or
receivable, net of returns and allowances, trade discounts, cash discounts and volume rebates.
Sale of services Income from services are recognized as and when the services are rendered.
Royalty Income Income for Royalty is recognised on accrual basis in accordance with the substance of relevant agreement. Royalties accrue in accordance
with the terms of relevant agreement and are recognised on that basis, unless having regard to the substance of the agreement, it is
more appropriate to recognise revenue on some other systematic and rational basis.
Notes to consolidated financial statements for the year ended March 31, 2018

UPL Limited Annual Report, 2017-18 246
Export Incentive Duty free imports of raw materials under Advance License for Imports as per the Export and Import Policy are matched with the exports
made against the said licenses and the benefit / obligation is accounted by making suitable adjustments in raw material consumption.
The benefit accrued under the Duty Drawback scheme and other schemes as per the Export and Import Policy in respect of exports
made under the said Schemes is included under the head “Revenue from Operations” as ‘Export Incentive’.
Interest income For all debt instruments measured either at amortised cost or at fair value through other comprehensive income, interest income is
recorded using the effective interest rate (EIR). EIR is the rate that exactly discounts the estimated future cash payments or receipts over
the expected life of the financial instrument or a shorter period, where appropriate, to the gross carrying amount of the financial asset or
to the amortised cost of a financial liability. When calculating the effective interest rate, the Group estimates the expected cash flows by
considering all the contractual terms of the financial instrument (for example, prepayment, extension, call and similar options) but does
not consider the expected credit losses. Interest income is included in finance income in the statement of profit and loss.
Dividends Divident income is recognised when the Group’s right to receive the payment is established, which is generally when shareholders
approve the dividend.
e. Non-current assets held for sale The Group classifies non-current assets as held for sale if their carrying amounts will be recovered principally through a sale rather than
through continuing use. Actions required to complete the sale should indicate that it is unlikely that significant changes to the sale will
be made or that the decision to sell will be withdrawn. Management must be committed to the sale expected within one year from the
date of classification.
For these purposes, sale transactions include exchanges of non-current assets for other non-current assets when the exchange has
commercial substance. The criteria for held for sale is regarded met only when the assets are available for immediate sale in its present
condition, subject only to terms that are usual and customary for sales of such assets, its sale is highly probable; and it will genuinely be
sold, not abandoned. The Group treats sale of the asset or disposal of Company to be highly probable when:
- The appropriate level of management is committed to a plan to sell the asset,
- An active programme to locate a buyer and complete the plan has been initiated (if applicable),
- The asset is being actively marketed for sale at a price that is reasonable in relation to its current fair value,
- The sale is expected to qualify for recognition as a completed sale within one year from the date of classification, and
- Actions required to complete the plan indicate that it is unlikely that significant changes to the plan will be made or that the plan
will be withdrawn.
Non-current assets held for sale to owners are measured at the lower of their carrying amount and the fair value less costs to sell. Assets
and liabilities classified as held for sale are presented separately in the balance sheet.
Property, plant and equipment and intangible assets once classified as held for sale are not depreciated or amortised.
f. Property, plant and equipment Items of Property, plant and equipment including capital work-in-progress are stated at cost, net of accumulated depreciation and
accumulated impairment losses, if any. Cost comprisess the purchase price and any attributable cost of bringing the asset to its working
condition for its intended use. Such cost includes the cost of replacing part of the plant and equipment and borrowing costs for long-
term construction projects if the recognition criteria are met. Subsequent expenditure related to an item of fixed asset is added to its
book value only if it increases the future benefits from the existing asset beyond its previously assessed standard of performance. When
significant parts of plant and equipment are required to be replaced at intervals, the Group depreciates them separately based on their
specific useful lives. All other repair and maintenance costs are recognised in statement of profit and loss as incurred. In respect of
additions to /deletions from the property, plant and equipment, depreciation is provided on pro-rata basis with reference to the month
of addition/deletion of the Assets.
Depreciation: (i) Leasehold Land: UPL Limited No depreciation is provided for leasehold land since as per the lease agreements, the leases are renewable at the option of the
Notes to consolidated financial statements for the year ended March 31, 2018

Overview
Strategyreview Performance Governance Financials
247
Company for a further periods of 99 years at the end of the lease periods of 99 years, without /with marginal payment of further
premium.
United Phosphorus Vietnam Limited: Lease Rentals and other costs incurred in conjunction with securing the land use rights of leased land are recognised on a straight
line basis over 37 years in accordance with the term of the lease.
(ii) Other Assets: The Group depreciates on a straight line method based on following estimated useful life of assets.
Sr.No.
Description of Assets Useful life of Assets
1. Aircraft 8 Years
2. Building 18 - 60 Years
3. Furniture, Fixtures & Equipments 3 - 15 Years
4. Improvements-Leasehold 6 - 10 Years
5. Laboratory Equipments 10 Years
6. Land-Leasehold 50 years or term of lease if shorter
7. Office Equipment 3 - 33 Years
8. Plant and Equipment 3 - 25 Years
9. Vehicles 3 - 15 years
The residual values, useful lives and methods of depreciation of property, plant and equipment are reviewed at each financial year end
and adjusted prospectively, if appropriate.
g. Intangible assets i) Goodwill - Goodwill is initially measured at cost, being the excess of the aggregate fair value of the consideration transferred over the net
of fair value of identifiable assets acquired and liabilities assumed. (Refer 2.3(a) - Accounting policy for Business Combination
and Goodwill)
- Subsequent measurement is at cost less accumulated impairment losses.
- Goodwill is not amortised and is tested for impairment annually.
ii) Other intangible assets
Intangible assets acquired separately are measured on initial recognition at cost. The cost of intangible assets acquired in a business
combination is their fair value at the date of acquisition. Following initial recognition, intangible assets with finite life are carried at
cost less any accumulated amortisation and accumulated impairment losses. Internally generated intangibles, excluding capitalised
development costs, are not capitalised and the related expenditure is reflected in statement of profit and loss in the period in which
the expenditure is incurred.
The amortisation period and the amortisation method for an intangible asset with a finite useful life is reviewed at least at the end
of each reporting period. Gains or losses arising from derecognition of an intangible asset are measured as the difference between
the net disposal proceeds and the carrying amount of the asset and are recognised in the statement of profit and loss when the
asset is derecognised.
Research costs are expensed as incurred. Development expenditures on an individual project are recognised as an intangible asset
when the Group can demonstrate the technical feasibility of completing the intangible asset so that the asset will be available for
use or sale.
Following initial recognition of the development expenditure as an asset, the asset is carried at cost less any accumulated
amortisation and accumulated impairment losses. Amortisation of the asset begins when development is complete and the asset
is available for use. It is amortised over the period of expected future benefit. Amortisation expense is recognised in the statement
of profit and loss unless such expenditure forms part of carrying value of another asset.
Notes to consolidated financial statements for the year ended March 31, 2018

UPL Limited Annual Report, 2017-18 248
A summary of the policies applied to the Group’s intangible assets is as follows
Intangible Assets Useful Life Amortisation method
Product Acquisitions Fifteen years Amortised on straight-line basis from the month of additions to match their future economic benefits
Germ plasm Ten to fifteen years Amortised on straight-line basis
Other Intangible assets Three to Five years Amortised on straight-line basis
h. Borrowing costs Borrowing costs directly attributable to the acquisition, construction or production of an asset that necessarily takes a substantial period
of time to get ready for its intended use or sale are capitalised as part of the cost of the asset. All other borrowing costs are expensed
in the period in which they occur. Borrowing costs consist of interest and other costs that an entity incurs in connection with the
borrowing of funds. Borrowing cost also includes exchange differences to the extent regarded as an adjustment to the borrowing costs.
i. Foreign currencies
The Group's consolidated financial statements are presented in Indian Rupee (INR), which is also the Group’s functional currency. For
each entity the Group determines the functional currency and items included in the financial statements of each entity are measured
using that functional currency.
Transactions and balances Transactions in foreign currencies are initially recorded by the Group's entities at their respective functional currency spot rates at the
date the transaction first qualifies for recognition.
Monetary assets and liabilities denominated in foreign currencies are translated at the functional currency spot rates of exchange at the
reporting date.
Transactions in foreign currency are recorded applying the exchange rate at the date of transaction. Monetary assets and liabilities
denominated in foreign currency remaining unsettled at the end of the year, are translated at the closing rates prevailing on the Balance
Sheet date. Non-monetary items which are carried in terms of historical cost denominated in foreign currency are reported using the
exchange rate at the date of transaction. Exchange differences arising as a result of the above are recognized as income or expenses
in the statement of profit and loss except for exchange differences arising on a monetary item which, in substance, forms part of the
Group's net investment in a foreign operation which is accumulated in a Foreign Currency Translation Reserve until the disposal of
the net investment. Exchange difference arising on the settlement of monetary items at rates different from those at which they were
initially recorded during the year, or reported in previous financial statements, are recognised as income or expenses in the year in which
they arise.
Exchange difference on such contracts are recognized in the statements of profit and loss in the year in which the exchange rate
changes. Any profit and loss arising on cancellation or renewal of forward exchange contract is recognized as income or as expenses for
the year.
Foreign exchange differences on foreign currency borrowings, loans given/taken, settlement gain/loss and fair value gain/losses on
derivative contracts relating to borrowings are accounted and disclosed under 'finance cost'.
Non-monetary items that are measured in terms of historical cost in a foreign currency are translated using the exchange rates at the
dates of the initial transactions. Non-monetary items measured at fair value in a foreign currency are translated using the exchange rates
at the date when the fair value is determined. The gain or loss arising on translation of non-monetary items measured at fair value is
treated in line with the recognition of the gain or loss on the change in fair value of the item (i.e., translation differences on items whose
fair value gain or loss is recognised in OCI or statement of profit and loss are also recognised in OCI or statement of profit and loss,
respectively)
Translation of financial statements of foreign entities On consolidation, the assets and liabilities of foreign operations are translated into INR at the rate of exchange prevailing at the reporting
date and their statements of profit and loss are translated at exchange rates prevailing at the dates of the transactions. For practical
reasons, the group uses a monthly average rate to translate income and expense items, if the average rate approximates the exchange
rates at the dates of the transactions. The exchange differences arising on translation for consolidation are recognised in OCI. On disposal
of a foreign operation, the component of OCI relating to that particular foreign operation is reclassified to the statement of profit and
loss.
Notes to consolidated financial statements for the year ended March 31, 2018

Overview
Strategyreview Performance Governance Financials
249
Any goodwill arising in the acquisition/ business combination of a foreign operation and any fair value adjustments to the carrying
amounts of assets and liabilities arising on the acquisition are treated as assets and liabilities of the foreign operation and translated at
the spot rate of exchange at the reporting date.
j. Fair value measurement The Group measures financial instruments, such as, derivatives at fair value at each balance sheet date on a portfolio basis.
Fair value is the price that would be received to sell an asset or paid to transfer a liability in an orderly transaction between market
participants at the measurement date. The fair value measurement is based on the presumption that the transaction to sell the asset or
transfer the liability takes place either:
- In the principal market for the asset or liability, or
- In the absence of a principal market, in the most advantageous market for the asset or liability
The principal or the most advantageous market must be accessible by the Group.
The fair value of an asset or a liability is measured using the assumptions that market participants would use when pricing the asset or
liability, assuming that market participants act in their economic best interest.
A fair value measurement of a non-financial asset takes into account a market participant’s ability to generate economic benefits by
using the asset in its highest and best use or by selling it to another market participant that would use the asset in its highest and best
use.
The Group uses valuation techniques that are appropriate in the circumstances and for which sufficient data are available to measure fair
value, maximising the use of relevant observable inputs and minimising the use of unobservable inputs.
All assets and liabilities for which fair value is measured or disclosed in the financial statements are categorised within the fair value
hierarchy, described as follows, based on the lowest level input that is significant to the fair value measurement as a whole:
- Level 1 – Quoted (unadjusted) market prices in active markets for identical assets or liabilities
- Level 2 – Valuation techniques for which the lowest level input that is significant to the fair value measurement is directly or
indirectly observable
- Level 3 – Valuation techniques for which the lowest level input that is significant to the fair value measurement is unobservable
For assets and liabilities that are recognised in the financial statements on a recurring basis, the Group determines whether transfers
have occurred between levels in the hierarchy by re-assessing categorisation (based on the lowest level input that is significant to the
fair value measurement as a whole) at the end of each reporting period.
This note summarises accounting policy for fair value. Other fair value related disclosures are given in the relevant notes.
- Contingent consideration (note 42)
- Quantitative disclosures of fair value measurement hierarchy (note 46)
- Financial instruments (including those carried at amortised cost) (note 5, 6, 7, 10, 11, 11A, 15, 16, 19, 44, 45, 46, 47)
k. Leases The determination of whether an arrangement is (or contains) a lease is based on the substance of the arrangement at the inception of
the lease. The arrangement is, or contains, a lease if fulfilment of the arrangement is dependent on the use of a specific asset or assets
and the arrangement conveys a right to use the asset or assets, even if that right is not explicitly specified in an arrangement.
For arrangements entered into prior to 1 April 2015, the Group has determined whether the arrangement contain lease on the basis of
facts and circumstances existing on the date of transition.
Group as a lessee A lease is classified at the inception date as a finance lease or an operating lease. A lease that transfers substantially all the risks and
rewards incidental to ownership to the Group is classified as a finance lease.
Finance leases are capitalised at the commencement of the lease at the inception date fair value of the leased property or, if lower, at the
present value of the minimum lease payments. Lease payments are apportioned between finance charges and reduction of the lease
liability so as to achieve a constant rate of interest on the remaining balance of the liability. Finance charges are recognised in finance
costs in the statement of profit and loss, unless they are directly attributable to qualifying assets, in which case they are capitalized in
Notes to consolidated financial statements for the year ended March 31, 2018

UPL Limited Annual Report, 2017-18 250
accordance with the Group’s general policy on the borrowing costs (See note 2.1). Contingent rentals are recognised as expenses in the
periods in which they are incurred.
A leased asset is depreciated over the useful life of the asset. However, if there is no reasonable certainty that the Group will obtain
ownership by the end of the lease term, the asset is depreciated over the shorter of the estimated useful life of the asset and the lease
term.
Operating lease payments are recognised as an expense in the statement of profit and loss on a straight-line basis over the lease term.
Group as a lessor Leases in which the Group does not transfer substantially all the risks and rewards of ownership of an asset are classified as operating
leases. Rental income from operating lease is recognised on a straight-line basis over the term of the relevant lease. Initial direct costs
incurred in negotiating and arranging an operating lease are added to the carrying amount of the leased asset and recognised over the
lease term on the same basis as rental income. Contingent rents are recognised as revenue in the period in which they are earned.
Leases are classified as finance leases when substantially all of the risks and rewards of ownership transfer from the Group to the lessee.
Amounts due from lessees under finance leases are recorded as receivables at the Group’s net investment in the leases. Finance lease
income is allocated to accounting periods so as to reflect a constant periodic rate of return on the net investment outstanding in respect
of the lease.
l. Inventories (i) Stocks of stores and spares, packing materials and raw materials are valued at lower of cost or net realisable value. Cost is determined
on moving weighted average basis. The aforesaid items are valued below cost if the finished products in which they are to be
incorporated are expected to be sold at a loss.
(ii) Semi-finished products, finished products and by-products are valued at lower of cost or net realisable value and for this purpose,
cost is determined on standard cost basis which approximates the actual cost. Cost of finished goods includes excise duty, as
applicable. Variances, exclusive of abnormally low volume and operating performance, are capitalized into inventory.
(iii) Traded goods are valued at lower of cost and net realizable value. Cost includes cost of purchase and other costs incurred in
bringing the inventories to their present location and condition. Cost is determined on a weighted average basis.
Net realisable value is the estimated selling price in the ordinary course of business, less estimated costs of completion and the estimated
costs necessary to make the sale.
m. Impairment of non-financial assets The Group assesses, at each reporting date, whether there is an indication that an asset may be impaired. If any indication exists, or
when annual impairment testing for an asset is required, the Group estimates the asset’s recoverable amount. An asset’s recoverable
amount is the higher of an asset’s or cash-generating unit’s (CGU) fair value less costs of disposal and its value in use. Recoverable
amount is determined for an individual asset, unless the asset does not generate cash inflows that are largely independent of those from
other assets or groups of assets. When the carrying amount of an asset or CGU exceeds its recoverable amount, the asset is considered
impaired and is written down to its recoverable amount.
In assessing value in use, the estimated future cash flows are discounted to their present value using a pre-tax discount rate that reflects
current market assessments of the time value of money and the risks specific to the asset. In determining fair value less costs of disposal,
recent market transactions are taken into account. If no such transactions can be identified, an appropriate valuation model is used.
These calculations are corroborated by valuation multiples, quoted share prices for publicly traded companies or other available fair
value indicators.
The Group bases its impairment calculation on detailed budgets and forecast calculations, which are prepared separately for each of the
Company’s CGUs to which the individual assets are allocated. These budgets and forecast calculations generally cover a period of five
years. For longer periods, a long-term growth rate is calculated and applied to project future cash flows after the fifth year. To estimate
cash flow projections beyond periods covered by the most recent budgets/forecasts, the Group extrapolates cash flow projections in
the budget using a steady or declining growth rate for subsequent years, unless an increasing rate can be justified. In any case, this
growth rate does not exceed the long-term average growth rate for the products, industries, or country or countries in which the entity
operates, or for the market in which the asset is used.
For assets excluding goodwill, an assessment is made at each reporting date to determine whether there is an indication that previously
recognised impairment losses no longer exist or have decreased. If such indication exists, the Group estimates the asset’s or CGU’s
recoverable amount. A previously recognised impairment loss is reversed only if there has been a change in the assumptions used to
Notes to consolidated financial statements for the year ended March 31, 2018

Overview
Strategyreview Performance Governance Financials
251
determine the asset’s recoverable amount since the last impairment loss was recognised. The reversal is limited so that the carrying
amount of the asset does not exceed its recoverable amount, nor exceed the carrying amount that would have been determined, net of
depreciation, had no impairment loss been recognised for the asset in prior years. Such reversal is recognised in the statement of profit
and loss.
Goodwill is tested for impairment annually as at 31 March and when circumstances indicate that the carrying value may be impaired.
Impairment is determined for goodwill by assessing the recoverable amount of each CGU (or group of CGUs) to which the goodwill
relates. When the recoverable amount of the CGU is less than its carrying amount, an impairment loss is recognised. Impairment losses
relating to goodwill are not reversed in future periods.
Intangible assets with indefinite useful lives are tested for impairment annually as at 31 March at the CGU level, as appropriate, and when
circumstances indicate that the carrying value may be impaired.
n. Provisions General
Provisions are recognised when the Group has a present obligation (legal or constructive) as a result of a past event, it is probable that
an outflow of resources embodying economic benefits will be required to settle the obligation and a reliable estimate can be made of
the amount of the obligation. When the Group expects some or all of a provision to be reimbursed, for example, under an insurance
contract, the reimbursement is recognised as a separate asset, but only when the reimbursement is virtually certain. The expense relating
to a provision is presented in the statement of profit and loss net of any reimbursement.
If the effect of the time value of money is material, provisions are discounted using a current pre-tax rate that reflects, when appropriate,
the risks specific to the liability. When discounting is used, the increase in the provision due to the passage of time is recognised as a
finance cost. Provisions are reviewed at each balance sheet and adjusted to reflect the current best estimates.
Contingent liabilities recognised in a business combination A contingent liability recognised in a business combination is initially measured at its fair value. Subsequently, it is measured at the higher
of the amount that would be recognised in accordance with the requirements for provisions above or the amount initially recognised
less, when appropriate, cumulative amortisation recognised in accordance with the requirements for revenue recognition.
o. Taxes Current income tax Current income tax assets and liabilities are measured at the amount expected to be recovered from or paid to the taxation authorities.
The tax rates and tax laws used to compute the amount are those that are enacted or substantively enacted, at the reporting date in the
countries where the Group operates and generates taxable income.
Current income tax relating to items recognised outside statement of profit and loss is recognised outside profit or loss (either in other
comprehensive income or in equity). Management periodically evaluates positions taken in the tax returns with respect to situations in
which applicable tax regulations are subject to interpretation and establishes provisions where appropriate.
Deferred tax Deferred tax is provided using the liability method on temporary differences between the tax bases of assets and liabilities and their
carrying amounts for financial reporting purposes at the reporting date.
Deferred tax liabilities are recognised for all taxable temporary differences, except:
- When the deferred tax liability arises from the initial recognition of goodwill or an asset or liability in a transaction that is not a
business combination and, at the time of the transaction, affects neither the accounting profit nor taxable profit or loss
- In respect of taxable temporary differences associated with investments in subsidiaries and interests in joint ventures, when the
timing of the reversal of the temporary differences can be controlled and it is probable that the temporary differences will not
reverse in the foreseeable future
Deferred tax assets are recognised for all deductible temporary differences, the carry forward of unused tax credits and any unused tax
losses. Deferred tax assets are recognised to the extent that it is reasonably certain that taxable profit will be available against which the
deductible temporary differences, and the carry forward of unused tax credits and unused tax losses can be utilised, except:
- When the deferred tax asset relating to the deductible temporary difference arises from the initial recognition of an asset or liability
in a transaction that is not a business combination and, at the time of the transaction, affects neither the accounting profit nor
taxable profit or loss
Notes to consolidated financial statements for the year ended March 31, 2018

UPL Limited Annual Report, 2017-18 252
- In respect of deductible temporary differences associated with investments in subsidiaries and interests in joint ventures, deferred
tax assets are recognised only to the extent that it is probable that the temporary differences will reverse in the foreseeable future
and taxable profit will be available against which the temporary differences can be utilised
The carrying amount of deferred tax assets is reviewed at each reporting date and reduced to the extent that it is no longer probable that
sufficient taxable profit will be available to allow all or part of the deferred tax asset to be utilised. Unrecognised deferred tax assets are
re-assessed at each reporting date and are recognised to the extent that it has become reasonable certainty that future taxable profits
will allow the deferred tax asset to be recovered.
Deferred tax assets and liabilities are measured at the tax rates that are expected to apply in the year when the asset is realised or the
liability is settled, based on tax rates (and tax laws) that have been enacted or substantively enacted at the reporting date.
Deferred tax relating to items recognised outside profit and loss is recognised outside the statement of profit and loss (either in other
comprehensive income or in equity). Deferred tax items are recognised in correlation to the underlying transaction either in OCI or
directly in equity.
Deferred tax assets and deferred tax liabilities are offset if a legally enforceable right exists to set off current tax assets against current tax
liabilities and the deferred taxes relate to the same taxable entity and the same taxation authority.
Tax benefits acquired as part of a business combination, but not satisfying the criteria for separate recognition at that date, are
recognised subsequently if new information about facts and circumstances change. Acquired deferred tax benefits recognised within
the measurement period reduce goodwill related to that acquisition if they result from new information obtained about facts and
circumstances existing at the acquisition date. If the carrying amount of goodwill is zero, any remaining deferred tax benefits are
recognised in OCI/ capital reserve depending on the principle explained for bargain purchase gains. All other acquired tax benefits
realised are recognised in statement of profit and loss.
Minimum Alternate Tax (MAT) Minimum Alternate Tax (MAT) is in the nature of unused tax credit which can be carried forward and utilised when the Group will pay
normal income tax during the specified period. Deferred tax assets on such tax credit is recognised to the extent that it is probable that the unused tax credit can be utilised in the specified future period.
p. Retirement and other employee benefits1 UPL Limited and SWAL Corporation Limited i) Provident Fund is a defined contribution scheme established under a State Plan. The contributions to the scheme are charged to
the statement of profit and loss in the year when employee rendered related services.
ii) Superannuation Fund is a defined contribution scheme and contributions to the scheme are charged to the statement of profit
and loss in the year when the contributions are due. The scheme is funded with an insurance company in the form of a qualifying
insurance policy.
iii) The companies have a defined benefit gratuity plan. Every employee who has completed five years or more of service gets a
gratuity on post employment at 15 days salary (last drawn salary) for each completed year of service as per the rules of the company.
The aforesaid liability is provided for on the basis of an actuarial valuation made on projected unit credit method at the end of the
financial year. The scheme is funded with an insurance company in the form of a qualifying insurance policy.
iv) The Group has other long term employee benefits in the nature of leave encashment. The liability in respect of leave encashment is
provided for on the basis of actuarial valuation made on projected unit credit method at the end of the financial year. The aforesaid
leave encashment is funded with an insurance company in the form of a qualifying insurance policy.
v) Remeasurements, comprising of actuarial gains and losses, the effect of the asset ceiling, excluding amounts included in net interest on the net defined benefit liability and the return on plan assets (excluding amounts included in net interest on the net defined benefit liability), are recognised immediately in the balance sheet with a corresponding debit or credit to retained earnings through OCI in the period in which they occur. Remeasurements are not reclassified to statement of profit and loss in subsequent periods.
2 All Other subsidiaries: The Companies contribute to a defined contribution plan which are charged to the statement of profit and loss as incurred.
q. Share-based payments Measurement and disclosure of the employee share based payment plans is done in accordance with Ind AS 102, "Share based
payments". The Group measures compensation cost relating to employee stock options using the fair value method. Compensation
expense is amortised over the vesting period of the option on a straight line basis.
Notes to consolidated financial statements for the year ended March 31, 2018

Overview
Strategyreview Performance Governance Financials
253
r. Financial instruments A financial instrument is any contract that gives rise to a financial asset of one entity and a financial liability or equity instrument of
another entity.
Financial assets Initial recognition and measurement All financial assets are recognised initially at cost and then measured at fair value at each reporting date, in the case of financial assets
not recorded at fair value through profit or loss, transaction costs that are attributable to the acquisition of the financial asset.
Debt instruments at amortised cost A ‘debt instrument’ is measured at the amortised cost if both the following conditions are met:
a) The asset is held within a business model whose objective is to hold assets for collecting contractual cash flows, and
b) Contractual terms of the asset give rise on specified dates to cash flows that are solely payments of principal and interest (SPPI) on
the principal amount outstanding.
After initial measurement, such financial assets are subsequently measured at amortised cost using the effective interest rate (EIR) method. Amortised cost is calculated by taking into account any discount or premium on acquisition and fees or costs that are an integral part of the EIR. The EIR amortisation is included in finance income in the statement of profit and loss. The losses arising from impairment are recognised in the statement of profit and loss.
Debt instrument at FVTOCI A ‘debt instrument’ is classified as at the FVTOCI if both of the following criteria are met:
a) The objective of the business model is achieved both by collecting contractual cash flows and selling the financial assets, and
b) The asset’s contractual cash flows represent SPPI.
Debt instruments included within the FVTOCI category are measured initially as well as at each reporting date at fair value. Fair value movements are recognized in the other comprehensive income (OCI). However, the Group recognizes interest income, impairment losses and reversals and foreign exchange gain or loss in the statment of profit and loss.On derecognition of the asset, cumulative gain or loss previously recognised in OCI is reclassified from the equity to statement of profit and loss. Interest earned whilst holding FVTOCI debt instrument is reported as interest income using the EIR method.
Debt instrument at FVTPL FVTPL is a residual category for debt instruments. Any debt instrument, which does not meet the criteria for categorization as at
amortized cost or as FVTOCI, is classified as at FVTPL.
In addition, the Group may elect to designate a debt instrument, which otherwise meets amortized cost or FVTOCI criteria, as at FVTPL. However, such election is allowed only if doing so reduces or eliminates a measurement or recognition inconsistency (referred to as ‘accounting mismatch’).
Debt instruments included within the FVTPL category are measured at fair value with all changes recognized in the statement of profit and loss.
Equity investments All equity investments in the scope of Ind AS 109 are measured at fair value. Equity instruments which are held for trading and contingent
consideration recognised by the Company as an acquirer in a business combination to which Ind AS 103 applies are classified as at FVTPL. For all other equity instruments, the Group may make an irrevocable election to present in other comprehensive income subsequent changes in the fair value. The Group makes such election on an instrument-by-instrument basis. The classification is made on initial recognition and is irrevocable.
If the Group decides to classify an equity instrument as at FVTOCI, then all fair value changes on the instrument, excluding dividends, are recognized in the OCI. There is no recycling of the amounts from OCI to statement of profit and loss, even on sale of investment. However, the Group may transfer the cumulative gain or loss within equity.
Equity instruments included within the FVTPL category are measured at fair value with all changes recognized in the statement of profit and loss.
Notes to consolidated financial statements for the year ended March 31, 2018

UPL Limited Annual Report, 2017-18 254
Derecognition A financial asset (or, where applicable, a part of a financial asset or part of a group of similar financial assets) is primarily derecognised (i.e.
removed from the Group’s consolidated balance sheet) when:
- The rights to receive cash flows from the asset have expired, or
- The Group has transferred its rights to receive cash flows from the asset or has assumed an obligation to pay the received cash flows in full without material delay to a third party under a ‘pass-through’ arrangement; and either (a) the Group has transferred substantially all the risks and rewards of the asset, or (b) the Group has neither transferred nor retained substantially all the risks and rewards of the asset, but has transferred control of the asset.
When the Group has transferred its rights to receive cash flows from an asset or has entered into a pass-through arrangement, it evaluates if and to what extent it has retained the risks and rewards of ownership. When it has neither transferred nor retained substantially all of the risks and rewards of the asset, nor transferred control of the asset, the Group continues to recognise the transferred asset to the extent of the Group's continuing involvement. In that case, the Group also recognises an associated liability. The transferred asset and the associated liability are measured on a basis that reflects the rights and obligations that the Group has retained.
Continuing involvement that takes the form of a guarantee over the transferred asset is measured at the lower of the original carrying amount of the asset and the maximum amount of consideration that the Group could be required to repay.
Impairment of financial assets In accordance with Ind AS 109, the Group applies expected credit loss (ECL) model for measurement and recognition of impairment loss
on the following financial assets and credit risk exposure:
a) Financial assets that are debt instruments, and are measured at amortised cost e.g., loans, debt securities, deposits, trade receivables
and bank balance
b) Financial assets that are debt instruments and are measured as at FVTOCI
c) Lease receivables under Ind AS 17
d) Trade receivables or any contractual right to receive cash or another financial asset that result from transactions that are within the
scope of Ind AS 18 (referred to as contractual revenue receivables’ in these financial statements)
e) Financial guarantee contracts which are not measured as at FVTPL
The Group follows ‘simplified approach’ for recognition of impairment loss allowance on:
- Trade receivables or contract revenue receivables; and
- All lease receivables resulting from transactions within the scope of Ind AS 17
The application of simplified approach does not require the Group to track changes in credit risk. Rather, it recognises impairment loss allowance based on lifetime ECLs at each reporting date, right from its initial recognition.
For recognition of impairment loss on other financial assets and risk exposure, the Group determines that whether there has been a significant increase in the credit risk since initial recognition. If credit risk has not increased significantly, 12-month ECL is used to provide for impairment loss. However, if credit risk has increased significantly, lifetime ECL is used. If, in a subsequent period, credit quality of the instrument improves such that there is no longer a significant increase in credit risk since initial recognition, then the entity reverts to recognising impairment loss allowance based on 12-month ECL.
Lifetime ECL are the expected credit losses resulting from all possible default events over the expected life of a financial instrument. The 12-month ECL is a portion of the lifetime ECL which results from default events that are possible within 12 months after the reporting date.
ECL is the difference between all contractual cash flows that are due to the Group in accordance with the contract and all the cash flows that the entity expects to receive (i.e., all cash shortfalls), discounted at the original EIR. When estimating the cash flows, an entity is required to consider:
- All contractual terms of the financial instrument (including prepayment, extension, call and similar options) over the expected life
of the financial instrument. However, in rare cases when the expected life of the financial instrument cannot be estimated reliably,
then the entity is required to used the remaining contractual term of the financial instrument.
- Cash flows from the sale of collateral held or other credit enhancements that are integral to the contractual terms
Notes to consolidated financial statements for the year ended March 31, 2018

Overview
Strategyreview Performance Governance Financials
255
- Financial assets measured as at amortised cost, contractual revenue receivables and lease receivables: ECL is presented as an allowance, i.e., as an integral part of the measurement of those assets in the balance sheet. The allowance reduces the net carrying amount. Until the asset meets write-off criteria, the company does not reduce impairment allowance from the gross carrying amount.
s. Financial liabilities Initial recognition and measurement Financial liabilities are classified, at initial recognition, as financial liabilities at fair value through profit or loss, loans and borrowings, or
payables, as appropriate.
All financial liabilities are recognised initially at fair value and, in the case of loans and borrowings and payables, net of directly attributable
transaction costs.
The Group’s financial liabilities include trade and other payables, loans and borrowings including bank overdrafts and derivative financial
instruments.
Subsequent measurement The measurement of financial liabilities depends on their classification, as described below:
Financial liabilities at fair value through profit or loss Financial liabilities at fair value through profit or loss include financial liabilities held for trading and financial liabilities designated upon
initial recognition as at fair value through profit or loss. Financial liabilities are classified as held for trading if they are incurred for the
purpose of repurchasing in the near term. This category also includes derivative financial instruments entered into by the Group that are
not designated as hedging instruments in hedge relationships as defined by Ind AS 109.
Gains or losses on liabilities held for trading are recognised in the statement of profit and loss.
Loans and borrowings This is the category most relevant to the Group. After initial recognition, interest-bearing loans and borrowings are subsequently
measured at amortised cost using the EIR method. Gains and losses are recognised in statement of profit and loss when the liabilities are derecognised as well as through the EIR amortisation process.
Amortised cost is calculated by taking into account any discount or premium on acquisition and fees or costs that are an integral part of the EIR. The EIR amortisation is included as finance costs in the statement of profit and loss.
This category generally applies to borrowings. For more information refer Note 15.
Derecognition A financial liability is derecognised when the obligation under the liability is discharged or cancelled or expires. When an existing financial
liability is replaced by another from the same lender on substantially different terms, or the terms of an existing liability are substantially modified, such an exchange or modification is treated as the derecognition of the original liability and the recognition of a new liability. The difference in the respective carrying amounts is recognised in the statement of profit and loss.
Offsetting of financial instruments Financial assets and financial liabilities are offset and the net amount is reported in the standalone balance sheet if there is a currently
enforceable legal right to offset the recognised amounts and there is an intention to settle on a net basis, to realise the assets and settle the liabilities simultaneously.
t. Derivative financial instruments Initial recognition and subsequent measurement The Group uses derivative financial instruments, such as forward currency contracts, full currency swaps and interest rate swaps, to hedge
its foreign currency risks and interest rate risks, respectively. Such derivative financial instruments are initially recognised at fair value on the date on which a derivative contract is entered into and are subsequently re-measured at fair value. Derivatives are carried as financial assets when the fair value is positive and as financial liabilities when the fair value is negative. Fair value changes are recongnised in the statement of profit and loss.
u. Convertible preference shares Convertible preference shares are separated into liability and equity components based on the terms of the contract.
On issuance of the convertible preference shares, the fair value of the liability component is determined using a market interest rate for an equivalent non-convertible instrument. This amount is classified as a financial liability measured at amortised cost (net of transaction costs) until it is extinguished on conversion or redemption.
Notes to consolidated financial statements for the year ended March 31, 2018

UPL Limited Annual Report, 2017-18 256
The remainder of the proceeds are allocated to the conversion option that is recognised and included in equity if the conversion option meets Ind AS 32 criteria for fixed to fixed classification. Transaction costs are deducted from equity, net of associated income tax. The carrying amount of the conversion option is not remeasured in subsequent years.
Transaction costs are apportioned between the liability and equity components of the convertible preference shares based on the allocation of proceeds to the liability and equity components when the instruments are initially recognised.
v. Cash and cash equivalents Cash and cash equivalents in the balance sheet comprise cash at banks and on hand and short-term deposits with an original maturity
of three months or less, which are subject to an insignificant risk of changes in value.
For the purpose of the consolidated statement of cash flows, cash and cash equivalents consist of cash and short-term deposits, as defined above, net of outstanding bank overdrafts as they are considered an integral part of the Group’s cash management.
w. Cash dividend
The Group recognises a liability to make cash distributions to equity holders of the parent when the distribution is authorised and the distribution is no longer at the discretion of the Group. As per the corporate laws in India, a distribution is authorised when it is approved by the shareholders. A corresponding amount is recognised directly in equity.
x. Government grants Government grants are recognised where there is reasonable assurance that the grant will be received and all attached conditions will
be complied with. When the grant relates to an expense item, it is recognised as income on a systematic basis over the periods that the related costs, for which it is intended to compensate, are expensed. When the grant relates to an asset, it is recognised as income in equal amounts over the expected useful life of the related asset.
y. Earnings Per Share: Basic earnings per share are calculated by dividing the net profit or loss for the period attributable to equity shareholders by the weighted
average number of equity shares outstanding during the period.
For the purpose of calculating diluted earnings per share, the net profit or loss for the period attributable to equity shareholders and the weighted average number of shares outstanding during the period are adjusted for the effects of all dilutive potential equity shares.
z. Segment Reporting: Based on "Management Approach" as defined in Ind AS 108-Operating Segments, the Chief Operating Decision Maker evaluates the
Group's performance and allocates the resources based on an analysis of various performance indicators by business segments. Inter segment sales and transfers are reflected at market prices.
Unallocable items includes general corporate income and expense items which are not allocated to any business segment.
The Group prepares its segment information in conformity with the accounting policies adopted for preparing and presenting the financial statements of the Group as a whole. Common allocable costs are allocated to each segment on an appropriate basis.
aa. Contingent Liability and Contingent Asset: A contingent liability is a possible obligation that arises from past events whose existence will be confirmed by the occurrence or
non-occurrence of one or more uncertain future events beyond the control of the Group or a present obligation that is not recognized because it is not probable that an outflow of resources will be required to settle the obligation. A contingent liability also arises in extremely rare cases where there is a liability that cannot be recognized because it cannot be measured reliably. The Group does not recognize a contingent liability but discloses its existence in the consolidated financial statements.
ab. Biological Assets: Sinagro Produtos Agropecua’rios S.A. and 3SB Produtos Agricolas S.A. Biological assets of the group consists of harvest of soybean, corn, cotton and beans. Such biological assets are recognised at fair value,
less cost to sell, when the Group controls the asset as a result of past events, it is probable that future economic benefits associated with the asset will flow to the enterprise, and the fair value or cost of the asset can be measured reliably. Any changes to fair value are recognised in the statement of profit and loss.
Notes to consolidated financial statements for the year ended March 31, 2018

Overview
Strategyreview Performance Governance Financials
257
ac. Standards issued but not yet effective In March 2018, the Ministry of Corporate Affairs issued the Companies (Indian Accounting Standards) Amendment Rules, 2018, notifying
Ind As 115 ‘Revenue from Contracts with Customers’, which replaces Ind AS 11 ‘Construction Contracts’ and Ind As 18 ‘Revenue’. Except for the disclosure requirements, the new standard will not materially impact the Company’s consolidated financial statements.
Amendment to Ind AS 21: Also Appendix B to Ind AS 21, foreign currency transactions and advance consideration was notified along with the same notification
which clarifies the date of the transaction for the purpose of determining the exchange rate to use on initial recognition of the related asset, expense or income, when an entity has received or paid advance consideration in a foreign currency. The company has evaluated the effect of these on the consolidated financial statements and the impact is not material.
These amendments will come into force from April 1, 2018.
Notes to consolidated financial statements for the year ended March 31, 2018

UPL Limited Annual Report, 2017-18 258
Not
es to
con
solid
ated
fina
ncia
l sta
tem
ents
for t
he y
ear e
nded
Mar
ch 3
1, 2
018
3.
Prop
erty
, pla
nt a
nd e
quip
men
t and
cap
ital w
ork-
in-p
rogr
ess
INR
Cro
res
Lan
d -
Free
hold
L
and
- Le
aseh
old
Bui
ldin
g Bu
ildin
g-Le
aseh
old
Pla
nt a
nd
Equi
pmen
t L
abor
ator
y Eq
uipm
ent's
Fu
rnitu
re
Fixt
ures
and
Eq
uipm
ents
Offi
ce
Equi
pmen
t's
Veh
icle
s A
sset
s Tak
en o
n Le
ase
Land
Im
prov
e-m
ents
Build
ing
Impr
ove-
men
ts
Airc
raft
Cap
ital
Wor
k in
Pr
ogre
ss
Tota
l
Fur
nitu
re,
Fixt
ures
and
Eq
uipm
ent's
Veh
icle
s
Cos
t or v
alua
tion
At 1
Apr
il 20
16
244
1
50
456
2
5 3
,211
5
3 8
7 7
7 8
3 2
2
2
0 8
5 7
6 3
12
4,8
83
Add
ition
s du
ring
the
year
2
1
2 5
5 -
416
1
4 9
9
3
8 -
- 1
3
-
682
1
,241
Dis
posa
ls d
urin
g th
e ye
ar
(22)
- (3
3) -
(66)
(4)
(1)
(6)
(10)
- -
(4)
- -
- (1
46)
Tra
nsfe
rs/C
apita
lised
-
- -
- -
- -
- -
- -
- -
- (3
69)
(369
)
Exc
hang
e di
ffere
nces
3
-
(7)
(2)
(50)
(2)
- (1
) 1
-
- (2
) 1
(3
) 8
(5
4)
At 3
1 M
arch
201
7 2
27
162
4
71
23
3,5
11
61
95
79
112
2
2
1
5 8
9 7
3 6
33
5,5
55
Add
ition
s du
ring
the
year
-
- 8
0 -
563
1
2 1
0 2
6 2
3 -
- -
2
1
991
1
,708
Dis
posa
ls d
urin
g th
e ye
ar
- -
(1)
- (7
3) -
(2)
(3)
(12)
- (1
) -
- -
(541
) (6
33)
Recl
assi
ficat
ion
- -
3
- (3
1) 8
(6
) 1
5 (2
) -
- -
(2)
- -
(15)
Exch
ange
diff
eren
ces
- 1
1
9 4
1
19
5
- 2
(1
) -
- 3
1
-
7
160
At 3
1 M
arch
201
8 2
27
163
5
72
27
4,0
89
86
97
119
1
20
2
1
18
90
74
1,0
90
6,7
75
Dep
reci
atio
n
At 1
Apr
il 20
16
- 1
2
21
17
1,7
99
28
52
53
49
- 1
1
9 3
3 1
0 -
2,2
83
Dep
reci
atio
n ch
arge
for t
he
year
(Not
e 25
) -
- 1
4 1
2
36
5
11
12
17
- -
- 6
1
0 -
312
Dis
posa
ls d
urin
g th
e ye
ar
- -
(26)
- (5
2) (4
) -
(6)
(7)
- -
(3)
- -
- (9
8)
Exch
ange
diff
eren
ces
- -
(8)
(1)
(41)
(4)
- (1
) -
- -
(2)
- (1
) -
(58)
At 3
1 M
arch
201
7 -
1
201
1
7 1
,942
2
5 6
3 5
8 5
9 -
1
14
39
19
- 2
,439
Dep
reci
atio
n ch
arge
for t
he
year
(Not
e 25
) -
- 1
6 2
2
62
6
9
13
19
- -
- 6
1
0 3
43
Dis
posa
ls d
urin
g th
e ye
ar
- -
(1)
(2)
(64)
- (2
) (2
) (9
) -
- -
- -
- (8
0)
Recl
assi
ficat
ion
- -
(1)
- (2
2) 5
(9
) 1
1 (2
) -
- -
- -
- (1
8)
Exch
ange
diff
eren
ces
- -
17
4
96
3
1
2
- 2
-
3
- (1
) -
127
At 3
1 M
arch
201
8 -
1
232
2
1 2
,214
3
9 6
2 8
2 6
7 2
1
1
7 4
5 2
8 -
2,8
11
Net
boo
k va
lue
At 3
1 M
arch
201
8 2
27
162
3
40
6
1,8
75
47
35
37
53
- -
1
45
46
1,0
90
3,9
64
At 3
1 M
arch
201
7 2
27
161
2
70
6
1,5
69
36
32
21
53
2
1
1
50
54
633
3
,116
INR
Cro
res
Net
boo
k va
lue
Year
end
ed
Mar
ch 3
1, 2
018
Year
end
ed
Mar
ch 3
1, 2
017
Plan
t, pr
oper
ty a
nd e
quip
men
t 2
,874
2
,483
Capi
tal w
ork
in p
rogr
ess
1,0
90
633
Tota
l 3
,964
3
,116
Capi
tal W
ork
in P
rogr
ess
Capi
tal w
ork-
in-p
rogr
ess
as a
t 31
Mar
ch 2
018
com
pris
es e
xpen
ditu
re fo
r the
pla
nt a
nd b
uild
ing
in th
e co
urse
of c
onst
ruct
ion.
Secu
rity
For p
rope
rty,
pla
nt a
nd e
quip
men
t giv
en a
s se
curit
y (R
efer
Not
e 15
)

Overview
Strategyreview Performance Governance Financials
259N
otes
to c
onso
lidat
ed fi
nanc
ial s
tate
men
ts fo
r the
yea
r end
ed M
arch
31,
201
8
4. I
ntan
gibl
e as
sets
INR
Cro
res
Oth
er In
tang
ible
Ass
ets
Inta
ngib
le
asse
t und
er
deve
lopm
ent
Tota
l (Ex
cl.
Goo
dwill
Goo
dwill
*D
ata
Acce
ss
Fees
Prod
uct
Regi
stra
tions
Prod
uct
Acqu
isiti
ons
Task
For
ce
Expe
nses
Soft
war
e/
Lice
nse
Fees
Cust
omer
Co
ntra
cts
Bran
ds/
Trad
e M
arks
Non
-com
pete
ag
reem
ents
Trad
e Se
cret
sRi
ght t
o U
seG
erm
plas
m
Cost
At 1
Apr
il 20
16 4
17
209
2
,795
6
45
22
56
420
3
01
22
18
- 2
56
172
4
,916
A
dditi
ons
durin
g th
e ye
ar -
- 2
80
99
- 7
-
2
- -
- -
156
5
44
Ded
uctio
ns d
urin
g th
e ye
ar -
(91)
(287
) -
- -
- -
- -
- -
- (3
78)
Tran
sfer
/Cap
italis
ed -
- -
- -
- -
- -
- -
- (1
74)
(174
)Fo
reig
n Ex
chan
ge
Adj
ustm
ent
2
(2)
(79)
(2)
- (1
) 1
6 (2
) -
- -
- 5
(6
5)
At 3
1 M
arch
201
7 4
19
116
2
,709
7
42
22
62
436
3
01
22
18
- 2
56
159
4
,843
A
dditi
ons
durin
g th
e ye
ar -
1
239
-
- 8
-
- -
- 3
-
187
4
38
Ded
uctio
ns d
urin
g th
e ye
ar -
- (1
8) -
- -
- -
- -
- -
(112
) (1
30)
Recl
assi
ficat
ion
- -
20
- -
(2)
- (1
9) -
- -
9
- -
Fore
ign
Exch
ange
A
djus
tmen
t 1
3 (7
) 1
80
5
- 4
(4
) -
- -
- -
(5)
173
At 3
1 M
arch
201
8 4
32
110
3
,130
7
47
22
72
432
2
82
22
18
3
265
2
29
5,3
24
Am
ortis
atio
nA
t 1 A
pril
2016
- 2
08
2,1
71
257
1
1 4
5 3
85
269
2
1 1
1 -
209
-
3,5
87
Am
ortis
atio
n fo
r the
yea
r (N
ote
25)
- 1
2
50
44
3
5
28
13
- 2
-
12
- 3
58
Am
ortis
atio
n on
dis
posa
ls -
(91)
(285
) -
- -
- -
- -
- -
- (3
76)
Fore
ign
Exch
ange
A
djus
tmen
t -
(3)
(65)
(1)
- (1
) 1
5 (1
) 1
-
- 1
-
(54)
At 1
Apr
il 20
17 -
115
2
,071
3
00
14
49
428
2
81
22
13
- 2
22
- 3
,515
A
mor
tisat
ion
for t
he y
ear
(Not
e 25
) -
1
243
5
0 3
5
6
4
3
-
10
- 3
25
Am
ortis
atio
n on
dis
posa
ls -
- (1
3) -
- -
- -
- -
- -
- (1
3)Re
clas
sific
atio
n -
(7)
14
(7)
- (2
) -
- -
- -
21
- 1
9 Fo
reig
n Ex
chan
ge
Adj
ustm
ent
- (1
) 1
42
2
(1)
5
(3)
(19)
- 1
-
- -
126
At 3
1 M
arch
201
8 -
108
2
,457
3
45
16
57
431
2
66
22
17
- 2
53
- 3
,972
N
et b
ook
valu
e 4
32
2
673
4
02
6
15
1
16
- 1
3
1
2 2
29
1,3
60
At 3
1 M
arch
201
8 4
19
1
638
4
42
8
13
8
20
- 5
-
34
159
1
,328
A
t 31
Mar
ch 2
017
INR
Cro
res
Net
boo
k va
lue
Year
end
ed
Mar
ch 3
1, 2
018
Year
end
ed
Mar
ch 3
1, 2
017
Goo
dwill
432
4
19
Oth
er in
tang
ible
ass
ets
1,1
31
1,1
69
Inta
ngib
le a
sset
s un
der d
evel
opm
ent
229
1
59
Tota
l 1
,792
1
,747
*Goo
dwill
is te
sted
for i
mpa
irmen
t on
an a
nnua
l bas
is a
nd w
hene
ver t
here
is a
n in
dica
tion
that
the
reco
vera
ble
amou
nt is
less
than
its
carr
ying
am
ount
bas
ed o
n a
num
ber o
f fac
tors
incl
udin
g bu
sine
ss p
lan,
ope
ratin
g re
sults
, fut
ure
cash
flow
s an
d ec
onom
ic c
ondi
tions
.
The
Gro
up g
ener
ally
use
s di
scou
nted
cas
h flo
ws
met
hod
to d
eter
min
e th
e re
cove
rabl
e am
ount
. The
se d
isco
unte
d ca
sh fl
ow c
alcu
latio
ns u
se fi
ve-y
ear
proj
ectio
ns t
hat
are
base
d on
fina
ncia
l fo
reca
sts.
Cash
flow
pro
ject
ions
take
into
acc
ount
pas
t exp
erie
nce
and
repr
esen
t man
agem
ents
's be
st e
stim
ate
abou
t fut
ure
deve
lopm
ent.

UPL Limited Annual Report, 2017-18 260
5. Investments INR Crores
March 31, 2018 March 31, 2017
Non-current
Investments accounted for using the equity method
Investment stated at Cost
(A) Investments in Equity Instruments a. Investment in Associates (Unquoted)(i) 5,675 [March 2017: 4,000] Equity Shares fully paid-up in 3SB Produtos Agricolas
SA [includes goodwill of H73 Crores [March 2017 H64 Crores]102 76
(ii) 87,298,237 [March 2017: 43,907,261] Equity Shares fully paid-up in Sinagro Produtos
Agropecuarios SA. [includes goodwill of H48 Crores, [March 2017: H24 Crores] (refer Note
(a) below)
0 36
(iii) 921,000 [March 2017: 921,000] Equity Shares of H10 each fully paid-up in Chemisynth
[Vapi] Limited (refer Note (a) below)
0 0
(iv) 18,130 [March 2017: 18,130] Equity shares of H100 each of Universal Pestochem
[Industries] Pvt. Ltd. (refer Note (a) below)
0 0
(v) 3,350,000 [March 2017: 3,350,000] Equity Shares of H10 each fully paid-up in Kerala Enviro
Infrastructure Limited
3 3
(vi) 200 [March 2017: 200] Equity shares of Polycoat Technologies 2010 Limited (refer Note
(a) below)
0 0
(vii) 37,681 [March 2017: 37,681] Equity shares of H10 each, fully paid-up in Weather Risk
Management Services Pvt Ltd [includes goodwill of H3 Crores [March 2017 HNil]
10 10
(viii) 103,016,215 [March 2017:Nil] Equity shares of H1 each, fully paid-up in Serra Bonita
Sementes S.A. [includes goodwill of H(14) Crores [March 2017 HNil]
208 0
b. Investment in Joint Ventures (Unquoted)
(i) 1,627 [March 2017: 1,627] Equity Shares of Tk.1,000 each fully paid-up in United
Phosphorus [Bangladesh] Limited (refer Note (a) below)
0 0
(ii) 200 [March 2017: 200] Equity shares fully paid up in Hodogaya UPL Co. Ltd 21 18
(iii) 88,223 [March 2017: 88,223] Equity shares of H1 AUD each fully paid-up in Longreach
Plant Breeders Management Private Limited [includes goodwill of H18 Crores, [March
2017: H18 Crores]
42 31
Total non-current investments accounted for using the Equity Method 386 174
Investment stated at Amortised Cost
Investments in Government or trust securities (Unquoted)
(i) Indira Vikas Patra [Face Value: Current Year: H0.06 lac.[March 31, 2017: H0.06 lac]] 0 0
(ii) "National Saving Certificates [Face Value: Current Year: H0.09 lac. [March 2017: H0.09 lac]] 0 0
Investments stated at Fair Value through OCI
Investments in Equity Instruments (Quoted)
(i) 11,700,000 [March 2017: 11,700,000 Equity shares fully paid up in Ishihara Sangyo Kaisha
Ltd.
94 75
(ii) 28,100 [March 31, 2017: 28,100] Equity Shares of H10 each fully paid-up in Gujarat State
Financial Corporation
0 0
(iii) 50,000 [March 31, 2017: 50,000] Equity Shares of H10 each fully paid-up in Nivi Trading
Limited
0 0
(iv) 41,150 [March 31, 2017: 41,150] Equity Shares of H10 each fully paid-up in Transpek
Industry Limited
5 2
(v) 5,307 [March 31, 2017: 5,307] Equity Shares of H10 each fully paid-up in IDFC Limited 0 0 (vi) 5,307 [March 31, 2017: 5,307] Equity Shares of H10 each fully paid-up in IDFC Bank Limited. 0 0
Notes to consolidated financial statements for the year ended March 31, 2018

Overview
Strategyreview Performance Governance Financials
261
Notes to consolidated financial statements for the year ended March 31, 2018
5. Investments INR Crores
March 31, 2018 March 31, 2017
(vii) 17,990 [March 31, 2017: 17,990] Equity Shares of H2 each fully paid-up in Bank of Baroda
Limited
0 0
Investments stated at Fair Value through Profit and Loss
A. Investments in Optionally Convertible Bonds (Unquoted)
6,855 [March 31, 2017: 6,855] Optionally Convertible Bonds of H1.00,000 each in Tatva
Global Environment Private Limited
76 83
B. Investment in Equity Instruments (Unquoted)
(i) 240,000 (March 31, 2017: 240,000) Equity shares of H10 each fully paid-up in UPL
Investment Private Limited
2 2
(ii) Equity shares in Amira Nature foods Limited 33 34
(iii) 57 [March 31, 2017: 57] Ordinary Shares of 1 Rand each fully paid-up in Cropserve [PTY]
Limited
0 0
(iv) 3,435,070 [March 31, 2017: 3,435,070] Equity Shares of H10 each fully paid-up in Narmada
Clean Tech Limited
3 3
(v) 10,000 [March 2017: 10,000] Equity Shares of H10 each fully paid—up in Janakalyan
Sahakari Bank Limited
0 0
(vi) 1,000,000 (March 31, 2017: 1,000,000) Equity Shares of H10 each fully paid-up in Uniphos
International Limited
0 0
(vii) 45,000 (March 31, 2017: 45,000) Equity Shares of H10 each fully paid-up in Bloom
Packaging Private Limited
1 1
(viii) 19,025 (March 31, 2017: 19,025) Equity Shares of H10 each fully paid-up in Bench Bio
Private Limited
1 1
(ix) 100 [March 31, 2017: 100] Equity Shares of Natural Art KK 0 0
(C) Investment in Others
415 [March 2017: 415] Optionally convertible Debentures of H50,000 each of Bloom
Packaging Pvt. Ltd.
2 2
201,834,849 [March 31, 2017: Nil] Non-convertible Debentures of BRL 1 each of IBI Brasil
Empreendimentos E Participacoes S.A.
424 -
Total Other Non-Current Investments 641 204
Total Non-Current Investments 1,027 378
(Contd.)

UPL Limited Annual Report, 2017-18 262
Notes to consolidated financial statements for the year ended March 31, 2018
6. Loans INR Crores
Non-current CurrentMarch 31, 2018 March 31, 2017 March 31, 2018 March 31, 2017
(A) Security Deposit
a. Unsecured, Considered good 91 95 31 0
b. Unsecured, Considered doubtful 2 2 - -
Less: Allowance for doubtful security deposit (2) (2) - -
91 95 31 0
(B) Loans and Advances to related parties (refer note 38)
a. Unsecured, Considered good 60 128 96 50
60 128 96 50
(C) Loans to employees
a. Unsecured, Considered good 0 2 8 11
0 2 8 11
(D) Sundry loans
a. Unsecured, Considered good - - 12 58
b. Unsecured, Considered doubtful 2 2 - -
Less: Allowance for doubtful sundry loans (2) (2) - -
- - 12 58
Total loans 151 225 147 119
Loans and receivables are non-derivative financial assets which generate a fixed or variable interest income for the Group.
5. Investments (Contd.)
March 31, 2018 March 31, 2017
Current
Investments stated at Fair Value through profit and loss
Investments in Others (Unquoted) 7 0
Total Current Investments 7 0
Total Investments 1,034 378
Aggregate amount and market value quoted investments 99 78
Aggregate amount of unquoted investments 935 300
Impairment of investments - -
Investments at fair value through Profit and loss (fully paid) reflect investment in debt instruments. Refer note 45 for determination of their
fair values.
Investments at fair value through OCI (fully paid) reflect investment in quoted equity securities. Refer note 45 for determination of their fair
values.
Note:
a. Share of losses has been restricted to the carrying value of the investment

Overview
Strategyreview Performance Governance Financials
263
Notes to consolidated financial statements for the year ended March 31, 2018
7. Other Financial Assets INR Crores
Non-current CurrentMarch 31, 2018 March 31, 2017 March 31, 2018 March 31, 2017
(A) Interest receivable
a. Unsecured, Considered good - - 49 57
b. Unsecured, Considered doubtful - - - 0
Less: Allowance for doubtful Interest receivable - - - (0)
- - 49 57
(B) Export benefits receivables
a. Unsecured, Considered good 35 60 94 87
35 60 94 87
(C) Others
a. Unsecured, Considered good - - 24 20
b. Unsecured, Considered doubtful 2 2 - -
Less: Allowance for doubtful other financial assets (2) (2) - -
- - 24 20
Total Other Financial Assets 35 60 167 164
8. Other Assets INR Crores
Non-current CurrentMarch 31, 2018 March 31, 2017 March 31, 2018 March 31, 2017
(i) Capital advances 93 32 - -
(ii) Statutory receivables 219 237 915 397
(iii) Other advances 7 6 260 259
Total Other Assets 319 275 1,175 656
9. Inventories(Valued at lower of cost and net realisable value) INR Crores
March 31, 2018 March 31, 2017
a. Raw materials and components 957 856
b. Work in progress 372 355
c. Finished goods 2,561 2,330
d. Traded goods 478 459
e. Store and spares [including fuel] 72 62
f. Packing material 93 87
g. By products 5 7
4,538 4,156
Amount of write down of inventories to net realisable value and other provisions / losses recognised in the statement of profit and loss as an
expense is H23 Crores (31 March 2017: H56 Crores).

UPL Limited Annual Report, 2017-18 264
Notes to consolidated financial statements for the year ended March 31, 2018
10. Trade receivables INR Crores
Non-current Current
March 31, 2018 March 31, 2017 March 31, 2018 March 31, 2017
Unsecured, Considered good 1 0 6,056 5,656
Unsecured, Considered doubtful - - 366 360
Less: Allowance for doubtful trade receivable - - (366) (360)
Total trade receivables 1 0 6,056 5,656
No trade or other receivable are due from directors or other officers of the company either severally or jointly with any other person. There are
no trade or other receivable are due from firms or private companies respectively in which any director is a partner, a director or a member.
Trade receivables are non-interest bearing and are generally on terms of 45 to 270 days.
For explanations on Group's Credit risk management process. (Refer note 47)
The Group has entered into an agreement to sell and assign its receivables on a non recourse basis with various banks. This is treated as a "true
sale" for both legal and financial reporting purposes. As such, the assets once transferred are not reflected on the balance sheet date. At 31st
March, 2018, the Group sold receivables which have been recognised of H2,051 Crores (H2,043 Crores at 31st March, 2017).
11. Cash and cash equivalents INR Crores
March 31, 2018 March 31, 2017
Balances with banks
-Current accounts 141 117
-Foreign currency accounts 2 1
-Current accounts outside India 1,519 1,481
Fixed deposit accounts
- Deposits with original maturity for less than 3 months - 1
-Fixed deposits outside India 1,164 1,241
Cheques/drafts on hand 32 33
Cash on hand 1 6
2,859 2,880
11A. Other Bank Balances INR Crores
March 31, 2018 March 31, 2017
- Deposits with original maturity for more than 3 months but less than 12 months 14 1
- Margin money deposit * 14 8
-Unclaimed dividend accounts 7 6
35 15
*Margin money deposits given as security against Bank Guarantees
For the purpose of the consolidated statement of cash flows, cash and cash equivalents comprise the following: INR Crores
March 31, 2018 March 31, 2017
Balances with banks:
-Current accounts 141 117
-Foreign currency accounts 2 1
-Current accounts outside India 1,519 1,481
Fixed deposit accounts 1,164 1,241
- Deposits with original maturity for less than 3 months - 1
Cheques/drafts on hand 32 33
Cash on hand 1 6
2,859 2,880

Overview
Strategyreview Performance Governance Financials
265
12. Share Capital Authorised Share Capital INR Crores
Equity Shares of INR 2 each No. INR Crores
At April 1, 2016 1,27,50,00,000 255
(Decrease) during the year (3,75,00,000) (7)
At March 31, 2017 1,23,75,00,000 248
Increase/(decrease) during the year - -
At March 31, 2018 1,23,75,00,000 248
INR Crores
March 31, 2018 March 31, 2017
Equity shares bought back by the Company. 3 3
There are 42,353,062 shares (March 31, 2017: 42,361,062) underlying equity shares of the Company in respect of GDR's traded on Luxemburg
Stock Exchange and against conversion of each GDR ten equity shares were issued.
There are NIL shares (March 31, 2017: 42,103,942) underlying equity shares of the Company in respect of GDR's listed on Singapore Stock
Exchange were issued pursuant to scheme of amalgamation of Advanta Limited with the Company.
Notes to consolidated financial statements for the year ended March 31, 2018
Issued equity capitalEquity shares of INR 2 each issued, subscribed and fully paid INR Crores
Equity Shares of INR 2 each No. INR Crores
At April 1, 2016 42,86,04,274 86
Increase during the year 7,84,12,844 15
At March 31, 2017 50,70,17,118 101
Increase during the year 23,15,963 1
At March 31, 2018 50,93,33,081 102
Terms/ rights attached to equity sharesThe Company has one class of equity shares having par value of H2 per share. Each holder of equity shares is entitled to one vote per share.
The Company declares and pays dividends in Indian rupees. The dividend proposed by the Board of Directors is subject to the approval of the
shareholders in the ensuing Annual General Meeting.
In the event of liquidation of the Company, the holders of equity shares will be entitled to receive the remaining assets of the Company,
after distribution of all preferential amounts. The distribution will be in proportion to the number of equity shares held by the shareholders.
During the year ended March, 2018, the amount of per share dividend proposed as distributions to equity shareholders is H8 (March, 2017: H7)
Details of shareholders holding more than 5% shares in the companyName of the shareholder
INR Crores
March 31, 2018 March 31, 2017No. in crores % holding in the
classNo. in crores % holding in the
classEquity shares of INR 2 each fully paid
Nerka Chemicals Private Limited 10 19.94% 10 19.98%
Uniphos Enterprises Limited 3 5.01% 3 5.03%
As per records of the Company, including its register of shareholders/ members and other declarations received from shareholders regarding
beneficial interest, the above shareholding represents both legal and beneficial ownerships of shares.
Aggregate number of equity shares issued as bonus, shares issued for consideration other than cash and shares bought back during the period of five years immediately preceding the reporting date:

UPL Limited Annual Report, 2017-18 266
Notes to consolidated financial statements for the year ended March 31, 2018
Issued Preference Share Capital INR Crores
Preference shares of INR 10 each issued, subscribed and fully paid
Optionally Convertible Preference Shares (OCPS)
Compulsorily Convertible Preference Shares (CCPS)
No. INR Crores No. INR Crores
At April 1, 2016 - - - -
Increase during the year 2,46,42,786 25 8,19,40,125 82
At March 31, 2017 2,46,42,786 25 8,19,40,125 82
Debt portion of OCPS considered as part of Short term
borrowings
- 24 - -
Equity portion of OCPS considered as part of other Equity - 1 - -
At March 31, 2017 2,46,42,786 25 8,19,40,125 82
Increase/(decrease) during the year (2,46,42,786) (25) (8,19,40,125) (82)
At March 31, 2018 - - - -
Terms/ rights attached to preference sharesEach Compulsory convertible preference share (CCPS) has a par value of INR 10 and is convertible at the option of the shareholders into Equity
shares of the Company starting within 18 months from the date of allotment i.e. from August 08, 2016 on the basis of ten new equity shares
of INR 2 for every four hundred and seventy one CCPS held. If the CCPS are not converted within 18 months from the date of allotment, then
the CCPS shall be automatically converted into equity shares of the Company at the end of 18 months from the date of allotment. The CCPS
carry a dividend of 5% per annum, payable annually, subject to deduction of taxes at source, if applicable. The CCPS shall be non-cumulative
and non-participating in nature. The holder of CCPS shall have right to vote in accordance with Section 47 of the Companies Act, 2013.
Each Optionally convertible preference share (OCPS) has a par value of INR 10 and is convertible at the option of the shareholders into Equity
shares of the Company starting within 18 months from the date of allotment i.e. from August 08, 2016 on the basis of ten new equity shares
of INR 2 for every four hundred and seventy one OCPS held. If the OCPS are not converted within 18 months from the date of allotment, then
the OCPS shall be automatically redeemed at par. The OCPS carry a dividend of 5% per annum, payable annually, subject to deduction of
taxes at source, if applicable. The OCPS shall be non-cumulative and non-participating in nature. The holder of OCPS shall have right to vote
in accordance with Section 47 of the Companies Act, 2013. The presentation of the liability and equity portions of these shares is explained
in the summary of significant accounting policy.
12B. Share Capital Suspense During the previous year, the Company had allotted Equity Shares, Compulsorily Convertible Preference Shares and Optionally Convertible
Preference Shares to the shareholders of erstwhile Advanta Limited, pursuant to Scheme of Amalgamation as described in detail in Note 30.
Accordingly , the balance lying in Share Capital Suspense Account was transferred to respective Equity / Liability Account.
12A. Preference Share Capital (Contd.)
Authorised Share Capital INR Crores
Optionally Convertible Preference Shares (OCPS) of INR 100 each
Compulsorily Convertible Preference Shares (CCPS) of INR
10 each No. INR Crores No. INR Crores
At April 1, 2016 1,40,00,000 140 50,00,000 5
Increase/(decrease) during the year (1,40,00,000) (140) 22,45,00,000 225
At March 31, 2017 - - 22,95,00,000 230
Increase/(decrease) during the year - - - -
At March 31, 2018 - - 22,95,00,000 230
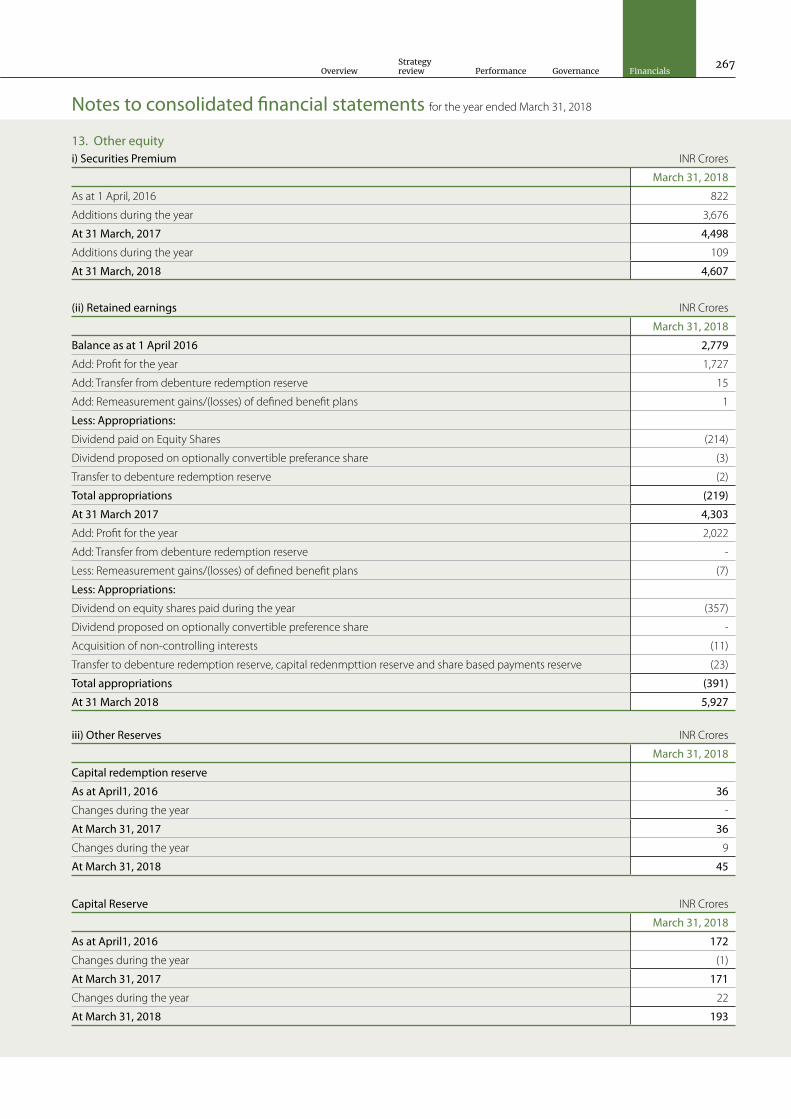
Overview
Strategyreview Performance Governance Financials
267
Notes to consolidated financial statements for the year ended March 31, 2018
13. Other equityi) Securities Premium INR Crores
March 31, 2018
As at 1 April, 2016 822
Additions during the year 3,676
At 31 March, 2017 4,498
Additions during the year 109
At 31 March, 2018 4,607
iii) Other Reserves INR Crores
March 31, 2018
Capital redemption reserve
As at April1, 2016 36
Changes during the year -
At March 31, 2017 36
Changes during the year 9
At March 31, 2018 45
Capital Reserve INR Crores
March 31, 2018
As at April1, 2016 172
Changes during the year (1)
At March 31, 2017 171
Changes during the year 22
At March 31, 2018 193
(ii) Retained earnings INR Crores
March 31, 2018
Balance as at 1 April 2016 2,779
Add: Profit for the year 1,727
Add: Transfer from debenture redemption reserve 15
Add: Remeasurement gains/(losses) of defined benefit plans 1
Less: Appropriations:
Dividend paid on Equity Shares (214)
Dividend proposed on optionally convertible preferance share (3)
Transfer to debenture redemption reserve (2)
Total appropriations (219)
At 31 March 2017 4,303
Add: Profit for the year 2,022
Add: Transfer from debenture redemption reserve -
Less: Remeasurement gains/(losses) of defined benefit plans (7)
Less: Appropriations:
Dividend on equity shares paid during the year (357)
Dividend proposed on optionally convertible preference share -
Acquisition of non-controlling interests (11)
Transfer to debenture redemption reserve, capital redenmpttion reserve and share based payments reserve (23)
Total appropriations (391)
At 31 March 2018 5,927

UPL Limited Annual Report, 2017-18 268
Notes to consolidated financial statements for the year ended March 31, 2018
Debenture Redemption Reserve INR Crores
March 31, 2018As at April1, 2016 140 Add: Amount transferred from retained earnings 2
Less: Amount transferred to retained earnings (15)
At March 31, 2017 127 Add: Amount transferred from retained earnings 14
Less: Amount transferred to retained earnings -
At March 31, 2018 141
Share based payment reserve INR Crores
March 31, 2018At 1 April 2016 2 Changes during the year 0
At 31 March 2017 2 Changes during the year (2)
At 31 March 2018 -
General Reserve INR Crores
March 31, 2018At 1 April 2016 1,848 Changes during the year -
At 31 March 2017 1,848 Changes during the year -
At 31 March 2018 1,848
Non-controlling interest reserve INR Crores
March 31, 2018At 1 April 2016 (3,693)Changes during the year -
At 31 March 2017 (3,693)Changes during the year -
At 31 March 2018 (3,693)
FVTOCI reserve INR Crores
March 31, 2018At 1 April 2016 (76)Changes during the year 22
At 31 March 2017 (54)Changes during the year 10
At 31 March 2018 (44)
Foreign currency translation reserve INR Crores
March 31, 2018At 1 April 2016 (24)Changes during the year 0
At 31 March 2017 (24)Changes during the year 67
At 31 March 2018 43
13. Other equity (Contd.)

Overview
Strategyreview Performance Governance Financials
269
Notes to consolidated financial statements for the year ended March 31, 2018
13. Other equity (Contd.)
Securities Premium - Where the Holding Company issues shares at a premium, whether for cash or otherwise, a sum equal to the aggregate
amount of the premium received on those shares shall be transferred to “Securities Premium ”. The Holding Company may issue fully paid-up
bonus shares to its members out of the securities premium reserve and can use this reserve for buy-back of shares.
Capital redemption reserve - Capital redemption reserve was created for buy-back of shares and can be utilised for issuance of fully paid up
bonus shares.
Capital reserve - The Group recognises profit or loss on purchase, sale, issue or cancellation of the Group's own equity instruments to capital
reserve.
Debenture redemption reserve (DRR) - The Holding Company has issued redeemable non-convertible debentures. The Companies (Share
capital and Debentures) Rules, 2014 (as amended), require the Company to create DRR out of profits of the Company available for payment
of dividend. DRR is required to be created for an amount which is equal to 25% of the value of debentures issued.
Share based payment reserve - The Holding Company has an employee stock option scheme under which the option to subscribe for the
companies share have been granted to the key employees and directors. The share-based payment reserve is used to recognize the value of
equity-settled share-based payments provided to the key employees and directors as part of their remuneration. Refer to Note 36 for further
details of the scheme.
General reserve - General reserve is created out of the profits earned by the Holding Company by way of transfer from surplus in the
statement of profit and loss. The Holding Company can use this reserve for payment of dividend and issue of fully paid-up and not paid-up
bonus shares.
Other reserves INR Crores
March 31, 2018 March 31, 2017
Capital redemption reserve 45 36
Capital reserve 193 171
Debenture redemption reserve 141 127
General reserve 1,848 1,848
Share based payment reserve - 2
Non-controlling interest reserve (3,693) (3,693)
FVTOCI reserve (44) (54)
Foreign currency translation reserve 43 (24)
Total other reserves (1,467) (1,587)
The disaggregation of changes in OCI by each type of reserves in equity is disclosed in note 28.
14. Distribution made and proposed INR Crores
March 31, 2018 March 31, 2017
Cash dividends on Equity shares declared and paid:
Final dividend for 31 March 2017: H7 per share (March 31, 2016: H5 per share) 357 214
357 214
Proposed dividends on Equity shares:
Proposed cash dividend for the year ended 31 March 2018: H8 per share (March 31, 2017: H7
per share)
407 355
407 355
Note Proposed dividend on equity shares is subject to approval at the annual general meeting and is not recognised as a liability as at 31 March.
14A.Shares reserved for issue under options
For details of shares reserved for issue under the Employee Stock Option Plan (ESOP) of the Holding Company (refer note 36)

UPL Limited Annual Report, 2017-18 270
Notes to consolidated financial statements for the year ended March 31, 2018
15. Borrowings INR CroresEffective
interest Rate %Maturity March 31, 2018 March 31, 2017
Non-current borrowings
Debentures
Redeemable non-convertible debentures (NCDs)
(Unsecured) (refer note a below)
10.44% to 10.85% 2018-2026 682 756
682 756
Bonds (Unsecured) (Refer Note b below)
3.25% Senior Notes 3.25% 13th October
2021
3,230 3,210
4.50% Senior Notes 4.50% 8th March 2028 1,937 -
Term Loan
From Bank
Foreign currency loan (Unsecured) Prime + 2%, 3.4% 2018-2021 2 1,380
Foreign currency loan (Secured) (Refer Note c below) 6.00% to 17.60% 2018-2022 3 4
Loan from Biotechnology Industry Research Assistance
(BIRAC) (Secured)
2 to 3% 2020 - 0
From others (Unsecured) 2% to 5.79% 2018-2023 19 -
5,873 5,350
Current maturities of long term borrowings
Debentures
Redeemable non-convertible debentures (NCDs)
(Unsecured) (refer note a below)
127 53
127 53
Term loans
Foreign currency loan from banks (Unsecured) Libor+1.5% and
Prime + 2%
2018 - 243
Foreign currency loan (Secured) (Refer Note c below) 6.00% to 17.60% 2018 4 5
From others (Unsecured) 5.79% 2017-2018 - 2
4 250
Total non-current borrowings 6,004 5,653
Less: Amount clubbed under “other current financial
liabilities” (Refer Note 16)
(131) (303)
Net non-current borrowings 5,873 5,350
Aggregate secured loans (non-current) 3 4
Aggregate unsecured loans (non-current) 5,870 5,346

Overview
Strategyreview Performance Governance Financials
271
Notes to consolidated financial statements for the year ended March 31, 2018
15. Borrowings INR CroresEffective
interest Rate %Maturity March 31, 2018 March 31, 2017
Current borrowings
Loan from banks
Secured (Refer Note d below) MCLR+50bsp
and 6 months
LIBOR+50bps
2017-2018 65 8
Unsecured:
Working capital loan repayable on demand from banks: CDI + 1.6% to
2.7%, 6 months
LIBOR+05 to 50bps
and 1month
GSEC+5bps,
30 Days T Bill Rate +
0.05%, BANABOR+
1.75%, 9% to 15.87%
2017-2018 556 587
Short term buyers credit LIBOR + 4.95% 2017-2018 - 46
621 641
Liability component of compound financial instrument
Optionally convertible preference shares (unsecured)
(Refer note 12A)
- 24
Others (Unsecured) - (0)
- 24
Discounted trade receivables (Unsecured) 8.5% - 9.5% 2017-2018 13 43
13 43
Total current borrowings 634 708
Aggregate secured loans (current) 65 8
Aggregate unsecured loans (current) 569 700
a. Unsecured redeemable non-convertible debentures (NCD's) i) The borrowings and current maturities of long term borrowings include H49 Crores (March,31 2017: H48 Crores) pertaining to
interest accrued but not due on account of recognition of debentures at amortised cost as per effective interest rate (EIR) method.
ii) NCD's of face value amounting to H300 Crores (March 31, 2017: H300 Crores) have been issued under two series and are redeemable
at par at the end of 10th year H150 Crores i.e June, 2022 and 7th year H150 Crores i.e June, 2019 from the date of allotment. Out of
the above, NCD's amounting to H90 Crores have been bought back by the Company.
iii) NCDs of face value amounting to H250 Crores (March 31, 2017: H250 Crores) are redeemable at par at the end of 15th year i.e July
2026 from the date of allotment . The NCD's carry a call option at the end of 10th year from the date of allotment.
iv) NCD's of face value aggregating to H300 Crores (March 31, 2017:H300 Crores) have been issued under four series and are redeemable
at par of H75 Crores each at the end of 12th year, 11th year, 9th year and 8th year i.e. October 2022, October 2021, October 2019 and
October 2018 respectively from the date of allotment.
v) NCD's mentioned above carry a coupon rate ranging from 10.25% to 10.70%.
b. Bonds (Unsecured) Bonds are listed on Singapore Stock exchange and are recorded at amortised cost.
c. Foreign currency loan from banks (secured) The Group has accounts receivables pledged as collateral for credit assignments with recourse and has machinery, equipment and
vehicles collateralized under financing and finance lease.
d. Loan repayable on demand from Banks (Secured) Outstanding loan is secured by hypothecation of inventories, bills receivables, book debts and all movable assets of the Company both
present and future, wherever situated.
(Contd.)

UPL Limited Annual Report, 2017-18 272
Notes to consolidated financial statements for the year ended March 31, 2018
16. Other financial liabilities INR Crores
Non-current CurrentMarch 31, 2018 March 31, 2017 March 31, 2018 March 31, 2017
Financial liabilities at fair value through profit or loss
Derivative contracts (net) 134 142 41 37
Other financial liabilities carried at amortised cost
Current maturities of long term borrowings (Refer
Note 15)
- - 131 303
Payable towards acquisition of additional stake in
UPL Do Brasil (Refer note: 42)
94 232 27 14
Creditors for capital goods - - 155 38
Interest accrued and not due on borrowings - - 59 103
Unpaid dividend - - 7 6
Trade deposits - - 73 70
Others 4 4 262 231
Total other financial liabilities 232 378 755 802
17. ProvisionsLong term provisions INR Crores
Jubilee Leave benefits Environmental Reorganisation Labour claim Total
At 1 April 2016 1 3 13 1 3 21
Arising during the year - - - - - -
Utilised - (3) (1) (1) - (5)
Foreign currency translation effect (0) - 0 - 0 0
At 31 March 2017 1 - 12 - 3 16
Arising during the year 0 - 1 - 3 4
Utilised (0) - (0) - - (1)
Foreign currency translation effect - - 0 - 0 1
At 31 March 2018 1 - 13 - 6 20
Short term provisions INR CroresLeave benefits Dividend on
CCPS Contingencies Reorganisation Total
At 1 April 2016 68 - 13 2 83
Arising during the year 24 2 - - 26
Utilised (6) - (7) (1) (14)
Foreign currency translation effect (2) - - - (2)
At 31 March 2017 84 2 6 1 93
Arising during the year 8 - - - 8
Utilised (5) (2) - - (7)
Foreign currency translation effect (2) - - - (2)
At 31 March 2018 85 - 6 - 91

Overview
Strategyreview Performance Governance Financials
273
Notes to consolidated financial statements for the year ended March 31, 2018
i) Jubilee Provision: The amount of provision represents the future jubliee expenses which are expected to be paid to the Company's employees when they
reach an employement of 25 and 40 years, based on acturial calculations.
ii) Environmental provision: The Group’s operations are subject to environmental laws and regulations in the jurisdictions in which group operates. Some of these
laws restrict the amount and type of emissions that group’s operations can release into the environment. Group has made necessary
provision required by respective local laws. The out flow of which would depend on the cessation of the respective events.
iii) Reorganization provision: Due to a downward trend and a stronger competition, management has announced a cost reduction plan in some of the geographies
which includes a decrease in headcounts and other costs. The Group made provision in respect of the same and outflow is expected on
cessations of the respective events.
iv) Labour / employee claim provision: Companies in the Group are parties to various lawsuits that are at administrative or judicial level or in their initial stages, involving labour,
tax and civil matters. The Group contest in court all claims and based on the assessment of their legal counsel, record a provision when
the risk of loss is considered probable. The outflow is expected on completion of the respective events.
v) Provision for contingencies : The Group has considered provision for contingencies based on the best estimate of management of possible outflow relating to
customs assessment on imports.
18. Income taxes The major components of income tax expense for the years ended 31 March 2018 and 31 March 2017 are:
Consolidated statement of profit and loss:Profit or loss section INR Crores
March 31, 2018 March 31, 2017
Current income tax:
Current income tax charge 311 293
Adjustments of tax relating to earlier years (79) 5
Deferred tax:
Relating to origination and reversal of temporary differences 43 (109)
Income tax expense reported in the statement of profit or loss 275 189
OCI section
Deferred tax related to items recognised in OCI during the year: INR Crores
March 31, 2018 March 31, 2017
Gain on FVTOCI financial assets and net gain/loss on remeasurement of defined benefit plans. (5) 0
Income tax charged to OCI (5) 0

UPL Limited Annual Report, 2017-18 274
Notes to consolidated financial statements for the year ended March 31, 2018
Reconciliation of tax expense and the accounting profit multiplied by India’s domestic tax rate for 31 March 2017 and 31 March 2018:
INR Crores
March 31, 2018 March 31, 2017
Accounting profit before tax 2,305 1,922
Accounting profit before income tax 2,305 1,922
At India’s statutory income tax rate of 34.608% (31 March 2017: 34.608%) 798 665
Profit taxable at higher/lower/nil tax rates in certain jurisdictions (451) (416)
Investment allowance on new Plant and Machinery - (16)
Additional deduction on expenditure on research and development (7) (15)
Adjustment of tax relating to previous years (144) -
Other tax credits and allowances (38) (27)
Income exempt for tax purpose (22) (35)
Impact of change in tax rates 41 -
Utilisation of previously unrecognised tax losses 1 (15)
Share of results of associates and joint ventures 32 6
Other non-deductible expenses 11 7
Unrecognised deferred tax asset on carry forward losses 74 24
Others (20) 11
At the effective income tax rate of 11.93% (31 March 2017: 9.81%) 275 189
Income tax expense reported in the statement of profit and loss 275 189
11.93% 9.81%
c) Deferred taxDeferred tax relates to the following:
INR Crores
Balance Sheet Statement of profit and lossMarch 31, 2018 March 31, 2017 March 31, 2018 March 31, 2017
Accelerated depreciation for tax purposes (267) (270) (3) (312)
Fair value of derivatives - - - (3)
Unrealised profits on intercompany transactions 185 233 48 (82)
Financial assets impairment - expected credit loss 135 146 11 (19)
Carry forward of tax losses and unabsorbed depreciation 84 131 47 (79)
Leave encashment 25 23 (2) (5)
Minimum alternative tax credit 69 12 (57) 80
Defined benefits obligation - Gratuity 14 7 (7) (5)
Provisions and others 196 219 23 316
Exchange impact - - (17) -
Deferred tax expense/(income) 43 (109)
Net deferred tax assets/(liabilities) 441 501
Reflected in the balance sheet as follows: INR Crores
Balance SheetMarch 31, 2018 March 31, 2017
Deferred tax assets 529 670
Deferred tax liabilities: (88) (169)
Deferred tax liabilities, net 441 501
18. Income taxes (Contd.)

Overview
Strategyreview Performance Governance Financials
275
Notes to consolidated financial statements for the year ended March 31, 2018
Reconciliation of deferred tax liabilities (net): INR Crores
Balance SheetMarch 31, 2018 March 31, 2017
Opening balance as of 1 April 501 390
Tax (expense)/income during the period recognised in statement of profit and loss (43) 109
Tax income/(expense) during the period recognised in OCI (5) 0
Exchange impact (12) 2
Closing balance as at 31 March 441 501
The Group offsets tax assets and liabilities if and only if it has a legally enforceable right to set off current tax assets and current tax liabilities
and the deferred tax assets and deferred tax liabilities relate to income taxes levied by the same tax authority.
The Group has tax losses of H547 Crores (31 March 2017: H375 Crores) that are available for offsetting for period upto ten years against future
taxable profits of the companies in which the losses arose.
Deferred tax assets have not been recognised in respect of these losses as they may not be used to offset taxable profits elsewhere in the
Group, they have arisen in subsidiaries that have been loss-making for some time, and there are no other tax planning opportunities or other
evidence of recoverability in the near future. If the Group were able to recognise all unrecognised deferred tax assets of current year, the profit
would increase by H84 Crores.
The Group has not recognized deferred tax liability with respect to unremitted retained earnings and associated foreign currency translation
reserve with respect to certain of its subsidiaries and joint ventures where the Group is in a position to control the timing of the distribution
of profits and it is probable that the subsidiaries and joint ventures will not distribute the profits in the foreseeable future.
The temporary differences associated with investments in subsidiaries, associate and joint venture, for which a deferred tax liability has not
been recognised.
Pursuant to the completion of assessments for the past years, the Holding Company has written back an excess provision of tax and recognised
minimum alternate tax credit entitlement relating to earlier periods aggregating to H146 Crores for the year ended 31st March 2018. Further
due to US Tax Reforms, Tax rate in US reduced from 36% to 25%, accordingly the Group has recognised appropriate effect on Defered Tax
Assets.
18. Income taxes (Contd.)
19. Trade payables INR Crores
Non CurrentMarch 31, 2018 March 31, 2017
Trade payables - 10
- 10
20. Other current liabilities INR Crores
Non CurrentMarch 31, 2018 March 31, 2017
Advances against orders 214 284
Statutory liabilities 143 130
Total other current liabilities 357 414
INR Crores
CurrentMarch 31, 2018 March 31, 2017
Trade payables 5,675 4,875
5,675 4,875
Terms and conditions of the above financial liabilities:
-Trade payables are non-interest bearing and are normally settled on 90-360 days terms
-For explanations on Group's Credit risk management process. Refer note 47

UPL Limited Annual Report, 2017-18 276
Notes to consolidated financial statements for the year ended March 31, 2018
21. Revenue from operations INR Crores
March 31, 2018 March 31, 2017
Sale of products (including excise duty) 17,244 16,422
Sale of services
Job-work / Service income 25 21
Other operating revenues
Export incentives 102 100
Refund of statutory receivables 22 49
Royalty income 1 17
Excess provisions in respect of earlier years written back (net) 57 40
Miscellaneous receipts 55 31
Total Revenue from operations 17,506 16,680
The Government of India introduced the Goods and Services Tax (GST) with effect from 1st July 2017, consequently revenue from operations
for the period from July 31, 2017 upto March 31, 2018 is net of GST. However revenue for the quarter ended 30th June 2017 included in the
year ended March 31, 2018 and for the year ended March 31, 2017 is inclusive of excise duty. The Net Revenue from Operations (Net of GST/
Excise Duty) as applicable are stated below:
22. Other income INR Crores
March 31, 2018 March 31, 2017
Interest income on
Bank deposits - 2
Loans and others 132 148
Unwinding of interest on trade receivable 282 249
Other non-operating income
Profit on sale of current and non current investments (net) (7) 12
Fair value gain on financial instruments at fair value through profit or loss - 12
Rent received 2 2
Profit on sale of property,plant and equipment (net) 2 13
Sundry credit balances written back (net) - 2
Miscellaneous income 3 4
Total 414 444
INR Crores
March 31, 2018 March 31, 2017
Revenue from operations 17,506 16,680
Less: Excise Duty (128) (368)
Net Revenue from operations 17,378 16,312

Overview
Strategyreview Performance Governance Financials
277
Notes to consolidated financial statements for the year ended March 31, 2018
23. Employee benefits expense INR Crores
March 31, 2018 March 31, 2017
Salaries, wages and bonus 1,556 1,493
Contribution to provident and other funds (Refer note 35) 34 30
Share based payments to employees (Refer note 36) - 0
Gratuity and other retirement benefits (Refer note 35) 11 11
Staff welfare expenses 112 93
Total 1,713 1,627
24 . Finance costs INR Crores
March 31, 2018 March 31, 2017
Interest:
- On Debentures 81 81
- On Term Loans 209 163
- On Cash Credit and Working Capital Demand Loan Accounts 126 175
- On Fixed Deposits and Fixed Loans 5 5
- On Others 55 79
Exchange difference (net) 145 109
Unwinding of interest on trade payables 113 84
Loss on derivatives Instruments (8) (47)
Other financial charges 57 86
Total 783 735
25. Depreciation and amortization expense INR Crores
March 31, 2018 March 31, 2017
Depreciation of property, plant and equipment 343 306
Amortization of intangible assets 332 366
Total 675 672
26. Other expense INR Crores
March 31, 2018 March 31, 2017
Power and fuel 291 339
Transport charges 661 636
Sub-contracting expenses 741 533
Travelling and conveyance 256 254
Exchange difference (net) 11 238
Advertising and sales promotion 229 276
Legal and professional fees 269 243
Sales commission 213 130
Rent (Refer note: 37) 153 142
Labour charges 138 121
Repairs and maintenance

UPL Limited Annual Report, 2017-18 278
Notes to consolidated financial statements for the year ended March 31, 2018
27. Exceptional items INR Crores
March 31, 2018 March 31, 2017
Restructuring/reorganisation cost (Refer note a below) 29 37
Product contamination and counterfeiting (Refer note b below) 13 7
Inventory provision (Refer note c below) - 18
Amount payable as stamp duty on merger with Advanta - 32
Amount payable on settlement of a contract in respect of earlier years - 14
Profit on sale of subsidiary - (27)
Towards Competition Comission of India (Refer note d below) 7 -
Others 14 -
Total 63 81
a) Restructuring/reorganisation costs incurred by the Group are for Latin American regions.
b) During the year, the Group incurred an amount of H13 Crores (March 31, 2017: H7 Crores) towards legal expenses for pursuing legal
actions against companies and individuals alleged to be counterfeiting its products and agricultural pesticide's financial fines.
c) During the previous year, one of the subsidiaries of Group has recognised provision for inventory for an amount of HNil (March 31, 2017:
H18 Crores) due to uncertainty and unfavourable market conditions.
d) The Competition Commission of India (CCI) had levied a penalty of H252 Crores on the Company for alleged violation of section 3(3)
(b) and 3(3) (d) of the Competition Act 2002. The order of the CCI was challenged before the Competition Appellate Tribunal (COMPAT)
which by its order dated 29th October, 2013 has reduced the penalty to H7 Crores and the same has been confirmed by the Hon'ble
Supreme Court in its order.
26. Other expense INR Crores
March 31, 2018 March 31, 2017
Plant and machinery 81 78
Buildings 12 11
Others 108 93
Effluent disposal charges 99 104
Consumption of stores and spares 83 84
Rates and taxes 76 77
Warehousing costs 119 90
Insurance 69 66
Registration charges 70 66
Allowances for doubtful debts and advances (net) 17 (4)
Communication costs 42 37
Royalty charges 43 22
Bad debts / advances written off 2 16
Charity and donations [(includes H22 Crores (31 March 2017: H25 Crores) paid to Satya
Electoral Trust for political purpose)]
53 53
Assets written off 10 5
Sundry credit balances written off (net) 15 -
Research and development expenses 19 23
Other expenses 168 151
Total 4,048 3,884
(Contd.)

Overview
Strategyreview Performance Governance Financials
279
Notes to consolidated financial statements for the year ended March 31, 2018
28. Components of Other Comprehensive Income (OCI), net of taxThe disaggregation of changes to OCI by each type of reserve in equity is shown below:
INR Crores
During the year ended 31 March 2018 Attributable to the owners of the parent Attributable to non
controlling interest
TotalFVTOCI reserve
Foreign currency
translation reserve
Retained earnings
Foreign exchange translation differences - 67 - - 67
Gain/(loss) on FVTOCI financial assets 10 - - - 10
Re-measurement gains/(losses) on defined benefit plans - - (7) - (7)
Total 10 67 (7) - 70
During the year ended 31 March 2017
INR Crores
Attributable to the owners of the parent Attributable to non
controlling interest
TotalFVTOCI reserve
Foreign currency
translation reserve
Retained earnings
Foreign exchange translation differences - - - - -
Gain/(loss) on FVTOCI financial assets 22 - - - 22
Re-measurement gains/(losses) on defined benefit plans - - 1 - 1
Total 22 - 1 - 23
Analysis of items of OCI, net of tax Foreign exchange translation differences
These comprise of all exchange differences arising from translation of financial statements of foreign operations as well as translation of
liabilities that hedge the company's net investment in a foreign subsidiary.
Gain/(loss) on FVTOCI financial assetsThe group has elected to recognise changes in fair value of certain investments in equity securities in other comprehensive income. These
changes are accumulated within the FVOCI equity investments within the equity. The group transfers amount therefrom to retained earnings
when the relevant equity securities are derecognized.
Re-measurement gains/(losses) on defined benefit plansRemeasurement of defined benefit plans comprises acturial gains and losses and return on plan assets (excluding interest income).
29. Earnings per share (EPS) INR Crores
March 31, 2018 March 31, 2017
Profit attributable to Equity holders of the parent: 2,022 1,727
Profit attributable to Equity holders of the parent for basic earnings per share 2,022 1,727
Interest on convertible preference shares - -
Profit attributable to Equity holders of the parent adjusted for the effect of dilution 2,022 1,727
INR Crores
March 31, 2018 March 31, 2017
Weighted average number of Equity shares for basic EPS* 50,82,06,912 50,70,17,118
Effect of dilution:
Employee stock options 91,176 75,973
Convertible preference shares - 22,62,904
Weighted average number of Equity shares adjusted for the effect of dilution * 50,82,98,088 50,93,55,995
Earnings per equity share ( in INR)
Basic (Face value of H2 each) 39.79 34.07
Diluted (Face value of H2 each) 39.78 33.92
* There have been no other transactions involving Equity shares or potential Equity shares between the reporting date and the date of
authorisation of these financial statements.

UPL Limited Annual Report, 2017-18 280
30. Amalgamation with Advanta Limited
The Hon'ble High Court of Gujarat vide its order dated 23rd June, 2016 had sanctioned the Scheme of Amalgamation of Advanta Limited, a
subsidiary with the Company with an appointed date of 1st April, 2015. The Scheme had become effective on 20th July, 2016, pursuant to its
filing with Registrar of Companies
In accordance with the provisions of the aforesaid scheme the Company had in prior year accounted for the amalgamation under the
"Purchase Method" as prescribed by the Accounting Standard 14 - Accounting for Amalgamations, which is different from Ind AS 103
"Business Combinations". Accordingly the accounting treatment had been given as under:
(i) The assets and liabilities of Advanta Limited as at 1 April 2015 have been incorporated at their book values in the financial statements
of the Company.
(ii) All inter-corporate balances and obligations (including investments held by the Company in Advanta Limited, deposits, loans and
advances, outstanding balances or other obligations) between the Company and Advanta Limited stood cancelled.
b. The excess of fair value of equity shares and preference shares over the book value of assets and liabilities transferred and cancellation of
Investments in Advanta held by the Company amounting to H3,697 Crores has been recorded as goodwill arising on amalgamation.
c. Consideration for amalgamation discharged by way of issuance of new Equity Shares has been recorded at fair value and Preference
Shares had been recorded at face value. As the shares had been allotted subsequent to the March 31, 2016, the same had been disclosed
under Share Capital Suspense account till the date of allotment.
d. In accordance with scheme, the goodwill recorded on amalgamation is being amortised and the Company has estimated its useful life
of 10 years. Accordingly, amortisation for the year amounting to H370 Crores (31 March, 2017: H370 Crores) had been recognised in the
statement of profit and loss.
Book value of assets and liabilities acquired from Advanta Limited are as under: INR Crores
Assets
Non Current Assets 645
Current Assets 81
Total Assets (A) 726
Liabilities
Non-Current Liabilities 6
Current Liabilities 86
Total Liabilities (B) 92
Net Assets taken over (C)=(A-B) 634
Cancellation of Investments in Advanta Limited held by the Company (D) 539
Purchase consideration (E) 3,797
Less: Other adjustments (F) (5)
Goodwill on amalgamation (G)=(E-F-C+D) 3,697
Notes to consolidated financial statements for the year ended March 31, 2018

Overview
Strategyreview Performance Governance Financials
281
Sr No
Name Principal activities Country of incorporation/Principal place of business
% Controlling Interest
31-Mar-18 31-Mar-17
1 Shroffs United Chemicals Limited Crop protection India 100% 100%
2 SWAL Corporation Limited Crop protection India 100% 100%
3 United Phosphorus (India) LLP Crop protection India 100% 100%
4 United Phosphorus Global LLP Crop protection India 100% 100%
5 Optima Farm Solutions Limited Crop protection India 100% 100%
6 UPL Europe Limited Crop protection United Kingdom 100% 100%
7 UPL Deutschland GmbH Crop protection Germany 100% 100%
8 UPL Polska Sp z.o.o. Crop protection Poland 100% 100%
9 UPL Benelux B.V. Crop protection Netherlands 100% 100%
10 Cerexagri B.V. Crop protection Netherlands 100% 100%
11 Blue Star B.V. Crop protection Netherlands 100% 100%
12 United Phosphorus Holdings Cooperatief U.A. Crop protection Netherlands 100% 100%
13 United Phosphorus Holdings B.V. Crop protection Netherlands 100% 100%
14 Decco Worldwide Post-Harvest Holdings Cooperatief U.A.
Crop protection Netherlands 100% 100%
15 Decco Worldwide Post-Harvest Holdings B.V. Crop protection Netherlands 100% 100%
16 United Phosphorus Holding, Brazil B.V. Crop protection Netherlands 100% 100%
17 UPL Italia S.R.L. Crop protection Italy 100% 100%
18 UPL Iberia, S.A. Crop protection Spain 100% 100%
19 Decco Iberica Postcosecha, S.A.U. Crop protection Spain 100% 100%
20 Transterra Invest, S. L. U. Crop protection Spain 100% 100%
21 Cerexagri S.A.S. Crop protection France 100% 100%
22 Neo-Fog S.A. Crop protection France 100% 100%
23 UPL France Crop protection France 100% 100%
24 United Phosphorus Switzerland Limited Crop protection Switzerland 100% 100%
25 Agrodan, ApS Crop protection Denmark 100% 100%
26 Decco Italia SRL Crop protection Italy 100% 100%
27 Limited Liability Company "UPL" Crop protection Russia 100% 100%
28 Decco Portugal Post Harvest, Unipessoal LDA (formerly known as UPL Portugal Unipessoal LDA)
Crop protection Portugal 100% 100%
29 United Phosphorus Inc. Crop protection USA 100% 100%
30 UPI Finance LLC Crop protection USA 100% 100%
31 Cerexagri, Inc. (PA) Crop protection USA 100% 100%
32 UPL Delaware, Inc. Crop protection USA 100% 100%
33 Canegrass LLC Crop protection USA 70% 70%
34 Decco US Post-Harvest Inc Crop protection USA 100% 100%
35 RiceCo LLC Crop protection USA 100% 100%
36 Riceco International, Inc. Crop protection Bahamas 100% 100%
37 UPL Corporation Limited Crop protection Mauritius 100% 100%
31. Group information
Information about subsidiaries The consolidated financial statements of the Group includes subsidiaries listed in the table below:
Notes to consolidated financial statements for the year ended March 31, 2018

UPL Limited Annual Report, 2017-18 282
Sr No
Name Principal activities Country of incorporation/Principal place of business
% Controlling Interest
31-Mar-18 31-Mar-17
38 UPL Limited Crop protection Mauritius # 100% 100%
39 UPL Management DMCC Crop protection United Arab Emirates
100% 100%
40 UPL Limited Crop protection Gibraltar 100% 100%
41 UPL Agro S.A. de C.V. Crop protection Mexico 100% 100%
42 Decco Jifkins Mexico Sapi Crop protection Mexico 100% 100%
43 United Phosphorus do Brasil Ltda Crop protection Brazil #2 - 100%
44 Uniphos Industria e Comercio de Produtos Quimicos Ltda.
Crop protection Brazil 100% 100%
45 Upl do Brasil Industria e Comércio de Insumos Agropecuários S.A.
Crop protection Brazil 100% 100%
46 UPL Costa Rica S.A. Crop protection Costa Rica 100% 100%
47 UPL Bolivia S.R.L Crop protection Bolivia 100% 100%
48 UPL Paraguay S.A. Crop protection Paraguay 100% 100%
49 Icona Sanluis S.A. Crop protection Argentina 100% 100%
50 DVA Technology Argentina S.A. Crop protection Argentina 100% 100%
51 UPL Argentina S A Crop protection Argentina 100% 100%
52 Decco Chile SpA Crop protection Chile 100% 100%
53 UPL Colombia SAS Crop protection Colombia 100% 100%
54 United Phosphorus Cayman Limited Crop protection Cayman Islands 100% 100%
55 UP Aviation Limited Crop protection Cayman Islands 100% 100%
56 UPL Australia Limited Crop protection Australia 100% 100%
57 UPL New Zealand Limited Crop protection New Zealand 100% 100%
58 UPL Shanghai Limited Crop protection China 100% 100%
59 UPL Limited (Korea) Crop protection Korea 100% 100%
60 PT.UPL Indonesia Crop protection Indonesia 100% 100%
61 PT Catur Agrodaya Mandiri Crop protection Indonesia 100% 100%
62 UPL Limited Crop protection Hong Kong 100% 100%
63 UPL Philippines Inc. Crop protection Philippines 100% 100%
64 UPL Vietnam Co. Limited Crop protection Vietnam 100% 100%
65 UPL Limited, Japan Crop protection Japan 100% 100%
66 Anning Decco Fine Chemical Co. Limited Crop protection China 55% 55%
67 UPL Ziraat Ve Kimya Sanayi Ve Ticaret Limited Sirketi
Crop protection Turkey 100% 100%
68 UPL Agromed Tarim Ilaclari ve Tohumculuk Sanayi ve Ticaret A.S.
Crop protection Turkey #3 100% 51%
69 Safepack Products Limited Crop protection Israel 100% 100%
70 Citrashine (Pty) Ltd Crop protection South Africa 100% 100%
71 UPL Africa SARL Crop protection Senegal #1 - 100%
72 Prolong Limited Crop protection Israel #4 100% 50%
73 Perrey Participações S.A Crop protection Brazil 100% 100%
74 Agrinet Solutions Limited Crop protection India 50% 50%
31. Group information (Contd.)
Notes to consolidated financial statements for the year ended March 31, 2018

Overview
Strategyreview Performance Governance Financials
283
Sr No
Name Principal activities Country of incorporation/Principal place of business
% Controlling Interest
31-Mar-18 31-Mar-17
75 Advanta Netherlands Holding B.V. Seed Business Netherlands 100% 100%
76 Advanta Semillas SAIC Seed Business Argentina 100% 100%
77 Advanta Holdings B.V. Seed Business Netherlands 100% 100%
78 Advanta Seeds International Seed Business Mauritius 100% 100%
79 Pacific Seeds Holdings (Thailand) Limited Seed Business Thailand 100% 100%
80 Pacific Seeds (Thai) Limited Seed Business Thailand 100% 100%
81 Advanta Seeds Pty Ltd Seed Business Australia 100% 100%
82 Advanta US LLC (formerly known as Advanta US Inc.)
Seed Business USA 100% 100%
83 Advanta Comercio De Sementes LTDA. Seed Business Brazil 100% 100%
84 PT Advanta Seeds Indonesia Seed Business Indonesia 100% 100%
85 Advanta Seeds DMCC Seed Business United Arab Emirates
100% 100%
86 Essentiv LCC Crop protection USA @2 50% 50%
87 UPL Agro Limited Mauritius Crop protection Mauritius @1 100% -
88 UPL Jiangsu Limited Crop protection China @ 70% -
89 Riceco International Bangladesh Ltd Crop protection Bangladesh @1 100% -
90 Uniphos Malaysia Sdn Bhd Crop protection Malaysia @1 100% -
91 Advanta Seeds Ukraine LLC Seed Business Ukraine @2 100% 100%
@ Subsidiary formed during the year
@1 Subsidiary acquired during the year
@2 Subsidiary formed during the previous year
# During the year UPL Limited, Mauritius merged in UPL Corporation Limited, Mauritius.
#1 Subsidiary divested during the year.
#2 During the previous year United Phosphorus do Brasil Ltda was merged in Upl do Brasil Industria e Comércio de Insumos Agropecuários
S.A.
#3 During the year, the Group through its step down wholly owned subsidiary, has increased its stake from 51% to 100%
#4 During the year, the Group through its step down wholly owned subsidiary, has increased its stake from 50% to 100%
31. Group information (Contd.)
Notes to consolidated financial statements for the year ended March 31, 2018

UPL Limited Annual Report, 2017-18 284
Notes to consolidated financial statements for the year ended March 31, 2018
AssociatesThe Group's interest in associates are summarised below
Sr No
Name Country of incorporation/Principal place of business
% equity interest
31-Mar-18 31-Mar-17
1 Weather Risk Management Private Ltd India $$ 27% 27%
2 Ingen Technologies Private Limited India $$ * *
3 Kerala Enviro Infrastructure Limited India 28% 28%
4 Polycoat Technologies 2010 Limited Israel 20% 20%
5 3SB Produtos Agricolas S.A. Brazil # 49% 40%
6 Sinagro Produtos Agropecuarios S.A. Brazil # 49% 40%
7 Seara Comercial Agricola Ltda. Brazil ** **
8 Serra Bonita Sementes S.A. Brazil $ 33% ***
9 Bioplanta Nutricao Vegetal,Industria e
Comercio S.A.
Brazil *** ***
10 Chemisynth (Vapi) Limited India 30% 30%
11 Universal Pestochem (Industries) Limited India 44% 44%
$ Investment during the year
* This is 100% step-down subsidiary of Weather Risk Management Private Ltd.
** This is 51% step-down subsidiary of Sinagro Produtos Agropecuarios S.A.
*** These are 33.33% Joint ventures of Sinagro Produtos Agropecuarios S.A.
$$ Investment made during the previous year ended 2016-17
# Additional 9% stake acquired during the year
Joint arrangement in which the group is a venturer
The Group's interest in joint ventures is summarised below
Sr No
Name Country of incorporation/Principal place of business
% equity interest
31-Mar-18 31-Mar-17
1 Hodagaya UPL Co. Limited Japan 40% 40%
2 Longreach Plant Breeders Management Pty
Limited
Australia 70% 70%
3 United Phosphorus (Bangladesh) Limited Bangladesh 50% 50%
31. Group information (Contd.)

Overview
Strategyreview Performance Governance Financials
285
Notes to consolidated financial statements for the year ended March 31, 2018
INR Crores
Name Country of incorporation /Principal
place of business
March 31, 2018 March 31, 2017
Canegrass LLC (Canegrass) USA 30% 30%
Anning Decco Fine Chemical Co. Limited (Anning Decco) China 45% 45%
UPL Agromed Tarim Ilaclari ve Tohumculuk Sanayi ve Ticaret A.S. Turkey - 49%
Information regarding non-controlling interest
INR Crores
Particulars March 31, 2018 March 31, 2017
Accumulated balances of material non-controlling interest:
Canegrass LLC 16 12
Anning Decco Fine Chemical Co. Limited 12 10
UPL Agromed Tarim Ilaclari ve Tohumculuk Sanayi ve Ticaret A.S. - 13
INR Crores
Particulars March 31, 2018 March 31, 2017
Profit/(loss) allocated to material non-controlling interest:
Canegrass LLC 17 12
Anning Decco Fine Chemical Co. Limited 0 2
UPL Agromed Tarim Ilaclari ve Tohumculuk Sanayi ve Ticaret A.S. - (3)
The summarised information of these subsidiaries are provided below. The information is based on amounts before inter company eliminations
Summarised statement of profit or loss for the year ended 31 March 2018: INR Crores
Particulars Canegrass LLC Anning Decco
Revenue 107 21
Cost of raw material and components consumed (51) 15
Other expenses (0) (35)
Finance costs - (1)
Profit before tax 57 0
Income tax - (0)
Profit for the year from continuing operations 57 0
Total comprehensive income 57 0
Attributable to non-controlling interests 17 0
Dividends paid to non-controlling interests - -
32. Material partly owned subsidiaries
Financial information of subsidiaries that have material non-controlling interests is provided below:
Proportion of equity interest held by non-controlling interests (NCI):

UPL Limited Annual Report, 2017-18 286
Notes to consolidated financial statements for the year ended March 31, 2018
Summarised statement of profit or loss for the year ended 31 March 2017: INR Crores
Particulars Canegrass LLC Anning Decco UPL Agromed
Revenue 79 25 89
Cost of raw material and components consumed (40) 15 (66)
Other expenses (0) (36) (29)
Finance costs (0) 1 (1)
Profit before tax 39 5 (7)
Income tax (1) 1
Profit for the year from continuing operations 39 4 (6)
Total comprehensive income 39 4 (6)
Attributable to non-controlling interests 12 2 (3)
Dividends paid to non-controlling interests 12 - -
Summarised balance sheet as at 31 March 2017: INR Crores
Particulars Canegrass LLC Anning Decco UPL Agromed
Current Assets 70 23 114
Non-current Assets - 2 7
Current Liabilities (32) (2) (95)
Non-current Liabilities - - (0)
Total equity 38 23 26
Attributable to:
Equity holders of parent 26 13 13
Non-controlling interest 12 10 13
32. Material partly owned subsidiaries (Contd.)
Summarised balance sheet as at 31 March 2018: INR Crores
Particulars Canegrass LLC Anning Decco
Current Assets 86 25
Non-current Assets - 3
Current Liabilities (32) (2)
Non-current Liabilities (0) -
Total equity 54 26
Attributable to:
Equity holders of parent 38 14
Non-controlling interest 16 12
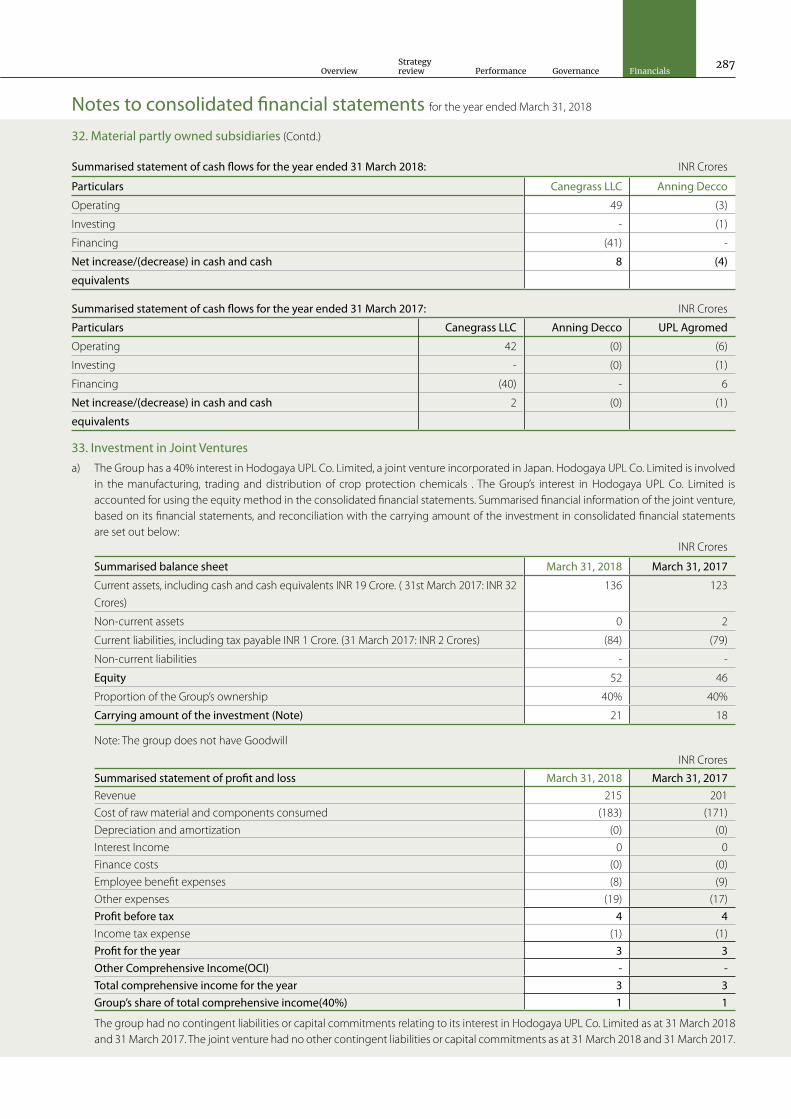
Overview
Strategyreview Performance Governance Financials
287
Notes to consolidated financial statements for the year ended March 31, 2018
Summarised statement of cash flows for the year ended 31 March 2017: INR Crores
Particulars Canegrass LLC Anning Decco UPL Agromed
Operating 42 (0) (6)
Investing - (0) (1)
Financing (40) - 6
Net increase/(decrease) in cash and cash 2 (0) (1)
equivalents
32. Material partly owned subsidiaries (Contd.)
Summarised statement of cash flows for the year ended 31 March 2018: INR Crores
Particulars Canegrass LLC Anning Decco
Operating 49 (3)
Investing - (1)
Financing (41) -
Net increase/(decrease) in cash and cash 8 (4)
equivalents
33. Investment in Joint Venturesa) The Group has a 40% interest in Hodogaya UPL Co. Limited, a joint venture incorporated in Japan. Hodogaya UPL Co. Limited is involved
in the manufacturing, trading and distribution of crop protection chemicals . The Group’s interest in Hodogaya UPL Co. Limited is accounted for using the equity method in the consolidated financial statements. Summarised financial information of the joint venture, based on its financial statements, and reconciliation with the carrying amount of the investment in consolidated financial statements are set out below:
INR Crores
Summarised balance sheet March 31, 2018 March 31, 2017
Current assets, including cash and cash equivalents INR 19 Crore. ( 31st March 2017: INR 32
Crores)
136 123
Non-current assets 0 2
Current liabilities, including tax payable INR 1 Crore. (31 March 2017: INR 2 Crores) (84) (79)
Non-current liabilities - -
Equity 52 46
Proportion of the Group’s ownership 40% 40%
Carrying amount of the investment (Note) 21 18
Note: The group does not have Goodwill
INR Crores
Summarised statement of profit and loss March 31, 2018 March 31, 2017Revenue 215 201
Cost of raw material and components consumed (183) (171)
Depreciation and amortization (0) (0)
Interest Income 0 0
Finance costs (0) (0)
Employee benefit expenses (8) (9)
Other expenses (19) (17)
Profit before tax 4 4 Income tax expense (1) (1)
Profit for the year 3 3 Other Comprehensive Income(OCI) - - Total comprehensive income for the year 3 3 Group’s share of total comprehensive income(40%) 1 1
The group had no contingent liabilities or capital commitments relating to its interest in Hodogaya UPL Co. Limited as at 31 March 2018 and 31 March 2017. The joint venture had no other contingent liabilities or capital commitments as at 31 March 2018 and 31 March 2017.

UPL Limited Annual Report, 2017-18 288
Notes to consolidated financial statements for the year ended March 31, 2018
33. Investment in Joint Ventures (Contd.)
b) The Group has a 70 % interest in Longreach Plant Breeders Management Pty Limited, a joint venture incorporated in Australia. Longreach
Plant Breeders Management Pty Limited is involved in the development of wheat seeds. The Group’s interest in Longreach Plant Breeders
Management Pty Limited is accounted for using the equity method in the consolidated financial statements. Summarised financial
information of the joint venture, based on its financial statements, and reconciliation with the carrying amount of the investment in
consolidated financial statements are set out below:
INR Crores
Summarised balance sheet March 31, 2018 March 31, 2017
Current assets including cash and cash equivalents INR 5 Crores. ( 31st March 2017: INR 5
Crores)
68 72
Non-current assets 46 43
Current liabilities (80) (95)
Non-current liabilities (0) (1)
Equity 34 19
Proportion of the Group’s ownership 70% 70%
Carrying amount of the investment before Goodwill 24 13
Add: Goodwill 18 18
Carrying amount of the investment 42 31
INR Crores
Summarised statement of profit and loss March 31, 2018 March 31, 2017
Revenue 48 32
Cost of raw material and components consumed - -
Depreciation and amortization (4) (12)
Finance costs (5) (5)
Employee benefit expenses (5) (5)
Other expenses (16) (11)
Profit before tax 19 (1)
Income tax expense (4) 2
Profit for the year 15 1
Other Comprehensive Income(OCI) - -
Total comprehensive income for the year 15 1
Group’s share of total comprehensive income(70%) 11 1
The group had no contingent liabilities or capital commitments relating to its interest in Longreach Plant Breeders Management Pty
Limited as at 31 March 2018 and 31 March 2017. The joint venture had no other contingent liabilities or capital commitments as at 31
March 2018 and 31 March 2017.
In the years ended 31 March 2018 and 31 March 2017, the group did not received dividends from any of its Joint Ventures.
The group also has interest in an immaterial Joint Venture United Phosphorous (Bangladesh) Limited.

Overview
Strategyreview Performance Governance Financials
289
Notes to consolidated financial statements for the year ended March 31, 2018
34. Investment in Associates
a) The Group has a 27.52% interest in Kerala Enviro Infrastructure Limited, which is involved in the business of management of hazardous
waste. Kerala Enviro Infrastructure Limited is a private entity that is not listed on any public exchange. The Group’s interest in Kerala
Enviro Infrastructure Limited is accounted for using the equity method in the consolidated financial statements. The following table
summarises the financial information of Kerala Enviro Infrastructure Limited as included in its own financial statements, adjusted for
fair value adjustments at acquisition and differences in accounting policies. The following table illustrates the summarised financial
information of the Group’s investment in Kerala Enviro Infrastructure Limited:
INR Crores
Summarised balance sheet March 31, 2018 March 31, 2017
Current assets 15 10
Non-current assets 11 11
Current liabilities (3) (1)
Non-current liabilities (11) (10)
Equity 12 10
Proportion of the Group’s ownership 28% 28%
Carrying amount of the investment 3 3
INR Crores
Summarised balance sheet March 31, 2018 March 31, 2017
Current assets 244 268
Non-current assets 281 216
Current liabilities (375) (342)
Non-current liabilities (91) (111)
Equity 59 31
Proportion of the Group’s ownership 49% 40%
Carrying amount of the investment excluding Goodwill 29 12
Goodwill 73 64
Additional investment during Jan-March'18 0 -
Carrying amount of the investment 102 76
INR Crores
Summarised statement of profit and loss March 31, 2018 March 31, 2017Revenue 14 9
Profit for the year 2 (4)
Other Comprehensive Income (OCI) - -
Total comprehensive income for the year 2 (4)
Group’s share of profit for the year 1 (1)
Contingent Liability not provided for H1.55 Crores (Previous Year HNil) for the appeals pending with Income tax for the AY 2015-16
b) The Group has a 49 % (31st March 2017: 40%) interest in 3SB Produtos Agropecuarios S.A., which is involved in business of planting,cultivation and commericialization of agriculture products. 3SB Produtos Agropecuarios S.A. is a private entity that is not listed on any public exchange. The Group’s interest in 3SB Produtos Agropecuarios S.A. is accounted for using the equity method in the consolidated financial statements. The following table summarises the financial information of 3SB Produtos Agropecuarios S.A. as included in its own financial statements, adjusted for fair value adjustments at acquisition and differences in accounting policies.

UPL Limited Annual Report, 2017-18 290
INR Crores
Summarised statement of profit and loss March 31, 2018 March 31, 2017Revenue 408 325
Profit for the year (7) (89)
Other Comprehensive Income (OCI) - -
Total comprehensive income for the year (7) (89)
Group’s share of profit for the year (3) (36)
The associate had no contingent liabilities or capital commitments as at 31 March 2018 and 31 March 2017.
c) The Group has a 49% (31st March 2017: 40%) interest in Sinagro Produtos Agropecuarios S.A., which is involved in the business of retail sales and commercial representation of crop protection chemical and seeds. Sinagro Produtos Agropecuarios S.A. is a private entity that is not listed on any public exchange. The Group’s interest in Sinagro Produtos Agropecuarios S.A. is accounted for using the equity method in the consolidated financial statements. The following table summarises the financial information of Sinagro Produtos Agropecuarios S.A.as included in its own financial statements, adjusted for fair value adjustments at acquisition and differences in accounting policies.
34. Investment in Associates (Contd.)
INR Crores
Summarised balance sheet March 31, 2018 March 31, 2017
Current assets 966 1,377
Non-current assets 382 782
Current liabilities (1,355) (1,643)
Non-current liabilities (153) (467)
Non-controlling interest (12) (18)
Equity (172) 30
Proportion of the Group’s ownership 49% 40%
Carrying amount of the investment excluding Goodwill (84) 12
Goodwill 48 24
Additional investment during Jan-March'18 36 0
Carrying amount of the investment - 36
INR Crores
Summarised statement of profit and loss March 31, 2018 March 31, 2017Revenue 2,011 2,476
Profit for the year (210) 40
Other Comprehensive Income (OCI) - -
Total comprehensive income for the year (210) 40
Group’s share of profit for the year (103) 16
The associate had no contingent liabilities or capital commitments as at 31 March 2018 and 31 March 2017 other than those disclosed in Note 37 of the financials.
d) The Group has a 27.37% interest in Weather Risk Management Services Private Limited, which is grown into a comprehensive Climate Risk Management company. The company has its range of patented producs and services delivered in customized formats to clients ranging from large corporate houses to poor peasants in remotest of villages. In order to deliver these products where they are required, the company has developed its own retail network and handy technologies which have found applications in diverse sectors. Weather Risk Management Services Private Limited also provides environmental consulting services to governments, institutions and corporate houses. The Group’s interest in Weather Risk Management Services Private Limited, is accounted for using the equity method in the consolidated financial statements. The following table summarises the financial information of Weather Risk Management Services Private Limited as included in its own financial statements, adjusted for fair value adjustments at acquisition and differences in accounting policies.
Notes to consolidated financial statements for the year ended March 31, 2018

Overview
Strategyreview Performance Governance Financials
291
34. Investment in Associates (Contd.)
INR Crores
Summarised balance sheet March 31, 2018 March 31, 2017
Current assets 20 12
Non-current assets 21 27
Current liabilities (8) (5)
Non-current liabilities (8) (8)
Non-controlling interest 0 0
Equity 26 26
Proportion of the Group’s ownership 27% 27%
Carrying amount of the investment excluding Goodwill 7 7
Goodwill 3 3
Carrying amount of the investment 10 10
INR Crores
Summarised balance sheet March 31, 2018
Current assets 119
Non-current assets 686
Current liabilities (110)
Non-current liabilities (31)
Non-controlling interest -
Equity 664
Proportion of the Group’s ownership 33%
Carrying amount of the investment excluding Goodwill 221
Goodwill (14)
Carrying amount of the investment 208
INR Crores
Summarised statement of profit and loss March 31, 2018 March 31, 2017Revenue 29 15
Profit for the year (0) (1)
Other Comprehensive Income (OCI) (0) -
Total comprehensive income for the year (0) (1)
Group’s share of profit for the year (0) (0)
The associate had no contingent liabilities or capital commitments as at 31 March 2018 and 31 March 2017.
e) During the year the Group has acquired 33.33% interest in Serra Bonita Sementes S.A, which is mainly engaged in producing certified soy beans & crop seeds, producing soy beans, corn grains, sorghum grains, millet grains & beans.The Group’s interest in Sinagro Produtos Agropecuarios S.A. is accounted for using the equity method in the consolidated financial statements. The following table summarises the financial information of Serra Bonita Sementes S.A. as included in its own financial statements, adjusted for fair value adjustments at acquisition and differences in accounting policies.
INR Crores
Summarised statement of profit and loss March 31, 2018Revenue 174
Profit for the year 2
Other Comprehensive Income (OCI) 0
Total comprehensive income for the year 2
Group’s share of profit for the year 1
The associate had no contingent liabilities or capital commitments as at 31 March 2018.
Notes to consolidated financial statements for the year ended March 31, 2018

UPL Limited Annual Report, 2017-18 292
Notes to consolidated financial statements for the year ended March 31, 2018
35. Net employee defined benefit liabilities INR Crores
March 31, 2018 March 31, 2017
Net employee defined benefit liabilities 73 60
- Gratuity Plan (Note 35 (b) to (g)) 44 35
- Defined benefit pension scheme (Note 35(h)) 29 25
The following tables summarise the components of net benefit expense recognised in the statement of profit or loss and the funded status
and amounts recognised in the balance sheet for the respective plans:
a) The amounts recognised in the statement of Profit and Loss are as follows:(i) Defined Benefit Plan INR Crores
GratuityMarch 31, 2018 March 31, 2017
Current service cost 8 11
Past Service Cost 4 -
Interest cost on benefit obligation 4 3
Expenses recognised in Profit and Loss(under the head Employee Benefit Expenses in Note23)
16 14
Return on plan assets (2) (2)
Net actuarial (gain)/loss recognised during the year (3) (2)
Remeasurements recognised in Other Comprehensive Income(OCI) (5) (4)
Total Expenses recognised in the statement of Profit & Loss 11 10
Actual return on plan assets 2 2
b) The amounts recognised in the Balance Sheet are as follows: INR Crores
Defined Benefit Plan - GratuityMarch 31, 2018 March 31, 2017
Present value of funded obligation 73 63
Less: Fair value of plan assets 29 28
Net Liability 44 35
(ii) Defined Contribution Plan INR Crores
Provident Fund March 31, 2018 March 31, 2017
Current service cost included under the head Employee Benefit Expense in Note 23 16 17
(iii) Defined Contribution Plan INR Crores
Superannuation FundMarch 31, 2018 March 31, 2017
Current service cost included under the head Employee Benefit Expense in Note 23 10 11
(iv) Defined Contribution Plan INR Crores
Pension Fund March 31, 2018 March 31, 2017
Current service cost included under the head Employee Benefit Expense in Note 23 - 1
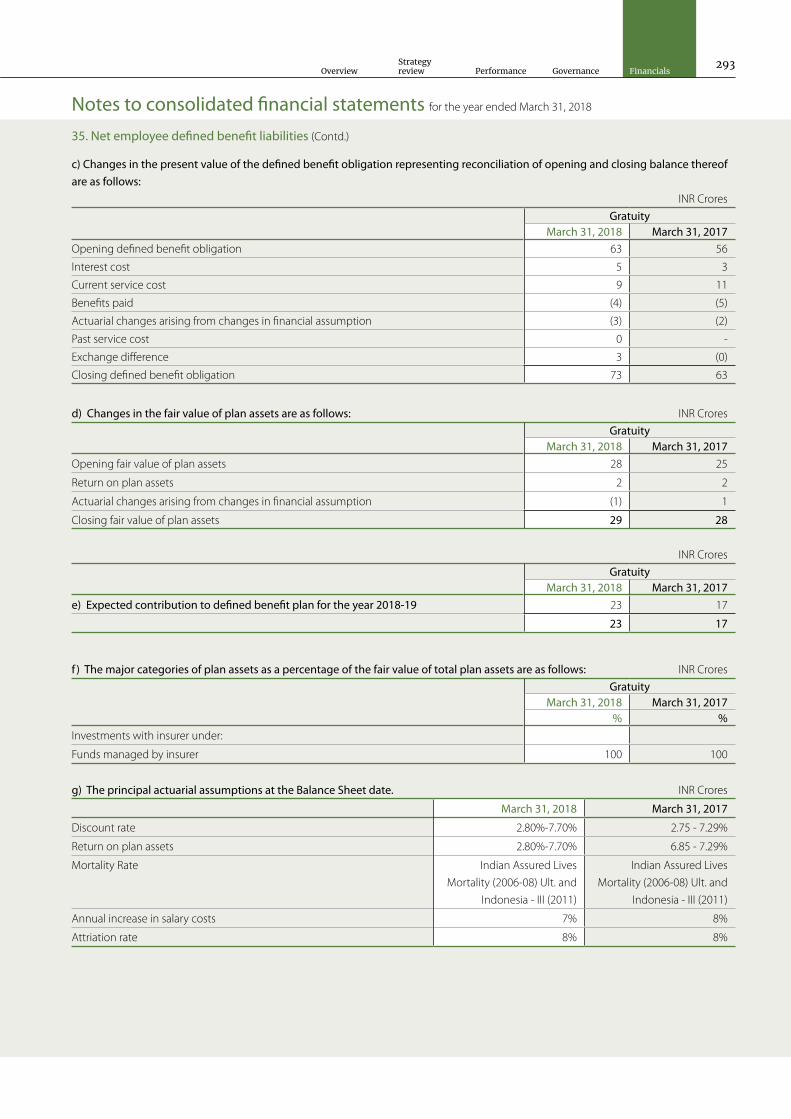
Overview
Strategyreview Performance Governance Financials
293
Notes to consolidated financial statements for the year ended March 31, 2018
c) Changes in the present value of the defined benefit obligation representing reconciliation of opening and closing balance thereof are as follows:
INR Crores
GratuityMarch 31, 2018 March 31, 2017
Opening defined benefit obligation 63 56
Interest cost 5 3
Current service cost 9 11
Benefits paid (4) (5)
Actuarial changes arising from changes in financial assumption (3) (2)
Past service cost 0 -
Exchange difference 3 (0)
Closing defined benefit obligation 73 63
d) Changes in the fair value of plan assets are as follows: INR Crores
GratuityMarch 31, 2018 March 31, 2017
Opening fair value of plan assets 28 25
Return on plan assets 2 2
Actuarial changes arising from changes in financial assumption (1) 1
Closing fair value of plan assets 29 28
f ) The major categories of plan assets as a percentage of the fair value of total plan assets are as follows: INR Crores
GratuityMarch 31, 2018 March 31, 2017
% %Investments with insurer under:
Funds managed by insurer 100 100
g) The principal actuarial assumptions at the Balance Sheet date. INR Crores
March 31, 2018 March 31, 2017
Discount rate 2.80%-7.70% 2.75 - 7.29%
Return on plan assets 2.80%-7.70% 6.85 - 7.29%
Mortality Rate Indian Assured Lives
Mortality (2006-08) Ult. and
Indonesia - III (2011)
Indian Assured Lives
Mortality (2006-08) Ult. and
Indonesia - III (2011)
Annual increase in salary costs 7% 8%
Attriation rate 8% 8%
INR Crores
GratuityMarch 31, 2018 March 31, 2017
e) Expected contribution to defined benefit plan for the year 2018-19 23 17
23 17
35. Net employee defined benefit liabilities (Contd.)

UPL Limited Annual Report, 2017-18 294
Notes to consolidated financial statements for the year ended March 31, 2018
A quantitative sensitivity analysis for significant assumption as at 31 March 2018 is as shown below: INR Crores
Sensitivity Level 1% increase 1% decrease
Impact on defined benefit obligation
Discount rate (2) 4
Future salary increases 4 (2)
Withdrawal rate 1 (0)
The sensitivity analysis above have been determined based on a method that extrapolates the impact on defined benefit obligation as a
result of reasonable changes in key assumptions occurring at the end of the reporting period.
h) Defined benefit pension scheme The Group operates unfunded defined benefit pension scheme in its entities located in France which are limited to retirement indemnities as
applicable in France. The cost of providing benefits is calculated using project unit credit method. The amount recognised as liability for the
year ended 31 March 2018 amounts to H29 Crores (31 March 2017: H25 Crores)
35. Net employee defined benefit liabilities (Contd.)
36. Share based payment
During the year ended March 31, 2018, the following employee stock option plan (ESOPs) were in existence. The relevant details of the
scheme and the grant are as follows:
1a Employees stock option and share plan 2006 The Company instituted an Employees Stock Option Scheme (“ESOPs”) for certain employees as approved by the shareholders on
September 20, 2006 which provides for a grant of 840,000 options (each option convertible into share) to employees.
Particulars March 31, 2018 March 31, 2017
Number of options granted (net of options lapsed) 5,08,390 5,08,390
Method of settlement (Cash/Equity) Equity Equity
Vesting period Spread over 4 years
and 6 months
Spread over 4 years
and 6 months
Excercise period 10 years 10 years
1b The details of the activity have been summarized below
Particulars (No. of equity shares)
March 31, 2018 March 31, 2017
Outstanding at the beginning of the year 52,250 1,88,055
Exercisable at the beginning of the year 52,250 1,12,195
Forfeited during the year - 6,075
Exercised during the year 35,750 89,575
Vested during the year - 69,785
Expired during the year - 40,155
Outstanding at the end of the year 16,500 52,250
Exercisable at the end of the year* 16,500 52,250
Weighted average remaining contractual life (in years) 3.91 4.91
For options excercised during the current period, the weighted average share price at the exercise date was H833 (Mar 31, 2017: H616.48).
1c Stock options granted The Black Scholes valuation model has been used for computing the weighted average fair value considering the following inputs:

Overview
Strategyreview Performance Governance Financials
295
36. Share based payment (Contd.)
Notes to consolidated financial statements for the year ended March 31, 2018
1c Stock options granted
Particulars March 31, 2018 March 31, 2017
Weighted average share price/market price 68.75 68.75
Exercise price (Hper share) 57.00 57.00
Expected volatility 64.49% 64.49%
Life of the options granted (vesting and exercise period) in years Vesting period + 18 months
i.e. 3 years, 4 years, 5 years,
and 6 years, for each Vesting
tranche of 25%
Vesting period + 18 months
i.e. 3 years, 4 years, 5 years,
and 6 years, for each Vesting
tranche of 25%
Expected dividends 0.30% per annum 0.30% per annum
Average risk-free interest rate 8.04% per annum 8.04% per annum
2a Employees stock option plan (ESOP) 2013 The Company instituted an Employees Stock Option Scheme (“ESOPs”) for certain employees as approved by the shareholders on
December 03, 2013 which provides for a grant of 1,300,000 options (each option convertible into shares) to employees.
Particulars March 31, 2017 and March 31, 2018
Dates of grant 30-Jan-14 27-May-14 27-May-14
Dates of board approval 30-Jan-14 27-May-14 27-May-14
Date of shareholders approval 03-Dec-13 03-Dec-13 03-Dec-13
Number of options granted 7,11,752 35,000 35,000
Method of settlement (Cash / Equity) Equity Equity Equity
Vesting period Spread over 4 years
Exercise period 60 months from the date of grant
2b The details of the activity have been summarized below
Particulars (No. of equity shares)
March 31, 2018 March 31, 2017
Outstanding at the beginning of the year 23,723 4,15,792
Exercisable at the beginning of the year 2,814 55,695
Granted during the year - -
Forfeited during the year - 3,19,685
Exercised during the year 9,047 72,384
Vested during the year 19,502 19,503
Expired during the year - -
Outstanding at the end of the year 14,676 23,723
Exercisable at the end of the year* 13,269 2,814
Weighted average remaining contractual life (in years) 1.02 1.95
For options excercised during the current period, the weighted average share price at the exercise date was H703.8 (Mar 31, 2017:
H538.72).

UPL Limited Annual Report, 2017-18 296
Notes to consolidated financial statements for the year ended March 31, 2018
Vesting conditions Grant Date Number of Options
Contractual life of Options
1 year from grant date 25-Jan-18 20,000 4 years
2 years from grant date 25-Jan-18 40,000 5 years
36. Share based payment (Contd.)
2c Stock options granted The Black Scholes valuation model has been used for computing the weighted average fair value considering the following inputs:
Particulars March 31, 2018 March 31, 2017
Weighted average share price/market price (Hper share) 112.81 112.81
Exercise price (Hper share) Grant 1 H103.80 Grant 1 H103.80
Grant 2 H262.75 Grant 2 H262.75
Grant 3 H319.70 Grant 3 H319.70
Expected volatility 49.17% 49.17%
Life of the options grantwed (vesting and exercise period) in years Vesting period + 6
months
Vesting period + 6
months
Expected dividends 0.00% 0.00%
Average risk-free interest rate 8.71% per annum 8.71% per annum
*Eligible Employees holding 1 Option shall be entitled to purchase 1.06 new equity shares as per the scheme of Amalgamation.
3a. Employees stock option plan (ESOP) 2017 The Company instituted an Employees Stock Option Scheme (“ESOPs”) for certain employees as approved by the shareholders on July
08, 2017 which provides for a grant of 2,500,000 options (each option convertible into share) to employees.
Particulars March 31, 2018
Dates of grant 25-Jan-18
Dates of board approval 25-Jan-17
Number of options granted 60,000
Method of settlement (Cash / Equity) Equity
Vesting period Spread over 2 years
Contractual life of Option 5 years
3b The details of the activity have been summarized below
Particulars March 31, 2018 March 31, 2017
Outstanding at the beginning of the year - -
Exercisable at the beginning of the year - -
Granted during the year 60,000 -
Forfeited during the year - -
Exercised during the year - -
Vested during the year - -
Expired during the year - -
Outstanding at the end of the year 60,000 -
Exercisable at the end of the year* - -
Weighted average remaining contractual life (in years) 4.49 -

Overview
Strategyreview Performance Governance Financials
297
Notes to consolidated financial statements for the year ended March 31, 2018
36. Share based payment (Contd.)
3c The Black Scholes valuation model has been used for computing the weighted average fair value considering the following inputs:
Particulars March 31, 2018 March 31, 2017
Weighted average share price/market price (H per share) 824 -
Exercise price (H per share) 784 -
Expected volatility 21.49% -
Life of the options granted (vesting and exercise period) in years 2 to 3.25 years -
Expected dividends - -
Average risk-free interest rate 7.22% per annum -
INR Crores
March 31, 2018 March 31, 2017
Within one year 52 46
After one year but more than five years 125 123
More than five years 27 39
195 208
There is no contingent rent recognised in the consolidated statement of profit and loss.
Finance lease The Group has entered into finance lease arrangements for some of its vehicles and certain equipments. These leasing agreements provide for purchase option after 2 to 3 years. The Group’s obligations under finance leases are secured by the lessor’s title to the leased assets. Future minimum lease payments under finance leases with the present value of the net minimum lease payments are as follows:
b. Commitments INR Crores
March 31, 2018 March 31, 2017
a) Estimated amount of contracts remaining to be executed on capital account and not
provided for (net of advances)
157 145
b) One of the Subsidiaries has entered into an agreement with Syngenta Seeds, Inc. for the resale and distribution of Syngenta branded Seed Corn. It is a Ten Year agreement expiring on 31st August, 2024, in which they must exclusively sell Syngenta brands during the first five years and are committed to minimum sales percentages during the remainder of the contract. As at the balance sheet date the unfulfilled commitment value is H73 Crores.
37. Commitments and contingenciesa. Leases- Operating lease commitments — Company as lesseeLease rent debited to statement of profit and loss is H153 Crores (March 31, 2017: H142 Crores)
The Group has entered into operating lease arrangements for its office premises (including utilities).
Future minimum rentals payable under non-cancellable operating leases as at 31 March are, as follows:
4a Effect of the employee option plan on the Statement of Profit and Loss and on its financial position
Particulars March 31, 2018 March 31, 2017
Total employee compensation cost pertaining to stock option plan 0 0
Liability for employee stock option plan outstanding as at the year end 0 2
*Eligible employees holding 1 Option shall be entitled to purchase 1.06 new equity shares as per the scheme of Amalgamation.
INR Crores
31-Mar-18 31-Mar-17
Minimum lease payments
Present value of MLP
Minimum lease payments
Present value of MLP
Within one year 1 1 5 4
After one year but not more than five years 0 0 1 1
More than five years - - - -
Total minimum lease payments 1 1 6 5
Less: amounts representing finance charges (0) 0 (1) -
Present value of minimum lease payments 1 1 5 5

UPL Limited Annual Report, 2017-18 298
Notes to consolidated financial statements for the year ended March 31, 2018
37. Commitments and contingencies (Contd.)
c. Contingent liabilities INR Crores
March 31, 2018 March 31, 2017
Claims against the company not acknowledged as debts
Disputed Excise Duty / Service Tax Liability 203 173
Disputed Income-tax Liability (excluding interest) 26 26
Disputed Sales-tax Liability 75 60
Disputed Custom duty Liability 34 36
Disputed Fiscal Penalty for cancellation of licenses 33 33
Disputed penalty on water tax - 2
In respect of the above matters, future cash outflows in respect of contingent liabilities are
determinable only on receipt of judgements pending at various forums / authorities.
Disputed penalty levied by Competition Commission of India for Cartelization of prices* - 252
Guarantees given by the Group on behalf of third parties 9 13
Claims against the Group not acknowledged as debts 14 17
Earn out fees 6 5
Aggregate maximum amount payable to growers. 13 9
Group's share of contingent liabilities of associates:
a) Claims against the Associates not acknowledged as debts 23 22
In January 2013, the Group has received a show cause notice from the Directorate of Enforcement, alleging that the Group has contravened
certain provisions of Foreign Exchange Management Act, 1999 with regard to foreign direct investment made/received and its utilisation of
proceeds of FCCB / ECB.
The management of the Group has replied to the show cause notice and had personal hearings to represent their matter and have filed the
written submissions. The matter is pending before the authority and based on internal assessment, the management believes that no liability
would arise in respect of the aforesaid matter.
The Competition Commission of India (CCI) had levied a penalty of H252 crores on the Company for alleged violation of section 3(3) (b) and
3(3) (d) of the Competition Act 2002. The order of the CCI was challenged before the Competition Appellate Tribunal (COMPAT) which by its
order dated 29th October, 2013 has reduced the penalty to H7 crores and the same has been confirmed by the Hon'ble Supreme Court in
its order. During the year ended 31 March 2018, the Company had received notice from CCI to deposit the interest of H4.17 crores for delay
of 40 months in payment as per Regulation 5 of CCI (Manner of Recovery of Monetary Penalty) Regulations, 2011. The Company had filed
their reply to the above notice on 24 October 2017. The Group does not expect the outcome of the proceedings to have a materially adverse
impact on standalone financial statements.
The Group has assessed that it is only possible, but not probable, that outflow of economic resources will be required.
Agrofresh Inc (USA) has filed a litigation against one subsidiary of the Group and the other shareholders of the subsidiary inter alia for
infringement of patents owned by Agrofresh in respect of a product, for loss of profits and for breach of contract .During the year the Group
has provided H1.29 crores towards amounts expected to be paid in this regard being the estimated profits earned from the product till
December 2016.The Group's application for challenging the original patent granted to Agrofresh has been admitted in the US courts.
The Group has filed for dissolution of the subsidary and a counter claim of H16.29 crores has been filed for the proposed dissolution.The
Group understands that this claim, if any, should be against the non controlling interest shareholder and is likely to be rejected in its present
form.While effect is not ascertainable, the Group does not expect this to materially affect its financial statements.
d. Contingent Assets During the year the Group settled its claim of H13.74 Crores against an agrochemicals trader regarding illegal parallel-trading of unauthorised
copies of UPL's product. No gain has been recognised during the year because the receipt of the additional consideration is not virtually
certain as it is dependent on the ability of the party to pay the compensation.

Overview
Strategyreview Performance Governance Financials
299
38. Related Party Disclosures: a) Name of other related parties with whom transactions have taken place during the year. (i) Joint Venture Companies:
United Phosphorus (Bangladesh) Limited
Hodogaya UPL Co. Limited
Longreach Plant Breeders Management Pty Limited
(ii) Associate Companies:
Chemisynth (Vapi) Limited
Kerala Enviro Infrastructure Limited
3SB Produtos Agrícolas S.A. (w.e.f. 29th June 2015)
Sinagro Produtos Agropecuários S.A. (w.e.f. 29th June 2015)
Weather Risk Management Pvt. Ltd
Ingen Technologies Pbt. Ltd
Polycoat Technologies 2010 Limited
Seara Comercial Agricola Ltda.
Serra Bonita Sementes S.A.
Bioplanta Nutricao Vegetal,Industria e Comercio S.A.
Universal Pestochem (Industries) Limited
(iii) Enterprises over which key management personnel and their relatives have significant influence (Other Related Parties): Bharuch Enviro Infrastructure Limited
Bloom Packaging Private Limited
Bloom Seal Containers Private Limited
Daman Ganga Pulp and Papers Private Limited
Demuric Holdings Private Limited
Enviro Technology Limited
Gharpure Engineering and Construction Private Limited
Uniphos Envirotronic Private Limited
JRF International
GC Laboratories
Jai Trust
Nerka Chemicals Private Limited
Pot Plants
Sanguine Holdings Private Limited
Tatva Global Environment Private Limited
Tatva Global Environment (Deonar) Limited
Ultima Search
Uniphos International Limited
Uniphos Enterprises Limited
Uniphos Envirotronic Private Limited
UPL Environmental Engineers Limited
Vikram Farm
Ubania Realty LLP
VJS Investments Limited
Bench Bio Private Limited
Notes to consolidated financial statements for the year ended March 31, 2018

UPL Limited Annual Report, 2017-18 300
38. Related Party Disclosures: (Contd.)
(iv) Key Management Personnel and their relatives :
Whole Time Directors and their relatives
Mr. Rajnikant D. Shroff
Mr. Jaidev R. Shroff *
Mr. Vikram R. Shroff *
Mrs. Sandra R. Shroff *
Mr. Kalyan Banerjee
Mr. Arun C. Ashar
Mrs. Asha Ashar *
Mr. Navin Ashar *
Mr. Hardeep Singh
Mr. Vasant Gandhi
Mr. Pradeep Goyal
Mr. Vinod Sethi
Dr. Reena Ramchandran
Mr. Pradip Madhavji
Mr. P. V. Krishna ( upto October 2016)
Mr. Anand Vora - Chief Financial Officer
Mr. M.B Trivedi - Company Secretary
* Relative of key management personnel.
Notes to consolidated financial statements for the year ended March 31, 2018

Overview
Strategyreview Performance Governance Financials
301N
otes
to c
onso
lidat
ed fi
nanc
ial s
tate
men
ts fo
r the
yea
r end
ed M
arch
31,
201
8
38 R
elat
ed P
arty
Dis
clos
ure
(Con
td.)
INR
Cro
res
Nat
ure
of T
rans
actio
ns 3
1 M
arch
201
8 3
1 M
arch
201
7
Join
t Ven
ture
s A
ssoc
iate
s O
ther
rela
ted
part
ies
TO
TAL
Join
t Ven
ture
s A
ssoc
iate
s O
ther
rela
ted
part
ies
TO
TAL
NAT
URE
OF
TRA
NSA
CTI
ON
S:
1IN
COM
E
a)
SA
LE O
F G
OO
DS
57
120
5
1
82
52
425
2
4
79
Sin
agro
Pro
duto
s A
grop
ecuá
rios
S.A
. -
81
- 8
1 -
386
-
386
Hod
ogay
a U
PL C
o. L
imite
d 5
0 -
- 5
0 4
7 -
- 4
7
3SB
Pro
duct
os A
gric
olas
S.A
. -
29
- 2
9 -
--
-
Oth
ers
7
10
5
22
5
39
2
46
b)
MA
NAG
EMEN
T FE
ES
- -
8
8
- -
7
7
Tat
va G
loba
l Env
ironm
ent P
rivat
e Li
mite
d -
- 2
2
-
- 3
3
Gha
rpur
e En
gine
erin
g &
Cons
truc
tion
Priv
ate
Lim
ited
- -
4
4
- -
2
2
Uni
phos
Ent
erpr
ises
Lim
ited
- -
1
1
- -
1
1
Bha
ruch
Env
iro In
frast
ruct
ure
Lim
ited
- -
1
1
- -
1
1
Oth
ers
- -
0
0
- -
0
0
c)
REN
T RE
CEIV
ED
- -
0
0
- -
0
0
Uni
phos
Env
irotr
onic
Priv
ate
Lim
ited
- -
0
0
- -
0
0
d)
INTE
REST
REC
EIVE
D
- -
- -
- -
0
0
Gha
rpur
e En
gine
erin
g an
d Co
nstr
uctio
ns
- -
- -
- -
0
0
e)
GRO
UP
RECH
ARG
E 1
-
- 1
0
-
- 0
Lon
grea
ch P
lant
Bre
eder
s M
anag
emen
t Ser
vice
s Pt
y Li
mite
d 1
-
- 1
0
-
- 0
f)
RO
YALT
Y 6
1 -
- 6
1 -
--
-
Lon
grea
ch P
lant
Bre
eder
s M
anag
emen
t Ser
vice
s Pt
y Li
mite
d 6
1 -
- 6
1 -
--
-
2. E
XPEN
SES
a)
PU
RCH
ASE
S O
F G
OO
DS
2
0 -
48
68
29
63
59
151
Hod
ogay
a U
PL C
o. L
imite
d 2
0 -
- 2
0 2
9 -
- 2
9
Sin
agro
Pro
duto
s A
grop
ecuá
rios
S.A
. -
--
- -
63
- 6
3
Blo
om S
eal C
onta
iner
s Pr
ivat
e Li
mite
d -
- 2
9 2
9 -
- 3
5 3
5
Blo
om P
acka
ging
Priv
ate
Lim
ited
--
13
13
- -
16
16
Oth
ers
--
6
6
- -
8
8
(b)
The
follo
win
g tr
ansa
ctio
ns w
ere
carr
ied
out w
ith re
late
d pa
rtie
s in
the
ordi
nary
cou
rse
of b
usin
ess
as d
iscl
osed
in th
e au
dite
d ac
coun
ts o
f the
indi
vidu
al c
ompa
nies
in th
e G
roup
, as
soci
ate
com
pani
es a
nd jo
int v
entu
res.

UPL Limited Annual Report, 2017-18 302
Not
es to
con
solid
ated
fina
ncia
l sta
tem
ents
for t
he y
ear e
nded
Mar
ch 3
1, 2
018
38 R
elat
ed P
arty
Dis
clos
ure
(Con
td.)
INR
Cro
res
Nat
ure
of T
rans
actio
ns 3
1 M
arch
201
8 3
1 M
arch
201
7
Join
t Ven
ture
s A
ssoc
iate
s O
ther
rela
ted
part
ies
TO
TAL
Join
t Ven
ture
s A
ssoc
iate
s O
ther
rela
ted
part
ies
TO
TAL
b)
PRO
PERT
Y,PL
AN
T an
d EQ
UIP
MEN
T -
0
0
0
- -
100
1
00
UPL
Env
ironm
enta
l Eng
inee
rs L
imite
d -
--
- -
- 0
0
Uni
phos
Env
irotr
onic
Priv
ate
Lim
ited
--
0
- -
- -
-
Bha
ruch
Env
iro In
frast
ruct
ure
Lim
ited
--
- -
- -
0
0
VJS
Inve
stm
ents
Lim
ited
--
- -
- -
100
1
00
Che
mie
Syn
th (V
api)
Lim
ited.
-
0
- 0
-
--
-
c)
OTH
ERS
- 0
0
0
-
- 0
0
Vik
ram
Far
m
- 0
-
0
- -
0
0
Pot
Pla
nts
- -
- -
- -
0
0
Cro
p Ca
re F
eder
atio
n of
Indi
a -
- 0
0
-
--
-
oth
ers
- -
- -
- -
0
0
d)
SER
VICE
S -
- 7
9 7
9 -
0
84
84
Bha
ruch
Env
iro In
frast
ruct
ure
Lim
ited
--
77
77
- -
82
82
Oth
ers
--
2
2
- 0
2
2
e)
REN
T -
- 1
1
-
- 1
1
San
guin
e H
oldi
ngs
Priv
ate
Lim
ited
--
0
0
- -
1
1
Ulti
ma
Sear
ch
--
0
0
- -
0
0
Blo
om P
acka
ging
Priv
ate
Lim
ited
--
0
0
- -
0
0
Jai T
rust
-
--
- -
- 0
0
Oth
ers
--
- -
- -
0
0
f)
RO
YALT
Y -
- -
- 3
0 -
- 3
0
Long
reac
h Pl
ant B
reed
ers
Man
agem
ent S
ervi
ces
Pty
Lim
ited
- -
- -
30
- -
30
g)
CO
MM
ISSI
ON
EXP
ENSE
-
- -
- -
- -
-
Sin
agro
Pro
duto
s A
grop
ecuá
rios
S.A
.
h)
PRO
VISI
ON
FO
R D
OU
BTFU
L A
DVA
NCE
S -
- -
- -
- -
-
Pol
ycoa
t Tec
hnol
ogie
s 20
10 L
imite
d -
- -
- -
- -
-

Overview
Strategyreview Performance Governance Financials
303
INR
Cro
res
Nat
ure
of T
rans
actio
ns 3
1 M
arch
201
8 3
1 M
arch
201
7
Join
t Ven
ture
s A
ssoc
iate
s O
ther
rela
ted
part
ies
TO
TAL
Join
t Ven
ture
s A
ssoc
iate
s O
ther
rela
ted
part
ies
TO
TAL
i)
CO
NTR
IBU
TIO
N T
O C
SR
- -
- -
- -
0
0
Vik
ram
Far
m
- -
- -
- 0
0
j)
GRO
UP
RECH
ARG
E 0
-
- 0
0
-
- 0
Long
reac
h Pl
ant B
reed
ers
Man
agem
ent S
ervi
ces
Pty
Lim
ited
0
- -
0
0
- -
0
3.
FIN
AN
CE
a)
INTE
REST
INCO
ME
5
42
- 4
7 5
5
8 0
6
3
Long
reac
h Pl
ant B
reed
ers
Man
agem
ent S
ervi
ces
Pty
Lim
ited
5
--
5
5
- -
5
Bha
ruch
Env
iro In
frast
ruct
ure
Lim
ited
--
- -
- -
0
0
Sin
agro
Pro
duto
s A
grop
ecuá
rios
S.A
. -
20
- 2
0 -
31
- 3
1
Tat
va G
loba
l Env
ironm
ent P
rivat
e Li
mite
d -
- -
- -
0
0
3SB
Pro
duct
os A
gric
olas
S.A
. -
22
- 2
2 -
27
- 2
7
oth
ers
--
- -
- -
- -
b)
LO
AN
/IN
TER
CORP
ORA
TE D
EPO
SITS
GIV
EN
- -
- -
- -
9
9
Tat
va G
loba
l Env
ironm
ent P
rivat
e Li
mite
d -
--
- -
- -
-
Sin
agro
Pro
duto
s A
grop
ecuá
rios
S.A
. -
--
- -
- -
-
Gha
rpur
e En
gine
erin
g an
d Co
nstr
uctio
ns
--
- -
- -
9
9
Oth
ers
--
- -
- -
- -
c)
PU
RCH
ASE
/ALL
OTM
ENT
OF
BON
DS
- -
- -
- 1
0 2
1
2
Wea
ther
Ris
k M
anag
emen
t Ser
vice
s Pr
ivat
e Li
mite
d -
--
- -
10
- 1
0
Tat
va G
loba
l Env
ironm
ent P
rivat
e Li
mite
d -
--
- -
- 2
2
d)
REP
AYM
ENT
OF
LOA
N /
INTE
R CO
RPO
RATE
DEP
OSI
TS G
IVEN
-
- -
1
- -
21
21
Tat
va G
loba
l Env
ironm
ent P
rivat
e Li
mite
d -
--
- -
- -
-
Gha
rpur
e En
gine
erin
g an
d Co
nstr
uctio
ns
--
- -
- -
17
17
Bha
ruch
Env
iro In
frast
ruct
ure
Lim
ited
--
- -
- -
4
4
Oth
ers
--
- -
--
- -
Not
es to
con
solid
ated
fina
ncia
l sta
tem
ents
for t
he y
ear e
nded
Mar
ch 3
1, 2
018
38 R
elat
ed P
arty
Dis
clos
ure
(Con
td.)

UPL Limited Annual Report, 2017-18 304
INR
Cro
res
Nat
ure
of T
rans
actio
ns 3
1 M
arch
201
8 3
1 M
arch
201
7
Join
t Ven
ture
s A
ssoc
iate
s O
ther
rela
ted
part
ies
TO
TAL
Join
t Ven
ture
s A
ssoc
iate
s O
ther
rela
ted
part
ies
TO
TAL
e)
AD
VAN
CES
GIV
EN
- -
17
17
- -
5
5
Urb
ania
Rea
lty L
LP
- -
17
17
- -
5
5
f)
SA
LE/R
EDEM
PTIO
N O
F SH
ARE
S/N
CD
- -
- -
- -
15
15
UPL
Inve
stm
ent I
ndia
Pvt
. Ltd
. -
- -
- -
- 1
5 1
5
g)
REC
EIPT
AG
AIN
ST L
OA
N G
IVEN
-
- 1
1
-
--
-
Bha
ruch
Env
iro In
frast
ruct
ure
Lim
ited
--
1
1
--
--
4.
REI
MBU
RSEM
ENTS
a)
REC
EIVE
D
- -
0
0
- -
0
0
Uni
phos
Env
irotr
onic
Priv
ate
Lim
ited
- -
0
0
- -
0
0
Ulti
ma
Sear
ch
- -
0
0
- -
0
0
Oth
ers
- -
0
0
- -
0
0
b)
MA
DE
- -
- -
- -
0
0
UPL
Env
irom
enta
l Eng
inee
ring
Lim
ited
- -
- -
- -
0
0
5. O
UTS
TAN
DIN
GS
AS
AT B
ALA
NCE
SH
EET
DAT
E
a)
PAY
ABL
ES
25
3
3
31
12
108
8
1
28
Long
reac
h Pl
ant B
reed
ers
Man
agem
ent S
ervi
ces
Pty
Lim
ited
12
--
12
- -
- -
Sin
agro
Pro
duto
s A
grop
ecuá
rios
S.A
. -
--
- -
108
-
108
Hod
ogay
a U
PL C
o. L
imite
d 1
3 -
- 1
3 1
2 -
- 1
2
Oth
ers
- 3
3
6
-
- 8
8
b)
REC
EIVA
BLES
2
9 1
87
4
220
3
1 3
15
2
348
Hod
ogay
a U
PL C
o. L
imite
d 2
8 -
- 2
8 3
0 -
- 3
0
Bha
ruch
Env
iro In
frast
ruct
ure
Lim
ited
--
- -
- -
1
1
3SB
Pro
duto
s A
gríc
olas
S.A
. -
51
- 5
1 -
58
- 5
8
Sin
agro
Pro
duto
s A
grop
ecuá
rios
S.A
. -
129
-
129
-
257
-
257
Long
reac
h Pl
ant B
reed
ers
Man
agem
ent S
ervi
ces
Pty
Lim
ited
--
- -
- -
- -
Ben
ch B
io P
rivat
e Li
mite
d -
--
- -
- 0
0
Oth
ers
1
7
4
12
1
0
1
2
Not
es to
con
solid
ated
fina
ncia
l sta
tem
ents
for t
he y
ear e
nded
Mar
ch 3
1, 2
018
38 R
elat
ed P
arty
Dis
clos
ure
(Con
td.)

Overview
Strategyreview Performance Governance Financials
305N
otes
to c
onso
lidat
ed fi
nanc
ial s
tate
men
ts fo
r the
yea
r end
ed M
arch
31,
201
8
38 R
elat
ed P
arty
Dis
clos
ure
(Con
td.)
INR
Cro
res
Nat
ure
of T
rans
actio
ns 3
1 M
arch
201
8 3
1 M
arch
201
7
Join
t Ven
ture
s A
ssoc
iate
s O
ther
rela
ted
part
ies
TO
TAL
Join
t Ven
ture
s A
ssoc
iate
s O
ther
rela
ted
part
ies
TO
TAL
c)
LO
AN
S / I
NTE
R CO
RPO
RATE
DEP
OSI
TS G
IVEN
5
9 1
27
- 1
86
58
116
2
1
76
3SB
Pro
duct
os A
gric
olas
S.A
. -
54
- 5
4 -
21
- 2
1
Long
reac
h Pl
ant B
reed
ers
Man
agem
ent S
ervi
ces
Pty
Lim
ited
59
--
59
58
- -
58
Sin
agro
Pro
duto
s A
grop
ecuá
rios
S.A
. -
73
- 7
3 -
95
- 9
5
Bha
ruch
Env
iro In
frast
ruct
ure
Lim
ited
--
- -
- -
1
1
Blo
om P
acka
ging
Priv
ate
Lim
ited
--
- -
- -
1
1
Oth
ers
--
- -
- -
0
0
d)
MA
NAG
EMEN
T FE
ES R
ECEI
VABL
E -
- 1
0 1
0 -
- 8
8
Tat
va G
loba
l Env
ironm
ent P
rivat
e Li
mite
d -
- 1
1
-
- 4
4
Gha
rpur
e En
gine
erin
g an
d Co
nstr
uctio
n Pr
ivat
e Li
mite
d -
- 8
8
-
- 4
4
Bha
ruch
Env
iro In
frast
ruct
ure
Lim
ited
--
- -
- -
0
0
Oth
ers
--
1
1
- -
0
0
e)
INTE
REST
REC
EIVA
BLES
0
-
0
1
18
- -
18
Gha
rpur
e En
gine
erin
g an
d Co
nstr
uctio
n Pr
ivat
e Li
mite
d -
--
- -
- -
-
Sin
agro
Pro
duto
s A
grop
ecuá
rios
S.A
. -
--
- -
- -
-
Lon
grea
ch P
lant
Bre
eder
s M
anag
emen
t Ser
vice
s Pt
y Li
mite
d 0
-
- 0
1
8 -
- 1
8
Oth
ers
--
0
0
- -
- -
f)
DEP
OSI
TS G
IVEN
-
- 1
4 1
4 -
- 5
5
Bha
ruch
Env
iro In
frast
ruct
ure
Lim
ited
--
8
8
--
--
Dam
an G
anga
Pul
p an
d Pa
pers
Priv
ate
Lim
ited
--
4
4
- -
4
4
Blo
om P
acka
ging
Priv
ate
Lim
ited
--
- -
- -
1
1
Oth
ers
--
2
2
- -
- -
g)
AD
VAN
CES
GIV
EN
- -
27
27
- -
10
10
Urb
ania
real
ity L
LP
27
27
- -
10
10
(Abo
ve fi
gure
s ar
e gr
oss
of ta
x)

UPL Limited Annual Report, 2017-18 306
38 Related Party Disclosure (Contd.)
c. Transactions with Key Management Personnel of the Holding Company and their relatives INR Crores
Nature of Transaction March 31, 2018 March 31, 2017
Remuneration (Refer Note 1 below)
Mr. Rajnikant D. Shroff 10 15
- Mr. Jaidev R. Shroff 13 13
- Mr. Vikram R. Shroff 8 10
- Mrs. Sandra R. Shroff 8 6
- Mr. Arun C. Ashar 3 3
- Others 4 4
Total 47 51
Rent paid
- Mr. Rajnikant D. Shroff 0 0
- Mr. Jaidev R. Shroff 1 1
- Mr. Vikram R. Shroff 6 0
- Mrs. Sandra R. Shroff 0 0
Total 8 1
Professional fees
Mr. Navin Ashar 0 0
Loan given during the year
Mr. Anand Vora - 0
Sundry Deposits Given
Mr. Jaidev R. Shroff - -
Refund of Sundry Deposits
Mrs. Asha Ashar - -
Outstandings as at the Balance Sheet Date
Remuneration payable - -
Sundry deposits given 2 2
Rent Payable - -
Professional fees payable - -
Loan outstanding - 0
Note 1 This includes short term employee benefits and key management personnel who are under the employment of the Company are
entitled to post employment benefits and other long term employee benefits recognied as per Ind AS19- Employee Benefits in the
consolidated financial statements. As these employee benefits are lumpsum such amounts provided on the basis of actuarial valuation,
the same is not included above.
2 Terms and conditions of transactions with related parties The sales to and purchases from related parties are made on terms equivalent to those that prevail in arm's length transactions.
Outstanding balances at the year-end are unsecured and interest free and settlement occurs in cash. There have been no guarantees
provided or received for any related party receivables or payables. This assessment is undertaken each financial year through examining
the financial position of the related party and the market in which the related party operates.
Notes to consolidated financial statements for the year ended March 31, 2018

Overview
Strategyreview Performance Governance Financials
307N
otes
to c
onso
lidat
ed fi
nanc
ial s
tate
men
ts fo
r the
yea
r end
ed M
arch
31,
201
8
39 .
Segm
ent i
nfor
mat
ion
A.
Prim
ary
Segm
ent R
epor
ting
(by
Busi
ness
Seg
men
t)
INR
Cro
res
Mar
ch 3
1, 2
018
Mar
ch 2
017
Agr
o Ac
tivity
N
on A
gro
Activ
ity
Una
lloca
ted
Tota
l A
gro
Activ
ity
Non
Agr
o Ac
tivity
U
nallo
cate
d To
tal
Prim
ary
Segm
ent R
epor
ting
(by
Busi
ness
Se
gmen
t)
Exte
rnal
16,
917
574
1
5 1
7,50
6 1
6,19
6 4
65
19
16,
680
Inte
r seg
men
t (1
83)
183
-
- (1
83)
183
-
-
Tota
l 1
6,73
4 7
57
15
17,
506
16,
013
648
1
9 1
6,68
0
Segm
ent R
esul
ts
Cont
ribut
ion
3,7
22
66
3,7
88
3,2
91
54
- 3
,345
Inte
rseg
men
t pro
fits
(37)
37
- (3
7) 3
7 -
-
Tota
l Seg
men
t Res
ults
3,6
85
103
-
3,7
88
3,2
54
91
- 3
,345
Less
:
(i) F
inan
ce C
osts
783
7
35
(ii) U
nallo
cabl
e Ex
pend
iture
/ In
com
e (n
et)
544
5
88
(iii)
Shar
e of
loss
of a
ssoc
iate
s an
d jo
int v
entu
res
93
19
(iv)
Exce
ptio
nal i
tem
s (r
efer
not
e no
. 27)
63
81
Tota
l Pro
fit b
efor
e Ta
x 2
,305
1
,922
Prov
isio
n fo
r tax
Curr
ent t
ax 3
11
293
Adj
ustm
ents
of t
ax re
latin
g to
ear
lier y
ears
(79)
5
Def
erre
d ta
x 4
3 (1
09)
Profi
t for
the
year
att
ribut
able
to 2
,030
1
,733
Ow
ners
of t
he p
aren
t 2
,022
1
,727
Non
-con
trol
ling
inte
rest
8
6
Oth
er In
form
atio
n
Segm
ent A
sset
s 1
7,20
9 7
38
5,0
96
23,
043
15,
150
623
4
,608
2
0,38
1
Segm
ent L
iabi
litie
s 6
,320
1
76
7,3
59
13,
855
5,9
18
154
6
,879
1
2,95
1
Capi
tal E
xpen
ditu
re 1
,325
6
9 1
9 1
,413
1
,218
2
1 2
1 1
,260
Dep
reci
atio
n 2
91
27
25
343
2
43
39
24
306
Am
ortiz
atio
n 2
67
- 6
5 3
32
318
0
4
8 3
66
Non
cas
h ex
pens
es o
ther
than
dep
reci
atio
n 3
9 5
-
44
35
1
0
36

UPL Limited Annual Report, 2017-18 308
Notes to consolidated financial statements for the year ended March 31, 2018
(B) Secondary Segment Reporting (by Geographical location of the customers) INR Crores
Particulars March 31, 2018India Europe North
AmericaLatin
AmericaROW Total
Revenue by geographical market 3,317 2,305 3,083 5,692 3,109 17,506
Carrying amount of Non Current Operating Assets
(Non Current Assets for this purpose consists of
property, plant and equipment, Capital work-in-
progress, Intangible assets, Intangible assets under
development and other non current assets)
3,138 997 371 1,084 485 6,075
INR Crores
Particulars March 31, 2017India Europe North
AmericaLatin
AmericaROW Total
Revenue by geographical market 3,334 2,148 2,888 5,396 2,914 16,680
Carrying amount of Non Current Operating Assets
(Non Current Assets for this purpose consists of
property, plant and equipment, Capital work-in-
progress, Intangible assets, Intangible assets under
development and other non current assets)
2,773 551 342 1,010 462 5,138
3. Notes (i) The business of the Group is divided into two business segments. These segments are the basis for management control and hence form
the basis for reporting. The business of each segment comprises of :
a) Agro Activity - This is the main area of the Group's operation and includes the manufacture and marketing of conventional
agrochemical products, seeds and other agricultural related products.
b) Non-agro Activity - Non agro activities includes manufacture and marketing of industrial chemical and other non agricultural
related products.
(2) Capital expenditure consist of additions of property, plant and equipment and intangible assets.
(3) Segment Revenue in the above segments includes sales of products net of taxes.
(4) Inter Segment Revenue is taken as comparable third party average selling price for the year.
(5) Segment Revenue in the geographical segments considered for disclosure are as follows:
a) Revenue in India includes sales to customers located within India.
b) Revenue in Europe includes sales to customers located within Europe.
c) Revenue in North America includes sales to customers located within North America.
d) Revenue in Latin America includes sales to customers located within Latin America.
e) Revenue in Rest of world includes sales to customers located other than above Geographic segments.
(6) Segment Revenue, Results, Assets and Liabilities include the respective amounts identifiable to each of the segments and amounts
allocated on a reasonable basis.
(7) Based on "management approach" defined under Ind AS 108 - Operating Segments, the Chief Operating Decision Maker evaluates
the company's performance and allocates resources based on an analysis of various performance indicators by business segments.
Accordingly information has been presented along these segments
39 . Segment information (Contd.)

Overview
Strategyreview Performance Governance Financials
309
Notes to consolidated financial statements for the year ended March 31, 2018
INR Crores
Particulars SBN Other denomination
Total
Closing cash balance as on 08.11.2016 74,39,500 13,69,870 88,09,370
Add: Permitted receipts - 61,25,495 61,25,495
Amount withdrawn from Banks - 4,74,425 4,74,425
Less: Permitted payments (2,54,500) - (2,54,500)
Less: Amount deposited in banks (71,85,000) - (71,85,000)
Expenditure incurred - (52,29,181) (52,29,181)
Closing cash balance as on 30.12.2016 - 27,40,609 27,40,609
40. Details of Specified Bank notes (SBN) held and transacted during the period from 8th November 2016 to 30th December 2016 for Holding Company and its subsidiaries and associates incorporated in India:
The disclosures regarding details of specified bank notes held and transacted during 8 November 2016 to 30 December 2016 has not been
made since the requirement does not pertain to financial year ended 31 March 2018. Corresponding amounts as appearing in the audited
consolidated Ind AS financial statements for the period ended 31 March 2017 have been disclosed as under:
41. Research and development costs INR Crores
Research and Development costs, as certified by the Management. March 31, 2018 March 31, 2017
a) Revenue expenses debited to appropriate heads in statement of Profit & Loss 334 315
b) Capital Expenditure 69 79
42. Payable towards acquisition of additional stake in UPL Do Brasil
Out of the consideration payable to previous shareholders of UPL Do Brasil Industria E Comercio de insumos Agropecurios SA amounting to
H246 Crores as on March 31, 2017 (H277 Crores as on 31st March'16), UPL group has settled H125 Crores during the year (H31 Crores in the
year ended March 31, 2017) with previous shareholders. Out of the amount payable, the amount payable within one year from the balance
sheet date amounting to H27 Crores (H14 Crores in March 31, 2017) has been disclosed as current and balance amount of H94 Crores (H232
Crores as on March 31, 2017) has been disclosed as non current.

UPL Limited Annual Report, 2017-18 310
43. I
nfor
mat
ion
requ
ired
for c
onso
lidat
ed fi
nanc
ial s
tate
men
t pur
suan
t to
Sche
dule
III o
f The
Com
pani
es A
ct, 2
013:
INR
Cro
res
S.N
oPa
rtic
ular
sCo
co
de31
st M
arch
201
831
st M
arch
201
7
Nam
e of
the
Ent
ity i
n th
e G
roup
Net
Ass
ets
i.e. t
otal
as
sets
min
us to
tal
liabi
litie
s
Sha
re in
pro
fit o
r lo
ss
Shar
e in
oth
er
com
preh
ensi
ve
inco
me
Shar
e in
tota
l co
mpr
ehen
sive
in
com
e
Net
Ass
ets
i.e. t
otal
as
sets
min
us to
tal
liabi
litie
s
Sha
re in
pro
fit o
r lo
ss
Shar
e in
oth
er
com
preh
ensi
ve
inco
me
Sha
re in
tota
l co
mpr
ehen
sive
in
com
e
%A
mou
nt %
A
mou
nt %
A
mou
nt%
Am
ount
%A
mou
nt %
A
mou
nt %
A
mou
nt%
Am
ount
1Pa
rent
1000
UPL
Lim
ited,
Ind
ia52
% 4
,726
48
% 9
63
46%
963
56
% 4
,178
38
% 6
53
37%
653
2Su
bsid
iarie
s In
dian
1060
Shro
ffs U
nite
d C
hem
ical
s Li
mite
d0%
0
0% 0
0%
0
0% 0
0%
0
0% 0
1200
SWA
L Co
rpor
atio
n Li
mite
d1%
90
1% 3
0 1%
30
1% 6
4 0%
3
0% 3
1300
Uni
ted
Phos
phor
us (I
ndia
) LL
P0%
15
2% 3
3 2%
33
0% 9
-2
% (3
0)-2
% (3
0)
1350
Uni
ted
Phos
phor
us G
loba
l LL
P0%
0
0% -
0% -
0% 0
0%
0
0% 0
1400
Opt
ima
Farm
Sol
utio
ns
Lim
ited
0% 2
9 1%
20
1% 2
0 0%
7
0% 5
0%
5
1450
Agr
inet
Sol
utio
ns L
imite
d0%
3
0% -
0% -
0% 3
0%
(0)
0% (0
)
Fore
ign
2030
UPL
Eur
ope
Lim
ited
2% 2
03
6% 1
14
5% 1
14
3% 2
07
3% 4
5 3%
45
2050
UPL
Deu
tsch
land
Gm
bH0%
14
0% 9
0%
9
0% 9
0%
2
0% 2
2060
UPL
Pol
ska
Sp z
.o.o
. 0%
(0)
0% (0
)0%
(0)
0% (0
)0%
(0)
0% (0
)
2100
UPL
Ben
elux
B.V
.1%
103
1%
15
1% 1
5 1%
80
1% 1
0 1%
10
2200
Cere
xagr
i B.V
.2%
220
0%
5
0% 5
2%
180
1%
11
1% 1
1
2230
Blue
Sta
r B.V
.0%
0
0% (1
)0%
(1)
0% 0
0%
(1)
0% (1
)
2250
Uni
ted
Phos
phor
us H
oldi
ngs
Coop
erat
ief U
.A.
0% (2
0)0%
(1)
0% (1
)0%
(16)
1% 1
2 1%
12
2260
Uni
ted
Phos
phor
us H
oldi
ngs
B.V.
-3%
(279
)0%
(0)
0% (0
)-3
% (2
54)
1% 1
4 1%
14
2270
Dec
co W
orld
wid
e Po
st-
Har
vest
Hol
ding
s Co
oper
atie
f U
.A.
0% (0
)0%
(0)
0% (0
)0%
(0)
0% (0
)0%
(0)
2280
Dec
co W
orld
wid
e Po
st-
Har
vest
Hol
ding
s B.
V.-1
% (6
2)0%
2
0% 2
-1
% (5
5)0%
(0)
0% (0
)
2290
Uni
ted
Phos
phor
us H
oldi
ng,
Braz
il B.
V.-3
% (2
96)
-1%
(17)
-1%
(17)
-3%
(247
)-2
% (3
0)-2
% (3
0)
2310
Adv
anta
Hol
ding
s B.
V.-6
% (5
61)
2% 4
3 2%
43
-6%
(481
)-1
% (2
4)-1
% (2
4)
2320
Adv
anta
Net
herla
nds
Hol
ding
B.V
.6%
588
0%
(3)
0% (3
)7%
507
0%
3
0% 3
2400
UPL
Ital
ia S
.R.L
. 1%
48
0% 6
0%
6
0% 3
3 0%
8
0% 8
2500
UPL
Iber
ia, S
.A.
1% 8
8 0%
0
0% 0
1%
73
0% 6
0%
6
2580
Dec
co Ib
eric
a Po
stco
sech
a,
S.A
.U.
1% 9
2 1%
13
1% 1
3 1%
67
1% 1
4 1%
14
2590
Tran
ster
ra In
vest
, S. L
. U.
-1%
(104
)0%
4
0% 4
-2
% (1
51)
0% 0
0%
0
2600
Cere
xagr
i S.A
.S.
3% 3
07
2% 4
5 2%
45
3% 2
20
1% 2
2 1%
22
2630
Neo
-Fog
S.A
.0%
31
0% 3
0%
3
0% 2
3 0%
2
0% 2
Not
es to
con
solid
ated
fina
ncia
l sta
tem
ents
for t
he y
ear e
nded
Mar
ch 3
1, 2
018

Overview
Strategyreview Performance Governance Financials
311
43. I
nfor
mat
ion
requ
ired
for c
onso
lidat
ed fi
nanc
ial s
tate
men
t pur
suan
t to
Sche
dule
III o
f The
Com
pani
es A
ct, 2
013:
INR
Cro
res
S.N
oPa
rtic
ular
sCo
co
de31
st M
arch
201
831
st M
arch
201
7
Nam
e of
the
Ent
ity i
n th
e G
roup
Net
Ass
ets
i.e. t
otal
as
sets
min
us to
tal
liabi
litie
s
Sha
re in
pro
fit o
r lo
ss
Shar
e in
oth
er
com
preh
ensi
ve
inco
me
Shar
e in
tota
l co
mpr
ehen
sive
in
com
e
Net
Ass
ets
i.e. t
otal
as
sets
min
us to
tal
liabi
litie
s
Sha
re in
pro
fit o
r lo
ss
Shar
e in
oth
er
com
preh
ensi
ve
inco
me
Sha
re in
tota
l co
mpr
ehen
sive
in
com
e
%A
mou
nt %
A
mou
nt %
A
mou
nt%
Am
ount
%A
mou
nt %
A
mou
nt %
A
mou
nt%
Am
ount
2700
UPL
Fra
nce
1% 8
6 0%
(5)
0% (5
)1%
76
3% 4
5 3%
45
4500
Uni
ted
Phos
phor
us L
imite
d,
Gib
ralto
r0%
- 0%
0
0% 0
0%
(0)
-19%
(333
)-1
9% (3
33)
2750
Uni
ted
Phos
phor
us
Switz
erla
nd L
imite
d0%
1
0% 0
0%
0
0% 1
-1
% (1
3)-1
% (1
3)
2760
Agr
odan
, ApS
0% 3
0%
(4)
0% (4
)0%
6
0% (4
)0%
(4)
2800
Dec
co It
alia
SRL
1% 4
8 0%
4
0% 4
1%
38
0% 3
0%
3
2900
Lim
ited
Liab
ility
Com
pany
"U
PL"
0% 1
0 0%
1
0% 1
0%
9
0% 5
0%
5
2950
Dec
co P
ortu
gal P
ost H
arve
st,
Uni
pess
oal L
DA
(for
mer
ly
know
n as
UPL
Por
tuga
l U
nipe
ssoa
l LD
A)
0% (0
)0%
0
0% 0
0%
(0)
0% (0
)0%
(0)
4050
UPL
Man
agem
ent D
MCC
1% 1
23
1% 2
6 1%
26
1% 9
6 1%
15
1% 1
5
3000
Uni
ted
Phos
phor
us In
c.-9
% (8
57)
3% 5
7 3%
57
-10%
(740
)3%
50
3% 5
0
3050
UPI
Fin
ance
LLC
0% 0
0%
0
0% 0
0%
0
0% 0
0%
0
3100
Cere
xagr
i, In
c. (P
A)
4% 3
58
1% 1
2 1%
12
5% 3
44
0% 1
0%
1
3150
UPL
Del
awar
e, In
c.0%
(10)
-1%
(14)
-1%
(14)
0% 4
0%
(7)
0% (7
)
3200
Cane
gras
s LL
C1%
54
1% 2
1 1%
21
1% 3
8 1%
12
1% 1
2
3300
Dec
co U
S Po
st-H
arve
st In
c1%
99
1% 1
6 1%
16
1% 8
3 0%
6
0% 6
3350
Esse
ntiv
LCC
0% (2
2)-1
% (1
4)-1
% (1
4)0%
(8)
0% (8
)0%
(8)
3400
Rice
Co L
LC1%
84
0% (3
)0%
(3)
1% 7
0 0%
6
0% 6
3450
Rice
co In
tern
atio
nal,
Inc.
3% 2
30
2% 4
2 2%
42
3% 1
98
0% 6
0%
6
3600
Adv
anta
US
Inc.
0% 3
7 -4
% (8
3)-4
% (8
3)-1
% (8
5)-5
% (8
5)-5
% (8
5)
4000
UPL
Cor
pora
tion
Lim
ited
-23%
(2,1
18)
-8%
(164
)-8
% (1
64)
-42%
(3,1
33)
5% 8
9 5%
89
5000
UPL
Agr
o S.
A. d
e C
.V.
0% (1
2)0%
(3)
0% (3
)-1
% (4
5)-1
% (2
0)-1
% (2
0)
5050
Dec
co Ji
fkin
s M
exic
o Sa
pi0%
(8)
0% (2
)0%
(2)
0% (6
)0%
(2)
0% (2
)
5130
Adv
anta
Com
erci
o D
e Se
men
tes
LTD
A.
-2%
(217
)-4
% (8
3)-4
% (8
3)-2
% (1
41)
-2%
(26)
-1%
(26)
5140
Perr
ey P
artic
ipaç
ões
S.A
0%
8
0% -
0% -
0% 8
0%
(0)
0% (0
)
5150
Uni
ted
Phos
phor
us d
o Br
asil L
td0%
- 0%
- 0%
- 0%
- 0%
(3)
0% (3
)
4100
UPL
Agr
o Li
mite
d M
aurit
ius
3% 2
55
9% 1
87
9% 1
87
4010
UPL
Lim
ited
0% -
20%
403
19
% 4
03
15%
1,0
91
17%
301
17
% 3
01
4200
Adv
anta
See
ds In
tern
atio
nal
6% 5
85
4% 7
5 4%
75
7% 5
13
2% 3
1 2%
31
4250
Adv
anta
See
ds D
MCC
2%
151
0%
(9)
0% (9
)2%
158
5%
84
5% 8
4
5170
Uni
phos
Indu
stria
e
Com
erci
o de
Pro
duto
s Q
uim
icos
Ltd
a.
2% 1
40
1% 1
1 1%
11
2% 1
35
1% 9
1%
9
Not
es to
con
solid
ated
fina
ncia
l sta
tem
ents
for t
he y
ear e
nded
Mar
ch 3
1, 2
018

UPL Limited Annual Report, 2017-18 312
43. I
nfor
mat
ion
requ
ired
for c
onso
lidat
ed fi
nanc
ial s
tate
men
t pur
suan
t to
Sche
dule
III o
f The
Com
pani
es A
ct, 2
013:
INR
Cro
res
S.N
oPa
rtic
ular
sCo
co
de31
st M
arch
201
831
st M
arch
201
7
Nam
e of
the
Ent
ity i
n th
e G
roup
Net
Ass
ets
i.e. t
otal
as
sets
min
us to
tal
liabi
litie
s
Sha
re in
pro
fit o
r lo
ss
Shar
e in
oth
er
com
preh
ensi
ve
inco
me
Shar
e in
tota
l co
mpr
ehen
sive
in
com
e
Net
Ass
ets
i.e. t
otal
as
sets
min
us to
tal
liabi
litie
s
Sha
re in
pro
fit o
r lo
ss
Shar
e in
oth
er
com
preh
ensi
ve
inco
me
Sha
re in
tota
l co
mpr
ehen
sive
in
com
e
%A
mou
nt %
A
mou
nt %
A
mou
nt%
Am
ount
%A
mou
nt %
A
mou
nt %
A
mou
nt%
Am
ount
5190
Upl
do
Bras
il In
dust
ria e
Co
mér
cio
de In
sum
os
Agr
opec
uário
s S.
A.
12%
1,1
46
3% 5
2 2%
52
15%
1,0
80
8% 1
41
8% 1
41
5300
UPL
Cos
ta R
ica
S.A
. 0%
(26)
-1%
(12)
-1%
(12)
0% (2
1)0%
7
0% 7
5360
UPL
Bol
ivia
S.R
.L
0% (1
)0%
(1)
0% (1
)0%
3
0% (6
)0%
(6)
5370
UPL
Par
agua
y S.
A.
0% (6
)0%
(4)
0% (4
)0%
(1)
0% (4
)0%
(4)
5430
Icon
a Sa
nlui
s S
.A.
0% (1
8)0%
(5)
0% (5
)0%
(12)
0% (5
)0%
(5)
5410
DVA
Tech
nolo
gy A
rgen
tina
S.A.
0% 0
0%
- 0%
- 0%
0
0% -
0% -
5450
Adv
anta
Sem
illas
SA
IC0%
18
-1%
(29)
-1%
(29)
1% 6
0 0%
(7)
0% (7
)
5630
UPL
Arg
entin
a S
A
0% (4
5)-4
% (8
0)-4
% (8
0)1%
44
-2%
(32)
-2%
(32)
5650
Dec
co C
hile
SpA
0% 1
2 0%
6
0% 6
0%
6
0% 4
0%
4
5700
UPL
Col
ombi
a SA
S0%
12
0% (9
)0%
(9)
0% 1
9 0%
1
0% 1
5950
Uni
ted
Phos
phor
us C
aym
an
Lim
ited
1% 6
7 1%
14
1% 1
4 1%
58
-1%
(12)
-1%
(12)
5960
UP
Avi
atio
n Li
mite
d0%
15
0% 3
0%
3
0% 1
2 2%
33
2% 3
3
6000
UPL
Aus
tral
ia L
imite
d 0%
25
0% 1
0 0%
10
0% 2
2 1%
13
1% 1
3
6050
UPL
New
Zea
land
Lim
ited
0% 3
0%
0
0% 0
0%
2
0% 1
0%
1
4600
UPL
Lim
ited
25%
2,3
37
14%
290
14
% 2
90
27%
2,0
17
35%
608
35
% 6
08
6100
UPL
Sha
ngha
i Lim
ited
0% 1
7 0%
4
0% 4
0%
12
0% 4
0%
4
6110
UPL
Jian
gsu
Lim
ited
0% 2
0%
0
0% 0
6150
Adv
anta
See
ds P
ty L
td
2% 2
07
1% 1
6 1%
16
3% 1
89
-1%
(15)
-1%
(15)
6200
UPL
Lim
ited
(Kor
ea)
0% 3
0%
1
0% 1
0%
2
0% 1
0%
1
6300
Paci
fic S
eeds
(Tha
i) Li
mite
d4%
334
4%
80
4% 8
0 3%
220
-1
% (2
6)-1
% (2
6)
6350
Paci
fic S
eeds
Hol
ding
s (T
haila
nd) L
imite
d0%
4
0% (0
)0%
(0)
0% 3
6%
100
6%
100
6400
PT.U
PL In
done
sia
0% 3
0%
4
0% 4
0%
(5)
0% 2
0%
2
6450
PT C
atur
Agr
oday
a M
andi
ri0%
(14)
0% (0
)0%
(0)
0% (1
5)0%
3
0% 3
6460
PT A
dvan
ta S
eeds
Indo
nesi
a0%
(17)
1% 1
6 1%
16
-1%
(38)
0% 2
0%
2
6500
UPL
Lim
ited
2% 1
97
1% 2
6 1%
26
2% 1
75
2% 3
5 2%
35
6550
UPL
Phi
lippi
nes
Inc.
0% (1
)0%
(7)
0% (7
)0%
1
0% 2
0%
2
6600
UPL
Vie
tnam
Co.
Lim
ited
1% 8
0 1%
21
1% 2
1 1%
55
1% 2
4 1%
24
6650
Uni
phos
Mal
aysi
a Sd
n Bh
d0%
2
0% (0
)0%
(0)
6780
UPL
Lim
ited,
Japa
n1%
104
0%
(1)
0% (1
)1%
88
0% 1
0%
1
6800
Ann
ing
Dec
co F
ine
Che
mic
al
Co. L
imite
d0%
26
0% 0
0%
0
0% 2
3 0%
4
0% 4
6900
Rice
co In
tern
atio
nal
Bang
lade
sh L
td0%
1
0% 0
0%
0
Not
es to
con
solid
ated
fina
ncia
l sta
tem
ents
for t
he y
ear e
nded
Mar
ch 3
1, 2
018

Overview
Strategyreview Performance Governance Financials
313
43. I
nfor
mat
ion
requ
ired
for c
onso
lidat
ed fi
nanc
ial s
tate
men
t pur
suan
t to
Sche
dule
III o
f The
Com
pani
es A
ct, 2
013:
INR
Cro
res
S.N
oPa
rtic
ular
sCo
co
de31
st M
arch
201
831
st M
arch
201
7
Nam
e of
the
Ent
ity i
n th
e G
roup
Net
Ass
ets
i.e. t
otal
as
sets
min
us to
tal
liabi
litie
s
Sha
re in
pro
fit o
r lo
ss
Shar
e in
oth
er
com
preh
ensi
ve
inco
me
Shar
e in
tota
l co
mpr
ehen
sive
in
com
e
Net
Ass
ets
i.e. t
otal
as
sets
min
us to
tal
liabi
litie
s
Sha
re in
pro
fit o
r lo
ss
Shar
e in
oth
er
com
preh
ensi
ve
inco
me
Sha
re in
tota
l co
mpr
ehen
sive
in
com
e
%A
mou
nt %
A
mou
nt %
A
mou
nt%
Am
ount
%A
mou
nt %
A
mou
nt %
A
mou
nt%
Am
ount
7100
UPL
Zira
at V
e Ki
mya
San
ayi
Ve T
icar
et L
imite
d Si
rket
i0%
2
-1%
(15)
-1%
(15)
0% 2
4 -1
% (1
1)-1
% (1
1)
7150
UPL
Agr
omed
Tar
im Il
acla
ri ve
Toh
umcu
luk
Sana
yi v
e Ti
care
t A.S
.
0% 1
9 0%
(1)
0% (1
)0%
20
0% (8
)0%
(8)
7200
Safe
pack
Pro
duct
s Li
mite
d0%
40
0% (3
)0%
(3)
1% 4
2 0%
2
0% 2
7250
Citr
ashi
ne (P
ty) L
td0%
(6)
0% (1
)0%
(1)
0% (4
)0%
(1)
0% (1
)
7500
UPL
Afri
ca S
ARL
0%
- 0%
0
0% 0
0%
(0)
0% (0
)0%
(0)
7550
Prol
ong
Lim
ited
0% 2
0%
(1)
0% (1
)0%
2
0% (0
)0%
(0)
2930
Adv
anta
See
ds U
krai
ne L
LC0%
0
0% -
0% -
0% -
0% -
0% -
3N
on-
cont
rolli
ng
inte
rest
0% (1
9)0%
(8)
0% (8
)0%
(33)
0% (6
)0%
(6)
4A
ssoc
iate
s
Indi
an
Kera
la E
nviro
Infra
stru
ctur
e Li
mite
d0%
3
0% 1
0%
1
0% 3
0%
(1)
0% (1
)
Che
mis
ynth
(Vap
i) Li
mite
d0%
0%0%
- 0%
- 0%
0% -
Uni
vers
al P
esto
chem
(In
dust
ries)
Lim
ited
0%0%
0% -
0% -
0%0%
-
Wea
ther
Ris
k M
anag
emen
t Pr
ivat
e Lt
d0%
10
0% (0
)0%
(0)
0% 1
0 0%
(0)
0% (0
)
Fore
ign
Poly
coat
Tec
hnol
ogie
s 20
10
Lim
ited
0%0%
0% -
0% -
0%0%
-
Sina
gro
Prod
utos
A
grop
ecua
rios
S.A
.0%
- -5
% (1
03)
-5%
(103
)0%
36
1% 1
6 1%
16
3SB
Prod
utos
Agr
icol
as S
.A.
1% 1
02
0% (4
)0%
(4)
1% 7
6 -2
% (3
6)-2
% (3
6)
Sera
Bon
ita2%
208
0%
1
0% 1
5Jo
int
Vent
ure
Fore
ign
6790
Hod
agay
a U
PL C
o. L
imite
d0%
21
0% 1
0%
1
0% 1
8 0%
1
0% 1
6160
Long
reac
h Pl
ant B
reed
ers
Man
agem
ent P
ty L
imite
d0%
42
1% 1
1 1%
11
0% 3
1 0%
1
0% 1
6O
ther
Co
mpr
e-he
nsiv
e In
com
e
100%
703%
70
100%
231%
23
Tota
l10
0% 9
,169
10
0% 2
,022
10
0%70
100%
2,0
92
100%
7,3
97
100%
1,7
27
100%
2310
0% 1
,750
Not
e: T
he a
bove
figu
res
are
afte
r elim
inat
ing
inte
r-co
mpa
ny tr
ansa
ctio
ns/b
alan
ces
and
cons
olid
atio
n ad
just
men
ts
Not
es to
con
solid
ated
fina
ncia
l sta
tem
ents
for t
he y
ear e
nded
Mar
ch 3
1, 2
018

UPL Limited Annual Report, 2017-18 314
44. Hedging activities and derivatives
Derivatives not designated as hedging instrumentsThe Group uses full currency interest rate swaps and foreign exchange forward contracts to manage some of its transaction exposures. The
foreign exchange forward contracts are not designated as cash flow hedges and are entered into for periods consistent with foreign currency
exposure of the underlying transactions.
The Group enters into foreign exchange forward contracts with the intention to reduce the foreign exchange risk of expected sales and
purchases, these contracts are not designated in hedge relationships and are measured at fair value through profit or loss.
Nature of Instrument Currency
31-Mar-18 31-Mar-18 31-Mar-17 31-Mar-17
Purpose - Hedging/ Speculation
(In '000) (INR Crores) (In '000) (INR Crores)
Amount outstanding
Amount outstanding
Amount outstanding
Amount outstanding
(a) Forward contracts - Sell USD 3,874 25 14,041 91 Hedging
Forward contracts - Sell EUR 2,893 23 331 2 Hedging
Forward contracts - Buy USD 74,571 486 2,05,082 1,330 Hedging
(b) Derivative contracts
(i) Full Currency Interest Rate Swap contracts - Buy USD 1,11,179 725 1,11,179 550 Hedging (refer note below)
Full Currency Interest Rate Swap contracts - Buy EUR 25,667 207 25,667 210 Hedging (refer note below)
Note:-
Hedging against the underlying INR borrowings
by which:
- Group will receive principal in INR and pay in
foreign currency
- Group will receive fixed interest in INR and pay
fixed / floating interest in foreign currency.
(c) Un-hedged Foreign Currency Exposure on:
1 Payables USD 3,50,549 2,285 2,76,975 1,796
(including Foreign Currency payable in respect of EUR 3,102 25 27,240 189
derivative contracts as mentioned in (b) above) GBP 6,937 64 2,526 20
CHF 5 0 16 0
DKK 878 1 1,310 1
PLN 11 0 175 0
AED 1,076 2 8 0
CAD 146 1 - -
COP 73,61,730 17 1,36,60,390 31
THB 421 0
HUF 163 0 - -
CZK 0 0 - -
2 Receivable USD 3,78,725 2,468 1,33,823 868
EUR 6,805 55 2,976 21
GBP 5,085 47 4,045 33
DKK 834 1 152 0
JPY 1,06,713 7 968 0
AUD 1,450 7 - -
PLN 3,431 7 - -
CAD 7,978 40 5,448 26
COP 34,56,462 8 42,25,403 9
AED 8 0 - -
CHF 864 6 - -
Notes to consolidated financial statements for the year ended March 31, 2018

Overview
Strategyreview Performance Governance Financials
315
Notes to consolidated financial statements for the year ended March 31, 2018
45. Catergory-wise Classification of Financial Instruments INR Crores
Refer note Non-current CurrentMarch 31, 2018 March 31, 2017 March 31, 2018 March 31, 2017
(A) Accounting, classification and Fair Value :
Investments accounted for using the equity method
5 386 174 - -
Financial assets measured at fair value through profit or loss (FVTPL)
Investments in others (unsecured) 5 426 2 7 0
Investments in unquoted equity shares 5 40 41 - -
Investments in unquoted optionally convertible
bonds
5 76 83 - -
542 126 7 0
Financial assets measured at fair value through other comprehensive income (FVTOCI)
Investments in quoted equity shares 5 99 78 - -
99 78 - -
Financial assets measured at amortised cost
Sundry deposits 6 ( A ) 91 95 31 0
Loans and advances to related party 6 ( B ) 60 128 96 50
Loans to employees 6 ( C ) 0 2 8 11
Sundry loans 6 ( D ) - - 12 58
Trade receivables 10 1 0 6,056 5,656
Interest Receivable 7 ( A ) - - 49 57
Bank deposits with more than 12 months of
original maturity
Cash and Cash Equivalents 11 - - 2,859 2,880
Other Bank Balances 11A - - 35 15
Other advances 7 ( C) - - 24 20
187 286 9,264 8,835
Financial liabilities measured at fair value through profit or loss (FVTPL)
Derivative contracts 16 134 142 41 37
134 142 41 37
Financial liabilities measured at amortised cost
Redeemable Non convertible Debentures
(Unsecured )
15 682 756 - -
Bonds (Unsecured)
- 3.25% Senior Notes 15 3,230 3,210 - -
- 4.50% Senior Notes 15 1,937 - - -
From Bank
- Foreign currency loan (Unsecured) 15 2 1,380 - -
- Foreign currency loan (Secured) 15 3 4 65 8
- Loan from Biotechnology
Industry Research Assistance
(BIRAC) (Secured)
15 - 0 - -
- Others borrowings 15 19 - 556 587
Liability component of compound financial
instruments
15 - - - 24

UPL Limited Annual Report, 2017-18 316
Notes to consolidated financial statements for the year ended March 31, 2018
45. Catergory-wise Classification of Financial Instruments INR Crores
Refer note Non-current CurrentMarch 31, 2018 March 31, 2017 March 31, 2018 March 31, 2017
Discounted Trade receivables (Unsecured) -
Factoring with recourse
15 - - 13 43
Current maturities of long term borrowings 16 - - 131 303
Payable towards acquisition of additional stake
in UPL Do Brasil (Refer note: 42)
16 94 232 27 14
Capital goods creditors 16 - - 155 38
Interest accrued and not due on borrowings 16 - - 59 103
Trade Deposits 16 - - 73 70
Trade payables (including Acceptances) 19 - 10 5,675 4,875
Others 16 4 4 269 236
5,971 5,597 7,023 6,302
(B) Measurement of fair value: Valuation techniques and significant unobservable inputs:
(i) Financial instruments measured at fair valueThe fair value of the financial assets and liabilities is included at the amount at which the instrument could be exchanged in a current
transaction between willing parties, other than in a forced or liquidation sale. The following methods and assumptions were used to estimate
the fair values:
- The fair value of unquoted instruments, loans from banks and other financial liabilities, as well as other non-current financial liabilities is
estimated by discounting future cash flows using rates currently available for debt on similar terms, credit risk and remaining maturities.
In addition to being sensitive to a reasonably possible change in the forecast cash flows or the discount rate, the fair value of the equity
instruments is also sensitive to a reasonably possible change in the growth rates. Management regularly assesses a range of reasonably
possible alternatives for those significant unobservable inputs and determines their impact on the total fair value.
-The fair values of the unquoted equity shares have been estimated using a DCF model. The valuation requires management to make certain
assumptions about the model inputs, including forecast cash flows, discount rate, credit risk and volatility. The probabilities of the various
estimates within the range can be reasonably assessed and are used in management’s estimate of fair value for these unquoted equity
investments.
-The fair values of the remaining FVTOCI financial assets are derived from quoted market prices in active markets.
- The fair values of the Company’s interest-bearing borrowings and loans are determined by using DCF method using discount rate that
reflects the issuer’s borrowing rate as at the end of the reporting period. The own non-performance risk as at 31 March 2018 was assessed to
be insignificant.
The discount for lack of marketability represents the amounts that the Company has determined that market participants would take into
account when pricing the investments.
(ii) Financial instrument measured at amortized cost:The carrying amount of financial assets and financial liability measured at amortized cost in the financial statements are a resonable
approximation of their fair value since the Company does not anticipate that the carrying amounts would be significantly different from the
value that would eventually be received or settled.
(Contd.)

Overview
Strategyreview Performance Governance Financials
317
Notes to consolidated financial statements for the year ended March 31, 2018
46. Fair value hierarchy
The following table provides the fair value measurement hierarchy of the Group’s assets and liabilities.
Quantitative disclosures fair value measurement hierarchy for assets as at 31 March 2018: INR Crores
Particulars Date of valuation
Fair value measurement using
Total Quoted prices in active markets
Significant observable
inputs
Significant unobservable
inputs
(Level 1) (Level 2) (Level 3)
Assets measured at fair value:
FVTOCI financial investments (Note 5):
Investments in equity instruments (Quoted) 31-Mar-18 99 99 - -
FVTPL financial investments (Note 5):
Investments in equity instruments (Unquoted) 31-Mar-18 40 - - 40
Investments in Optionally Convertible Bonds
(Unquoted)
31-Mar-18 76 - - 76
Investments in Others (Unquoted) 31-Mar-18 433 - - 433
Quantitative disclosures fair value measurement hierarchy for liabilities as at 31 March 2018: INR Crores
Particulars Date of valuation
Fair value measurement using
Total Quoted prices in active markets
Significant observable
inputs
Significant unobservable
inputs
(Level 1) (Level 2) (Level 3)
Liabilities measured at fair value:
Derivative financial liabilities (Note 16):
Derivative contracts 31-Mar-18 175 175 - -
Quantitative disclosures fair value measurement hierarchy for assets as at 31 March 2017: INR Crores
Particulars Date of valuation
Fair value measurement using
Total Quoted prices in active markets
Significant observable
inputs
Significant unobservable
inputs
(Level 1) (Level 2) (Level 3)
Assets measured at fair value:
FVTOCI financial investments (Note 5):
Investments in Equity Instruments (Quoted) 31-Mar-17 78 78 - -
FVTPL financial investments (Note 5):
Investments in Equity Instruments (Unquoted) 31-Mar-17 41 - - 41
Investments in Optionally Convertible Bonds
(Unquoted)
31-Mar-17 83 - - 83
Investments in Others (Unquoted) 31-Mar-17 2 - - 2
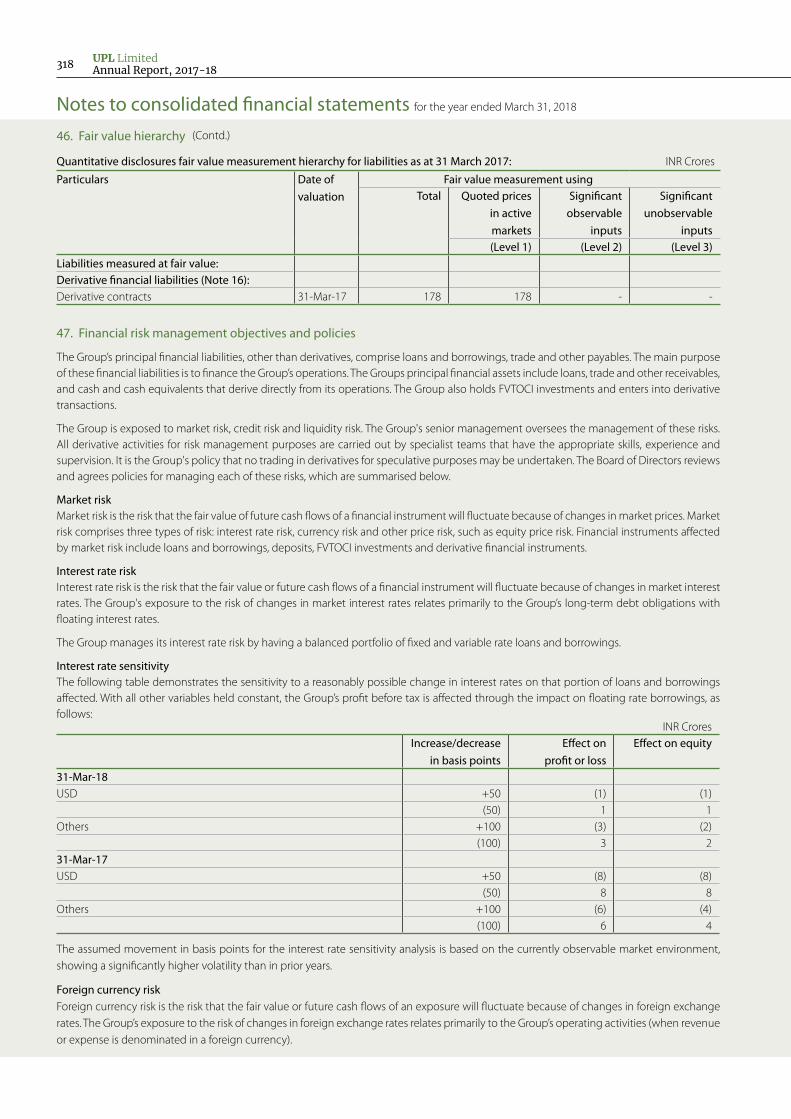
UPL Limited Annual Report, 2017-18 318
Notes to consolidated financial statements for the year ended March 31, 2018
47. Financial risk management objectives and policies
The Group’s principal financial liabilities, other than derivatives, comprise loans and borrowings, trade and other payables. The main purpose of these financial liabilities is to finance the Group’s operations. The Groups principal financial assets include loans, trade and other receivables, and cash and cash equivalents that derive directly from its operations. The Group also holds FVTOCI investments and enters into derivative transactions.
The Group is exposed to market risk, credit risk and liquidity risk. The Group's senior management oversees the management of these risks. All derivative activities for risk management purposes are carried out by specialist teams that have the appropriate skills, experience and supervision. It is the Group's policy that no trading in derivatives for speculative purposes may be undertaken. The Board of Directors reviews and agrees policies for managing each of these risks, which are summarised below.
Market risk Market risk is the risk that the fair value of future cash flows of a financial instrument will fluctuate because of changes in market prices. Market risk comprises three types of risk: interest rate risk, currency risk and other price risk, such as equity price risk. Financial instruments affected by market risk include loans and borrowings, deposits, FVTOCI investments and derivative financial instruments.
Interest rate risk Interest rate risk is the risk that the fair value or future cash flows of a financial instrument will fluctuate because of changes in market interest rates. The Group's exposure to the risk of changes in market interest rates relates primarily to the Group’s long-term debt obligations with floating interest rates.
The Group manages its interest rate risk by having a balanced portfolio of fixed and variable rate loans and borrowings.
Interest rate sensitivity The following table demonstrates the sensitivity to a reasonably possible change in interest rates on that portion of loans and borrowings affected. With all other variables held constant, the Group’s profit before tax is affected through the impact on floating rate borrowings, as follows:
INR CroresIncrease/decrease
in basis pointsEffect on
profit or lossEffect on equity
31-Mar-18USD +50 (1) (1)
(50) 1 1 Others +100 (3) (2)
(100) 3 2 31-Mar-17USD +50 (8) (8)
(50) 8 8 Others +100 (6) (4)
(100) 6 4
The assumed movement in basis points for the interest rate sensitivity analysis is based on the currently observable market environment, showing a significantly higher volatility than in prior years.
Foreign currency riskForeign currency risk is the risk that the fair value or future cash flows of an exposure will fluctuate because of changes in foreign exchange rates. The Group’s exposure to the risk of changes in foreign exchange rates relates primarily to the Group’s operating activities (when revenue or expense is denominated in a foreign currency).
Quantitative disclosures fair value measurement hierarchy for liabilities as at 31 March 2017: INR Crores
Particulars Date of valuation
Fair value measurement usingTotal Quoted prices
in active markets
Significant observable
inputs
Significant unobservable
inputs(Level 1) (Level 2) (Level 3)
Liabilities measured at fair value:Derivative financial liabilities (Note 16):Derivative contracts 31-Mar-17 178 178 - -
(Contd.)46. Fair value hierarchy

Overview
Strategyreview Performance Governance Financials
319
Notes to consolidated financial statements for the year ended March 31, 2018
47. Financial risk management objectives and policies (Contd.)
The Group manages its foreign currency risk by hedging transactions that are expected to occur within a maximum 12-month period for hedges of actual sales and purchases and 12-month period for foreign currency loans.
When a derivative is entered into for the purpose of being a hedge, the Group negotiates the terms of those derivatives to match the terms of the hedged exposure. For hedges of forecast transactions the derivatives cover the period of exposure from the point the cash flows of the transactions are forecasted up to the point of settlement of the resulting receivable or payable that is denominated in the foreign currency.
The Group hedges its exposure to fluctuations on the foreign currency loan by using foreign currency swaps and forwards.
At 31 March 2018, the Group hedge position is stated in Note 44. This foreign currency risk is hedged by using foreign currency forward contracts and full currency interest rate swaps.
Foreign currency sensitivityThe following tables demonstrate the sensitivity to a reasonably possible change in USD and EUR exchange rates, with all other variables held constant. The impact on the Group’s profit before tax is due to changes in the fair value of monetary assets and liabilities. The Group’s exposure to foreign currency changes for all other currencies is not material.
INR Crores
Change in USD Rate Effect on profit or loss Effect on equityMarch 31, 2018 1% 2 1
-1% (2) (1)March 31, 2017 1% (9) (6)
-1% 9 6
INR Crores
Change in EURO Rate Effect on profit or loss Effect on equityMarch 31, 2018 1% 0 0
-1% (0) (0)March 31, 2017 1% (2) (1)
-1% 2 1
The movement in the pre-tax effect is a result of a change in the fair value of monetary assets and liabilities denominated in US dollars, where the functional currency of the entity is a currency other than US dollars. Although the derivatives have not been designated in a hedge relationship, they act as an economic hedge and will offset the underlying transactions when they occur.
Equity price risk The Group’s listed and non-listed equity securities are susceptible to market price risk arising from uncertainties about future values of the investment securities. The investment in listed and unlisted equity securities are not significant.
Credit risk Credit risk is the risk that counterparty will not meet its obligations under a financial instrument or customer contract, leading to a financial loss. The Group is exposed to credit risk from its operating activities (primarily trade receivables) and from its financing activities, including deposits with banks and financial institutions, foreign exchange transactions and other financial instruments.
Financial instruments and cash deposits Credit risk from balances with banks and financial institutions is managed by the Group's treasury department. Investments of surplus funds are made only with approved counterparties and within credit limits assigned to each counterparty. The limits are set to minimise the concentration of risks and therefore mitigate financial loss through counterparty’s potential failure to make payments.
The Group’s maximum exposure to credit risk for the components of the balance sheet at 31 March 2018 and 31 March 2017 is the carrying
amounts as illustrated in Note 10 except for derivative financial instruments.
Liquidity risk Liquidity risk is the risk that the Group will not be able to meet its financial obligations as they fall due. The Group's approach to managing
liquidity is to ensure, as far as possible, that it will always have sufficient liquidity to meet its liabilities when due, under both normal and
stressed conditions, without incurring unacceptable losses or risking damage to the Group's reputation.
The Group manages liquidity risk by maintaining adequate reserves, by continuously monitoring forecast and actual cash flows and matching
the maturity profiles of the financial assets and liabilities.
The table below summarises the maturity profile of the Group's financial liabilities based on contractual undiscounted payments.

UPL Limited Annual Report, 2017-18 320
Notes to consolidated financial statements for the year ended March 31, 2018
INR CroresYear ended March 31, 2018
Less than 1 year 1 to 5 years > 5 years TotalBorrowings (other than convertible preference
shares) (Refer Note 15)
634 3,667 2,206 6,507
Other financial liabilities (Refer Note 16) 715 98 - 812 Trade and other payables (Refer Note 19) 5,675 - - 5,675 Derivative contracts (Refer Note 16) 41 134 - 175
7,064 3,900 2,206 13,170
INR CroresYear ended March 31, 2017
Less than 1 year 1 to 5 years > 5 years TotalBorrowings (other than convertible preference
shares) (Refer Note 15)
684 4,938 412 6,034
Convertible preference shares (Refer Note 15) 24 - - 24Other financial liabilities (Refer Note 16) 766 236 - 1,002Trade and other payables (Refer Note 19) 4,875 10 - 4,885Derivative contracts (Refer Note 16) 37 117 25 179
6,386 5,301 437 12,124
48. Capital managementCapital includes equity attributable to the equity holders of the Parent Capital management is to ensure that Group maintains an efficient capital structure and healthy capital ratios in order to support its business and maximise shareholder value.The Group manages its capital structure and makes adjustments to it, in light of changes in economic conditions or its business requirements. To maintain or adjust the capital structure, the Group may adjust the dividend payment to shareholders, return capital to shareholders or issue new shares. No changes were made in the objectives, policies or processes during the year ended March 31, 2018 and March 31, 2017.
The Group monitors capital using a gearing ratio, which is net debt divided by total capital plus net debt. Net debt is calculated as loans and
borrowings less cash and cash equivalents.
INR Crores
March 31, 2018 March 31, 2017Borrowings other than convertible preference shares (Note 15) 6,638 6,337 Less: cash and cash equivalents (Note 11) (2,859) (2,880)Net debt 3,779 3,457 Optionally Convertible preference shares (Note 15) 0 24Equity 9,188 7,430 Total capital 9,188 7,454 Capital and net debt 12,967 10,912 Gearing ratio 29% 32%
In order to achieve this overall objective, the Group’s capital management, amongst other things, aims to ensure that it meets financial covenants attached to the interest-bearing loans and borrowings that define capital structure requirements. Breaches in meeting the financial covenants would permit the bank to immediately call loans and borrowings. There have been no breaches in the financial covenants of any interest-bearing loans and borrowing in the current period.As per our report of even date attached.
For B S R & Co. LLP For and on behalf of the Board of Directors of UPL Limited Chartered Accountants CIN No.-L24219GJ1985PLC025132Firm's registration No: 101248W/W-100022
Bhavesh Dhupelia R.D. Shroff A.C.AsharPartner Chairman and Managing Director Whole-time DirectorMembership No.: 042070 Din No.-00180810 Din No.- 00192088 Place: Mumbai Place: Mumbai
Anand Vora M.B.Trivedi Chief Financial Officer Company Secretary Membership No.: ACS4250Place: Mumbai Place: Mumbai Place: San FranciscoDate: April 27, 2018 Date: April 27, 2018 Date: April 27, 2018


Uniphos House, C. D. Marg Madhu Park, Khar (West)
Mumbai 400 052.