Embed Size (px)
Citation preview

Annual Report 2012

Quebec City
Longueuil
Drummondville
Laval
Montreal
The annual general meeting of shareholderswill be held on March 28, 2013 at 11:00 a.m., at the Omni Mont-Royal Hotel,1050 Sherbrooke Street West, Montreal, Quebec.
Table of Contents
Financial Highlights 3
Profile 4
Message from the President 5
Network 9
Products 10
Social and Environmental Responsibility 20
Directors and Officers 22
Management’s Report 23
Management’s and Independent Auditors’ Reports 33
Consolidated Statements of Financial Position 34
Consolidated Statements of Earnings 35
Consolidated Statements of Comprehensive Income 35
Consolidated Statements of Changes in Equity 36
Consolidated Statements of Cash Flows 37
Notes to Consolidated Financial Statements 38

13
Quebec City
From our 60 strategic centres, we contribute to the creativity and differentiation strategies
of our customers wherever they may be throughout North America, with a business model tailored to their needs.
Underpinned by innovation, quality and reliability of service, the customer relationship is at the core of every level
of our organization.
From St. John’s to Victoria, from Boston to Seattle
Concept incorporating Richelieu products
1

CASH FLOWS FROM OPERATINg ACTIvITIES (1)
(in millions of $)
2008 2009 2010 2011 2012
37.3
54.4
43.0
45.150.2
EARNINgS PER SHARE
DILuTED(in $)
2008 2009 2010 2011 2012
1.39
2.15
1.56
1.781.87
Sustained growth and profitability Stability ■ Solidity
EQuITY(in millions of $)
2008 2009 2010 2011 2012
240.5
287.9
228.2
253.9 256.2
0.6 0.7
2.9
5.5
2.6
Total debt
SALES(in millions of $)
2008 2009 2010 2011 2012
415.6
447.0
565.8
427.5
523.8
Acquisitions in North America
2012
CourterCo Inc. (Indiana, Kentucky, North Carolina)
2011Outwater Hardware (New Jersey)
Madico Inc. (Quebec)Provincial Woodproducts Ltd. (Newfoundland)
2010Woodland Specialties Inc. (New York State)
Raybern Company, Inc. (Connecticut)gordon Industrial Materials Ltd. (Quebec, Ontario)New Century Distributors group LLC (New Jersey)
E.Kinast Distributors Inc. (Chicago region)PJ White Hardwoods Ltd. (B.C., Alberta)
(1) Measure not consistent with IFRS, as described on page 24.
RICHELIEu Annual Report 2012
2

2012 (1) 2011 (1) 2010 (2) 2009 (2) 2008 (2)
$ $ $ $ $
Sales 565,798 523,786 446,963 415,592 427,536EBITDA (3) 71,163 67,149 63,832 51,588 58,433EBITDA margin (%) 12.6 12.8 14.3 12.4 13.7Net earnings 45,909 40,105 39,233 30,404 35,607Net earnings attributable to shareholders of the Company 45,404 39,726 38,574 (4) 30,605 (4) 35,733 (4)
Net margin attributable to shareholders of the Company (%) 8.0 7.6 8.6 7.4 8.4Cash flows from operating activities (5) 54,403 50,183 45,059 37,310 43,033
FINANCIAL POSITIONNet cash (6) 49,024 23,551 36,431 47,774 5,477Working capital 200,088 166,897 162,727 150,485 130,865Total assets 349,869 318,676 320,816 286,928 273,484Total debt 2,563 5,544 2,858 668 649Equity 287,942 256,187 253,869 240,500 228,234
Average number of shares outstanding (diluted) (in thousands) 21,137 21,262 21,705 22,019 22,785
PER SHARENet earnings attributable to shareholders of the Company ■ basic per share ($) 2.17 1.89 1.79 1.39 1.56■ diluted per share ($) 2.15 1.87 1.78 1.39 1.56Cash flows from operating activities (5) 2.57 2.36 2.08 1.69 1.88Book value ($) 13.65 12.11 12.01 11.04 10.39Dividends 0.48 0.44 0.36 0.32 0.32
RATIOSTotal debt/equity (%) 0.9 2.2 1.1 0.3 0.3Return on average equity (%) 16.9 16.5 15.9 13.0 16.3
(1) The financial statements for 2012 and those for 2011, for comparative purposes, have been prepared in accordance with IFRS.(2) The financial statements for 2010, 2009 and 2008 have been prepared in accordance with gAAP.(3) EBITDA is a non-IFRS measure, as described on page 24 of this report.(4) Net earnings from continuing operations.(5) Cash flows from operating activities and cash flows per share are non-IFRS measures, as described on page 24 of this report.(6) Cash net of debt.
Listing of shares (RCH) on the Toronto Stock Exchange (TSX) in 1993
APPRECIATION IN SHARE PRICE SINCE INITIAL STOCK LISTINg
1,469%
MARKET CAPITALIZATION AS AT NOvEMBER 30, 2012
$ 697.4 million
Financial Highlights
Years ended November 30 (in thousands of $, except per-share amounts, number of shares and ratios)
TOTAL RETuRN ON SHARE/10 YEARS *
195%
AvERAgE ANNuAL RETuRN ON SHARE/10 YEARS*
11.4%* Including dividend reinvestment
RICHELIEu Annual Report 2012
3

ProfileImporter, distributor and manufacturer of specialty
hardware and complementary products
Our customers
Nearly 70,000 customers in North America: kitchen and bathroom cabinet manufacturers, kitchen designers, residential and commercial woodworkers, home furnishing manu facturers, office and ready-to-assemble furniture manu-facturers, renovation superstore chains and purchasing groups including more than 6,000 hardware retailers.
Our team
Some 1,700 people, close to half of whom focus on sales and marketing, and nearly 70% of whom are Richelieu shareholders.
Our products
More than 90,000 products (SKUs) in a wide variety of categories including: kitchen acces-sories, lighting systems, finishing and decora-ting products, functional hardware, ergono-mic workstations, closet and kitchen storage solutions, sliding door systems, decorative and functional panels, high-pressure lami-nates and floor protection products. This offe-ring is complemented by the specialty items manufactured by our two subsidiaries, Cedan Industries Inc. and Menuiserie des Pins Ltée. These include a broad range of veneer sheets and edgebanding products, a variety of deco-rative moldings and components for the win-dow and door industry. In addition, some of our products are manufactured in Asia accor-ding to our specifications and those of our customers.
Our network
60 centres across North America including two manufacturing plants. Our wide array of pro-ducts, our “one-stop shop” service approach, our efficient logistics and the numerous advantages of the transactional website richelieu.com translate into an optimal res-ponse rate for our customers.
Our mission
Remain a top-quality customer-orien ted company, respectful of the interests of our other three partners: our team, our suppliers and our shareholders.
RICHELIEu Annual Report 2012
4

By applying our two-tiered growth strategy of internal growth and acquisitions with success, and by aiming to excel year after year, we continue to achieve a performance that provides Richelieu with financial solidity, strengthens its North American leadership, and also yields an attractive return for shareholders. For instance, that was the case in 2012. New synergies were created during the year and we further improved operational efficiency with the acquisitions closed between 2010 and 2012, including last May’s transaction with CourterCo, a distributor operating in Indiana, Kentucky and North Carolina. Our innovation strategy remains the spearhead of our growth, added to the expertise and dynamism of our sales and customer service teams, it enabled us to gain market share in North America. We thereby achieved a 15.0% rise in earnings per share, a solid internal growth in our Canadian markets, along with an increase of some 20% in U.S. dollars in sales in the United States, also reflecting the impact of our acquisitions and the new agreements entered into with American retailers.
We remain in an impeccable financial position, with cash of $51.6 million, working capital of $200 million and almost no debt, after repurchasing Richelieu shares for some $6 million, further operational investments and the payment of dividends of $10.0 million to our shareholders, the equivalent of 22.1% of 2012 net earnings. During the twelve-month period ended November 30, 2012, our share price appreciated more than 23%.
Richard Lord President and Chief Executive Officer
RICHELIEu Annual Report 2012
5

We succeed in creating value for Richelieu by first creating value
for our customers.
We can rely on a central operations control system and a robust, reliable logistics chain,
in support of our business strategy
and customer orientation.
Our very first priority is to be a growth partner for some 70,000 manufacturer and retailer customers. As part of this commitment, we take our customers’ busi-ness challenges into account when de-veloping our strategies in order to antici- pate their needs and to meet them locally and competitively with a diversified offer- ing of available and innovative products paired with unrivalled quality of service. To contribute more effectively to our cus-tomers’ growth, we have invested in ana-lytical tools that provide us with reliable purchasing profiles from our personalized sales data. We can thereby offer customers innovative solutions to support their crea-tivity and differentiation strategies.
Over the years, we have greatly expanded the range of our innovations and success-fully integrated 46 North American busi-nesses, enabling us to extend our reach across the continent, to integrate quality resources and to establish the critical mass to offer a unique service concept. That has been possible thanks to our business model which incorporates a sustained flow of innovations, while focusing on efficient logistics, expert neighbourhood service, and a good balance between centraliza-tion and decentralization.
We attend closely to our business model in order to achieve our operational and financial objectives, even under more challenging conditions, and to remain at the forefront in regard to service, innova-tion and product offering. We ensure it is always specifically adapted to our custo-mers’ needs.
Our decentralized customer service assu-red by local employees is paired with our strong central operations control system and a North America-wide marketing program that includes regional features as needed. These three inter-dependent components are equally important.
Efficient logistics are a strategic com-mitment at Richelieu, given our exten-sive distribution network and growing number of customers, products and daily orders, including those online. As part of our commitment to being our customers’ growth partner, we must consider their competitiveness challenges and hence prioritize a “one-stop shop” approach, order delivery within 24 hours, efficient inventory management with them and our suppliers, while controlling logistics costs.
RICHELIEu Annual Report 2012
Our supply chain is made fully efficient by the support of a central management information system designed to meet our needs over the short, medium and long terms.
We make every effort to facilitate our customers’ business and to improve the efficiency of their purchases at our centres or at richelieu.com. In 2012, we further automated our logistics operations and thereby enhanced our quality of service and efficiency. The team in charge of our supply chain is made up of seasoned pro-fessionals who ensure that our logistics remain well instrumented, interconnected and efficient network-wide.
Thanks to our rigorous execution, use of the right management tools, interactive website and efficient paperless system, we obtain an optimal service rate and minimize inventory costs while broadening our offering.
Last November, our u.S. East Coast opera-tions temporarily hit by Hurricane Sandy were able to appreciate our efficient inte-grated logistics, as we met our customers’ various needs across the region with the support of some of our other centres.
6

We can rely on the initiatives and
quality of execution of our team, more than half of whom specialize in sales
and customer service. But at
Richelieu, quality of service is everyone’s
concern.
We can rely on our ongoing innovation
strategy as a key growth driver for our customers
and our Company. We manage our
product offering to ensure it remains
innovative and well adapted to
today’s market.
We always consider the potential of any innovations and products we might introduce to our offering. New technolo-gies and design are a constant source of in-novation for our product lines. Our world-wide suppliers are outstanding partners with whom we have built relationships of trust based entirely on performance, crea-tive collaboration and mutual loyalty.
In 2012, we introduced various innova-tions intended for major commercial and architectural woodworking projects as well as smaller-scale residential concepts fitting new urban housing trends. Some of these new solutions enter into retractable furniture and compact or concealed units designed for small areas with a focus on space gain, comfort and quality design.
Architects and designers are influential partners for us, and we hence consider them with the utmost regard. To keep them up-to-date on our innovations, we have designed information sessions with them specifically in mind.
Our innovation strategy entails that we go beyond the current needs expressed by our customers. We provide them with real added value by seeking out the most functional and innovative products from many of the best manufacturers world-wide. We offer these products through di-versified channels, including showrooms, many exclusive brochures and catalogues, a strong presence at major planning and design trade shows in North America, and our trilingual website.
richelieu.com is the most complete, well-documented and interactive portal in our field. Our easily accessible, user-friendly transactional site has become a search and configuration tool supporting the business of our customers.
Our customer culture is shared network- wide. It is based on common values, inclu-ding sound listening skills, an innovation, efficiency and results mindset, integrity and mutual trust. This culture also gives us a competitive edge. In the process of integrating our acquisitions, the teams who join us commit to these values, and we also benefit from theirs.
7

Training is more than ever key to our cus-tomer service strategy, given our high standards of service, our extensive team, the acquisitions we integrate and our strengthened operational structure in the united States. In 2012, we further increased and fine-tuned our professional training and skills development programs, especially in service and sales. We empha-size retaining the best resources. We bene-fit from an outstanding skills base and we enjoy a very low employee turnover rate.
We also innovate in our way of ser-ving customers by giving them access to our offering through our multi- channel service strategy. All our service and interaction channels are a priority, whether it be our representatives, sales desks and showrooms, telephone orders department or website. We have manage- ment tools to assess our daily service performance, and we take any necessary adjustment measures.
We are committed to maintaining Richelieu as a top-quality, prosperous and solid company, while pursuing our growth strategy through internal growth and acquisitions. We will continue to strengthen our fundamentals, improve our ways of doing business and create opportunities.
Our customers will remain central to our decision-making. We will ensure we main-tain the role of growth partner to which we are committed, by building upon our innovation strategy and impeccable com-petitive service.
We will continue to exercise forward- looking management and transparent eva-luation of our performance. As the past has shown, our customer orientation will be of benefit to our other growth partners – our shareholders, employees and suppliers with whom we enjoy special ties.
Changes to Board of Directors
In conclusion, we sincerely thank Mr. Robert Chevrier for contributing to Richelieu’s success for over twenty years. Mr. Chevrier has stepped down as our Chairman of the Board, a position he held since April 2005, after we had bene-fited from his counsel as Director since 1991. We wish him the greatest success in his new responsibilities. Mr. Jocelyn Proteau, who has been with our Board since 2005, succeeds Mr. Chevrier as Chair-man. Mr. Proteau has acquired a wealth of extensive experience in senior manage-ment posi tions, notably at the Desjardins group and as Chairman of the Board at Standard Life Canada from 2004 to 2009 and at BTB Real Estate Investment Trust, as well as Director of several organizations such as HEC Montréal.
On January 24, 2013, we were pleased to welcome Mr. Marc Poulin as Director. Currently President and Chief Executive Officer of Sobeys Inc., Mr. Poulin has solid experience in management, marketing and strategic merchandising in the retail industry, having held various senior mana-gement positions at Sobeys Québec Inc. over the past twelve years and for eight years at Provigo Distribution. His specia-lized experience and dynamism will be of great benefit to Richelieu.
We wish to thank our directors, all our cus-tomers, our suppliers and our other busi-ness partners. We express our gratitude to our team members for their determination to be the best and their commitment to remaining actively involved in Richelieu’s future success.
(Signed) Richard Lord
President and Chief Executive Officer
Our corporate vision guides us in our
growth strategies with a view to sustaining our
North American leadership over the
long term.
8

60 inter-connected centres process and deliver thousands of orders
within 24 hours every day.
60 centres
Canada34 DISTRIBuTION CENTRES
St. John’s, Halifax, Moncton, Drummondville, Quebec City (3), Montreal, Longueuil (2), Laval (2), Ottawa, Toronto, Mississauga, Barrie, Kitchener,
Sudbury, Thunder Bay, Winnipeg, Regina, Saskatoon, Edmonton (2), Calgary (3), Kelowna, vancouver (4), victoria (2)
+ 2 MANuFACTuRINg CENTRESLongueuil, Notre-Dame-Des-Pins
UnITEd STaTES 24 DISTRIBuTION CENTRES
Boston, Hartford, New York, Avenel, Lincoln Park, Syracuse, Raleigh, greensboro, Riviera Beach, Dania, Pompano, Hialeah, Charlotte,
greenville, Cleveland, Columbus, Detroit, Atlanta, Cincinnati, Louisville, Indianapolis, Nashville, Chicago, Seattle
9

Seattle
Greenville
In 2012, we further increased our penetration of the U.S. manufacturers market and greatly enhanced our presence in the retailers market.
In order to meet growth needs, we reinforced our sales and customer service structure, along with our representation towards U.S. architects and designers, and continued to invest in the training of our teams, who are organized according to our markets,
products and customers.
10

Chicago
ClevelandSeattle
NashvillePompano
IndianapolisColumbus
AvenelLincoln Park
SyracuseRaleigh
Greenboro
Atlanta
The U.S. market holds strong growth potential
that Richelieu has undertaken to successfully build upon.
11

Greenville
Thanks to the reach and strength of our Canadian network, combined with our service and sales force, we always remain very close
to our customers. Our commitment to innovation, thoroughness and quality of execution makes all the difference to them.
It is a value-added creation driver for them and for us.
12

Toronto
Kelowna
Saskatoon
VancouverVictoria
SudburyWinnipeg
KitchenerRegina
Thunder Bay
St. John’s HalifaxMoncton Edmonton
Calgary Barry
Ottawa
Richelieu maintains long-lasting relationships with its shareholders,
its customers, its employees and its suppliers.
13

On the strength of its organization and innovation strategy,
Richelieu has built a reputation as a driver of worldwide innovations,
including in the U.S. marketplace.
New York City
Detroit
Boston
Greenville
Riviera BeachDaniaHialeah
Louisville
Hartford
Cincinnati
Seattle
Charlotte
14

Riviera Beach
Our awareness of workplace, retail and living space layout trends, our sustained innovation strategy and our specialty product expertise position us
as the leader with our offering of functional, architectural and decorative hardware.
Our U.S. customers can find an outstanding offering meeting all sizes of diversified needs in our strategically located centres, such as eco-friendly layouts,
ergonomic office solutions, space management solutions, and the latest urban trends in innovative compact housing designs.
15

At Richelieu, the customer can complete his sale even before placing his order, with the help of richelieu.com and the
selling tools we make available.
16

Moncton
Our customer-orientation is certainly defined by our efficient logistics, the scope and diversity of our product offering, and the unique selling tools available
to our customers, but also by the many benefits of our website.
Via richelieu.com, the only trilingual site in our field in North America, our customers access Richelieu from anywhere. They benefit from complete paperless administration of their orders. Thanks to our numerous website product configurators,
they place their orders according to their own specifications in various product categories.
17

Our quality and innovation approach is rooted in our long-standing partnership with the most rigorous and innovative manufacturers worldwide,
including manufacturers from Quebec, other Canadian provinces and the United States.
18

England
SpainUnited States
Canada
Asia
Austria
SwissGermany
Italy
Richelieu has built relationships of trust and powerful collaboration with
leading manufacturers worldwide, for the benefit of its customers.
19

Social and Environmental Responsibility
20

With a rigorous eco-responsible approach, we respect the principles of sustainable development
and environmental regulations.
All our team is concerned with social res-ponsibility, which involves local mutual aid and compliance with a set of values. That was the case, for instance, when Hurricane Sandy hit the U.S. East Coast where we serve a large customer base of small and medium-sized businesses. Our local teams and trucking fleet were rapidly called upon to deliver neces-sary commodities and emergency supplies to the affected communities. Across our North American network, we share a corporate culture rooted in good governance, service excellence, innovation, partnership and mutual aid. We endeavour to maintain a compensation policy that favours the retention of the best resour-ces, offer effective training programs, and observe the strictest workplace safety and security measures.
We have developed a strong environmen-tal awareness. Our distribution and manu-facturing operations do not have a material impact on the environment. Nevertheless, our organization-wide approach is eco-responsible, which notably involves the minimal use of paper, smart product packaging, electronic transmission of reports, holding meetings and training sessions via teleconference, and using vegetable-based inks and recycled paper. We also ensure that residual materials, contai-ners and obsolete inventory components are managed ecologically. We increase the energy- efficiency of our offices, warehouses and show-rooms with efficient lighting systems. Our web-site at richelieu.com is an efficient paperless administrative management tool, as it is used by many of our customers to place their orders and settle their invoices.
We continuously expand our offering of eco-responsible and “green” certified products. Our manufacturer and retailer customers source a large number of FSC and Greenguard certified products from our cen-tres. We have several thousand items that gua-rantee a sound environmental performance, including water-based finishing products and glues, formaldehyde-free decorative panels, items made from recycled materials such as the sturdy lightweight honeycomb panels used in the manufacture of tables and storage furniture, and LED lighting systems.
Support, Hurricane Sandy
Honeycomb panels
LED lighting
RICHELIEu Annual Report 2012
21

DIRECTORS
Jocelyn Proteau * Chairman of the BoardRichelieu Hardware Ltd.Director of Corporations
Richard LordPresident and Chief Executive OfficerRichelieu Hardware Ltd.
Mathieu Gauvin (1)
Partner RSM Richter Inc.
Jean Douville (2) Chairman of the BoarduAP Inc.Chairman of the BoardNational Bank of CanadaDirector of Corporations
Pierre Bourgie (1)
President and Chief Executive OfficerBourgie Financial Corporation (1996) Inc.President, Ipso FactoDirector of Corporations
Denyse Chicoyne (1)
Director of Corporations
Robert Courteau (2)
President and Chief Executive Officer SPI Health and Safety Inc.
Marc Poulin **President and Chief Executive Officer Sobeys Inc.
(1) Member of the Audit Committee
(2) Member of the Human Resources and Corporate governance Committee
* Elected Chairman of the Board on January 24, 2013 following the departure of Mr. Robert Chevrier
** Appointed on January 24, 2013
OFFICERS
Richard LordPresident and Chief Executive Officer
Antoine Auclairvice-President and Chief Financial Officer
Guy Greniervice-President, Sales and Marketing — Sales to Manufacturers Division
Christian Ladouceurvice-President, Sales and Marketing — Sales to Retailers Division
Éric Daignaultgeneral Manager of Divisions
Marion Kloibhofergeneral Manager — Central Canada
John Stattongeneral Manager — Western Canada and Western united States
Charles Whitegeneral Manager — united States
Christian DionManager — Human Resources
Geneviève QuevillonManager — Logistics and Supply Chain
Hélène LévesqueCorporate Secretary
22

2012 HigHligHts
For Richelieu, 2012 was another year focused on growth, productivity, innovation and customer service quality, as reflected by the increase in its performance indicators. The 10 acquisitions closed between 2010 and 2012, including last May’s transaction with CourterCo, brought a solid contribution to results and their integration has led to accretive synergies that will yield further benefits in the coming years. To this contribution were added good internal growth in Canadian markets and a strong advance in the United States where Richelieu continues to increase its market share and product offering to manufacturers and retailers. The Company’s financial position remains impeccable, with almost no debt and excellent liquidity. During the year, shareholders received a total of $10 million in dividends, and the Company repurchased shares for some $6 million. Richelieu remains strongly positioned to pursue its business strategy in North America in 2013.
■ Consolidated sales totalled $565.8 million, up 8.0% over 2011.
■ Earnings before income taxes, interest and amortization (EBITDA) rose 6.0% to $71.2 million.
■ Net earnings attributable to shareholders amounted to $45.4 million or $2.17 per share (basic) and $2.15 (diluted), compared with $1.89 per share (basic) and $1.87 (diluted) in 2011, an increase of 14.8% and 15.0% respectively.
■ The EBITDA margin stood at 12.6%, compared with 12.8% in 2011.
■ Cash flows from operating activities grew to $54.4 million, up 8.4% over 2011.
■ As at November 30, 2012, working capital totalled $200.1 million (4.6:1 current ratio), an increase of 19.9% over November 30, 2011.
■ Cash and cash equivalents reached $51.6 million.
■ Total debt amounted to $2.6 million, of which $0.8 million in long-term debt.
■ Richelieu paid dividends of $10.0 million to its shareholders during 2012, an increase of 8.2%, representing 22.1% of the year’s net earnings attributable to shareholders, and repurchased outstanding common shares (RCH) under its normal course issuer bid for a consideration of $5.9 million.
■ In May 2012, the Company closed the acquisition of the principal net assets of CourterCo Inc. (“CourterCo”), which at the time operated three centres in the United States (Indianapolis, Indiana; Louisville, Kentucky; and Greensboro, North Carolina).
Management’s ReportMANAGEMENT’S DISCUSSIoN AND ANALySIS
oF opERATING RESULTS AND FINANCIAL poSITIoN
year Ended November 30, 2012
CONtENts
2012 Highlights 23
Forward-Looking Statements 24
General Business overview as at November 30, 2012 24
Mission and Strategy 25
Financial Highlights 25
Analysis of operating Results 26
Summary of Quarterly Results and Fourth Quarter 27
Financial position 28
Analysis of principal Cash Flows 28
Analysis of Financial position 29
Contractual Commitments 29
Financial Instruments 30
Internal Control over Financial Reporting 30
Significant Accounting policies and International Financial Reporting Standards (IFRS) 30
Significant Accounting policies and Estimates 30
Risk Management 31
Share price 32
Share Information as at January 24, 2013 32
outlook 32
Supplementary Information 32
23
RICHELIEU Annual Report 2012

This management’s report relates to Richelieu Hardware Ltd.’s consolidated operating results and cash flows for the year ended November 30, 2012 in comparison with the year ended November 30, 2011, as well as the Compa-ny’s financial position at those dates. This report should be read in conjunc-tion with the audited consolidated financial statements for the year ended November 30, 2012 and accompanying notes appearing in the Company’s Annual Report. In this management’s report, “Richelieu” or the “Company” designates, as the case may be, Richelieu Hardware Ltd. and its subsidiaries and divisions, or one of its subsidiaries or divisions. Various supplementary documents, such as the Annual Information Form, interim management’s reports, Management proxy Circular, certificates signed by the Company’s president and Chief Executive officer and Vice-president and Chief Financial officer, as well as press releases issued during the year ended November 30, 2012, are available on the website of the System for Electronic Document Analysis and Retrieval (“SEDAR”) at www.sedar.com.
The information contained in this management’s report accounts for any major event occurring prior to January 24, 2013, on which date the audited consolidated financial statements and annual management’s report were approved by the Company’s Board of Directors. Unless otherwise indicated, the financial information presented below, including tabular amounts, is expressed in Canadian dollars and prepared in accordance with International Financial Reporting Standards (“IFRS”), which since December 1, 2011 represent the Canadian generally accepted accounting principles (“GAAp”) applicable to the Company. The consolidated financial statements for the fourth quarter ended November 30, 2012 have not been audited or reviewed by the Company’s auditors.
Richelieu uses earnings before income taxes, interest and amortization (“EBITDA”) because this measure enables management to assess the Company’s operational performance. This measure is a widely accepted financial indicator of a company’s ability to service and incur debt. However, EBITDA should not be considered by an investor as an alternative to operating income or the net earnings attributable to shareholders of the Company, as an indicator of financial performance or cash flows, or as a measure of liquidity. Because EBITDA is not a standardized measurement as prescribed by IFRS, it may not be comparable to the EBITDA of other companies.
Richelieu also uses cash flows from operating activities and cash flows from operating activities per share. Cash flows from operating activities are based on net earnings plus amortization of property, plant and equipment and in-tangible assets, deferred tax expense (or recovery) and share-based compen-sation expense. These additional measures do not account for net change in non-cash working capital items to exclude seasonality effects and are used by management in its assessments of cash flows from long-term operations.
FORWARD-lOOKiNg stAtEMENts
Certain statements set forth in this management’s report, including state-ments relating to the expected sufficiency of cash flows to cover contractual commitments, to maintain growth and to provide for financing and investing activities, growth outlook, Richelieu’s competitive position in its industry, Richelieu’s ability to weather the current economic context and access other external financing, the closing of new acquisitions, and other statements not pertaining to past events, constitute forward-looking statements. In some ca-ses, these statements are identified by the use of terms such as “may”, “could”, “might”, “intend” “should”, “expect”, “project”, “plan”, “believe”, “estimate” or the negative form of these expressions or other comparable variants. These statements are based on the information available at the time they are written, on assumptions made by management and on the expectations of manage-ment, acting in good faith, regarding future events, including the assumption that economic conditions and exchange rates will not significantly deteriorate, the Company’s deliveries will be sufficient to fulfill Richelieu’s needs, the availability of credit will remain stable during the year and no extraordinary events will require supplementary capital expenditures.
Although management believes these assumptions and expectations to be reasonable based on the information available at the time they are written, they could prove inaccurate. Forward-looking statements are also subject, by their very nature, to known and unknown risks and uncertainties such as those related to the industry, acquisitions, labour relations, credit, key officers, supply and product liability, as well as other factors set forth in the Company’s 2012 Annual Report (see the “Risk Management” section of this management’s report and the 2012 Annual Information Form available on SEDAR at www sedar.com).
Richelieu’s ac tual results could differ materially from those indicated or under-lying these forward-looking statements. The reader is therefore recommended not to unduly rely on these forward-looking statements. Forward-looking state-ments do not reflect the potential impact of special items, any business com-bination or any other transaction that may be announced or occur subsequent to the date hereof. Richelieu undertakes no obligation to update or revise the forward-looking statements to account for new events or new circumstances, except where provided for by applicable legislation.
gENERAl BUsiNEss OVERViEW As At NOVEMBER 30, 2012
Richelieu Hardware Ltd. is a leading North American importer, distributor and manufacturer of specialty hardware and related products.
Its products are targeted to an extensive customer base of kitchen and bathroom cabinet, furniture, and window and door manufacturers plus the residential and commercial woodworking industry, as well as a large customer base of hardware retailers, including renovation superstores. The residential and commercial renovation industry is the Company’s major source of growth.
Richelieu offers customers a broad mix of products sourced from manufac-turers worldwide. The solid relationships Richelieu has built with the world’s leading suppliers enable it to provide customers with the latest innovative products tailored to their business needs. The Company’s product selection consists of some 90,000 different items targeted to a base of nearly 70,000 customers who are served by 60 centres in North America — 34 distribu-tion centres in Canada, 24 in the United States and two manufacturing plants in Canada.
Main product categories include functional cabinet hardware and assembly products for the manufacture of furniture and kitchen cabinets, decorative hardware products, high-pressure laminates, decorative and functional panels, kitchen accessories, ergonomic workstation components, finishing products, whiteboards and tackboards, and floor protection products. Richelieu also spe-cializes in the manufacture of a wide variety of veneer sheets and edgebanding products through its subsidiary Cedan Industries Inc., and of components for the window and door industry and mouldings through Menuiserie des pins Ltée. In addition, some of the Company’s products are manufactured in Asia according to its specifications and those of its customers.
The Company employs about 1,700 people at its head office and throughout the network, close to half of whom work in marketing, sales and customer ser-vice. Approximately 70% of its employees are Richelieu shareholders.
24
RICHELIEU Annual Report 2012

MissiON AND stRAtEgY
Richelieu’s mission is to create shareholder value and contribute to its customers’ growth and success, while favouring a business culture focused on quality of service and results, partnership and entrepreneurship.
To sustain its growth and remain the leader in its specialty market, the Company continues to implement the strategy that has benefited it until now, with a focus on:
■ continuing to strengthen its product selection by annually introducing diversified products that meet its market segment needs and position it as the specialist in functional and decorative hardware for manufacturers and retailers;
■ further developing its current markets in Canada and the United States with the support of a specialized sales and marketing force capable of providing customers with personalized service; and
■ expanding in North America through the opening of distribution centres and through efficiently integrated, profitable acquisitions made at the right price, offering high growth potential and complementary to its product mix and expertise.
Richelieu’s solid and efficient organization, highly diversified product selection and long-term relationships with leading suppliers worldwide position it to compete effectively in a fragmented market consisting mainly of a host of regional distributors who distribute a limited range of products.
FiNANCiAl HigHligHts (audited)(in thousands of $, except per-share amounts, number of shares and data expressed as a %)
2012 (1) 2011 (1) 2010 (2) 2009 (2)
Years ended November 30 $ $ $ $
Sales 565,798 523,786 446,963 415,592
EBITDA (3) 71,163 67,149 63,832 51,588EBITDA margin (%) 12.6 12.8 14.3 12.4
Net earnings 45,909 40,105 39,233 30,404
Net earnings attributable to shareholders of the Company 45,404 39,726 38,574 (4) 30,605 (4)
■ basic per share ($) 2.17 1.89 1.79 1.39■ diluted per share ($) 2.15 1.87 1.78 1.39
Net margin attributable to shareholders of the Company (%) 8.0 7.6 8.6 7.4
Cash flows from operating activities (5) 54,403 50,183 45,059 37,310■ diluted per share ($) 2.57 2.36 2.08 1.69
Cash dividends paid on shares 10,026 9,267 7,768 7,032■ per share ($) 0.48 0.44 0.36 0.32
Weighted average number of shares outstanding (diluted) (in thousands) 21,137 21,262 21,705 22,019
As at November 30
Total assets 349,869 318,676 320,816 286,928Working capital 200,088 166,897 162,727 150,485Current ratio 4.6 4.0 3.7 4.7Equity 287,942 256,187 253,869 240,500Return on average equity (%) 16.9 16.5 15.9 13.0Book value ($) 13.65 12.11 12.01 11.04Total debt 2,563 5,544 2,858 668Cash and cash equivalents 51,587 29,095 39,289 48,442
(1) The financial statements for 2012 and those for 2011, for comparative purposes, have been prepared in accordance with IFRS.
(2) The financial statements for 2010 and 2009 have been prepared in accordance with GAAp.
(3) EBITDA is a non-IFRS measure, as described on page 24 of this report.
(4) Net earnings from continuing operations.
(5) Cash flows from operating activities and cash flows per share are non-IFRS measures, as described on page 24 of this report.
25
RICHELIEU Annual Report 2012
ANAlYsis OF OPERAtiNg REsUlts FOR tHE YEAR ENDED NOVEMBER 30, 2012 COMPARED WitH tHE YEAR ENDED NOVEMBER 30, 2011
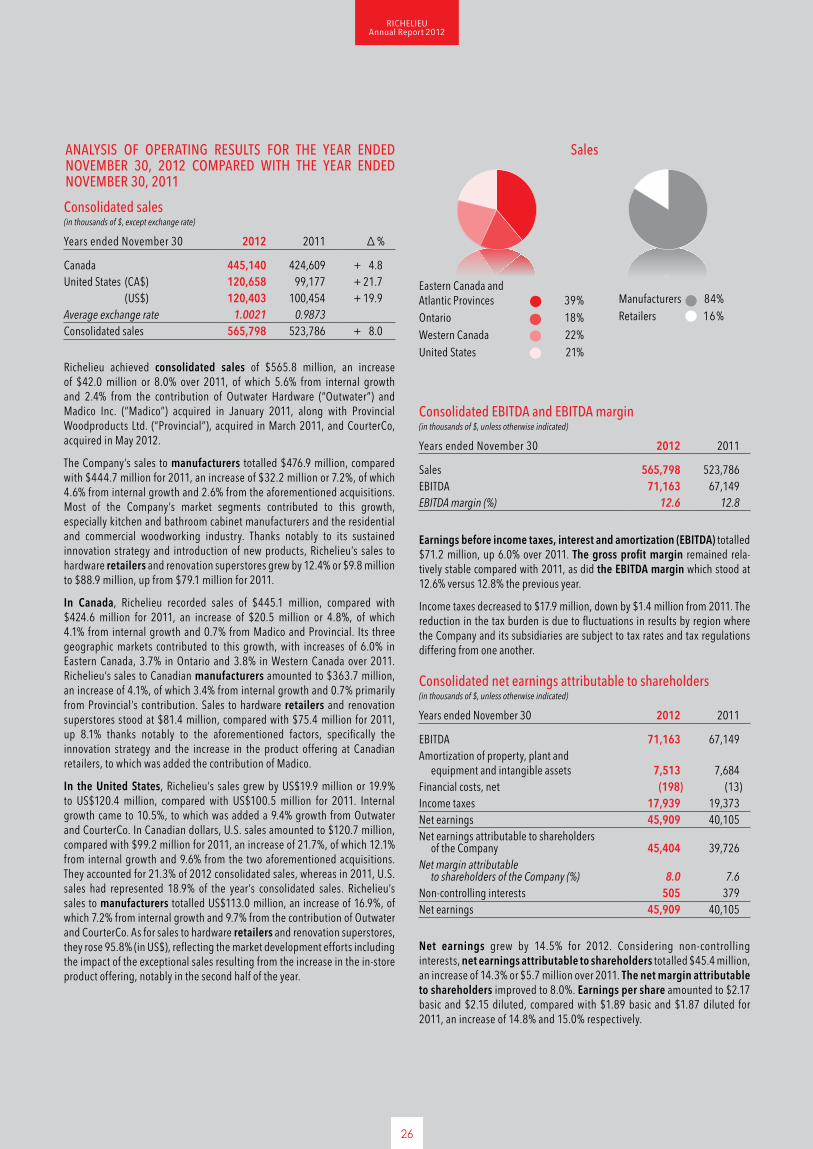
Consolidated sales(in thousands of $, except exchange rate)
years ended November 30 2012 2011 ∆ %
Canada 445,140 424,609 + 4.8United States (CA$) 120,658 99,177 + 21.7 (US$) 120,403 100,454 + 19.9Average exchange rate 1.0021 0.9873Consolidated sales 565,798 523,786 + 8.0
Richelieu achieved consolidated sales of $565.8 million, an increase of $42.0 million or 8.0% over 2011, of which 5.6% from internal growth and 2.4% from the contribution of outwater Hardware (“outwater”) and Madico Inc. (“Madico”) acquired in January 2011, along with provincial Woodproducts Ltd. (“provincial”), acquired in March 2011, and CourterCo, acquired in May 2012.
The Company’s sales to manufacturers totalled $476.9 million, compared with $444.7 million for 2011, an increase of $32.2 million or 7.2%, of which 4.6% from internal growth and 2.6% from the aforementioned acquisitions. Most of the Company’s market segments contributed to this growth, especially kitchen and bathroom cabinet manufacturers and the residential and commercial woodworking industry. Thanks notably to its sustained innovation strategy and introduction of new products, Richelieu’s sales to hardware retailers and renovation superstores grew by 12.4% or $9.8 million to $88.9 million, up from $79.1 million for 2011.
In Canada, Richelieu recorded sales of $445.1 million, compared with $424.6 million for 2011, an increase of $20.5 million or 4.8%, of which 4.1% from internal growth and 0.7% from Madico and provincial. Its three geographic markets contributed to this growth, with increases of 6.0% in Eastern Canada, 3.7% in ontario and 3.8% in Western Canada over 2011. Richelieu’s sales to Canadian manufacturers amounted to $363.7 million, an increase of 4.1%, of which 3.4% from internal growth and 0.7% primarily from provincial’s contribution. Sales to hardware retailers and renovation superstores stood at $81.4 million, compared with $75.4 million for 2011, up 8.1% thanks notably to the aforementioned factors, specifically the innovation strategy and the increase in the product offering at Canadian retailers, to which was added the contribution of Madico.
In the United States, Richelieu’s sales grew by US$19.9 million or 19.9% to US$120.4 million, compared with US$100.5 million for 2011. Internal growth came to 10.5%, to which was added a 9.4% growth from outwater and CourterCo. In Canadian dollars, U.S. sales amounted to $120.7 million, compared with $99.2 million for 2011, an increase of 21.7%, of which 12.1% from internal growth and 9.6% from the two aforementioned acquisitions. They accounted for 21.3% of 2012 consolidated sales, whereas in 2011, U.S. sales had represented 18.9% of the year’s consolidated sales. Richelieu’s sales to manufacturers totalled US$113.0 million, an increase of 16.9%, of which 7.2% from internal growth and 9.7% from the contribution of outwater and CourterCo. As for sales to hardware retailers and renovation superstores, they rose 95.8% (in US$), reflecting the market development efforts including the impact of the exceptional sales resulting from the increase in the in-store product offering, notably in the second half of the year.
Consolidated EBitDA and EBitDA margin (in thousands of $, unless otherwise indicated)
years ended November 30 2012 2011
Sales 565,798 523,786EBITDA 71,163 67,149EBITDA margin (%) 12.6 12.8
Consolidated net earnings attributable to shareholders (in thousands of $, unless otherwise indicated)
years ended November 30 2012 2011
EBITDA 71,163 67,149Amortization of property, plant and equipment and intangible assets 7,513 7,684Financial costs, net (198) (13)Income taxes 17,939 19,373Net earnings 45,909 40,105Net earnings attributable to shareholders of the Company 45,404 39,726Net margin attributable to shareholders of the Company (%) 8.0 7.6Non-controlling interests 505 379Net earnings 45,909 40,105
Répartition géographique Par segment de marchéRépartition géographique Par segment de marché
Eastern Canada and Atlantic provinces 39%ontario 18%Western Canada 22%United States 21%
Manufacturers 84%Retailers 16%
salesRépartition géographique Par segment de marchéRépartition géographique Par segment de marché
Earnings before income taxes, interest and amortization (EBITDA) totalled $71.2 million, up 6.0% over 2011. The gross profit margin remained rela-tively stable compared with 2011, as did the EBITDA margin which stood at 12.6% versus 12.8% the previous year.
Income taxes decreased to $17.9 million, down by $1.4 million from 2011. The reduction in the tax burden is due to fluctuations in results by region where the Company and its subsidiaries are subject to tax rates and tax regulations differing from one another.
Net earnings grew by 14.5% for 2012. Considering non-controlling interests, net earnings attributable to shareholders totalled $45.4 million, an increase of 14.3% or $5.7 million over 2011. The net margin attributable to shareholders improved to 8.0%. Earnings per share amounted to $2.17 basic and $2.15 diluted, compared with $1.89 basic and $1.87 diluted for 2011, an increase of 14.8% and 15.0% respectively.
26
RICHELIEU Annual Report 2012

Quarterly variations in earnings — The first quarter ending February 28 is generally the year’s weakest for Richelieu in light of the smaller number of business days due to the end-of-year holiday period and a wintertime slow-down in renovation and construction work. The third quarter ending August 31 also includes a smaller number of business days due to the summer holidays, which can be reflected in the period’s financial results. The second and fourth quarters respectively ending May 31 and November 30 generally represent the year’s most active periods.
Note: For further information about the Company’s performance in the first, second and third quarters of 2012, the reader is referred to the interim management’s reports avail-able on SEDAR’s website at www.sedar.com.
FOURtH QUARtER ENDED NOVEMBER 30, 2012
Richelieu achieved consolidated sales of $145.8 million, an increase of $10.5 million or 7.8% over the corresponding quarter of 2011, of which 5.5% from internal growth and 2.3% from the acquisition of CourterCo.
The Company’s sales to manufacturers totalled $125.3 million, compared with $117.0 million for the corresponding period of 2011, an increase of $8.3 million or 7.1%, of which 4.5% from internal growth and 2.6% from the aforementioned acquisition. During the fourth quarter, Richelieu continued to achieve a very good performance in its principal market segments, specifically kitchen and bathroom cabinet manufacturers and the residential and commercial woodworking industry, in both Canada and the United States. The Company’s sales to hardware retailers and renovation superstores amounted to $20.5 million, compared with $18.3 million for the corresponding quarter of
Comprehensive income stood at $44.8 million, on account of a negative adjustment of $1.2 million on translation of the financial statements of the subsidiary in the United States, compared with $40.2 million for 2011, on account of a positive adjustment of $0.1 million on translation of the financial statements of the subsidiary in the United States.
sUMMARY OF QUARtERlY REsUlts (unaudited)(in thousands of $, except per-share amounts)
Quarters 1 2 3 4
2012■ Sales 124,083 147,107 148,782 145,826■ EBITDA 13,280 18,617 19,636 19,630■ Net earnings
attributable to shareholders of the Company 8,004 11,997 12,761 12,642
basic per share 0.38 0.57 0.61 0.61 diluted per share 0.38 0.57 0.60 0.60
2011■ Sales 113,192 139,178 136,132 135,284■ EBITDA 12,018 17,075 19,153 18,903■ Net earnings
attributable to shareholders of the Company 6,989 10,015 11,411 11,311
basic per share 0.33 0.48 0.54 0.54 diluted per share 0.33 0.47 0.54 0.54
2010 (GAAp)■ Sales 95,183 117,960 115,957 117,863■ EBITDA 10,880 18,764 17,054 17,134■ Net earnings 7,002 11,502 10,348 10,381 basic per share 0.32 0.53 0.48 0.49 diluted per share 0.32 0.53 0.48 0.48
2011, an increase of $2.2 million or 12.0% to which all its geographic markets contributed, thanks notably to its sustained innovation strategy and the greater diversity of its product offering.
In Canada, sales amounted to $114.6 million, up from $108.4 million for the fourth quarter of 2011, an increase of $6.2 million or 5.7% stemming from internal growth. The markets in Eastern Canada, ontario and Western Canada contributed to this growth with increases of 7.4%, 2.8% and 5.1% respectively. The Company’s sales to manufacturers grew by 5.4% to $96.4 million, compared with $91.4 million for the fourth quarter of 2011. Richelieu’s sales to hardware retailers and renovation superstores increased by 7.4%, thanks notably to the in-store introduction of new products; they totalled $18.2 million, compared with $17.0 million for the corresponding quarter of 2011.
In the United States, the Company recorded sales of US$31.6 million, compared with US$26.5 million for the corresponding quarter of 2011, an increase of US$5.1 million or 19.4%, of which 7.3% from internal growth and 12.1% from the contribution of CourterCo. Constant market penetration efforts and the introduction of new product lines to manufacturers and retailers con-tinued to yield benefits. This growth is all the more appreciable as the fourth quarter was partially affected by an activity slowdown on the U.S. East Coast caused by Hurricane Sandy at the end of october. In Canadian dollars, U.S. sales amounted to $31.2 million, compared with $26.9 million for the cor-responding quarter of 2011, an increase of 16.1%, of which 4.4% from inter-nal growth and 11.7% from CourterCo. They accounted for 21.4% of fourth- quarter consolidated sales, whereas for the fourth quarter of 2011, U.S. sales had represented 19.9% of the period’s consolidated sales. The Company’s sales to manufacturers amounted to US$29.3 million, an increase of 16.5%, of which 4.0% from internal growth and 12.5% from CourterCo. As for sales to hardware retailers and renovation superstores, they grew by 77.5% (in US$), reflecting the market development efforts and the impact of the exceptional sales resulting from the in-store introduction of additional products during the fourth quarter.
Earnings before income taxes, interest and amortization (EBITDA) totalled $19.6 million, an increase of 3.8% over the corresponding quarter of 2011, primarily reflecting the sales growth. Notwithstanding the recent acquisition of CourterCo whose product mix differs from that of Richelieu and the impact of the introduction of additional products in the retailers market, the gross profit margin remained stable compared with the corresponding quarter of 2011 and the EBITDA margin stood at 13.5%.
Income taxes decreased to $5.0 million, down by $0.5 million from the fourth quarter of 2011. The reduction in the tax burden is due to fluctuations in results by region where the Company and its subsidiaries are subject to tax rates and tax regulations differing from one another.
Fourth-quarter net earnings grew by 12.1%. Considering non-controlling interests, net earnings attributable to shareholders of the Company totalled $12.6 million, an increase of 11.8% over the corresponding quarter of 2011. The net margin attributable to shareholders improved to 8.7%. Earnings per share amounted to $0.61 basic and $0.60 diluted, up from $0.54 basic and diluted for the fourth quarter of 2011, an increase of 13.0% and 11.1% respectively.
Comprehensive income stood at $13.2 million, on account of a positive adjustment of $0.4 million on translation of the financial statements of the subsidiary in the United States, compared with $12.7 million for the corresponding quarter of 2011, on account of a positive adjustment of $1.3 million on translation of the financial statements of the subsidiary in the United States.
27
RICHELIEU Annual Report 2012

Cash flows from operating activities (before net change in non-cash working capital balances) totalled $14.8 million or $0.70 diluted per share, remaining virtually identical to those for the fourth quarter of 2011. Net change in non-cash working capital balances provided cash flows of $2.8 million, compared with $3.7 million for the fourth quarter of 2011. Consequently, operating activities provided cash flows of $17.6 million, compared with $18.4 million for the fourth quarter of 2011.
Financing activities represented a cash outflow of $5.6 million, compared with $5.8 million for the corresponding quarter of 2011. The Company paid shareholder dividends of $2.5 million, an increase of 8.8%, on account of the 9.1% dividend increase announced in January 2012. During the quarter, Richelieu repurchased common shares under its normal course issuer bid for $3.1 million, compared with $3.9 million for the fourth quarter of 2011. In addition, it issued common shares for $0.3 million upon the exercise of options under its stock option plan, compared with $0.7 million in the cor-responding quarter of 2011.
Investing activities represented a cash outflow of $2.3 million, primar-ily for equipment needed for operations, whereas the Company had invested $0.7 million in various property, plant and equipment during the correspond-ing quarter of 2011.
FiNANCiAl POsitiON
Analysis of principal cash flows for the year ended November 30, 2012
Change in cash and cash equivalents and capital resources (in thousands of $))
years ended November 30 2012 2011
Cash flows provided by (used for):operating activities 45,622 38,313Financing activities (16,214) (19,690)Investing activities (7,183) (29,080)Effect of exchange rate changes 267 263
Net change in cash and cash equivalents 22,492 (10,194)Cash and cash equivalents, beginning of year 29,095 39,289
Cash and cash equivalents, end of year 51,587 29,095
As at November 30 2012 2011
Working capital 200,088 166,897Renewable line of credit (CA$) 26,000 26,000Renewable line of credit (US$) 6,000 5,000
Operating activities
Cash flows from operating activities (before net change in non-cash working capital balances) totalled $54.4 million or $2.57 diluted per share, compared with $50.2 million or $2.36 diluted per share for 2011, primarily reflecting the $5.8 million increase in net earnings and the $1.6 million decrease in deferred taxes. Net change in non-cash working capital used cash flows of $8.8 million, compared with $11.9 million for 2011. Changes in accounts receivable and inventories used cash flows of $10.8 million, whereas other items represented a cash inflow of $2.0 million. Consequently, operating activities provided cash flows of $45.6 million, compared with $38.3 million for 2011.
Financing activities
Richelieu paid shareholder dividends of $10.0 million, up 8.2% over 2011, on account of the 9.1% dividend increase announced in January 2012. The Company also issued common shares for $2.6 million upon the exercise of options under its stock option plan, compared with $1.5 million in 2011, and repurchased common shares under its normal course issuer bid for $5.9 million, compared with $10.5 million in 2011. Furthermore, Richelieu repaid $2.9 million on its long-term debt, compared with a $1.4 million repayment in 2011. Consequently, financing activities represented a cash outflow of $16.2 million, compared with $19.7 million for 2011.
investing activities
During 2012, the Company invested a total of $7.2 million, of which $2.4 million in the acquisition of the net assets of CourterCo and $4.8 million in software and equipment required for its operations. It is to be noted that during 2011, the Company had invested $29.1 million, of which $18.4 million in the acquisition of the net assets of outwater, the shares of Madico and 85% of the common shares of provincial and $10.7 million in property, plant and equipment, primarily in the expansion of the Montreal and Laval distribution centres as well as complementary modules to its information technology system.
sources of financing
As at November 30, 2012, cash and cash equivalents totalled $51.6 million, compared with $29.1 million a year earlier. The Company posted a working capital of $200.1 million for a current ratio of 4.6:1, compared with $166.9 million (4.0:1 ratio) as at November 30, 2011.
Richelieu believes it has the capital resources to fulfill its ongoing commitments and obligations and to assume the funding requirements needed for its growth and the financing and investing activities planned for 2013. The Company continues to benefit from an authorized line of credit of CA$26 million as well as a line of credit of US$6 million renewable annually and bearing interest respectively at prime rate and at base rate. In addition, the Company estimates it could obtain access to other outside financing if necessary.
The expectation set forth above consists of forward-looking information based on the assumption that economic conditions and exchange rates will not deteriorate significantly, operating expenses will not increase considerably, deliveries will be sufficient to fulfill Richelieu’s requirements, the availability of credit will remain stable in 2013, and no unusual events will entail additional capital expenditures. This expectation also remains subject to the risks identified under “Risk Management”.
28
RICHELIEU Annual Report 2012

summary financial position (in thousands of $)
As at November 30 2012 2011
Current assets 256,210 223,059Long-term assets 93,659 95,617Total 349,869 318,676Current liabilities 56,122 56,162Long-term liabilities 5,805 6,327Equity attributable to shareholders
of the Company 283,835 252,467Non-controlling interests 4,107 3,720Total 349,869 318,676Exchange rate on translation of a subsidiary in the United States 0.9936 1.0203
CONtRACtUAl COMMitMENts
summary of contractual financial commitments as at November 30, 2012 (in thousands of $)
2013 2014 2015 2016 2017 2018 and thereafter
Total
Long-term debt 1,743 820 – – – – 2,563operating leases 6,874 5,550 4,328 3,098 1,453 1,298 22,601Total 8,617 6,370 4,328 3,098 1,453 1,298 25,164
For 2013 and the foreseeable future, the Company expects cash flows from operating activities and other sources of financing to meet its ongoing contractual commitments.
The expectation set forth above consists of forward-looking information based on the assumption that economic conditions and exchange rates will not deteriorate significantly, operating expenses will not increase considerably, deliveries will be sufficient to fulfill its requirements, the availability of credit will remain stable in 2013, and no usual events will entail additional capital expenditures. This expectation also remains subject to the risks identified under “Risk Management”.
Net cash (in thousands of $)
As at November 30 2012 2011
Current portion of long-term debt 1,743 4,309Long-term debt 820 1,235Total 2,563 5,544Cash and cash equivalents 51,587 29,095Total cash net of debt 49,024 23,551
Analysis of financial position as at November 30, 2012
Assets
Total assets amounted to $349.9 million as at November 30, 2012, compared with $318.7 million a year earlier, up by 9.8% or $31.2 million. This increase resulted from the Company’s growth and the CourterCo acquisition. Current assets grew by 14.9% or $33.2 million over November 30, 2011, notably reflecting the increases of $8.9 million in inventories, $22.5 million in cash and cash equivalents and $3.4 million in accounts receivable, whereas prepaid expenses decreased by $0.4 million and income taxes receivable by $1.2 million.
The Company benefits from an excellent financial position to pursue its business strategy. As at November 30, 2012, total debt amounted to $2.6 million, of which $0.8 million in long-term debt and a current portion of $1.7 million representing the balances payable on previous acquisitions.
Equity reached $283.8 million as at November 30, 2012, compared with $252.5 million as at November 30, 2011, an increase of 12.4% stemming mainly from the $29.7 million growth in retained earnings which totalled $258.8 million as at November 30, 2012 and a $3.6 million increase in share capital, less the change in accumulated other comprehensive income of $1.2 million and the change in contributed surplus of $0.8 million. The book value per share stood at $13.65 at 2012 year-end, compared with $12.11 as at November 30, 2011.
Return on average equity stood at 16.9% as at November 30, 2012, com-pared with 16.5% a year earlier.
As at November 30, 2012, the Company’s share capital consisted of 20,794,484 common shares (20,846,709 shares as at November 30, 2011). During the year, the Company issued 121,375 common shares at an average price of $21.22 (84,300 in 2011 at an average price of $18.24) upon the exer-cise of options under its stock option plan. Also during 2012, 173,600 common shares were purchased for cancellation under the Company’s normal course issuer bid for a cash consideration of $5.9 million (372,800 common shares for a cash consideration of $10.5 million in 2011). Finally, during 2012, the Company granted 41,000 stock options (51,000 in 2011). Consequently, as at November 30, 2012, 762,000 stock options were outstanding (883,000 as at November 30, 2011).
29
RICHELIEU Annual Report 2012

FiNANCiAl iNstRUMENts
Richelieu periodically enters into forward exchange contracts to fully or par-tially hedge the effects of foreign currency fluctuations related to foreign-currency denominated payables or to hedge forecasted purchase transactions. The Company has a policy of not entering into derivatives for speculative or negotiation purposes and to enter into these contracts only with major finan-cial institutions.
In notes (1) and (12) of the audited consolidated financial statements for the year ended November 30, 2012, the Company presents the information on the classification and fair value of its financial instruments, as well as on their value and management of the risks arising from their use.
iNtERNAl CONtROl OVER FiNANCiAl REPORtiNg
Management has designed and evaluated internal controls over financial re-porting (ICFR) and disclosure controls and procedures (DC&p) to provide rea-sonable assurance that the Company’s financial reporting is reliable and that its publicly-disclosed financial statements are prepared in accordance with IFRS. The president and Chief Executive officer and the Vice-president and Chief Financial officer have assessed, within the meaning of National Instru-ment 52-109 – Certification of Disclosure in Issuers’ Annual and Interim Filings, the design and the effectiveness of internal controls over financial reporting as at November 30, 2012. In light of this assessment, they concluded that the design and the effectiveness of internal controls over financial reporting (ICFR and DC&p) were effective. During the year ended November 30, 2012, management verified that there were no material changes in the Company’s procedures that were reasonably likely to have a material impact on its internal control over financial reporting. No such changes were identified.
Due to their intrinsic limits, internal controls over financial reporting only provide rea-sonable assurance and cannot forecast or detect inaccuracies. In addition, projections of an assessment of effectiveness in future periods carry the risk that controls will become inappropriate as a result of changes in conditions or if the degree of conformity with standards and methods should deteriorate.
sigNiFiCANt ACCOUNtiNg POliCiEs AND iNtERNAtiONAl FiNANCiAl REPORtiNg stANDARDs
As stated previously, the Company’s audited consolidated financial statements for the year ended November 30, 2012 have been prepared by management in accordance with IFRS. Notes 2 and 16 accompanying the consolidated financial statements for 2012 present the new accounting policies and explain the ex-tent to which the transition to IFRS had an impact on the Company’s financial position, operating results and cash flows.
sigNiFiCANt ACCOUNtiNg POliCiEs AND EstiMAtEs
The preparation and presentation of the consolidated financial statements and other financial information contained in this report require management to make estimates, assumptions and enlightened judgments. The Company’s es-timates are based upon assumptions which it believes to be reasonable, such as those based upon past experience. These estimates constitute the basis for the judgments regarding the carrying amounts of assets and liabilities that would not otherwise be readily available through other sources. Use of dif-ferent methods might have yielded different amounts than those presented. Actual results could differ from those estimates.
Cash and cash equivalents
Cash and cash equivalents consist of cash on hand and highly liquid investments with an initial term of three months or less. Cash and cash equivalents were classified as financial instruments in financial assets at fair
value through net earnings and measured at fair value. Gains (losses) arising from remeasurement at each year-end are recorded in the consolidated statement of earnings.
Accounts receivable
Accounts receivable are classified as financial instruments in loans and receiv-ables and carried at cost, which is equivalent to fair market value on initial recognition. Subsequent measurements are recorded at amortized cost using the effective interest method. For the Company, this measurement is usually equivalent to cost due to their short-term maturities..
inventories
Inventories, which consist primarily of finished goods, are valued at the lower of average cost and net realizable value. Net realizable value is the expected selling price in the normal course of business, less estimated costs to sell. The Company uses significant judgment when estimating the effect of certain fac-tors on the net realizable value of inventory, such as inventory obsolescence and loss. The quantity, age and condition of inventory are measured and assessed regularly during the year.
Property, plant and equipment
property, plant and equipment are recorded at cost and are amortized on a straight-line basis over their useful lives. The main components with different useful lives are amortized separately. The amortization method and useful life estimates are reviewed annually.
intangible assets
Intangible assets are acquired assets that lack physical substance and meet the specified criteria for recognition apart from goodwill and property, plant and equipment. Intangible assets consist of purchased or internally de-veloped software, customer relationships, non-competition agreements and trademarks. Software and customer relationships are amortized on a straight-line basis over their estimated useful lives of three years and 10 to 20 years, respectively, while non-competition agreements are amortized over the terms of the agreements. Trademarks have an indefinite useful life and, therefore, are not amortized.
goodwill
Goodwill represents the excess of the purchase price over the fair value of net assets acquired. Goodwill is not amortized.
impairment of non-current assets
At the end of each reporting period, the Company must determine whether indicators of impairment exist for its non-current assets, excluding goodwill and intangible assets with indefinite lives. If such indicators exist, the non-current assets are tested for impairment. When the impairment test indicates that the carrying amount of the intangible asset exceeds its fair value, an im-pairment loss is recognized in net earnings in an amount equal to the excess. The Company is required to test goodwill and intangible assets with indefinite lives for impairment at least once a year, whether or not indicators of impair-ment exist. Impairment tests are carried out on the asset itself, the cash-gener-ating unit (“CGU”) or group of CGUs. A CGU is the smallest identifiable group of assets that generates cash inflows that are largely independent of the cash in-flows from other assets or groups of assets. Goodwill and the supporting assets that cannot be wholly allocated to a single CGU are tested for impairment at the group of CGUs level.
30
RICHELIEU Annual Report 2012

income taxes
The Company follows the liability method of accounting for income taxes. Under this method, deferred tax assets and liabilities are accounted for on the basis of estimated taxes recoverable or payable that would result from the recovery or settlement of the assets or liabilities at book value. Deferred tax assets and liabilities are measured using substantially enacted tax rates expected to be in effect in the years in which the temporary differences are expected to reverse. Changes in these balances are recognized in net earnings in the year in which they occur.
Foreign currency translation
The consolidated financial statements are presented in the Company’s func-tional currency, which is the Canadian dollar. The Company follows the tem-poral method of translating foreign currency balances and transactions into Canadian dollars, except for the accounts of its foreign subsidiary. Under this method, monetary assets and liabilities are translated at the exchange rate in effect at the end of the reporting period and the other items in the statements of financial position and earnings are translated at the exchange rates in effect at the date of transaction. Foreign exchange gains and losses are recognized in net earnings in the year in which they arise.
The assets and liabilities of the U.S. subsidiary are translated into Canadian dol-lars at the exchange rate in effect at the end of the reporting period. Revenues and expenses are translated at the rate in effect at the date of transaction. For-eign exchange gains and losses are recognized in the consolidated statements of comprehensive income.
Foreign exchange forward contracts
The Company periodically enters into foreign exchange forward contracts with major financial institutions to partially hedge the effects of changes in foreign exchange rates related to foreign currency liabilities, as well as to hedge an-ticipated purchase transactions. The Company does not use derivatives for speculative purposes. The Company uses hedge accounting only when IFRS documentation criteria are met. Derivative financial instruments designated as cash flow hedges are classified as held-for-sale financial assets and liabilities and are measured at fair value, which is the instruments’ approximate settle-ment value at market rates. Gains and losses on remeasurement at each year-end are recorded in comprehensive income. If the instrument is not designated and documented as a hedge, changes in fair value are recognized in earnings for the year. Assets or liabilities related to derivative financial instruments are included in accounts receivable or accounts payable and accrued liabilities in the consolidated statements of financial position.
RisK MANAgEMENt
Richelieu is exposed to different risks that can have an impact on its profitabil-ity. To offset them, the Company has adopted various strategies adapted to the major risk factors below.
Economic conditions
Richelieu’s operations and financial results partly depend on general economic conditions and the economic factors specific to the renovation and construc-tion industry. Any economic downturn can lead to a decline in sales and have an adverse impact on the Company’s financial performance.
Market and competition
The specialty hardware and renovation products segment is highly competi-tive. Richelieu has developed a business strategy rooted in a product offer-ing that is unmatched in various targeted niche markets in North America and sourced from suppliers around the world, in creative marketing and in unparal-leled expertise and quality of service. Up to now, this strategy has enabled it to benefit from a solid competitive edge. However, if Richelieu were unable to implement its business strategy with the same success in the future, it could lose market share and its financial performance could be adversely affected.
Foreign currency
Richelieu is exposed to the risks related to currency fluctuations, primarily in regard to foreign-currency denominated purchases and sales made abroad.
The Company’s products are regularly sourced from abroad through its import business. Thus, any increase in foreign currencies (U.S. dollar and the Euro) compared with the Canadian dollar tends to raise its supply cost and thereby affect its consolidated financial results. These currency fluctuation related risks are mitigated by the Company’s ability to adjust its selling prices within a rela-tively short timeframe so as to protect its profit margins, although significant volatility in foreign currencies can have an adverse impact on its sales.
Sales made abroad are mainly recorded in the United States and account for more or less 20% of total sales. Any volatility in the Canadian dollar therefore tends to affect consolidated results. This risk is partially offset by the fact that major purchases are denominated in U.S. dollars.
To manage its currency risk, the Company uses derivative financial instru-ments, more specifically forward exchange contracts in U.S. dollars and Euros. There can be no assurance that the Company will not sustain losses arising from these financial instruments or fluctuations in foreign currency.
supply and inventory management
Richelieu must anticipate and meet its customers’ supply needs. To that end, the Company must maintain solid relationships with suppliers respecting its supply criteria. The inability to maintain such relationships or to efficiently manage the supply chain and inventories could affect the Company’s financial position. Similarly, Richelieu must track trends and its customers’ preferences and maintain inventories meeting their needs, failing which its financial per-formance could be adversely affected.
To mitigate its supply-related risks, Richelieu has built solid long-term rela-tionships with numerous suppliers on several continents, most of whom are world leaders.
31
RICHELIEU Annual Report 2012

Acquisitions
Acquisitions in North America remain an important strategic focus for Richelieu. The Company will maintain its acquisition criteria and pay special attention to the integration of acquisitions. Nevertheless, there is no guaran-tee that a business matching Richelieu’s acquisition criteria will be available and there can be no assurance that the Company will be able to make acquisi-tions at the same pace as in the past. However, note that the U.S. market is highly fragmented and acquisitions are smaller sized, which reduces the inher-ent financial and operational risks.
Credit
The Company is exposed to the credit risk related to its accounts receivable. Richelieu has adopted a policy defining the credit conditions for its customers to safeguard against credit losses arising from doing business with them. For each customer, the Company sets a specific limit that is regularly reviewed. The diversification of its products, customers and suppliers protects Richelieu against a concentration of its credit risk. None of its customers’ accounts for more than 10% of its revenues.
labour relations and qualified employees
To achieve its objectives, Richelieu must attract, train and retain qualified em-ployees while controlling its payroll. The inability to attract, train and retain qualified employees and to control its payroll could have an impact on the Company’s financial performance.
About one-quarter of Richelieu’s workforce is unionized. The Company’s policy is to negotiate collective agreements at conditions enabling it to maintain its competitive edge and a positive and satisfactory working environment for its entire team. Richelieu has not experienced any major labour conflicts over the past five years. Any interruption in operations as a result of a labour conflict could have an adverse impact on the Company’s financial results.
stability of key officers
Richelieu offers a stimulating working environment and a competitive com-pensation plan, which help it retain a stable management team. Failure to retain the services of a highly qualified management team could comprom-ise the success of Richelieu’s strategic execution and expansion, which could have an adverse impact on its financial results. To adequately manage its fu-ture growth, the Company adjusts its organizational structure as needed and strengthens the teams at the various levels of its business. It should be noted that approximately 70% of its employees, including senior officers, are Riche-lieu shareholders.
Product liability
In the normal course of business, Richelieu is exposed to various product liabil-ity claims that could result in major costs and affect the Company’s financial position. Richelieu has agreements containing the usual limits with insurance companies to cover the risks of claims associated with its operations.
Crisis management and it contingency plan
The IT structure implemented by Richelieu enables it to support its oper-ations and contributes to ensure their efficiency. As the occurrence of a dis-aster, including a major interruption of its computer systems, could affect its operations and financial performance, the Company has implemented a crisis management and IT contingency plan to reduce the extent of such a risk. This plan provides among others for an alternate physical location in the event of a disaster, generators in the event of power outages and a relief computer as powerful as the central computer.
sHARE PRiCE
In 2012, the share price fluctuated between $26.92 and $35.92, and the vol-ume traded on the Toronto Stock Exchange totalled approximately 2.7 million shares. The closing price was $33.54 on November 30, 2012, compared with $27.22 as at November 30, 2011. Richelieu’s share price has increased by 1,469% since its 1993 listing on the stock market. It should also be pointed out that the Company has paid shareholder dividends since 2002 and that the dividends paid in 2012 represented 22.1% of the year’s net earnings attribu-table to shareholders.
sHARE iNFORMAtiON As At JANUARY 24, 2013
Issued and outstanding common shares: 20,812,384
Stock options under stock option plan: 744,100
OUtlOOK
In 2013 and subsequent years, Richelieu will maintain its growth strategy, with a focus on innovation, market development and the creation of commer-cial and operational synergies with its latest acquisitions so as to continue driving its internal growth, as well as on efficiently integrated acquisitions consistent with its financial and operational objectives. on the strength of its business model and excellent resources, the Company will be able to take advantage of any eventual economic recovery in the United States.
sUPPlEMENtARY iNFORMAtiON
Further information about Richelieu, including its latest Annual Information Form, is available on the System for Electronic Document Analysis and Retrieval (SEDAR) website at www.sedar.com.
(Signed) Richard Lord (Signed) Antoine Auclair
president and Vice-president and Chief Executive officer Chief Financial officer
January 24, 2013
32
RICHELIEU Annual Report 2012

Management’s ReportRelated to the consolidated financial statements
The consolidated financial statements of Richelieu Hardware Ltd. (the “Company”) and other financial information included in this Annual Report are the responsibility of the Company’s management. These consolidated financial statements have been prepared by management in accordance with IFRS and approved by the Board of Directors.
Richelieu Hardware Ltd. maintains accounting and internal control systems which, in management’s opinion, reasonably ensure the accuracy of the financial information and maintain proper standards of conduct in the Company’s activities.
The Board of Directors fulfills its responsibility regarding the consolidated financial statements included in the Annual Report, primarily through its Audit Committee. This committee which meets periodically with the Company’s managers and external auditors, has reviewed the consolidated financial statements of Richelieu Hardware Ltd. and has recommended that they be approved by the Board of Directors.
The consolidated financial statements have been audited by the Company’s external auditors, Ernst & young LLp, Chartered professional Accountants.
Montreal, Canada January 24, 2013
(Signed) Richard Lord (Signed) Antoine Auclair president and Chief Executive officer Vice-president and Chief Financial officer
Independent Auditors’ ReportTo the Shareholders of Richelieu Hardware Ltd.
We have audited the accompanying consolidated financial statements of Richelieu Hardware Ltd., which comprise the consolidated statements of financial position as at November 30, 2012 and 2011 and December 1, 2010, and the consolidated statements of earnings, comprehensive income, changes in equity and cash flows for the years ended November 30, 2012 and 2011, and a summary of significant accounting policies and other explanatory information.
Management’s responsibility for the consolidated financial statements
Management is responsible for the preparation and fair presentation of these consolidated financial statements in accordance with International Financial Reporting Standards, and for such internal control as management determines is necessary to enable the preparation of consolidated financial statements that are free from material misstatement, whether due to fraud or error.
Auditors’ responsibility
our responsibility is to express an opinion on these consolidated financial statements based on our audits. We conducted our audits in accordance with Canadian generally accepted auditing standards. Those standards require that we comply with ethical requirements and plan and perform the audit to obtain reasonable assurance about whether the consolidated financial statements are free from material misstatement.
An audit involves performing procedures to obtain audit evidence about the amounts and disclosures in the consolidated financial statements. The procedures selected depend on the auditors’ judgment, including the assessment of the risks of material misstatement of the consolidated financial statements, whether due to fraud or error. In making those risk assessments, the auditors consider internal control relevant to the entity’s preparation and fair presentation of the consolidated financial statements in order to design audit procedures that are appropriate in the circumstances, but not for the purpose of expressing an opinion on the effectiveness of the entity’s internal control. An audit also includes evaluating the appropriateness of accounting policies used and the reasonableness of accounting estimates made by management, as well as evaluating the overall presentation of the consolidated financial statements.
We believe that the audit evidence we have obtained in our audits is sufficient and appropriate to provide a basis for our audit opinion.
Opinion
In our opinion, the consolidated financial statements present fairly, in all material respects, the financial position of Richelieu Hardware Ltd. as at November 30, 2012 and 2011 and December 1, 2010 and its financial performance and its cash flows for the years ended November 30, 2012 and 2011 in accordance with International Financial Reporting Standards.
(Signed Ernst & young LLp) Montreal, Canada January 24, 2013 Chartered professional Accountants
1 CpA auditor, CA, public accountancy permit no. A120803
1
33
RICHELIEU Annual Report 2012

Consolidated Statements of Financial PositionAs at November 30, 2012 and 2011 and December 1, 2010 (In thousands of dollars)
Notes2012
$2011
$2010
$
ASSETSCurrent assets 3Cash and cash equivalents 51,587 29,095 39,289Accounts receivable 75,721 72,366 65,017Income taxes receivable 514 1,688 —Inventories 127,607 118,753 117,609prepaid expenses 781 1,157 837
256,210 223,059 222,752
Non-current assetsproperty, plant and equipment 3, 4 23,740 24,927 18,473Intangible assets 3, 5 15,601 16,639 7,420Goodwill 3, 5 51,405 50,748 43,335Deferred taxes 9 2,913 3,303 2,972
349 869 318 676 294 952
LIABILITIES AND EQUITYCurrent liabilities Accounts payable and accrued liabilities 54,379 51,853 54,612Income taxes payable — — 3,741Current portion of long-term debt 7 1,743 4,309 2,072
56,122 56,162 60,425
Non-current liabilitiesLong-term debt 7 820 1,235 786Deferred taxes 9 3,246 3,471 —other liabilities 1,739 1,621 —
61,927 62,489 61,211
EquityShare capital 8 23,349 19,714 17,623Contributed surplus 8 2,761 3,586 3,906Retained earnings 258,775 229,064 208,782Accumulated other comprehensive income (loss) 11 (1,050) 103 —Equity attributable to shareholders of the Company 283,835 252,467 230,311Non-controlling interests 4,107 3,720 3,430
287,942 256,187 233,741349,869 318,676 294,952
Commitments and contingencies (note 10)
See accompanying notes to the consolidated financial statements.
(Signed) Richard Lord Director
(Signed) Mathieu Gauvin Director
on behalf of the Board:
34
RICHELIEU Annual Report 2012

Consolidated Statements of Earningsyears ended November 30(In thousands of dollars, except earnings per share)
Notes2012
$2011
$
Sales 565,798 523,786Cost of goods sold, warehousing, selling and administrative expenses 494,635 456,637Earnings before the undernoted 71,163 67,149Amortization of property, plant and equipment 5,162 5,774Amortization of intangible assets 2,351 1,910Financial costs, net (198) (13)
7,315 7,671Earnings before income taxes 63,848 59,478Income taxes 9 17,939 19,373Net earnings 45,909 40,105
Net earnings attributable to:Shareholders of the Company 45,404 39,726Non-controlling interests 505 379
45,909 40,105
Net earnings per share attributable to shareholders of the Company 8Basic 2.17 1.89Diluted 2.15 1.87
See accompanying notes to the consolidated financial statements.
Consolidated Statements of Comprehensive Income years ended November 30(In thousands of dollars)
Notes2012
$2011
$
Net earnings 45,909 40,105Other comprehensive income (loss)Exchange differences on translation of foreign operations 11 (1,153) 103Comprehensive income 44,756 40,208
Comprehensive income attributable to:Shareholders of the Company 44,251 39,829Non-controlling interests 505 379
44,756 40,208
See accompanying notes to the consolidated financial statements.
35
RICHELIEU Annual Report 2012

Consolidated Statements of Changes in Equity years ended November 30 (In thousands of dollars)
Attributable to shareholders of the Company
Share capital
$
Contributed surplus
$
Retained earnings
$
Accumulated other comprehensive
income (loss)$
Total$
Non-controlling interests
$
Total equity
$
Notes 8 11
Balance as at December 1, 2010 17,623 3,906 208,782 — 230,311 3,430 233,741Net earnings — — 39,726 — 39,726 379 40,105other comprehensive income — — — 103 103 — 103Comprehensive income — — 39,726 103 39,829 379 40,208Business combinations — — — — — 1,532 1,532Shares repurchased (335) — (10,177) — (10,512) — (10,512)Stock options exercised 2,426 (888) — — 1,538 — 1,538Share-based compensation expense — 568 — — 568 — 568Dividends (note 17) — — (9,267) — (9,267) — (9,267)other liabilities — — — — — (1,621) (1,621)
2,091 (320) (19,444) — (17,673) (89) (17,762)
Balance as at November 30, 2011 19,714 3,586 229,064 103 252,467 3,720 256,187Net earnings — — 45,404 — 45,404 505 45,909other comprehensive loss — — — (1,153) (1,153) — (1,153)Comprehensive income (loss) — — 45,404 (1,153) 44,251 505 44,756Shares repurchased (188) — (5,667) — (5,855) — (5,855)Stock options exercised 3,823 (1,247) — — 2,576 — 2,576Share-based compensation expense — 422 — — 422 — 422Dividends (note 17) — — (10,026) — (10,026) — (10,026)other liabilities — — — — — (118) (118)
3,635 (825) (15,693) — (12,883) (118) (13,001)
Balance as at November 30, 2012 23,349 2,761 258,775 (1,050) 283,835 4,107 287,942
See accompanying notes to the consolidated financial statements.
36
RICHELIEU Annual Report 2012

Consolidated Statements of Cash Flows years ended November 30(In thousands of dollars)
Notes2012
$2011
$
OPERATING ACTIVITIESNet earnings 45,909 40,105Items not affecting cash
Amortization of property, plant and equipment 5,162 5,774Amortization of intangible assets 2,351 1,910Deferred taxes — 1,573Share-based compensation expense 8 981 821
54,403 50183Net change in non-cash working capital balances (8,781) (11,870)
45,622 38,313
FINANCING ACTIVITIESRepayment of long-term debt (2,909) (1,449)Dividends paid 17 (10,026) (9,267)Common shares issued 8 2,576 1,538Common shares repurchased for cancellation 8 (5,855) (10,512)
(16,214) (19,690)
INVESTING ACTIVITIESBusiness acquisitions 3 (2,386) (18,360)Additions to property, plant and equipment and intangible assets (4,797) (10,720)
(7,183) (29,080)
Effect of exchange rate changes on cash and cash equivalents 267 263
Net change in cash and cash equivalents 22,492 (10,194)Cash and cash equivalents, beginning of year 29,095 39,289Cash and cash equivalents, end of year 51,587 29,095Supplementary informationIncome taxes paid 16,647 23,074Interest received, net (335) (24)
See accompanying notes to the consolidated financial statements.
37
RICHELIEU Annual Report 2012

NATURE OF BUSINESSRichelieu Hardware Ltd. (the “Company”) is incorporated under the laws of Quebec, Canada. The Company is a distributor, importer, and manufacturer of specialty hardware and complementary products. These products target an extensive customer base of kitchen and bathroom cabinet, furniture, and window and door manufacturers plus the residential and commercial woodworking industry, as well as a large customer base of retailers, including big box home renovation stores. The Company’s head office is located at 7900 Henri-Bourassa Blvd. W., Montreal, Quebec, Canada, H4S 1V4.
1. SIGNIFICANT ACCOUNTING POLICIES The Company’s consolidated financial statements, presented in Canadian dollars, have been prepared by management in accordance with International Financial Reporting Standards (“IFRS”). Note 16 explains how the transition to IFRS affected the Company’s financial position, results and cash flows.
The preparation of the consolidated financial statements requires management to make estimates and assumptions that affect the amounts reported in the consolidated financial statements and accompanying notes. These estimates are based on management’s best knowledge of current events and actions that the Company may undertake in the future and other factors deemed relevant and reasonable.
The judgments made by management in applying the accounting policies that have the most significant effect on the amounts recognized in the consolidated financial state-ments and the assumptions about the future and other major sources of estimation uncertainty as at the end of the reporting period that could potentially result in material adjustments to the carrying amount of assets and liabilities during the following period, are summarized as follows:
Inventory impairment, including loss and obsolescence, estimating customer and sup-plier rebates, and contingent liabilities, measuring the allowance for doubtful accounts and the classification of leases require the use of judgment and assumptions that may affect the amounts reported in the consolidated financial statements. The underlying estimates and assumptions are reviewed regularly. Revised accounting estimates, if any, are recognized in the period in which the estimates are revised, as well as in the future periods affected by the revisions. Actual results could differ from those estimates.
The Company’s consolidated financial statements have been properly prepared within the reasonable limits of materiality in accordance with the accounting policies summar-ized below:
ConsolidationThe consolidated financial statements include the accounts of Richelieu Hardware Ltd. and its subsidiaries described in note 13. All significant intercompany balances and transactions have been eliminated upon consolidation.
Cash and cash equivalentsCash and cash equivalents consist of cash on hand and highly liquid investments with an initial term of three months or less. Cash and cash equivalents were classified in “financial assets at fair value through net earnings” and measured at fair value. Gains (losses) arising from remeasurement at each period-end are recorded in the consolidated statement of earnings.
Accounts receivableAccounts receivable are classified in “loans and receivables” and carried at cost, which is equivalent to fair market value on initial recognition. Subsequent measurements are recorded at amortized cost using the effective interest method. For the Company, this measurement is usually equivalent to cost due to their short-term maturities.
InventoriesInventories, which consist primarily of finished goods, are valued at the lower of average cost and net realizable value. Net realizable value is the expected selling price in the normal course of business, less estimated costs to sell. The Company uses significant judgment when estimating the effect of certain factors on the net realizable value of inventory, such as inventory obsolescence and loss. The quantity, age and condition of inventory are measured and assessed regularly during the year.
Property, plant and equipmentproperty, plant and equipment are recorded at cost and amortized on a straight-line basis over their estimated useful lives. The main components have different useful lives and are amortized separately. The amortization method and useful life estimates are reviewed annually.
Buildings 20 years Leasehold improvements Lease terms, maximum 5 years Machinery and equipment 5–10 years Rolling stock 5 years Furniture and fixtures 3–5 years Computer equipment 3–5 years
Intangible assets
Intangible assets are acquired assets that lack physical substance and that meet the specified criteria for recognition apart from goodwill and property, plant and equipment. Intangible assets consist mainly of purchased or internally developed software, customer relationships, non-competition agreements and trademarks. Software and customer relationships are amortized on a straight-line basis over their useful lives of 3 and 10–20 years, respectively, while non-competition agreements are amortized over the terms of the agreements. Trademarks have an indefinite life and are therefore not amortized.
Goodwill
Goodwill represents the excess of the purchase price over the fair value of net assets acquired. Goodwill is not amortized.
Impairment of non-current assets At the end of each reporting period, the Company must determine whether indicators of impairment exist for its non-current assets, excluding goodwill and intangible assets with indefinite useful lives. If such indicators exist, the non-current assets are tested for impairment. When the impairment test indicates that the carrying amount of the intangible asset exceeds its fair value, an impairment loss is recognized in net earnings in an amount equal to the excess.
The Company is required to test goodwill and intangible assets with indefinite lives for impairment at least once a year, whether or not indicators of impairment exist. Impair-ment tests are carried out on the asset itself, the cash-generating unit (“CGU”) or group of CGUs. A CGU is the smallest identifiable group of assets that generates cash inflows that are largely independent of the cash inflows from other assets or groups of assets. Goodwill and the supporting assets that cannot be wholly allocated to a single CGU are tested for impairment at the group of CGUs level.
Impairment tests consist in a comparison between the carrying and recoverable amounts of an asset, CGU or group of CGUs. The recoverable amount is the higher of value in use and fair value less costs to sell. Where the carrying amount exceeds the recoverable amount, an impairment loss equal to the excess is recognized in net earnings. Impairment losses related to CGUs or groups of CGUs are allocated proportionately to the assets of the CGU or group of CGUs; however, the carrying amount of the assets is not reduced below the higher of their fair value less costs to sell and their value in use.
other than for goodwill, if a reversal of an impairment loss occurs, it must be recognized immediately in net earnings. Reversals of impairment losses related to a CGU or group of CGUs are allocated proportionately to the assets of the CGU or group of CGUs. on reversal of an impairment loss, the increased recoverable amount of an asset must not exceed the carrying amount that would have been determined, net of amortization, if no impairment loss had been recognized in respect of the asset in prior years.
In impairment testing of goodwill and intangible assets with indefinite useful lives, value in use is estimated using a discounted future cash flow model. The application of this method is based on different assumptions such as estimated future cash flows as described in notes 5 and 16.
NOTES TO CONSOLIDATED FINANCIAL STATEMENTS November 30, 2012 and 2011 (Amounts are in thousands of dollars, except per-share amounts)
RICHELIEU Annual Report 2012
38

NOTES TO CONSOLIDATED FINANCIAL STATEMENTS November 30, 2012 and 2011 (Amounts are in thousands of dollars, except per-share amounts)
NOTES TO CONSOLIDATED FINANCIAL STATEMENTS November 30, 2012 and 2011 (Amounts are in thousands of dollars, except per-share amounts)
Other financial liabilitiesAccounts payable and accrued liabilities are classified in “other financial liabilities” and are initially recorded at fair value. They are subsequently measured at amortized cost using the effective interest method. For the Company, this measurement is usually equivalent to cost.
Revenue recognition
Revenues are recognized when finished products are shipped to customers.
Income taxes
The Company follows the liability method of accounting for income taxes. Under this method, deferred tax assets and liabilities are accounted for based on estimated taxes recoverable or payable that would result from the recovery or settlement of the carrying amount of assets and liabilities. Deferred tax assets and liabilities are measured using substantially enacted tax rates expected to be in effect in the years in which the temporary differences are expected to reverse. Changes in these balances are recognized in net earnings in the year in which they arise.
Deferred tax assets are recognized when it is probable that the Company will have future taxable income against which these tax assets may be offset. In determining these deferred tax assets, assumptions are considered, such as the period for tax loss carry-forwards to be completely used up and the level of future taxable income in accordance with tax planning strategies.
Foreign currency translation
The consolidated financial statements are presented in the Company’s functional currency, which is the Canadian dollar. The Company follows the temporal method of translating foreign currency balances and transactions into Canadian dollars, except for the accounts of its foreign subsidiary. Under this method, monetary assets and liabilities are translated at the exchange rate in effect at the end of the reporting period and the other items in the statements of financial position and earnings are translated at the exchange rates in effect at the date of transaction. Foreign exchange gains and losses are recognized in net earnings in the year in which they arise.
The assets and liabilities of the U.S. subsidiary are translated into Canadian dollars at the exchange rate in effect at the end of the reporting period. Revenues and expenses are translated at the rate in effect at the date of transaction. Foreign exchange gains and losses are recognized in the consolidated statements of comprehensive income.
Foreign exchange forward contracts
The Company periodically enters into foreign exchange forward contracts with major financial institutions to partially hedge the effects of changes in foreign exchange rates related to foreign currency liabilities, as well as to hedge anticipated purchase transac-tions. The Company does not use derivatives for speculative purposes.
The Company uses hedge accounting only when IFRS documentation criteria are met. Derivative financial instruments designated as cash flow hedges are classified as available-for-sale financial assets and liabilities and are measured at fair value, which is the instruments’ approximate settlement value at market rates. Gains and losses on remeasurement at each year-end are recorded in comprehensive income. If the instrument is not designated and documented as a hedge, changes in fair value are recognized in the statement of consolidated earnings for the year. Assets or liabilities related to financial instruments are included in accounts receivable or accounts payable and accrued liabilities in the consolidated statements of financial position.
Share-based payment
The Company recognizes stock-based compensation and other share-based payments in net earnings using the fair value method for stock options granted. The Black & Scholes model is used to determine the grant date fair value of stock options. The application of this method is based on different assumptions such as risk free interest rate, expected life, volatility and dividend yield as described in note 8.
Earnings per share
Earnings per share are calculated based on the weighted average number of common shares outstanding during the year. Diluted earnings per share are calculated using the treasury stock method and take into account all the items that have a dilutive effect.
2. CHANGES IN ACCOUNTING METHODS
The IASB recently issued new standards with effective dates for fiscal years 2013 and thereafter, as presented below.
IFRS 9, Financial Instruments
In November 2009, the International Accounting Standard Board (“IASB”) published IFRS 9, Financial Instruments. This new standard simplifies the classification and meas-urement of financial assets set out in IAS 39, Financial Instruments: Recognition and Measurement. Financial assets are to be measured at amortized cost or fair value. They are to be measured at amortized cost if the following two conditions are met:
(a) The assets are held within a business model whose objective is to collect contractual cash flows; and
(b) The contractual cash flows are solely payments of principal and interest on the out-standing principal.
All other financial assets are to be measured at fair value through earnings. The entity may, if certain conditions are met, elect to use the fair value option instead of meas-urement at amortized cost. As well, the entity may choose upon initial recognition to measure non-trading equity investments at fair value through comprehensive income. Such a choice is irrevocable.
In october 2010, the IASB issued revisions to IFRS 9, adding the requirements for classification and measurement of financial liabilities contained in IAS 39. For financial liabilities measured at fair value through earnings using the fair value option, the amount of change in a liability’s fair value attributable to changes in its credit risk is recognized directly in other comprehensive income.
In December 2011, the IASB deferred the mandatory effective date of IFRS 9 to fiscal years beginning on or after January 1, 2015. Early adoption is permitted under certain conditions. An entity is not required to restate comparative financial periods for its first- time application of IFRS 9, but must comply with the new disclosure requirements.
IFRS 10, Consolidated Financial Statements
In May 2011, the IASB published IFRS 10, Consolidated Financial Statements, which supersedes SIC-12, Consolidation – Special Purpose Entities and certain parts of IAS 27, Consolidated and Separate Financial Statements. IFRS 10 uses control as the single basis for consolidation, irrespective of the nature of the investee, employing the following factors to identify control:
(a) power over the investee;
(b) Exposure or rights to variables returns from involvement with the investee;
(c) The ability to use power over the investee to affect the amount of the investor’s returns.
IFRS 10 will be applied to fiscal years beginning on or after January 1, 2013 with earlier adoption permitted under certain conditions.
IFRS 12, Disclosure of Interests in Other Entities
In May 2011, the IASB published IFRS 12, Disclosure of Interests in Other Entities, which requires that an entity disclose information on the nature of and risks associated with its interests in other entities (i.e., subsidiaries, joint arrangements, associates and unconsolidated structured entities) and the effects of those interests on its financial statements. IFRS 12 will be applied to fiscal years beginning on or after January 1, 2013 with earlier adoption is permitted under certain conditions. Entities may, without early adoption of IFRS 12, elect to incorporate only some of the required disclosures in their financial statements.
RICHELIEU Annual Report 2012
39

NOTES TO CONSOLIDATED FINANCIAL STATEMENTS November 30, 2012 and 2011 (Amounts are in thousands of dollars, except per-share amounts)
2012 2011
$ $
Net assets acquiredAccounts receivable 1,509 3,924Inventories 1,930 4,296prepaid expenses 24 227
3,463 8,447
property, plant and equipment 66 2,744Software — 9Customer relationships 439 8,102Trademark 205 1,013
Non-competition agreement 57 665
Goodwill 316 7,2794,546 28,259
Current liabilities assumed 1,556 2,713Deferred taxes — 1,504Non-controlling interests — 1,532Net assets acquired 2,990 22,510
ConsiderationsCash, net of cash acquired 2,384 18,014
Considerations payable 606 4,4962,990 22,510
2. CHANGES IN ACCOUNTING METHODS (Cont’d)
IFRS 13, Fair Value Measurement
In May 2011, the IASB published IFRS 13, Fair Value Measurement to establish a single framework for fair value measurement of financial and non-financial items. IFRS 13 defines fair value as the price that would be received to sell an asset or paid to transfer a liability in an orderly transaction between market participants at the measurement date. It also requires disclosure of certain information on fair value measurements. IFRS 13 will be applied to fiscal years beginning on or after January 1, 2013 with earlier adoption permitted.
IAS 1, Presentation of Financial Statements
In June 2011, the IASB issued amendments to IAS 1, Presentation of Financial State-ments. Items of other comprehensive income and the corresponding tax are required to be grouped into those that will and will not subsequently be reclassified to earnings. These amendments will be applied to fiscal years beginning on or after July 1, 2012 with earlier adoption permitted.
IAS 32, Financial Instruments: Presentation
In December 2011, the IASB issued amendments to IAS 32, Financial Instruments: Presentation clarifying the requirements for offsetting financial assets and liabilities. The amendments shall be applied to annual periods beginning on or after January 1, 2014. The IASB also issued amendments to IFRS 7, Financial Instruments: Disclosure improving disclosure on offsetting of financial assets and liabilities. These amendments shall be applied to annual and interim periods beginning on or after January 1, 2013.
At present, the Company is assessing the impact of the above-mentioned amendments on its income, financial position and cash flows.
3. BUSINESS ACQUISITIONS
2012
on May 1, 2012, the Company purchased the net asset s of Cour terCo Inc . (“CourterCo”) for a cash consideration of $2,386 (US$2,415), and a balance of sale of $606 (US$613). From its three locations in the United States: Indianapolis (Indiana), Louisville (Kentucky), and Greensboro (North Carolina), this business serves a customer base of residential and commercial woodworkers, kitchen, bathroom cabinet and furniture manufacturers.
Since the acquisition, CourterCo has generated sales of $7,800 and had no significant impact on earnings before income taxes. If Cour terCo had been acquired on December 1, 2011, management believes that the sales included in the consolidated statement of earnings would have been approximately $13,500, assuming that tempor-ary adjustments made as at May 1, 2012 would have been the same on December 1, 2011.
2011
on January 10, 2011, the Company acquired the principal net assets of outwater Hardware (“outwater”) for a cash consideration of $8,748 (US$8,800), excluding acquisi-tion costs, and a consideration payable of $2,920 (US$2,937). Located in Lincoln park in the U.S. state of New Jersey, this company manages a distribution centre of specialized and decorative hardware, which serves residential and commercial woodworkers, kitchen and bathroom cabinet makers and furniture manufacturers.
on January 31, 2011, the Company acquired all the outstanding common shares of Madico Inc. for a cash consideration of $2,770, excluding acquisition costs, and a consideration payable of $95. Located in the Quebec City area in Quebec, Canada, this company develops and distributes floor protection products to an extensive network of hardware retailers and renovation superstores mainly in Canada and the U.S.
on March 14, 2011, the Company acquired 85% of the outstanding common shares of provincial Woodproducts Ltd. for a cash consideration of $7,200, excluding acquisition costs, and a consideration payable of $1,481. Based in St. John’s, Newfoundland and Labrador, Canada, the company operates a distribution centre specializing in hardware, finishing and hardwood flooring products.
Summary of acquisitions
These transactions were accounted for using the acquisition method and the results of operations are included in the consolidated financial statements as of the respective acquisition date for each acquisition. The preliminary purchase price allocation for CourterCo and the final purchase price allocations of outwater, Madico Inc. and provincial Woodproducts Ltd., at the transaction date, are summarized as follows:
As at November 30, 2011, the Company finalized the purchase price allocation for its 2010 business acquisitions, which resulted in a $517 increase in goodwill. During the year ended November 30, 2012, the Company finalized the purchase price allocation for businesses acquired during 2011, which resulted in a $396 increase in goodwill. The goodwill arising from the acquisitions corresponds to the development potential of the acquired businesses, combined with the Company’s operations.
RICHELIEU Annual Report 2012
40

NOTES TO CONSOLIDATED FINANCIAL STATEMENTS November 30, 2012 and 2011 (Amounts are in thousands of dollars, except per-share amounts)
NOTES TO CONSOLIDATED FINANCIAL STATEMENTS November 30, 2012 and 2011 (Amounts are in thousands of dollars, except per-share amounts)
4. PROPERTY, PLANT AND EQUIPMENT
Land BuildingsLeasehold
improvementsMachinery and
equipment Rolling stockFurniture and
fixturesComputer
equipment Total
$ $ $ $ $ $ $ $
Net carrying amount as at December 1, 2010 3,546 5,882 722 4,633 1,048 2,075 567 18,473Acquisitions — 4,964 175 1,665 873 913 880 9,470Acquisitions through business combinations 106 1,045 818 541 134 60 40 2,744Amortization — (1,188) (422) (1,533) (584) (1,478) (569) (5,774)
Effect of changes in foreign exchange rates — (1) 17 (4) (2) (5) 9 14
Net carrying amount as at November 30, 2011 3,652 10,702 1,310 5,302 1,469 1,565 927 24,927
Cost 3,652 20,170 4,082 22,557 5,827 10,583 8,475 75,346Accumulated amortization — (9,468) (2,772) (17,255) (4,358) (9,018) (7,548) (50,419)
Net carrying amount as at November 30, 2011 3,652 10,702 1,310 5,302 1,469 1,565 927 24,927
5. INTANGIBLE ASSETS AND GOODWILL
Software
Non-competition agreements
Customer relationships Trademarks Total Goodwill
$ $ $ $ $ $
Net carrying amount as at December 1, 2010 558 138 4,450 2,274 7,420 43,335Acquisitions 1,250 — — — 1,250 —Acquisitions through business combinations 9 665 8,102 1,013 9,789 6,883Adjustment for business combinations — — — — — 517
Amortization (567) (130) (1,213) — (1,910) —
Effect of changes in foreign exchange rates — — 82 8 90 13
Net carrying amount as at November 30, 2011 1,250 673 11,421 3,295 16,639 50,748
Cost 4,297 1,272 20,141 3,295 29,005 50,748Accumulated amortization (3,047) (599) (8,720) — (12,366) —
Net carrying amount as at November 30, 2011 1,250 673 11,421 3,295 16,639 50,748
Net carrying amount as at November 30, 2011 1,250 673 11,421 3,295 16,639 50,748Acquisitions 749 33 33 — 815 —Acquisitions through business combinations — 57 439 205 701 316Adjustment for business combinations — — — — — 396Amortization (831) (217) (1,303) — (2,351) —Effect of changes in foreign exchange rates — (4) (165) (34) (203) (55)Net carrying amount as at November 30, 2012 1,168 542 10,425 3,466 15,601 51,405
Cost 5,044 1,346 20,287 3,466 30,144 60,172Accumulated amortization (3,876) (804) (9,862) — (14,543) (8,767)Net carrying amount as at November 30, 2012 1,168 542 10,425 3,466 15,601 51,405
Land BuildingsLeasehold
improvementsMachinery and
equipment Rolling stockFurniture and
fixturesComputer
equipment Total
$ $ $ $ $ $ $ $
Net carrying amount as at November 30, 2011 3,652 10,702 1,310 5,302 1,469 1,565 927 24,927Acquisitions — 281 181 1,070 605 1,507 312 3,956Acquisitions through business combinations — — 31 9 — 26 — 66Amortization — (1,274) (435) (1,548) (588) (801) (516) (5,162)Effect of changes in foreign exchange rates — (1) (18) (14) (5) (8) (1) (47)Net carrying amount as at November 30, 2012 3,652 9,708 1,069 4,819 1,481 2,289 722 23,740
Cost 3,652 21,170 4,262 23,164 6,272 12,076 9,262 79,858Accumulated amortization — (11,462) (3,193) (18,345) (4,791) (9,787) (8,540) (56,118)Net carrying amount as at November 30, 2012 3,652 9,708 1,069 4,819 1,481 2,289 722 23,740
RICHELIEU Annual Report 2012
41

NOTES TO CONSOLIDATED FINANCIAL STATEMENTS November 30, 2012 and 2011 (Amounts are in thousands of dollars, except per-share amounts)
5. INTANGIBLE ASSETS AND GOODWILL (Cont’d)
For impairment test purposes, the carrying value of goodwill and intangible assets has been allocated to CGUs or groups of CGUs. The recoverable value of the CGUs or groups of CGUs was determined on the basis of their value in use, which was calcula- ted using forecasted cash flows before taxes over a period of five years. The discount rates before taxes used as at November 30, 2012 and 2011 are between 13.9% and 14.5%, considering a terminal value of 2%. Note 16 describes the impairments recognized as a reduction in goodwill upon the initial application of IFRS. No change reasonably likely as a result of any of the previously mentioned key assumptions used would be such that the carrying value would be superior to the recoverable value.
6. BANK INDEBTEDNESSThe Company has a line of credit with a Canadian banking institution with an author-ized amount of 26 million in Canadian dollars and 6 million in U.S. dollars, bearing interest at the bank’s prime and base rates, which were respectively 3% and 3.75% as at November 30, 2012. The line of credit is renewable annually. (2011 – $26 million with a Canadian banking institution, bearing interest at the bank’s prime rate, which was 3% as at November 30, 2011 and a line of credit with an authorized maximum amount of US$5 million with a U.S. banking institution, bearing interest at prime rate, which was 3.25% as at November 30, 2011, plus 2%).
7. LONG-TERM DEBT
2012 2011
$ $
Business acquisition considerations payable, not bearing interest, including US$1,017 (US$3,132 in 2011) 2,563 5,136
US$400 in 2011 bearing interest at a variable rate of 2.25% based on prime rate less 1% — 408
2,563 5,544
Current portion of long-term debt 1,743 4,309
820 1,235
principal payments on long-term debt for the next few years are: $1,743 in 2013 and $820 in 2014.
Number of options
Exercise price per share Total
$ $
outstanding, November 30, 2010 918,300 7.28 to 24.76 18,762
Granted 51,000 27.93 to 30.68 1,555
Exercised (84,300) 7.28 to 24.76 (1,538)
Cancelled (2,000) 7.28 to 17.44 (20)
Outstanding, November 30, 2011 883,000 11.35 to 30.68 18,759Granted 41,000 27.43 1,125Exercised (121,375) 11.35 to 30.68 (2,576)Cancelled (40,625) 15.89 to 30.68 (1,034)Outstanding, November 30, 2012 762,000 14.50 to 30.68 16,274
8. SHARE CAPITALAuthorized
Unlimited number of:
Common shares
Non-voting first and second ranking preferred shares issuable in series, the character-istics of which are to be determined by the Board of Directors
Issued2012 2011
$ $
20,794,484 common shares (2011 – 20,846,709) 23,349 19,714
During 2012, the Company issued 121,375 common shares (2011 – 84,300) at an average price of $21.22 per share (2011 – $18.24) pursuant to the exercise of options under the stock option plan. In addition, during 2012, the Company, through a normal course issuer bid, purchased 173,600 common shares for cancellation in consideration of $5,855 (2011 – 372,800 for a consideration of $10,512) which resulted in a premium on redemption in the amount of $5,667 applied against retained earnings (premium of $10,177 in 2011).
Stock option plan
The Company offers a stock option plan to its directors, officers and key employees. The subscription price of each share issuable under the plan is equal to the market price of the shares five days prior to the day the option was granted and must be paid in full at the time the option is exercised. options vest at a rate of 25% per year starting one year after grant date and expire on the tenth anniversary of the grant date.
As at November 30, 2012, 219,900 options (2011 – 220,275) were still available to be granted.
In the last two years, transactions involving options are summarized as follows:
During 2012, the Company granted 41,000 options (2011 – 51,000) with an average exercise price of $27.43 per share (2011 – $30.49) and an average fair value of $6.56 per option (2011 – $8.73) as determined using the Black & Scholes option pricing model using an expected dividend yield of 1.75% (2011 – 1.5%), a volatility of 25% (2011 – 25%), a risk free interest rate of 2.31% (2012 – 3.69%) and an expected life of 7 years (2012 – 7 years). The compensation expense charged to earnings for the options granted in 2012 amounted to $422 (2011 – $568).
Deferred share unit plan
The Company offers a deferred share unit (“DSU”) plan to its directors who can elect to receive part or all of their compensation in DSUs. The value of DSUs is redeemable for cash only when a director ceases to be a member of the Board. The financial liability resulting from the plan of $2,159 (2011 – $1,863) is presented under Accounts payable and accrued liabilities. The compensation expense charged to earnings for the DSUs in 2012 amounted to $559 (2011 – $253).
Share purchase plan
The Company has a share purchase plan entitling any employees to purchase shares up to a maximum percentage of their total compensation in cash. The Company contributes an amount equivalent to a percentage of any amount invested by the employee to the purchase of additional shares. The Company’s contribution is determined annually. Compensation expense related to the share purchase plan amounted to $391 for 2012 (2011 – $313) and is recognized under Cost of goods sold, warehousing, selling and administrative expenses.
The table below summarizes the information regarding the stock options outstanding as at November 30, 2012.
Options outstandingExercisable
options
Range in exercise price(in dollars)
Number of options
(in thousands)
Weighted average
remaining period(years)
Weighted average exercise
price(in dollars)
Number ofoptions
(in thousands)
Weighted average exercise
price(in dollars)
9.97 – 14.50 50,000 0.32 14.50 50,000 14.5014.51 – 21.69 317,700 4.94 19.08 286,825 19.26
21.70 – 24.76 329,300 3.33 23.18 321,800 23.1824.77 – 30.68 65,000 8.82 28.62 6,625 30.35
762,000 4.27 21.36 665,250 20.91
RICHELIEU Annual Report 2012
42

NOTES TO CONSOLIDATED FINANCIAL STATEMENTS November 30, 2012 and 2011 (Amounts are in thousands of dollars, except per-share amounts)
NOTES TO CONSOLIDATED FINANCIAL STATEMENTS November 30, 2012 and 2011 (Amounts are in thousands of dollars, except per-share amounts)
8. SHARE CAPITAL (Cont’d)Earnings per share
Basic earnings per share and diluted earnings per share were calculated based on the following number of shares:
2012 2011
$ $
Weighted average number of shares outstanding – basic 20,885 21,036
Dilutive effect under stock option plan 252 226
Weighted average number of shares outstanding – diluted 21,137 21,262
The computation of diluted net earnings per share includes all outstanding options (2011 – excludes the weighted average of 51,000 options with an exercise price excee-ding the average market share price for the period because of their anti-dilutive effect).
9. INCOME TAXES
The main components of the provision for income taxes are as follows:
2012 2011
$ $
Current 17,939 17,800
Deferred
Temporary differences — 1,624
Impact of tax rate changes on deferred taxes — (51)
17,939 19,373
The effective income tax rate differs from the combined statutory rates for the following reasons::
2012 2011
$ $
Combined statutory rates 26.96% 28.44%Income taxes at combined statutory rates 17,212 16,917
Increase (decrease) resulting from:
Impact of statutory rates changes for the subsidiary outside Canada (21) (175)
Share-based compensation 265 162
other non-deductible expenses 103 79
Valuation allowance on tax attributes — 2,619
other 380 (229)
17,939 19,373
10. COMMITMENTS AND CONTINGENCIES
(a) Leases
The Company has commitments under operating leases for warehouse and office pre-mises expiring on various dates up to 2019. The future minimum payments, excluding incidental costs for which the Company is responsible, are as follows:
$
Less than a year 6,874
Between 1 and 5 years 14,429
More than 5 years 1,298
22,601
(b) Foreign exchange forward contracts
As at November 30, 2012, the Company held the following foreign exchange forward contracts having maturity dates in December 2012.
Type Currency in thousands Average exchange rate
purchase 2,700 Euros 1.2836
(c) Claims
In the normal course of business, various proceedings and claims are instituted against the Company. Management believes that any forthcoming settlement in respect of these claims will not have a material effect on the Company’s financial position or net consolidated earnings.
Deferred taxes reflect the net tax impact of temporary differences between the value of assets and liabilities for accounting and tax purposes. The major components of deferred tax assets and liabilities of the Company were as follows:
2012 2011
$ $
Deferred taxesTranslation of foreign exchange currencies, other reserves only
recognized for tax purposes upon disbursement and other tax attributes 2,545 3,279
Excess of the tax value of property, plant and equipment over their net carrying value 1,607 1,579
Excess of the net carrying value of intangible assets and goodwill over their tax value (4,485) (5,026)
Net amount (333) (168)
The net deferred taxes included the following as at November 30:
2012 2011$ $
Deferred tax assets 2,913 3,303Deferred tax liabilities (3,246) (3,471)
(333) (168)
The variations of deferred taxes for the years ended November 30 are detailed as follows:
2012 2011$ $
Balance at the beginning of the year, net (168) 2,972In net results — (1,573)
Related to business combinations — (1,504)
other (165) (63)
Balance at the end of the year, net (333) (168)
operating losses carried forward for which the deferred taxes have not been recognized amounted to $6,600 as at November 30, 2012 (2011 – $6,900) and expire between 2030 and 2032.
RICHELIEU Annual Report 2012
43

NOTES TO CONSOLIDATED FINANCIAL STATEMENTS November 30, 2012 and 2011 (Amounts are in thousands of dollars, except per-share amounts)
11. ACCUMULATED OTHER COMPREHENSIVE INCOME (LOSS)
Accumulated other comprehensive income, including the following items and the changes that occurred during the year, was as follows:
2012 2011
$ $
Balance at the beginning of the year 103 —
Exchange differences on translation of foreign operations (1,153) 103
Balance at the end of the year (1,050) 103
2012 2011$ $
Balance at the beginning of the year 5,006 4,607
Allowance for doubtful accounts 2,152 2,438
Write-offs (2,061) (2,017)
Exchange rate variations (65) (22)
Balance at the end of the year 5,032 5,006
The balance of accounts receivable of the Company that are overdue for more than 60 days, but which were not provided for, totals $1,513 ($1,186 in 2011).
As at November 30, 2012 and 2011, no customer accounted for more than 10% of the total accounts receivable.
Market risk
The Company’s foreign currency exposure arises from purchases and sales transacted mainly in U.S. dollars and Euros. Administrative charges included, for the year ended November 30, 2012, an exchange loss of $9 (2011 – gain of $297).
The Company’s policy is to maintain its purchase price and selling prices of its com-mercial activities by mitigating its exposure by use of derivative financial instruments. To protect its operations from exposure to exchange rate fluctuations, foreign exchange contracts are used. Major exchange risks are covered by a centralized cash flow manage-ment. Exchange rate risks are managed in accordance with the Company’s policy on exchange risk management. The goal of this policy is to protect the Company’s profits by eliminating the exposure to exchange rate fluctuations. The Company’s policy does not allow speculative trades.
12. FINANCIAL INSTRUMENTS AND OTHER INFORMATIONFair values
The carrying value of cash and cash equivalents, accounts receivable and accounts payable and accrued liabilities is a reasonable estimate of their fair value because of their short maturity.
The carrying value of long-term debt approximates their fair value either because of the floating rate nature of some loans or because management estimates that the loans payable with fixed interest rates have no significant differences between their fair value and their carrying value, based on rates currently available to the Company on loans with similar terms and remaining maturities.
As at November 30, 2012, the fair value of foreign exchange forward contracts resulted in a gain of approximately $25 (loss of approximately $54 as at November 30, 2011), representing the amount the Company would collect (disburse) on settlement of these contracts at spot rates.
Credit risk
The Company sells its products to numerous customers in Canada and, in a lesser proportion, in the United States. The credit risk refers to the possibility that customers will be unable to assume their liabilities towards the Company. The average days outstanding of accounts receivable, as at November 31, 2012 and 2011, is acceptable given the industry in which the Company operates.
The Company performs ongoing credit evaluations of customers and generally does not require collateral. The allowance for doubtful accounts for the years ended November 30, 2012 and 2011 is as follows:
As at November 30, 2012 and 2011, a decrease of 1% of the Canadian dollar against the U.S. dollar and the Euro, all other variables remaining the same, would have had no significant effect on consolidated net earnings and increased the consolidated com-prehensive income by $731 (2011 – $570 ). The exchange rate sensitivity is calculated by aggregation of the net foreign exchange rate exposure of the Company’s financial instruments as of November 30, 2012.
Liquidity risk
The Company manages its risk of not being able to settle its financial liabilities when required by taking into account its operational needs and by using different financing tools, if required. During the previous years, the Company has financed its growth, its acquisitions, and its payout to shareholders by using the cash generated by the operating activities.
Current fiscal year expenses
During the year ended November 30, 2012, the amount relating to inventories recorded as expenses from the distribution, imports and manufacturing activities totals $398,957 (2011 – $366,242). An expense of $2,123 (2011 – $472) for inventory obsolescence is included in this amount. Salaries and related charges of $81,992 (2011 – $75,025) are included in the cost of goods sold, warehousing, selling and administrative expenses.
13. RELATED PARTY INFORMATIONThe Company has significant interests in the following subsidiaries:
NamesCountry of
incorporationEquity interest
%Voting rights
%
Richelieu America Ltd. U.S. 100 100
Richelieu Finance Ltd. Canada 100 100
Richelieu Hardware Canada Ltd. Canada 100 100
Cedan Industries Inc. Canada 100 100
Distributions 20/20 Inc. Canada 100 100
provincial Woodproducts Ltd. Canada 85 85
Menuiserie des pins Ltée Canada 75 75
Executive officer compensation is as follows:
2012 2011$ $
Short-term employee benefits 2,669 2,692
other long-term benefits 228 343
Share-based compensation 17 17
2,914 3,052
Accounts payable include a retirement allowance amounting to $1,900 payable to a senior executive officer.
14. GEOGRAPHIC INFORMATIONDuring the year ended November 30, 2012, nearly 79% of sales had been made in Canada (2011 – 81%). The Company’s sales to foreign countries, almost entirely directed to the United States, amounted to $120,658 (2011 – $99,177) in Canadian dollars and to $120,403 (2011 – $100,454) in U.S. dollars.
As at November 30, 2012, out of a total amount of $23,740 in capital assets (2011 – $24,927), $3,301 (2011 – $2,019) are located in the United States. In addition, intangible assets located in the United States amounted to $7,996 (2011 – $8,158) and goodwill to $3,835 (2011 – $3,212) in Canadian dollars and to $8,047 (2011 – $7,996) and goodwill to $3,860 (2011 – $3,148) in U.S. dollars.
RICHELIEU Annual Report 2012
44

NOTES TO CONSOLIDATED FINANCIAL STATEMENTS November 30, 2012 and 2011 (Amounts are in thousands of dollars, except per-share amounts)
NOTES TO CONSOLIDATED FINANCIAL STATEMENTS November 30, 2012 and 2011 (Amounts are in thousands of dollars, except per-share amounts)
15. CAPITAL MANAGEMENTThe Company’s objectives are: :
■ Maintain a low debt ratio to preserve its capacity to pursue its growth both internally and through acquisitions;
■ provide an adequate return to shareholders.
The Company manages and makes adjustments to its capital structure in light of changes in economic conditions and the risk characteristics of underlying assets. To maintain or adjust its capital structure, the Company may adjust the amount of dividends paid to shareholders, return capital to shareholders or issue new shares.
For the year ended November 30, 2012, the Company achieved the following results regarding its capital management objectives:
■ Debt/equity ratio: 0.9% (2011 – 2.2 %) (long-term debt/equity)
■ Return on average equity: 16.9% (2011 – 16.5%)
The Company’s capital management objectives remained unchanged from the previous fiscal year.
16. IFRS ADOPTIONThese financial statements are the first consolidated financial statements of the Company prepared under IFRS. The IFRS transition date was December 1, 2010. These consolidated financial statements were prepared using the IFRS significant accounting policies of the Company presented in Note 1. The main adjustments made to convert the consolidated statement of financial position as at December 1, 2010 prepared under Canadian generally accepted accounting principles before the transition to IFRS are explained below.
To prepare the consolidated statement of financial position as at December 1, 2010, the Company elected to use the following exemptions to retrospective application as at the transition date, as allowed under IFRS 1.
Business combinations
IFRS 3, Business Combinations, may be adopted retrospectively or prospectively. Retro-spective application requires restatement of some or all of the business combinations that occurred before the transition date. The Company made use of this exemption and did not restate its acquisitions prior to the transition date.
Share-based payment
An entity may apply IFRS 2, Share-based Payment, only to equity instruments that are unvested at the transition date. The Company elected not to apply IFRS 2 to equity instruments granted and vested before the date of transition to IFRS.
Cumulative exchange differences
Retrospective application of IFRS would require the Company to determine cumula-tive exchange differences in accordance with IAS 21, The Effects of Changes in Foreign Exchange Rates, from the date a subsidiary or associate was formed or acquired. How-ever, IFRS 1, First-time Adoption of International Financial Reporting Standards allows cumulative foreign exchange gains and losses to be reset to zero at the transition date. The Company elected to reset its net foreign exchange losses totalling $5.6 million as at December 1, 2010 to zero. Net foreign exchange losses were reclassified to retained earnings at the transition date.
RECONCILIATION OF EQUITY
NotesNovember 30,
2011December 1,
2012$ $
Equity under Canadian GAAP 275,634 253,869Impairment of assets – impairment losses of
property, plant and equipment, intangible assets and goodwill (a), (c) (26,509) (26,509)
Amortization and other (a), (c) 408 —
other liabilities (e) (400) (400)
Deferred taxes (b) 3,334 3,351
(23,167) (23,558)Equity attributable to shareholders of the
Company under IFRS 252,467 230,311
RECONCILIATION OF FINANCIAL POSITION As at December 1, 2010
Notes GAAP Adjustments IFRS$ $ $
ASSETSCurrent assets Cash and cash equivalents 39,289 — 39,289Accounts receivable 65,017 — 65,017Inventories 117,609 — 117,609prepaid expenses 837 — 837
222,752 — 222,752Non-current assetsproperty, plant and equipment (a) 19,132 (659) 18,473Intangible assets (a) 13,242 (5,822) 7,420Goodwill (a), (c) 63,363 (20,028) 43,335Deferred taxes (e) 2,327 645 2,972
320,816 (25,864) 294,952
LIABILITIES AND EQUITYCurrent liabilities Accounts payable and
accrued liabilities (e) 54,212 400 54,612Income taxes payable 3,741 — 3,741Current portion of long-term debt 2,072 — 2,072
60,025 400 60,425Non-current liabilitiesLong-term debt 786 — 786Deferred taxes (a), (b) 2,706 (2,706) —Non-controlling interests (d) 3,430 (3,430) —
66,947 (5,736) 61,211EquityShare capital 17,623 — 17,623Contributed surplus 3,906 — 3,906Retained earnings 237,907 (29,125) 208,782Accumulated other comprehensive
income (loss) (d) (5,567) 5,567 —Equity attributable to shareholders
of the Company 253,869 (23,558) 230,311Non-controlling interests (d) — 3,430 3,430
253,869 (20,128) 233,741320,816 (25,864) 294,952
RICHELIEU Annual Report 2012
45

NOTES TO CONSOLIDATED FINANCIAL STATEMENTS November 30, 2012 and 2011 (Amounts are in thousands of dollars, except per-share amounts)
RECONCILIATION OF FINANCIAL POSITION As at November 30, 2011
Notes GAAP Adjustments IFRS$ $ $
ASSETSCurrent assetsCash and cash equivalents 29,095 — 29,095Accounts receivable 72,366 — 72,366Income taxes receivable 1,645 43 1,688Inventories 118,753 — 118,753prepaid expenses 1,157 — 1,157
223,016 43 223,059Non-current assetsproperty, plant and equipment (a) 25,399 (472) 24,927Intangible assets (a) 22,189 (5,550) 16,639Goodwill (a), (c) 70,870 (20,122) 50,748Deferred taxes (e) 2,658 645 3,303
344,132 (25,456) 318,676
LIABILITIES AND EQUITYCurrent liabilitiesAccounts payable and accrued liabilities (e) 51,453 400 51,853Current portion of long-term debt 4,309 — 4,309
55,762 400 56,162Non-current liabilitiesLong-term debt 1,235 — 1,235Deferred taxes (a), (b) 6,160 (2,689) 3,471other liabilities (d) — 1,621 1,621Non-controlling interests (d) 5,341 (5,341) —
68,498 (6,009) 62,489EquityShare capital 19,714 — 19,714Contributed surplus (d) 3,586 — 3,586Retained earnings 257,955 (28,891) 229,064Accumulated other comprehensive
income (loss) (d) (5,621) 5,724 103Equity attributable to shareholders of the
Company 275,634 (23,167) 252,467Non-controlling interests — 3,720 3,720
275,634 (19,447) 256,187344,132 (25,456) 318,676
RECONCILIATION OF CONSOLIDATED STATEMENTS OF EARNINGSYear ended November 30, 2011
Notes GAAP Adjustments IFRS$ $ $
Sales 523,786 — 523,786Cost of goods sold, warehousing, selling
and administrative expenses (c) 456,467 170 456,637Earnings before the undernoted 67,319 (170) 67,149Amortization of property, plant and
equipment (a) 5,906 (132) 5,774Amortization of intangible assets (a) 2,139 (229) 1,910Financial costs, net (13) — (13)
8,032 (361) 7,671Earnings before income taxes 59,287 191 59,478Income taxes (b) 19,416 (43) 19,373
Net earnings 39,871 234 40,105
Attributable to:Shareholders of the Company 39,492 234 39,726Non-controlling interests 379 — 379
39,871 234 40,105
Net earnings per share attributable to shareholders of the Company
Basic 1.88 0.01 1.89Diluted 1.86 0.01 1.87
RECONCILIATION OF CONSOLIDATED STATEMENTS OF COMPREHENSIVE INCOMEYear ended November 30, 2011
Notes GAAP Adjustments IFRS$ $ $
Net earnings 39,871 234 40,105Other comprehensive income (loss)Exchange differences on translation of
foreign operations (d) (54) 157 103Comprehensive income 39,817 391 40,208
RECONCILIATION OF CONSOLIDATED STATEMENTS OF CASH FLOWSYear ended November 30, 2011
Notes GAAP Adjustments IFRS$ $ $
operating activities (c) 38,528 (215) 38,313Investing activities (19,690) — (19,690)Financing activities (c) (29,295) 215 (29,080)
16. IFRS ADOPTION (Cont’d)
RICHELIEU Annual Report 2012
46

NOTES TO CONSOLIDATED FINANCIAL STATEMENTS November 30, 2012 and 2011 (Amounts are in thousands of dollars, except per-share amounts)
NOTES TO CONSOLIDATED FINANCIAL STATEMENTS November 30, 2012 and 2011 (Amounts are in thousands of dollars, except per-share amounts)
16. IFRS ADOPTION (Cont’d)
(a) IAS 36, Impairment of Assets
Impact on opening statement of financial position
The GAAp impairment test is carried out at the level of the operating unit that includes several distribution centres in a region, thereby benefiting from the cash flows of the distribution centres which have no intangible assets or goodwill. Unlike the GAAp impairment test, the IFRS impairment test is performed at a lower level, specifically at the level where cash inflows largely independent of other groups of assets are generated, which is the distribution centre level in several cases.
Due to the anticipated adoption of the new accounting policy, the value in use of certain CGUs, and thus the recoverable amount, is lower than their carrying amount.
Estimates of value in use, and, in turn, impairment test conclusions, are sensitive to assumptions made regarding revenue growth, gross margin generated, working capital requirements to support operations over the next five years, long-term market growth, and the appropriate discount rate to reflect the time value of money and the risks specific to each CGU not accounted for in cash flows. The discount rate before taxes used was 14.6% as at December 1, 2010.
In light of the foregoing, a $26.5 million impairment expense (US$25.8 million) was recognized as a reduction of the carrying amounts of assets acquired in the U.S. from 2003 to 2010.
Implications for fiscal 2011 This impairment reduces the asset amortization expense by $0.4 million.
(b) IAS 12, Income Taxes
IFRS accounting policy Adjustments made to the opening statement of financial position triggered the recognition of additional deferred tax assets and resulted in the write-off of deferred tax liabilities. This standard limits the recognition of deferred tax assets to the amount that is probable to be realized.
Impact on opening statement of financial position
As a result, the deferred tax liabilities were written off and certain deferred tax assets have not been recognized since it is not probable that the benefits will be realized in subsequent years.
(c) IFRS 3, Business Combinations – Acquisition-related Costs and IFRS 1 Exemption
GAAp accounting policy Acquisition-related costs, or the costs the acquirer incurs to effect a business combination, are included in the allocation of the price paid and are therefore capitalized in the statement of financial position.
IFRS accounting policy All costs incurred in connection with a business combination are to be accounted for by the acquirer as expenses during the period in which the services were received.
Impact on opening statement of financial position
IFRS 1 offers the election of applying IFRS 3 solely to business combinations beginning on or after December 1, 2010. As a result, there is no effect on the opening statement of financial position.
Implications for fiscal 2011 Acquisition-related costs recognized in fiscal 2011 and factored into the allocation of the purchase price of business acquired totalled $0.2 million. These costs were recognized as expenses in the consolidated statement of earnings for the year ended November 30, 2011.
(d) Reclassifications: Foreign currency translation and non-controlling interests
IFRS accounting policy IAS 21 requires the Company to recognize some translation differences in other comprehensive income and accumulate these in a separate component of equity. Under IFRS 1, the Company need not comply with these requirements for cumulative translation differences that existed as at December 1, 2010 if the differences are deemed to be zero at that date.
IFRS 10 requires non-controlling interests to be presented in equity in the consolidated statement of financial position, separately from equity attributable to shareholders of the Company. options to purchase non-controlling interests that correspond to the definition of a financial liability according to IAS 32, Financial Instruments: Presentation, are measured at fair value and presented under other liabilities.
Impact on opening statement of financial position
Cumulative translation differences are deemed to be zero as at December 1, 2010, as the consideration was recognized as a reduction of retained earnings.
Total liabilities were reduced by the balance of non-controlling interests pertaining to transactions under which there were no non-controlling interest purchase options and the balance was reclassified to equity.
RICHELIEU Annual Report 2012
47

NOTES TO CONSOLIDATED FINANCIAL STATEMENTS November 30, 2012 and 2011 (Amounts are in thousands of dollars, except per-share amounts)
16. IFRS ADOPTION (Cont’d)
(e) Other liabilities, provisions and contingent liabilities
Comparisons between IFRS and GAAp IFRS require a provision to be recorded when it is probable (>50%) that the Company will settle an obligation with a cash outflow that can be reliably estimated.
Such provisions must be disclosed in the notes to consolidated financial statements.
Under GAAp, the recognition criteria for similar situations require a greater level of certainty.
Impact on opening statement of financial position
The balance of provisions was reviewed and adjusted when the IFRS recognition criteria were met.
17. DIVIDENDSFor the year ended November 30, 2012, the Company paid a quarterly dividend of $0.12 per common share [2011 – quarterly dividend of $0.11 per share] for a total amount of $10,026 [2011 – $9,267]. For 2013, the Board of Directors approved on January 24, 2013 the payment of a quarterly dividend of $0.13 per common share.
18. APPROVAL OF FINANCIAL STATEMENTSThe consolidated financial statements for the year ended November 30, 2012 (including the comparative figures) were approved for issue by the Board of Directors on January 24, 2013.
19. COMPARATIVE FIGURESSome figures disclosed for the year ended November 30, 2011 have been reclassified to conform to the presentation adopted in the year ended November 30, 2012.
RICHELIEU Annual Report 2012
48

Transfer Agent and Registrar Computershare Trust Company of Canada
AuditorsErnst & Young LLP800 René-Lévesque Blvd. WestSuite 1900Montreal, Quebec, H3B 1X9
Head OfficeRichelieu Hardware Ltd. 7900 Henri-Bourassa Blvd. WestMontreal, Quebec, H4S 1v4Telephone: 514 336-4144Fax: 514 832-4002
Real
izat
ion:
Lefe
bvre
Fin
ancia
l Com
mun
icat
ions
Inc.
/ gra
phic
Desig
n: u
zin3
/ Pro
duct
ion:
iota
desig
n
Printed in Canada

Annual Report 2012
www.richelieu.com