Embed Size (px)
Citation preview

a n n ua l r e p ort 2007

C O N T E N TS
Investment phIlosophy 1 Remgro’s investment philosophyGRoup pRofIle 1 summary of the Company’s business and its principal investmentsGRoup stRuCtuRe 2 schematic presentation of the Group’s principal investmentssalIent featuRes 6 headline earnings per share Dividends per share net asset value per share exchange rates stock exchange prices Remgro’s relative share performance shaRe statIstICs 7 Information regarding transactions on the Jse limited ConsolIDateD fInanCIal statIstICs seven-year consolidated income statements 8seven-year consolidated balance sheets and cash flow statements 9DIReCtoRate 10 executive and non-executive directors’ curricula vitaeGeneRal RepoRtfinancial review 12 Commentary on the Group’s resultsInvestment review 16 short review of the results of individual investmentsIntRInsIC net asset value 27 Composition of the intrinsic net asset valueCoRpoRate GoveRnanCe 28sustaInabIlIty RepoRt 35 stakeholder relations Group ethics safety and environment hIv/aids policy employees pandemics employment equity bee – black economic empowerment social investment fInanCIal RepoRt 2007 statutory consolidated annual financial statements of the Group with contents 46 Company InfoRmatIon 102shaReholDeRs’ InfoRmatIon 102notICe to shaReholDeRs 106explanatoRy notes to the notICe to shaReholDeRs 110foRm of pRoxy attached
RemGRo lImIteDIncorporated in the Republic of south africa Registration number 1968/006415/06 IsIn zae000026480 share code Rem
www.remgro.com

Remgro invests in businesses that can deliver superior earnings and dividend growth over the long term. This involves the acquisition of meaningful interests in companies that have sound management and have the ability to generate strong cash returns and growth. Remgro forges strategic alliances on a partnership basis and endeavours to add value where possible. The purpose is to ensure excellent returns to shareholders by way of dividend and capital growth.
investment philosophy
2007
Remgro Limited is an investment holding company established with effect from 1 April 2000, after the restructuring of the former Rembrandt Group Limited. The Group’s interests consist of investments in tobacco products, banking and financial services, printing and packaging, motor components, medical services, mining, petroleum products, food, wine and spirits and various other trade mark products.
The Company’s activities are concentrated mainly on the management of investments and the provision of support rather than on being involved in the day-to-day management of business units of investees.
Subsidiaries not wholly owned are mainly listed companies with independent boards of directors on which this Company has non-executive representation. Non-subsidiary investments comprise both listed and unlisted companies not controlled by this Company and which are mostly associated companies due to significant influence and Board representation.
group profile
r e m g ro l i m i t e d | 1

r e m g ro l i m i t e d2 |
g ro u p s t ru c t u r eat 31 march 2007
• British American Tobacco 10.4%
Tobacco interests
• AirProductsSA 50.0%
• Distell 29.4%
• Dorbyl 41.4%
• KagisoTrustInvestments 41.8%
• Medi-Clinic 47.6%
• Nampak 13.4%
• TotalSouthAfrica 24.9%
• UnileverBestfoodsRobertsons 41.0%
Industrial interests
• TransHex 33.6%
• Implats 4.2%
Mining interests
• RMBHoldings 23.7%
• FirstRand 9.3%
Financial services
• TsbSugar 100.0%
• Wispeco 100.0%
• Rainbow 61.4%
Industrial interests
• RemgroFinanceCorporation 100.0%
• M&IGroupServices 100.0%
Corporate and other interests
Percentages represent the direct interests held. Annexures A and B provide further information of subsidiary companies and investments.
• BusinessPartners 21.3%
Other interests
ASSOCIATED COMPANIES AND OTHEr
SUBSIDIArY COMPANIES

r e m g ro l i m i t e d | 3
g ro u p s t ru c t u r einformation on the companies in which investments are held
ASSOCIATED COMPANIES AND OTHEr
Mining interests
effective interest: 33.6%
• ListedontheJSELimited.•ChiefExecutiveOfficer:LDelport• Explorationfor,andminingandmarketing
of land and marine diamonds.•Marketcapitalisationat31March2007:R1304million
•Website:www.transhex.co.za
effective interest: 4.2%
• ListedontheJSELimited.•ChiefExecutiveOfficer:DBrown• Implatsisafullyintegratedminingand
metallurgical organisation, which markets refined platinum group metals for global markets and is one of the world’s largest platinum recyclers.
•Marketcapitalisationat31March2007:R143851million
•Website:www.implats.co.za
Tobacco interests Financial services
effective interest: 10.4%
•ListedontheLondonStockExchange.•ChiefExecutiveOfficer:PAdams• Produceshigh-qualitytobaccoproductsfor
a diverse, worldwide market. The company is involved from the planting and growing of tobacco crops to the marketing of the products.
• Interestisrepresentedbyaone-thirdshareholding in the ordinary shares and a 100%shareholdinginthe“2005”participatingsecuritiesofR&RHoldingsSA(R&R).Theothertwo-thirdsshareholdinginR&RisheldbyCompagnieFinancièreRichemontSA.
•Marketcapitalisationat31March2007:£32658million
•Website:www.bat.com
effective interest: 23.7%
• ListedontheJSELimited.•ChiefOperatingOfficer:PCooper•RMBH’sinterestsare:–FirstRandLimited(33%)–RMBStructuredInsuranceLimited(80%)–OUTsuranceLimited(62%)–GlenrandM.I.BLimited(16%)•Marketcapitalisationat31March2007:R42749million
•Website:www.rmbh.co.za
effective interest: 9.3%(excluding indirect interest held through RMB Holdings)
• ListedontheJSELimited.•ChiefExecutiveOfficer:PKHarris•TheFirstRandgroupofcompaniesis
involved in the financial service activities, including retail, corporate, investment and merchant banking, short-term insurance, life insurance, employee benefits, health insurance and asset management.
•Thebankingandinsuranceactivitiesarerepresented by the wholly owned subsidiaries FirstRandBankHoldingsLimitedandMomentumGroupLimitedrespectivelyandthehealthactivitiesinthe57%-ownedDiscoveryHoldingsLimited.
•Marketcapitalisationat31March2007:R127063million
•Website:www.firstrand.co.za

r e m g ro l i m i t e d4 |
g ro u p s t ru c t u r einformation on the companies in which investments are held
ASSOCIATED COMPANIES AND OTHEr
Industrial interests
effective interest: 41.0%
•Unlisted•ChiefExecutiveOfficers:MrsGAKlintworth(SouthAfrica);MKeren(Israel)
•TheUBRventurecoverstheterritoriesofSouthernAfricaandIsrael,andmanufactures and markets an extensive range of food products, while enjoying market leadership in most of its major categories. Well-knowninternationalandlocalbrandsinclude Robertsons herbs and spices, Knorr soups, Aromat seasonings, Rama and Flora margarine, Lipton and Joko tea, and Mrs Ball’s culinary products.
•Website:www.unilever.co.za
effective interest: 13.4%
• ListedontheJSELimited.•ChiefExecutiveOfficer:GEBortolan•NampakisAfrica’slargestandmost
diversified packaging manufacturer, with operationsintheUnitedKingdomandEurope.Itproducesawidevarietyofpackaging products from metals, paper, plastic and glass and is the largest manufacturer and distributor of tissue paper products.
•Marketcapitalisationat31March2007: R14552million
•Website:www.nampak.com
effective interest: 29.4%
• ListedontheJSELimited.•ChiefExecutiveOfficer:JJScannell•Distellproducesandmarketsfinewines,
spirits and flavoured alcoholic beverages, in South Africa with an increasing international profile.
• Interestisrepresentedbya50%shareholdinginRemgro-KWVInvestmentsLimited,whichhelda59%shareinDistellat 31March2007.
•Marketcapitalisationat31March2007: R10397million
•Website:www.distell.co.za
effective interest: 41.8%
•Unlisted•ChiefExecutiveOfficer:JJNjeke•KTIisanestablishedempowerment
company with a focus on investment banking services, media and strategic investments. KTIhasaninvestmentportfolioandstrategy that is complementary to that of Remgro.
•Website:www.kagiso.com
effective interest: 24.9%
•Unlisted•ChiefExecutiveOfficer:PWJordan• SubsidiaryofTotal(France).TotalSouth
Africa’s business is the refining and marketing of petroleum and petroleum products in South Africa and it has a market share of 14.7%.ItdistributestoneighbouringNBLScountries.Ithasa36%interestinNationalPetroleumRefinersofS.A.(Pty)Limited(Natref ).
•Website:www.total.co.za
effective interest: 50.0%
•Unlisted•ChiefExecutiveOfficer:AGCooper•AirProductsSAproducesoxygen,nitrogen,
argon, hydrogen and carbon dioxide for sale in gaseous form by pipeline under long-term contracts to major industrial users, as well as the distribution of industrial gases and chemicals for sale, together with ancillary equipment, to the merchant market.
•Theother50%oftheordinarysharesis heldbyAirProductsandChemicalsIncorporated,aUSAcompany.
•Website:www.airproducts.com
effective interest: 41.4%
• ListedontheJSELimited.•ChiefExecutiveOfficer:RFRöhrs•Dorbylisanindustrialgroupinthe
automotive engineering industry. The company specialises in the production and assembly of a wide range of vehicle components.
•Marketcapitalisationat31March2007:R511million
•Website:www.dorbyl.co.za
effective interest: 47.6%
• ListedontheJSELimited.•ChiefExecutiveOfficer:LJAlberts•Medi-Clinic’sbusinessconsistsofthe
provision of comprehensive, high-quality hospital services on a cost-effective basis.
•Marketcapitalisationat31March2007: R9898million
•Website:www.mediclinic.co.za
Other interests
effective interest: 21.3%
•Unlisted•ChiefExecutiveOfficer:JSchwenke•BusinessPartnersisaspecialistinvestment
company providing debt and equity investment, mentorship and property management services for small and medium enterprises in South Africa.
•Website:www.businesspartners.co.za
r e m g ro l i m i t e d | 5
g ro u p s t ru c t u r e information on the companies in which investments are held
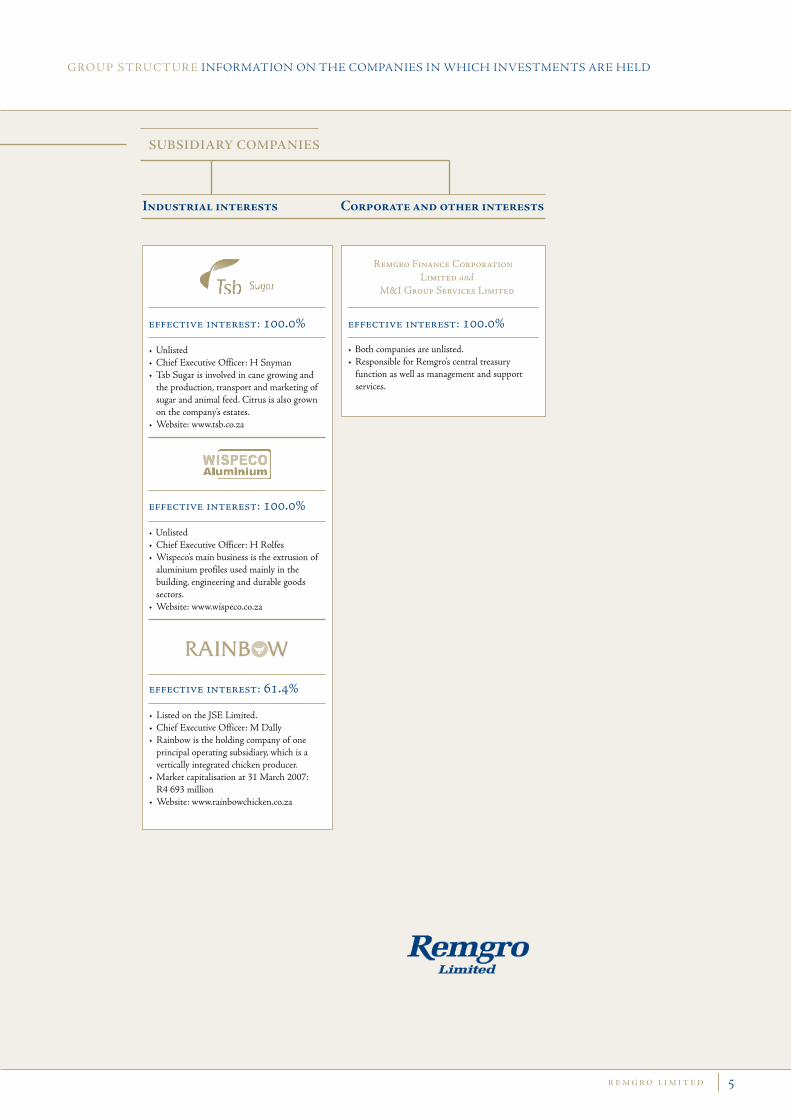
effective interest: 100.0%
•Unlisted•ChiefExecutiveOfficer:HSnyman•TsbSugarisinvolvedincanegrowingand
the production, transport and marketing of sugar and animal feed. Citrus is also grown on the company’s estates.
•Website:www.tsb.co.za
effective interest: 100.0%
•Unlisted•ChiefExecutiveOfficer:HRolfes•Wispeco’smainbusinessistheextrusionof
aluminium profiles used mainly in the building, engineering and durable goods sectors.
•Website:www.wispeco.co.za
effective interest: 61.4%
• ListedontheJSELimited.•ChiefExecutiveOfficer:MDally• Rainbowistheholdingcompanyofone
principal operating subsidiary, which is a vertically integrated chicken producer.
•Marketcapitalisationat31March2007: R4693million
•Website:www.rainbowchicken.co.za
SUBSIDIArY COMPANIES
Industrial interests
effective interest: 100.0%
•Bothcompaniesareunlisted.• ResponsibleforRemgro’scentraltreasury
function as well as management and support services.
Remgro Finance Corporation Limited and
M&IGroup Services Limited
Corporate and other interests

r e m g ro l i m i t e d6 |
s a l i e n t f e at u r e s
2007 2006 % change
HEADLINEEARNINGSPERSHARE– excludingnon-recurringportionofBEEcosts 1 445.4c 1130.9c 27.8
HEADLINEEARNINGSPERSHARE 1 445.4c 1052.3c 37.4
EARNINGSPERSHARE 1 464.2c 1697.6c (13.7)
HEADLINEEARNINGS– excludingnon-recurringportionofBEEcosts R6 853m R5464m 25.4
HEADLINEEARNINGS R6 853m R5084m 34.8
EARNINGS–net profit for the year R6 942m R8202m (15.4)
Dividends per shareOrdinary
–Interim–Final
Special
434.00c
153.00c281.00c
361.00c
133.00c228.00c
400.00c
20.2
15.023.2
Net asset value per share(attributabletoownmembers)
– at intrinsic value R221.00 R157.59 40.2
Tobacco interests Otherinvestments
R110.56R110.44
R70.99R86.60
55.727.5
Exchange ratesSA rand/pound sterling exchange rate – weighted average for the financial year –at31March
13.289814.3449
11.405010.6437
Stock exchange pricesClosingpricepershareat31March R181.00 R135.00 34.1
dividend cover

r e m g ro l i m i t e d | 7
s h a r e s tat i s t i c s
JSELimited 2007 2006 2005 2004 2003 2002
Weightednumberof Remgro ordinary shares in issue – excluding the unlisted “B”shares(’000) 438 617 447648 461786 467774 481011 486494
Marketcapitalisationat 31March(Rmillion)–Ordinarysharesonly 81 233 60588 45633 35028 25030 30649
Price(centspershare)–31March–Highest– Lowest
18 10018 29412 200
13500138009150
938097016980
720074955150
514573995145
630066504780
Number of shares traded(’000) 236 577 284396 187389 187231 216082 203231
Valueofsharestraded (Rmillion) 35 509 32732 15553 11785 14105 12 101
Shares traded/weighted number of ordinary shares(%) 53.9 63.5 40.6 40.0 44.9 41.8
Number of transactions 126 747 100309 64707 54055 58873 67712
remgro share price
Cents per share
Average closing priceHighest/lowestclosingprice

r e m g ro l i m i t e d8 |
s e v e n -y e a rconsolidated income statements
R million 2007 2006 2005 2004 2003 2002 2001
remgro’s relative share performance (based to 100)
Profitbeforetakingintoaccount the following 1 476 1938 1384 1292 1209 734 504Impairments,capitaland non-recurring items 51 3165 2216 (132) 1055 (158) 1523
Consolidated profit before tax 1 527 5103 3600 1160 2264 576 2027Taxation (403) (857) (417) (397) (394) (173) (109)
Consolidated profit after tax 1 124 4246 3183 763 1870 403 1918Share in after-tax profit of associated companies 6 003 4354 5742 3177 7262 3255 4765
Profitbeforetakinginto account the following 5 995 4428 4514 4164 4421 3881 2901Impairments,capitaland non-recurring items 8 (74) 1228 (987) 2841 (626) 1864
Net profit after tax 7 127 8600 8925 3940 9132 3658 6683Minorityinterest (185) (398) (407) (335) (446) (151) (109)
Attributable net profit for the year 6 942 8202 8518 3605 8686 3507 6574
Headline earnings 6 853 5084 4998 4687 4856 4252 3195
Headlineearningspershare(cents) 1 445.4 1052.3 1005.0 931.3 940.1 814.5 612.1Headlineearningspershare– excluding non-recurring portionofBEEcosts(cents) 1 445.4 1130.9 1005.0 931.3 940.1 814.5 612.1Earningspershare(cents) 1 464.2 1697.6 1712.9 716.3 1681.6 671.8 1259.4Dividendspershare(cents)–Ordinary 434.00 361.00 314.00 285.00 248.00 206.00 162.00–Special 400.00 600.00 200.00 100.00
Thefiguresfor2005abovehavebeenrestatedintermsofIFRS.Figuresfortheyearsbefore2005havenotbeen adjusted.
Since1January2006,Medi-Clinichasbeenaccountedforasanassociatedcompany,whileitwasconsolidatedpreviously.

r e m g ro l i m i t e d | 9
s e v e n -y e a rconsolidated balance sheets and cash flow statements
BAlANCE SHEETS Property,plantandequipment 2 565 2444 4120 3515 3253 2083 2027Investments–Associatedcompanies 33 033 26098 28201 22737 19844 16984 13164Othernon-currentassets 6 797 4584 2645 2106 3607 2831 2968Current assets 7 466 8210 4773 5372 4079 4435 3395
Total assets 49 861 41336 39739 33730 30783 26333 21554
Total equity 46 427 38090 36844 31411 28981 24991 20177Non-current liabilities 1 580 1144 866 685 472 244 310Current liabilities 1 854 2102 2029 1634 1330 1098 1067
Total equity and liabilities 49 861 41336 39739 33730 30783 26333 21554
Net asset value per share (Rand)(attributabletoownmembers)– at book value 96.69 78.14 71.51 59.26 54.19 46.10 37.14– at intrinsic value 221.00 157.59 119.97 100.36 77.23 89.50 64.32
CASH flOw STATEMENTS Cash generated from operations 1 666 1474 1566 1383 1055 618 401Cash flow generated from returns on investments 3 040 4200 2670 2013 2542 1697 1196Taxation paid (676) (369) (546) (363) (220) (111) (116)
Cash available from operating activities 4 030 5305 3690 3033 3377 2204 1481Dividendspaid (3 813) (4676) (2642) (1438) (1765) (968) (303)
Cash flow from operating activities 217 629 1048 1595 1612 1236 1178Net investing activities (1 725) 3364 (2203) (528) (1943) (201) 356Net financing activities 70 99 9 62 (82) (158) (631)
Netincrease/(decrease)incash and cash equivalents (1 438) 4 092 (1146) 1129 (413) 877 903
Thefiguresfor2005abovehavebeenrestatedintermsofIFRS.Figuresfortheyearsbefore2005havenotbeen adjusted.
Since1January2006,Medi-Clinichasbeenaccountedforasanassociatedcompany,whileitwasconsolidatedpreviously.
R million 2007 2006 2005 2004 2003 2002 2001
cash movement at the holding company (“cash at the centre”) (r million)

r e m g ro l i m i t e d1 0 |
d i r e c to r at eand members of committees
1 0 |
NON-EXECUTIVE DIRECTORS
J P Rupert (57) chairman
J Malherbe (52)
J W Dreyer (56)
P E Beyers (57)
E de la H Hertzog (57)Deputy chairman
EXECUTIVE DIRECTORS
M H Visser (53)chief Executive OfficerQualification: BComm (Hons), CA(SA)Years of service with the Group: 27
W E Bührmann (52)InvestmentsQualification: BComm, CA(SA)Years of service with the Group: 20
D M Falck (61)Group FinanceQualification: CA(SA)Years of service with the Group: 35
J A Preller (Mrs) (57) corporate AffairsQualification: BEconYears of service with the Group: 35
T van Wyk (59)InvestmentsQualification: BComm, LLB, LLM, H Dip TaxYears of service with the Group: 17
Directorships: British American Tobacco Plc, Distell Group Limited, Kagiso Trust Investments (Pty) Limited, Nampak Limited, Medi-Clinic Corporation Limited, Unilever Bestfoods Robertsons (Holdings) Limited L.L.C. and Chairman of Rainbow Chicken Limited.
Directorships: RMB Holdings Limited, FirstRand Limited, FirstRand Bank Holdings Limited, Total South Africa (Pty) Limited and Trans Hex Group Limited.
Directorships: Air Products SA (Pty) Limited, Dorbyl Limited, Kagiso Trust Investments (Pty) Limited, Momentum Group Limited, Tsb Sugar Holdings (Pty) Limited, Chairman of Wispeco Holdings Limited and Deputy Chairman of Business Partners Limited.
Directorships: Executive Chairman of Compagnie Financière Richemont SA and Richemont Société Anonyme and Non-executive Chairman of VenFin Limited and Chairman of Business Partners Limited.
Directorships: Chairman of Medi-Clinic Corporation Limited. Serves on the Board of Distell Group Limited, Total South Africa (Pty) Limited and Trans Hex Group Limited.
Directorships: Richemont Société Anonyme, British American Tobacco Plc, Distell Group Limited and Unilever Bestfoods Robertsons (Holdings) Limited L.L.C.
Directorships: RMB Holdings Limited.
Directorships: Dimension Data Holdings Plc, Datacraft Asia Limited, e.tv (Pty) Limited and Deputy Chairman of VenFin Limited.

r e m g ro l i m i t e d | 1 1 | 1 1
d i r e c to r at e and members of committees
Executive CommitteeM H Visser (Chairman)W E BührmannD M FalckJ A PrellerT van Wyk
Audit and Risk CommitteeD Prins (Chairman)G D de JagerD M Falck F Robertson
MEMBERS OF COMMITTEES
Remuneration and Nomination CommitteeJ P Rupert (Chairman)G D de JagerP K HarrisF Robertson
INDEPENDENT NON-EXECUTIVE DIRECTORS
P K Harris (57)
M M Morobe (50)
D Prins (59)
M Ramos (Miss) (48)
G D de Jager (56) Directorships: Anglo Suisse Investment Holdings Limited, Lenco Holdings Limited and Sharp Interpack Limited.
Directorships: Chief Executive Officer of FirstRand Limited and director of RMB Holdings Limited and Momentum Group Limited.
Directorships: Chairman of My Acre of Africa Trust and co-Chairman of City Year South Africa and director of Johannesburg Housing Company, Resolve Group (Pty) Limited and South African National Parks Board.
Directorships: Sanlam Limited and Chief Executive Officer of Transnet Limited.
F Robertson (52) Directorships: Executive Deputy Chairman of Brimstone Investment Corporation Limited and Chairman of Lion of Africa Insurance Company Limited and Lion of Africa Life Assurance Company Limited.

r e m g ro l i m i t e d1 2 |
g e n e r a l r e p o rtfinancial review
INTrODUCTIONThe South African economy registered real GDP growth of 5% in calendar 2006, i.e. the thirdconsecutive year at around such a level. The economy remained remarkably resilient towards the end of 2006 and early in 2007 in the face of higher interest rates. Both the global and domesticfinancialmarketshavealsoshruggedoffthejittersthatsurfacedinMayandJune2006andinlate February2007.Domesticbusinessandconsumerconfidenceremainedpoisedatelevatedlevelsduringtheearlypartof2007suggestingthatthestrongeconomicgrowthcouldcontinue.Withrobustfixedinvestment spending across many sectors, employment is growing and this is improving household finances generally, in turn underpinning consumption spending.
While the interest rate sensitive components of domestic spending are expected to slow down,robust fixed investment and a recovery in exports are encouraging elements of the economy’s recent performance. This needs to improve further in order to create a better balance on the current account of the balance of payments. The deficit on the current account which widened to 6.4% of GDP in 2006, continues to be handsomely financed by capital inflows, although these inflows tend to be dominated by portfolio investments.This in turn results in an element of riskregarding the rand exchange rate.
WhiledomesticCPIXinflationcameinclosetothemid-levelofthe3-6%targetrangeduring2006,inflationacceleratedtowardstheendoftheyear,breakingthroughtheupper6%boundaryinAprilthisyear.Energyandfoodpriceincreaseshavebeenthemaindriversofhigherinflation,butthereisalsoevidenceofbroaderinflationpressures.TheSAReserveBankdecidedtoincreaseinterestrateswithhalfapercentinJuneafterpausingwithinterestratehikesinFebruary2007.CPIXinflationis likely to continue trending above theupper6% inflation target level over the short term,whichincreases the risk of further interest rate hikes.
On the global front, a key source of economic strength remains the robust growth in emerging markets, led by China, which is underpinning commodity strength and capital flows into developing countries.The resurgence of economic growth in Europe and Japan provides furthersupport and compensates forwhat appears to be a soft landing in theUSA.The global economyremains supportive of the South African economy although slightly lower growth is expected over the short term compared to last year.
HEADlINE EArNINGS Total headline earnings for the year to 31March 2007 increased by 34.8% from R5 084 million toR6853million.Headlineearningspershare,however, increasedby37.4%from1052.3cents to 1445.4centsduetothefavourableeffectofthesharerepurchaseprogramme.ExcludingRemgro’sshareofthenon-recurringportionofBEEcostsincurredbyvariousinvesteecompaniesinthecomparativeyear,headlineearningsandheadlineearningspershareincreasedby25.4%and27.8%respectively.
contribution to headline earnings Year ended 31 March
Non-recurring Non-recurring portion of portion of BEEcosts BEEcosts included excluded 2007 % 2006 % 2006 R’m change R’m change R’m Tobacco interests 2 964 25.1 2369 25.1 2369Financialservices 1 529 33.3 1147 6.5 1436Industrialinterests 1 924 62.5 1184 50.9 1275Mininginterests 155 (46.2) 288 (46.2) 288Corporate finance and other interests 281 192.7 96 192.7 96 6 853 34.8 5084 25.4 5464

g e n e r a l r e p o rt financial review
r e m g ro l i m i t e d | 1 3
The following commentary, comparing the results to those of the previous year, is based on headline earnings excluding the non-recurring portion of BEE costs.
The contribution of the tobacco interests, which represented 43.3% (2006: 43.4%) of headlineearnings,increasedby25.1%.
Currency movements had a greater impact on the Group’s earnings than in the previous financial year. Duetotheweakerrand, thecurrency impactontranslationofR&RHoldingsSA,Luxembourg’s(R&R)contribution toheadline earnings increased fromanunfavourableR26million in2006 to a favourable R420 million, as set out in the table below.
Year ended 31 March 2007 2006Averageexchangerate(R/£) 13.2898 11.4050Closingexchangerate(R/£) 14.3449 10.6437R&R’scontribution(£’m) 223 208R&R’scontribution(R’m) 2 964 2369Favourable/(unfavourable)currencyimpact(R’m) 420 (26)
Insterlingterms,R&R’scontributionincreasedby7.2%.
ThecombinedcontributionofFirstRandandRMBHtoRemgro’sheadlineearningsamountedto R1529million (2006:R1313million), an increase of 16.5%, due to goodperformances byFirstNationalBankandRandMerchantBank.In2006dividendsfromAbsaGroupLimitedamountingtoR123millionwerealsoaccountedforinheadlineearnings.
The contribution of the industrial interests to headline earnings increased by 50.9%. UnileverBestfoods Robertsons and Tsb Sugar produced strong results, while Distell and RainbowChicken continued their earnings growth, with contributions to Remgro’s headline earnings amountingtoR210millionandR293millionrespectively(2006:R164millionandR250million).KagisoTrust Investments (Pty) Limited’s (KTI) contribution toRemgro’s headline earningswas R307million. During the year under review KTI’s profit was favourably impacted by fair valueadjustments of the conversion right attached to its holding of Metropolitan Holdings Limitedpreferenceshares(R390million)aswellasanon-recurringprofitrealisedontheexerciseofitsoptiontoacquireaninterestinTheFirstRandEmpowermentTrust(R81million).AsRemgroeffectivelyacquired its investment in KTI during December 2005, no income from KTI was accountedfor during the comparative year. Medi-Clinic’s contribution to headline earnings increased from R200millionin2006toR278million.Thisincreasecanbeattributedmainlytosecondarytaxationon companies (STC)paid byMedi-Clinic in the comparative period on the special dividend thatwas paid inDecember 2005.Nampak’s contribution toRemgro’s headline earnings amounted to R125million(2006:R107million).
Mining interests’ contribution to headline earnings decreased by 46.2% to R155 million (2006:R288million).Thisdecreasecanbeattributedmainlytothenon-recurringspecialdividendamountingtoR183millionreceivedfromImplatsduringthecomparativeyear.DividendsreceivedfromImplatsamountedtoR147million(2006:R277million).TransHex’scontributiontoheadlineearningswasR8million(2006:R10million).
The central treasury division’s contribution increased from R146 million to R266 million. Thisincrease can be attributed mainly to higher interest rates as well as higher average cash balances compared to 2006.Also included therein, are foreign currency profits amounting toR65million

(2006: R24million loss) relating to intergroup balances. These intergroup balances were settledduring the past year.
Headline earningswas also impacted favourably by the accounting recognition of a pension fundsurplusamountingtoR70millionfollowingthefinalisationofasurplusallocationprocess.
EArNINGSTotalearningsdecreasedby15.4%toR6942million(2006:R8202million),mainlyasaresultofcapital gains arising on the realisation of investments accounted for during the comparative year.
CASH EArNINGSAttributablecashearnings(excludingtheGroup’sshareofnetprofitsretainedbyassociatedcompanies),beforeimpairmentsandcapitalandnon-recurringitems,decreasedby24.9%fromR4871milliontoR3660million,mainlyasaresultofadecreaseindividendsreceivedfromassociatedcompanies.ThelatteramountedtoR2580millioncomparedtoR3478millionin2006.ThissubstantialdecreasewasmainlyduetothespecialdividendsreceivedfromMedi-ClinicandDorbylaswellasImplatsin2006.
rEPUrCHASE Of rEMGrO SHArESDuring the year under review, a wholly owned subsidiary company of Remgro acquired a further 7174384 Remgro ordinary shares at an average price of R143.71 for a total amount of R1031.0million.At31March2007,8554019Remgroordinaryshares(1.9%)wereheldastreasuryshares. No derivative transactions, which may have lead to the repurchase of Remgro shares, were entered into during the year under review.
TheRemgroShareTrustpurchased563000(2006:21000)Remgroordinarysharesduringtheyearunder review, at anaveragepriceofR132.68 (2006:R134.46) for a total amountofR74.7million(2006:R2.8million),while262016(2006:1308790)sharesweredeliveredtoparticipantsagainstpayment of the subscription price.
DIVIDENDSOrdinarydividendsof434.00centspershareweredeclared for theyear,comparedto361.00centsthepreviousyear.Thisrepresentsanincreaseof20.2%.Thedividendiscovered3.3timesbyheadlineearnings and 1.8 times by cash earnings, against 3.1 times (excluding BEE costs) and 2.8 timesrespectively the previous year.
INTrINSIC VAlUEThe intrinsic net asset value of the Group includes valuations of all investments, incorporating subsidiary and associated companies, either at listed market value or, in the case of unlisted investments, at directors’ valuation. The net assets of wholly owned non-investment subsidiary companies, consisting mainly of monetary items, are included at book value.
The following factors are taken into account in determining the directors’ valuation of unlisted investments:• Marketvalueandearningsyieldofsimilarlistedshares,takingintoaccountthatthemarketability
ofunlistedinvestmentsislimitedand,insomecases,alsothetradeability;• Growthpotentialandrisk;• Underlyingnetassetvalue;• Profithistory;and• Cash flow projections
r e m g ro l i m i t e d1 4 |
g e n e r a l r e p o rtfinancial review

r e m g ro l i m i t e d | 1 5
g e n e r a l r e p o rt financial review
TheintrinsicnetassetvalueattheendofMarch2007amountedtoR221.00pershare.Aschedule, setting out the analysis of the intrinsic net asset value per share on 31March 2007 and 2006, isincluded at the end of the investment review.
The cash at the centre differs from the cash in the balance sheet. The latter comprises the following:
2007 2006 R million R millionPerbalancesheet 5 004 6357Less: Cash from other operating subsidiaries (647) (562)Cash at the centre 4 357 5795
– Local 1 220 4066–Offshore 3 137 1729
Cash held by associated companies are not included. For information, R&R’s cash attributable toRemgroat31March2007,amountedto£150million or R2151million(2006:£143 million or R1524million).
The table below compares the relative performance of the Remgro intrinsic net asset value per share in relationtocertainselectedJSEindices.NoaccounthasbeentakenofdividendspaidbyRemgro.
2007 2006 2005 2004 2003 2002Intrinsicnetassetvalue– Rand per share 221.00 157.59 119.97 100.36 77.23 89.50JSE–Allshareindex 27 267 20352 13299 10693 7680 11015–Fin&Ind30index 24 960 19491 13477 9953 6682 9713–Financial15index 9 345 7616 5258 3782 2744 3415 – Resource 20 index 50 018 34923 21585 19961 15763 24512Remgroshareprice(Rand) 181.00 135.00 93.80 72.00 51.45 63.00 1 year to 5 years to 31 March 2007 31 March 2007 Relative performance (% year-on-year) (% comp p.a.)Intrinsicnetassetvalue +40.2 +19.8JSE–Allshareindex +34.0 +19.9–Fin&Ind30index +28.1 +20.8–Financial15index +22.7 +22.3 – Resource 20 index +43.2 +15.3Remgro share price +34.1 +23.5
The tablebelowcomparesRemgro’s internal rateof return (IRR)with thatof certain selected JSEindices.Forthispurpose ithasbeenassumedthatdividendshavebeenreinvested ineitherRemgroshares or in the particular index, depending on the case. IRR From 26 September 2000 to 31 March 2007 (% comp p.a.)JSE–Allshareindex +24.41–Fin&Ind30index +16.45–Financial15index +19.24 – Resource 20 index +31.55Remgro share +32.20

TOBACCO INTErESTScontribution to headline earnings 2007 2006 R million R millionR&RHoldings 2 964 2369
R&R HoldingsRemgro’s interest in British American Tobacco Plc (BAT)isrepresentedbyitsone-thirdholdingoftheordinarysharesandallofthe“2005”participationsecuritiesissuedbyR&R.ThisgivesRemgroaneffectiveinterestof10.4%inBATat31March2007.Theothertwo-thirdsoftheordinarysharecapitalofR&RisheldbyCompagnieFinancièreRichemontSA(Richemont).
Therewas no change in the number of BAT shares held byR&R.However, due to the positiveeffectofBAT’scontinuingsharebuy-backprogramme,R&R’sinterestinBATincreasedto29.4%at 31March2007(2006:28.9%).
R&R,Remgro,RichemontandBATarepartiestoaStandstillAgreement(theagreement)originallyenteredintoatthetimeofthemergerofRothmansInternationalandBATin1999.Underthetermsof this agreement, BAT is not permitted to continue with its share buy-back programme without R&R’s,Remgro’sandRichemont’sconsentoncetheircombinedinterestreaches30%.Atthislevel,the London Takeover Code would normally require that a cash offer be made for the shares in BAT thatR&Rdoesnotalreadyown.TheagreementthereforeprotectedR&Randitsshareholdersfromthe obligation to make a compulsory bid for BAT.
On1March2007BATannouncedthatithadsoughtR&R’s,Remgro’sandRichemont’sconsenttoallowittocontinuewithitssharebuy-backprogramme,notwithstandingthatitbelievesthatthe30%limitwillbereachedwithinthenext12to15months.ToprecludeanyobligationonR&R,Remgroand Richemont to make a cash bid for those shares that they do not already own, BAT proposed to obtain approval from its independent shareholders for a waiver under the terms of the London Takeover Code.
R&R,Remgro andRichemont agreed to the proposalsmade byBAT. In return for giving theirconsent, they asked for and obtained a commitment from BAT that, if so requested, it will seek to obtain a secondary listing for its ordinary shares on the JSELimited, subject to all regulatoryapprovalsbeingobtained.On26April2007theindependentshareholdersapprovedtheproposalsmade by BAT and the waiver under the terms of the London Takeover Code.
R&R’sshareofBAT’searningsforthetwelvemonthsto31March2007isbasedonBAT’sresults for the year ended31December2006plus the results for thequarter to31March2007 less theresultsforthequarterto31March2006.
Remgro’s share ofR&R’s headline earnings consists of 35.46%ofR&R’s share of the attributableprofit of BAT and its share of R&R’s non-BAT profit (this includes income attributable to itsinvestmentinthe“2006”participationsecuritiesissuedbyR&RduringMarch2006).
r e m g ro l i m i t e d1 6 |
g e n e r a l r e p o rtinvestment review(Note: Only limited commentary is given for listed companies seeing that the information is generally available. The unlisted investments are dealt with in more detail .)
r e m g ro l i m i t e d | 1 7
g e n e r a l r e p o rt investment review
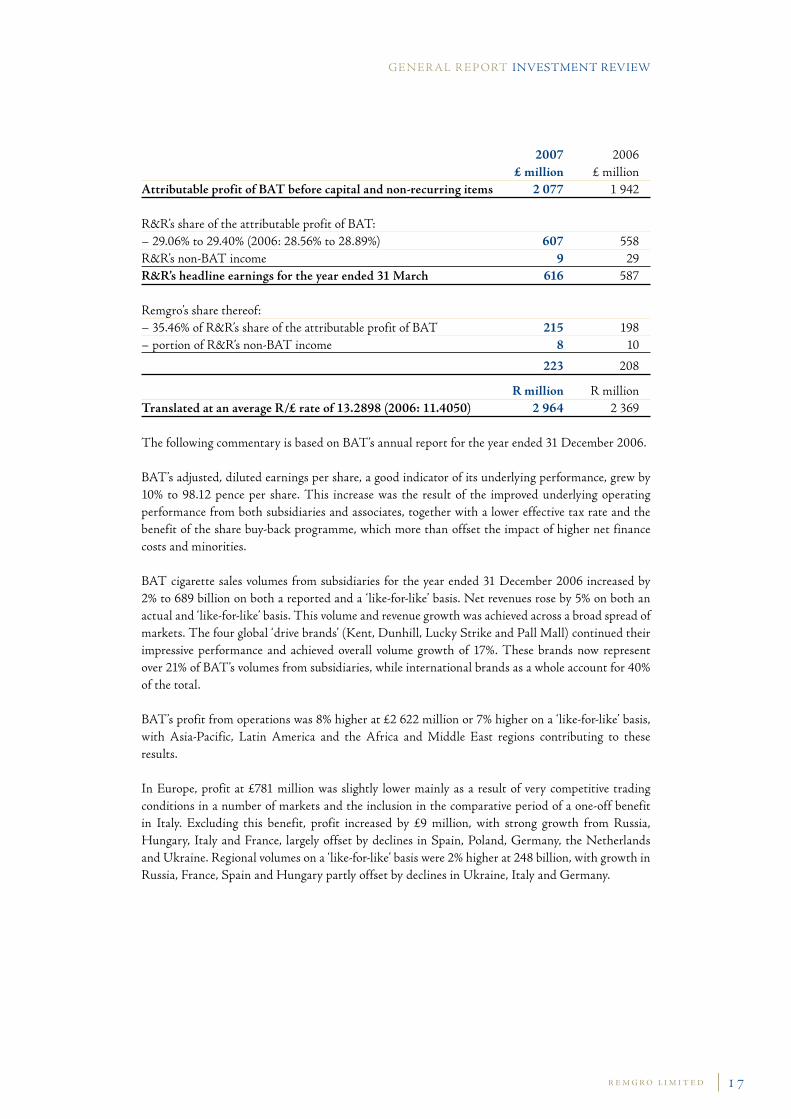
2007 2006 £ million £ millionAttributable profit of BAT before capital and non-recurring items 2 077 1 942 R&R’sshareoftheattributableprofitofBAT: –29.06%to29.40%(2006:28.56%to28.89%) 607 558R&R’snon-BATincome 9 29 R&R’s headline earnings for the year ended 31 March 616 587
Remgro’s share thereof: –35.46%ofR&R’sshareoftheattributableprofitofBAT 215 198–portionofR&R’snon-BATincome 8 10
223 208
R million R million Translated at an average R/£ rate of 13.2898 (2006: 11.4050) 2 964 2369 ThefollowingcommentaryisbasedonBAT’sannualreportfortheyearended31December2006.
BAT’s adjusted, diluted earnings per share, a good indicator of its underlying performance, grew by 10% to 98.12 pence per share.This increasewas the result of the improvedunderlying operatingperformance from both subsidiaries and associates, together with a lower effective tax rate and the benefit of the share buy-back programme, which more than offset the impact of higher net finance costs and minorities.
BATcigarette salesvolumes fromsubsidiaries for theyearended31December2006 increasedby2%to689billiononbothareportedanda‘like-for-like’basis.Netrevenuesroseby5%onbothanactualand‘like-for-like’basis.Thisvolumeandrevenuegrowthwasachievedacrossabroadspreadofmarkets.Thefourglobal‘drivebrands’(Kent,Dunhill,LuckyStrikeandPallMall)continuedtheirimpressive performance and achieved overall volume growth of 17%.These brands now representover 21% of BAT’s volumes from subsidiaries, while international brands as a whole account for 40% of the total.
BAT’sprofitfromoperationswas8%higherat£2622millionor7%higherona‘like-for-like’basis,with Asia-Pacific, Latin America and the Africa andMiddle East regions contributing to theseresults.
InEurope,profit at£781millionwas slightly lowermainly as a resultof very competitive tradingconditions in a number of markets and the inclusion in the comparative period of a one-off benefit in Italy. Excluding this benefit, profit increased by £9 million, with strong growth from Russia,Hungary, ItalyandFrance, largelyoffsetbydeclines inSpain,Poland,Germany, theNetherlandsandUkraine.Regionalvolumesona‘like-for-like’basiswere2%higherat248billion,withgrowthinRussia,France,SpainandHungarypartlyoffsetbydeclinesinUkraine,ItalyandGermany.

InAsia-Pacific,regionalprofitincreasedby£85millionto£616million,mainlyattributabletogoodperformancesinAustralasia,Malaysia,SouthKoreaandPakistan.Volumesat142billionwere4%higherasstrongincreasesinPakistan,Bangladesh,SouthKoreaandVietnamwerepartiallyoffsetbydeclinesinMalaysiaandIndonesia.
ProfitinLatinAmericaincreasedby£81millionto£611millionduetogoodperformancesacrosstheregion,coupledwithastrongeraverageexchangerateinBrazil.Volumesgrewinmanyofthemarketswhichledtoanoverallincreaseof2%to153billion.
ProfitintheAfricaandMiddleEastregiongrewby£34millionto£468million,mainlydrivenbySouthAfrica,Nigeria,theMiddleEastandEgypt.Volumeswereslightlyhigherat103billion,asaresultofNigeria,EgyptandtheMiddleEast,partiallyoffsetbydecreasesinTurkey.
TheprofitfromtheAmerica-Pacificregiondecreasedby£12millionto£424million,whilevolumesweredown3%to44billionsticks.TheincreasesinprofitandvolumesfromJapanweremorethanoffset by lower contributions from Canada.
BAT’s associated companies grew their volumes by 4% to 241 billion sticks. BAT’s share of the post-taxresultsamountedto£431million.Excludingexceptionalitems,theshareofthepost-taxresultsofassociates,increasedby£38millionto£427million,mainlyfromReynoldsAmericanandITC.Thecontribution from Reynolds American, excluding brand impairment charges and the benefit from the favourableresolutionofcertaintaxmattersinbothyearsaswellasotherexceptionalchargesin2005,was£18millionhigherat£285million.Thiswasmainlyduetoimprovedpricingandcostreductions,partiallyoffsetbylowervolumes.ThecontributionfromITC,BAT’sassociateinIndia,increasedby£11 million to £91 million.
fINANCIAl SErVICEScontribution to headline earnings
BothFirstRandLimitedandRMBHoldingsLimitedhaveJuneyear-endsandtheirresultsforthetwelvemonthsended31Decemberhavethereforebeenequityaccounted.
FirstRandFirstRand’s contribution to headline earnings shown above excludes the indirect contribution ofFirstRandthroughRemgro’sinterestinRMBH.
Forthelatestreportedsixmonthsended31December2006,FirstRand’sheadlineearningsincreasedby 26% to R4 569 million (2005: R3 636 million). These results were achieved in a favourableeconomic environment that provided strong organic growth opportunities, particularly for the FirstRandBankinggroup.
r e m g ro l i m i t e d1 8 |
g e n e r a l r e p o rtinvestment review

r e m g ro l i m i t e d | 1 9
g e n e r a l r e p o rt investment review
RMBHForthesixmonthsended31December2006,86.9%(2005:82.7%)ofRMBH’sheadlineearningswasfromFirstRand,whileitsotherinterestscontributed13.1%(2005:17.3%).
RMBH’s other interests include RMB Structured Insurance Limited,OUTsurance Limited andGlenrandM.I.B.Limited. OUTsurance posted excellent results for the six months ended 31 December 2006. Net earnedpremium income exceeded R1.3 billion, reflecting a 27% increase due to strong organic growthin both personal lines and business lines, as well as continued efficiency gains. OUTsurance’sheadlineearningsforthesix-monthperiodincreasedby18%.RMBStructuredInsuranceachievedmuted growth in headline earnings of 7% while GlenrandM.I.B. reported headline earnings of R3.6million(2005:R9million)inchallengingmarketcircumstances.
INDUSTrIAl INTErESTScontribution to headline earnings
Kagiso Kagiso Trust Investments (Pty) Limited is a BEE controlled investment holding company. Its investments are predominantly in the financial services, media and other industrial sectors.Its two largest investments, by value, are in Metropolitan Holdings Limited (MHL) and Kagiso MediaLimited. KTIposted strong results for the sixmonths ended31December2006,withheadline earningsofR625.9millioncomparedtoR473.5millionforthefullyearendedJune2006. Included in the earnings are profits realised on the sale of equity stakes in Alstom andNormanBissettandAssociates(NBA),whichwereheldthroughKagisoVenturesPrivateEquityFundI.ItshouldbenotedthatKTIhassubsequentlyreinvestedinbothAlstomandNBAviaKagisoStrategicInvestmentsII. InOctober2006,KTIacquired7.5%ofMacsteelaspartofabroaderBEEconsortium. Inaddition,unrealisedfairvaluegainsofR302million,whichareincludedintheheadlineearnings,wereachievedontheinvestmentinMHL. KTIexerciseditsoptiontoacquireaninterestintheFirstRandEmpowermentTrustinAugust2006.ThisresultedinacquisitionprofitsofR81million,whicharealsoincludedinheadlineearnings.

Rainbow Rainbow Chicken Limited’s headline earnings increased by 19.2%, from R400.3 million to R477.0million,andby13.7%excludinganon-recurringtaxationbenefit. Rainbow’s revenue increased by 15.3% and chicken revenue by 13%. Rainbow’s average pricerealisationgrowthof8%resultedfromanimprovedproductmix.Overallchickenvolumesincreasedby 5%, with encouraging growth in sales to the Quick Service Restaurant sector and targetedcustomers and brands. The macro-economic environment remained positive during the year, despite increasing inflation and interestrates,andconsumerdemandremainedstrong.However,itisexpectedthatthefullimpactofthe interest rate hikes will only be felt in coming months. Epol is a critical element inRainbow’s overall cost chain. It has performedwell during the year,with improved capacity utilisation through higher external volumes. The raw material procurement strategyhas enabledEpol to be price competitive despite inflationarypressures.The significantlyhighermaize prices will, however, be felt in feed and chicken prices in the new year, which willtranslateintoprofitmargincompressioninthe2008financialyear. Thelocalchickenindustryremainsonhighalertforavianinfluenza.Rainbowandthelocalindustryatlarge,throughtheSouthernAfricanPoultryAssociationandinco-operationwiththeNationalDepartmentofAgriculture,havefocusedonpreventionthroughincreasedbiosecurityandstepped-up surveillance and monitoring of f lock health. Rainbow’s strong performance is due to a number of strategic initiatives that have increased chicken volumes in targeted customer and branded products and the building of strategic partnerships with key customers, optimising route to market opportunities and product mix. Medi-Clinic Medi-ClinicCorporationLimited’sturnoverincreasedby14%toR5364million(2006:R4723million)for the yearunder review,whileheadline earnings (excluding theSTCcharge andBEE share-based paymentcost)increasedby5%toR581million(2006:R553million).
On 27March 2007, the group’s acquisition of a controlling share (50% plus 1 share) in EmiratesHealthcare Holdings Limited became unconditional. Emirates Healthcare owns and operates theWelcareHospital(120beds)andhascommencedconstructionofthe210-bedCityHospital.Thishospitalshouldbeoperationalattheendof2007.EmiratesHealthcarealsohastherighttodevelopother hospitals and clinics. This will make EmiratesHealthcare the largest healthcare provider inDubai.Due to the acquisition justbeforeyear-endnoneofEmiratesHealthcare’soperating resultswereincludedinMedi-Clinic’sincome.
Localacquisitionsduringtheyearunderreviewincludeda49.9%interestinthe190-bedWitsDonaldGordanMedicalCentre,a100%interestintheLegaePrivateHospital(137beds),aswellasa51%interest in the 200-bed Protector Group. Excluding the capacity increase, Medi-Clinic’s turnoverincreased by 11%, partly due to an increase in both in-patient-bed-days and average income per bed-day as well as a slight change in the case profile of patients treated.
r e m g ro l i m i t e d2 0 |
g e n e r a l r e p o rtinvestment review

r e m g ro l i m i t e d | 2 1
g e n e r a l r e p o rt investment review
Total South Africa – UnlistedTotalSouthAfrica(Pty)Limitedreportedexcellentresultsfortheyearto31December2006duetoincreased retail market share and improved margins. Themarket share ofmain fuels stood at 14.7% at the end of 2006 (2005: 14.6%).Whilst retailmarket share continued to grow during 2006, Commercial& Specialities continued its focus onconsolidating customer profitability. In 2006, after the launch of the Clean Fuel 1, the Natref refinery experienced a few unplanned shutdowns which resulted in production being lower than expected.Natrefiscurrentlyhavingplannedmaintenanceandimprovementsresultingina50-daysshutdown. After this operation the production rate is expected to increase. The company again maintained a high level of investment in its marketing activities during the year. Safety remained a key focus area as part of the overall Total group emphasis on health, safety, environment and quality matters.
Unilever Bestfoods Robertsons (Holdings) LLC (UBR) – UnlistedTheUBRventurecoverstheterritoriesofSouthernAfricaandIsraelandmanufacturesandmarketsanextensiverangeoffoodproducts.Itenjoysmarketleadershipinmostofthemajorcategories.
IsraelThegeneraleconomicclimateinIsraelishealthy,withgrowthinGDPofaround5%,interestratesathistoricallylowlevels(3.75%)andtheshekelstrengtheningsteadilyagainstmajorcurrencies,notablythe US dollar. This benign economic environment has been maintained despite the continuingpoliticaltensionswithintheregionandtheworseningcrisisinnearbyGaza.Pricesintheeconomyingeneralremainstable,withminordeflationoverrecentmonths.Inthefoodsectorpricepressurefrom competing retailers remains a key feature, with levels of promotional activity continuing to rise steadily.
Turnoverinshekel,forthetwelvemonthsended31March2007,increasedby3.5%comparedwiththe previous period. This increase comprised a 2.4% increase in the professional market sector and a 4.0% increase in the retail sector.
Gross margins increased by 2.6% against the previous period. This was driven by a substantialimprovement in sales mix, with high-margin cereal sales growing strongly, and by price increases takenintheDressingsandMargarinecategories.Costsavingswerealsoeffectedinlinewithplans,particularly in respect of distribution costs.
IndirectcostsdecreasedbyR25.6millionagainstthepreviousperioddueprimarilytotheeffectofarestructuringprogrammecompletedinMarch2007.Thissawasignificantreductioninemployeesthrough the period from 2005 toMarch 2007, but also brought benefits in respect of businesssimplification and process improvement.
South Africa2006/2007wasthesecondyearofthePathtoVitality2010Strategy.Volumegrowthintheretailbusiness was 6%, in linewith the strategic intent tomove volume growth to a sustainable 5-6%.Marketsharesincreasedinmostcategories,particularlyinregularsoup,stockcubesandherbsandspices, while remaining f lat in tea.

Turnoverincreasedby10.3%.ThiswasdrivenbyagoodperformanceinSavoury&Dressings(S&D)and Cooking with key launches of Rama/Flora and Knorr delivering positive results. Retail turnover is11.3%higherthanin2006,reflectingstrongvolumegrowthacrosstherangeinthelatterhalfof2006.Thegrowthwasdrivenmainlybynewproductlaunchesandbrandspecificactivities,partlyoffsetbylowergrowthintheMarch2007quarterduetocompetitorpricinginteaandthelackofpre-priceincreasebuy-inonS&D.
Interestonshareholderloansdecreasedduetothepartialrepaymentofloancapital,Remgro’sportionthereofbeingR164million.
UBR’scontributiontoRemgro’sheadlineearningsismadeupasfollows:
2007 2006 R million R millionEarningsbeforecapitalandnon-recurringitems – South Africa 162 108–Israel 51 18 213 126Less: Capital and non-recurring items charged against headline earnings (17) (1)Headlineearnings 196 125Interestonshareholder’sloanaftertaxation 14 21 Contribution to headline earnings 210 146
DistellDistellGroupLimited’scontributiontoRemgro’sheadlineearningsrelatestoitsresultsforthetwelvemonthsended31December2006.
Forthelatestreportedsix-monthperiodended31December2006,Distell’sturnovergrewby16.6%toR4.3billiononasalesvolumeincreaseof11.0%.Salesvolumeinthedomesticmarketincreasedby11.9%.Internationalsalesvolume,excludingAfrica,grewby3.3%,resultinginanincreaseof27.5%ininternationalturnover.TurnoverderivedfromAfricancountriesincreasedby16.3%onsalesvolumegrowthof10.5%.
Theincreaseof30.2%toR460millioninDistell’sheadlineearningsforthesix-monthperiodended31December2006,excludingtheBEEexpenseofthepreviousyear,wasduetoincreasedturnoverresulting from brand marketing and pricing strategies.
NampakNampak Limited’s contribution to Remgro’s headline earnings relates to its results for the twelve monthsto31March2007. Nampak recently reported an increase in headline earnings per share of 6.2% to 87.6 cents (2006:82.5cents)forthesixmonthsended31March2007.However,earningsdeclinedby3.4%toR462.2millionfromR478.3million. Revenue increased by 11%, boosted by good volume growth in South Africa. Although the profit marginincreased,operatingprofitdecreasedby1.5%toR781million.
r e m g ro l i m i t e d2 2 |
g e n e r a l r e p o rtinvestment review

r e m g ro l i m i t e d | 2 3
g e n e r a l r e p o rt investment review
Tsb Sugar – Unlisted Tsb Sugar Holdings (Pty) Limited is primarily involved in cane growing and the production,transport and marketing of refined and brown sugar and animal feed. The main area of operation is theNkomaziregionintheMpumalangaLowveld.Sugarproductsaresoldunderthewell-establishedSelatibrand.TheSelatibrandenjoysmarketleadershipinitstargetmarket(Gauteng,Mpumalanga,NorthWest andLimpopo),while the recent expansion intoother geographic areashas alsobeenverysuccessful.TsbSugar’stwosugarmillsaresituatednearMalelaneandKomatipoort.TsbSugaralsoholdsa27.03%shareholding inRoyalSwazilandSugarCorporationLimited,acompanythatowns and operates two sugar mills. In addition, the company holds an effective shareholding of 63.5%inManangaSugarPackers–asugarpackagingandmarketingcompanybasedinSwazilandwhichmarketssugarundertheFirstbrandinSwazilandaswellasinSouthAfrica.
TheSouthAfricansugar industry’sproductiondecreasedby10.8% in2006/2007due toclimaticconditions.TsbSugar’s sugar productiondecreased by only 7.7%.Thiswas due to the favourableclimatic conditions in the Tsb Sugar water catchment areas and the subsequent increase in irrigation water. The effect of a smaller harvest was offset by the increase in the world sugar price and together with a weaker rand, had a positive effect on the financial performance of millers and growers throughout the industry.
Atotalof3.629milliontonsofcanewerecrushedthisseason(2006:3.737milliontons),withasugarproductionof436804tonsrawsugar(2006:461057tons)atthetwomillsoperatedbyTsbSugar.Thesugartocaneratioof8.3comparesfavourablytotheSouthAfricansugar industryaverageof 8.6andindicatedgoodproductionefficienciesatbothmills.
TsbSugaroperatesarefineryattheMalelaneMillcomplex.Rawsugarreceivedfromthecompany’ssugarmillsisrefinedforboththelocalandexportmarkets.Therefineryproduced314432tonsofrefinedsugarduringtheyear(2006:329689tons).
Theanimalfeedoperation,Molatek,producesvariousproductsfortheneedsofthelivestockmarket.Themajorrawmaterials(molassesandbagasse)usedintheproductionprocessareby-productsofsugar production.
Tsb Sugar also invests in citrus through its 51% share in Golden Frontiers Citrus (GFC). GFCowns three citrus estates where grapefruit and oranges are cultivated, harvested and packed for the exportmarket.Themarketingof the citrus isundertakenbyKomatiFruits, apartnershipbetweenvariouscitrusproducers.GFCharvested48000tonscitrusofwhich37000tonsweregrapefruitand 11000tonsoranges.Theexportpercentageof63%(2006:70%)waslowerthanthepreviousyearbutachange in marketing strategy and higher prices contributed to increased profits for the citrus division.
Tsb Sugar’s group results were influenced positively by the turnaround in the results of the Citrus division and the increased contribution from investments. The increase in the world sugar price over that of the previous financial year and the weakening of the exchange rate contributed toincreasedheadlineearningsofR115million(2006:R52million).Turnoverincreasedby39%to R2282millionandoperatingprofitby225%.
Itisexpectedthatthedecreaseintheworldsugarpricewillhaveanegativeimpactonthe2007/2008results, while an expected increase in production will partly offset the lower export prices.
The settlement of land claims registered on Tsb Sugar farms is progressing well, with the Tenbosch land claim already in the registration phase. The other claims are in the negotiation phase and it is expectedthattheywillbesettledduringtheyear.Thecashf lowofR285millionfromsettledlandclaimsisexpectedinthe2007/2008financialyearandthecashf lowfromthebalanceofclaimsinthe following year.

Air Products – UnlistedAirProductsSouthAfrica(Pty)LimitedisthelargestindustrialmanufacturerinSouthernAfricaofoxygen,nitrogen,argon,hydrogenandcarbondioxide.Productsaresuppliedtothesteel,chemical,petrol refining, pulp and paper industries as well as general fabrication and welding shops. The company also supplies gases to the resource minerals industry for platinum refining and copper and cobalt smelting.
The company focuses on cost-effective solutions in the supply of gases to major corporations through pipeline supply from major on-site plants, bulk liquid tankers as well as supplying smaller customers with a wide range of cylinders, minitanks and specialty gases or through an extensive distribution network.
The company has increased its market share in the packaged gas business through the leadership position established in the small liquid and minitank/maxitank product offering.
Anewairseparationplant,commissionedforImpalaPlatinumRefineriesinSprings,isperformingwell, and has enabled the company to expand its extensive pipeline network by offering supplies to nearby customers in the plate glass and copper tubing industries.
Recently the company expanded its range of innovative offerings to provide atmospheric gas mixtures to be used in high-quality packaging of fresh produce. Additionally, the company has launched an oxygen-rich application, shown to increase hatching rates in the chicken industry.
Capital expenditure plans for the forthcoming year include major expansion of the existing air separationunitstomeettheongoingdemandforatmosphericgasesattheMittalSteelsites,andtomeet the significant growth in the merchant markets.
Air Products has a September year-end. For the six-month period ended 31 March 2007, AirProducts’ turnover grew by 22.4% (2006: 0.7%) fromR364.2million to R445.9million, and itsheadlineearningsby25.2%(2006:0.9%)fromR62.6milliontoR78.4million.
Wispeco – UnlistedDuring the year under review Wispeco Holdings Limited’s sales volume increased by 8%.However,turnoverincreasedby36%mainlyduetohighersellingpricesdrivenbyincreasingraw-materialcosts.HeadlineearningsincreasedfromR61milliontoR62.6million.
InanticipationofcontinuedvolumegrowthandtosupportWispeco’sphilosophyofquickdelivery,the company embarked on a capacity expansion programme during the financial year of which a large part has been completed and is operational.
Training programmes are of strategic importance to Wispeco. Internal programmes aim atproductivity improvement as well as leadership and technical skills development, while external programmes focus on market development and include practical manufacturing training for customers as well as a formal learnership for unemployed members of the community.
r e m g ro l i m i t e d2 4 |
g e n e r a l r e p o rtinvestment review

r e m g ro l i m i t e d | 2 5
g e n e r a l r e p o rt investment review
Dorbyl DorbylLimited’sturnoverandoperatingprofitdecreasedby2.4%toR962millionandby24.5%toR17.9million,respectively.Increasedandcontinuingindustrypressureonprices,lowertake-offsbythe motor manufacturers on some components and rising steel prices, adversely impacted margins and the profitability of most of the operations during the year. Dorbyl’sheadlineearningspershareincreasedby104.1%from176.1centsheadlinelosspersharein2006toa7.3centsheadlineearningspersharein2007.
MINING INTErESTScontribution to headline earnings
ImplatsRemgro’sinterestinImplatsis4.2%andonlydividendincomehasbeenaccountedfor.
Trans HexTransHexGroupLimitedreportedimprovedprofits,butitsheadlineearningspersharedecreasedby27%,from28.2centsto21.7cents. Totalroughdiamondsalesforthefinancialyeardecreasedby12%andrandrevenuewas5%lowerthan the prior year. The impact of lower sales volume was partially offset by the weaker rand andmarginallyhigher sellingprices.These factors resulted in an earningsper shareof39.4 cents (2006:112.7centsearningspershareloss).

COrPOrATE fINANCE AND OTHEr INTErESTS 2007 2006 R million R millionCentral treasury 266 146Net corporate cost (61) (56)Pensionfundsurplus 70 –Otherinterests 6 6 281 96
CorporateThe central treasury division’s contribution increased from R146 million to R266 million. Thisincrease can be attributed mainly to higher interest rates as well as higher average cash balances compared to 2006.Also included therein, are foreign currency profits amounting toR65million(2006: R24million loss) relating to intergroup balances. These intergroup balances were settledduring the past year.
The net after-tax corporate costs above, which include salaries, donations and the cost of the share incentive scheme, increased by R5 million, from R56 million in 2006 to R61 million in 2007. Headline earningswas also impacted favourably by the accounting recognition of a pension fundsurplusamountingtoR70millionfollowingthefinalisationofasurplusallocationprocess.
ACkNOwlEDGEMENTTo all of those who contributed to the performance of the Group over the past year, we extend our sincere thanks: to the shareholders for their continuedconfidence; themanagingdirectorsandallcolleagues in thevariousGroupcompanies for their co-operationandsupport;allotherdirectors,officials and employees for their dedication and all parties concerned for services rendered.
Johann Rupert Thys Visser
Stellenbosch18June2007
r e m g ro l i m i t e d2 6 | 2 6 |
g e n e r a l r e p o rtinvestment review

r e m g ro l i m i t e d | 2 7
i n t r i n s i c n e t a s s e t va lu eat 31 march 2007
Tobacco interestR&RHoldings 3 641.0 14.3449 52 229 34065
– BAT ordinary shares 1 214.3 1 589 3 405.2– Cash and dividends receivable 236.1 –Othernetassets (0.3)
Financial servicesFirstRand 481.1 2 460 11 836 9623RMBHoldings 280.9 3 599 10 111 7990
Industrial interestsMedi-ClinicCorporation 171.1 2 510 4 295 3531UnileverBestfoodsRobertsons 3 020 1984DistellGroup 58.7 5 205 3 054 2 112Nampak 78.1 2 221 1 735 1308Total South Africa 2 226 1889Rainbow Chicken 173.6 1 600 2 778 1642Tsb Sugar 1 980 1260AirProductsSouthAfrica 910 801Dorbyl 14.1 1 300 211 191Wispeco 421 441KagisoTrustInvestments 1 312 710Caxton 7.8 1 670 130 117
Mining interestsImplats 26.7 22 801 6 085 3886TransHexGroup 30.2 1 450 438 363Gencor 38.0 – – 8
Other Sundry investments and loans 220 117Deferredtaxationasset/(liability) (738) (417)Othernetassets/(liabilities) 506 (100)
Cash at the centre – Local 2 1 220 4066–Offshore 2 218.7 14.3449 3 137 1729
Intrinsic net asset value 107 116 77316Potential CGT liability 3 (2 714) (1699)
Intrinsic net asset value after tax 104 402 75617
Issuedsharesafterdeductionofsharesrepurchasedandtheshares inTheRemgroShareTrust(million) 472.4 479.8
Intrinsic value per share R221.00 R157.59
Notes1.ThisrepresentsRemgro’seffectiveinterestof10.4%inBATPlc.2. Cash at the centre excludes cash held by subsidiaries and associated companies that are separately
valued above.3.The potential capital gains tax (CGT) liability, which is unaudited, is calculated on the specific
identification method using the most favourable calculation for investments acquired before 1October 2001 and also taking into account the corporate relief provisions.Deferred CGT oninvestmentsavailable-for-sale(ImplatsandCaxton)isincludedin“Other”above.
4.Unlisted investments are shown at directors’ valuation. Listed investments, with the exclusion of RainbowChicken,areshownatstockexchangeprices.RainbowChickenisshownatR16.00,thepriceapplicableforthealternativeoffertoRainbowChickenshareholderssince6June2007.
Stock Shares exchange 31 March 31March held closing Exchange 2007 2006 Notes million price £ million rate R million R million

Remgro endorses and is fully committed to compliancewith theprinciplesof theKing IIReport’sCode of Corporate Practices and Conduct. All the Company’s listed subsidiaries and associatedcompaniesendorsetheCodeofCorporatePracticesandConductwhereapplicable.
TheCompanyisaninvestmentholdingcompany.Referenceto“theCompany”mayalsodenotetheCompanyand itswhollyownedsubsidiaries.Eachentity inwhich theCompany is investedhas itsowngovernancestructures.Ingivingeffectto itsriskmanagementresponsibilities,Remgrohasalsoapproved the maintenance of a broader continuous risk management review programme to ensure a coherent governance approach throughout the Group.
The Remgro Board advocates sound governance practices by all entities the Company is invested in. EffectivecorporategovernanceformspartofRemgro’sinvestmentassessmentcriteria.Itismonitoredby Remgro’s non-executive representation on those boards.
In setting the parameters for this report, guidance was taken from theGlobal Reporting Initiative(GRI)BoundaryProtocol.Disclosureislimitedtothoseentitiesthatcouldgeneratesignificantimpacton the Company’s sustainability performance and where it exercises control over the financial and operating policies of such entities, save where those entities disclose the relevant information in their own publicised annual reports.
The following are the notable aspects of the Company’s corporate governance.
BOArD CHArTErThe Board has adopted a formal charter which has been implemented to:
• identify, define and record the responsibilities, functions and composition of the Board, and • serve as a reference to new directors.
The charter has been endorsed by all directors of Remgro Limited and is available for inspection at the registered address.
The Board, having reflected on the following, is satisfied that, for the year under review, the required actions contained in the charter were executed satisfactorily.
COMPOSITION Of THE BOArDRemgrohasafullyfunctionalBoardthatleadsandcontrolstheGroup.On31March2007,theBoardconsisted of five executive and ten non-executive directors of whom five are independent.
The roles of the chairman and the chief executive officer are separated. The chairman is a non-executive director but is not independent.
Board members are listed on pages 10 and 11.
rOlE AND rESPONSIBIlITIESThe Board is ultimately responsible for the strategic direction, risk appetite, performance and affairs of theCompany.IndirectingtheGroup,theBoardexercises leadership, integrityand judgementbasedon fairness, accountability, responsibility and transparency so as to achieve continuing prosperity for the Group.
After approving operational and investment plans and strategies, the Board empowers executive management to implement these and to provide timely, accurate and relevant feedback on progress made.
r e m g ro l i m i t e d2 8 |
c o r p o r at e g ov e r na n c e

r e m g ro l i m i t e d | 2 9
c o r p o r at e g ov e r na n c e
The Board remains accountable for the overall success of the approved strategies, based on values, objectives and stakeholder requirements, and for the process and policy to ensure the effectiveness of risk management and internal controls. The Board is the focal point of the Group’s corporate governance and is also responsible for ensuring that it complies with all relevant laws, regulations and codes of best business practices.
The Board is responsible for monitoring the operational and investment performance of the Group includingfinancialandnon-financialaspects. It isalsoresponsible forensuringthatproceduresandpractices are in place which will protect the Company’s assets and reputation.
The Board has established the following subcommittees to assist it in discharging its duties and responsibilities:
• The Remuneration and Nomination Committee, consisting of four non-executive directors, advises the Board on the remuneration and terms of employment of all directors and members of senior management and is responsible for succession planning. Additionally, it annually participates in evaluating directors. The committee is also responsible for nominating directors. Directorsdonothavelong-termcontractsorexceptionalbenefitsassociatedwiththeterminationof services. The chairman of the Board is chairman of this committee. The chief executive officer attends meetings by invitation.
The committee has a formal mandate and its effectiveness is evaluated by the Board in terms thereof.
• The Audit and Risk Committee, consisting of three non-executive directors and one executive
director, reviews the adequacy and effectiveness of the financial reporting process; the systemof internal control; themanagement of financial, investment, technological and operating risks;risk funding; the internal and external audit processes; the Company’s process for monitoringcompliance with laws and regulations; its own code of business conduct; and proceduresimplemented to safeguard the Company’s assets. An independent non-executive director is chairman of the committee.
The committee has a formal mandate and its effectiveness is evaluated by the Board in terms thereof. The committee evaluates the effectiveness of the treasury committee.
• The Executive Committee, consisting of all five executive directors, meets regularly between Board meetings to deal with issues delegated by the Board.
The Board is responsible for the appointment and induction of new directors. Non-executive directors are selected for their broader knowledge and experience and are expected to contribute effectively to decision-making and the formulation of strategies and policy.
Executivedirectors contribute their insightofday-to-dayoperations enabling theBoard to identifygoals, provide direction and determine the feasibility of the strategies proposed. These directors are generally responsible for taking and implementing all operational decisions.
MEETINGS AND qUOrUMThe articles of association requires three directors to form a quorum for Board meetings. A majority of members, preferably with significant representation of the non-executive directors, are required to attend all committee meetings.
The Board meets at least six times a year. The Audit and Risk Committee meets at least four times a year, and the Remuneration and Nomination Committee meets at least once a year.

MATErIAlITY AND APPrOVAl frAMEwOrkIssuesofamaterialorstrategicnature,whichcanimpactonthereputationoftheCompany,arereferredtotheBoard.Otherissues,asmandatedbytheBoard,aredealtwithatseniormanagementlevel.
Theminutesof all the committeemeetings are circulated to themembersof theBoard. Issues thatrequire the Board’s attention or a Board resolution, are highlighted and included as agenda items for the next Board meeting.
rEMUNErATION PrINCIPlESThe Company’s policy that guides the remuneration of all directors and senior management is aimed at:
• Retaining the services of existing directors and senior management• Attracting potential directors and senior managers• Providingdirectorsandseniormanagementwithremunerationthatisfairandjust• Ensuringthatnodiscriminationoccurs• Recognising and encouraging exceptional and value-added performance• EnsuringthatremunerationstructuresareconsistentwiththeCompany’slong-termrequirements• ProtectingtheCompany’srightsbyservicecontracts
Inaccordancewiththeseobjectives,theRemunerationandNominationCommitteeannuallyreviewsand evaluates the contribution of each director and member of senior management and determines their annualsalaryadjustments.Forthispurposeitalsoconsiderssalarysurveyscompiledbyindependentorganisations.
DUTIES Of DIrECTOrSThe Companies Act places certain duties on directors and determines that they should apply the necessary care and skill in fulfilling their duties. To ensure that this is achieved, best practice principles, ascontainedintheKingIIReportonCorporateGovernanceforSouthAfrica,areapplied.
The Board is also responsible for formulating the Company’s communication policy and ensuring that spokespersons of the Company adhere to it. This responsibility includes clear, transparent, balanced and truthful communication to shareholders and relevant stakeholders.
After evaluating in terms of their respective charters, the directors are of the opinion that the Board and the subcommittees have discharged all their responsibilities.
CONflICTS Mechanisms are in place to recognise, respond to and manage any potential conflicts of interest.Directors sign, at least once a year, adeclaration stating that they arenot awareof anyundeclaredconflictsofinterestthatmayexistduetotheirinterestin,orassociationwith,anyothercompany.Inaddition, directors disclose interests in contracts that are of significance to the Company’s business and do not participate in the voting process of these matters.
All information acquired by directors in the performance of their duties, which is not disclosed publicly, is treated as confidential. Directors may not use, or appear to use, such information forpersonal advantage or for the advantage of third parties.
All directors of the Company are required to comply with the Remgro Code of Conduct and the requirementsof the JSELimited (JSE) regarding inside information, transactionsanddisclosureoftransactions.
r e m g ro l i m i t e d3 0 |
c o r p o r at e g ov e r na n c e

r e m g ro l i m i t e d | 3 1
COMPANY SECrETArY AND PrOfESSIONAl ADVICEAll directors are entitled to seek independent professional advice concerning the affairs of the Group, at the Company’s expense.
All directors have unlimited access to the services of the company secretary, who is responsible to the Board for ensuring that proper corporate governance principles are adhered to. Board orientation or training is done when appropriate.
GOING CONCErNAt least once a year the Board considers the going concern status of the Group with reference to the following:
• Net available funds and the liquidity thereof• The Group’s residual risk profile• Worldeconomicevents• The following year’s strategic business plan, budgets and cash flow models• The Group’s current financial position
SErVICE COMPANY
Sincetheestablishmentin2000ofRemgroLimitedandVenFinLimited,M&IManagementServices(Pty)Limitedhasrenderedmanagementandsupportservicestothesetwoandtheirgroupcompanies.NeitherRemgro,norVenFinhadafinancialinterestinM&IManagementServices.
TheserviceagreementswithRemgroandVenFinstipulatethatfeeswillnotbemorethan0.463%ofmarketcapitalisation.Inthepreviousyearto31March2006,feespaidbyRemgroamountedto R81million,or0.137%ofmarketcapitalisation.
DuringthepastfinancialyearasubsidiaryofRemgro,M&IGroupServicesLimited(“newM&I”),hasacquiredthebusinessofM&IManagementServicesandrecoverssomeofitscoststhroughfeesforservicesrenderedtogroupcompanies.AnagreementhasalsobeennegotiatedwithVenFintoprovidecertain support and administrative services to theVenFin groupof companies at fees determinedannually.
Thenetcostofthe“newM&I”willbepartofthecorporatecostsofRemgroandiscomparablewiththefeespaidinthepastbyRemgrotoM&IManagementServices.Referalsotonote19.
rISk MANAGEMENT AND INTErNAl CONTrOlIndeterminingstrategicgoals, theBoardofDirectorshasensured itsunderstandingofall therisksaccepted in the Company’s investment portfolio with a view to maximising sustainable profits and growth. These risks are continuously measured against the risk appetite determined by the Board.
The categories of risk identified can be broadly classified as follows:
• Performance risk relates to those risks managed by the Board and includes strategic risk, opportunity risk, reputation risk, liquidity risk, and also risks relating to corporate governance, social responsibility and stakeholder relations.
• Investment risk inherent to existing investments. The Board has delegated the responsibility for investment risk management to the boards of the various investment companies. The Remgro Board monitors that these delegated responsibilities are effectively executed by appointing its own members in non-executive capacities on those boards.
c o r p o r at e g ov e r na n c e

• Operational risk includes operational effectiveness and efficiency, safeguarding of assets, compliance with relevant laws and regulations, reliability of reporting, effective operational risk management, human resource risk, technology risks, business continuity and risk funding.
The Board has documented and implemented a comprehensive risk management system, which incorporates continuous risk assessment, evaluation, and internal control embedment.
TheEnterprise-wideRiskManagementsystemapplicabletotheCompanyisasfollows:
• Group risk analysis The purpose of the Group risk analysis is to reconfirm and update the Group’s consolidated
risk profile. This ensures that the residual risk profiles by investment, and in total, remain within the risk tolerances set by the Board and that new emerging risks are identified and responded to in time.
• Activity risk analysis The activity risk assessment further refines the Company’s risk assessment at key activity level
relevant to the achieving of detailed objectives and ensures that risk management initiatives are duly prioritised and resourced appropriately.
• Operational risk management The Board influences the control environment by setting ethical values and organisational culture
while ensuring that management styles, delegated authorities, business plans and management competency are appropriate, effective and efficient.
Operationalrisksaremanagedmainlybymeansofinternalcontrol.Thisisaprocessdesignedtoprovide reasonable assurance regarding the constant achievement of organisational objectives and to reduce the possibility of loss or misstatement to within accepted levels. The effectiveness of risk management is measured by the level of reduction of the Company’s cost of risk.
Management structures have been established to focus on certain key risk activities, includingtreasury, safety, health, environment, asset protection, tax and risk funding.
• Treasury Given the nature and its extent, control of treasury risk is regarded as very important. The
responsibilityofM&IGroupServicesLimited’scentraltreasurydepartmentistomanagetherisksassociated with rates of return, compliance, liquidity as well as investment, financing and foreign exchange transactions in accordance with a written mandate.
A treasury committee, constituted of nominated members of the Risk and Audit Committee and senior management, is responsible for determining policy and procedures as well as clearly defined levels of competency and gives regular feedback to the Board. The treasury policy also ensures that the return on cash reserves is optimised taking cognisance of investment and credit risk and the Group’s liquidity requirements.
V&RManagementServices,acompanyregisteredandmanagedinSwitzerland,renderstreasuryservices toR&RHoldingsandRemgroInvestments( Jersey).These twocompanieshaveservicecontractswhich recordV&R’s obligations and responsibilities concerning their treasury policiesasapprovedandmonitoredby theirBoards.V&R’sactivitiesandriskmanagementpracticesareannuallysubjecttoindependentaudits.RemgroandVenFineachholds50%ofV&R.
r e m g ro l i m i t e d3 2 |
c o r p o r at e g ov e r na n c e

r e m g ro l i m i t e d | 3 3
• Risk funding Risk funding is viewed as a cost of capital activity aimed at reducing the Company’s residual
exposures to potential risk with catastrophic impacts or risks which cannot be managed cost beneficially.
• Integrated assurance The Board does not only rely on the adequacy of the control embedment process but regularly
receives and considers reports on the effectiveness of risk management activities. The Audit and Risk Committee ensures that the assurance functions of management as well as internal and external audit are sufficiently integrated.
The various assurance providers to the Board comprise the following:
•TheExecutiveCommittee and seniormanagement consider theCompany’s risk strategy andpolicy along with the effectiveness and efficiency thereof.
•TheAuditandRiskCommitteeconsiderstheadequacyofriskmanagementstrategies,systemsof internal control, risk profiles, legal compliance, internal and external audit reports and also reviews the independence of the auditors, the extent and nature of their engagements, coverage and findings. This committee also reviews the level of disclosure in the annual reports and the appropriateness of policies adopted by management, the ethics register and other loss incidents reported. The Board reviews the functionality of the Audit and Risk Committee against its charter.
Internal audit The Company’s internal audit function is fulfilled by M&I Group Services Limited’s Risk
ManagementandInternalAuditdepartment.It isaneffective independentappraisal functionandemploysarisk-basedauditapproach,formallydefinedinaccordancewiththeInstituteofInternalAuditors’(IIA)definitionofinternalauditinganddocumentedinacharterapprovedbythe Board. The head of this department has direct access to the chairman of the Audit and Risk Committee as well as to the chairman of the Group.
External audit The Company’s external auditors attend all Audit and Risk Committee meetings and have direct
access to the chairman of the Audit and Risk Committee. Their audit coverage is adequately integratedwiththeInternalAuditfunctionswithouttheirscopebeingrestricted.
Other servicesprovidedby the auditing firmmainly relate to taxmatters and are effectedbyadepartment independent to theauditpartners. Independence is furtherassuredby termsofappointment.
The directors are of the opinion that, based on inquiries made and the reports from the internal and external auditors, the risk management programmes and systems of internal control of the Company anditsdependentsubsidiarieswereeffectivefortheperiodunderreview.InthisregardTsbSugarandWispecoareconsideredtobeindependent.
The Audit and Risk Committee has also satisfied itself that there are effective audit committees functioning at the Company’s independent subsidiaries and associated companies.
c o r p o r at e g ov e r na n c e

DEAlINGS IN SECUrITIES InaccordancewiththeListingsRequirementsoftheJSE,theCompanyhasadoptedacodeofconductfor insider trading. During the closed period directors and designated employees are prohibitedfrom dealing in the Company’s securities. Directors and designated employees may only deal inthe Company’s securities outside the closed period, with the authorisation of the chairman or the managing director. The closed period lasts from the end of a financial reporting period until the publication of financial results for that period. Additional closed periods may be declared from time to time if circumstances warrant it.
ATTENDANCE AT MEETINGS Audit and Remuneration Executive Risk and Nomination Directorate Committee Committee Committee
Number of meetings held 6 7 4 2
Attendance by directors
JPRupert 6 2
MHVisser 6 7 2
PEBeyers 6
WEBührmann 6 7
GDdeJager(1) 5 2 1
JWDreyer 5
DMFalck 6 7 4
PKHarris 5 2
EdelaHHertzog 5
JMalherbe(2) 3
JFMouton(3) 2 2 1
JAPreller(Mrs) 6 7
DPrins 5 4
MRamos(Miss)(4) 1
FRobertson 6 4 2
TvanWyk 6 7
(1) Mr G D de Jager was a member of the Audit and Risk Committee as well as the Remuneration and Nomination Committee for six months.
(2) Mr J Malherbe was appointed to the Board of Directors of this Company on 11 October 2006 and has since attended all the meetings.
(3) Mr J F Mouton retired as a director of this Company on 11 October 2006.(4) Miss Ramos was appointed to the Board of Directors of this Company on 26 March 2007.
r e m g ro l i m i t e d3 4 |
c o r p o r at e g ov e r na n c e

r e m g ro l i m i t e d | 3 5
As Remgro is an investment holding company, disclosure regarding sustainability is limited to that of the Company and its wholly owned subsidiaries, including Wispeco and Tsb Sugar. Social andsustainability reporting for listed investees is contained in the annual reports of those entities.
The main aspects to report on are as follows:
STAkEHOlDEr rElATIONSThe following are recognised as stakeholders in the Company:
• Shareholders and lenders as providers of capital• The State as policy maker and regulator• The investment community as interested party• The community, through the creation of employment, and part benefactor of taxes paid by
profitable organisations and as a recipient of social contributions
The Board regularly reviews its strategies against the requirements of the stakeholders to ensure balanced long-term growth and the viability of the Company and the environment in which it operates.
GrOUP ETHICS DrAntonRupert,founderoftheGroup,whichtodayincludesRemgroLimited,morethan40yearsago drew up guidelines for doing business successfully. These guidelines developed into what is today Remgro’s value system. The Company believes that these values incorporate the spirit in which it strives tobeagoodcorporatecitizen.It furthermorebelieves thatethicalbehaviourstemsfromthevaluesystem,ascommunicatedanddemonstratedbytheBoardofDirectors.
Remgro’s commitment to ethical behaviour is contained in the following documents:
• Code of ethics• Gift policy • Internetpolicy• Disciplinarycode
SAfETY AND ENVIrONMENTTheCompanyhasadulyconstitutedsafetyandhealthcommittee,asrequiredbytheOccupationalHealth and SafetyAct.This committee assists the Board in ensuring that theCompany provides and maintains a safe and healthy risk-free environment for staff and visitors by identifying risks and ensuring that controls designed to mitigate these risks are effective and complied with.
MostoftheCompany’scoreactivitiesareregardedashavingalowimpactontheenvironment.
The Company benchmarks its current environmental practices against the criteria stipulated in the GlobalReportingInitiative™(GRI)Framework.Theseinclude:
• Materials• Energy• Water• Biodiversity• Emissions,effluentsandwaste• Suppliers• Productsandservices• Compliance• Transport
s u s ta i na bi l i t y r e p o rt

Wheredeemedappropriate,usageandimpactarebeingquantifiedandmeasuredagainstbestpractices.Whereappropriate,compliancewithsafety,healthandenvironmentalsystemsaremeasuredagainstformalstandardsystemssuchasISOandsubjecttoindependentreview.Independentboardsmonitorcapital projects aimed at reducing environmental usage while increasing biodegradable recycling.
Tsb Sugar has set itself performance measures to minimise its environmental impact, for example bagasse, a by-product of the sugar production process, that is utilised to generate electricity. Approximately60%ofTsbSugar’selectricityneedsaregeneratedfrombagasse.SurpluselectricityissuppliedintotheEskomnationalnetwork.
HIV/AIDS POlICY From an investment holding company perspective, the risk ofHIV/Aids comprises two elements,namely:
Group risk GiventhepotentialimpactofHIV/Aidsonthemarkets,onhumancapitalcostofemploymentandon the operational processes of the various businesses invested in, this risk is managed within the governance structures of the various companies.
The progress of these policies and strategies is monitored against best practice standards.
Company riskRemgroandM&IhaveaformalHIV/Aidspolicyandarecommittedtomanagethepandemic,andthe business risks associated with it, actively. The policy makes provision, inter alia, for the following:
• CompliancewithalllegalrequirementsasfarasHIV/Aidsisconcerned• NodiscriminationagainstemployeesorpotentialemployeesbasedontheirHIVstatus• StrictconfidentialtreatmentofinformationontheHIVstatusofemployees• General measures to prevent accidental infection
RemediMedicalAidScheme,ofwhichmostofM&I’sstaffaremembers,hasamanagementplanforHIV/Aidsinwhichemployeescanchoosetoparticipate. EMPlOYEESSummary of employees of the operating subsidiaries 2007 2006Rainbow Chicken 7 223 6686Wispeco 963 888 TsbSugar(excludingcontractworkers) 2 533 2308Other 14 10 10 733 9892M&I 172 188 10 905 10080
The boards of directors of the individual operating subsidiaries are responsible for their own strategies regardingemploymentequity,HIV/Aidsprogrammes,trainingandotherpersonnelmatters.Furtheranalyses in categories are therefore not given here.
r e m g ro l i m i t e d3 6 |
s u s ta i na bi l i t y r e p o rt

r e m g ro l i m i t e d | 3 7
PANDEMICSAs part of its awareness of community risk, the Group monitors pandemic risks, such as bird flu, and will take appropriate steps as and when required.
EMPlOYMENT EqUITYM&Istrives, inaccordancewith theEmploymentEquityAct, toaffordall staff theopportunity torealise their full potential.
M&I’smanagementandpersonnelarecontinuouslyinvolvedindeterminingtraininganddevelopmentneeds and in implementing and monitoring a labour plan. Special attention is given to those groups which, because of historic reasons, may be in a disadvantaged position.
InaccordancewiththerequirementsoftheEmploymentEquityAct,M&IannuallysubmitsalabourplantotheDepartmentofLabour.
Becauseofthenatureofitsoperations,interaliatoprovidecoreservicestoRemgro,M&I’sworkforceis characterised by the following:
• A high level of expertise within the top structure of the organisation and in various specialised divisions
• A young employee profile, especially with regard to management• A low turnover rate of staff and, consequently, limited opportunities for new appointments
M&Ibelievesthatthequalityofitsstaffisanimportantsustainablecompetitiveadvantage.Thereforeit believes that its success does not lie in the uniformity of its staff, but in the diversity and development oftheircollectivetalents.Forthese,spaceandopportunitywillalwaysbecreated.
Humanresourcepoliciesandproceduresalsoaddresstheissuesofnon-discrimination,childlabour,disciplinary practices, human rights, etc.
BEE – BlACk ECONOMIC EMPOwErMENTTheBoardbelievesthatBEEonabroadbasis isasocial,politicalandeconomic imperativeandwetherefore support the Company’s subsidiaries and associated companies’ initiatives in this regard. Although the ideal is to support people to realise their full potential, special focus is needed on those who, for historical reasons, have lagged behind. The aim is to enable them to compete on merit in the market. We look forward to the day when all South Africans, especially our children, can fullyparticipate in our economy on a non-racial and equal basis.
s u s ta i na bi l i t y r e p o rt

SOCIAl INVESTMENTCorporate citizenship, namely the commitment of business to contribute to sustainable economicdevelopment, endorses the principle that no business exists in isolation but is undeniably an integral partoftheenvironmentinwhichoperationstakeplace.Initsrelationswithallstakeholders(clients,personnelandthecommunity),Remgrostrivestobeavaluepartner.
Duringthepastfewyears,thefocusoftheCompany’sdonationprogrammehasshiftedincreasingly to the development of young people from disadvantaged communities as well as to assisting people in need, knowing that social investment brings dignity and a sense of hope.
Donationstodeservinginstitutionsareusuallymadeoverspecificperiodsandalthoughtheycoverquitea wide range, there is one noticeable exception: political parties. Although the Company respects the individual’s right of choice to get involved with these organisations, it does not exercise a choice itself.
Duringthepastyear,theCompanyhasbeeninvolvedinthefollowingprojectsandinstitutions:
Entrepreneurship and trainingTheproceedsfromaloanRemgromadeavailabletothePeaceParksFoundation(PPF)someyearsagosupport the activities of the SA College for Tourism in Graaff-Reinet and the Southern African Wildlife CollegeneartheborderoftheKrugerNationalPark.Bothcollegesareinvolvedinpracticaltrainingandjob creation.
SA College for Tourism (SACT) – the demand for the services of this College, where especially young black women from previously disadvantaged communities are trained for careers in the hospitality industry, has increased to the extent that 90 students from eight Southern African countries were enrolledthisyear–50%morethanthepreviousyear.Tomakeprovisionforthisintake,somestructuralchangeshadtobemadetothePanoramaGuesthouseinGraaff-Reinet,asubsidiaryoftheSACT.
Besides following courses in culinary arts, food and beverage studies, room and front-of-house services and guesthouse management, the students gain excellent practical experience from exposure to public events – during the past year these have included eleven wedding receptions, four large banquets and 22conferences,whilearestaurantwasmanagedduringalargeEasternCapegolftournament.
The excellentwork of theCollege has been acclaimed by two recent audits: one byEducor, SouthAfrica’slargestprivateeducationinstitution,andtheotherbyTHETA(theTourism,HospitalityandSportEducationandTrainingAuthority)duringanunannouncedon-sitevisit.TheSACTreceivedthreeperfectratingsfromTHETA,theonlytrainingproviderwhocouldachievethisratingthusfar,whileEducorinitsreportcommendedthequalityofthetrainingteamandthepracticalnatureofthecourse.
Southern African Wildlife College –since1997thisCollege,onthewesternboundaryoftheKrugerNationalPark,hastrainedandempoweredpeople fromAfricatomanageandconservesomeoftheworld’s most biologically diverse areas. This training has proved to be extremely valuable to transfrontier conservation areas inAngola,Botswana,Malawi,Mozambique,SouthAfrica,Uganda,Zambia andZimbabwe.
Besides training in the management and conservation of natural resources, courses are also presented in personnel management skills and community conservation strategies, while field trips provide students with sound practical experience.
r e m g ro l i m i t e d3 8 |
s u s ta i na bi l i t y r e p o rt

r e m g ro l i m i t e d | 3 9
SciMathUS –aftersixyearsthispost-matricprogrammeoftheUniversityofStellenbosch,whichgivestalented black students from disadvantaged communities the opportunity to gain access to mainstream higher education, is well under way. The success of the programme is evident from the number of students involved in it since 2001 who are now following degree courses, with mathematics, science and accounting as major subjects.
ManystudentscomefromverylowincomefamiliesandsomeofthemtravelfromplacesasfarafieldasWellingtonandMitchell’sPlainbytrain,carortaxitoattendclassesstartingat08:00inthemorning.The most needy students are offered accommodation in Stellenbosch. These expenses are afforded from thebudgetofSciMathUS.
At the endof 2006, 47 students from theWestern, theEastern and theNorthernCape aswell asGautengandtheFreeStatecompletedtheNationalSeniorCertificateexamination,withasignificantimprovement in their maths, science and accounting results. Most of these students are currentlystudyingattheUniversityofStellenbosch.
Paul Roos Academy –hasalmostcomefullcirclewiththefirstintakeofGr.7learnersin2003.Thisgroup,nowinGr.11,willreceivetheirlastholidaytuitionduringthisyearandwillwritematricin2008.FortheAcademythisexaminationwillprovideanexcellentvaluetestoftheinvestmentmadeintheselearners over five years.
However, academic achievement is only one side of the coin of this project, which also focuses onidentifying leadership talent in disadvantaged schools and on assisting these learners by providing additional tuition to realise their full potential. The growth in self-confidence, visible at an early stage, as well as the development of other skills, ensures that these learners are just so much better prepared to face the future.
In2006,atotalof237learnersfromGr.7-10receivedtuitionattheAcademy.Duringschoolholidaystheyareaccommodated in thehostelsofPaulRoosGymnasiumandRhenishandalso takepart insport and other educational activities.
Rally to Read – celebrates its tenth year with a proud record. Since this literacy programme got under wayin1998,R21.5millionhasbeeninvestedinthequalityof literacytraining insomeofthemostremote areas of the country.This year an additionalR4.3millionwill be spent at the 135 schoolsparticipating in the programme.
AnnuallyinMay,convoysofoff-roadvehiclesdepartfromvariouscentrestodeliverbooksandothereducationalmaterialtosomeofthecountry’smostneglectedschools.Thisyearatotalof425vehiclesvisited nine areas in eight provinces. Remgro is one of approximately 100 sponsors of this project.
Equip –isaschooldevelopmentprogrammeoftheNationalBusinessInitiativefocusingonleadershipand the quality of education at historically disadvantaged schools. Remgro’s sponsorship for this purpose is used at two secondary and three primary schools in the Stellenbosch region.
Good progress has been made at two of the schools, while unfortunately conflict and disputes in one of the school management teams and a lack of strong leadership by principals at other schools hampered progress. As far as teacher development is concerned, more than fifteen teachers from five schools have been invited to register foranadvancedcertificate ineducationat theCapePeninsulaUniversityofTechnology.
s u s ta i na bi l i t y r e p o rt

EnvironmentWWF South Africa (WWF-SA) –isaconservationorganisationsupportedbyRemgrosince1968.Duringthepastyeartheorganisationhassharpeneditsfocusontheinterplaybetweenbiodiversityandthe impact of human activities. This focus comprises the following three initiatives:
TheMarine Programme, which looks at the sustainability of seafood; the Freshwater Programme,whichplacesemphasisoninternationallytradedwater-intensivecropssuchassugar;andtheBiodiversityandWineInitiative(BWI),apartnershipbetweenWWF-SA,TheGreenTrust,numerousmembersin the conservation sector and the South African wine industry.
Goodprogresshasbeenmadewithallthreeinitiatives.Some800officialshavebeentrainedforMarineProtected Areas, while a major breakthrough was achieved for the Freshwater Programme by thesigningofamemorandumofunderstandingwiththesugarindustry.AsfarastheBWIisconcerned,morethan70winefarmscouldbeinvolvedinanattempttobringabetterbalancebetweenconservationandagricultureinthehighlysensitiveCapeFloralRegion.
Cultural developmentKlein Karoo National Arts Festival (KKNK) – this year the Remgro/VenFin bursary will bebroughttothenoticeofyoungpeopleintheEdenDistrictMunicipalityaspartoftheAbsa KKNK on Tour, after which applications will be invited and a winner be selected by an expert panel before the end of the year.
Remgro’s sponsorship of the festival in 2007has also beenused to sponsor the artistic programmewhichincludesseveraldramas,amongstwhichwerethreetranslatedintoAfrikaans.Oneofthedramas,’n Ander Tongval (Another Dialect),isbasedonthebookwiththesametitlebyAntjieKrog.IthasbeencompiledwithaEuropeantourinmind.
Field Band Foundation (FBF) – music is a catalyst for many of the problems encountered by the country’syouth.ThisishowtheFBF,whichcelebratesitstenthanniversaryin2007,approachesitsrole.With30bandsatitsdisposalandamembershipof4000,theFoundationharnessesmusictoimprovethe skills and career opportunities of young people who could otherwise have landed on the street.
AnawarenessofthedangersofHIV/Aidsformsanintegralpartoftheproject.Arecentsurveyontheprevalenceof thediseaseamongstmembersbetweenages16and26hasshownfiguresconsiderablylower than the national average. Regular exposure to international musicians and role models also reiterates the message to young people that there are many reasons for protecting themselves against HIVinfection.
Lastyear,forthefirsttime,theFoundationwasabletosendoneofitsmemberstouniversity.Thisyeartwo are receiving tertiary education, while many more are doing a bridging course which will enable themtofollowsuit.Remgro’sinvestmentintheFBFcanbeseenasacontributiontohelpchangethe“riskprofile”ofouryouth.
WAT –theDictionaryoftheAfrikaansLanguage(WAT)is80yearsoldandisstillintheforefrontof renewing the language and making it as supple and as user-friendly as possible. Testimony of the relevance of its efforts is the fact that during the past two years six large South African universities, amongst which are Unisa and the US, have purchased the internet version of the WAT as an electronic source.
r e m g ro l i m i t e d4 0 |
s u s ta i na bi l i t y r e p o rt

r e m g ro l i m i t e d | 4 1
BesidescollectingandrecordingAfrikaanswordsinalltheirforms,theWATalsoplaysanimportantroleinthetrainingoflexicographersaswellasintheeducationaluseofdictionaries.DuringthepastyearfivedoctoralstudentsfromGabonandfouremployeesoftheOxfordUniversityPressattendedcoursesinlexicographyattheWAT.OveraperiodofthreeyearsRemgrowillcontributetothetrustfundoftheWAT.
Sport developmentSA Golf Development Board (SAGDB) –inayearofmanychallenges,theSAGDBhascompletedits restructuring process and committed itself anew to spending its money where most needed on the needs of the children in the national programmes. Structures were brought in accordance with this objective and administrative costs cut considerably to bring about a more performance-driven organisation.Besidesitsnormalcontribution,RemgrohasmadeanadditionalR1.5millionavailableforthe restructuring process.
SAGDB has also adopted Project 312 to assist development managers in assessing their ownperformance aswell as those of coaches. In addition, coaches taking part in theNationalTrainingProgrammecompletedtheirfirstyearofstudy.Theprogrammeprovidesanopportunitytocoachestogainanaccreditedtertiary-leveleducationandacoachingqualificationfromthePGA,whichcouldhelpraise the standard of the programmes they are involved in.
Western Cape Cricket Academy – the ripple effect of the investment made in this Academy since 1993isgrowingallthetime.DuringthepastyearthenamesofcurrentandformerAcademyplayerssurfacedeverywhere,notonlyintheSAWorldCupsquadandtheSA“A”sidetoAustralia,butalsointhewinningsidesoftheLions,TitansandCobras,respectivewinnersoftheStandardBankPro20,theSuperSportCompetitionandtheMTN45Championships.
Anditdoesn’tstopthere.SixwomenfromWesternProvince(WP),andanequalnumberfromBoland,all part of the Academy structure, represented their provinces at the national tournament for women where20teamsparticipated.WPandBolandreachedthefinals,whichwaswonbyWP.Tocapitall during a very successful year, several of the Academy’s umpires gained access to international and national panels.
Community developmentIkamva Labantu – thankstoanadministrativesponsorshipbyRemgroandVenFin,currentlytotallingjustoverR2millionayear,Ikamva,acommunityprojectwithitsrootsfirmlyinthetownshipsoftheWesternCape,could,besidesitsinvolvementinearlychildhooddevelopment,familyservicesandcarefor the visually impaired, continue its role as mentor for other community organisations.
Duringthepastyear,120morepreschoolsjoinedIkamvaand5500additionalchildrenbetweentheagesof0and6werereached.Foodwasdeliveredto110indigentpreschools,while20foodgardensweresuccessfully initiated for theseschools. Inthe familyservicessector,childrenwerecared for in14homes,while15“magnificentmothers”caredfor90childrenfrombrokenfamilies.
A project launched by Ikamva in Philippi East at the request ofRemgro to determine howmanychildrenwerewithoutsupport,isprogressingwell.Initiallytheprogrammewasplannedtoprovidefor100vulnerablechildren,butthisnumbersoongrewto247.Supportcomprisesfoodparcels,schooluniforms, stationery and financial assistance. The aim is to create a standard model of intervention which could be replicated elsewhere in the country. This also includes a disengagement process as families become more self-sustainable.
s u s ta i na bi l i t y r e p o rt

r e m g ro l i m i t e d4 2 |
s u s ta i na bi l i t y r e p o rt
u Mephi Child Care Programme – offers abused, unwanted and abandoned orphans a place of security.In2006,409childrenwereadmittedtotheprogramme.TheidealforuMephiisthatchildrenshouldgrowupwithin theirbiological families. If this isnotpossible, the childrenare cared for inhomesor,inthecaseofbabies,theyaremadeavailableforadoption.In2006,142babieswereadoptedlocally and internationally.
Childhood should be the happiest time in a child’s life. The unfortunate reality is that many are physically, emotionally and sexually abused, are rejected and are denied the basic necessities for a normal life. Seven social workers assist these traumatised children to come to terms with their past in order to cope with the future.
St Joseph’s Home – runs a ward of 25 beds for the treatment ofHIV/Aids paediatric patients. Actually the ward is a step-down facility for children discharged from tertiary hospitals but still too ill to be sent home. Nursing care and rehabilitation are provided, and parents and caregivers are instructed in administering antiretroviral drugs.
Remgro’s partial sponsorship of the ward helps to care for children who otherwise would have been sent home to suffer and even to die. Approximately 90% of the children admitted come from the Cape TownMetropoleandmostofthemhaveonlyasingleparentorgrandparent.
Yabonga – is a HIV/Aids project in the Western Cape to which Remgro has made a once-off contribution of R1 million during the past year to assist the organisation in extending its activities to the rural areas of the Eastern and the Northern Cape.
Inits2006annualreportMaria Ramos, patron of yabonga, wrote that the project developed into a meaningful and sustainable one over the past eight years, benefiting some 10 000 underprivileged children and those in dire need in our communities.More than 1 000 preschool children are alsoexposed to quality educational programmes prior to entering Grade 1.
Health careWits/Donald Gordon Medical Centre (WDGMC) – this year the first private academic hospital in the country is celebrating its fifth anniversary and is still making good progress. The accreditation programme has been strengthened by confirmation of the status of medical practitioners working at theWDGMC.
ThetransplantunitoftheWDGMChasbecometheprominentliver,kidneyandpancreastransplantcentre in the northern provinces of South Africa, while the oncology and intensive care units are going from strength to strength. Together with the ear, nose and throat unit and the surgery department, these have all developed into centres of excellence.
Organ Donor Foundation of SA – dedicates itself to the task of providing many people with a second chance to a normal life by making life-sustainable organs available to them. Remgro supports this effort by sponsoring four flights per year for the transport of these organs. The excellent service provided by Falconair’sstaffinthisregardisappreciatedbyall,bythedoctorsperformingthetransplantsandtherecipients of the organs.
New commitments
Since1April2007theCompanyhasmadenewcommitmentstothefollowingprogrammes:
• Shalamuka Foundation – supporter of the Penreach programme, the largest school outreachproject in Africa, through which the quality of education is promoted and a learning culture inculcated at disadvantaged schools.

Penreachstarted in1994andinthatyearreached40teachersand10schools.The latest figure is 2 000 teachers and 900 schools and the ripple effect of this intervention is such that some 200000 schoolchildren in Mpumalanga are benefiting from it. Penreach runs workshops forprincipals, student governing bodies, preschool, primary school and secondary school teachers and represents an excellent example of the best education practice in emerging communities.
RemgrohascommitteditselftoR2millionovertwoyearstoenablePenreachtoextenditsactivitiesand to replicate the model elsewhere.
• Beyers Naudé School Development Programme (BNSDP) – this programme is managed by theKagisoTrust,whichhasdedicateditselfovermorethan20yearstosocialjusticeinsomeofthepoorest rural areas in the country. The programme concentrates on the sustainable development of ruralschoolsintheformerhomelandVenda,whichisplaguedbypoverty,ashortageoffacilitiesand resources, poor teaching standards and dismal results.
Where the BNSDP is implemented, the morale and the functioning of school communitiesimprove, absenteeism and vandalism are reduced, more learners enter for the matric examination and the pass rate increases. In one of the schools taking part in the programme the pass rateincreasesfrom44%to79.8%overtwoyears.Atotalof766childrenfromnineBNSDPschoolswrotematricin2005,170ofwhompassedwithexemption,while34distinctionswereattained.Six of the schools achieved a pass rate higher than the national average.
TheBNSDPwas launched in 2004 as a living legacy to the values andprinciples practised byDrBeyersNaudé,founderoftheKagisoTrust.Remgrohasagreedtocontribute,inpartnershipwithVenFin,R3.6millionoverthreeyearstotheBNSDP.
• Stellenbosch Community Development Programme (SCDP) –wasfoundedin2005withtheaim of:
• feeding malnourished, underprivileged, poverty-stricken and orphaned children, many ofwhomareinfectedbyHIV/Aids;
• providingprimaryhealthcare; • assistingunemployedparentstolayoutvegetablegardensandtolearnnewskills;and • actinginpartnershipwithotherorganisationssuchasChildWelfareandclinics.
The SCDP’s primary focus is on Kayamandi, where 568 children are fed daily and monthly foodparcelsprovidedto60families.Anestimated12%oftheblacktownships’childrenarenotattendingschoolbecausetheirparentsaretoopoor.Approximately23%ofKayamandi’sresidentsliveindwellingswithonlyoneroom,45%ofhouseholdsstilluseparaffinforheating,while25%ofadults indicated that they have gone hungry periodically during the past year.
• Children’s Art Festival (CAF) – runs concurrentlywith the annualNationalArtsFestival inGrahamstown and has been designed to help children discover their own artistic potential.
Internationalresearchhasshownthat98%ofchildrenbetweentheagesof3and5enjoyasuperiorlevelofcreativity.Bytheageof10itdiminishesto32%andatage15tojust10%.Adultsabove 25yearsretainonly2%oftheirnaturalcreativity!
SkilledhandsareapowerfultoolforupliftmentandempowermentandthisisthefocusofCAF’sactivities.Duringthefestivalanintensivedevelopmentprogrammeispresentedtoprimaryschoollearners to stimulate their creative skills. At several workshops the children are exposed to diverse cultures and the talents of artists, dancers, actors and musicians.
s u s ta i na bi l i t y r e p o rt
r e m g ro l i m i t e d | 4 3


f i na n c i a l r e p ort 2007

Statement of reSponSibility by the board of directorS 47
Statement by the company Secretary 47
report of the independent auditor 48
report of the board of directorS 49
accounting policieS 55
balance SheetS 66
income StatementS 67
StatementS of changeS in equity 68
caSh flow StatementS 69
noteS to the annual financial StatementS 70
annexure a – principal SubSidiary companieS 96
annexure b – principal inveStmentS 97
annexure c – Significant aSSociated companieS 98
annexure d – information on buSineSS and geographical SegmentS 100
company information 102
ShareholderS’ information 102
notice to ShareholderS 106
explanatory noteS to the notice to ShareholderS 110
form of proxy attached
c o n t e n ts
r e m g ro l i m i t e d4 6 |

r e m g ro l i m i t e d | 4 7
s tat e m e n t o f r e s p o n s i bi l i t yby the board of directors
the directors are responsible for the maintenance of adequate accounting records and the preparation and integrity of the annual financial statements included in this annual report.
the annual financial statements are prepared, in accordance with international financial reporting Standards (ifrS) and the requirements of the South african companies act, on the going concern basis and incorporate full and responsible disclosure. the annual financial statements are based upon appropriate accounting policies and supported by reasonable and prudent judgements and estimates.
the directors are satisfied that the information contained in the financial statements fairly represents the results of operations for the year and the financial position of the group at year-end. the accuracy of the other information included in the annual report was considered by the directors and they are satisfied that it accords with the financial statements.
the directors are also responsible for the company’s system of internal financial controls. the system was developed to provide reasonable, but not absolute, assurance regarding the reliability of the financial statements, the safeguarding of assets, and to prevent and detect misrepresentation and losses.
the directors are of the opinion that the group will continue as a going concern in the future.
the financial statements were audited by independent auditors, pricewaterhousecoopers inc., to whom unrestricted access was given to all financial records and related information. the directors are further of the opinion that all statements that were made to the auditors during the course of the audit were valid and relevant. the auditor’s report is presented on page 48.
Signed on behalf of the board of directors.
Johann Rupert Thys VisserChairman Chief Executive Officer
Stellenbosch18 June 2007
i, mariza lubbe, being the company Secretary of remgro limited, hereby certify that all returns required of a public company have, in respect of the year under review, been lodged with the registrar of companies and that all such returns are true, correct and up to date.
Mariza LubbeSecretary
Stellenbosch 18 June 2007
s tat e m e n t by t h e c o m pa n y s e c r e ta ry

r e m g ro l i m i t e d4 8 |
r e p o rt o f t h e i n d e p e n d e n t au d i to rto the members of remgro limited
we have audited the annual financial statements and group annual financial statements of remgro limited, which comprise the directors’ report, the balance sheet and the consolidated balance sheet as at 31 march 2007, the income statement and the consolidated income statement, the statement of changes in equity and the consolidated statement of changes in equity, the cash f low statement and the consolidated cash f low statement for the year then ended, and a summary of significant accounting policies and other explanatory notes, as set out on pages 49 to 101.
Directors’ responsibility for the financial statementsthe company’s directors are responsible for the preparation and fair presentation of these financial statements in accordance with international financial reporting Standards and in the manner required by the companies act of South africa. this responsibility includes: designing, implementing and maintaining internal control relevant to the preparation and fair presentation of financial statements that are free from material misstatement, whether due to fraud or error; selecting and applying appropriate accounting policies; and making accounting estimates that are reasonable in the circumstances.
Auditor’s responsibilityour responsibility is to express an opinion on these financial statements based on our audit. we conducted our audit in accordance with international Standards on auditing. those standards require that we comply with ethical requirements and plan and perform the audit to obtain reasonable assurance whether the financial statements are free from material misstatement. an audit involves performing procedures to obtain audit evidence about the amounts and disclosures in the financial statements. the procedures selected depend on the auditor’s judgement, including the assessment of the risks of material misstatement of the financial statements, whether due to fraud or error. in making those risk assessments, the auditor considers internal control relevant to the entity’s preparation and fair presentation of the financial statements in order to design audit procedures that are appropriate in the circumstances, but not for the purpose of expressing an opinion on the effectiveness of the entity’s internal control. an audit also includes evaluating the appropriateness of accounting policies used and the reasonableness of accounting estimates made by the directors, as well as evaluating the overall presentation of the financial statements.
we believe that the audit evidence we have obtained is sufficient and appropriate to provide a basis for our audit opinion.
Opinionin our opinion, the financial statements present fairly, in all material respects, the financial position of the company and of the group as of 31 march 2007, and of their financial performance and their cash f lows for the year then ended in accordance with international financial reporting Standards and in the manner required by the companies act of South africa.
Director: N H DömanRegistered Auditor
cape town 18 June 2007
r e m g ro l i m i t e d | 4 9
r e p o rt o f t h e b oa r d o f d i r e c to r sfor the year ended 31 march 2007
dear Shareholder
the board has pleasure in reporting on the activities and financial results for the year under review.
Nature of activitiesthe company is an investment holding company. cash income is derived mainly from dividends and interest. the consolidated annual financial statements of the company and its subsidiaries also incorporate the equity accounted attributable income of associated companies.
the group’s interests consist mainly of investments in tobacco products, banking and financial services, printing and packaging, motor components, medical services, mining, petroleum products, food, wine and spirits and various other trade mark products.
resultsyear ended 31 march: 2007 2006headline earnings – excluding non-recurring portion of bee costs (r million) 6 853 5 464– per share (cents) 1 445.4 1 130.9– diluted (cents) 1 401.3 1 106.1
headline earnings (r million) 6 853 5 084– per share (cents) 1 445.4 1 052.3– diluted (cents) 1 401.3 1 027.7
earnings – net profit for the year (r million) 6 942 8 202– per share (cents) 1 464.2 1 697.6– diluted (cents) 1 418.5 1 671.3
dividends (r million)* 2 102 3 735– ordinary – per share (cents) 434.00 361.00– special – per share (cents) 400.00
* A final dividend of 281 cents (2006: 228 cents) per share was declared after the year-end and was therefore not provided for in the annual financial statements. No STC is payable on these dividends.
INVESTMENTSthe most important changes during the year under review were as follows:
Rainbow Chicken Limited (Rainbow)during march 2007 remgro made an offer by way of a scheme of arrangement to acquire the entire issued share capital of rainbow not already owned by remgro. the initial offer was for a cash consideration of r16.00 per rainbow share or 9 remgro ordinary shares for every 100 shares held in rainbow, or a combination of the aforementioned. on 5 June 2007 rainbow shareholders voted against the scheme of arrangement.
an alternative offer, consisting of a cash consideration of r16.00 per rainbow share or 8.1 remgro ordinary shares for every 100 shares held in rainbow, or a combination thereof, became effective on 6 June 2007. the last day to trade in order to participate in the alternative offer will be 22 June 2007.
Since 6 June 2007, to date hereof, remgro has acquired 7 841 819 rainbow shares in the open market at r16.00 per share for a total amount of r126.0 million.

Kagiso Trust Investments (Pty) Limited (KTI) and the Kagiso Infrastructure Empowerment Fund (KIEF)remgro entered into agreements with Kti and Kief, in terms of which it committed funds amounting to r350 million to Kief. the fund has a target size of r650 million and aims to invest in infrastructure projects, including roads, airports, power and telecommunication installations, railway systems, ports and water and social infrastructure. by 31 march 2007 r4.7 million of the r350 million committed was invested.
RMB Holdings Limited (RMBH)during the year under review, remgro acquired a further 6 836 847 rmbh shares at an average price of r28.88 for a total amount of r197.5 million. on 31 march 2007, remgro’s interest in rmbh was 23.7% (2006: 23.1%).
Business Partners Limited (Business Partners)during January 2007 remgro acquired a further 7 070 699 business partners shares for a total amount of r42.2 million. on 31 march 2007, remgro’s interest in business partners was 21.3% (2006: 17.8%).
due to the increase in shareholding, business partners was reclassified as an investment in an associated company with effect from 31 march 2007, while previously it was accounted for under “investments – other”. during the year under review only dividend income from business partners amounting to r5.2 million was accounted for. as from 1 april 2007 business partners will be equity accounted according to the equity method.
Gencor Limited (Gencor) on 14 march 2006, gencor was placed under voluntary liquidation and a liquidation dividend of r0.20 per share was declared. during may 2006 remgro received r7.6 million.
Sage Group Limited (Sage)as previously reported, remgro sold its 17.9% interest in Sage to momentum group limited during the previous financial year for r114 million, or r1.75 per Sage share, comprising of an initial payment of r1.42 per share and a potential subsequent payment of up to r0.33 per share. the initial payment received in September 2005 amounted to r92 million.
during the year under review, remgro received a further r6 million, or r0.09 per Sage share, as partial payment of the potential subsequent payment that was still subject to certain tax disputes being resolved.
on 8 June 2007 remgro received r17 million, or r0.27 per Sage share, as final distribution following the successful resolution of the tax disputes referred to above.
Medi-Clinic Corporation Limited (Medi-Clinic)during december 2006 remgro acquired a further 140 000 medi-clinic shares for an amount of r3.3 million. on 31 march 2007, remgro’s interest in medi-clinic was 47.6% (2006: 48.0%).
Repurchase of Remgro sharesduring the year under review, a wholly owned subsidiary company of remgro acquired a further 7 174 384 remgro ordinary shares at an average price of r143.71 for a total amount of r1 031.0 million. at 31 march 2007, 8 554 019 remgro ordinary shares (1.9%) were held as treasury shares. no derivative transactions, which may have led to the repurchase of remgro shares, were entered into during the year under review.
the remgro Share trust purchased 563 000 remgro ordinary shares during the year under review at an average price of r132.68 for a total amount of r74.7 million, while 262 016 shares were delivered to participants against payment of the subscription price.
Subsequent to the year-end
PG Group of Companies (PG)remgro has acquired, subject to certain conditions precedent, a 25% interest in pg for r700 million. the transaction is not expected to have a material impact on remgro’s profits in the short term.
r e p o rt o f t h e b oa r d o f d i r e c to r sfor the year ended 31 march 2007
r e m g ro l i m i t e d5 0 |

pg is the largest automotive and building glass corporation in africa with a successful history of more than 100 years. PG Glass and Shatterprufe are recognised as two of the strongest brand names in Southern africa and are synonymous with automotive and building glass throughout the region. pg is also a major exporter of automotive glass to europe and the united States of america. pg operates a wide spread of manufacturing, wholesale and retail operations in both the automotive and building markets. a new state-of-the-art f loat glass line (r800 million investment) that will increase capacity by 80% and make South africa a net exporter of f loat glass, has been commissioned during april 2007. in addition, pg has recently invested significantly in its automotive manufacturing facilities. it is ideally positioned to participate in the ongoing growth of the building and automotive sectors.
Tsb Sugar Holdings (Pty) Limited (Tsb Sugar)on 31 January 2007 tsb Sugar entered into an agreement to sell certain sugarcane farms in the nkomazi region to land claimants in terms of a land reform transaction for an amount of r285 million. the effective date of the transaction is 1 april 2007.
the farms and biological agricultural assets will be rented from the new owners and a joint management company will be responsible for the management of each of the farms. tsb Sugar and the new owners each has a 50% interest in the management companies.
caSh rESourcES aNd applIcaTIoNThe Company’s cash resources at 31 March 2007 are as follows:
Local Offshore Total R million R million R millionper consolidated balance sheet 1 867 3 137 5 004less: cash from other operating subsidiaries (647) – (647)cash at the centre 1 220 3 137 4 357attributable share of r&r’s cash – 2 151 2 151Available cash 1 220 5 288 6 508
the final ordinary dividend per share has been increased by 23.2% to 281 cents. total ordinary dividends per share in respect of the financial year to 31 march 2007 have therefore increased by 20.2% from 361 cents to 434 cents.
The total distribution to shareholders in respect of the financial year is as follows:
2007 2006(based on total issued shares at time of payment) R million r millionordinary – interim 741 694 – final 1 361 1 104 2 102 1 798 Special – 1 937 total 2 102 3 735
the board is of the opinion that, after the above distribution to shareholders, the group will have sufficient cash resources to pursue investment opportunities and to continue its share repurchase programme.
group fINaNcIal rEVIEwComparison with prior yearduring the previous financial year various investee companies in the group concluded black economic empowerment (bee) transactions. the accounting treatment of these transactions resulted in non-recurring charges of r379.7 million against headline earnings for the year ended 31 march 2006. due to the material effect that the accounting treatment of these transactions had on remgro’s results, headline earnings per share, and its year-on-year comparison, are also presented excluding the non-recurring portion of bee costs.
Since 1 January 2006, medi-clinic is accounted for as an associated company, whilst previously it was consolidated. certain income statement items are therefore not directly comparable with those of the previous financial year.
r e m g ro l i m i t e d | 5 1
r e p o rt o f t h e b oa r d o f d i r e c to r s for the year ended 31 march 2007

Balance sheet the analysis of “equity” and of “Source of headline earnings” below reflects the divisions into which the interests have been classified. each division represents the main business sector of the investments classified under it. no adjustment has been made where companies are active mainly in one sector but also have interests in other sectors.
2007 2006 R per r per R million share r million shareEquity employed attributable to equity holders 45 672 96.69 37 494 78.14Employment of equitytobacco interests 20 124 42.60 14 055 29.29financial services 8 593 18.19 7 105 14.81industrial interests 9 546 20.21 8 320 17.34mining interests 5 677 12.02 3 678 7.66corporate finance and other interests 1 732 3.67 4 336 9.04 45 672 96.69 37 494 78.14
Income statement 2007 2006 R million % r million % Source of headline earningstobacco interests 2 964 43 2 369 47financial services 1 529 22 1 147 22industrial interests 1 924 29 1 184 23mining interests 155 2 288 6corporate finance and other interests 281 4 96 2 6 853 100 5 084 100
2007 2006 R million r millionComposition of headline earningsSubsidiary companies and joint ventures 888 1 061
profits 900 1 088 losses (12) (27)
associated companies 5 965 4 023 profits 5 965 4 048 losses – (25)
6 853 5 084
coMpaNy NET profIT aNd approprIaTIoN 2007 2006 R million r millionthe company’s own distributable reserves at the beginning of the year amounted to 2 779 7 986net profit for the year 3 356 4 188Shares cancelled – (4 535)dividend no 12 of 228.00c per share paid in august 2006 (august 2005: 198.00c) (1 104) (1 034)Special dividend of 400.00c per share paid in august 2006 (august 2005: 600.00c) (1 937) (3 132)dividend no 13 of 153.00c per share paid in January 2007 (January 2006: 133.00c) (741) (694)the company’s own distributable reserves carried forward to the following year amounted to 2 353 2 779
r e p o rt o f t h e b oa r d o f d i r e c to r sfor the year ended 31 march 2007
r e m g ro l i m i t e d5 2 |

SharE SchEMEduring the year the trustees of the remgro Share Scheme offered ordinary shares to participants as follows: Number of shares Offer Number accepted as at price of shares 31 March Date (Rand) offered 200702/05/2006 132.60 562 56202/06/2006 133.00 323 32326/06/2006 135.00 563 227 563 22703/07/2006 135.01 4 279 4 27915/08/2006 137.80 1 308 1 308 569 699 569 699
the current position of the remgro Share Scheme is as follows: Average offer price Number (Rand) of sharesOrdinary shares due to participantsprevious financial year 59.24 3 093 691offered and accepted in current financial year 135.02 569 699Shares paid for and delivered 49.52 (262 016)resignations and other (4 380)total at 31 march 2007 72.65 3 396 994 refer to note 26 to the annual financial statements for full details on the remgro Share Scheme.
prINcIpal SharEholdErrembrandt trust (pty) limited (rembrandt trust) holds all the issued unlisted b ordinary shares of the company and is entitled to 44.84% (2006: 44.42%) of the total votes.
an analysis of the shareholders appears on pages 103 and 104.
SubSIdIary coMpaNIES aNd INVESTMENTSparticulars of subsidiary companies, associated companies and other investments are disclosed in annexures a and b.
dIrEcTorSthe names of the directors appear on pages 10 and 11.
in terms of the provision of the articles of association, messrs p e beyers, w e bührmann, p K harris, J malherbe, m m morobe, d prins, m h visser and miss m ramos retire from the board by rotation. these directors are eligible and offer themselves for re-election.
mr J f mouton retired as a director on 11 october 2006 and the board of directors’ wishes to thank him for his contribution.
mr J malherbe was appointed as a non-executive director on 11 october 2006. miss m ramos and mr m m morobe were appointed on 26 march 2007 and 18 June 2007 respectively as independent non-executive directors.
r e m g ro l i m i t e d | 5 3
r e p o rt o f t h e b oa r d o f d i r e c to r s for the year ended 31 march 2007

dIrEcTorS’ INTErESTSat 31 march 2007 the aggregate of the direct and indirect interests of the directors in the issued ordinary share capital of the company amounted to 0.88% (2006: 0.80%).
mr J p rupert is a director of rembrandt trust which owns all the issued unlisted b ordinary shares.
an analysis of directors’ interests in the issued capital of the company appears on page 105.
dIrEcTorS’ EMoluMENTSthe board recommends that directors’ fees for services rendered as directors during the past financial year be fixed at r1 846 000 (2006: r1 870 000) in total.
acquISITIoN of SharES of ThE coMpaNy it is recommended that a general authority be granted to the board to acquire, should circumstances warrant it, the company’s own shares and to approve the acquisition of shares in the company by any of its subsidiaries, subject to the provisions of the companies act 61 of 1973, as amended (“the companies act”), and the listings requirements of the JSe limited (“the listings requirements”). it is further recommended that a general authority be granted to the board to enable the board to, subject to the provisions of the companies act and the listings requirements, enter into derivative transactions which may or will lead to the company being required to purchase its own shares.
Special resolutions to grant this general authority are incorporated in the notice of the annual general meeting that appears on page 106.
SpEcIal rESoluTIoNSno special resolutions have been passed by the company’s major subsidiaries, the nature of which might be significant in respect of the state of affairs of the group.
dIVIdENd dEclaraTIoNDividend No 14a final dividend of 281 cents (2006: 228 cents) per share was declared in respect of both the ordinary shares of one cent each and the unlisted b ordinary shares of ten cents each, for the financial year ended 31 march 2007.
Paymentthe final dividend is payable to shareholders of the company registered at the close of business on friday, 17 august 2007.
Shareholders may not dematerialise or rematerialise their holdings of ordinary shares between monday, 13 august 2007, and friday, 17 august 2007, both days inclusive.
SEcrETarythe name and address of the company Secretary appears on page 102.
approValthe annual financial statements set out on pages 49 to 101 have been approved by the board.
Signed on behalf of the board of directors.
Johann Rupert Thys VisserChairman Chief Executive Officer
Stellenbosch18 June 2007
r e p o rt o f t h e b oa r d o f d i r e c to r sfor the year ended 31 march 2007
r e m g ro l i m i t e d5 4 |

r e m g ro l i m i t e d | 5 5
ac c o u n t i n g p o l i c i e sfor the year ended 31 march 2007
the annual financial statements are prepared on the historical cost basis, unless otherwise indicated, in accordance with international financial reporting Standards (ifrS), the requirements of the South african companies act, act 61 of 1973, as amended, and the listings requirements of the JSe limited.
these financial statements incorporate accounting policies that have been consistently applied to both years presented. during the year under review various new accounting standards, interpretations and amendments to ifrS became effective. the adoption of these new accounting standards, interpretations and amendments to ifrS had no impact on the results of either the current or prior years.
the preparation of the financial statements necessitates the use of estimates, assumptions and judgements that affect the reported amounts in the balance sheet and income statement. although estimates are based on management’s best knowledge and judgements of current facts as at balance sheet date, the actual outcome may differ from those estimates.
the most critical judgement exercised relates to the classification of investments as associated companies rather than investments available-for-sale. there are some investments over which remgro is believed to have significant influence although it has an interest of less than 20% in these companies. however, as remgro has board representation and is one of the major shareholders of these companies, its influence over their financial and operating policies is significant. those investments are accordingly accounted for as associated companies using the equity method. the fair value of associated companies is set out in note 6 to the annual financial statements.
other less significant estimates and assumptions relate to the determination of the useful lives of assets, impairment of goodwill, the valuation of unlisted investments and the assumptions used in calculating retirement benefit obligations and share-based payments, as well as the tax rates for the provision of deferred tax on fair value adjustments of investments. details of these estimates and assumptions are set out in the relevant notes to the annual financial statements.
the accounting policies that the group applied in the presentation of the financial statements are set out below.
(i) Consolidation, proportionate consolidation and equity accounting Consolidation – subsidiary companies all entities in which the group, directly or indirectly, has an interest of more than one half of the voting rights or
otherwise has the power to exercise control over the operations, are included in the consolidated financial statements in the accepted manner. the existence and effect of potential voting rights that are currently exercisable or convertible are considered when assessing whether the group controls another entity.
the purchase method of accounting is used to account for the acquisition of subsidiaries. identifiable assets acquired and liabilities and contingent liabilities assumed in a business combination, irrespective of the extent of minority interests, are measured initially at their fair values at the acquisition date. the excess of the cost of the acquisition over the fair value of the group’s share of the identifiable net assets acquired is recorded as goodwill. if the cost of the acquisition is less than the fair value of the net assets of the subsidiary acquired, the difference is accounted for directly in the income statement. the cost of an acquisition is measured at the fair value of the assets given, equity instruments issued and liabilities incurred or assumed at the date of exchange, plus costs directly attributable to the acquisition.
the results of subsidiary companies acquired or disposed of during the year are included in the consolidated income statement from or to the date on which effective control was acquired or ceased.
intergroup transactions, balances and unrealised gains are eliminated on consolidation. unrealised losses are also eliminated unless the transaction provides evidence of an impairment of the asset transferred.

ac c o u n t i n g p o l i c i e sfor the year ended 31 march 2007
r e m g ro l i m i t e d5 6 |
the accounting policies of subsidiaries conform to the policies adopted by the group. accounting policies between various industries have been aligned to the extent that it is material and appropriate for the specific industry.
Special purpose entities are consolidated when the substance of the relationship between the group and the special purpose entity indicates that the group effectively controls the entity.
Consolidation – The Remgro Share Trust the remgro Share trust has been consolidated as it is effectively controlled by the company.
Proportionate consolidation – joint ventures all jointly controlled ventures are accounted for according to the proportionate consolidation method. in terms of this
method the attributable share of assets, liabilities, income, expenditure and cash f low is included in the consolidated financial statements.
Equity accounting – associated companies entities that are neither subsidiaries nor joint ventures, but in which a long-term interest is held and over whose financial
and operating policies a significant influence can be exercised, are accounted for according to the equity method as associated companies. the results of associated companies, acquired or disposed of, are included in the consolidated income statement from the date on which effective significant influence begins or until it ceases. unrealised gains on transactions between the group and its associated companies are eliminated to the extent of the group’s interest in the associate. unrealised losses are also eliminated unless the transaction provides evidence of an impairment of the asset transferred. the group’s share of retained income is transferred to non-distributable reserves. the group’s share of other movements in the reserves of associated companies is accounted for as changes in consolidated non-distributable reserves. the carrying value of the group’s associated companies includes goodwill (net of any accumulated impairment losses) identified at acquisition. when the group’s share of losses in an associated company equals or exceeds its interest in the associate, including any other unsecured receivables, the group does not recognise further losses, unless it has incurred obligations or made payments on behalf of the associated company.
dilutionary and anti-dilutionary effects of equity transactions by associated companies that remgro is not party to, are accounted for directly against reserves.
certain associated companies have year-ends that differ from that of the company. in such circumstances the results of listed and certain unlisted companies are accounted for from the latest published information and management accounts as at year-end, respectively. the accounting policies of associated companies have been changed where necessary to align them to those of remgro and its subsidiaries to the extent that it is material and appropriate for the specific industry in which the associate operates.
Separate financial statements in remgro’s separate financial statements, investments in subsidiaries, joint ventures and associated companies are
carried at cost.
(ii) Property, plant and equipment and depreciation Land and buildings, machinery, equipment, office equipment and vehicles – are stated at historical cost less
accumulated depreciation. Subsequent costs are included in the asset’s carrying amount or recognised as a separate asset, as appropriate, only when it is probable that future economic benefits associated with the item will f low to the group and the cost of the item can be measured reliably. all other repairs and maintenance are charged to the income statement during the financial period in which they are incurred.

r e m g ro l i m i t e d | 5 7
depreciation on buildings, machinery, equipment, office equipment and vehicles is provided on a straight-line basis at rates that reduce the cost thereof to an estimated residual value over the expected useful life of the asset. the residual values and expected useful lives of assets are reviewed annually on balance sheet date and adjusted where necessary. no depreciation is provided for on land.
Leased assets – assets leased in terms of finance leases, i.e. where the group assumes substantially all the risks and rewards of ownership, are capitalised at the inception of the lease at the lower of the fair value of the leased asset or the present value of the minimum finance lease payments. leased assets are depreciated over the shorter of the lease period or the period over which the particular asset category is otherwise depreciated. the corresponding rental obligations, net of finance charges, are included in non-current liabilities. each lease payment is allocated between the liability and finance charges so as to achieve a constant rate on the finance balance outstanding. the finance charges are accounted for in the income statement over the term of the lease using the effective interest rate method.
leases of assets where the lessor substantially retains all the risks and rewards of ownership are classified as operating leases. payments made under operating leases are accounted for in income on a straight-line basis over the period of the lease.
Preproduction and borrowing costs – preproduction and borrowing costs directly attributable to the acquisition, construction or production of qualifying assets, i.e. assets that necessarily take a substantial period of time to get ready for their intended use or sale, are capitalised as part of the cost of those assets until such assets are substantially ready for their intended use or sale. investment income earned on the temporary investment of specific borrowings pending their expenditure on qualifying assets is deducted from borrowing costs capitalised.
(iii) Biological agricultural assets the fair value of the biological agricultural assets is determined on the following basis:
Sugarcane – roots are valued at the current establishment and replacement cost and the value is proportionally reduced over the estimated useful life of the roots. Standing cane is valued at its best-estimated recoverable value less harvesting, transport, agricultural levies and other over-the-weighbridge costs.
Citrus – orchards are valued at the current establishment and replacement cost adjusted for maturity levels and the value is proportionally reduced over the estimated useful life of the orchards. citrus fruit is valued at the best-estimated recoverable values less harvesting, transport and agricultural levies.
Breeding stock – breeding stock includes the breeding and laying operations. hatching eggs are included in breeding stock. breeding stock is measured at their fair value less estimated closure point-of-sale costs at reporting dates. fair value is determined based on market prices or, where market prices are not available, by reference to sector benchmarks.
gains and losses arising on the initial recognition of these assets at fair value less estimated point-of-sale costs and from a change in fair value less estimated point-of-sale costs are accounted for in profit and loss during the period in which they arise.
Sugarcane and citrus are reported in the balance sheet as non-current assets, while breeding stock is reported as current assets.
(iv) Investment properties investment properties are held to generate rental income and appreciate in capital value. investment properties are
treated as long-term investments and are carried at cost less accumulated depreciation. buildings are depreciated to their estimated residual values on a straight-line basis over their expected useful lives.
ac c o u n t i n g p o l i c i e s for the year ended 31 march 2007

ac c o u n t i n g p o l i c i e sfor the year ended 31 march 2007
r e m g ro l i m i t e d5 8 |
investment properties are valued by external independent professional valuers every third year.
(v) Intangible assets Goodwill – on the acquisition of an investment, fair values at the date of acquisition are attributed to the identifiable
assets, liabilities and contingent liabilities acquired.
goodwill is the difference between the cost of the investments and the fair value of attributable net assets of the subsidiaries, joint ventures and associated companies at the acquisition dates. goodwill is reported in the balance sheet as non-current assets and is carried at cost less accumulated impairment losses.
goodwill attributable to associated companies is included in the carrying value of these companies and is consequently
reported under “investments – associated companies”.
Trade marks – the cost of developing and establishing trade marks is expensed as incurred. consequently, the value thereof is not reflected in the annual financial statements. the cost of purchased trade marks is written off on a straight-line basis over their expected useful lives, subject to an annual impairment test.
Research and development costs – research cost is expensed as incurred. where the asset recognition criteria have been met, development cost is capitalised and written off over the expected useful life of the product. development cost previously expensed is not recognised as an asset in a subsequent period.
trade marks and capitalised development costs with infinite lives are not amortised, but are subject to an annual impairment test. any impairment is accounted for in income.
(vi) Financial instruments financial instruments disclosed in the financial statements include cash and cash equivalents, investments, derivative
instruments, debtors and short-term loans, trade and other payables and borrowings. financial instruments are initially recognised at fair value, including transaction costs, when the group becomes party to the contractual terms of the instruments. the transaction costs relating to the acquisition of financial instruments held at fair value through profit and loss are expensed. Subsequent to initial recognition, these instruments are measured as follows:
Loans and receivables and borrowings – loans and receivables and borrowings are non-derivative financial instruments with fixed or determinable payments that are not quoted in an active market. these instruments are carried at amortised cost using the effective interest rate method.
Held-to-maturity financial instruments – instruments with fixed maturity that the group has the intent and ability to hold to maturity are classified as held-to-maturity financial instruments and are carried at amortised cost using the effective interest rate method.

r e m g ro l i m i t e d | 5 9
Available-for-sale financial instruments – other long-term financial instruments are classified as available-for-sale and are carried at fair value. unrealised gains and losses arising from changes in the fair value of available-for-sale financial instruments are recognised in non-distributable reserves in the period in which they arise. when these financial instruments are either derecognised or impaired, the accumulated fair value adjustments are realised and included in income.
Financial instruments at fair value through profit and loss – these instruments, consisting of financial
instruments held-for-trading and those designated at fair value through profit and loss at inception, are carried at fair value. derivatives are also classified as held-for-trading unless they are designated as hedges. realised and unrealised gains and losses arising from changes in the fair value of these financial instruments are recognised in the income statement in the period in which they arise.
financial assets (or portions thereof) are derecognised when the group realises the rights to the benefits specified in the contract, the rights expire or the group surrenders or otherwise loses control of the contractual rights that comprise the financial asset. on derecognition, the difference between the carrying amount of the financial asset and proceeds receivable, as well as any prior adjustments to reflect fair value that had been recognised in equity, is included in the income statement.
financial liabilities (or portions thereof) are derecognised when the obligation specified in the contract is discharged or cancelled or has expired. on derecognition, the difference between the carrying amount of the financial liability, including related unamortised costs, and the amount paid for it is included in the income statement.
the fair value of financial instruments traded in an organised financial market is measured at the applicable quoted prices. the fair value of the financial instruments that are not traded in an organised financial market is determined using a variety of methods and assumptions that are based on market conditions and risk existing at balance sheet date, including independent appraisals and discounted cash f low methods. fair values represent an approximation of possible value, which may differ from the value that will finally be realised.
there are group companies that are parties to derivative financial instruments that reduce exposure to financial risks. these instruments mainly comprise forward contracts. certain group companies apply hedge accounting. gains and losses arising from cash f low hedges are recognised directly in equity, while those arising from fair value hedges are recognised in the income statement in the period in which they arise. group companies that do not apply hedge accounting, recognise changes in the fair value of these and other derivative instruments in the income statement in the period in which they arise.
where a current legally enforceable right of set-off exists for recognised financial assets and financial liabilities, and there is an intention to settle the liability and realise the asset simultaneously, or to settle on a net basis, all related financial effects are offset.
all purchases and sales of financial instruments are recognised at the trade date.
any derivatives embedded in financial instruments are separated from the host contract when their economic characteristics are not closely related to those of the host contract and the host contract is not carried at fair value. gains and losses are reported in the income statement.
ac c o u n t i n g p o l i c i e s for the year ended 31 march 2007

ac c o u n t i n g p o l i c i e sfor the year ended 31 march 2007
r e m g ro l i m i t e d6 0 |
(vii) Non-current assets held for sale and discontinued operations non-current assets (or disposal groups) are classified as held for sale if their carrying amounts will be recovered
principally through a sale transaction rather than through continuing use. these assets (or disposal groups) are measured at the lower of its carrying amount or fair value less costs to sell.
(viii) Inventories inventories are stated at the lower of cost or net realisable value. the basis of determining cost, which excludes finance
costs, is the first-in first-out cost method. net realisable value is the estimated selling price in the ordinary course of business, less applicable variable selling expenses. where applicable, provision is made for slow-moving and redundant inventories. work in progress and finished goods include direct costs and an appropriate allocation of manufacturing overheads.
(ix) Taxation deferred taxation is provided for at current rates using the balance sheet liability method. full provision is made for
all temporary differences between the taxation base of an asset or liability and its balance sheet carrying amount. no deferred tax liability is recognised in those circumstances where the initial recognition of an asset or liability has no impact on accounting profit or taxable income. assets are not raised in respect of deferred taxation, unless it is probable that future taxable profits will be available against which the deferred taxation asset can be realised in the foreseeable future.
Secondary taxation on companies is provided for in respect of dividend payments, net of dividends received or receivable and is recognised as a taxation charge for the year.
(x) Foreign currencies Functional and presentation currency items included in the financial statements of each of the group’s entities are measured using the currency of the
primary economic environment in which the entity operates, i.e. its functional currency. remgro group’s company and consolidated functional and presentation currency is rand and all amounts, unless otherwise indicated, are stated in millions.
Transactions and balances foreign currency transactions are translated to the functional currency using the exchange rates prevailing at the date of
the transactions. except when deferred in equity as qualifying cash f low hedges and qualifying net investment hedges, foreign exchange gains and losses resulting from the settlement of such transactions and from the translation at year-end exchange rates of foreign currency denominated monetary assets and liabilities are recognised in the income statement. exchange differences on non-monetary items are accounted for based on the classification of the underlying items. foreign exchange gains and losses on financial instruments classified as available-for-sale financial assets are included in equity, whereas those on financial instruments held at fair value through profit and loss are reported as part of the fair value gain or loss.
Group entities the results and financial position of all foreign operations (excluding those operating in hyperinflationary economies)
that have a functional currency different from the group’s presentation currency are translated into the presentation currency as follows:
• assets and liabilities are translated at the closing rate on the balance sheet date. • income and expenses for each income statement are translated at average exchange rates for the year, to the extent
that such average rates approximate actual rates. • all resulting exchange differences are recognised directly in equity.

r e m g ro l i m i t e d | 6 1
on consolidation exchange differences arising from the translation of the net investment in foreign operations, and of borrowings and other currency instruments designated as hedges of such investments, are taken directly to equity. on disposal of foreign operations, the related exchange differences are recognised in the income statement as part of the profit or loss on disposal. goodwill and fair value adjustments arising on the acquisition of foreign operations are treated as assets and liabilities of the foreign operation and translated at closing rates at balance sheet date.
(xi) Impairment of assets Impairment – subsidiaries, joint ventures and associates an asset is impaired if its carrying amount is greater than its estimated recoverable amount, which is the higher of its fair
value less cost to sell or its value in use. the carrying amounts of subsidiaries, joint ventures and associated companies are reviewed annually and written down for impairment where necessary.
Investment property and property, plant and equipment where these assets are identified as being impaired, that is when the recoverable amount has declined below its carrying
amount, the carrying amount is reduced to reflect the decline in value. Such written-off amounts are accounted for in the income statement.
Financial instruments carried at amortised cost the group assesses whether there is objective evidence that a financial asset is impaired at each balance sheet date.
a financial asset is impaired and impairment losses are incurred only if there is objective evidence of impairment as a result of one or more events that have occurred after the initial recognition of the asset (a ‘loss event’) and that loss event has an impact on the estimated future cash f lows of the financial asset that can be reliably estimated.
if there is objective evidence that an impairment loss on loans and receivables or held-to-maturity investments carried at amortised cost has occurred, the amount of the loss is measured as the difference between the asset’s carrying amount and the present value of estimated future cash f lows discounted at the financial asset’s original effective interest rate. the carrying amount of the asset is reduced and the amount of the loss is recognised in the income statement. if a held-to-maturity investment or a loan has a variable interest rate, the discount rate for measuring any impairment loss is the current effective interest rate determined under contract. as a practical expedient, the group may measure impairment on the basis of an instrument’s fair value using an observable market price.
if in a subsequent period, the amount of the impairment loss decreases and the decrease can be related objectively to an event occurring after the impairment was recognised, such as improved credit rating, the previously recognised impairment loss is reversed and is recognised in the income statement.
Financial assets carried at fair value at each balance sheet date the group assesses whether there is objective evidence of possible impairment of financial
assets carried at fair value. if any objective evidence of impairment exists for available-for-sale financial assets, the cumulative loss, measured as the difference between the acquisition cost and current fair value, less any impairment loss on the financial asset previously recognised in profit or loss is removed from equity and recognised in the income statement.
impairment losses on equity instruments that were recognised in the income statement are not subsequently reversed through the income statement – such reversals are accounted for in equity.
Goodwill goodwill is assessed annually for possible impairments. for purposes of impairment testing, goodwill is allocated
to cash-generating units, being the lowest component of the business measured in the management accounts that is expected to generate cash f lows that are largely independent of another business component. impairment losses relating to goodwill are not reversed.
ac c o u n t i n g p o l i c i e s for the year ended 31 march 2007

ac c o u n t i n g p o l i c i e sfor the year ended 31 march 2007
r e m g ro l i m i t e d6 2 |
(xii) Provisions provisions are recognised when a present legal or constructive obligation exists as a result of past events, it is probable
that an outflow of resources embodying economic benefits will be required to settle the obligation, and a reliable estimate of the amount of the obligation can be made.
provisions are measured at the present value of the expected expenditure required to settle the obligation using a pre-tax rate that reflects the current market assessment of the time value of money and the risks specific to the obligation. the increase in the provision due to passage of time is recognised as interest expense.
(xiii) Employee benefits Post-retirement benefits pension obligations – companies in the group provide defined benefit and defined contribution post-retirement
plans for their employees. the plan assets are held in separate trustee-administered funds. these plans are funded by payments from the employees and the group, taking into account recommendations of independent qualified actuaries.
for the defined benefit plans, the pension accounting costs are assessed using the projected unit credit method. the cost of providing pensions is charged to the income statement to spread the regular costs over the service lives of the employees in accordance with advice of qualified actuaries. the pension obligation is measured as the present value of the estimated future cash outflows using interest rates of government securities that have maturity terms approximating the terms of the related liability.
past-service costs are immediately expensed, unless the changes to the pension plan are conditional on the employees remaining in service for a specified vesting period, in which case the past-service costs are amortised on a straight-line basis over the vesting period.
the net surplus or deficit of the benefit obligation is the difference between the present value of the funded obligations and the fair value of the plan assets. if the cumulated unrecognised actuarial gains and losses at the end of the previous reporting period exceed the greater of ten percent of the defined benefit obligation or defined benefit plan’s assets, that excess is recognised in future periods over the expected average remaining working lives of the participating employees.
the group’s contribution to the defined contribution pension plans is charged to the income statement in the year in which they relate.
post-retirement medical obligations – the group provides post-retirement medical benefits to its retirees. the entitlement to post-retirement medical benefits is based on the employees remaining in service up to retirement age and the completion of a minimum service period. the projected unit credit method of valuation is used to calculate the liability for post-retirement medical benefits.
the expected costs of these benefits are expensed and the liabilities accumulated over the period of employment, using accounting methodology similar to that for defined benefits pension plans. independent qualified actuaries value these obligations.
r e m g ro l i m i t e d6 2 | r e m g ro l i m i t e d6 2 |
r e m g ro l i m i t e d | 6 3 r e m g ro l i m i t e d | 6 3
Equity compensation plans the remgro group operates various equity settled share-based compensation plans. all share offers granted after
7 november 2002 that have not vested by 1 January 2005 are accounted for as share-based payment transactions. the fair value of share offers is determined on the grant date and is accounted for as an employee services expense over the vesting period of the offer, with a corresponding increase in equity, based on the group’s estimate of the number of shares that will eventually vest. fair value is determined using a binomial model. the expected contract life used in the model has been adjusted based on management’s best estimate of the effects of non-transferability, exercise restrictions and behavioural considerations.
any profits or losses that realise from shares being delivered to participants of the remgro Share Scheme are recognised directly in equity. the proceeds received net of any directly attributable transaction costs are accounted for against treasury shares when the options are exercised.
Short-term benefits employee entitlements to leave are recognised when they accrue to employees involved. a provision is made for the
estimated liability for leave as a result of services rendered by employees up to balance sheet date.
(xiv) Cash and cash equivalents for the purpose of the cash f low statement, cash and cash equivalents comprise cash on hand, deposits held at call with
banks, and investments in money market instruments, net of bank overdrafts. in the balance sheet, bank overdrafts are included in short-term interest-bearing loans.
(xv) Revenue recognition the sale of goods is recognised when the significant risks and rewards of ownership of the goods have been transferred.
revenue arising from services is recognised when the service is rendered. Sales comprise the fair value of the consideration received or receivable for the sale of goods and services in the ordinary course of the group’s activities and are disclosed net of value added tax, returns, rebates and discounts.
interest is recognised on a time proportion basis (taking into account the principal outstanding, the effective rate and the period), unless collectability is in doubt. dividends are recognised when the right to receive payment is established.
(xvi) treasury shares Shares in the company held by group companies and those held by the remgro Share trust are classified as treasury
shares and are held at cost. these shares are treated as a deduction from the issued number of shares and taken into account in the calculation of the weighted average number of shares. the cost price of the shares is deducted from the group’s equity.
(xvii) Current/non-current distinction items are classified as current when it is expected to be realised, traded, consumed or settled within twelve months after
the balance sheet date, or the group does not have an unconditional right to defer settlement for at least twelve months after the balance sheet date.
ac c o u n t i n g p o l i c i e s for the year ended 31 march 2007

ac c o u n t i n g p o l i c i e sfor the year ended 31 march 2007
r e m g ro l i m i t e d6 4 |
(xviii) New accounting policies and interpretations management considered all new accounting standards, interpretations and amendments to ifrS that were issued prior
to 31 march 2007, but not yet effective on that date. the standards that are applicable to the group, but that were not implemented early, are the following:
• IFRS 7: Financial Instruments – Disclosures (effective date – financial periods commencing on/after 1 January 2007) this standard significantly impacts on the disclosure requirements regarding financial instruments. it focuses on the
disclosure of entity specific risks, as well as the measures management implemented to address those risks. ifrS 7 does not impact the measurement of financial instruments.
• IFRS 8: Operating Segments (effective date – financial periods commencing on/after 1 January 2009) ifrS 8 replaces iaS 14: Segment reporting. it redefines “operating segment” and prescribes various disclosures. this
standard only affects disclosure and will not impact the group’s results.
• IFRIC 9: Reassessment of Embedded Derivatives (effective date – financial periods commencing on/after 1 June 2006) iaS 39 requires an entity, when it first becomes a party to a contract, to assess whether any embedded derivatives
contained in the contract are required to be separated from the host contract and accounted for as derivatives. this interpretation addresses whether such an assessment is only to be made when the entity first becomes a party to the contract, or whether the assessment should be reconsidered throughout the life of the contract.
an entity shall assess whether an embedded derivative is required to be separated from the host contract and accounted for as a derivative only when the entity first becomes a party to the contract. no reassessment shall take place, unless the terms of the contracts change to the extent that they vary the cash f lows resulting from the instrument.
• IFRIC 10: Interim Financial Reporting and Impairment (effective date – financial periods commencing on/after 1 November 2006) an entity shall not reverse an impairment loss recognised in a previous interim period in respect of goodwill or an
investment in either an equity instrument or a financial asset carried at cost.
• IFRIC 11: IFRS 2 – Group and Treasury Share Transactions (effective date – financial periods commencing on/after 1 March 2007, applied retrospectively in accordance with the
transitional provisions of IFRS 2) this interpretation clarifies two issues: • the distinction between equity and cash settled share-based payment transactions in instances where the equity
instruments used for settlement are either obtained from a third party or are treasury shares; and • share-based payment arrangements that involve two or more entities within the same group, e.g. employees of a
subsidiary are granted rights to equity instruments of its parent as consideration for the services provided to the subsidiary.
r e m g ro l i m i t e d6 4 |

r e m g ro l i m i t e d | 6 5
ac c o u n t i n g p o l i c i e s for the year ended 31 march 2007
Issue 1 if an entity provides its own equity instruments as settlement for goods and services obtained, the transaction is
treated as equity settled, regardless of the source from which it obtained the equity instruments.
Issue 2 if the parent grants the right to receive the parent’s equity instruments to the subsidiary’s employees, and on
consolidation the scheme is accounted for as equity settled, the subsidiary shall account for it as an equity settled share-based payment transaction.
if the subsidiary grants the right to receive the parent’s equity instruments to its employees, the scheme is accounted for as a cash settled share-based payment transaction.
• IFRIC 12: Service Concession Arrangements (effective date – financial periods commencing on/after 1 January 2008) in some countries, governments have introduced contractual service arrangements to attract private sector
participation in the development, financing, operation and maintenance of such infrastructure. the interpretation sets out the appropriate accounting treatment for the divergent aspects resulting from these arrangements. the group is not party to such arrangements, therefore the interpretation is not applicable.
• Amendment to IAS 1: Presentation of financial statements (Objectives, policies and processes for managing capital)
(effective date – financial periods commencing on/after 1 January 2007) the amendment requires disclosures that will enable users to evaluate the group’s objectives, policies and processes
for managing capital. this includes, amongst others, a description of what an entity manages as capital (including quantitative data), the nature of externally imposed capital requirements (if applicable) and how it is meeting its objectives for managing capital. the disclosures should be based on information used by key management in making decisions.
the application of the standards, interpretations and amendments to ifrS mentioned above in future financial reporting periods is not expected to have a significant effect on the group’s financial results, financial position and cash f low.
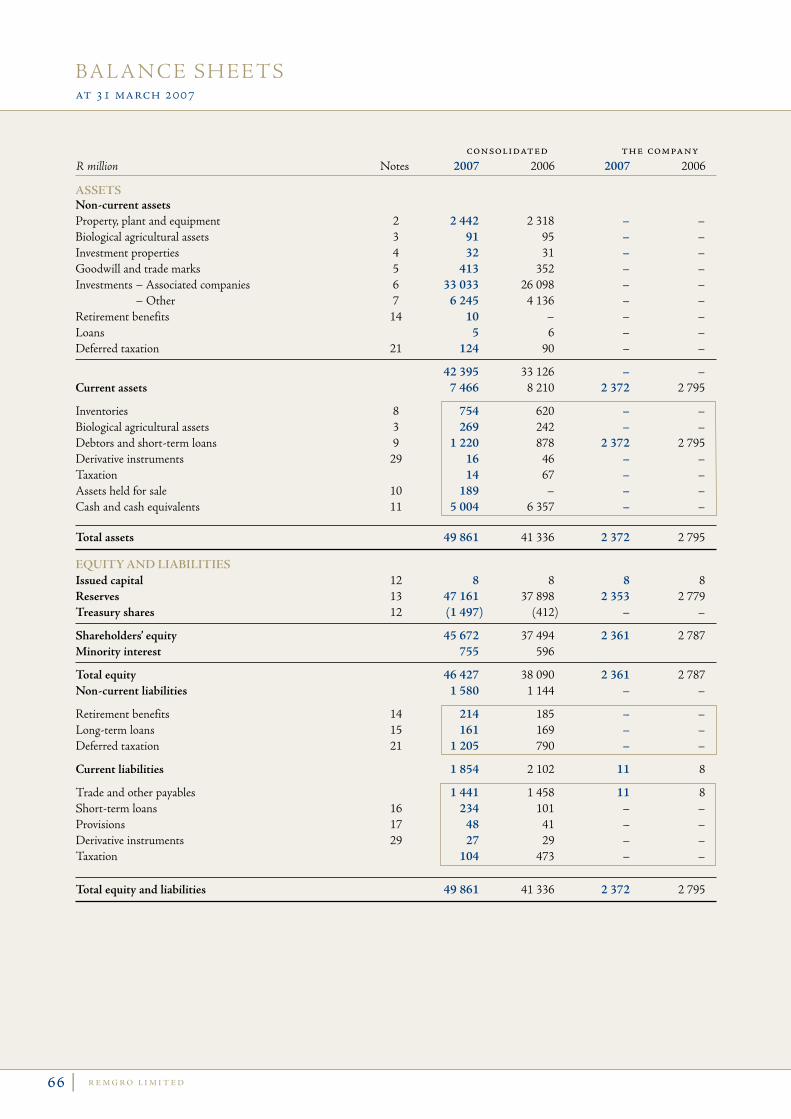
r e m g ro l i m i t e d6 6 | 6 6 |
b a l a n c e s h e e tsat 31 march 2007
consolidated the companyR million Notes 2007 2006 2007 2006
AssetsNon-current assetsProperty, plant and equipment 2 2 442 2 318 – –Biological agricultural assets 3 91 95 – –Investment properties 4 32 31 – –Goodwill and trade marks 5 413 352 – –Investments – Associated companies 6 33 033 26 098 – –
– Other 7 6 245 4 136 – –Retirement benefits 14 10 – – –Loans 5 6 – –Deferred taxation 21 124 90 – –
42 395 33 126 – –Current assets 7 466 8 210 2 372 2 795
Inventories 8 754 620 – –Biological agricultural assets 3 269 242 – –Debtors and short-term loans 9 1 220 878 2 372 2 795Derivative instruments 29 16 46 – –Taxation 14 67 – –Assets held for sale 10 189 – – –Cash and cash equivalents 11 5 004 6 357 – –
Total assets 49 861 41 336 2 372 2 795
equity And liAbilitiesIssued capital 12 8 8 8 8Reserves 13 47 161 37 898 2 353 2 779Treasury shares 12 (1 497) (412) – –
Shareholders’ equity 45 672 37 494 2 361 2 787Minority interest 755 596
Total equity 46 427 38 090 2 361 2 787Non-current liabilities 1 580 1 144 – –
Retirement benefits 14 214 185 – –Long-term loans 15 161 169 – –Deferred taxation 21 1 205 790 – –
Current liabilities 1 854 2 102 11 8
Trade and other payables 1 441 1 458 11 8Short-term loans 16 234 101 – –Provisions 17 48 41 – –Derivative instruments 29 27 29 – –Taxation 104 473 – –
Total equity and liabilities 49 861 41 336 2 372 2 795

r e m g ro l i m i t e d | 6 7 | 6 7
i n c o m e s tat e m e n tsfor the year ended 31 march 2007
consolidated the companyR million Notes 2007 2006 2007 2006
Sales 7 877 9 802Inventory expenses (4 781) (4 919) Personnel costs 24 (1 306) (2 603) Depreciation 18 (223) (293) Other net operating expenses 18 (551) (771) (2) (3)
Trading profit 1 016 1 216 (2) (3)Dividends received 20 156 410 3 358 4 191Interest received 18 334 341Finance costs (30) (29) Negative goodwill 44 –Net impairment of investments, assets and goodwill – 3 Profit on redemption and sale of investments 18 7 3 162
Consolidated profit before tax 1 527 5 103 3 356 4 188Taxation 21 (403) (857)
Consolidated profit after tax 1 124 4 246 3 356 4 188Share of after-tax profit of associated companies 22 6 003 4 354
Net profit for the year 7 127 8 600 3 356 4 188
Attributable to:Equity holders 6 942 8 202 3 356 4 188Minority interest 185 398
7 127 8 600 3 356 4 188
eArnings per shAre Cents Cents
– Basic 1 1 464.2 1 697.6 – Diluted 1 418.5 1 671.3
AssociAted compAnies R million R million
Share of after-tax profit of associated companies Profit before taking into account impairments, capital and non-recurring items 5 995 4 428 Net impairment of investments, assets and goodwill (12) (157) Profit on the sale of investments 249 681Restructuring costs (237) (280) Non-recurring portion of BEE costs – (380) Other capital and non-recurring items 8 62
6 003 4 354

r e m g ro l i m i t e d6 8 | 6 8 |
s tat e m e n ts o f c h a n g e s i n e q u i t yfor the year ended 31 march 2007
consolidated attributable to equity holders of the company Other non- Fair Share- Issued Equity distributable value Retained Treasury holders’ Minority Total R million capital reserves reserves reserves earnings shares equity interest equity
2007Balances at 1 April 8 14 026 997 3 160 19 715 (412) 37 494 596 38 090Total income accounted for 3 594 910 1 843 7 476 13 823 185 14 008
Exchange rate adjustments 3 594 907 534 5 035 5 035Net fair value adjustments for the year 3 1 843 1 846 1 846Net income directly accounted for in equity 3 594 910 1 843 534 6 881 6 881Net profit for the year 6 942 6 942 185 7 127
Dividends paid (3 748) (3 748) (65) (3 813)Capital invested by minorities 30 30Transfer between reserves and other movements (7) 17 (5) 5 6 11Change in reserves of associated companies (824) (824) (824)Transfer of retained income of associated companies 3 366 (3 366) – –Purchase of shares by wholly owned subsidiary (treasury shares) (1 031) (1 031) (1 031)Net (purchase)/delivery of shares by The Remgro Share Trust (54) (54) (54)Long-term share incentive scheme reserve 7 7 3 10
Balances at 31 March 8 20 155 1 931 5 003 20 072 (1 497) 45 672 755 46 427
2006Balances at 1 April 8 15 076 1 091 1 261 19 608 (2 552) 34 492 2 011 36 503Total income accounted for (1 035) (213) 1 903 8 055 8 710 398 9 108
Exchange rate adjustments (1 035) (213) (147) (1 395) (1 395)Net fair value adjustments for the year 1 903 1 903 1 903Net income directly accounted for in equity (1 035) (213) 1 903 (147) 508 508Net profit for the year 8 202 8 202 398 8 600
Dividends paid (4 525) (4 525) (151) (4 676) Capital invested by minorities 17 17Transfer between reserves and other movements (2 024) 159 (4) 1 848 (21) (264) (285)Change in reserves of associated companies (242) (242) (242) Transfer of retained income of associated companies 897 (897) – – Purchase of shares by wholly owned subsidiary (treasury shares) (977) (977) (977) Medi-Clinic* 1 354 (16) (1 338) – (1 418) (1 418)Net (purchase)/delivery of shares by The Remgro Share Trust 92 92 92Long-term share incentive scheme reserve (24) (24) 3 (21)Cancellation of treasury shares (3 036) 3 025 (11) (11)
Balances at 31 March 8 14 026 997 3 160 19 715 (412) 37 494 596 38 090
* Since 1 January 2006, Medi-Clinic has been accounted for as an associated company, while it was consolidated previously.
the company
R million 2007 2006
Balances at 1 April 2 787 7 994
Issued capital 8 8 Retained earnings 2 779 7 986
Shares cancelled – (4 535)Net profit for the year 3 356 4 188Dividends paid (3 782) (4 860)
Balances at 31 March 2 361 2 787

r e m g ro l i m i t e d | 6 9 | 6 9
c a s h f l ow s tat e m e n tsfor the year ended 31 march 2007
consolidated the companyR million Notes 2007 2006 2007 2006
Cash flows – operating activitiesConsolidated profit before taxation 1 527 5 103 3 356 4 188Adjustments 23.1 309 (3 588) (3 358) (4 191)
Consolidated profit/(loss) before working capital changes 1 836 1 515 (2) (3)Working capital changes 23.2 (170) (41) 2 (2)
Cash generated/(utilised) from operations 1 666 1 474 – (5)Cash flow generated from returns on investments 3 070 4 229 3 358 4 191
Interest received 334 341 – – Dividends received 23.3 2 736 3 888 3 358 4 191
Finance cost (30) (29) – –Taxation paid 23.4 (676) (369) – –
Cash available from operating activities 4 030 5 305 3 358 4 186Dividends paid 23.5 (3 813) (4 676) (3 782) (4 860)
Cash inflow/(outflow) from operating activities 217 629 (424) (674)
Cash flows – investing activitiesNet investments to maintain operations (109) (54) – –
Replacement of property, plant and equipment (124) (83) – – Proceeds on disposal of property, plant and equipment 15 29 – –
Investments to expand operations (673) (1 362) – –
Additions to – property, plant and equipment and other assets (410) (607) – – – investments and loans (249) (609) – – Business acquired (14) (146) – –
Proceeds from disposal of investments and loans 260 6 585 – –
Medi-Clinic’s cash transferred to associated company – (879) – –Purchase of treasury shares (1 203) (926) – –
Net cash generated/(utilised) before financing activities (1 508) 3 993 (424) (674)
Cash flows – financing activities 70 99 424 674
(Increase)/decrease in loans 40 93 424 5 209Issue of new shares by subsidiary companies 12 10 – –Capital contributed by minorities of subsidiary company 18 7 – –Shares cancelled – (11) – (4 535)
Net increase/(decrease) in cash and cash equivalents (1 438) 4 092 – –Cash and cash equivalents at the beginning of the year 6 339 2 247 – –
Cash and cash equivalents at the end of the year 4 901 6 339 – –
Cash and cash equivalents – per balance sheet 5 004 6 357 Bank overdraft (103) (18)

r e m g ro l i m i t e d7 0 | 7 0 |
n ot e s to t h e a n n ua l f i na n c i a l s tat e m e n tsfor the year ended 31 march 2007
2007 2006 R million R million
1. eArnings Headline earnings reconciliation
Net profit for the year attributable to equity holders 6 942 8 202 Plus/(minus) – portion attributable to equity holders: – Negative goodwill (44) – – Net impairment of investments, assets and goodwill 12 157 – Profit on redemption and sale of investments (256) (3 475) – Restructuring costs 221 279 – Other capital and non-recurring items (10) (67) – Net surplus, after tax on disposal of property, plant and equipment (12) (12)
Headline earnings 6 853 5 084 Non-recurring portion of BEE costs added back – 380
Headline earnings – Excluding non-recurring portion of BEE costs 6 853 5 464
Earnings per share Cents Cents
Headline earnings per share – Basic 1 445.4 1 052.3 – Diluted 1 401.3 1 027.7
Headline earnings per share – Excluding non-recurring portion of BEE costs – Basic 1 445.4 1 130.9 – Diluted 1 401.3 1 106.1
Earnings per share – Basic 1 464.2 1 697.6 – Diluted 1 418.5 1 671.3
Earnings per share In determining earnings per share and headline earnings per share the weighted number of shares in issue, being
474 123 689 (2006: 483 154 691), was taken into account after deduction of treasury shares as well as shares held in The Remgro Share Trust and certain associated companies.
Diluted earnings per share In determining diluted earnings per share and diluted headline earnings per share the weighted number of shares in issue was
adjusted for the deemed dilutive effect of the shares accepted by participants in the Remgro Share Scheme but not yet delivered.
Because the scheme shares have to be accounted for as treasury shares, the delivery thereof to participants will be regarded as an issue of shares. As the market value (fair value) of the shares at date of delivery will differ from the offer value, the number of shares represented by the difference will be regarded as an issue of ordinary shares for no consideration. These imputed shares total 1 672 153 (2006: 1 352 255) and have been added to the weighted number of shares to determine the dilutive effect.
Some subsidiary and associated companies have similar management incentive schemes as well as other instruments that can dilute these companies’ earnings in the future. To calculate Remgro’s diluted earnings per share, R186 million (2006: R105 million) and R193 million (2006: R105 million) were offset against headline earnings and earnings respectively to account for the potential diluted effect.

r e m g ro l i m i t e d | 7 1 | 7 1
2. property, plAnt And equipment Land and Machinery Office buildings and equipment Vehicles equipment Total R million R million R million R million R million
Carrying value at 1 April 2005 2 289 1 521 104 81 3 995
Cost 2 673 3 123 244 225 6 265 Accumulated depreciation (384) (1 602) (140) (144) (2 270)
Additions 245 361 43 40 689 Disposals (17) (5) (7) – (29) Depreciation (31) (214) (23) (25) (293) Businesses acquired 126 29 102 18 275 Businesses disposed – (1) – (1) (2) Medi-Clinic* (1 730) (481) – (100) (2 311) Other (8) 2 – – (6)
Carrying value at 31 March 2006 874 1 212 219 13 2 318
Cost 1 267 2 312 376 39 3 994 Accumulated depreciation (393) (1 100) (157) (26) (1 676)
Additions 102 300 78 22 502 Disposals (5) (4) (6) – (15) Depreciation (27) (167) (26) (3) (223) Other (153) 13 – – (140)
Carrying value at 31 March 2007 791 1 354 265 32 2 442
Cost 1 199 2 582 429 47 4 257 Accumulated depreciation (408) (1 228) (164) (15) (1 815)
* Since 1 January 2006, Medi-Clinic has been accounted for as an associated company, while it was consolidated previously. 2007 2006 Depreciation rates are as follows: % % Buildings 0 – 50 0 – 50 Machinery and equipment 3⅓ – 100 2 – 100 Vehicles 4 – 33⅓ 5 – 33⅓ Office equipment 5 – 33⅓ 5 – 33⅓
Liabilities resulting from mortgage loans, finance leases and instalment sale agreements are secured by vehicles with a book value of R1 million (2006: R2 million).
The registers containing details of land and buildings are available for inspection by members or their proxies at the registered
offices of the companies to which the relevant properties belong.
n ot e s to t h e a n n ua l f i na n c i a l s tat e m e n ts for the year ended 31 march 2007

r e m g ro l i m i t e d7 2 | 7 2 |
n ot e s to t h e a n n ua l f i na n c i a l s tat e m e n tsfor the year ended 31 march 2007
3. biologicAl AgriculturAl Assets Included in non-current assets:
Reconciliation of carrying Sugarcane Sugarcane Sugarcane Sugarcane value at the beginning and roots plants Citrus 2007 roots plants Citrus 2006 end of the year R million R million R million R million R million R million R million R million
Balances at 1 April 47 34 14 95 45 35 14 94 Fair value adjustment 22 (4) – 18 2 (1) – 1 Other (14) (8) _ (22) – – – –
Balances at 31 March 55 22 14 91 47 34 14 95
The quantity at 31 March is as follows: Sugarcane roots (ha) 5 024 8 343 Sugarcane plants (ha) 5 024 8 343 Citrus (ha) 1 393 1 482
Included in current assets: Reconciliation of carrying Breeding Broiler Breeding Broiler value at the beginning and stock stock 2007 stock stock 2006 end of the year R million R million R million R million R million R million
Balances at 1 April 143 99 242 148 91 239 Additions 418 2 115 2 533 376 1 901 2 277 Decrease due to harvest (403) (2 114) (2 517) (382) (1 901) (2 283) Fair value adjustment 2 9 11 1 8 9
Balances at 31 March 160 109 269 143 99 242
4. investment properties 2007 2006 Accumulated Net Accumulated Net Cost depreciation value Cost depreciation value R million R million R million R million R million R million
Land 3 – 3 3 – 3 Buildings 29 – 29 28 – 28
32 – 32 31 – 31
Reconciliation of carrying value at the beginning and Land Buildings 2007 Land Buildings 2006 end of the year R million R million R million R million R million R million
Balances at 1 April 3 28 31 3 28 31 Other – 1 1 – – –
Balances at 31 March 3 29 32 3 28 31
The South African investment properties were valued during the 2005 financial year by an independent, qualified valuer using market information. The fair value of these investment properties was determined by increasing the 2006 valuation by 10% (2006: 6%). Foreign investment properties were valued by an independent, qualified valuer during the 2006 year. The fair value of the investment properties, VAT exclusive, is R318 million (2006 valuation: R292 million).
No depreciation was provided for on investment properties, as all the assets have significant residual values. The remaining useful life of the assets is estimated as 50 years.
The registers containing details of investment properties are available for inspection by members or their proxies at the registered offices of the companies to which the relevant properties belong.

r e m g ro l i m i t e d | 7 3 | 7 3
n ot e s to t h e a n n ua l f i na n c i a l s tat e m e n ts for the year ended 31 march 2007
5. goodwill And trAde mArks 2007 2006 Accumulated Accumulated Cost or impairment/ Net Cost or impairment/ Net valuation amortisation value valuation amortisation value R million R million R million R million R million R million
Goodwill 342 – 342 316 – 316 Trade marks 146 75 71 99 63 36
488 75 413 415 63 352
2007 2006 Amortisation rates are as follows: % % Trade marks 5 – 100 5 – 6⅔
Reconciliation of carrying Trade Trade value at the beginning and Goodwill marks 2007 Goodwill marks 2006 end of the year R million R million R million R million R million R million
Balances at the beginning of the year 316 36 352 379 7 386 Additions 19 37 56 – 41 41 Amortisation – (14) (14) – (8) (8) Businesses acquired 7 2 9 9 – 9 Medi-Clinic* – – – (44) (4) (48) Other – 10 10 (28) – (28)
Balances at the end of the year 342 71 413 316 36 352
* Since 1 January 2006, Medi-Clinic has been accounted for as an associated company, while it was consolidated previously.
Goodwill is tested annually for any possible impairment and for this reason allocated to the respective cash-generating units as indicated below.
Tsb Sugar Holdings Wispeco Rainbow (Pty) Holdings Chicken Limited Limited Limited and and its and its 2007 its subsidiaries subsidiaries subsidiaries Total
Goodwill allocated (R million) 291 35 16 342
Basis of valuation of cash-generating units Fair Directors’ Directors’ value/ valuation valuation value in use
R287 million of the goodwill relating to Rainbow Chicken and its subsidiaries relates to the acquisition of Vector Logistics (Pty) Limited in 2005. In determining the value in use of the cash-generating unit to which this goodwill was allocated, the following assumptions were used:
Discount rate 12.81% Growth rate 5.0% Period 5 years
Sensitivity analysis of assumptions used in the goodwill impairment test:
Assumption Movement Impairment
Discount rate +5% Nil Growth rate –5% Nil
During the year under review no impairment of goodwill occurred.

r e m g ro l i m i t e d7 4 | 7 4 |
n ot e s to t h e a n n ua l f i na n c i a l s tat e m e n tsfor the year ended 31 march 2007
6. investments – AssociAted compAnies (Annexures B & C) 2007 2006 Listed Unlisted Total Listed Unlisted Total R million R million R million R million R million R million
Shares – at cost 6 720 4 289 11 009 6 594 3 444 10 038 Equity adjustment 4 758 17 077 21 835 3 395 12 311 15 706
Carrying value 11 478 21 366 32 844 9 989 15 755 25 744 Long-term loans – 189 189 – 354 354
11 478 21 555 33 033 9 989 16 109 26 098
Market values of listed investments 28 871 28 871 23 248 23 248
Directors’ valuation of unlisted investments 62 969 62 969 41 564 41 564
Market values and directors’ valuation 28 871 62 969 91 840 23 248 41 564 64 812
Excess of market values and directors’ valuation over the carrying value of investments:
– attributable to equity holders 58 807 38 714 – attributable to minority – –
58 807 38 714
Of the directors’ valuations of unlisted investments stated above, a substantial proportion amounting to R55 283 million (2006: R36 177 million) was based on the stock exchange prices of underlying listed shares held by the unlisted investments concerned.
2007 2006 Reconciliation of carrying value at the beginning and end of the year R million R million
Carrying value at the beginning of the year 26 098 27 860 Exchange rate differences on translation of carrying value at the beginning of the year to year-end rate 4 292 (1 244)
Income of associated companies retained 3 366 910
Share of net attributable profit of associated companies 6 003 4 354 Dividends received from associated companies (2 748) (3 349) Exchange rate differences on translation between average rate to year-end rates 111 (95)
Equity-accounted movements on reserves (824) (240) Loans repaid (165) (196) Disposals/capital reductions (85) (3 050) Investments 201 617 Associated investments reclassified as subsidiary companies – (19) Investments reclassified as associated companies 106 – Medi-Clinic* – 1 460 Other 44 –
Carrying value at the end of the year 33 033 26 098
* Since 1 January 2006, Medi-Clinic has been accounted for as an associated company, while it was consolidated previously.

r e m g ro l i m i t e d | 7 5 | 7 5
n ot e s to t h e a n n ua l f i na n c i a l s tat e m e n ts for the year ended 31 march 2007
7. investments – other (Annexure B) 2007 2006 Listed Unlisted Total Listed Unlisted Total R million R million R million R million R million R million
Consolidated Investments – other Shares – available-for-sale 6 229 16 6 245 4 013 123 4 136
Market values of listed investments 6 229 6 229 4 013 4 013
Directors’ valuation of unlisted investments 16 16 123 123
Market values and directors’ valuation 6 229 16 6 245 4 013 123 4 136
Reconciliation of carrying value of investments available-for-sale 2007 2006 at the beginning and end of the year R million R million
Balances at the beginning of the year 4 136 1 948 Fair value adjustments for the year 2 169 2 216 Additions 48 2 Medi-Clinic* – (13) Sales (2) (7) Investment reclassified as associated company (106) (10)
Balances at the end of the year 6 245 4 136
* Since 1 January 2006, Medi-Clinic has been accounted for as an associated company, while it was consolidated previously.
8. inventories Raw materials 272 249 Finished products 430 319 Work in progress 6 6 Consumable stores 46 46
754 620
the company consolidated 2007 2006 2007 2006 R million R million R million R million
9. debtors And short-term loAns Trading debtors 6 5 916 822 Provision for impairments – – (42) (29) Loans – Subsidiary companies 2 366 2 790 – – Dividends receivable – – 168 – Advance payments and other – – 178 85
2 372 2 795 1 220 878

r e m g ro l i m i t e d7 6 | 7 6 |
n ot e s to t h e a n n ua l f i na n c i a l s tat e m e n tsfor the year ended 31 march 2007
2007 2006 R million R million
10. Assets clAssified As held for sAle On 31 January 2007 Tsb Sugar entered into an agreement to sell certain assets in terms of
a land reform transaction. The effective date of the transaction is 1 April 2007. The assets that will be sold in terms of the agreement are therefore classified as held for sale and valued in terms of the requirements of IFRS 5.
Details of the assets classified as held for sale are as follows:
Assets Property, plant and equipment 140 – Biological agricultural assets 22 – Inventories 1 – Debtors 24 – Various other net assets 2 –
189 –
11. cAsh And cAsh equivAlents Cash at the centre 4 357 5 795 Other operating subsidiaries 647 562
5 004 6 357
At year-end cash and cash equivalents earned interest at effective interest rates that vary between 8.50% and 9.06% (2006: 6.75% and 7.10%) per annum at local financial institutions and between 5.33% and 5.35% (2006: 4.42% and 4.43%) per annum in foreign countries.
12. shAre cApitAl Authorised 512 493 650 ordinary shares of 1 cent each 5.1 5.1 40 506 352 B ordinary shares of 10 cents each 4.1 4.1
9.2 9.2
Issued 448 802 207 (2006: 448 802 207) ordinary shares of 1 cent each 4.5 4.5 35 506 352 (2006: 35 506 352) B ordinary shares of 10 cents each 3.5 3.5
8.0 8.0
Number of Number of shares shares
Movement of the ordinary shares of 1 cent each for the year: Total number of shares issued at 1 April 448 802 207 486 493 650 Shares cancelled – (37 691 443)
Total number of shares issued at 31 March* 448 802 207 448 802 207
* Treasury shares held by wholly owned subsidiary companies included.
Each ordinary share has one vote. Each B ordinary share has ten votes.
Number of shares held in treasury by a wholly owned subsidiary and shares held by The Remgro Share Trust (ordinary shares of 1 cent each): 11 948 372 (2006: 4 473 004 ).
At a general meeting held on 23 August 2006, the unissued shares comprising 63 691 443 ordinary shares of 1 cent each and
5 000 000 B ordinary shares of 10 cents each were placed under the control of the Board of Directors as a general authority in terms of section 221(2) of the Companies Act, 1973 (Act 61 of 1973), as amended (the Act), subject to the provisions of the Act and the Rules and Requirements of the JSE until the next annual general meeting of the Company, for allotment and issue to such persons as they deemed fit, provided that 26 000 000 ordinary shares and 5 000 000 B ordinary shares in the authorised share

r e m g ro l i m i t e d | 7 7 | 7 7
n ot e s to t h e a n n ua l f i na n c i a l s tat e m e n ts for the year ended 31 march 2007
12. shAre cApitAl (continued) capital of the Company are reserved for the purposes of the Remgro Share Scheme in terms of an ordinary resolution passed by
the shareholders on 21 September 2000.
Details in respect of the share scheme and the current year’s offers are disclosed in note 26 and the Report of the Board of Directors.
2007 2006 R million R million
13. reserves 13.1 Composition of reserves The Company: Retained earnings 2 353 2 779
Subsidiary companies and joint ventures 24 653 21 093 Non-distributable reserves Fair value reserve 5 003 3 160 Other non-distributable reserves 1 931 997 Retained earnings 17 719 16 936
Associated companies: Equity reserves 20 155 14 026
47 161 37 898
Statutory non-distributable reserves included in 464 345
Other non-distributable reserves 11 9 Equity reserves 453 336
13.2 Included in the respective reserves above are reserves arising on exchange rate translation
Non- distributable Equity Retained 2007 2006 reserves reserves earnings Total Total R million R million R million R million R million
Balances at 1 April (105) (992) (57) (1 154) 245 Exchange rate adjustments during the year 907 3 594 534 5 035 (1 399) Transfer of equity adjustment 111 (111) – –
Balances at 31 March 802 2 713 366 3 881 (1 154)
2007 2006 R million R million
14. retirement benefits Balance sheet assets Retirement benefits 10 –
Balance sheet obligations Retirement benefits (85) (69) Post-retirement medical benefits (129) (116)
(214) (185)
Income statement Retirement benefits* (95) 4 Post-retirement medical benefits 11 38
(84) 42
* Refer note 24 on page 87.

n ot e s to t h e a n n ua l f i na n c i a l s tat e m e n tsfor the year ended 31 march 2007
r e m g ro l i m i t e d7 8 |
14. retirement benefits (continued) 14.1 Retirement benefits Some of the Company’s subsidiaries have various defined benefit pension funds, defined contribution pension funds and
defined contribution provident funds which are privately administered independent of the finances of the Group. All the funds are governed by the Pension Funds Act, 1956 (as amended). All salaried employees are obliged to accept membership of one of these funds.
For statutory purposes the defined benefit pension funds are actuarially valued every three years by independent actuaries using the projected unit credit method. The latest actuarial valuations of these funds were conducted between 31 March 2002 and 31 December 2004.
Income Balance sheet statement
Present Unrecognised Pension Fair value value of actuarial fund Amount of plan funded (gains)/ surplus recognised in Included assets obligations losses limitation balance sheet in staff costs R million R million R million R million R million R million
Balances at 1 April 2005 629 (527) (55) (124) (77) Current service cost – (4) – – (4) 4 Interest cost – (30) – – (30) 30 Expected return on assets 46 – – – 46 (46) Amortisation of actuarial gains/losses – – 2 – 2 (2) Contributions 7 – – – 7 – Exchange rate differences (24) 29 – – 5 – Benefit payments (28) 28 – – – – Actuarial movements: fund obligation – (129) 129 (18) (18) 18 Actuarial movements: plan assets 92 – (92) – – –
Balances at 31 March 2006 722 (633) (16) (142) (69) 4
Current service cost – (4) – – (4) 4 Interest cost – (40) – – (40) 40 Expected return on assets 53 – – – 53 (53) Surplus limitation utilisation – – – 108 108 (108) Amortisation of actuarial gains/losses – – (22) – (22) 22 Contributions 7 – – – 7 – Transfer of assets (88) – – – (88) – Exchange rate differences 114 (132) (2) – (20) – Benefit payments (31) 31 – – – – Actuarial movements: fund obligation – 11 (11) – – – Actuarial movements: plan assets (6) – 6 – – –
Balances at 31 March 2007 771 (767) (45) (34) (75) (95)

n ot e s to t h e a n n ua l f i na n c i a l s tat e m e n ts for the year ended 31 march 2007
2007 2006 R million R million
r e m g ro l i m i t e d | 7 9
14. retirement benefits (continued) 14.1 Retirement benefits (continued) Amount of plan assets represented by investment in the entity’s own financial instruments 14 17 Actual return on plan assets 47 138 Adjustment for experience on plan assets 5 90 Adjustment for experience on funded obligations 17 74 Expected contributions to retirement funds for the year ended 31 March 2008: R8 million
Number Number Number of members 7 670 7 115
Composition of plan assets % % Cash 6.69 9.16 Equity 20.62 27.59 Bonds 2.73 3.25 Property 0.70 0.96 International 69.26 59.04
100.00 100.00
Principal actuarial assumptions on balance sheet date Discount rate 5.40 – 9.95 5.50 – 8.50 Expected rates of return on plan assets* 6.48 – 9.95 7.50 – 8.50 Future salary increases 5.75 – 7.04 2.75 – 5.50 Future pension increases 2.90 – 4.75 4.50 – 6.50 Inflation rate 4.75 2.75 – 4.50
* The expected return on plan assets is determined with reference to the expected long-term returns on equity, cash and bonds.
Fund history for the current and prior years R million R million
Balances at 31 March Fair value of plan assets 771 722 Present value of funded obligation (767) (633)
Surplus/(deficit) 4 89

r e m g ro l i m i t e d8 0 | 8 0 |
n ot e s to t h e a n n ua l f i na n c i a l s tat e m e n tsfor the year ended 31 march 2007
14. retirement benefits (continued) 14.2 Post-retirement medical benefits
Income Balance sheet statement
Unrecog- Present nised Fair value value of actuarial Amount of plan funded (gains)/ recognised in Included assets obligations losses balance sheet in staff cost
R million R million R million R million R million
Balances at 1 April 2005 – (163) 1 (162) Current service cost – (22) – (22) 22 Interest cost – (18) – (18) 18 Expected return on assets 2 – – 2 (2) Contributions – 5 – 5 – Actuarial movements – 5 (5) – – Acquired in business combination 14 (23) (7) (16) – Medi-Clinic* – 95 – 95 –
Balances at 31 March 2006 16 (121) (11) (116) 38
Current service cost – (3) – (3) 3 Interest cost – (10) – (10) 10 Expected return on assets 2 – – 2 (2) Liability accepted 5 (6) (2) (3) – Amortisation of actuarial gains/losses – (1) 1 – – Benefit payments – 1 – 1 – Actuarial movements 12 (6) (6) – –
Balances at 31 March 2007 35 (146) (18) (129) 11
* Since 1 January 2006, Medi-Clinic has been accounted for as an associated company, while it was consolidated previously. 2007 2006 R million R million
Amount of plan assets represented by investment in the entity’s own financial instruments 2 1 Actual return on plan assets 14 2 Adjustment for experience on plan assets 14 – Adjustment for experience on funded obligations 4 – Expected contributions to retirement funds for the year ended 31 March 2008: R8 million
Number Number Number of members 1 050 1 046
Fund history for the current and prior years R million R million
Balances at 31 March Fair value of plan assets 35 16 Present value of funded obligation (146) (121)
Surplus/(deficit) (111) (105)
Composition of plan assets % % Cash 3.00 3.00 Equity 92.00 92.00 Bonds 5.00 5.00
100.00 100.00

r e m g ro l i m i t e d | 8 1 | 8 1
n ot e s to t h e a n n ua l f i na n c i a l s tat e m e n ts for the year ended 31 march 2007
2007 2006 % %
14. retirement benefits (continued) 14.2 Post-retirement medical benefits (continued) Principal actuarial assumptions on balance sheet date Discount rate 7.50 – 7.75 7.50 Expected rates of return on plan assets * 8.75 8.50 Annual increase in healthcare costs 4.75 – 6.75 5.50 – 6.50
* The expected return on plan assets is determined with reference to the expected long-term returns on equity, cash and bonds.
2007 2007 Increase Decrease R million R million
The effect of a 1% movement in the above-mentioned expected yearly increase in healthcare costs is as follows: Post-retirement medical liability 24 21
Current service costs and interest on obligation 2 1
2007 2006 R million R million
15. long-term loAns Interest-bearing loans Secured long-term loans with effective interest rates of between 9.5% and 11%
(2006: 6.0% and 10.0%) per annum repayable over a period of between five to ten years 197 195 These liabilities are secured by assets with a book value of R68 million
(2006: R46 million). Net liabilities resulting from various capitalised finance leases and instalment sale agreements payable in monthly, quarterly and annual instalments at varying interest rates per annum amount to 1 2 These liabilities are secured by vehicles and equipment with a book value of R1 million (2006: R2 million). Various unsecured loans with varying terms and interest rates – 1
198 198 Instalments payable within one year transferred to short-term interest-bearing loans (37) (29)
161 169
Payable – two to five years 161 169 Payable thereafter – –
161 169
16. short-term loAns Interest-bearing loans Portion of long-term interest-bearing loans payable within one year 37 29 Bank overdrafts 103 18
140 47 Interest-free loans with no fixed repayment conditions 94 54
234 101
Legal disputes* Other** 2007 Legal disputes* Other** 2006 R million R million R million R million R million R million
17. provisions Balances at 1 April 30 11 41 15 6 21 Businesses acquired – – – – 4 4 Additional provisions 13 1 14 21 1 22 Unused amounts – (4) (4) – – –
43 8 51 36 11 47 Provisions utilised during the year (3) – (3) (6) – (6)
Balances at 31 March 40 8 48 30 11 41
* Litigation, of which the timing and outcome is uncertain, is in progress against certain subsidiary companies. ** Various smaller provisions.

r e m g ro l i m i t e d8 2 | 8 2 |
n ot e s to t h e a n n ua l f i na n c i a l s tat e m e n tsfor the year ended 31 march 2007
2007 2006 R million R million
18. profit Profit is stated after taking the following into account: Income Fair value adjustment – biological assets 21 5 Fair value adjustment – investments 113 59 Rental income – investment properties 8 10 Interest received 334 341
Shareholder’s loan to associated company 20 29 Financial institutions and other 314 312
Profit on redemption and sale of investments* 7 3 162 Exchange rate gains 67 –
* Refer to the Report of the Board of Directors for further information.
Expenses Amortisation of trade marks 14 8 Fair value adjustment – investments 6 – Expenses – investment properties 2 2 Rental 37 70
Land and buildings 20 45 Machinery and equipment 10 16 Vehicles 1 3 Office equipment 6 6
Research and development costs written off – 1 Auditors’ remuneration – audit fees 10 10 – other services 3 3 Professional fees 28 22 Depreciation 223 293
Buildings 27 31 Machinery and equipment 167 214 Vehicles 26 23 Office equipment 3 25
Loss on sale of property, plant and equipment 1 2 Exchange rate losses – 23
19. AdministrAtion And mAnAgement fees Total administration and management fees of Remgro Limited* 75 81 Less: Fees received (16) (15)
Intergroup – excluding wholly owned subsidiaries (4) (6) Other (12) (9)
Net 59 66
* After recovery of appropriate portion from VenFin Limited.

r e m g ro l i m i t e d | 8 3 | 8 3
n ot e s to t h e a n n ua l f i na n c i a l s tat e m e n ts for the year ended 31 march 2007
the company consolidated 2007 2006 2007 2006 R million R million R million R million
20. dividend income Included in profit: Listed – – 151 404 Unlisted – Subsidiary companies 3 358 4 191 – Other – – 5 6
3 358 4 191 156 410
Dividends from associated companies set off against investments 2 748 3 349
2007 2006 R million R million
21. tAxAtion 21.1 Taxation in income statement Current 339 841
– current year – South African normal taxation 332 488 – Taxation on capital gain – 350 – Foreign taxation 8 5
340 843 – previous year – South African normal taxation (1) (2)
Secondary taxation on companies 21 27
– current 21 13 – deferred – 14
Deferred – current year 60 (8) – previous year (17) 6
– rate change – (9)
403 857
21.2 Reconciliation of effective tax rate of the Company and its subsidiaries with standard rate % %
Effective tax rate 26.4 16.8 Reduction/(increase) in standard rate as a result of: Exempt dividend income 3.0 2.3 Non-taxable capital profit – 10.6 Other non-taxable income/(expenses) 0.4 0.1 Foreign taxation (0.5) (0.3) Taxation in respect of previous years 1.1 (0.2) Rate change – 0.2 Secondary tax on companies (1.4) (0.5)
Standard rate 29.0 29.0

r e m g ro l i m i t e d8 4 |
n ot e s to t h e a n n ua l f i na n c i a l s tat e m e n tsfor the year ended 31 march 2007
2007 2006 R million R million
21. tAxAtion (continued) 21.3 Deferred taxation Deferred taxation liability 1 205 790
Property, plant and equipment 378 322 Intangibles 16 14 Inventories 84 75 Provisions (44) (67) Biological agricultural assets 34 24 Other (1) 5 Investments (accounted for directly in equity) 738 417
Deferred tax asset (124) (90)
Property, plant and equipment (44) (12) Intangibles – (3) Inventories – (24) Provisions (20) (24) Other (11) (10) Tax losses (49) (17)
Net deferred taxation 1 081 700
The movement between balances of deferred taxation at the beginning and end of the year can be analysed as follows:
Beginning of the year 700 319 As per income statement 43 3 Direct in equity 338 310 Businesses acquired – (3) Medi-Clinic* – 71
1 081 700
* Since 1 January 2006, Medi-Clinic has been accounted for as an associated company, while it was consolidated previously.
No deferred tax is provided on temporary differences relating to investments in subsidiary companies and joint ventures as Remgro controls the dividend policy of these companies and consequently also controls the reversal of the temporary differences.
The carrying values of investments in associated companies are mainly recovered through dividends. As no taxable temporary differences exist, no deferred tax is provided.
Deferred taxation on the fair value adjustments of investments available-for-sale is provided at 14.5%, as there is a possibility that these investments will be realised in the medium term.

r e m g ro l i m i t e d | 8 5
n ot e s to t h e a n n ua l f i na n c i a l s tat e m e n ts for the year ended 31 march 2007
2007 2006 R million R million
21. tAxAtion (continued) 21.4 Tax losses Estimated tax losses available for set-off against future taxable income 245 60 Utilised to create deferred tax asset (168) (60)
77 –
21.5 Secondary taxation on companies (STC) The STC credits on 31 March, which could be set off against future dividend payments, amount to – The Company 172 596 – Subsidiary companies 1 356 1 223
Unutilised STC credits 1 528 1 819
A foreign wholly owned subsidiary company of Remgro has reserves available that will give rise to additional STC credits of R1 538 million (2006: R1 471 million) when declared as dividends to its South African holding company.
Remgro’s history of dividends received compared to ordinary dividends paid suggests increasing STC credits over time. It is therefore unlikely that Remgro’s STC credits will be utilised against ordinary dividends paid in the foreseeable future, and consequently no deferred tax asset has been created for the Company’s unutilised STC credits.
22. equity Adjustment Share of net attributable profit of associated companies – per income statement 6 003 4 354 Minority interest – (6) Share of net profit retained in distributable reserves – (7) Dividends received from associated companies (2 748) (3 349)
Share of net profit retained by associated companies 3 255 992 Exchange rate differences on translation between average rates and year-end rates 111 (95)
Equity adjustment transferred to non-distributable reserves (Refer to statements of changes in equity) 3 366 897
Portion of the share of net profit/(loss) retained by associated companies, that has been accounted for from unaudited interim reports and management accounts 1 102 587
Contingent liabilities of associated companies Guarantees to third parties – Performance guarantees, suretyships and letters of credit of various associated companies 393 371
Contingent tax liabilities 103 108
Product liabilities – British American Tobacco Plc (BAT) has contingent liabilities in respect of litigation regarding product liability, overseas taxation and guarantees in various countries. Despite the quality of defences judged by BAT to be available, BAT is of the opinion that there is a possibility that its results of operations or cash flows could be materially affected by the outcomes of such matters, which could give rise to a consequent effect on Remgro’s share of BAT’s results and attributable net assets.
Claims – There are a number of legal or potential claims against various associated companies, the outcome of which cannot be foreseen, but are not regarded as material individually or on a group basis.

r e m g ro l i m i t e d8 6 |
n ot e s to t h e a n n ua l f i na n c i a l s tat e m e n tsfor the year ended 31 march 2007
consolidated the company 2007 2006 2007 2006 R million R million R million R million
23. cAsh flow informAtion 23.1 Adjustments Depreciation, amortisation of goodwill and trade marks 237 302 – – Movement in provisions (58) 65 – – Interest received (334) (341) – – Finance cost 30 29 – – Dividends received (156) (410) (3 358) (4 191) Capital surplus on the sale of investments (7) (3 161) – – Net impairment of assets – (3) – – Share scheme cost 18 18 – – Negative goodwill (44) – – – Exchange rate gain/(loss) on foreign cash 622 (85) – – Other 1 (2) – –
309 (3 588) (3 358) (4 191)
23.2 Decrease/(increase) in working capital Decrease/(increase) in inventories and biological agricultural assets (180) (139) – – Decrease/(increase) in trade and other receivables (109) (121) (1) (4) Increase/(decrease) in trade and other payables 86 252 3 2 Net movement in derivative instruments 33 (33) – –
(170) (41) 2 (2)
23.3 Reconciliation of dividends received Receivable at the beginning of the year – 129 – – Per income statement 156 410 3 358 4 191 Dividends from associated companies set off against
investments 2 748 3 349 Receivable at the end of the year (168) – – –
Cash received 2 736 3 888 3 358 4 191
23.4 Reconciliation of taxation paid with the amount disclosed in the income statement
Paid in advance at the beginning of the year 67 60 – – Unpaid at the beginning of the year (473) (69) – – Per income statement (360) (854) – –
– normal income (339) (491) – – – capital gain – (350) – – – STC (21) (13) – –
Medi-Clinic – 91 – – Business acquired – (3) – – Unpaid at the end of the year 104 473 – – Paid in advance at the end of the year (14) (67) – –
Cash paid (676) (369) – –
23.5 Reconciliation of dividends paid Per statements of changes in equity (3 748) (4 525) (3 782) (4 860) Paid by subsidiary companies to minority (65) (151)
Cash paid (3 813) (4 676) (3 782) (4 860)

r e m g ro l i m i t e d | 8 7
n ot e s to t h e a n n ua l f i na n c i a l s tat e m e n ts for the year ended 31 march 2007
2007 2006 R million R million
24. stAff costs Salaries and wages 1 254 2 399 Share-based payments 20 18 Retirement benefits 1 9 Pension costs – defined contribution 79 111 Pension costs – defined benefit (95) 4 Other post-retirement benefits 11 38 Other 36 24
1 306 2 603
25. directors’ emoluments 2007 2006 Non- Non- Executive executive Total Executive executive Total R’000 R’000 R’000 R’000 R’000 R’000
Executive directors Fees 615 615 560 560 Salaries 11 472 11 472 9 843 9 843 Retirement fund contributions 2 411 2 411 2 183 2 183 Other benefits 1 238 1 238 1 236 1 236
Subtotal 15 736 15 736 13 822 13 822 Non-executive directors Independent 801 801 862 862 Non-independent 4 217 4 217 3 390 3 390
Total 15 736 5 018 20 754 13 822 4 252 18 074
Increase in value – Remgro
Share Scheme* 5 607 – 5 607 58 153 4 151 62 304
* Refer note 26.1 on page 89. 2007 2006 Salaries Salaries Fees and other Total Fees and other Total R’000 R’000 R’000 R’000 R’000 R’000
Paid by: The Company 801 801 862 862 Management company 492 8 735 9 227 1 008 16 204 17 212 Subsidiary company 553 10 173 10 726 – – –
1 846 18 908 20 754 1 870 16 204 18 074

r e m g ro l i m i t e d8 8 |
n ot e s to t h e a n n ua l f i na n c i a l s tat e m e n tsfor the year ended 31 march 2007
25. directors’ emoluments (continued) 2007 2006 Retire- Retire- ment Other ment Other Fees Salaries fund benefits(9) Total Fees Salaries fund benefits(9) Total R’000 R’000 R’000 R’000 R’000 R’000 R’000 R’000 R’000 R’000
Executive W E Bührmann 123 1 272 276 219 1 890 112 1 183 256 218 1 769 D M Falck 123 1 884 403 316 2 726 112 1 657 361 316 2 446 J A Preller 123 864 196 219 1 402 112 803 181 218 1 314 M H Visser(1) 123 6 224 1 268 265 7 880 112 5 084 1 142 266 6 604 T van Wyk 123 1 228 268 219 1 838 112 1 116 243 218 1 689
Subtotal 615 11 472 2 411 1 238 15 736 560 9 843 2 183 1 236 13 822
Non-executive (independent) G D de Jager(2) 160 160 112 112 P K Harris 147 147 134 134 E Molobi(3) – – 112 112 J F Mouton(4) 99 99 168 168 D Prins 198 198 168 168 M Ramos (Miss)(5) – – – – F Robertson 197 197 168 168
Subtotal 801 801 862 862
Non-executive (non-independent) P E Beyers(6a) 123 645 155 100 1 023 112 369 93 37 611 J W Dreyer(6a) 123 1 328 287 100 1 838 112 567 135 50 864 E de la H Hertzog(6b) 123 916 183 73 1 295 112 859 170 72 1 213 J Malherbe(7) 61 – – – 61 – – – – – J P Rupert(8) – – – – – 112 420 115 55 702
Subtotal 430 2 889 625 273 4 217 448 2 215 513 214 3 390
Total 1 846 14 361 3 036 1 511 20 754 1 870 12 058 2 696 1 450 18 074 1. Mr M H Visser earns in addition to the above a director’s fee of GBP75 000 (2006: GBP60 000) per annum from British
American Tobacco Plc, an associated company. 2. Mr G D de Jager was a member of the Audit and Risk Committee as well as the Remuneration and Nomination Committee for
six months. 3. Mr E Molobi passed away on 4 June 2006. 4. Mr J F Mouton retired as an independent non-executive director on 11 October 2006. He was a member of the Audit and Risk
Committee as well as the Remuneration and Nomination Committee for six months. 5. Miss M Ramos was appointed as an independent non-executive director on 26 March 2007. 6. (a) For the 2006 financial year the amounts presented only amount to 50% of total remuneration as these personnel also served as
directors of VenFin Limited. (b) These amounts represent 33.3% of the total emoluments paid. The other 66.7% is recovered from Medi-Clinic for services as
director of Medi-Clinic. 7. Mr J Malherbe was appointed as a non-executive director on 11 October 2006. 8. Mr J P Rupert receives no emoluments since 30 September 2005. 9. Benefits include medical aid contributions and vehicle benefits.

r e m g ro l i m i t e d | 8 9
n ot e s to t h e a n n ua l f i na n c i a l s tat e m e n ts for the year ended 31 march 2007
26. shAre-bAsed pAyments 26.1 Remgro Share Scheme The share-based payments that are accounted for in the financial statements are in respect of the Remgro Share Scheme
(the “Scheme”) and consist of ordinary shares in Remgro Limited that were offered to participants in terms of the Scheme. The offers are valid for one year from the offer date. The Scheme is a deferred purchase scheme and payment takes place in three equal instalments, the first of which is payable three years after the offer date. Participants have no rights to delivery, voting or ordinary dividends on shares before payment has been made. Participants may choose to pay on a later date, with the resultant deferment of rights. Payment relating to offers before 26 November 2004 must be settled within ten years, while offers thereafter must be settled before seven years have passed.
The valuation of the Scheme was performed using an actuarial model. This model was developed by an independent third party from the standard binomial option pricing model in order to address the unique nature of the Scheme, especially with regard to early exercise of offers.
The expected contract lifetimes are estimated by considering separately each of the tranches within that grant. The risk-free rate was estimated by using the implied yield on a SA zero-coupon government bond and the yield curve over the expected contract lifetimes of five, six and seven years from the offer date.
Share price volatility of ordinary shares in Remgro Limited was determined with reference to movements in the share price since 1 October 2000, that being the date from which Remgro commenced trading on the JSE.
Dividend yield was calculated using the two-year moving average dividend yield at each offer date. 2007 2006 R’ 000 R’000
Fair value of offers made during the year 53 353 2 681 Share-based payment cost included in the income statement (in accordance with IFRS 2) 10 275 8 067 – Portion attributable to directors 6 651 5 657
Although the Group elected, in accordance with the transitional provisions of IFRS, to only apply IFRS 2 on transactions entered into after 7 November 2002 that had not vested at 1 January 2005, the following information relates to all offers to the participants of the Scheme.
Number of weighted average exercise prices of all share offers to participants of the Scheme:
2007 2006 Number Number of shares Rand of shares Rand
Previous financial years 3 093 691 59.24 4 375 782 54.26 Offered and accepted in current financial year 569 699 135.02 29 079 114.75 Shares paid for and delivered (262 016) 49.52 (1 308 790) 43.80 Resignations and other (4 380) 98.67 (2 380) 68.02
Total at 31 March 3 396 994 72.65 3 093 691 59.24
Exercisable at the end of the period 1 797 087 48.46 1 804 454 46.38

r e m g ro l i m i t e d9 0 |
n ot e s to t h e a n n ua l f i na n c i a l s tat e m e n tsfor the year ended 31 march 2007
26. shAre-bAsed pAyments (continued) 26.1 Remgro Share Scheme (continued) Exercise price range of all offers: 2007 2006 Weighted Weighted Weighted Weighted average average average average Number remaining exercise Number remaining exercise of shares contract price of shares contract price outstanding lifetime per share outstanding lifetime per share at year-end in years (Rand) at year-end in years (Rand)
R40 – R60 1 464 972 3.57 44.98 1 677 301 4.58 45.07 R60 – R80 678 927 6.16 64.67 729 469 7.16 64.75 R80 – R100 656 615 5.13 86.82 658 205 6.14 86.81 R100 – R120 28 430 5.67 114.93 28 716 6.67 115.02 > R120 568 050 6.24 135.01 – – – The following assumptions were used in the binomial model to value offers: 2007 2006
Weighted average Remgro share price for the year (R) 150.20 116.98 Exercise price (R) 132.60 – 137.80 93.80 – 124.00 Average expected exercise period (years) 5 – 7 5 – 7 Price volatility (%) 20.05 – 20.18 19.9 – 21.3 Risk-free rate (%) 7.1 – 8.6 7.1 – 8.3 Expected dividend yield (%) 2.9 – 3.1 3.2 – 3.7 Current status – offers to directors – ordinary shares Share price Balance Balance Date of on date of of shares of shares Shares Number payment payment accepted accepted as at accepted Date of Offer of shares and and Increase as at 31 March during acceptance price paid and delivery delivery in value* 31 March Participant 2006 the year of shares (Rand) delivered of shares (Rand) (R’000) 2007
Executive W E Bührmann 97 872 87.86 97 872 7 303 26/06/06 135.00 7 303 D M Falck 458 716 43.60 458 716 104 917 63.00 104 917 30 050 87.86 30 050 92 988 26/06/06 135.00 92 988 J A Preller 24 466 43.60 24 466 34 572 87.86 34 572 30 167 26/06/06 135.00 30 167 M H Visser 278 979 63.00 278 979 342 488 87.86 342 488 172 681 26/06/06 135.00 172 681 T van Wyk 24 464 43.60 24 464 02/08/06 143.50 2 444.0 33 195 48.20 33 195 02/08/06 143.50 3 163.4 42 161 87.86 42 161 41 598 26/06/06 135.00 41 598
Subtotal 1 471 880 344 737 57 659 5 607.4 1 758 958
Non-executive P E Beyers 191 130 43.60 191 130 J W Dreyer 191 130 43.60 191 130 J P Rupert 414 938 48.20 414 938
Subtotal 797 198 797 198
Total 2 269 078 344 737 57 659 5 607.4 2 556 156
* It refers to the increase in value of the scheme shares of the indicated participants from the offer date to the date of payment and delivery.
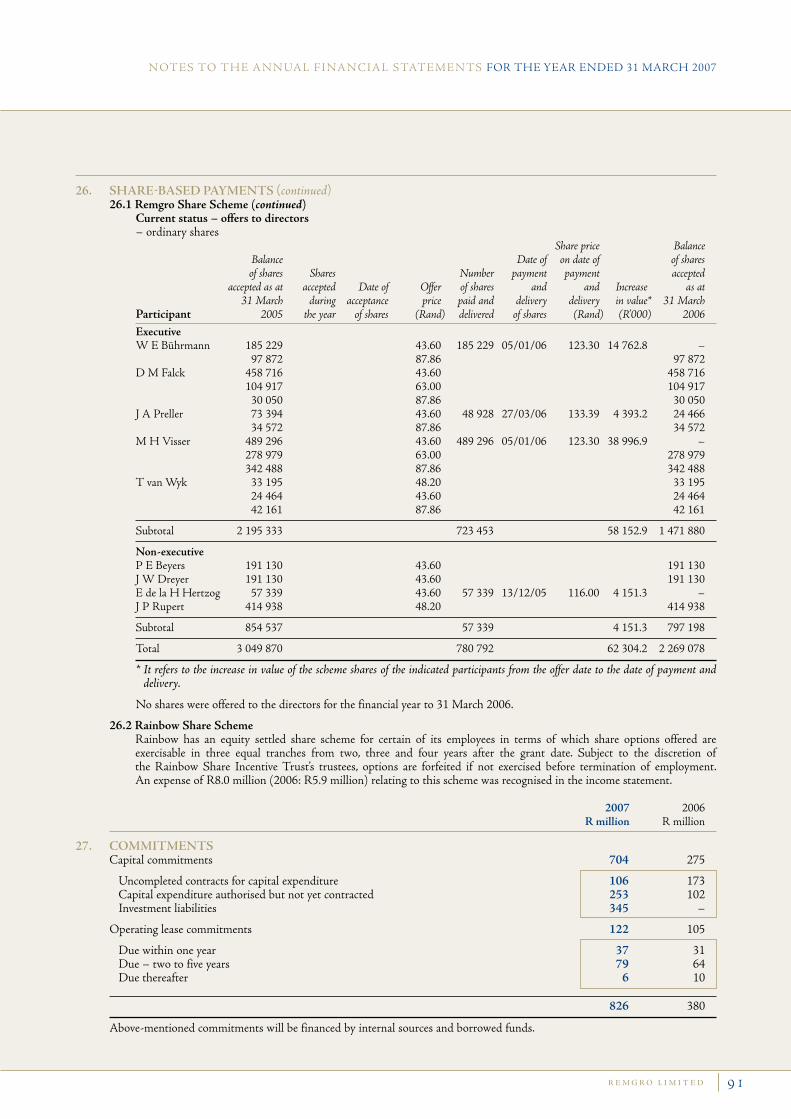
r e m g ro l i m i t e d | 9 1
n ot e s to t h e a n n ua l f i na n c i a l s tat e m e n ts for the year ended 31 march 2007
26. shAre-bAsed pAyments (continued) 26.1 Remgro Share Scheme (continued) Current status – offers to directors – ordinary shares Share price Balance Balance Date of on date of of shares of shares Shares Number payment payment accepted accepted as at accepted Date of Offer of shares and and Increase as at 31 March during acceptance price paid and delivery delivery in value* 31 March Participant 2005 the year of shares (Rand) delivered of shares (Rand) (R’000) 2006 Executive W E Bührmann 185 229 43.60 185 229 05/01/06 123.30 14 762.8 – 97 872 87.86 97 872 D M Falck 458 716 43.60 458 716 104 917 63.00 104 917 30 050 87.86 30 050 J A Preller 73 394 43.60 48 928 27/03/06 133.39 4 393.2 24 466 34 572 87.86 34 572 M H Visser 489 296 43.60 489 296 05/01/06 123.30 38 996.9 – 278 979 63.00 278 979 342 488 87.86 342 488 T van Wyk 33 195 48.20 33 195 24 464 43.60 24 464 42 161 87.86 42 161
Subtotal 2 195 333 723 453 58 152.9 1 471 880
Non-executive P E Beyers 191 130 43.60 191 130 J W Dreyer 191 130 43.60 191 130 E de la H Hertzog 57 339 43.60 57 339 13/12/05 116.00 4 151.3 – J P Rupert 414 938 48.20 414 938
Subtotal 854 537 57 339 4 151.3 797 198
Total 3 049 870 780 792 62 304.2 2 269 078
* It refers to the increase in value of the scheme shares of the indicated participants from the offer date to the date of payment and delivery.
No shares were offered to the directors for the financial year to 31 March 2006.
26.2 Rainbow Share Scheme Rainbow has an equity settled share scheme for certain of its employees in terms of which share options offered are
exercisable in three equal tranches from two, three and four years after the grant date. Subject to the discretion of the Rainbow Share Incentive Trust’s trustees, options are forfeited if not exercised before termination of employment. An expense of R8.0 million (2006: R5.9 million) relating to this scheme was recognised in the income statement.
2007 2006 R million R million
27. commitments Capital commitments 704 275
Uncompleted contracts for capital expenditure 106 173 Capital expenditure authorised but not yet contracted 253 102 Investment liabilities 345 –
Operating lease commitments 122 105
Due within one year 37 31 Due – two to five years 79 64 Due thereafter 6 10
826 380
Above-mentioned commitments will be financed by internal sources and borrowed funds.

r e m g ro l i m i t e d9 2 |
n ot e s to t h e a n n ua l f i na n c i a l s tat e m e n tsfor the year ended 31 march 2007
28. borrowing powers There are no limitations on the borrowing powers of the Company and its subsidiaries in respect of loans and guaranteed debts.
29. finAnciAl instruments 29.1 Financial instruments and risk management Various financial risks have an impact on the financial statements: Market risk (including price and foreign exchange risk),
credit risk, liquidity risk and interest rate risk. The Company and its subsidiary companies’ risk management programmes, of which key aspects are explained below, acknowledge the unpredictability of financial markets and are aimed to minimise any negative effect thereof. Derivative instruments are used to hedge against certain financial risk exposures.
Financial instruments on the balance sheet include investments, loans receivable, debtors, cash, creditors, long-term loans and derivative instruments. Details of the nature, extent and terms of these instruments are explained in the notes to the relevant items. Relevant financial risks and programmes that limit these risks are summarised as follows:
Market risk Price risk Exposure to share price risk is due to investments in listed and unlisted shares. “Investments available-for-sale” consists
mainly of the investment in Impala Platinum Holdings Limited that is included at market value under “Investments – Other” in the balance sheet. The executive committee monitors all investments continuously and makes recommendations to the Board of Directors in this regard.
Price risk due to movements in commodity prices of certain key raw materials affects operating subsidiary companies in the sugar, aluminium and chicken industries. These risks are limited by using preferred supplier agreements and commodity option and futures contracts.
Foreign exchange risk The Company and its subsidiary companies operate internationally and are therefore exposed to foreign currency risk due
to commercial transactions denominated in foreign currencies. These risks are limited using foreign exchange contracts when deemed necessary.
Net assets of investments in foreign operations are exposed to foreign exchange translation risk. The most prominent of these is the investment in Remgro Investments Limited, Jersey, that owns the stake in R&R. At year-end the carrying value of the investment in R&R was £1 188 million (2006: £1 159 million) and it also had cash amounting to £219 million (2006: £162 million) abroad.
Credit risk At year-end no significant “Loans receivable” were outstanding. No significant concentration of credit risk existed regarding
debtors as customers are spread over a wide geographical area. Policies and procedures are in place ensuring that sales occur only to customers with an acceptable credit history.
Derivative instrument and cash transactions are limited to financial institutions with good credit ratings. The treasury committee approves these institutions and determines limits for credit exposure in each entity.
Liquidity risk The Company and its subsidiary companies have substantial cash balances at their disposal and minimum long-term debt
that limit their liquidity risk. Nevertheless it is ensured that adequate credit facilities are available to maintain flexibility in the funding of transactions.
Interest rate risk Due to significant cash investments, movements in market interest rates influence income. The profile of the cash and cash
equivalents is explained in note 11.
The Company and its subsidiary companies are also exposed to interest rate risk due to long-term debt. The interest profile of the liabilities is disclosed in note 15.

r e m g ro l i m i t e d | 9 3
n ot e s to t h e a n n ua l f i na n c i a l s tat e m e n ts for the year ended 31 march 2007
29. finAnciAl instruments (continued) 29.2 The following material derivative instruments existed at 31 March: 2007 2006 Currency Forward Fair Currency Forward Fair value value value value value value Assets million R million R million million R million R million
Foreign exchange contracts Buy: USA dollar (USD) 1.3 8.7 2.6 12.0 74.2 1.6 Sell: USA dollar (USD) 20.5 154.4 3.1 7.3 46.9 1.2
5.7 2.8 Other derivative instruments Sugar selling contracts 9.7 24.7 Maize option contracts 0.3 1.6 Maize purchase contracts – 16.6
10.0 42.9
15.7 45.7
Liabilities
Foreign exchange contracts Buy: British pound (GBP) – – – 0.8 8.7 0.3 USA dollar (USD) – – – 1.7 10.6 0.3 Other 0.1 0.8 – 9.2 3.8 0.2 Sell: USA dollar (USD) 3.7 27.7 0.4 12.3 75.5 1.1
0.4 1.9 Other derivative instruments Sugar selling contracts 9.3 26.6 Maize option contracts 16.9 –
26.2 26.6
26.6 28.5
29.3 Fair value On 31 March 2007 and 2006 the fair value of financial instruments approximates their carrying value.
The following methods and assumptions are used to determine the fair value of each class of financial instruments:
Financial instruments available-for-sale: Fair value is based on available market information or, in the case of unlisted instruments, appropriate valuation methodologies.
Cash and cash equivalents, debtors, creditors and short-term loans: Due to the expected short-term maturity of these financial instruments their carrying values approximate fair value.
Borrowings: The fair value of long-term borrowings is based on discounted cash flows using the effective interest rate method. As the interest rates of long-term borrowings are all market related their carrying values approximate fair value.
Derivative instruments: The fair value of derivative instruments is determined by using mark-to-market valuations.
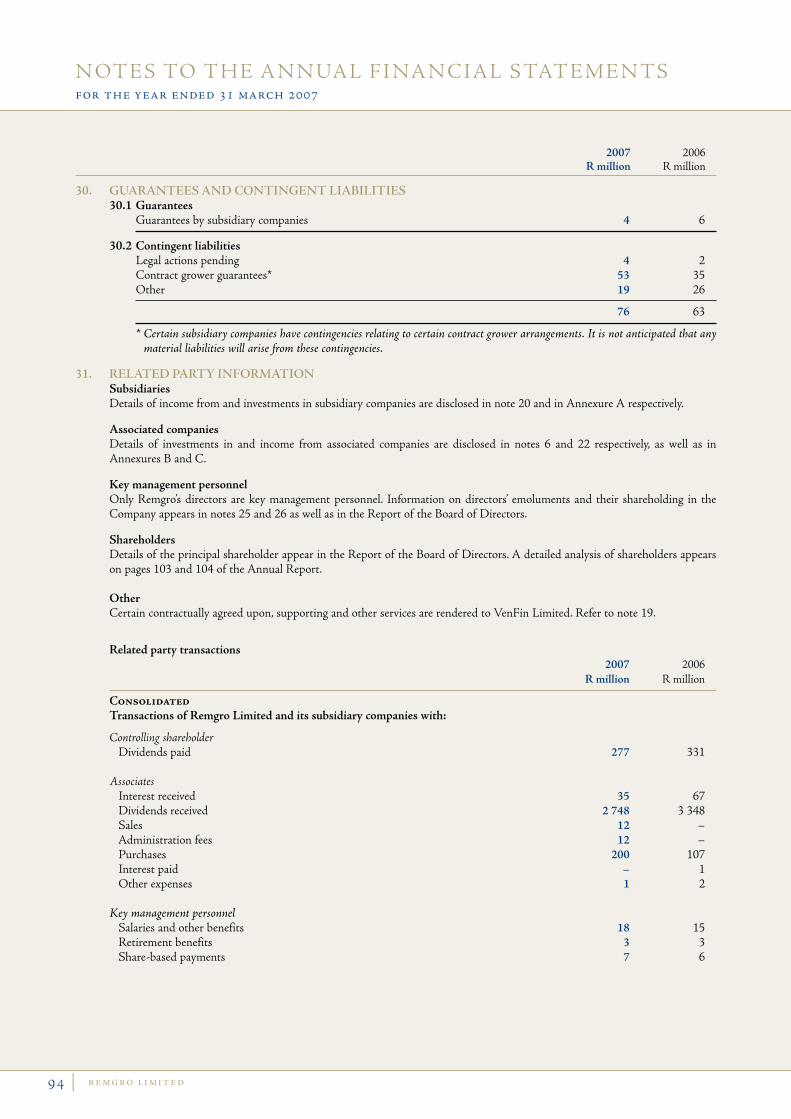
n ot e s to t h e a n n ua l f i na n c i a l s tat e m e n tsfor the year ended 31 march 2007
2007 2006 R million R million
r e m g ro l i m i t e d9 4 |
30. guArAntees And contingent liAbilities 30.1 Guarantees Guarantees by subsidiary companies 4 6
30.2 Contingent liabilities Legal actions pending 4 2 Contract grower guarantees* 53 35 Other 19 26
76 63
* Certain subsidiary companies have contingencies relating to certain contract grower arrangements. It is not anticipated that any material liabilities will arise from these contingencies.
31. relAted pArty informAtion Subsidiaries Details of income from and investments in subsidiary companies are disclosed in note 20 and in Annexure A respectively.
Associated companies Details of investments in and income from associated companies are disclosed in notes 6 and 22 respectively, as well as in
Annexures B and C.
Key management personnel Only Remgro’s directors are key management personnel. Information on directors’ emoluments and their shareholding in the
Company appears in notes 25 and 26 as well as in the Report of the Board of Directors.
Shareholders Details of the principal shareholder appear in the Report of the Board of Directors. A detailed analysis of shareholders appears
on pages 103 and 104 of the Annual Report.
Other Certain contractually agreed upon, supporting and other services are rendered to VenFin Limited. Refer to note 19.
Related party transactions 2007 2006 R million R million
Consolidated Transactions of Remgro Limited and its subsidiary companies with:
Controlling shareholder Dividends paid 277 331 Associates Interest received 35 67 Dividends received 2 748 3 348 Sales 12 – Administration fees 12 – Purchases 200 107 Interest paid – 1 Other expenses 1 2
Key management personnel Salaries and other benefits 18 15 Retirement benefits 3 3 Share-based payments 7 6

n ot e s to t h e a n n ua l f i na n c i a l s tat e m e n ts for the year ended 31 march 2007
2007 2006 R million R million
r e m g ro l i m i t e d | 9 5
31. relAted pArty informAtion (continued) Consolidated (continued) Transactions of Remgro Limited and its subsidiary companies with (continued):
Other Fees received from VenFin Limited 21 –
Balances due from/(to) related parties Associated companies (13) (49)
The Company Transactions of Remgro Limited with:
Subsidiary companies Dividends received 3 358 4 191 Administration fees received 4 4 Share capital reacquired – (4 535)
Balances due from/(to) related parties Subsidiary companies 2 366 2 790
No security is given for any outstanding balances. No provisions for bad debts against outstanding balances with related parties have been made and no bad debt of related parties has been written off during the year.
2007 R million
32. businesses Acquired During the year under review, a subsidiary company in the Group acquired a business.
The assets and liabilities arising from this acquisition were as follows:
Net assets acquired 4 Goodwill (note 5) 7
Cash paid 11 Cash acquired from business 3
Net cash flow on acquisition of business 14
The business was acquired on 1 April 2006 and the revenue and net profit included in the results of the Group, amount to
R38 million and R2 million respectively.

r e m g ro l i m i t e d9 6 |
a n n e x u r e aprincipal subsidiary companies at 31 march 2007
Tobacco interestsRemgro International Holdings (Pty) Limited 2 100.0 100.0 2 2 Remgro Investments Limited – Jersey (GBP) 1 314 000 100.0 100.0
Financial servicesFinancial Securities Limited 250 000 100.0 100.0 250 000 250 000
Industrial interestsIndustrial Partnership Investments Limited 125 000 100.0 100.0 125 000 125 000 Robertsons Holdings (Pty) Limited 1 000 100.0 100.0 Tsb Sugar Holdings (Pty) Limited 100 100.0 100.0 Rainbow Chicken Limited * 127 285 000 61.4 61.9Wispeco Holdings Limited 5 000 000 100.0 100.0
Mining interestsPartnership in Mining Limited 100 100.0 100.0 100 100 Tegniese Mynbeleggings Limited 2 100.0 100.0
Corporate finance and other interestsEikenlust (Pty) Limited 100 100.0 100.0 Entek Investments Limited 810 630 64.5 64.0 Historical Homes of South Africa Limited 555 000 51.4 51.4 M&I Group Services Limited # 100 100.0 100.0 70 –Remgro Finance Corporation Limited 300 100.0 100.0 Remgro Investments (Pty) Limited 4 100.0 100.0 Remgro Loan Corporation Limited 700 100.0 100.0 2 296 1 878Remgro South Africa (Pty) Limited 48 614 100.0 100.0 96 506 96 506 – 912Stellenryck Trust Limited 700 100.0 100.0 TTR Holdings (Pty) Limited 7 100.0 100.0 7 7
2 366 2 790
(GBP) British pound* Listed company # Previously named Remgro Finance and Services Limited
Details of sundry subsidiary companies which are not material to the evaluation of the business of the Group, are not shown.
name of company Issued Effective held by company capital interest Shares LoanIncorporated in South Africa R (unless other- 2007 2006 2007 2006 2007 2006unless otherwise stated wise stated) % % R R R million R million

r e m g ro l i m i t e d | 9 7 r e m g ro l i m i t e d | 9 7
a n n e x u r e bprincipal investments at 31 march 2007
Tobacco interests R&R Holdings SA – Luxembourg (1)– ordinary shares 316 000 33.3 316 000 33.3– debentures 682 291 38.7 682 291 38.7– participating securities (2005) 19 281 686 100.0 19 281 686 100.0– participating securities (2006) 1 33.3 1 33.3– held by R&R Holdings SA:
– BAT Plc – UK (29%) (1) 10.4 10.2
Financial servicesRMB Holdings Limited (2) 280 946 517 23.7 274 109 670 23.1 – held by RMB Holdings Limited:
– FirstRand Limited (33%) 7.8 7.6
FirstRand Limited (2) 481 142 375 9.3 481 142 375 9.4
Industrial interestsAir Products South Africa (Pty) Limited (1) 4 500 000 50.0 4 500 000 50.0Dorbyl Limited (1) 14 058 346 41.4 14 058 346 41.4 Kagiso Trust Investments (Pty) Limited *(2) 10 344 41.8 10 344 41.8Medi-Clinic Corporation Limited (1) 171 128 418 47.6 170 988 418 48.0Nampak Limited (1) 78 096 694 13.4 78 096 694 13.5Unilever Bestfoods Robertsons (Holdings) Limited L.L.C. – USA (1) 8 200 41.0 8 200 41.0Total South Africa (Pty) Limited *(2) 12 872 450 33.2 12 872 450 33.2Remgro-KWV Beleggings Limited (2) 50 50.0 50 50.0 – held by Remgro-KWV
Beleggings Limited:
– Distell Group Limited (59%) 29.4 29.7
Mining interests Impala Platinum Holdings Limited ** 26 687 288 4.2 3 335 911 5.0Trans Hex Group Limited (1) 30 215 000 33.6 30 215 000 33.6
Other interestsBusiness Partners Limited *(3) 35 766 919 21.3 28 696 220 17.8
Financial period accounted for:(1) Twelve months to 31 March 2007 (2) Twelve months to 31 December 2006(3) Accounted for as an associated company from 31 March 2007
* Effective interest, on a fully diluted basis: – Total South Africa (Pty) Limited 24.9% – Kagiso Trust Investments (Pty) Limited 37.1% – Business Partners Limited 20.0% (2006: 16.0%) ** Not an associated company – the increase in shareholding is a result of the subdivision of shares in the ratio of 8:1
UK – United Kingdom USA – United States of America
Details of investments which are not material to the evaluation of the business of the Group, are not shown.
name of company listed unlisted 2007 2006 2007 2006 Effective Effective Effective EffectiveIncorporated in South Africa Shares interest Shares interest Shares interest Shares interestunless otherwise stated held % held % held % held %

r e m g ro l i m i t e d9 8 |
a n n e x u r e csignificant associated companies – additional information
Effective interest 23.7% 9.3% 47.6% 33⅓%
R million R million R million R million
Carrying value of investments 4 054 4 539 987 17 047
Share of retained equity income – Current year 403 552 197 4 015
Normal income 715 813 280 2 964 Dividends (345) (354) (91) (1 405) Impairments, capital and non-recurring items 86 101 – (190) Other changes in reserves and exchange rates (53) (8) 8 2 646
– Cumulative 1 453 1 654 878 14 350
Summarised financial information: Per Per Per Per Interim Report Interim Report Annual Report Annual Report 31/12/2006 31/12/2006 31/03/2007 31/03/2007
Note 1Balance sheetAssetsNet advances, loans and bank-related securities 1 257 50 804 – – Intangible assets 10 4 261 419 107 242 Property, plant and equipment and other 100 941 3 124 31 659 Investments and loans 13 703 17 894 46 38 760 Net current assets/(liabilities) – (21 875) 356 13 456
15 070 52 025 3 945 191 117
Equity and liabilitiesShareholders’ funds and long-term debt 15 070 52 025 3 945 191 117
12 months 12 months 12 months 12 months ended ended ended ended 31/12/2006 31/12/2006 31/03/2007 31/03/2007
Note 2Income statementHeadline earnings 3 155 9 048 581 8 190 Net profit for the year 3 524 10 126 582 7 653 Dividends paid 1 347 3 267 178 3 964
There are no loans to these associated companies.
Note 1: In the audited balance sheet of R&R, its interest in British American Tobacco Plc (BAT) is only shown as a single item representing the carrying value thereof as an equity accounted associated company. So as to disclose more meaningful information, BAT’s abridged balance sheet is presented above instead. This balance sheet is at 31 December 2006 as BAT has not included a balance sheet in its quarterly report to 31 March 2007.
Note 2: Headline earnings and net profit for the year relate to the income statement of R&R which includes its share of the net profit of BAT.
Note 3: The investments above represent 81% of the total carrying value of associated companies.
RMB Holdings FirstRand Medi-Clinic R&R (Financial (Financial (Industrial (Tobacco services) services) interests) interests) 2007 2007 2007 2007
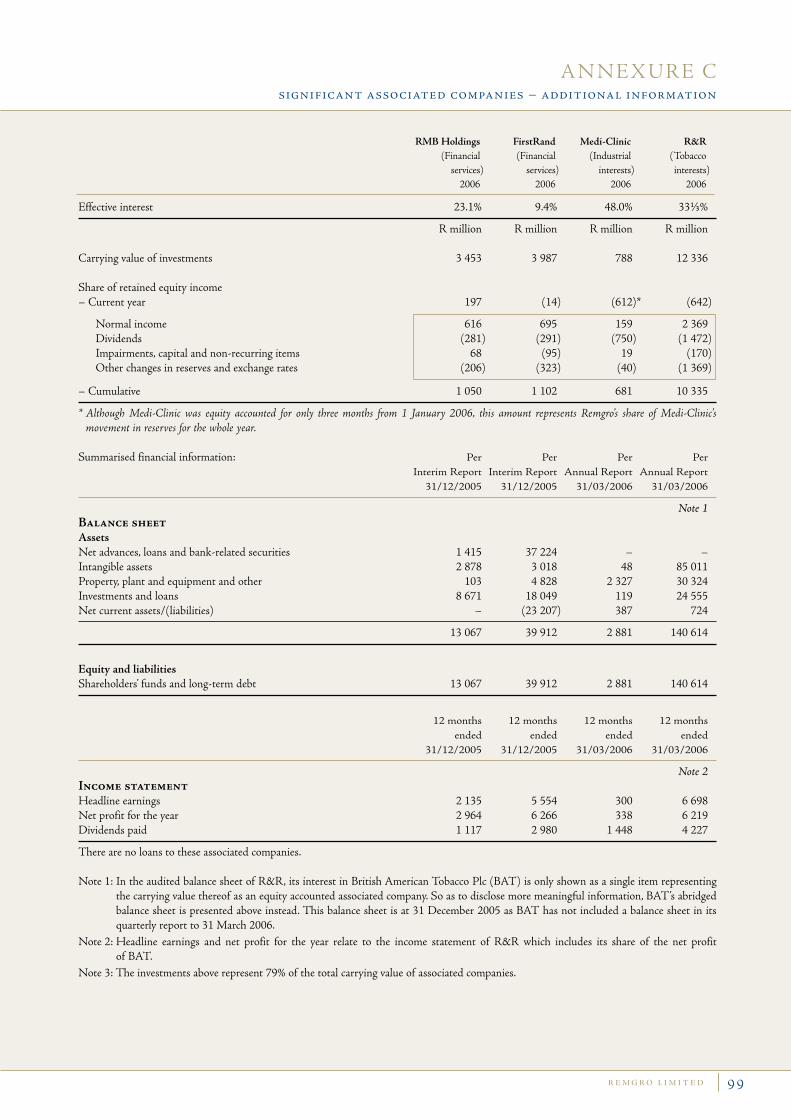
r e m g ro l i m i t e d | 9 9
Effective interest 23.1% 9.4% 48.0% 33⅓%
R million R million R million R million
Carrying value of investments 3 453 3 987 788 12 336
Share of retained equity income – Current year 197 (14) (612)* (642)
Normal income 616 695 159 2 369 Dividends (281) (291) (750) (1 472) Impairments, capital and non-recurring items 68 (95) 19 (170) Other changes in reserves and exchange rates (206) (323) (40) (1 369)
– Cumulative 1 050 1 102 681 10 335
* Although Medi-Clinic was equity accounted for only three months from 1 January 2006, this amount represents Remgro’s share of Medi-Clinic’s movement in reserves for the whole year.
Summarised financial information: Per Per Per Per Interim Report Interim Report Annual Report Annual Report 31/12/2005 31/12/2005 31/03/2006 31/03/2006
Note 1Balance sheetAssetsNet advances, loans and bank-related securities 1 415 37 224 – – Intangible assets 2 878 3 018 48 85 011 Property, plant and equipment and other 103 4 828 2 327 30 324 Investments and loans 8 671 18 049 119 24 555 Net current assets/(liabilities) – (23 207) 387 724
13 067 39 912 2 881 140 614
Equity and liabilitiesShareholders’ funds and long-term debt 13 067 39 912 2 881 140 614
12 months 12 months 12 months 12 months ended ended ended ended 31/12/2005 31/12/2005 31/03/2006 31/03/2006
Note 2Income statementHeadline earnings 2 135 5 554 300 6 698 Net profit for the year 2 964 6 266 338 6 219 Dividends paid 1 117 2 980 1 448 4 227
There are no loans to these associated companies.
Note 1: In the audited balance sheet of R&R, its interest in British American Tobacco Plc (BAT) is only shown as a single item representing the carrying value thereof as an equity accounted associated company. So as to disclose more meaningful information, BAT’s abridged balance sheet is presented above instead. This balance sheet is at 31 December 2005 as BAT has not included a balance sheet in its quarterly report to 31 March 2006.
Note 2: Headline earnings and net profit for the year relate to the income statement of R&R which includes its share of the net profit of BAT.
Note 3: The investments above represent 79% of the total carrying value of associated companies.
RMB Holdings FirstRand Medi-Clinic R&R (Financial (Financial (Industrial (Tobacco services) services) interests) interests) 2006 2006 2006 2006
a n n e x u r e csignificant associated companies – additional information

r e m g ro l i m i t e d1 0 0 |
a n n e x u r e dinformation on business and geographical segments for the year ended 31 march 2007
business segment AnAlysisSales – – 7 877 – – 7 877
Results Subsidiary companies 218 1 969 147 171 1 506 Associated companies 2 774 1 716 1 499 14 – 6 003
7 509Finance costs (30)Profit on sale of investments and negative goodwill 51
Profit before tax 7 530Taxation (403)
Net profit 7 127
Attributable to:Equity holders 6 942Minority interests 185
7 127
Headline earnings 2 964 1 529 1 924 155 281 6 853
other informAtionSegment assets 3 139 – 5 849 6 085 1 617 16 690Investments in associated companies 17 047 8 593 6 782 316 295 33 033
49 723Taxation – Deferred 124 – Current 14
Consolidated total assets 49 861
Segment liabilities 3 – 1 982 – 140 2 125Taxation – Deferred 1 205 – Current 104
Consolidated total liabilities 3 434
Additions to property, plant and equipment and intangible assets – – 474 – 65 539Depreciation and amortisation – – 229 – 8 237
The interests of the Group have been classified into five main operating divisions/business segments – tobacco interests, financial services, industrial interests, mining interests and corporate finance/other interests. Each segment represents the main business sector of the investments classified thereunder. No adjustment has been made where companies are mainly active in one sector but have also interests in other sectors.
Income and expenses, as well as the attributable portion of the income from associated companies, are directly attributable to the segment.
Segment assets mainly include cash and cash equivalents, debtors and short-term loans, inventories, property, plant and equipment, intangible assets and other investments. Investments in associated companies, accounted for on the equity method, are stated separately.
Segment liabilities include all operating liabilities, except for taxation.
geogrAphicAl segmentAl AnAlysisThe Group’s interests can be divided into two main geographical areas, namely South Africa and abroad. Capital Headline Total expenditure Sales earnings assetsR million 2007 2007 2007 2007
South Africa 539 7 877 3 795 29 537Abroad – – 3 058 20 186
539 7 877 6 853 49 723
Total assets include assets and investments in associated companies, but exclude deferred tax assets and taxation paid in advance.
Corporate consoli- finance dated Tobacco Financial Industrial Mining and other 2007R million interests services interests interests interests Total

r e m g ro l i m i t e d | 1 0 1
business segment AnAlysisSales – – 9 802 – – 9 802
Results Subsidiary companies – 123 1 423 168 256 1 970 Associated companies 2 199 1 284 911 (40) – 4 354
6 324Finance costs (29)Profit on redemption and sale of investments 3 162
Profit before tax 9 457Taxation (857)
Net profit 8 600
Attributable to:Equity holders 8 202Minority interests 398
8 600
Headline earnings 2 369 1 147 1 184 288 96 5 084
other informAtionSegment assets 1 730 – 5 062 3 886 4 403 15 081Investments in associated companies 12 336 7 442 6 013 307 – 26 098
41 179Taxation – Deferred 90 – Current 67
Consolidated total assets 41 336
Segment liabilities 3 – 1 781 110 89 1 983Taxation – Deferred 790 – Current 473
Consolidated total liabilities 3 246
Additions to property, plant and equipment and intangible assets – – 667 – 23 690Depreciation and amortisation – – 293 – 8 301Impairments – – (3) – – (3)
The interests of the Group have been classified into five main operating divisions/business segments – tobacco interests, financial services, industrial interests, mining interests and corporate finance/other interests. Each segment represents the main business sector of the investments classified thereunder. No adjustment has been made where companies are mainly active in one sector but have also interests in other sectors.
Income and expenses, as well as the attributable portion of the income from associated companies, are directly attributable to the segment.
Segment assets mainly include cash and cash equivalents, debtors and short-term loans, inventories, property, plant and equipment, intangible assets and other investments. Investments in associated companies, accounted for on the equity method, are stated separately.
Segment liabilities include all operating liabilities, except for taxation.
geogrAphicAl segmentAl AnAlysisThe Group’s interests can be divided into two main geographical areas, namely South Africa and abroad. Capital Headline Total expenditure Sales earnings assetsR million 2006 2006 2006 2006
South Africa 690 9 802 2 693 27 113Abroad – – 2 391 14 066
690 9 802 5 084 41 179
Total assets include assets and investments in associated companies, but exclude deferred tax assets and taxation paid in advance.
Corporate consoli- finance dated Tobacco Financial Industrial Mining and other 2006R million interests services interests interests interests Total
a n n e x u r e dinformation on business and geographical segments for the year ended 31 march 2006

c o m pa n y i n f o r m at i o n
secretAryM Lubbe (Mrs)
business Address And registered officeCarpe Diem Office ParkQuantum StreetTechno ParkStellenbosch7600
PO Box 456Stellenbosch7599
trAnsfer secretAriesComputershare Investor Services 2004 (Pty) Limited70 Marshall Street Johannesburg2001
PO Box 61051Marshalltown2107
AuditorsPricewaterhouseCoopers Inc.Cape Town
listingJSE LimitedSector: Industrials – Diversified Industrials
AmericAn depositAry receipt (Adr) progrAmCusip number 75956M107ADR to ordinary share 1:1
Depositary:The Bank of New York101 Barclay StreetNew York, NY 10286
sponsorRand Merchant Bank (A division of FirstRand Bank Limited)
websitewww.remgro.com
s h a r e h o l d e r s ’ i n f o r m at i o ndates of importance to shareholders
Financial year-end 31 MarchAnnual general meeting Wednesday, 22 August 2007
Financial reportsAnnouncement of interim results NovemberInterim report December Announcement of annual results JuneAnnual financial statements July
DividendsInterim dividend– declared November– paid JanuaryFinal dividend– declared June– paid August
Final dividend number 14Ordinary dividend per share 281 centsLast day to trade in order to participate in the final dividend Friday, 10 August 2007 Trading on or after this date will be ex the final dividend Monday, 13 August 2007 Record date Friday, 17 August 2007 Payment date Monday, 20 August 2007
r e m g ro l i m i t e d1 0 2 |

mAjor beneficiAl shAreholdersOrdinary sharesPublic Investment Commissioner 15.68 70 376 263 13.36 59 954 389Old Mutual Life Assurance Company SA 5.47 24 558 168 6.05 27 164 496Other 78.85 353 867 776 80.59 361 683 322
100.00 448 802 207 100.00 448 802 207B ordinary sharesRembrandt Trust (Pty) Limited 100.00 35 506 352 100.00 35 506 352
Total 484 308 559 484 308 559
No other shareholder held a beneficial interest of more than 5% in the ordinary shares in your Company on 31 March.
2007 2006 Number of Number of % shares % shares
distribution of shAreholders Ordinary sharesPublic shareholders 28 728 30 929 27 321 25 600
Percentage of shareholders 99.90 99.92 99.91 99.91 Number of shares 432 253 223 440 740 885 448 808 224 462 478 974 Percentage of shares issued 96.31 98.20 92.25 95.06
Non-public shareholders Directors and their associates/Share Trust/Treasury shares 29 26 24 24
Percentage of shareholders 0.10 0.08 0.09 0.09 Number of shares 16 548 984 8 061 322 37 685 426 24 014 676 Percentage of shares issued 3.69 1.80 7.75 4.94
Number of shareholders 28 757 30 955 27 345 25 624
2007 2006 2005 2004
s h a r e h o l d e r s ’ i n f o r m at i o nstatistics at 31 march 2007
r e m g ro l i m i t e d | 1 0 3

r e m g ro l i m i t e d1 0 4 |
s h a r e h o l d e r s ’ i n f o r m at i o nstatistics at 31 march 2007
2007 2006 2005 2004
number of shAres in issue– Ordinary shares of 1 cent each 448 802 207 448 802 207 486 493 650 486 493 650
Issued at 1 April 448 802 207 486 493 650 486 493 650 486 493 650 Cancelled during the year – (37 691 443) – –
– Unlisted B ordinary shares of 10 cents each 35 506 352 35 506 352 35 506 352 35 506 352
Total number of shares in issue 484 308 559 484 308 559 522 000 002 522 000 002Number of shares held in treasury (11 948 372) (4 473 004) (34 903 000) (20 678 689)
Ordinary shares repurchased and held in treasury (8 554 019) (1 379 635) (30 521 841) (16 442 602)Ordinary shares purchased by The Remgro Share Trust and accounted for as treasury shares (3 394 353) (3 093 369) (4 381 159) (4 236 087)
472 360 187 479 835 555 487 097 002 501 321 313
Weighted number of shares 474 123 689 483 154 691 497 292 403 503 280 054
Institutional and private shareholding in Remgro Limited ordinary shares
Institutional and private shareholding in Remgro Limited ordinary shares
additional information (2007)
additional information (2006)
Private 17%
Institutional 83%
Private 16%
Institutional 84%
Overseas and local shareholding in Remgro Limited ordinary shares
Overseas 13%
South Africa 87%
Overseas and local shareholding in Remgro Limited ordinary shares
Overseas 13%
South Africa 87%

r e m g ro l i m i t e d | 1 0 5
s h a r e h o l d e r s ’ i n f o r m at i o n statistics at 31 march 2007
31 March 2007
P E Beyers 70 024 – 13 000 – 83 024W E Bührmann 223 256 – – – 223 256G D de Jager 38 740 – 108 300 – 147 040D M Falck 200 – 18 133 – 18 333P K Harris – – 169 118 – 169 118E de la H Hertzog 228 245 – 1 671 903 4 484 1 904 632J Malherbe 26 826 – 207 799 – 234 625J A Preller 75 069 – – – 75 069F Robertson – – 5 000 – 5 000J P Rupert – – – 270 001 270 001T van Wyk 117 585 – – – 117 585M H Visser – – 715 145 – 715 145
779 945 – 2 908 398 274 485 3 962 828
31 March 2006
P E Beyers 60 024 – 12 500 – 72 524W E Bührmann 223 256 – – – 223 256G D de Jager 38 740 – 108 300 – 147 040D M Falck 200 – 18 133 – 18 333P K Harris – – 57 118 – 57 118E de la H Hertzog 228 245 – 1 671 903 4 484 1 904 632E Molobi 174 – – – 174J F Mouton – – 20 000 – 20 000J A Preller 75 069 – – – 75 069F Robertson – – 1 000 – 1 000J P Rupert – – – 270 001 270 001T van Wyk 59 926 – – – 59 926M H Visser – – 733 945 – 733 945
685 634 – 2 622 899 274 485 3 583 018
B ordinary sharesMr J P Rupert is a director of Rembrandt Trust (Pty) Limited which owns all the issued unlisted B ordinary shares.
Since the end of the financial year to the date of this report the interests of directors remained unchanged.
Interests of the directors in the issued capital of the CompanyOrdinary shares Direct Indirect Non- Non- Beneficial beneficial Beneficial beneficial Total

r e m g ro l i m i t e d1 0 6 |
n ot i c e to s h a r e h o l d e r s
The 2007 Annual General Meeting of the Company will be held on Wednesday, 22 August 2007, at 15:30 in Magnifica 2 & 3, Protea Hotel Stellenbosch, Techno Avenue, Techno Park, Stellenbosch, 7600, to, if approved, pass the following ordinary and special resolutions with or without modification:
1. ApprovAl of AnnuAl finAnciAl stAtements Ordinary Resolution Number 1 Resolved that the audited annual financial statements of the Company and the Group for the year ended 31 March 2007 be accepted
and approved.
2. ApprovAl of directors’ remunerAtion Ordinary Resolution Number 2 Resolved that directors’ fees for services rendered as directors during the past financial year, be fixed at R1 846 000.
3. election of director Ordinary Resolution Number 3 Resolved that Mr P E Beyers who retires in terms of article 31.1.1 of the Company’s Articles of Association and who has offered
himself for re-election, be re-elected as a director of the Company.
4. election of director Ordinary Resolution Number 4 Resolved that Mr W E Bührmann who retires in terms of article 31.1.1 of the Company’s Articles of Association and who has offered
himself for re-election, be re-elected as a director of the Company.
5. election of director Ordinary Resolution Number 5 Resolved that Mr P K Harris who retires in terms of article 31.1.1 of the Company’s Articles of Association and who has offered
himself for re-election, be re-elected as a director of the Company.
6. election of director Ordinary Resolution Number 6 Resolved that Mr J Malherbe who retires in terms of article 31.4.1.1 of the Company’s Articles of Association and who has offered
himself for re-election, be re-elected as a director of the Company.
7. election of director Ordinary Resolution Number 7 Resolved that Mr M M Morobe who retires in terms of article 31.4.1.1 of the Company’s Articles of Association and who has offered
himself for re-election, be re-elected as a director of the Company.
8. election of director Ordinary Resolution Number 8 Resolved that Mr D Prins who retires in terms of article 31.1.1 of the Company’s Articles of Association and who has offered himself
for re-election, be re-elected as a director of the Company.
9. election of director Ordinary Resolution Number 9 Resolved that Miss M Ramos who retires in terms of article 31.4.1.1 of the Company’s Articles of Association and who has offered
herself for re-election, be re-elected as a director of the Company.

r e m g ro l i m i t e d | 1 0 7
n ot i c e to s h a r e h o l d e r s
10. election of director Ordinary Resolution Number 10 Resolved that Mr M H Visser who retires in terms of article 31.1.1 of the Company’s Articles of Association and who has offered
himself for re-election, be re-elected as a director of the Company.
Biographical details of all directors of the Company are set out on pages 10 and 11 of the Annual Report.
11. Authority to plAce shAres under the control of the directors Ordinary Resolution Number 11 Resolved that the entire authorised but unissued share capital of the Company, comprising 63 691 443 ordinary shares of one cent
each and 5 000 000 B ordinary shares of ten cents each, be and are hereby placed under the control of the Board of Directors of the Company as a general authority in terms of section 221(2) of the Companies Act (Act 61 of 1973), as amended, (“the Companies Act”) for allotment and issue to such persons as they deem fit, provided that 26 000 000 ordinary shares and 5 000 000 B ordinary shares in the authorised share capital of the Company are reserved for the purposes of the Remgro Share Scheme in terms of an ordinary resolution passed by the shareholders on 21 September 2000.
This general authority is subject to the provisions of the Companies Act, the Articles of Association of the Company and the Listings Requirements of the JSE Limited (“the Listings Requirements”) and will be valid until the next annual general meeting.
12. Authority to repurchAse shAres Special Resolution Number 1 Resolved that the Board of Directors of the Company be hereby authorised, by way of a renewable general authority, to approve the
purchase of its own shares by the Company, or to approve the purchase of ordinary shares in the Company by any subsidiary of the Company, provided that:
• this general authority shall be valid until the Company’s next annual general meeting or for 15 months from the date of this resolution, whichever period is shorter;
• the ordinary shares be purchased through the order book of the JSE trading system and done without any prior understanding or arrangement between the Company and/or the relevant subsidiary and the counterparty, provided that if the Company purchases its own shares from any wholly owned subsidiary of the Company for the purposes of cancelling such treasury shares pursuant to this general authority, the above provisions will not be applicable to such purchase transaction;
• an announcement complying with paragraph 11.27 of the Listings Requirements be published by the Company (i) when the Company and/or its subsidiaries cumulatively repurchased 3% of the ordinary shares in issue as at the time when the general authority was given (“the initial number”) and (ii) for each 3% in the aggregate of the initial number of the ordinary shares acquired thereafter by the Company and/or its subsidiaries;
• the repurchase by the Company of its own ordinary shares shall not in the aggregate in any one financial year exceed 20% of the Company’s issued share capital of that class, provided that the acquisition of ordinary shares as treasury stock by a subsidiary of the Company shall not exceed 10% in the aggregate of the number of issued shares of the Company;
• repurchases must not be made at a price more than 10% above the weighted average of the market value of the ordinary shares for the five business days immediately preceding the date on which the transaction is effected;
• at any point in time the Company may only appoint one agent to effect any repurchase on the Company’s behalf or on behalf of any subsidiary of the Company;
• the Company will after a repurchase of shares still comply with the provisions of the Listings Requirements regarding shareholder spread;
• the Company and the Group will not repurchase ordinary shares during a prohibited period (as defined in the Listings Requirements); and
• such repurchases will be subject to the Companies Act, the Company’s Articles of Association and the Listings Requirements.
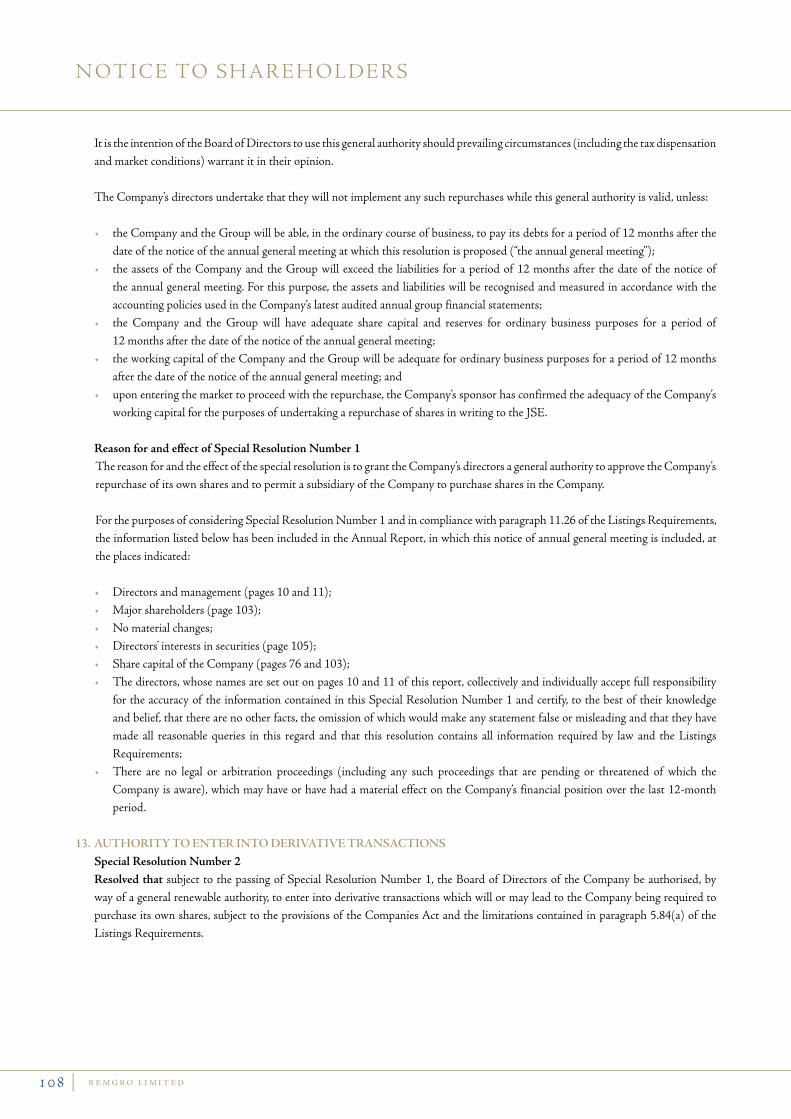
r e m g ro l i m i t e d1 0 8 |
It is the intention of the Board of Directors to use this general authority should prevailing circumstances (including the tax dispensation and market conditions) warrant it in their opinion.
The Company’s directors undertake that they will not implement any such repurchases while this general authority is valid, unless:
• the Company and the Group will be able, in the ordinary course of business, to pay its debts for a period of 12 months after the date of the notice of the annual general meeting at which this resolution is proposed (“the annual general meeting”);
• the assets of the Company and the Group will exceed the liabilities for a period of 12 months after the date of the notice of the annual general meeting. For this purpose, the assets and liabilities will be recognised and measured in accordance with the accounting policies used in the Company’s latest audited annual group financial statements;
• the Company and the Group will have adequate share capital and reserves for ordinary business purposes for a period of 12 months after the date of the notice of the annual general meeting;
• the working capital of the Company and the Group will be adequate for ordinary business purposes for a period of 12 months after the date of the notice of the annual general meeting; and
• upon entering the market to proceed with the repurchase, the Company’s sponsor has confirmed the adequacy of the Company’s working capital for the purposes of undertaking a repurchase of shares in writing to the JSE.
Reason for and effect of Special Resolution Number 1 The reason for and the effect of the special resolution is to grant the Company’s directors a general authority to approve the Company’s
repurchase of its own shares and to permit a subsidiary of the Company to purchase shares in the Company.
For the purposes of considering Special Resolution Number 1 and in compliance with paragraph 11.26 of the Listings Requirements, the information listed below has been included in the Annual Report, in which this notice of annual general meeting is included, at the places indicated:
• Directors and management (pages 10 and 11); • Major shareholders (page 103); • No material changes; • Directors’ interests in securities (page 105); • Share capital of the Company (pages 76 and 103); • The directors, whose names are set out on pages 10 and 11 of this report, collectively and individually accept full responsibility
for the accuracy of the information contained in this Special Resolution Number 1 and certify, to the best of their knowledge and belief, that there are no other facts, the omission of which would make any statement false or misleading and that they have made all reasonable queries in this regard and that this resolution contains all information required by law and the Listings Requirements;
• There are no legal or arbitration proceedings (including any such proceedings that are pending or threatened of which the Company is aware), which may have or have had a material effect on the Company’s financial position over the last 12-month period.
13. Authority to enter into derivAtive trAnsActions Special Resolution Number 2 Resolved that subject to the passing of Special Resolution Number 1, the Board of Directors of the Company be authorised, by
way of a general renewable authority, to enter into derivative transactions which will or may lead to the Company being required to purchase its own shares, subject to the provisions of the Companies Act and the limitations contained in paragraph 5.84(a) of the Listings Requirements.
n ot i c e to s h a r e h o l d e r s

r e m g ro l i m i t e d | 1 0 9
Reason for and effect of Special Resolution Number 2 The reason for and the effect of the special resolution is to grant the Company’s directors a general authority to, subject to the
provisions of the Companies Act and the Listings Requirements, enter into derivative transactions which will or may lead to the Company being required to purchase its own shares.
And to transact any other business that may be transacted at an annual general meeting.
Members who have not dematerialised their shares or who have dematerialised their shares with “own name” registration are entitled to attend and vote at the meeting and are entitled to appoint a proxy or proxies (for which purpose a form of proxy is attached hereto) to attend, speak and vote in their stead. The person so appointed as proxy need not be a member of the Company. Proxy forms must be lodged with the transfer secretaries of the Company, Computershare Investor Services 2004 (Pty) Limited, 70 Marshall Street, Johannesburg, 2001, South Africa, or posted to the transfer secretaries at PO Box 61051, Marshalltown, 2107, South Africa, to be received by them not later than Monday, 20 August 2007, at 15:30 (South African time).
Proxy forms must only be completed by members who have not dematerialised their shares or who have dematerialised their shares with “own name” registration.
On a show of hands, every member of the Company present in person or represented by proxy shall have one vote only. On a poll, every member of the Company shall have one vote for every share held in the Company by such member.
Members who have dematerialised their shares, other than those members who have dematerialised their shares with “own name” registration, should contact their Central Securities Depository Participant (“CSDP”) or broker in the manner and time stipulated in their agreement:
• to furnish them with their voting instructions; or• in the event that they wish to attend the meeting, to obtain the necessary authority to do so.
By order of the Board of Directors.
M Lubbe Secretary
Stellenbosch18 June 2007
n ot i c e to s h a r e h o l d e r s

r e m g ro l i m i t e d1 1 0 |
e x p l a nato ry n ot e s to t h e n ot i c e to s h a r e h o l d e r s
ordinAry resolutionsOrdinary Resolution Number 1Approval of annual financial statementsIn terms of the Companies Act (Act 61 of 1973), as amended (“the Companies Act”), the directors are obliged to present the annual financial statements and Group annual financial statements to the members at the annual general meeting for consideration.
Ordinary Resolution Number 2Approval of directors’ remunerationIn terms of the Company’s Articles of Association, the remuneration payable to the directors must be determined at the Company’s annual general meeting.
Ordinary Resolutions Numbers 3 to 10Election of directorsIn terms of the Company’s Articles of Association, one-third of the directors, or if their number is not a multiple of three, then the number nearest to but not less than one-third are required to retire at each annual general meeting. A person appointed by the directors shall retire at the following annual general meeting and shall not form part of the one-third of directors who are required to retire by rotation. Directors may offer themselves for re-election. Biographical details of all the directors of the Company are set out on pages 10 and 11 of the annual report.
Ordinary Resolution Number 11Authority to place shares under control of the directorsIn terms of the Companies Act, the directors shall not have the power to allot or issue shares of the Company without approval of the members of the Company. The existing authority is due to expire at the forthcoming annual general meeting, unless it is renewed. Shareholders are reminded that 26 000 000 ordinary shares and 5 000 000 B ordinary shares are reserved for the Remgro Share Scheme in terms of a shareholders’ resolution passed on 21 September 2000.
speciAl resolutionsSpecial Resolution Number 1Authority to repurchase sharesThe annual renewal of this authority is required in terms of the Companies Act and the Listings Requirements of the JSE Limited (“the Listings Requirements”). The existing authority to the directors is due to expire at the forthcoming annual general meeting, unless renewed.
Special Resolution Number 2Authority to enter into derivative transactionsThe general authority is given to the directors to enable them to, subject to the provisions of the Companies Act and the Listings Requirements, enter into derivative transactions, which may or will lead to the Company being required to purchase its own shares.
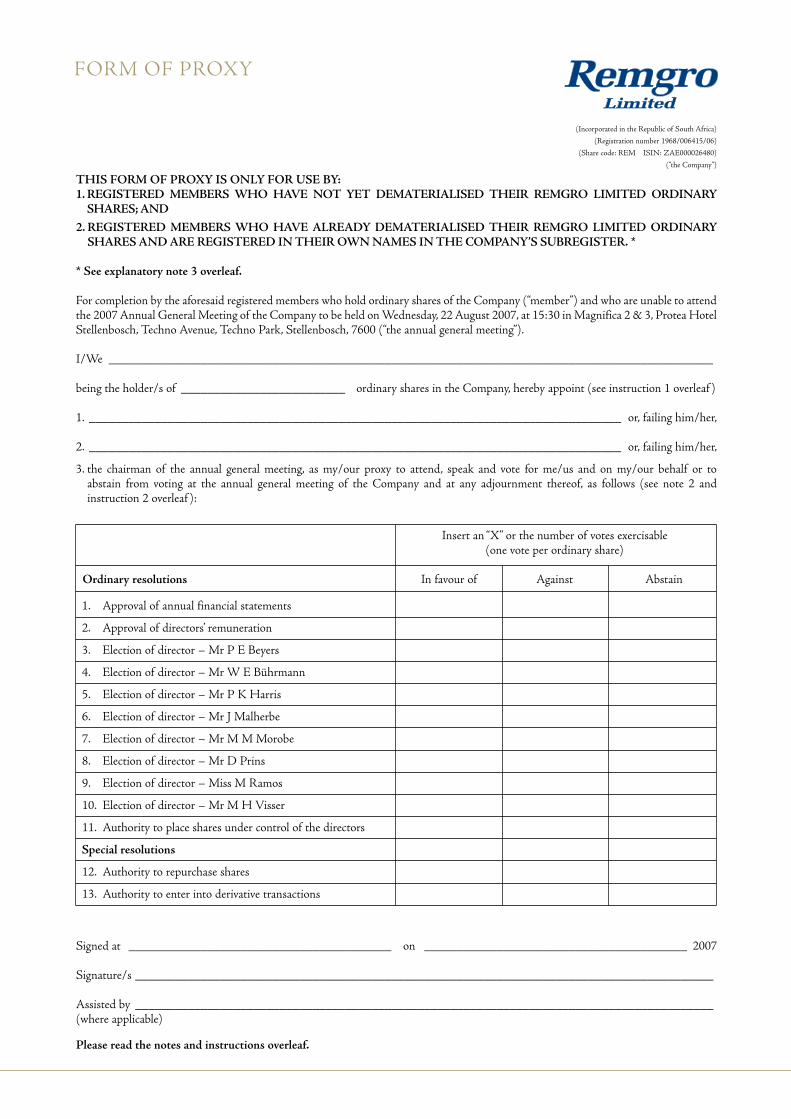
THIS FORM OF PROXY IS ONLY FOR USE BY:1. REGISTERED MEMBERS WHO HAVE NOT YET DEMATERIALISED THEIR REMGRO LIMITED ORDINARY
SHARES; AND2. REGISTERED MEMBERS WHO HAVE ALREADY DEMATERIALISED THEIR REMGRO LIMITED ORDINARY
SHARES AND ARE REGISTERED IN THEIR OWN NAMES IN THE COMPANY’S SUBREGISTER. *
* See explanatory note 3 overleaf.
For completion by the aforesaid registered members who hold ordinary shares of the Company (“member”) and who are unable to attend the 2007 Annual General Meeting of the Company to be held on Wednesday, 22 August 2007, at 15:30 in Magnifica 2 & 3, Protea Hotel Stellenbosch, Techno Avenue, Techno Park, Stellenbosch, 7600 (“the annual general meeting”).
I/We ____________________________________________________________________________________________
being the holder/s of _________________________ ordinary shares in the Company, hereby appoint (see instruction 1 overleaf )
1. _________________________________________________________________________________ or, failing him/her,
2. _________________________________________________________________________________ or, failing him/her,
3. the chairman of the annual general meeting, as my/our proxy to attend, speak and vote for me/us and on my/our behalf or to abstain from voting at the annual general meeting of the Company and at any adjournment thereof, as follows (see note 2 and instruction 2 overleaf ):
Insert an “X” or the number of votes exercisable (one vote per ordinary share)
Ordinary resolutions In favour of Against Abstain
1. Approval of annual financial statements
2. Approval of directors’ remuneration
3. Election of director – Mr P E Beyers
4. Election of director – Mr W E Bührmann
5. Election of director – Mr P K Harris
6. Election of director – Mr J Malherbe
7. Election of director – Mr M M Morobe
8. Election of director – Mr D Prins
9. Election of director – Miss M Ramos
10. Election of director – Mr M H Visser
11. Authority to place shares under control of the directors
Special resolutions
12. Authority to repurchase shares
13. Authority to enter into derivative transactions
Signed at ________________________________________ on ________________________________________ 2007
Signature/s ________________________________________________________________________________________
Assisted by ________________________________________________________________________________________(where applicable)
Please read the notes and instructions overleaf.
form of proxy
(Incorporated in the Republic of South Africa)
(Registration number 1968/006415/06)
(Share code: REM ISIN: ZAE000026480)
(“the Company”)

notes1. A member entitled to attend and vote at the annual general meeting is entitled to appoint one or more proxies to attend, speak and
vote in his/her stead. A proxy need not be a registered member of the Company.2. Every member present in person or by proxy and entitled to vote at the annual general meeting of the Company shall, on a show
of hands, have one vote only, irrespective of the number of shares such member holds. In the event of a poll, every member shall be entitled to that proportion of the total votes in the Company which the aggregate amount of the nominal value of the shares held by such member bears to the aggregate amount of the nominal value of all the shares issued by the Company.
3. Members registered in their own name are members who elected not to participate in the Issuer-Sponsored Nominee Programme and who appointed Computershare Limited as their Central Securities Depository Participant (“CSDP”) with the express instruction that their uncertificated shares are to be registered in the electronic subregister of members in their own names.
instructions on signing And lodging the form of proxy: 1. A member may insert the name of a proxy or the names of two alternative proxies of the member’s choice in the space/s provided
overleaf, with or without deleting “the chairman of the annual general meeting”, but any such deletion must be initialled by the member. Should this space/s be left blank, the proxy will be exercised by the chairman of the annual general meeting. The person whose name appears first on the form of proxy and who is present at the annual general meeting will be entitled to act as proxy to the exclusion of those whose names follow.
2. A member’s voting instructions to the proxy must be indicated by the insertion of an “X”, or the number of votes exercisable by that member, in the appropriate spaces provided overleaf. Failure to do so will be deemed to authorise the proxy to vote or to abstain from voting at the annual general meeting as he/she thinks fit in respect of all the member’s exercisable votes. A member or his/her proxy is not obliged to use all the votes exercisable by him/her or by his/her proxy, but the total number of votes cast, or those in respect of which abstention is recorded, may not exceed the total number of votes exercisable by the member or by his/her proxy.
3. A minor must be assisted by his/her parent or guardian unless the relevant documents establishing his/her legal capacity are produced or have been registered by the transfer secretaries.
4. To be valid, the completed forms of proxy must be lodged with the transfer secretaries of the Company, Computershare Investor Services 2004 (Pty) Limited at 70 Marshall Street, Johannesburg, 2001, South Africa, or posted to the transfer secretaries at PO Box 61051, Marshalltown, 2107, South Africa, to be received by them not later than Monday, 20 August 2007, at 15:30 (South African time).
5. Documentary evidence establishing the authority of a person signing this form of proxy in a representative capacity must be attached to this form of proxy unless previously recorded by the transfer secretaries or waived by the chairman of the annual general meeting.
6. The completion and lodging of this form of proxy will not preclude the relevant member from attending the annual general meeting and speaking and voting in person thereat to the exclusion of any proxy appointed in terms hereof, should such member wish to do so.
7. The completion of any blank spaces overleaf need not be initialled. Any alterations or corrections to this form of proxy must be initialled by the signatory/ies.
8. The chairman of the annual general meeting may accept any form of proxy which is completed other than in accordance with these instructions provided that he is satisfied as to the manner in which a member wishes to vote.

COMPRESSPB3376