Embed Size (px)
Citation preview

Annual report 2007


Core competences & core activities
Draka’s core competences are the development, production and sale of cable. Since the Company’s inception 98 years ago, it has
responded to the ever changing customer needs. Draka’s current portfolio includes:
Cable material Semi-manufactures (copper drawing, compounding, optical fiber production)
Cable products Cable as final product
Cable systems/concepts Cable as part of a system/project, kit concept and/or turnkey project
As a global manufacturer of wire and cable, Draka is able to offer unique competences in materials development, production technology,
marketing and logistics. Draka’s product portfolio covers all mechanical, electrical and environmental requirements. These varied require-
ments have led to an outstanding range of customised products and established Draka’s name as a specialist for challenging applications.
Strategic & financial goals
Draka has committed itself to achieve the following strategic and
financial goals in the medium term:
• Increasing the scale in the special-purpose cable segment within
the cable market, through organic growth and acquisitions.
• Geographical increase in scale, through organic growth and
acquisitions; particularly in regions like Asia, Eastern Europe,
North America and emerging markets.
• Increasing the revenues in the aforementioned special-
purpose cable segments and geographical regions to about
60% of total revenues (2007: approximately 47%).
• Organic strengthening of Draka’s existing position in
continental Europe.
• Capitalising on Draka’s improved sales and marketing position:
value creation by benefiting from market opportunities and
responding to customer requirements at an early stage.
• Extension of Draka’s current range of products and services by
expanding the core activities and continuing to invest in new
technologies and application engineering.
• Continuing the optimisation of the organisation, which may
include disposing of non-core activities and reorganisations.
• Ongoing improvement in profitability through a combination of
organic growth, acquisitions and cost-reduction programmes.
Despite a good spread of activities over the different customer
groups, Draka’s profitability in any given year is determined
partly by economic developments at that time. Draka does not
therefore set itself a given medium-term target, but expects an
average operating margin over the economic cycle (of 6–7
years) of around 5% of revenue.
• Regular maintenance and replacement investments in intangible
assets, property, plant and equipment will equal amortisation
and depreciation. In line with Draka’s strategic principles,
investments in growth markets (special-purpose cable segment
and emerging markets) may result in a total investment level
which exceeds the depreciation level in a particular year.
• Healthy interest coverage, implying an EBITDA/interest ratio
of more than 4.5 (2007: 4.3).
• Stabilisation of the operating working capital at 16-18% of
revenues (2007: 16.1%).
Core values
2007 saw a concerted effort by Draka’s staff to define and
communicate the business values for the entire organisation and
the publication of a comprehensively revised Code of Conduct.
The Code embodies the Company’s core values of respect, integrity,
responsibility and discipline which form Draka’s personality. It also
sets out in detail the high standards we demand of all our staff and
the principles of ethical conduct with which they are required to
comply with in all cases.
Respect• For the individual
• For our customers, suppliers and colleagues
• For our neighbourhood and the environment
• For our communities
Integrity• In all relationships
• Complying with the law and regulations
• Behaving ethically in everything we do
• Making the right choices
Responsibility• Acting in accordance with our responsibilities
• To our stakeholders
• To our customers, by providing the highest possible standard
of service
• For our personal growth and our personal contribution to
Draka’s success
• For our results
Discipline• In implementing our corporate plans, processes and
procedures
• In developing and defining best practices in the sector and
implementing them without delay
Mission
Draka’s mission is to be one of the world’s leading cable manufacturers in all its selected product/market segments, with a sound financial
base, a balanced geographical spread and an extensive, technologically advanced product portfolio. To this end Draka’s focus is on quality,
growth and profitability. In this way, Draka aims to be an attractive partner for all its stakeholders: customers, employees, shareholders,
financiers and suppliers. At the same time, Draka takes its social obligations seriously by also investing in sustainable technology.
Draka Holding | 3Annual Report 2007

GOING FOR GROWTHGrowth at Draka has many dimensions. In the context
of an annual report it usually refers to the bottom line:
growth in profitability, based on increasing sales,
margins, market share and other classical performance
indicators. Of course those are important, and they are
what shareholders and analysts usually look at first to
characterise the performance of the company. They
are also important to the company itself, because
good financial results form the basis for long-term
continuity. But there’s more to growth than figures alone.
Because those figures are the result of the strategies
followed throughout the company. All of which are
focused on, and aligned with, the overall goal of growth.
A few of those strategies are highlighted in this annual
report. For example organic growth, but also growth
through acquisitions. Growth through optimisation of
the organisation, through globalisation, and through
growth of the market itself. Growth through innovation
in products, processes and technologies. But also
personal growth, to enable people to maximise their
potential. These are some of the factors behind our
results. But they are also what drives our organisation.
Going for growth is the key to success – now and in
the future.

Contents
Core competences & core activities, mission, core values, strategic & financial goals 3
Draka Holding N.V. 6
Company profile in brief 7
Sustainable and profitable growth 8
Organisational chart 10
2007 in brief 11
Key figures 12
Report of the Board of Management 14
Report on Draka Cableteq and Draka Comteq 26
Main subsidiaries, associates and joint ventures 38
Risk management 39
Report of the Supervisory Board 43
Corporate Governance 50
Share information 52
Financial statements 59
• Consolidated statement of income 60
• Consolidated balance sheet 61
• Consolidated statement of cash flows 62
• Consolidated statement of changes in total equity 63
• Notes to the consolidated financial statements 64
• Company financial statements 104
• Notes to the company financial statements 105
Other information 114
• Appropriation of result as provided for by the Articles of Association 114
• Proposed appropriation of result 115
• Auditors’ report 116
• Trustee report 117
Ten years of Draka Holding N.V. 118
Draka Holding | 5Contents

Draka has a flat, decentralised organisational structure with short lines of communication. The divisions within the Group enjoy a large measure of autonomy and independent responsibility for their revenue and profits including operational issues like sales and delivery contracts with customers and research & development.
Draka Holding N.V.
Draka Cableteq
Divisions
ELEVATOR PRODUCTS
LOW-VOLTAGE CABLE
MARINE, OIL & GAS
MOBILE NETWORK CABLE
RUBBER CABLE
TRANSPORT
Divisions
DRAKA COMTEQ CABLE SOLUTIONS, EMEA
DRAKA COMTEQ CABLE SOLUTIONS, AMERICAS
DRAKA COMTEQ CABLE SOLUTIONS, ASIA/PACIFIC
DRAKA COMTEQ OPTICAL FIBER
Draka Comteq B.V.
• AUSTRALIA
• BELGIUM
• BRAZIL
• CANADA
• CZECH REPUBLIC
• DENMARK
• ESTONIA
• FINLAND
• FRANCE
• GERMANY
• INDIA
• INDONESIA
• ITALY
• JAPAN
• MALAYSIA
• MEXICO
• NETHERLANDS
• NORWAY
• PEOPLE’S REPUBLIC OF CHINA
• PHILIPPINES
• RUSSIA
• SINGAPORE
• SLOVAK REPUBLIC
• SPAIN
• SULTANATE OF OMAN
• SWEDEN
• THAILAND
• TURKEY
• UNITED KINGDOM
• UNITED STATES
Worldwide the Draka companies have some 9,550 employees. Draka Holding N.V., the head office, is established in Amsterdam. Draka has 68 operating companies in 30 countries throughout Europe, North and South America, Asia and Australia.
Operating in 30 countries
Draka Holding N.V.6 | Draka Holding

Company profile in brief
Draka Holding N.V. is engaged worldwide in the development, production and sale of cable and cablesystems. Draka has subdivided its activities into two groups: Draka Cableteq, which is responsible for the low-voltage and special-purpose cable activities, and Draka Comteq, which handles the communication cable activities.
Draka Cableteq
Divisions Market position Competitors Clients
Elevator Products Market leader in lift cable in
North America
Strong position in Europe
In development in Asia
Daetwyler (Switzerland)
Gebauer & Griller (Austria)
Sumitomo (Japan)
Lift producers, such as
Otis (USA) and
ThyssenKrupp (Germany)
Low-Voltage Cable Top three position in Europe
Limited position outside Europe,
focusing on market niches
General Cable (USA)
Nexans (France)
Prysmian (Italy)
Construction and installation
companies
Technical wholesalers such as
Sonepar (France), Rexel (France),
and Hagemeyer (Netherlands)
Marine, Oil & Gas Strong position in north-
western Europe
Prominent position in North
America and the Far East
LS Cable (South Korea)
Nexans (France)
Prysmian (Italy)
Oil and gas industry
Technical installation
companies
Shipyards
Mobile Network Cable Global third-ranking position CommScope (USA), RFS
(part of Alcatel, Germany)
Suppliers and operators of
mobile telecommunication
networks
Rubber Cable Top 2 position in Europe
Global market leader in cable
for wind turbines
Nexans (France)
Prysmian (Italy)
Technical wholesalers such as
Hagemeyer (Netherlands),
Rexel (France) and
Sonepar (France)
Industrial companies active in
mining and the wind turbine
and solar power markets
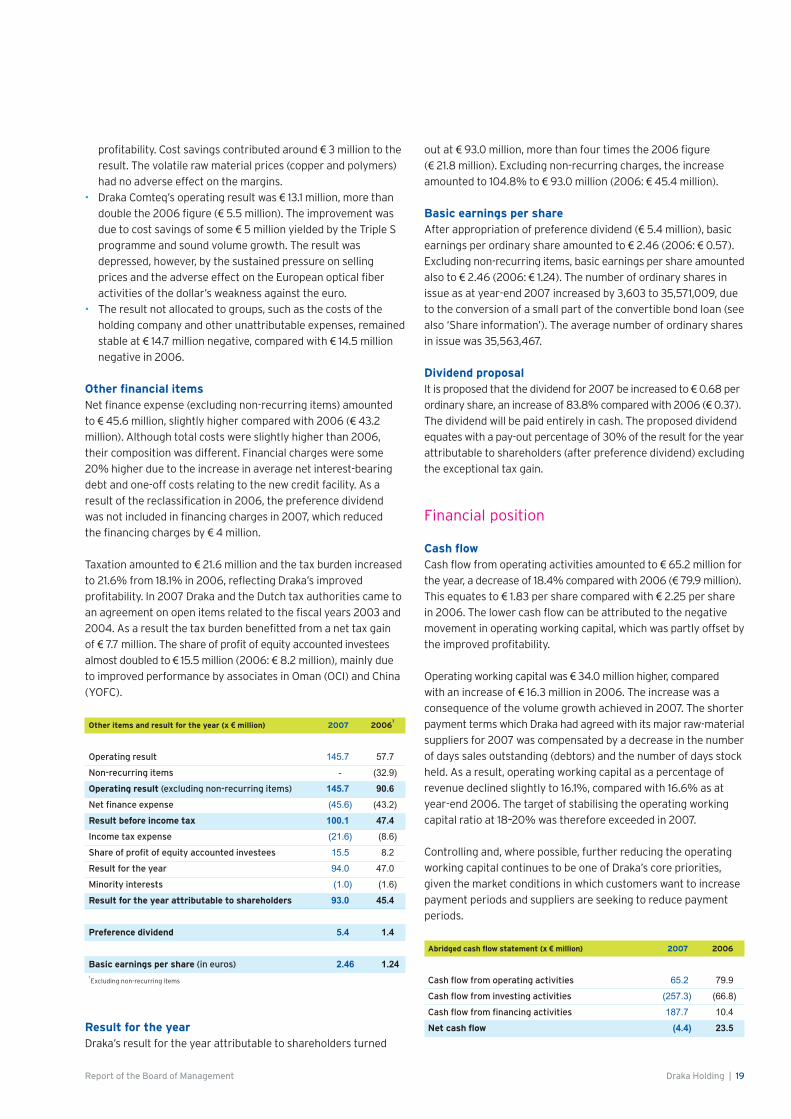
Transport World no. 1 independent
supplier of advanced
automotive cables;
key position in standard cable
Important supplier of Airbus
Coficab (Tunisia)
Coleman (USA)
Leoni (Germany)
Nexans (France)
Sumitomo (Japan)
System suppliers, such as
Delphi (USA),
Yazaki (Japan) and
Lear (USA)
Labinal (France) for aircraft cable
Draka Comteq
Markets Market position Competitors Clients
Telecommunications Optical fiber cable:
No. 1 in Europe and China
and no. 3 in USA
Outdoor copper cable:
no. 3 in EMEA
Corning (USA)
Furukawa (Japan)
Nexans (France)
Prysmian (Italy)
Operators, such as KPN, Deutsche
Telekom, France Telecom, Telia/
Sonera, Tele Denmark, AT&T,
Verizon, China Telecom, Illiad,
Alcatel and Siemens
Data Communication No. 1 in Europe Acome (France)
Belden (USA)
CommScope (USA)
Leoni (Germany)
Nexans (France)
Wholesalers, distributors, OEM
and system providers
Optical Fiber No. 1 worldwide in multimode
optical fiber
No. 2 worldwide in single mode
optical fiber
Corning (USA)
Fujikura (Japan)
Furukawa (Japan)
Sumitomo (Japan)
Cable makers for
telecommunications and data
communications applications
Draka Holding | 7Company profile in brief

Sustainable and profitable growth
To our shareholders and other stakeholders,
2007 was a highly successful year for Draka. Benefiting from the
favourable market conditions, Draka recorded growth in all parts
of the business, in line with its strategic objectives. The operating
results showed a significant improvement, Draka’s innovative
strength enabled it to increase its share in most market segments,
the cost base was further reduced and we acquired full ownership
of Draka Comteq. We can therefore look back on 2007 with great
satisfaction, and the Board of Management thanks everyone for
their contribution to Draka’s strong performance.
Although we may justifiably derive satisfaction from these results,
we shall continue to invest in safeguarding Draka’s leading position
in the future. First and foremost, we shall be investing in our people.
The plan developed by Draka in 2007 to intensify our internal
training and education programmes, known as the ‘Draka Academy’
project, aims to enable employees to achieve work-related personal
and career goals. This project, which will be rolled out in 2008, is
designed to help Draka retain and recruit sufficient numbers of
professionals who are motivated to work for the further growth
of the business.
We shall also continue to invest in innovation. Draka invests a
substantial part of its annual revenues in research and development,
focused mainly on application engineering and improving materials
and production processes. As a consequence, Draka’s products are
generally ‘state of the art’, which gives us a competitive edge in
many markets. Supported by increased sales and marketing effort,
Draka aims to set the standard in each market segment with its
products and services.
Draka will continue to seek new market opportunities. Consistent
with our strategy, we shall look for opportunities mainly in the special-
purpose cable segments and emerging markets. As announced in
2007, we are currently investing some € 17 million in further
expansion of our wind-turbine cable production capacity, to meet
the strongly rising demand in this growth market. To extend our
position as world market leader in this field, we recently decided to
move into medium-voltage submarine cable, used amongst others
for power connection between the windmills in offshore wind farms.
These are just a few examples of our investments, reflecting the
entrepreneurial spirit that has always been characteristic of Draka.
This combination of people, innovation and entrepreneurship is
unique to Draka and is key to our success. In recent years, this has
translated into organic growth faster than the market average. We
are confident that, strengthened by the initiatives we have taken
in several areas as outlined above, Draka will continue to achieve
sustained organic growth in the future.
As well as organic growth, acquisitions will also play a part in
raising our performance. Draka has a proven track record in this
field and we shall continue to make acquisitions in the future,
consistent with our strategy. The acquisition at the end of 2007 of
the remaining 49.9% interest in Draka Comteq B.V. was such a
strategically important step. Draka now owns 100% of Draka Comteq
and is in a position to further improve the efficiency of its operations.
In the light of the constant shifts in the market, which Draka
continues to anticipate, and after having achieved sole ownership
of Draka Comteq, we have made certain changes to the Company’s
organisational structure. As from 2008, the organisation is divided
into three Groups – Energy & Infrastructure, Industry & Specialty
and Communications – which are in turn split into various divisions.
Apart from the transfer of certain activities, the divisions have
remained unchanged (see organisational chart on page 10). The
allocation of activities to the three Groups is based on the business
model needed to provide optimum service to the customer in each
market segment. Accordingly, we expect this new organisational
structure to generate additional growth in the future.
Given our performance in 2007 and the market opportunities
available to Draka, we look to the future with enthusiasm. That is
why we have chosen ‘Going for growth’ as the theme of this annual
report. The substantial investments we are making in people,
innovation and capacity are evidence of our faith in the future.
This, combined with Draka’s solid foundations, innovative strength
and motivated workforce, inspires our confidence that Draka is
moving into a period of sustained and profitable growth.
Board of Management,
Sandy Lyons
Frank Dorjee
8 | Draka Holding Sustainable and profitable growth

The Board of Management:
Frank Dorjee (left)
and Sandy Lyons.

Organisational chart Draka’s new organisational structure as from 1 January 2008
DRAKA HOLDING N.V.
Sandy Lyons (CEO)
Frank Dorjee (CFO)
AUSTRALASIA
Kian Cheng Wong
EUROPE
Hans Siebring
GREATER CHINA
Kee Yat Chua
AUTOMOTIVE & AVIATION
Christian Schütte
CABLETEQ USA
John Chrupcala
ELEVATOR PRODUCTS
John Moore
MARINE, OIL & GAS
Ronnie George
CABLE SOLUTIONS AMERICAS
Mike Amicone
CABLE SOLUTIONS EMEA
Gerhard König
MOBILE NETWORK CABLE
Mika Höijer
OPTICAL FIBER
Phil Edwards
RUBBER CABLE
Wilhelm Engst
ENERGY & INFRASTRUCTURE
Sandy Lyons
INDUSTRY & SPECIALTY
Ken Petersson
COMMUNICATIONS
Phil Edwards
WIRE & CABLE ASSEMBLIES
Andries van Bergen
10 | Draka Holding Organisational chart

2007 in brief
Draka continued to pursue its strategic objectives in 2007: its profitability improved sharply, its position in both special-purpose cables and emerging markets was further strengthened and it acquired full ownership of Draka Comteq.
Market share continued to increase, as Draka’s volume growth (6.1%) outpaced world market growth (4%).
Operating result (excluding non-recurring items) increased 61% to € 145.7 million, driven by volume growth, acquisitions, cost
savings and efficiency improvements. Draka Cableteq posted a 48% improvement and Draka Comteq’s result more than doubled.
Result for the year attributable to shareholders was up 105% to € 93.0 million; basic earnings per share rose 99% to € 2.46
(both excluding non-recurring items). The proposed dividend is € 0.68 per ordinary share (+84%), payable entirely in cash.
Operating working capital slightly lower at 16.1% of revenue (2006: 16.6%); stock and debtor positions as a percentage of
revenue were again lower.
Draka acquired full ownership of Draka Comteq in exchange for a cash payment of € 209 million to Alcatel-Lucent as at 27 December 2007. Draka expects this transaction, including the additional cost savings that are expected to accrue
and after financing costs, to have a limited positive effect on earnings per share in 2008.
A new € 625 million credit facility was secured which will cover Draka’s financing requirements until 2013.
��������������������������������������������������
�
��
���
���
���
���
�����������������������������������������������������������������
�������� ����
�������������������������������������������
�������������
�����������������������������������������
�������������
�������� ���� �������� ����
�������
����������������������������
�������������������������������������
���������������������������
��������������������������������
��������������������������������� ��������������������������������� ���������������������������������
�������
����������������������������
�
������
�����
�����
�����
�����
�����
���
�
���
���
���
��
��
��
�
���
���
���
���
���
���
���
�
��
��
��
��
��
��
�
�
��
���
��
���
���
���
��������������������������
��
��
���
���
��
���
���
���
�������������
������������� ���� �����������������
��������������������������������������������������
�
��
���
���
���
���
�����������������������������������������������������������������
�������� ����
�������������������������������������������
�������������
�����������������������������������������
�������������
�������� ���� �������� ����
�������
����������������������������
�������������������������������������
���������������������������
��������������������������������
��������������������������������� ��������������������������������� ���������������������������������
�������
����������������������������
�
������
�����
�����
�����
�����
�����
���
�
���
���
���
��
��
��
�
���
���
���
���
���
���
���
�
��
��
��
��
��
��
�
�
��
���
��
���
���
���
��������������������������
��
��
���
���
��
���
���
���
�������������
������������� ���� �������������������������������������������������������������������
�
��
���
���
���
���
�����������������������������������������������������������������
�������� ����
�������������������������������������������
�������������
�����������������������������������������
�������������
�������� ���� �������� ����
�������
����������������������������
�������������������������������������
���������������������������
��������������������������������
��������������������������������� ��������������������������������� ���������������������������������
�������
����������������������������
�
������
�����
�����
�����
�����
�����
���
�
���
���
���
��
��
��
�
���
���
���
���
���
���
���
�
��
��
��
��
��
��
�
�
��
���
��
���
���
���
��������������������������
��
��
���
���
��
���
���
���
�������������
������������� ���� �����������������
Draka Holding | 112007 in brief

2007 2006
RESULTS (x € million)
Revenue 2,816.2 2,529.4
EBITDA (excluding non-recurring items) 198.2 145.3
EBITDA 198.2 112.4
Operating result (excluding non-recurring items) 145.7 90.6
Operating result 145.7 57.7
Result before income tax (excluding non-recurring items) 115.6 64.9
Result before income tax 115.6 32.0
Result for the year (excluding non-recurring items) 93.0 45.4
Result for the year 93.0 21.8
BALANCE SHEET (x € million)
Shareholders’ equity 414.8 426.9
Guarantee capital 1 537.5 619.5
Total assets 1,752.5 1,745.0
Current assets -/- non-interest bearing current liabilities 343.6 279.7
INVESTMENTS, AMORTISATION, DEPRECIATION AND IMPAIRMENT (x € million)
Investments in intangible assets 7.3 4.9
Investments in property, plant and equipment 64.2 45.6
Amortisation, depreciation and impairment 52.5 61.0
Investments in subsidiaries and equity accounted investees 209.8 30.0
Result for the year (excluding non-recurring items) + amortisation, depreciation and impairment 145.5 106.4
PERSONNEL
Number of employees at year-end 9,547 9,145
RATIOS (in %)
Operating result (excluding non-recurring items) / Revenue 5.2 3.6
Operating result / Revenue 5.2 2.3
ROTA excluding non-recurring items 2 6.6 3.8
ROTA 2 6.6 1.9
Guarantee capital 1 / Total assets 30.7 35.5
PER ORDINARY SHARE (x € 1)
Shareholders’ equity (excluding preference shares) 9.51 9.85
Result for the year after dividend on preference shares
(excluding non-recurring items) + amortisation, depreciation and impairment 3.94 2.95
Result for the year after dividend on preference shares
(excluding non-recurring items) 2.46 1.24
Result for the year after dividend on preference shares 2.46 0.57
Result for the year (fully diluted) 3 2.19 0.57
Proposed dividend 0.68 0.37
Key figures
1 Shareholders’ equity, provision for deferred taxation and long-term part of convertible subordinated bond and other subordinated loans
2 Result before income tax / Average total assets
3 The calculation takes into account the interest charge on the convertible subordinated bond
12 | Draka Holding Key figures

�
�����
�����
�����
�����
�����
���
�
���
���
���
��
��
��
�
���������������������
���� ���� ���� ���� ���� ����
�������������������������������
�������������������������������
�
���
���
���
��
��
��
�
������
�����
�����
�����
�����
�
����������������������������������
���� ���� ���� ���� ���� ����
�������������������������������
�������������������������������
�
�����
�����
�����
���
�
���
���
���
��
�
��������������������������
���� ���� ���� ���� ���� ����
���������������
Draka Holding | 13Key figures

Strategy
Draka’s management continued in 2007 to implement its
strategic goals and objectives defined in the Company’s strategic
plan ‘Building Future Growth’, which was launched in 2005. This
aspect is discussed in greater detail in the ‘Developments at
Draka’ section of the report of the Board of Management. In line
with this, Draka strengthened its position significantly in 2007, in
terms of market position, financial position and profitability.
Draka’s strategy centers around four cornerstones.
GrowthIn a consolidating world, with both cable suppliers and cable
customers growing ever larger, the cable industry itself must stay
alert. The industry has to continue to strive for scale and growth
if it is to remain viable in the long term, and that includes Draka.
Draka seeks to widen the range of products and services it offers
its customers by expanding its core activities while promoting
recognition of the Draka brand around the world. Draka is focusing
on growing its activities in the special-purpose cable segment
and in specific geographical regions, both organically and through
targeted acquisitions, because these markets are expected to exhibit
above-average growth in the coming years.
The key to achieve organic growth is to place the customer’s wishes
first. Draka seeks to respond to those wishes while setting itself
apart from the competition. This requires a culture predicated
upon innovative strength, flexibility and a willingness to cooperate.
Draka will continue to pursue this active policy, making the
necessary investments to preserve and enhance that culture. This
is the best guarantee of achieving continued organic growth in
the future.
As well as organic growth, Draka will also seek growth through
targeted acquisitions, mainly with a view to speeding the process
of strengthening its position in emerging markets and in the
special-purpose cable segment. Draka has the organisation and
the financial position it needs to pursue its acquisition strategy
more actively. As well as strengthening Draka’s market position in
its core activities, making a contribution to Draka’s result in the
first year of consolidation will also be a criterion that potential
acquisition candidates will have to meet.
Draka’s medium-term objective is to increase the proportion of
revenues generated by the special-purpose cable segment and
emerging markets from about 47% to around 60% of total
revenues.
EntrepreneurshipDraka has an organisational structure whereby policies,
guidelines and procedures are developed and determined
centrally and the appropriate execution takes place on a local
level. This requires employees with strong enterprising spirit in
order to achieve profitable growth. That has traditionally been
one of the strengths that distinguish Draka from its competitors
in the cable industry. This aspect is always taken into account in
the selection, development and advancement of employees.
Research & DevelopmentDraka invests a substantial part of its annual revenue in research
and development (R&D) in the fields of materials, cables and
systems. This creates the basis for innovation. The Company’s
scale provides a sound basis for maintaining and, in consultation
with clients, expanding the leading position in the fields of R&D
and application engineering. The drive for further progress in
development of materials will be encouraged, by exchanging
knowledge within and between the divisions.
OptimisationDraka regards the optimisation of its organisation as a continual
process. Cost leadership in the different market segments is crucially
important, which is why Draka will continue to invest in more
efficient and effective design of both the production structure
and the sales and marketing structure with undiminished vigour.
The disposal of non-core activities fits this orientation. In principle,
the costs involved in optimising the organisation should be covered
by the disposal of non-core activities and/or by additional incoming
cash flows generated by each Group.
Financial objectivesThe strategic approach described above is aimed at increasing
Draka’s profitability, generating an optimum free cash flow
(definition: cash flow generated from ordinary operations taking
account of a required level of investment) and strengthening its
balance sheet position.
In the medium term, Draka aims for ongoing improvement in
profitability through a combination of organic growth, acquisitions
and cost-reduction programmes. Despite a good spread of
activities over the different customer groups, Draka’s profitability
in any given year is determined partly by current economic
developments. Draka does not, therefore, set itself a given
medium-term target, but expects an average operating margin
over the economic cycle (of 6–7 years) of around 5% of revenues.
Other important financial objectives for the medium term:
• Regular maintenance and replacement investments in
intangible assets and property, plant and equipment will equal
amortisation and depreciation. In line with Draka’s strategic
principles, investments in growth markets (special-purpose
cable segment and emerging markets) can take place resulting
in a total investment level which exceeds the depreciation level
in a particular year.
• Healthy interest coverage, implying an EBITDA/interest ≥ 4.5
(2007: 4.3).
• Stabilisation of the operating working capital (definition:
stocks plus trade debtors minus trade creditors) at 16–18% of
revenues (2007: 16.1%).
Report of the Board of Management
14 | Draka Holding Report of the Board of Management

SWOT analysis
Business developments in 2007
Market trendsGrowth in global demand for cable amounted to around 4% in 2007,
compared with 4.2% in 2006 (based on constant exchange rates
and copper prices). This represents very healthy growth, above
the medium-term average of some 2-3%. Growth was stronger
in the first half of the year (4-5%) than the second (around 3%),
due to weakening economic growth in North America in
particular during 2007.
Emerging markets such as Eastern Europe, the Far East, India and
Latin America remain the driving force behind worldwide demand
for cable. The growth rate in these markets last year was 6–8%,
depending on the market. Demand in North America fell a further
4%, after declining by 3% in 2006, while the West European market
showed growth of 3-4%, compared with 5% in 2006. This slower
growth must be seen in the context of pent-up demand in 2006
after a very weak 2005 (down 3%).
At the product level, virtual all segments contributed to the growth
in the cable market. The trend in the energy cable segment
remained positive, with demand for medium and high voltage cable
particularly strong, at around 6% (note: Draka is not active in
high-voltage cable). The growth in the low-voltage cable segment
slowed to around 3% compared with 4% in 2006, due primarily to
the downturn in the US housing market. In contrast, the special-
purpose cable market again showed healthy growth of around 4%.
Within the communication cable segment, the fastest growth was
again in optical fiber telecommunication cable (13%), with demand
for copper telecommunication cable declining again for the fourth
year in a row. Demand for data communication cable (copper and
optical fiber) grew around 4-5%.
After the sharp rises since 2004, metal prices (copper and
aluminium) stabilised in 2007. The copper price was particularly
volatile, rising rapidly in March and April and then remaining high
until November, when it fell 20%. The average copper price (in
euros) in 2007 was down 2.4%. The aluminium price fell slightly
further, down around 5%. Polymer prices rose 5–10%. With raw
material prices remaining relatively stable, pressure on margins in
the cable industry was limited last year.
Copper price development (euros) over the period 2000-2007
Developments at Draka
• 2007 was a year of growth for Draka. As well as investing in the
personal development of its staff and growth in capacity (of both
people and machines), Draka again invested in its organisational
structure. The divisional structure introduced in 2005 was further
refined in 2007. This resulted in more effective sales and marketing
organisations, streamlined production facilities and improved
cooperation (both within and between divisions), creating a
more efficient organisation and, in many cases, gains in market
share and further improvement in operating profit. Thanks to
the good progress Draka has achieved in the past two and a half
years, it has met all the strategic targets for 2007 that were set
in the ‘Building Future Growth’ strategic plan published in 2005.
• Draka further expanded its position in the special-purpose cable
activities and emerging markets to some 47% of revenues
(2006: 43%). This strengthening of its position in these markets,
which is one of Draka’s strategic objectives, was achieved by
organic growth and a full year’s contribution by acquisitions
made in 2006. Draka again expanded its activities in the special-
purpose cable segment. The Elevator Products division formed
with Nantong Zhongyao Mechanic Electric Co, Ltd a second
jointly owned company in China and acquired DeBiase Lift
Components s.r.l. in Italy. This will strengthen Draka’s leading
position as a global supplier of total solutions for the global lift
industry. Draka also launched a special expansion project
investing € 17 million in the Rubber Cable division, to increase
capacity for cable for wind turbines. This investment project is
scheduled for completion in 2008.
Strengths• Entrepreneurship at local level
• Diverse and extensive customer base
• Good position in special-purpose
cables
• Distinctive product quality
• Cost leadership in several market
segments
• Customer focus
• Committed staff
Weaknesses• Profitability in some cable segments
below target
• Relatively small position in USA and
Asia
Opportunities• Good growth potential, both organic
and through acquisition, thanks to
highly fragmented markets
• Strong market growth in emerging
countries
• Good growth potential in special-
purpose cable segment
• Potential for further efficiency
improvements in both production
and sales channels
Threats• Raw material shortages (copper and
polymers)
• Rising prices of acquisition
candidates
• Downturn in economic activity
• Consolidation among suppliers,
customers and competitors
Draka Holding | 15Report of the Board of Management
����
����
����
����
����
����
����
���� ���� ���� ���� ���� ���� ���� ����

• Another special investment project for the Rubber Cable division
was approved at the end of December 2007. This investment in
production capacity for submarine cable (medium voltage) is
designed to maintain and extend Draka’s leading position in
cable for new forms of energy, such as wind power.
Applications for this cable include amongst others the power
connection between the windmills in offshore wind farms and
the power connection between offshore oil platforms. Around
€ 17 million will be invested in production capacity for this cable at
the existing plant in Drammen (Norway), of which about € 8 million
will be invested in 2008 and the remainder in 2009. This project
will strengthen the Rubber Cable division’s position in special-
purpose cable, consistent with Draka’s strategic principles.
• Draka seeks constantly to further optimise the organisation, in
line with its strategic goals. August 2005 saw the launch of the
Stop, Swap & Share (or ‘Triple S’) project, an ongoing process
designed to make the organisation more efficient. The project
generated cost savings of some € 8 million in 2007, of which
Draka Cableteq accounted for € 3 million and Draka Comteq for
€ 5 million. Additional synergy gains of around € 4 million were
also realised.
16 | Draka Holding Report of the Board of Management
savings by rationalisation, it’s also a barrier
to streamlined purchasing and an optimised,
integrated supply chain. Not only that, it
greatly increases the complexity of logistics
and distribution in making sure the right
parts and materials are available exactly
where and when they’re needed.”
Improvement opportunity
To maximise the improvement opportunity,
Draka Elevator Products’ approach is first to
thoroughly analyse the customer’s
procurement and logistics processes, from
ordering right through to delivery to the line.
That includes the nature of the current
supply chain, exact details of all the parts
involved, and any required further
processing. With that knowledge, the most
cost-effective solution can then be found for
each part of the process.
Proven strengths in kitting
“Since we first rolled out our Extended Factory
Model, we’re supplying around 80 per cent
of the customer’s total bill of materials, from
over 15,000 different part numbers we have
available. That gives a good indication of the
workload we’ve offloaded from the customer,
which translates directly into lower indirect
“It’s a win-win situation for us and the customer”“Back in late 2003 when we introduced our
Extended Factory Model, we recognised the
need of elevator manufacturers to cut costs
and increase efficiency. At that time we saw
many customers were working with multiple
vendors for all kinds of mechanical and
electrical components. And in some cases
they were even producing those components
in their own plants. We saw there was
tremendous scope for cost savings and process
improvement, so we offered to take over that
workload and provide the customer with a
professional single-source solution”, Sterrett
Lloyd explains.
Leveraging purchasing volume
Through the Extended Factory Model, Draka
Elevator Products is able to leverage its
purchasing volume and secure immediate
savings on sourcing of parts and materials.
But that’s not the only way in which costs
are reduced. “Taking that work out of
customers’ factories provides additional
savings which are just as important. They
have numerous internal staff and
departments and external partners, all
involved in the procurement process but not
adding direct, productive value. This
dispersion of effort not only prevents
Driving organic growth: Extended Factory Model cuts costs and streamlines procurement
Bill of material savings of 10 per cent in
the first year and 5 per cent year on year
afterwards. That’s the proposition Draka
Elevator Products offers its customers.
“It’s a win-win situation”, says Chief
Operating Officer Sterrett Lloyd. “For us
it’s a growth opportunity and for our
customers it’s a source of both significant
savings and process improvement.”

• Draka’s results continued to improve in 2007 at the rapid
pace achieved in the two previous years. Revenues rose 11.3%
in the past financial year, the combined effect of volume
growth (6.1%) and acquisitions (5.5%). Volume growth was
slightly lower than in 2006 (7.1%), but well ahead of growth in
the global cable market (4%). The operating result was
60.8% higher at € 145.7 million, reflecting sustained and
healthy volume growth, the effects of several cost-reduction
programmes and a further improvement in the product mix.
Result for the year attributable to shareholders excluding
non-recurring items was € 93.0 million (2006: € 45.4 million).
• Operating working capital as a percentage of revenues decreased
slightly to 16.1%, compared with 16.6% as at year-end 2006.
This good performance was realised despite the shorter payment
terms agreed by Draka with its suppliers at the end of 2006.
The resultant increase in operating working capital was fully
compensated by a decrease in the number of days’ stock held
and decline in days of sales outstanding (debtors). The target of
stabilising the operating working capital ratio at 18–20% was
therefore exceeded in 2007. Investments in intangible assets
and property, plant and equipment amounted to € 71.5 million,
higher than the projections for maintenance investments
Draka Holding | 17Report of the Board of Management
headcount, drastically reduced inventory
levels and savings in working capital. Many
of those items are simple components like
nuts, bolts ands clips. But others are complex
and customised, and require extra handling
before they are ready for use. For example
cut-to-length, harnessing, adding connectors,
and putting together panels, subassemblies
and sheet metal parts. With our proven
strengths in kitting – or customised parts
packaging – together with order consolidation
and global logistics and distribution, we offer
an efficient package that gets parts to where
they’re needed at minimum cost.”
The biggest benefit for customers is that
they can focus on their core, value-added
activities, Sterrett Lloyd emphasises.
“Kitting can be a nightmare for customers
“Just like a cell in the customer’s factory”
“Providing an integrated IT solution is an essential part of Draka Elevator Products’ offer
to OEMs. From order right through to delivery, each part can be traced at every stage of
the process. That’s the key to an efficient supply chain that can be operated at minimum
cost and effort. In the kitting process each component is scanned before crating into
complete sets for specific elevators. Full track & trace means the customer can check the
status of each component at any time. We work seamlessly as part of the customer’s own
process, just as though we’re a cell in his own factory.”
JOHN MOORE, PRESIDENT DRAKA ELEVATOR PRODUCTS
because it’s a complex and time-consuming
process. It’s also a distraction from the core
task of delivering state-of-the-art vertical
transport solutions. At Draka Elevator
Products we use our expertise to provide an
effective, packaged solution with guaranteed
cost savings and a global distribution reach.
As far as the customer is concerned, that’s a
very strong proposition!”
Sterret Lloyd Chief Operating Officer Draka Elevator Products
John Moore President Draka Elevator Products

(approximately € 55 million) including the special investment
project for the Rubber Cable division (€ 8 million). Free cash flow,
excluding acquisitions, amounted to € 17.7 million (€ 0.50 per
ordinary share) in 2007, compared with € 43.1 million in 2006.
This decline was mainly due to the increase in working capital
and higher investments.
• On 18 December, Draka announced that it was acquiring
Alcatel-Lucent’s 49.9% interest in Draka Comteq B.V. (‘Draka
Comteq’) for a total cash payment of € 209 million. The
transaction, which was finalised on 27 December, gives Draka
full ownership of Draka Comteq. As a wholly owned Draka
subsidiary, Draka Comteq will continue with undiminished
vigour to pursue its strategy, including the Triple S programme
launched in 2006. Draka expects the integration of the two
head offices to yield additional cost savings of around € 3
million a year from 2008 onwards. Apart from the equity
movement, acquiring full ownership has had no material effect
on Draka’s consolidation, because Draka has had a controlling
interest in the jointly owned company since its formation (1
July 2004) and its results have been included in full in Draka’s
consolidated financial statements since that time.
• Late in 2007, Draka arranged a new credit facility of € 625 million
in various currencies with a syndicate of five relationship banks.
This revolving credit facility has an initial term of five years, with
an option to extend it for one year.
• As part of the Company’s continuing optimisation, Draka
Comteq announced a Triple S programme in June 2006 for the
restructuring of its Cable Solutions EMEA division. The annual
cost savings are expected to amount to about € 12 million and
will be fully achieved in 2008. The first savings of € 5 million
were achieved in 2007 and the remaining savings are expected
to amount to around € 7 million.
Financial results
RevenueDraka’s revenue in 2007 amounted to € 2,816.2 million, an
increase of 11.3% compared with 2006. Acquisitions accounted
for 5.5 percentage points of this revenue growth. These were
mainly acquisitions made in 2006 which contributed a full
year’s results in 2007, namely the insulated cable activities of
International Wire Group, Inc. (USA) and Cornelia Thies
Kabeltechnik GmbH (Germany). The takeover of Nantong
Zhongyao Mechanic Electric Co, Ltd (China) also contributed in
2007. The acquisition in Italy, DeBiase Lift Components s.r.l., will
be included in the consolidation as from the 2008 financial year.
The organic growth in revenue amounted to 5.8%, of which
volume growth accounted for 6.1 percentage points. The copper
price, although slightly lower, had a small positive effect (1.1%) on
revenue, due to the time-lag in reflecting the copper price in
selling prices. The exchange rate effect was 1.4% negative, mainly
due to the weaker dollar against the euro.
Revenue per Group (x € million) 2007 2006
Draka Cableteq 2,180.0 1,936.2
Draka Comteq 636.2 593.2
Total 2,816.2 2,529.4
Draka Cableteq achieved revenue growth of 12.6% to € 2,180.0
million in 2007, including the effects of the acquisitions referred
to above, all of which related to Draka Cableteq. The organic
growth in revenue, i.e. growth corrected for acquisition effects,
amounted to 5.4%. All divisions contributed to the growth.
At Draka Comteq, revenue increased by 7.2% to € 636.2 million.
This growth was entirely organic. All divisions achieved volume
growth.
Operating resultThe operating result in 2007 was € 145.7 million, an increase of
152.5% compared with 2006 (€ 57.7 million, including non-recurring
items). There were no non-recurring items in 2007, but there was
a non-recurring charge of € 32.9 million in 2006, relating mainly
to a provision for the Triple S project at Draka Comteq.
On a similar basis, excluding non-recurring items, the operating result
increased by 60.8% to € 145.7 million, compared with € 90.6 million
in 2006. The operating margin – the operating result expressed as
a percentage of revenue – was 5.2%, a substantial increase on the
3.6% figure in 2006. Contributory factors were volume growth,
resulting in better capacity utilisation at Draka’s factories, an improved
product mix and gains from efficiency and Triple S programmes.
At 5.2%, the operating margin was slightly ahead of the target for
2007 of 5% set in the September 2005 update of the ‘Building
Future Growth’ strategic plan.
Operating result per Group (x € million) 2007 2006
Draka Cableteq 147.3 99.6
Draka Comteq 13.1 5.5
Not attributed (14.7) (14.5)
Total operating result (excluding non-recurring items) 145.7 90.6
Draka Cableteq - (6.1)
Draka Comteq - (26.8)
Not attributed - -
Total non-recurring items - (32.9)
Operating result 145.7 57.7
Operating margin (excluding non-recurring items) 5.2% 3.6%
• Draka Cableteq’s operating result rose 47.9% to € 147.3 million.
Most of the improvement was due to volume growth, but the
higher proportion of revenues from the special-purpose cable
activities which generate above average margins also boosted
18 | Draka Holding Report of the Board of Management
profitability. Cost savings contributed around € 3 million to the
result. The volatile raw material prices (copper and polymers)
had no adverse effect on the margins.
• Draka Comteq’s operating result was € 13.1 million, more than
double the 2006 figure (€ 5.5 million). The improvement was
due to cost savings of some € 5 million yielded by the Triple S
programme and sound volume growth. The result was
depressed, however, by the sustained pressure on selling
prices and the adverse effect on the European optical fiber
activities of the dollar’s weakness against the euro.
• The result not allocated to groups, such as the costs of the
holding company and other unattributable expenses, remained
stable at € 14.7 million negative, compared with € 14.5 million
negative in 2006.
Other financial itemsNet finance expense (excluding non-recurring items) amounted
to € 45.6 million, slightly higher compared with 2006 (€ 43.2
million). Although total costs were slightly higher than 2006,
their composition was different. Financial charges were some
20% higher due to the increase in average net interest-bearing
debt and one-off costs relating to the new credit facility. As a
result of the reclassification in 2006, the preference dividend
was not included in financing charges in 2007, which reduced
the financing charges by € 4 million.
Taxation amounted to € 21.6 million and the tax burden increased
to 21.6% from 18.1% in 2006, reflecting Draka’s improved
profitability. In 2007 Draka and the Dutch tax authorities came to
an agreement on open items related to the fiscal years 2003 and
2004. As a result the tax burden benefitted from a net tax gain
of € 7.7 million. The share of profit of equity accounted investees
almost doubled to € 15.5 million (2006: € 8.2 million), mainly due
to improved performance by associates in Oman (OCI) and China
(YOFC).
Other items and result for the year (x € million) 2007 20061
Operating result 145.7 57.7
Non-recurring items - (32.9)
Operating result (excluding non-recurring items) 145.7 90.6
Net finance expense (45.6) (43.2)
Result before income tax 100.1 47.4
Income tax expense (21.6) (8.6)
Share of profit of equity accounted investees 15.5 8.2
Result for the year 94.0 47.0
Minority interests (1.0) (1.6)
Result for the year attributable to shareholders 93.0 45.4
Preference dividend 5.4 1.4
Basic earnings per share (in euros) 2.46 1.241 Excluding non-recurring items
Result for the yearDraka’s result for the year attributable to shareholders turned
out at € 93.0 million, more than four times the 2006 figure
(€ 21.8 million). Excluding non-recurring charges, the increase
amounted to 104.8% to € 93.0 million (2006: € 45.4 million).
Basic earnings per shareAfter appropriation of preference dividend (€ 5.4 million), basic
earnings per ordinary share amounted to € 2.46 (2006: € 0.57).
Excluding non-recurring items, basic earnings per share amounted
also to € 2.46 (2006: € 1.24). The number of ordinary shares in
issue as at year-end 2007 increased by 3,603 to 35,571,009, due
to the conversion of a small part of the convertible bond loan (see
also ‘Share information’). The average number of ordinary shares
in issue was 35,563,467.
Dividend proposalIt is proposed that the dividend for 2007 be increased to € 0.68 per
ordinary share, an increase of 83.8% compared with 2006 (€ 0.37).
The dividend will be paid entirely in cash. The proposed dividend
equates with a pay-out percentage of 30% of the result for the year
attributable to shareholders (after preference dividend) excluding
the exceptional tax gain.
Financial position
Cash flowCash flow from operating activities amounted to € 65.2 million for
the year, a decrease of 18.4% compared with 2006 (€ 79.9 million).
This equates to € 1.83 per share compared with € 2.25 per share
in 2006. The lower cash flow can be attributed to the negative
movement in operating working capital, which was partly offset by
the improved profitability.
Operating working capital was € 34.0 million higher, compared
with an increase of € 16.3 million in 2006. The increase was a
consequence of the volume growth achieved in 2007. The shorter
payment terms which Draka had agreed with its major raw-material
suppliers for 2007 was compensated by a decrease in the number
of days sales outstanding (debtors) and the number of days stock
held. As a result, operating working capital as a percentage of
revenue declined slightly to 16.1%, compared with 16.6% as at
year-end 2006. The target of stabilising the operating working
capital ratio at 18–20% was therefore exceeded in 2007.
Controlling and, where possible, further reducing the operating
working capital continues to be one of Draka’s core priorities,
given the market conditions in which customers want to increase
payment periods and suppliers are seeking to reduce payment
periods.
Abridged cash flow statement (x € million) 2007 2006
Cash flow from operating activities 65.2 79.9
Cash flow from investing activities (257.3) (66.8)
Cash flow from financing activities 187.7 10.4
Net cash flow (4.4) 23.5
Draka Holding | 19Report of the Board of Management

Investments, acquisitions and disposalsNet investments in intangible assets, property, plant and equipment
amounted to € 71.5 million, of which normal maintenance and
replacement investments accounted for € 63.5 million. Major
projects included new warehousing in the Czech Republic, a new
PVC compounding mixer in the Netherlands (Emmen), additional
medium-voltage cable capacity in Sweden (Nässjö), expansion of the
optical fiber capacity in the USA (Claremont) and a capacity increase
in copper data communication cable in Slovak Republic (Presvov).
The remainder (€ 8 million) related to a special investment project
for the Rubber Cable division, designed to enable Draka to take
full advantage of the attractive prospects for cable for new power
sources such as windmills. It was planned to complete the project,
with a total expenditure of around € 17 million, in 2007, but there
have been several changes to technical specifications and delays
in equipment deliveries and completion is now expected in the
course of 2008. The rest of the expenditure (€ 9 million) will
therefore be incurred in 2008.
As for acquisitions, Draka completed the purchase of Alcatel-Lucent’s
49.9% interest in Draka Comteq in 2007 for € 209 million in cash.
The transaction, which was finalised on 27 December, gives Draka
full ownership of Draka Comteq. Draka paid € 0.8 million for Nantong
Zhongyao Mechanic Electric Co, Ltd (China). The acquisition of DeBiase
Lift Components s.r.l. in Italy was completed on 10 January 2008.
There were no disposals of material size in 2007.
Balance sheet positionThe balance sheet total as at year-end 2007 amounted to € 1,752.5
million, an increase of 0.4% compared with year-end 2006. This
was solely caused by a € 18.3 million increase in current assets
(stocks and trade debtors) due to the volume growth.
Shareholders’ equityShareholders’ equity as at year-end 2007 amounted to € 414.8
million. The decrease of 2.8% compared with 2006 was mainly due
to the combination of an equity adjustment (€ 77.1 million) resulting
from the acquisition of the 49.9% interest in Draka Comteq, nega-
tive currency translation effects, dividend paid over 2006 and the
addition of the result for the year 2007 attributable to shareholders.
Movements in shareholders’ equity (x € million)
Shareholders’ equity as at year-end 2006 426.9
Currency translation effects (13.1)
Changes in fair value 1.2
Result for the year 2007 attributable to shareholders 93.0
Effect of acquisition minority interest (77.1)
Dividend paid (14.6)
Other (1.5)
Shareholders’ equity as at year-end 2007 414.8
The solvency ratio (shareholders’ equity as a percentage of balance
sheet total) slightly decreased to 23.7% compared with 24.5% as at
year-end 2006. The guarantee capital (consisting of shareholders’
equity, the provision for deferred tax liabilities and the long-term
portion of the subordinated loans) amounted to € 537.5 million or
30.7% of the total invested capital (year-end 2006: 35.5%).
Balance sheet summary (in %) 2007 2006
Intangible assets, property plant & equipment 36.5 36.0
Financial fixed assets 6.4 7.3
Deferred tax assets 2.6 3.0
Current assets 54.5 53.7
Total assets 100.0 100.0
Shareholders’ equity 23.7 24.5
Minority interests 0.7 0.7
Provisions 6.7 8.6
Provision for deferred taxation 1.8 1.5
Long-term liabilities 30.1 22.7
Current liabilities 37.0 42.0
Total equity and liabilities 100.0 100.0
Interest-bearing liabilitiesNet interest-bearing liabilities (including the subordinated convertible
bond loan carried at nominal value) increased in 2007 to € 552.5
million compared with € 345.9 million in 2006. This increase relates
solely to the acquisition of the remaining 49.9% interest in Draka
Comteq for € 209 million, which was financed with borrowed capital.
This increased net gearing (total net interest-bearing liabilities as
a percentage of shareholders’ equity) to 133.2% (2006: 81.0%).
At the end of December 2007, simultaneously with the Draka Comteq
transaction, Draka arranged a new € 625 million multi currency
revolving credit facility with a syndicate of five relationship banks,
namely Rabobank, ING Wholesale Banking, ABN AMRO, Fortis
Bank and NIBC. This new facility replaced the existing € 370 million
credit facility arranged in October 2005 and the outstanding
subordinated loan of € 77.5 million. This refinancing programme
means that Draka’s financing requirement is covered until 2013.
Information and Communication Technology
Work continued last year on refining and implementing the ICT
strategy formulated in 2006 to support the business strategy by
creating more synergy through regional or global partnerships.
The business support applications form an important part of this
strategy. The long-term strategy is to base these on the SAP system.
The Draka SAP template that has been developed is a fully
operational SAP system in which the primary business processes
are programmed. The aim is to harmonise business processes and
to perform new SAP implementations faster, more cost-effectively
and with less risk than in the past. The template has been used as
the basis for the Customer Care system that will be introduced at
all Draka Comteq EMEA locations to support all sales and customer-
related activities in Europe. The template was successfully
20 | Draka Holding Report of the Board of Management

particular emphasis on application engineering and the further
improvement of materials and production processes.
In recent years, Draka’s R&D activities were directed largely towards
achieving cost reductions for existing products and improving
production processes. As material consumption are an important
cost component in almost all Draka divisions, the search for
potential cost reductions and substitution of environmentally
critical materials in this field remains a continual focus of attention.
After reaching substantial cost savings, Draka focused in 2007
mainly on stimulating innovation by and between the different
divisions. A special committee was formed for this purpose in
2006 and several working groups started the innovation journey.
The principle here is that innovation must grow to become a
mindset throughout the Draka organisation. The objectives are:
• To have a clear view on the future of the industry;
• To develop the skills and competencies to meet the future
challenges;
• To create intelligent product platforms from which completely
new product families are borne;
• To remain focused on product and service improvements.
In 2007 Draka has redefined the innovation focus on sensing
external trends, and on increasing the company’s internal
capacity for sharing and acting upon insights generated within
and across the divisions.
Sustainability
Draka is aware of its responsibility for the products and services it
supplies and of the effects these can have on the community at
large. The interests of all stakeholders need to be weighed and
thus Draka is conscious not just of profits but of the environment
and society as well.
Socially responsible entrepreneurship is not new at Draka but is
deeply embedded within the organisation. In the environmental
field Draka goes to particular lengths in reducing the use of
materials and to recycle production waste. In the socio-economic
field it provides training and education for the workforce. At the
social level, Draka’s products contribute, among other things,
towards safety in the living environment (buildings), reduced use
of fossil fuels and greater use of alternative energy sources.
EnvironmentAn important aspect of Draka’s policy is the commitment to minimise
the environmental impact of its activities. The starting point for
Draka’s environmental policy is, of course, that all business
activities must as a minimum comply with current legislation and
regulations. The principle here is that its operating companies
should not only comply with specific laws and regulations, but
should also take a pro-active and preventive approach. Moreover,
each production facility operates an improvement programme
geared to its own specific situation. Draka encourages the
implemented by Draka Cableteq USA in 2007 and will be used as a
starting-point for the planned introduction in Singapore, Malaysia
and Thailand for Draka Cableteq Asia Pacific. The template approach
has also been used to implement SAP rapidly and effectively at
Cornelia Thies Kabeltechnik in Germany, which was acquired in 2006.
Closer cooperation between the Draka companies makes it essential
to standardise the ICT infrastructure and provide opportunities for
effective collaboration. Working closely with the ICT managers of the
various Draka companies and Atos Origin, the chosen supplier, the
standard base services have been defined that must be available at all
companies, including the international communications network,
e-mail and network security. After careful preparation, these services
were successfully implemented on a trial basis in September 2007
at the Calais plant and at eight Draka Comteq EMEA sites in October
and November. Roll-out to the rest of Draka – comprising over 68
locations – started at the end of 2007 and will take until mid-2008.
Availability of a shared infrastructure will also enable Draka to take
advantage of economies of scale through joint purchasing of
software. Plans for further standardisation of the ICT infrastructure
will be developed in 2008. At Draka’s request, Atos Origin has also set
up a shared SAP hosting service for the various SAP template systems.
This will enable Draka in due course to consolidate its computer
centres and reduce their number.
Draka continued in 2007 to work to strengthen governance of ICT
by the Board of Management and divisional managers and improve
the required ICT competencies. Each division has formulated an
information plan which defines the ICT developments needed to
support achievement of the division’s objectives. The consolidated
plan is a powerful aid to business and ICT managers in managing
the ICT activities and ensuring optimum deployment of resources.
An important element of the plan is a summary of the ERP
consolidation process over the period 2007–2012, based on use of
the Draka SAP template.
To define and develop specific ICT competencies, Draka has set up
several competence centres, including an SAP competence centre
and a project management competence centre. Good progress
has been made in these areas and Draka-wide networks of
practitioners are working actively to extend their knowledge and
skills and share their experience. New, experienced staff have been
recruited to fill various vacancies, with the emphasis on
competencies designed to provide added value in achieving the
corporate objectives.
Research & Development (R&D)
Ongoing innovation is a critical success factor for Draka. Only by
constantly investigating and responding fast to the wishes and
requirements of customers can Draka continue to build on its
prominent market position. On a constant basis the company is
exploring possibilities for further broadening and improving the
services it offers. Draka moreover sees R&D as an important
instrument for meeting the company’s obligations to society.
Draka spends a substantial part of its revenues on R&D, with
Draka Holding | 21Report of the Board of Management

implementation of a structured environmental management system
for all its operating companies. Most locations are now accredited
under the international ISO 14001 standard, the international
standard for environmental care systems.
The environmental impact of Draka’s activities primarily relates to
the consumption of raw materials (copper, aluminium and
polymers) and the waste flows from production and discarded cable.
As in previous years, Draka has continued to improve its
performance in 2007. Waste flows have been reduced still further
at most locations. Draka’s approach is based on the one hand on
optimising production processes by investing in process control
systems and in education and training and other programmes at
production locations. Improvements are suggested by the workforce
and implemented by adopting best practices from other locations
in pursuit of the objectives. On the other hand, Draka is working
to extend the direct reuse of material flows during the production
process and maximise recycling by segregating waste flows.
As well as optimising the use of materials, Draka is also developing
and introducing processes which use less energy, such techniques
that enable cross-linking of materials at ambient temperature
instead of 75°C.
SafetyFurther progress was made last year in the development and
introduction of the fire-safety classification for cables for buildings
under the European Construction Products Directive (CPD). Draka
22 | Draka Holding Report of the Board of Management
The switch from the former country
management to a divisional model has had
a big impact on business at Draka Low-
Voltage Europe division. Specialization in
the factories means each sales organization
now has access to 13 factories, and as a
result to a much wider range of products.
“Now we can focus on meeting customers’
needs, wherever they are located, instead
of simply selling products from the local
factory in each country”, says the
division’s President Ken Petersson.
The move to focused factories brings a
number of benefits to the division’s business,
as Ken Petersson explains. “First of all we save
cost by avoiding duplication of resources and
effort in several factories. And as well as that
we can produce each product more effectively
by concentrating it at a single, specialized
location. But the real benefits come from the
market itself. Instead of being limited to their
own product portfolios, our sales people can
offer their customers products from all 13 of
our factories. That’s a big advantage because
it allows them to increase sales by
broadening the market. The first results are
astonishing. We’ve already seen a big increase
in the bottom-line result since the new model
was introduced, and I’m confident there’s still
more to come.”
Company-wide product portfolio
Gaining those benefits is a matter of
understanding the local market, and
customers’ needs and applications. Sales
people need to make full use of the much
larger company-wide product portfolio, and
to serve customers in different industries.
That demands higher skill levels, and to meet
that need an intensified training programme
has recently been started.
Another condition for implementing the
divisional model was a transparent, standard
transfer pricing model. “People are sourcing
products from multiple factories to a much
greater extent than in the past”, Ken
Petersson explains. “Before, there was always
a lot of discussion and unclarity about
transfer pricing, and that was an obstacle to
building the business. Now people know
exactly what the conditions are, and that
makes it much easier to focus on the needs
of the market, and on the customer. We’ve
also put in place standardised logistics systems
to ensure fast and efficient distribution from
each factory to customers all over Europe.”
Wholesalers are route to market
The route to the market in most countries is
“You have to understand your local market”
Growth by optimisation: Focused factory leads to wider national product portfolios

is playing a leading role in defining the relevant testing and
product standards, but wants to speed up the process and
ensure that action is taken now to improve fire safety in
buildings by using non-combustible low-smoke cables that do
not give off corrosive gases in case of fire. Work has continued
in the various European countries to increase knowledge and
awareness of fire risks and cables among designers of
installations, installers and government agencies. In the
Netherlands, for example, a fire-safety knowledge centre has
been set up where several hundred installers and consultants
have already attended seminars.
In terms of both cable and production technology, Draka has a
very strong base for making the switch to production of a new
generation of low-smoke halogen-free (LSHF) cables, as proven
in recent years in countries including Spain and the UK.
In addition to their impact on fire development, preserving the
function of cables is increasingly important for improving fire safety
in built-up environments. In a growing number of cases world-wide,
continued functioning of fire extinguishing units, lifts, ventilation
systems and alarm installations in the event of fire is being imposed
as a requirement. Draka has the in-house knowledge to
continually develop products for the various applications and
conditions with the right level of function preservation.
CooperationDraka is fully aware of the fact that improved sustainability can
Draka Holding | 23Report of the Board of Management
through the wholesalers, who in turn serve
the actual users – the installers. Working
closely together with the wholesalers to
make life easier for the installers is key.
“They want to save time wherever possible.
One way we can help them to do that is by
offering all the cable products they need
from a single source. But we can also save
them time on the job itself. For example
with clear instructions and technical
information, helping them to get easier
solutions for each situation. And by making
the products easier to use, with cables that
are easier to strip or bend, or that move
more quickly through tubes and ducts.
“Strengthened networking at all levels”
“The closer contacts within the organisation also create internal benefits which strengthen
networking at all levels. All factories have more or less the same machinery, which
promotes sharing of knowledge and ideas between engineers. Before, people were not really
connecting with each other. But now, even though it’s not formally structured, we’ve found
they are much more willing to contact each other if they have any questions or problems.
Exactly the same thing applies in other functions like procurement and sales. There’s a
willingness to help each other and share best practices in a wide range of areas. And that’s
a big benefit to effectiveness right across the company.”
HANS SIEBRING, VICE-PRESIDENT DRAKA LOW VOLTAGE EUROPE
Aspects like that enable us to differentiate
our brand, and create a preference for our
Ken Petersson President Draka Low Voltage Europe
products in the wholesale channel”,
Ken Petersson concludes.
Hans Siebring Vice-President Draka Low Voltage Europe

only be achieved through effective partnerships with all parties
concerned. This is why Draka attaches considerable importance
not only to intensive co-operation with its clients and suppliers,
but also to the realisation of improved product and application
standards and regulations. Draka makes a major contribution to
the work of international standardisation committees such as
Cenelec and IEC. In addition, Draka plays an active role in the
associated national and sectoral activities.
Personnel and organisation
Draka maintains its leading position within the cable industry by
paying careful attention to the needs, responsibilities and
aspirations of the people employed at all levels of the organisation.
Personnel and organisationDraka believes that the commitment, involvement and quality of its
personnel are key to the achievement of its corporate objectives.
Draka’s human resources strategy is to recruit new talent and
develop, motivate and retain the existing talent. This strategy, which
leaves room for local cultural norms and statutory requirements,
is consistent with Draka’s core values and code of conduct. Draka
launched several initiatives in 2007 to improve the human
resources systems and will continue to develop them in 2008.
Restructuring and optimisationOne of Draka’s strategic principles is the continuing optimisation
of the organisation. In order to realise this, Draka launched the
Triple S project in 2005, which consists of:
1) stopping the production of cable products that do not enhance
the product mix;
2) swapping cable production within the divisions, in order to achieve
an optimally efficient product portfolio in focused factories;
3) sharing best practices within and among divisions in fields
such as production, compounding, logistics and marketing.
This project resulted in 2007 in the reduction of around 245 jobs
within Draka Comteq, in the Cable Solutions EMEA division. This
phase of the Triple S project is scheduled for completion in 2008,
resulting in the reduction of a further 25 jobs. These measures
have already made a positive contribution to the operating result,
bringing out a structural improvement of Draka’s profitability.
All the activities relating to the programme have put pressure on
the organisation and all the personnel worldwide, especially at
Draka Comteq’ Cable Solutions EMEA division. The Board of
Management thanks all concerned for their input and for the way
in which the measures have been implemented.
Number of employeesThe average number of employees on a full-time equivalent basis
in 2007 was 9,346, an increase of 6.7% compared with 2006.
The increase was due to Draka’s organic growth, which necessitated
the recruitment of additional personnel, and the inclusion in the
consolidation for a full year of the acquisitions made in the second
half of 2006. This was partly offset by a decrease of around 125 in
the average number of employees due to the Triple S project at
Draka Comteq. The number of employees at year-end 2007 was
9,547, an increase of 4.4% compared with year-end 2006.
Long-term incentive planIn 2007, Draka management was once again able to participate in
the long-term incentive plan introduced in 2002. Participation in
the plan means that a Draka manager (excluding members of the
Board of Management, see Remuneration report on page 44)
can use part of their net bonus to acquire Draka shares or Draka
options. Information on the number of shares or options allocated
and at what price can be found in the chapter ‘Share information’
on page 52.
European Works CouncilThe Draka European Works Council is well established as a vital
link between the Board of Management, the works councils and
employees in the individual countries. Two meetings were held
during 2007 in Newcastle (UK) and Amsterdam (Netherlands),
when financial results and corporate objectives were discussed.
The Board of Management wishes to thank the European Works
Council for its constructive attitude throughout the year 2007.
Ambitions for 2008Draka will continue to create equal opportunities for its
employees in 2008, in such areas as recruitment, career
development, training and remuneration. All applicants will be
measured against clear and transparent criteria. Draka will
continue to invest in training and development to enable its
employees to utilise their full potential. On the basis of a careful
analysis of needs, a number of programmes will be developed in
2008 in conjunction with the Draka Academy, the purpose of
which is to enable employees to achieve work-related personal
and career goals.
Prospects and objectives for 2008
ProspectsThere is considerable uncertainty at present as to how the global
economy will develop in 2008. Compared with 2007, which was a
strong year for the global economy, it appears that a slowdown is
likely in 2008. This will certainly be the case in North America,
which experienced some weakening of economic growth in the
second half of 2007. The European economy is currently
expected to grow at 1–2%. Economic conditions in emerging
markets and Asia are expected to remain robust.
On the basis of these economic projections, global manufacturing
output will increase slightly and the global cable market is
expected to show modest volume growth in 2008. Current
projections put this growth at 2–3%.
The prices of the cable industry’s main raw materials (copper,
aluminium and polymers) are expected to remain volatile in 2008.
24 | Draka Holding Report of the Board of Management

Taking into consideration the above developments, as well as the
cyclical nature of the cable industry, Draka is cautiously optimistic
for 2008 as the company is well placed, in terms of both
organisation and market position, to take full advantage of the
opportunities that the market presents and looks to the future
with confidence. In addition, Draka expects to make further
progress in 2008 towards achievement of its other strategic
objectives.
ObjectivesIn line with Draka’s strategic focus, the following objectives have
been formulated for 2008:
• Further reinforcement of the sales and marketing
organisations, with the emphasis on the special-purpose cable
activities, with the aim of stimulating organic growth.
• Continued investment in innovation, not confined solely to the
introduction of new, innovative products, but aimed at the
entire proposition Draka offers the client.
• Continuation of programmes aimed at greater focus at the
production facilities.
• Successful completion of the Triple S project at Draka Comteq,
which is expected to yield to annual cost savings of some € 12
million in 2008, € 7 million more than in 2007. Draka also
expects to make additional cost savings of around € 3 million a
year from the integration of the two head offices.
• Keeping the operating working capital ratio within a bandwidth
of 16–18% of revenue.
• Achieving an optimum free cash flow. Regular investments in
intangible assets, property, plant and equipment are expected to
turn out at around € 55 million, in line with depreciation. The
investments relating to the two special projects for the Rubber
Cable division, which are expected to amount to € 17 million in
2008, are additional to these regular investments. The free
cash flow will be invested in growth, both organic and through
acquisitions, and/or in further reducing the interest-bearing debt.
Draka Holding | 25Report of the Board of Management

Draka Cableteq
Draka Cableteq develops, manufactures and sells low-voltage and
special-purpose cables for applications in lifts, residential and other
buildings, cars, aircraft, trains, shipping, windmills, the oil and gas
industry, mobile telecommunications networks, domestic
appliances and industrial equipment and installations. This involves
both common products for cabling purposes and special-purpose
and client-specific products and applications.
Profile of Draka CableteqDraka Cableteq operates from six divisions:
Elevator Products Wide range of products for the lift and escalator
industry
Low-Voltage Cable Full range of cable products for buildings,
industry and infrastructure
Marine, Oil & Gas Full range of cables for the shipbuilding, oil
and gas industries
Mobile Network Cable Full passive antenna line for base stations for
mobile telephony
Rubber Cable Flexible rubber-insulated cable for industrial
applications and alternative energy sources
Transport Cables for applications in cars and aircrafts
Market position Top three position in Europe, strong in market
niches world-wide
Establishments Australia, Belgium, Brazil, Canada, China,
Czech Republic, Denmark, Estonia, Finland,
France, Germany, India, Indonesia, Italy, Malaysia,
Mexico, Netherlands, Norway, Oman, Philippines,
Poland, Russia, Singapore, Spain, Sweden,
Thailand, Turkey, UK, USA
Employees Approximately 6,570
Research & Development The leading position of the Draka Cableteq divisions is partly due to
the innovations they continually develop and implement. The group
regards R&D as a key activity for making an optimum response to
its clients’ needs and requirements, often in partnership with the
client itself. Continual progress is achieved in material development,
in combination with process technology, with an exchange of
knowledge between and within the divisions. Application engineering
and the improvement of materials and production processes are
important priority areas.
Notable developments and successful product launches during
2007 included:
• innovative compensating cable options designed for special
applications such as flat compensating cable for Asian markets
and compensating chain with intertwined rope for the
European market (Elevator Products);
• development of off the track cable product range for high speed
trains. All designs of signal cables including halogen free models
(Low-Voltage Cable);
• halogen free and fire resistant cable products have been
developed, tested, approved and introduced at the Baltic and
Ukraine markets (Low-Voltage Cable);
• completed the development of a thermoplastic power, control
and instrumentation cable family for application at the global
offshore oil and gas drilling, production and storage facilities.
This advanced cable family is approved to be in compliance with
both the International (IEC) and North American (IEEE) marine
shipboard standards (Marine, Oil & Gas);
• new corrugated light weight aluminium outer conductor feeder
cable (Mobile Network Cable);
• for wind energy applications new cable portfolio’s named Windflex
Global and Towerflex 1 kV – 3 kV (Rubber Cable);
• new flexible cables for the Russian mining industry that can
withstand extreme cold (Rubber Cable);
• various optimised compounds that have been tested and approved
for mining, wind power and OEM applications (Rubber Cable);
• new special insulated cable for use in the next generation of
automotive bus systems known as ‘FLEXRAY’. In the future,
standard applications in the car like ABS, ESP, airbags and
multimedia will be equipped with this special cable (Transport).
Financial resultsThe sharply rising trend in Draka Cableteq’ results observed in 2006
was sustained in 2007. All divisions contributed to the improved
result, with the Marine, Oil & Gas, Rubber Cable and Transport
divisions achieving most progress.
Draka Cableteq’ revenue rose 12.6% in 2007 to € 2,180.0 million.
Excluding the effects of acquisitions (the insulated cable activities
of International Wire Group, Inc., Cornelia Thies Kabeltechnik
GmbH and Nantong Zhongyao Mechanic Electric Co. Ltd), organic
revenue growth amounted to 5.5%, of which healthy volume
growth accounted for 5.4 percentage points and the copper price
was responsible for 0.1 percentage points.
Report on Draka Cableteq and Draka Comteq
Draka is active internationally in the development, production and sale of all kinds of cable solutions for a wide range of clients. Draka’s products are used in aircrafts, trains and cars, on ships and drilling platforms, in lifts and windmills, in homes and offices, to give just a few examples. From minute cables to cables with a diameter of several decimetres, they offer a solution for every application.
The activities are divided into two groups: Draka Cableteq, for low-voltage cables and cables for applications in specific markets, and Draka Comteq for almost all applications (copper and optical fiber) in the telecommunications and data communications market.
In terms of revenue, Draka is the world’s sixth largest cable producer and ranks third in Europe.
26 | Draka Holding Report on Draka Cableteq and Draka Comteq

Results (x € million) 2007 2006
Revenue 2,180.0 1,936.2
Operating result1 147.3 99.6
Capital expenditure 47.0 26.5
Depreciation and amortisation 36.5 37.4
Operating result as % of revenue 6.8 5.11 Excluding non-recurring items of € 6.1 million negative in 2006.
The operating result rose sharply in 2007 to € 147.3 million
(+47.9%). The improvement was attributable mainly to volume
growth, which translated into even better capacity utilisation
at Draka’s factories, and an improved product mix. Cost
savings (of around € 3 million) were also yielded by the
Triple S project in the Low-Voltage Cable division. Although
raw material prices (copper and polymers) were highly volatile
in 2007, this had no adverse effect on margins.
Elevator ProductsProducts Wide range of products for the lift and escalator
industry
Market segments Lift and escalator industry
Growth driver Construction market in general, including
maintenance and repair of lifts and escalators
Market position Global presence; no. 1 in USA, strong in Europe and
growing in Asia
Establishments Brasil, China, Czech Republic, Hong Kong, Italy,
Malaysia, Netherlands, Singapore, Spain, and USA
Employees Around 640
Customers Lift manufacturers such as Otis (USA) and
ThyssenKrupp (Germany)
Elevator Products offers the global lift and escalator industry a
growing range of products and special services aimed at the
highest level of customer satisfaction with the widest reach of
distribution in the industry. The division distributes more than
30,000 parts and components for all international lift and escalator
companies. In addition to lift cables and cable accessories the
product line consists of lift and escalator components and systems
that include wire rope, electrical items, specialty electronics and
replacement parts. Key to the division’s success is its ability to offer
‘parts kitting’ to manufacturers and installers of lifts and escalators.
They can also rely on support and advice from expert and committed
engineers for installation, maintenance, new product development
and repair work.
Market developmentsMarkets were robust in almost all regions in 2007, and especially
in China and the Middle East. Bookings were down slightly in North
America as the economy started to slow, and its already strong
market share in North America limits the opportunities for further
growth there. However this is more than compensated by a
strengthened focus on other markets such as Europe and the Far
East, in particular China. The latter country continues to represent
a tremendous market opportunity, with growth expected to be at
around 15 to 20% in 2008. Although the new building market is not
so strong in Europe there is still a high level of renovation activity.
On balance the division has maintained its market share in all regions,
and is well placed to take advantage of growth opportunities in
developing areas such as the Middle East – particularly the UAE
and Dubai, Russia and of course China.
Developments in the divisionA key event in 2007 was the intended acquisition of DeBiase Lift
Components in Milan, Italy, which will help the division to better
align its business in Europe with customer needs. As a result the
division’s European headquarters will be relocated to Milan from
Oudenbosch, Netherlands.
Underlining the strong focus on growth in China and the Far East,
a second jointly owned company Zhongyao Draka was entered
into in mid-2007 alongside the existing joint venture Haixun Draka.
These joint venture companies will further strengthen the ability
to address this market, as well as contributing exports for the rest
of Asia and Europe. A technology license for seismic sensors
further extends the range of technology solutions for the global
elevator market, and manufacturing has been transferred to
Zhongyao Draka in China.
The strategic partnership in Brazil has been extended with an
additional cable line to further increase the ability to compete
with local manufacturers. The division’s competitive proposition
continues to be based on globally managed manufacturing at
four locations around the world with cost-effective local
production and distribution. This meets the needs of major OEM
customers to manufacture globally standardised products and
deal with a single supplier with whom they can negotiate global
contracts. Dealing direct with OEMs takes out a layer of cost
normally associated with distribution channels and gives
customers direct contact with development and engineering
departments. The roll-out of the EFM (Extended Factory Model) is
continuing to give positive results, and further progress has been
made in increasing productivity and reducing costs at customer
manufacturing locations.
Low-Voltage CableProducts Low- and medium-voltage cables, ranging from
installation to instrumentation and control cables
Market segments Construction, industry, infrastructure, electrical
applications, defence industry
Growth driver Construction market in general
Market position No. 3 in Europe; outside Europe focusing on
market niches
Establishments Australia, Belgium, Czech Republic, Denmark,
Estonia, Finland, France, Germany, Hong Kong,
India, Indonesia, Malaysia, Netherlands, Norway,
Oman, Poland, Russia, Singapore, Spain, Sweden,
Thailand, Turkey, UK and USA
Employees Around 3,685
Customers Construction and installation companies, technical
wholesalers like Hagemeyer (Netherlands),
Sonepar (France) and Rexel (France)
Draka Holding | 27Report on Draka Cableteq and Draka Comteq

Low-Voltage Cable develops, produces and sells low- and medium-
voltage cables. The portfolio covers the entire range, from
installation cables and flexible PVC cables to instrumentation
cables. The division also produces special-purpose products such
as halogen-free cable and cables with low smoke emissions. With
advanced production facilities and local sales teams, the division
operates on the basis of the ‘global-for-local’ concept. The
products are distributed mainly via technical wholesalers. The
division works closely with these distribution houses in the fields
of logistics and other services. For example by means of training
for sales teams and their customers (construction and installation
companies) it can provide added-value support for installers.
Products are also applied in industry and in the infrastructure sector.
Market developmentsAmong the most notable developments in 2007 was the
slowdown in the residential market in Southern Europe. While
the market in Spain was down by as much as 20% in the
second half year due mainly to excessive levels of apartment
building in past years, growth in the rest of the region declined
less strongly to around the same level as the underlying
economies, from the double-digit levels seen in past years.
However this decline was compensated by the continued good
level of business in the industrial and infrastructure sectors.
These continue to show healthy growth, and as well the
division was able to increase its market share slightly in most
parts of Europe.
28 | Draka Holding Report on Draka Cableteq and Draka Comteq
Building a consistent Draka culture,
strengthening networking on a global
basis and helping talented employees to
grow to top management positions. The
management masterclass fits in a culture
that enables people to maximise their
opportunities. “It’s part of a continuing
learning process”, says Ronnie George,
President Marine, Oil & Gas.
“Following a period of strong growth and
acquisitions in 1999 and 2000, we needed to
define the Draka culture on a more consistent
basis. There was already an understanding of
Draka and what it stood for in the companies
that were acquired at that time. And even
though there was no formal set of values, or
even a process to develop them, if you asked
anyone in the organisation around the world
you would get the same answer: we’re a
business that depends on delivering effective
customer service, and the vital factor in
achieving that is the people.”
Marine, Oil & Gas is essentially a service and
distribution business. With products coming
from about nine factories all around the
world, the key success factor is ensuring the
availability of those products to customers
when they need them, and providing all the
necessary supporting services. That’s why the
masterclass plays such a vital role in net-
working and teambuilding among the division’s
managers, wherever they are located.
‘Leap of faith’
Ronnie George took part in one of the first
masterclasses in late 2001, some three years
after his company Delta Cables was acquired
by Draka. “At that time it was a ‘leap of
faith’”, he explains. “We wanted to
strengthen the links between our managers
in the different companies that had been
acquired, even though they were at widely
separated locations and in some cases
serving customers in different industries.”
As well as emphasising networking, the master-
class also help to develop management skills
in a very practical way. The learning process
includes assignments set by the Board of
Management which focus on critical issues
for the business. It challenges teams to
stand up and identify suboptimal processes
in the spotlight of the Board of Management,
and to come up with improvement
proposals. “It’s almost like another job, and
you learn to lean on each other and rely on
colleagues to achieve the tasks you’re set.”
Fast, flexible teambuilding
“Of course that’s very valuable in everyday
business, because you also have to depend
on support from your colleagues in complex
“Bringing together the talent in the organisation”
Personal growth: management masterclass is powerful networking tool

In both Western and Eastern Europe the picture was largely the
same as the preceding year, with healthy growth maintained
through most of the year.
Developments in the divisionStrong emphasis continues to be placed on the one hand on
partnerships with wholesalers as the key to building business
among installers, and on the other hand on supporting the
installers themselves with products that are conveniently available
and easy to install. The aim towards wholesalers is to help them to
sell, and towards installers to make it quick and easy for them to
select exactly the products they need from the Draka Low-Voltage
Cable range. Specific sales support activities include product
demonstrations, joint roadshows together with wholesalers and
customer visits. The positive response from installers underlines
the appreciation for the Draka brand that these activities help to
generate. A vital aspect of this form of sales support is its role in
strengthening the positioning of Draka as an ‘A’ brand that users
and specifiers can trust, thereby helping the division to compete
effectively with brands whose only weapon is price.
The internal Triple S programme was continued in 2007. The aim
is to stop activities with insufficient margins, to swap production
between factories to increase efficiency by concentrating and
specialising, and to share knowledge and best practices by
connecting people at all levels in the organisation. The latter
Draka Holding | 29Report on Draka Cableteq and Draka Comteq
global processes”, says Ronnie George. “It’s
essential to understand who owns what part
of the process – especially in today’s fast-
changing world, for example with
shipbuilding activities in China expected to
double in the next five years. In situations
like that you need a fast and flexible ‘virtual
teambuilding’ capability to respond
effectively to the demands of specific projects.”
According to Ronnie George, the masterclass
is just one aspect of a company culture based
on pride in your work. That also explains the
long service of most employees, and their
loyalty to ‘the world’s most trusted cable
brand’. “Leadership styles vary greatly, but
“Cutting through to the right person if there’s a problem”
“With colleagues who’ve also been on the masterclass, I can cut through to the right
person if there’s a problem, without any politics. That highlights the value I get personally.
Participants are nominated by the divisional presidents in close collaboration with HR, and
there’s almost a feeling of envy if you’re left out. There’s an all-round focus that aims to
address the gaps in the organisation – working capital, operations, sales and marketing
or whatever else they may be. The aim is to improve the talent pool in the organisation
through training and development, and to teach people to formulate strategy.
That leads to some serious proposals, and it’s very empowering for the participants.”
what they all have in common is open
communication and treating people fairly.
I strongly believe the majority of our people
enjoy their work, feel they have good
opportunities and have confidence in
management. And of course that translates
directly into the effort they put into
customer service.”
Ronnie George, President Draka Marine, Oil & Gas

applies not only to manufacturing, but increasingly also to sales,
accounting, IT, warehousing, engineering, marketing and
purchasing, in all of which significant operational improvements
are being achieved.
A number of important projects were supplied with cables from
Draka in 2007. Especially in Asia Pacific these included the
delivery of fire performance cables for the longest underground
tunnel in South East Asia (Singapore), for the Venetian Theatre
for Circus du Soleil in Macau, for the Government - MEA Tunnel
Power supply (Thailand) and secured the supply of fire
performance cables for the high profile Formula I night circuit
race track which will be delivered in 2008 (Singapore).
Furthermore, Draka completed the delivery of instrumentation
and control cables for the Vietnam DungQuat Crude Oil refinery
project in 2007.
After three years of development, Draka received in the USA an
award from General Atomics to manufacture high power cables
used in the Electromagnetic Aircraft Launch System (EMALS).
This system will revolutionize the way fixed wing aircraft are
launched from the decks of aircraft carriers. The cables will
transmit the power from the ship’s electrical system to the
induction motors used to launch the aircraft.
Marine, Oil & GasProducts Cable solutions for the shipbuilding and oil and
gas industries in compliance with strict industry
standards
Market segments Drilling rigs and vessels
Growth driver Investments by oil industry
Market position Strong position in North-western Europe,
prominent in North America and Far East
Establishments China, Netherlands, Norway, Singapore, UK
and USA
Employees Around 185
Customers Oil and Gas offshore industry, technical installation
companies, shipyards
Marine, Oil & Gas supplies advanced, cost-effective cable solutions
for the shipbuilding and oil and gas industries. The cables, produced
in compliance with strict industry standards such as IEEE, IEC and
NEK, contribute to human safety and ensure that vessels and
drilling rigs can be used reliably for long periods. The division’s
products include halogen-free, flame-retardant, fire-resistant and
dust-resistant cables with excellent physical and electrical
properties. These cables are resistant to oil, wear and tear and
petrochemical fluids, among other things.
Market developmentsToday’s high oil price and increasing demand make exploration and
production viable at much greater offshore distances and depths
than in the past. With a break-even point much lower than the
present oil price, all available rigs are currently operating at
capacity and there is a backlog of work in both the new building
and repair markets. Substantial new finds such as that by
Petrobras off the coast of Brazil – potentially one of the world’s
largest oil and gas fields – should help to keep demand at high
levels for the coming years. The wide range of different
environments in which rigs and platforms have to work – from
arctic icecaps to the tropics – is leading to a new generation of
multipurpose rigs. These are often owned by leasing companies
and can operate anywhere in the world, placing stringent demands
on cable specifications.
Demand for rigs is outstripping the available capacity, leading to a
very strong outlook for the next three to five years. The situation
in the shipbuilding market is much more commoditised, and there
is greater sensitivity to price, with two thirds of the global market
in Asia. Although the present high level of global trade is leading
to a shipping boom, the market is more cyclical than the oil & gas
industry, and is more sensitive to the economy and regional
developments. Growth in China is particularly strong, especially
with the migration of companies from Singapore where there is
no further room for growth.
Developments in the divisionThe division is focusing on further strengthening its position in
both the offshore and shipbuilding markets, building on its 35-
year track record and established brand values of high product
quality, excellent delivery performance and strong service close
to the customer. In the offshore market, the ability to deliver
cables meeting the most demanding specifications such as the
Norwegian NEK606 offshore and marine standard is an
important strength. Even when rigs are built elsewhere the high-
value engineering works are often carried out in European yards.
The division’s familiarity with the applicable standards means it is
well placed to supply cables to exactly the required specifications.
A significant development in the offshore market is the supply of
complementary products from leading brands as part of a
complete package for builders of rigs and platforms, with 15% of
sales in the USA in 2008 expected to be of non-cable products.
In shipbuilding the division has a growing presence in China,
where it is close to the shipyards and able to provide products of
proven quality with strong local service. This is often a decisive
factor in winning orders, together with the economics of local
Chinese production. When cables account for only around 5% of
a vessel’s total costs, shipbuilders prefer Draka’s assurance of
quality and fitness for purpose, rather than take risks with less
qualified products for relatively small price savings.
Mobile Network CableProducts Complete Draka Antenna Line Products for base
stations
Market segments Mobile telecommunication
Growth driver Investments by mobile telecom operators
Market position Global third-ranking position
Establishments Brazil, China, Finland, Singapore, and USA
Employees Around 185
Customers Suppliers and operators of mobile
telecommunication networks
30 | Draka Holding Report on Draka Cableteq and Draka Comteq

Mobile Network Cable is one of the leading producers of mobile
network cable, supplying the complete Draka Antenne Line
Products for base stations. Products range from Radio Frequency
feeder cables, jumper cables and highly flexible cables to
connectors, EMP protectors and other accessories. The cables
are used for mobile telecommunication applications such as GSM,
WCDMA (UMTS), TDMA, D-AMPS, PCN, CDMA, TETRA and WiMAX.
Mobile network cable is produced to the highest quality and strict
environmental standards. The division works according to the
one-stop-shop principle, allowing customers to rely on fast delivery
and service.
Market developmentsThe market trend was similar to that in the preceding year, with
continuing strong growth opportunities in the emerging markets.
The main growth area is the Asia-Pacific region, although the
presence of all major competitors is placing strong pressure on
prices. Especially in China a number of new local players have
entered the market with very low prices. Customers and especially
the major OEMs are increasingly price-conscious, which further
underlines the need to operate with maximum cost-effectiveness.
The process of awarding licenses for 3G services is currently under
way in China. It is not yet clear how this market will develop in the
future. China uses its own network technology, and the market is
mainly served by local companies. Market growth in other regions
is much more modest compared with Asia. In Latin America
growth although still positive has slowed, and Eastern Europe has
not yet developed as expected. In both Western Europe and
North America investments in 3G networks are increasing slowly,
although operators in general are reluctant to make major new
investments. A new driving force may be the increasing attention
for mobile data communication and Internet access.
Developments in the divisionA major development during 2007 was the expansion of capacity
at the factory in Wuhan, China to meet the rapidly increasing
demand for mobile network infrastructure in the region. The
additional capacity was brought on stream in the last quarter of
the year. This facility allows faster, more cost-effective logistics,
contributing to lower costs throughout the Asia region.
Globally the division is a lean and flexible partner to its customers,
offering local service and fast response times to their requirements. To
meet the challenge of the current price war the division has further
intensified its focus on continuous cost reduction and increased
productivity in the factories, with reductions in material usage
and renewed work on finding solutions to replace expensive copper.
Rubber CableProducts Flexible, rubber-insulated LV and MV cables
according to harmonised standards and
client-specific designs
Market segments Equipment construction, industry, mining,
material handling, mass transport, wind turbines
and solar systems
Growth driver Equipment construction, industrial investments,
investments in mining and exploration and
alternative energy sources
Market position Top 2 position in Europe; global market leader
in cable for wind turbines
Establishments China, Denmark, Germany, Netherlands, Norway,
Sweden and USA
Employees Around 615
Customers OEM’s, operators (like mining, cranes, harbours),
technical wholesalers like Hagemeyer
(Netherlands), Sonepar (France) and Rexel
(France), industrial equipment manufacturers
active in the mining and windmill markets
Rubber Cable develops, produces and sells flexible, rubber-insulated
cables according to standard specifications, harmonised standards
and customer-specific designs. The division also supplies special
flexible cables for power and medium-voltage applications. The
rubber cables are applied in wind turbines, open-cast and
underground mining and for magnetically levitated and high-speed
trains. The division’s special rubber cables are also used world-wide
in IT, the robotic and processing industries, container terminals,
industrial cranes, offshore platforms and building sites.
Market developmentsOverall market demand remained at a high level in 2007, with high
single-digit growth across all market segments. The strongest growth
driver was renewable energy, where demand showed double-digit
growth. Wind energy has now reached around the same cost level
as coal-fired power generation, and the development of solar energy
is also following on the same curve. Other important markets are
wholesalers, projects and industry, especially manufacturers of
material handling systems and cranes. Demand for the latter
remains strong from both manufacturers and subcontractors,
as ports and container terminals are increasing their capacity
worldwide. With the strong prices for coal and metals the mining
industry is also growing, and demand for cables to renovate
equipment for both underground and surface mining is increasing.
Sales through wholesalers are particularly strong in the Nordic
countries, the Netherlands and Central Europe. These channels
mainly serve the market for temporary power and lighting
installations at special events and construction sites, with stable
sales in line with GDP growth.
Developments in the divisionSpecially developed products are a key factor for the division’s
success in the renewable energy market. Cables used in wind energy
turbines must be able to resist harsh environmental conditions,
with temperatures ranging from -40°C to +90°C and often high
ozone levels. In addition they must have excellent mechanical
Draka Holding | 31Report on Draka Cableteq and Draka Comteq
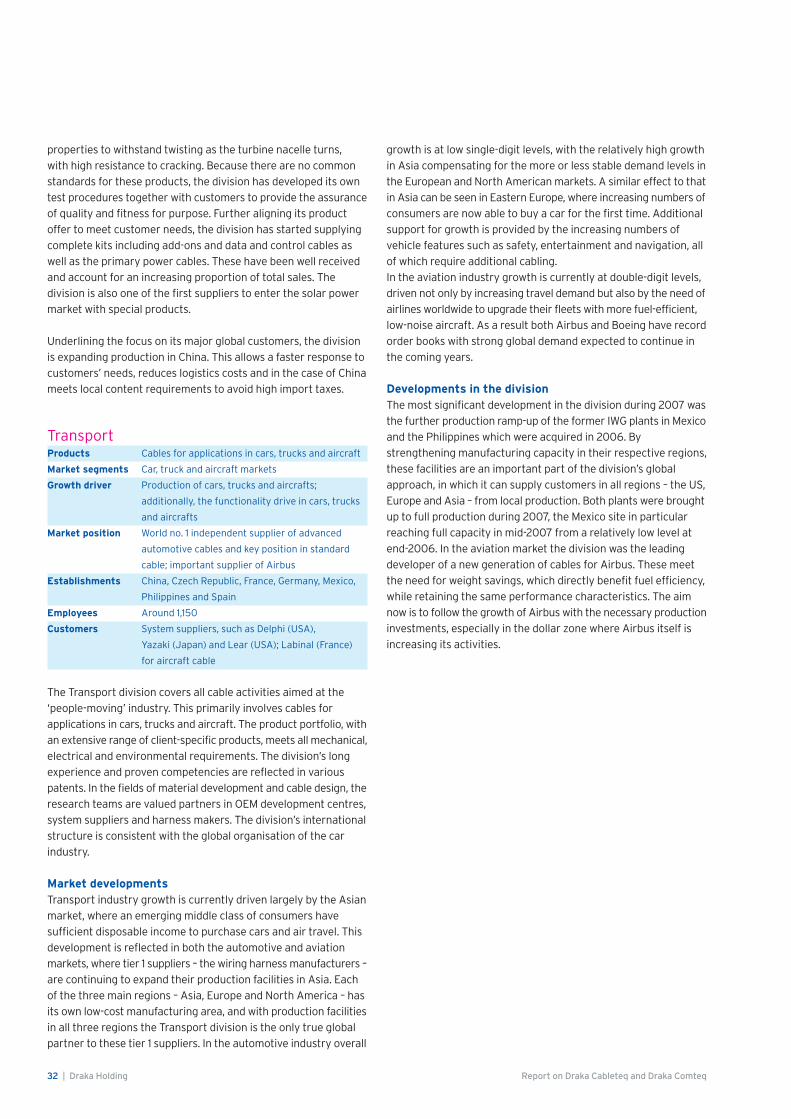
properties to withstand twisting as the turbine nacelle turns,
with high resistance to cracking. Because there are no common
standards for these products, the division has developed its own
test procedures together with customers to provide the assurance
of quality and fitness for purpose. Further aligning its product
offer to meet customer needs, the division has started supplying
complete kits including add-ons and data and control cables as
well as the primary power cables. These have been well received
and account for an increasing proportion of total sales. The
division is also one of the first suppliers to enter the solar power
market with special products.
Underlining the focus on its major global customers, the division
is expanding production in China. This allows a faster response to
customers’ needs, reduces logistics costs and in the case of China
meets local content requirements to avoid high import taxes.
TransportProducts Cables for applications in cars, trucks and aircraft
Market segments Car, truck and aircraft markets
Growth driver Production of cars, trucks and aircrafts;
additionally, the functionality drive in cars, trucks
and aircrafts
Market position World no. 1 independent supplier of advanced
automotive cables and key position in standard
cable; important supplier of Airbus
Establishments China, Czech Republic, France, Germany, Mexico,
Philippines and Spain
Employees Around 1,150
Customers System suppliers, such as Delphi (USA),
Yazaki (Japan) and Lear (USA); Labinal (France)
for aircraft cable
The Transport division covers all cable activities aimed at the
‘people-moving’ industry. This primarily involves cables for
applications in cars, trucks and aircraft. The product portfolio, with
an extensive range of client-specific products, meets all mechanical,
electrical and environmental requirements. The division’s long
experience and proven competencies are reflected in various
patents. In the fields of material development and cable design, the
research teams are valued partners in OEM development centres,
system suppliers and harness makers. The division’s international
structure is consistent with the global organisation of the car
industry.
Market developmentsTransport industry growth is currently driven largely by the Asian
market, where an emerging middle class of consumers have
sufficient disposable income to purchase cars and air travel. This
development is reflected in both the automotive and aviation
markets, where tier 1 suppliers – the wiring harness manufacturers –
are continuing to expand their production facilities in Asia. Each
of the three main regions – Asia, Europe and North America – has
its own low-cost manufacturing area, and with production facilities
in all three regions the Transport division is the only true global
partner to these tier 1 suppliers. In the automotive industry overall
growth is at low single-digit levels, with the relatively high growth
in Asia compensating for the more or less stable demand levels in
the European and North American markets. A similar effect to that
in Asia can be seen in Eastern Europe, where increasing numbers of
consumers are now able to buy a car for the first time. Additional
support for growth is provided by the increasing numbers of
vehicle features such as safety, entertainment and navigation, all
of which require additional cabling.
In the aviation industry growth is currently at double-digit levels,
driven not only by increasing travel demand but also by the need of
airlines worldwide to upgrade their fleets with more fuel-efficient,
low-noise aircraft. As a result both Airbus and Boeing have record
order books with strong global demand expected to continue in
the coming years.
Developments in the divisionThe most significant development in the division during 2007 was
the further production ramp-up of the former IWG plants in Mexico
and the Philippines which were acquired in 2006. By
strengthening manufacturing capacity in their respective regions,
these facilities are an important part of the division’s global
approach, in which it can supply customers in all regions – the US,
Europe and Asia – from local production. Both plants were brought
up to full production during 2007, the Mexico site in particular
reaching full capacity in mid-2007 from a relatively low level at
end-2006. In the aviation market the division was the leading
developer of a new generation of cables for Airbus. These meet
the need for weight savings, which directly benefit fuel efficiency,
while retaining the same performance characteristics. The aim
now is to follow the growth of Airbus with the necessary production
investments, especially in the dollar zone where Airbus itself is
increasing its activities.
32 | Draka Holding Report on Draka Cableteq and Draka Comteq

Draka Comteq
Draka Comteq primarily develops, produces and sells optical fiber,
optical fiber cable and copper cable for applications in
telecommunication and data communication. Draka Comteq also
manages the engineering and installation of its products as well
as complementary hardware products from others in networks
throughout the world.
The worldwide optical fiber and communication cable activities of
Draka and Alcatel-Lucent S.A. were brought together on 1 July 2004
in Draka Comteq B.V., in which Draka had a 50.1% interest and
Alcatel-Lucent a 49.9% interest. On 27 December 2007, Draka
secured full ownership of Draka Comteq by acquiring Alcatel-Lucent’s
49.9% interest (see also the Report of the Board of Management).
Profile of Draka ComteqDraka Comteq approaches the international market for
telecommunication and data communication cable with four
divisions offering a complete product range to their customers:
• Draka Comteq Cable Solutions, EMEA (Europe, Middle East and
Africa)
• Draka Comteq Cable Solutions, Americas
• Draka Comteq Cable Solutions, Asia/Pacific
• Draka Comteq Optical Fiber
The Draka Comteq divisions concentrate on the following areas:
Telecommunications Copper and optical fiber cable solutions,
passive access networks, connectivity,
project services, and turnkey solutions
Data Communication Copper and optical fiber cable solutions for
Local Area Network (LAN’s) applications
Optical Fiber Development, production and sale of single
mode, multimode and specialty optical fiber
Market position Market leader in Europe, no. 1 in China
(optical fiber telecommunication cable),
no. 3 in North America (optical fiber
telecommunication cable)
Establishments Brazil, China, Denmark, France, Germany,
Netherlands, Norway, Russia, Singapore,
Slovak Republic, Spain, UK and USA
Employees Approximately 2,915
Research & DevelopmentThe technological developments at Draka Comteq were once
again dominated in 2007 by Fiber-To-The-Home (FTTH), 10 Gbit
Ethernet and High Definition Television. The clear focus was on
cable and connectivity solutions in the emerging FTTH market.
Moreover, the R&D activities are continuing to make a major
contribution towards the reduction of production costs and
improved products for new higher performance applications. The
improvement of the quality of production processes also remains
an important objective of R&D.
Notable developments in 2007 included:
• introduction of a new optical fiber coating product capable of
150°C continuous operation. The new coating can be offered in
combination with state-of-the-art multimode and on single
mode PCVD made glass. This new coating capability opens the
route to a wide family of products with applications and
performances that were not achievable in the past;
• market introduction of Draka’s proprietary optical fiber coating
ColorlockXS providing optical fiber with superior microbending
resistance performance and vibrant colors. BendBrightXS with
ColorlockXS is the most forgiving fiber for FTTx installations;
• introduction of connectivity products utilizing Draka’s
BendBrightXS technology:
• compact optical distribution frame based on BendBrightXS
technology with single circuit fiber management;
• new splice trays based on the reduced bending radius for
the fiber leading to a huge reduction in size;
• optical splitters saving space by minimizing the bend radius
of input and output fibers;
• for the FTTH market different solutions depending on the
installation environment or project roll-out have been developed:
• sewer distribution cabling system: a flextube distribution
cable with 720 fibers allowing the midspan window access.
For the building access the derivation duct, a branch closure
and the full set of tools complete the solution;
• flextube outdoor distribution cables: a complete range of
duct cables up to 720 fibers is available. In addition small size
flextube cables for duct and aerial installation;
• significant capacity expansion for optical fiber manufacturing
in Draka’s existing plants in France and USA.
Financial resultsDraka Comteq posted substantially improved results in 2007, despite
continuing strong competition. All divisions contributed to the
improved results, in particular the Optical Fiber division. Revenue
was 7.2% higher at € 636.2 million, entirely due to organic growth.
Higher volume accounted for 8.3 percentage points of this increase
in revenue and the combination of the higher copper price and
the adverse effects of the lower dollar-euro exchange rate on its
European optical fiber activities had a downward impact of 1.1
percentage points. Draka Comteq achieved volume growth in all
market segments except copper telecommunication cable, but
organic growth in revenue was held back to some extent by the
continuing pressure on selling prices.
Results (x € million) 2007 2006
Revenue 636.2 593.2
Operating result 1 13.1 5.5
Capital expenditure 23.9 20.2
Amortisation, depreciation and impairment 15.6 23.4
Operating result as % of revenue 2.1 0.91 Excluding non-recurring items of € 26.8 million negative in 2006.
The operating result excluding non-recurring items more than
doubled to € 13.1 million, as against € 5.5 million in 2006. The strong
volume growth, which translated into higher capacity utilisation
Draka Holding | 33Report on Draka Cableteq and Draka Comteq
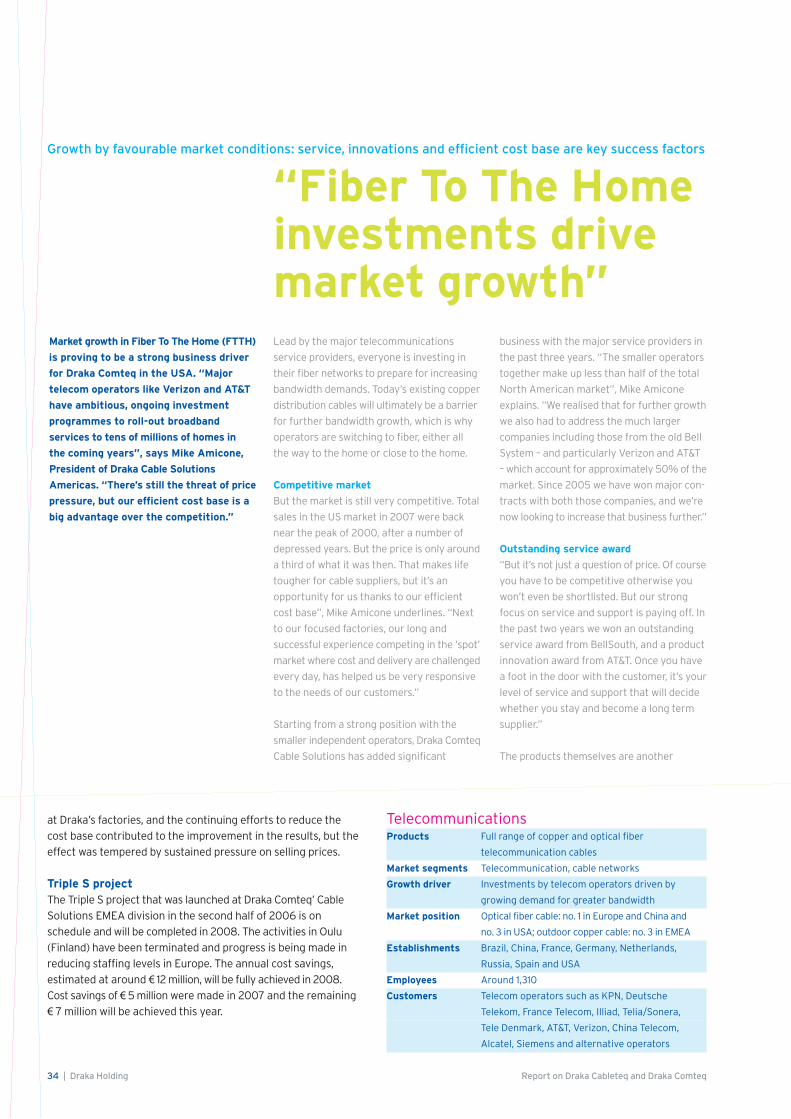
at Draka’s factories, and the continuing efforts to reduce the
cost base contributed to the improvement in the results, but the
effect was tempered by sustained pressure on selling prices.
Triple S projectThe Triple S project that was launched at Draka Comteq’ Cable
Solutions EMEA division in the second half of 2006 is on
schedule and will be completed in 2008. The activities in Oulu
(Finland) have been terminated and progress is being made in
reducing staffing levels in Europe. The annual cost savings,
estimated at around € 12 million, will be fully achieved in 2008.
Cost savings of € 5 million were made in 2007 and the remaining
€ 7 million will be achieved this year.
TelecommunicationsProducts Full range of copper and optical fiber
telecommunication cables
Market segments Telecommunication, cable networks
Growth driver Investments by telecom operators driven by
growing demand for greater bandwidth
Market position Optical fiber cable: no. 1 in Europe and China and
no. 3 in USA; outdoor copper cable: no. 3 in EMEA
Establishments Brazil, China, France, Germany, Netherlands,
Russia, Spain and USA
Employees Around 1,310
Customers Telecom operators such as KPN, Deutsche
Telekom, France Telecom, Illiad, Telia/Sonera,
Tele Denmark, AT&T, Verizon, China Telecom,
Alcatel, Siemens and alternative operators
34 | Draka Holding Report on Draka Cableteq and Draka Comteq
Market growth in Fiber To The Home (FTTH)
is proving to be a strong business driver
for Draka Comteq in the USA. “Major
telecom operators like Verizon and AT&T
have ambitious, ongoing investment
programmes to roll-out broadband
services to tens of millions of homes in
the coming years”, says Mike Amicone,
President of Draka Cable Solutions
Americas. “There’s still the threat of price
pressure, but our efficient cost base is a
big advantage over the competition.”
business with the major service providers in
the past three years. “The smaller operators
together make up less than half of the total
North American market”, Mike Amicone
explains. “We realised that for further growth
we also had to address the much larger
companies including those from the old Bell
System – and particularly Verizon and AT&T
– which account for approximately 50% of the
market. Since 2005 we have won major con-
tracts with both those companies, and we’re
now looking to increase that business further.”
Outstanding service award
“But it’s not just a question of price. Of course
you have to be competitive otherwise you
won’t even be shortlisted. But our strong
focus on service and support is paying off. In
the past two years we won an outstanding
service award from BellSouth, and a product
innovation award from AT&T. Once you have
a foot in the door with the customer, it’s your
level of service and support that will decide
whether you stay and become a long term
supplier.”
The products themselves are another
“Fiber To The Homeinvestments drive market growth”Lead by the major telecommunications
service providers, everyone is investing in
their fiber networks to prepare for increasing
bandwidth demands. Today’s existing copper
distribution cables will ultimately be a barrier
for further bandwidth growth, which is why
operators are switching to fiber, either all
the way to the home or close to the home.
Competitive market
But the market is still very competitive. Total
sales in the US market in 2007 were back
near the peak of 2000, after a number of
depressed years. But the price is only around
a third of what it was then. That makes life
tougher for cable suppliers, but it’s an
opportunity for us thanks to our efficient
cost base”, Mike Amicone underlines. “Next
to our focused factories, our long and
successful experience competing in the ‘spot’
market where cost and delivery are challenged
every day, has helped us be very responsive
to the needs of our customers.”
Starting from a strong position with the
smaller independent operators, Draka Comteq
Cable Solutions has added significant
Growth by favourable market conditions: service, innovations and efficient cost base are key success factors

Within the telecommunications market segment, Draka Comteq
concentrates on copper and optical fiber cable solutions, project
services and turnkey solutions. Its solutions for large and small
networks enable the growing demand for greater bandwidth
to be met, while it also provides long-distance cables for
telecommunication networks. Apart from the development,
production and delivery of cable solutions, Draka Comteq
concentrates on the realisation of complete network projects in
partnership with installation companies. Experienced project
managers, engineers and support workers take responsibility for
the design, engineering or even management of the complete
installation or expansion of telecommunication networks.
Market developmentsOptical fiber demand was up strongly in Western Europe with
over 14% growth compared with 2006 due to strong broadband
investments by both independent and incumbent operators.
However in the Americas demand was relatively flat, influenced
largely by excess inventory at a major operator which had to be
absorbed in 2007. Business in Europe was driven not only by the
large operators, but also by network developments by new entrants
such as municipalities, housing corporations, utilities and property
developers, all of whom want to offer their customers high-speed
network facilities. The strongest growth was in the Nordics and
Southern Europe regions, although the markets in Turkey, the
Near and Middle East and South Africa are also favourable with
operators in the early stages of rolling-out their FTTH networks.
In the USA, FTTH has become a strategic action to offer
broadband services in competition with the cable TV providers.
Although South America is still a relatively small market growth
Draka Holding | 35
Mike Amicone, President Draka Cable Solutions Americas
Report on Draka Cableteq and Draka Comteq
important part of the Draka Comteq Cable
Solutions growth strategy, as customers
look for the optimum solutions to maximise
their share of the growing market for
broadband and the related services. “Ease of
deployment is vital to operators because of
the high labour element in total costs”, Mike
Amicone points out. “Our recently introduced
BendBrightXS fiber helps to speed up
installation by its high flexibility. For example
this makes it easy to install in the numerous
sharp bends typical in multiple dwelling
buildings, with no signal degradation. In
addition, we’re shipping more cables with
connectors already attached or with easy-to-fit
connection solutions. We’re constantly
“Opportunities for cost-efficient suppliers”
“It’s much harder now to make money in the cable business than during the last boom
period which ended in 2000-2001. That’s especially true in fiber, where there are still five
major suppliers, compared with just two in the copper cables market. Most analysts think a
shake-out is around the corner, which will further strengthen the position of cost-efficient
suppliers like Draka. On the manufacturing side, the reorganisations which we initiated a
couple of years ago have made a big contribution to improving our cost base. In addition,
we can leverage our global manufacturing locations to increase our competitive strength.
We believe we can turn today’s weak dollar into another opportunity for growth.”
working on new and innovative applications
that will enable us to increase our share of
business with the operators. The increasing
penetration of FTTH is an important part of
that, not only in the networks themselves but
also in high-rise buildings. Our strong product
portfolio and high service level give us a unique
proposition to benefit from the market growth.”

is strong, particularly in Brazil but also in Argentina where
development is starting rapidly.
The share of copper cable continues to decline, although some
operators in Eastern Europe are still installing copper networks
because of their familiarity with the technology.
Developments at Draka ComteqImplementation of the focused factory programme was continued
in 2007, aiming at increasing efficiency by combining product
groups at specialised factories. This is especially important because
of the wide variety of custom-made products, all made to order
for customers demanding short lead times. To meet these needs
Draka Comteq is in constant dialogue with customers, with
forecast-based capacity reservation to guarantee response times
for the most important customers. A part of the commercial
operation has also been focused on FTTH cables because of the
special knowledge required for this application. Draka Comteq’s
ability to offer customers in-depth support for network design
distinguishes it strongly from competitors. For example, it can
provide a complete design for a city area within a very short period
of time, including bill of materials and costings, saving much time
and work for the customer. Such early dialogue with the customer
regarding network requirements provides a clear competitive
advantage. In the USA, capacity at the Claremont, N.C., plant is
currently being expanded to meet the expected North American
demand in the coming years. After reopening the fiber plant in
South America in 2005, this facility has now also been expanded
to full capacity to meet growing local demand. Production started
in 2007 of a new generation of gel-free cables using swellable
powder instead of the traditional gel filling to waterproof the
fibers. These products are becoming popular in some segments of
the US market.
Data CommunicationProducts Copper and optical fiber cable solutions for Local
Area Network (LAN’s) applications in the data and
communication market, and specialized cables
for applications in Broadcast / HDTV, RF, and OEM
applications
Market segments Data communication, broadcast
Growth driver IT investments; investments in LAN’s driven by
growing demand for greater bandwidth
Market position No. 1 in Europe
Establishments China, Denmark, Germany, Netherlands, Norway,
Singapore, Slovak Republic, UK and USA
Employees Around 730
Customers Technical wholesalers, distributors, OEM and
system providers
With a wide product range and the ability to provide solutions for
all forms of communication, Draka Comteq offers copper and optical
fiber cable solutions within the data communication market for
all kinds of data transmission. The applications extend to both the
office and home environment. Draka Comteq also offers a unique
blend of specialty cable for high performance applications for
broadcast including new HDTV camera systems along with other
specialised Original Equipment Manufacturers (OEM) applications.
Market developmentsStrong demand for data communication cables continues in the
major markets. The focus is on high-end solutions in new buildings
as well as renovation projects. In most cases internal indoor
distribution continues to be by means of copper wire, which still
accounts for over 80% of sales, although the share of fiber is
increasing progressively under ever increasing bandwidth demands
and gigabit network roll outs. Growth in the data communications
area is relatively sensitive to the economic climate, and is not as
rapid as in the telecommunications area, but is expected to continue
to increase steadily in the coming years. Draka Comteq has
extended its number one position in Europe, gaining ground
further over competitors. The focus is on markets with higher
growth rates such as those in South and South-East Europe,
Germany and Central Europe.
Developments at Draka ComteqMost of the sales in data communication are through local parties
such as distributors, installers and VARs who have a good
knowledge of their local markets and customers. Sales efforts are
therefore concentrated on providing these parties with maximum
support in building their business. The new cable manufacturing
facility in Presvov (Slovak Republic) which was opened in late 2006
has now come fully on-stream and will provide the capacity
needed to meet the expected increase in demand in the coming
years. Constant attention is being given to the development of
new products, particularly those offering solutions for increased
bandwidth demands.
Optical FiberProducts Preforms, single mode and multimode optical
fiber, tailored fiber solution (Specials)
Market segments Telecommunications, data communication,
transport and industrial
Growth driver Investments by telecom operators, IT investments,
extension of fiber application portfolio
Market position No. 1 worldwide in multimode optical fiber;
no. 2 worldwide in single mode optical fiber
Establishments Brazil, China, France, Netherlands and USA
Employees Around 860
Customers Cable makers for telecommunications and data
communications applications, engineering
consultants and network integrators
In the optical fiber market Draka Comteq develops and
manufactures fiber products to service single mode optical fiber
(for telecommunication) and multimode optical fiber (for data
communication) and specialty fibers for tailored solutions. These
products support both internal use and sale to third parties.
The production of preforms and optical fiber (‘drawn’ from the
preforms) takes place in Draka Comteq. The optical fiber is
manufactured using Draka’s own Plasma-activated Chemical Vapour
Deposition (PCVD) process, which enables the core of the optical
36 | Draka Holding Report on Draka Cableteq and Draka Comteq

fiber to be produced with high efficiency. This is combined with the
Advanced Plasma Vapour Deposition (APVD) process developed by
Alcatel, a highly efficient method for manufacturing the overcladding
of the optical fiber. Draka Comteq owns the intellectual property
rights to both processes (PCVD and APVD).
Market developmentsThe year 2007 saw the largest-ever consumption of optical fiber
worldwide, with a 13% growth year on year on the back of growth
levels of in excess of 20% per year in 2006 and 2005. This sustained
good performance was demonstrated across the majority of the
globe with even the lower reported performance in USA being
attributable to inventory correction with Verizon the largest user
in that market and compensated by good growth in all other
segments of that market. The drivers of growth centered around the
need for additional sustainable Bandwidth provision whether in terms
of infrastructure roll-out and expansion in for example China, India,
Latin America and Russia, and widespread maintenance,
renovation of installed base and introduction of significant FTTx
installations in Western Europe, North America and Japan.
Draka Comteq’s global footprint and comprehensive product
portfolio has meant that it has benefited considerably from this
activity further reinforcing its number 1 market position in Europe
and Asia, and growing position as a top 3 player in the America’s.
Pricing (in US dollars) remained stable after years of continued
erosion, reflecting the strong demand for optical fiber products.
Developments at Draka ComteqDraka Comteq continued its process of rolling-out next-generation
processes in manufacturing to make its operations faster, more
productive and lower cost. Significant developments have already
taken place in this area, focused on implementing state-of-the-art
processes, and providing reliable and innovative supply solutions
in servicing its customers.
New developments continued to focus on reducing both the
cost of ownership for Draka Comteq’s customers and providing
platforms which fuel their own possibilities to innovate. The
specialty product line with specific features to meet demands
for high security, bandwidth, and robustness to operate reliably
in the often harsh environments encountered in military,
transportation, power and energy-related markets is a focus
area of development for Draka Comteq. In these niche markets
Draka Comteq is responding to the challenge of effectively
meeting customer needs for relatively smaller volumes of
specially designed high value added product based on unique,
robust technology.
Draka Holding | 37Report on Draka Cableteq and Draka Comteq

Main subsidiaries, associates and joint ventures (100% owned by Draka Holding N.V, unless otherwise indicated, situation as at 6 March 2008)
Draka Comteq ASIA
Japan Precision Fiber Optics Ltd (50%)
People’s Republic Yangtze Optical Fiber & Cable Co Ltd (37.5%)
of China NK Wuhan Cable Co Ltd (67.8%)
Draka Comteq SDGI Co Ltd (55%)
Yangtze Optical Fiber & Cable (Shanghai) Co Ltd (53.13%)
Singapore Draka Comteq Singapore Pte Ltd
EUROPE
Austria Draka Austria Cable GmbH
Denmark Draka Comteq Denmark A/S
Finland Draka Comteq Finland Oy
France Draka Comteq France SAS
Germany Draka Comteq Germany Holding GmbH & Co KG
Draka Comteq Berlin GmbH & Co KG
Netherlands Draka Comteq BV
Draka Beheer BV
Draka Comteq Cable Solutions BV
Draka Comteq Fiber BV
Draka Comteq Telecom BV
Norway Draka Comteq Norway AS
Russia Neva Cables AO (75%)
Slovak Republic Draka Comteq Slovakia sro
Spain Draka Comteq Spain SL
Draka Comteq Iberica SL
Sweden Draka Comteq Sweden AB
United Kingdom Draka Comteq UK Ltd
NORTH AMERICA
United States Draka Comteq Americas Inc
SOUTH AMERICA
Argentina Cables Opticos y Metalicos para Telecommunicationes
Telcon S.r.l. (49%)
Brazil Draka Comteq Brasil Ltda
Draka Comteq Cabos Brasil Holding SA
Draktel Optical Fiber SA (70%)
Telcon Fios e Cabos para Telecomunicaçöes SA (50%)
Draka CableteqASIA
India Associated Cables Pvt Ltd (65%)
Malaysia Sindutch Cable Manufacturer Sdn Bhd
People’s Republic Suzhou Draka Cable Co.Ltd
of China Draka Cables (HONG KONG) Ltd
Draka NK Cables (Shanghai) Co. Ltd
Nantong Haixun Draka Elevator Products Co. Ltd (75%)
Zhongyao Draka Elevator Products Co. Ltd (75%)
Singapore Draka Asia Pacific Holding Pte Ltd
Oakwell Engineering Ltd (29.9%)
Singapore Cables Manufacturers Pte Ltd
Draka Distribution Singapore Pte Ltd
Sultanate of Oman Oman Cables Industry Saog (34.8%)
Thailand MCI-Draka Cable Co. Ltd (70.3%)
Philippines Draka Philippines Inc
AUSTRALIA
Australia Draka Cableteq Australia Pvt Ltd (70%)
EUROPE
Belgium Draka Belgium NV-SA
Czech Republic Draka Kabely sro
Denmark Draka Denmark Copper Cables AS
Estonia Draka Keila Cables AS (66%)
Finland Draka NK Cables Oy
France Draka France SAS
Draka Fileca-Foptica SAS
Draka Paricable SAS
Cableries de Valenciennes SAS
Germany Draka Deutschland GmbH
Draka Industrial Cable GmbH
Draka Automotive GmbH
Draka Kabeltechnik GmbH
USB-Elektro Kabelkonfektions GmbH
Draka Service GmbH
Höhn GmbH
Draka Deutschland Erste Beteiligungs GmbH
Draka Deutschland Zweite Beteiligungs GmbH
Draka Deutschland Dritte Beteiligungs GmbH
NKF Holding Deutschland GmbH
Kaiser Kabel GmbH
Italy D.B. Draka Lift Elevator Products Srl
Luxemburg Draka Finance Sarl
Draka Luxemburg Sarl
Netherlands Kabelbedrijven Draka Nederland BV
Draka Elevator Products BV
White Holding BV
Beheer- en Beleggingsmaatschappij De Vaartweg BV
Draka Treasury BV
Draka Nederland BV
NKF Participatie BV
Norway Draka Norsk Kabel AS
Russia Elkat Ltd (40%)
Spain Draka Cables Industrial SL
Draka Elevator Products Spain SL
Draka Holding NV y Cia. Soc Co
Sweden Draka Kabel Sverige AB
Turkey Wagner Kablo Sanayi Ve Ticaret AS (80%)
Draka Istanbul Ithalat Ihracat Uretim Ltd Sti (70%)
United Kingdom Draka UK Ltd
Draka UK Group Ltd
Draka Distribution Aberdeen Ltd
NORTH AMERICA
Canada Draka Elevator Products Inc
Mexico Draka Mexico Cables S de RL de CV
United States Draka Marine Oil & Gas International Llc
Draka Cableteq Holdings USA Inc
Draka Cableteq USA Inc
Draka Elevator Products Inc
SOUTH AMERICA
Brazil Draka Cableteq Brasil SA (99%)
38 | Draka Holding Main subsidiaries, associates and joint ventures

In carrying out its activities, Draka is exposed to a number of
business risks. The company’s risk-management policy is aimed at
sustainably controlling business risks in the long term and at limiting
and where possible hedging those risks. Despite the attention
devoted to these risks and the management and control procedures
applied, risks can never be eliminated completely. They are an
inherent part of doing business given the wide diversity of markets,
customers and geographical areas in which Draka operates. Draka’s
long term risks are limited by:
• the great diversity of the markets in which Draka operates
(both geographically and in terms of clients);
• the fact that no client accounts for more than 5% of
Draka’s worldwide sales;
• a widely spread group of suppliers;
• price movements in important raw materials (copper, aluminium
and polymers) which can be passed on within a reasonable period;
• state-of-the-art process technologies, often developed in-house;
• informative, compliant and transparent reporting systems;
• the fact Draka’s net interest-bearing debt consists for 92.7% of
long term liabilities (more than 5 years), with current liabilities
accounting for 7.3% in 2007;
• a highly skilled workforce.
Given the diversity of the markets, customers and regions served
by Draka and the breadth of its portfolio of activities, it is virtually
impossible to quantify all the risks that may be relevant to the
Company as a whole. Where those risks can be measured,
however, they will be quantified as accurately as possible. The
risks described below do not comprise an exhaustive list, but are
a selection of the most important risk factors.
Operational risks
Portfolio of activitiesDraka’s core activities are generally sensitive to economic
fluctuations which affect supply and demand-ratio’s within the
cable industry. Draka minimises these risks by spreading its
activities widely.
Draka Cableteq (which accounted for around 77% of revenue in
2007) consists of six divisions that constitute a balanced portfolio
of cable businesses serving a highly diverse customer base. The
largest is the Low-Voltage Cable division which generates about
half of Draka Cableteq’s revenue. Sales in Europe, the division’s
main market, are split roughly 40/30/30 between the residential,
infrastructure and commercial construction markets. European
sales are fairly evenly spread over the Scandinavian countries,
the UK, Benelux and Spain and, to a lesser extent, France. Outside
Europe, the division is chiefly active in Asia and the USA, selling
mostly specialty cables not depended on the housing market.
The most important customer group for special-purpose cables is
original equipment manufacturers (OEMs) operating worldwide.
The global automotive industry is the biggest customer group
served by the Transport division, which generates around 20% of
Draka Cableteq’ revenues. The Transport division meets some
50% of Airbus’ cable requirement. The other divisions – Elevator
Products (cable and other products for lifts), Marine, Oil & Gas
(cable for oil and gas production platforms and shipping), Mobile
Network Cable (antenna line for base stations for mobile telephony)
and Rubber Cable (cable for cranes, mining and alternative energy
sources) – each account for 5–10% of Draka Cableteq’ revenue.
At Draka Comteq, which generated around 23% of Draka’s revenue
in 2007, the activities depend mainly on developments in IT and the
telecom sector. The telecom operators are the largest customer
group, with sales concentrated mainly in Europe (circa 85%) and
the USA (about 10%).
Generally speaking, the impact of cyclical movements is limited
by the:
• spread of Draka’s activities;
• wide geographical spread;
• diversified customer base;
• strong market positions and
• size of the company.
CompetitionThe global cable market is still fragmented. The world’s ten biggest
cable producers account for an estimated market share of about
35%. Draka is one of the world’s leading cable producers, with an
estimated market share of some 2.5%. This gives Draka a sixth-
ranking position world-wide and a third-ranking position in Europe.
The competition consists of a limited number of global players
and a substantial number of cable producers operating regionally,
often only locally.
Stock risksIn order to meet the wishes of specific client groups to have access
on demand to the full product range within certain cable segments,
Draka maintains consignment stocks of its products for such
customers. However, holding stocks creates the risk of full or
partial obsolescence of the products as well as the risk of price
falls. The policy implemented by Draka of reducing the operating
working capital by means of further optimising production (with
plants concentrating on ‘product families’) is expected to lead to a
further reduction in stocks whilst maintaining a full product range.
Raw materialsCopper, preforms for optical fiber, aluminium, PVC, polyethylene
and other polymers are the raw materials needed for Draka’s
manufacturing process. Lack of raw materials can adversely impact
the results of the enterprise. Draka uses its strong position to
procure raw materials and ensure their constant supply on the best
possible terms.
Financial risks
FinancingIn order to minimise the financial risks and sustain the company’s
financial solidity in the long term, Draka pursues an active policy
Risk management
Draka Holding | 39Risk management

to optimise balance sheet ratios. Thanks to the refinancing that
Draka completed in 2007, the ratio of current liabilities to long-term
liabilities has continued to improve. This transaction has also
secured funding until 2013 and limits future interest-rate risks.
Currency risksDraka reports its financial results in euros. Given the international
spread of its activities, this means it is exposed to currency
influences that can affect the bottom line. The business is
especially sensitive to changes in the exchange rate between
the euro and the US dollar, Chinese renminbi, Danish kroner,
Norwegian kroner, Swedish krona, Czech koruna and Pound
sterling. Transaction risks are, in principle, hedged. Translation
effects associated with investments in foreign participating
interests are, in principle, not hedged.
Debtor risksDraka’s trade receivables position accounted for around 23.5% of
the balance sheet total in 2007, a slight increase in relation to 2006.
The acquisition of Cornelia Thies
Kabeltechnik – now Draka Kabeltechnik –
in 2006 marked a big step towards
forward integration: moving up in the
value chain. “That company’s strong
position in cable sets and systems
opened the way for us to become a
stronger partner for our customers, and
to create new growth opportunities”,
explains Wilhelm Engst, President of
Draka Rubber Cable.
The wind power market is showing tremendous
growth and is expected to continue growing
at around 15 to 20 per cent annually on a
global basis for the foreseeable future. That
makes it attractive in itself, but for Draka
Rubber Cable even more potential lies in
supplying wind turbine OEMs with complete,
ready-to-install cable sets. “We’ve seen that
existing cable customers are very happy to
move up to sourcing cable sets because it fi ts
in their own strategy. It allows them to focus
on their core business, instead of having to
act as system integrator and deal with all the
related small components that are involved.”
Major business opportunity
According to Wilhelm Engst, that’s a major
business opportunity for the division. “Not
only are we generating extra business from
our existing customers, but it also opens the
way to new customers who are entering the
wind power market and want to make a fast
and effi cient start. For example in China there
are about 64 wind turbine manufacturers,
most of them quite small. We’re talking to
some of them right now, and we see there’s
a tendency for them to buy complete cable
sets right from the start. That move up the
value chain also benefi ts us by making it
harder for competitors to enter the market.
Anyone can source cables and offer them on
the market, but there’s a much bigger barrier
to supplying the total solutions that we offer.
To do that you need knowledge, the supply
chain, local production and assembly
facilities, global logistics and distribution and
– not least – the trust of your customers.
Those are our strengths, and equalling them
is a big challenge to our competitors.”
Opening the solar market
Another way the Cornelia Thies acquisition is
benefi ting Draka Rubber Cable is by opening
the way to entering the solar market. In
“Moving up in the value chain through acquisition”
Growth by acquisition: System integrator role fits customers’ own strategy
���������������
����������
�������������
��������
������������� ���
�����
��������������
��������
�������
������
���������
��������������
��������
�������������
��������
��������������
��������
�������������
��������
��������������
��������
��������������
��������
�������������
��������
����������������
���������
40 | Draka Holding Risk management

The average credit term was reduced to 53 days (2006: 58 days).
This still relatively long credit term is explained by the activities
of the group in Asia and Southern Europe, where long payment
terms are common. Draka runs a bad debt risk in respect of its
trade receivables position.
The debtor risks are managed and mitigated through alert and
active policies. At the same time, a commitment to reducing the
debtor positions forms part of Draka’s focus on securing a
minimal level of operating working capital requirements. The
creditworthiness of new customers of sufficient size is assessed
in advance.
Raw materialsRaw materials needed for Draka’s manufacturing process (copper,
preforms for optical fiber, aluminium, PVC, polyethylene and other
polymers) are subject to price changes that can impact the results
of the enterprise. Changes in the price of copper are however
generally passed on to the customers. Furthermore, Draka’s
financial risk on its raw material requirements is reduced as much
as possible by entering into derivative contracts.
InsuranceDraka is insured against a number of risks. Risks related to
product liability and/or the loss of property and equipment are
insured, as well as damages related to business interruption. In
addition, insurance cover exists (in varying degrees) for pensions
and medical costs to be incurred on behalf of Draka’s employees.
These policies are, if possible, entered into globally (via Draka
Holding) or else via local subsidiaries.
general the solar market is similar to wind
energy, but is currently around 10 to 15 years
behind in terms of development. OEMs in that
market face the same challenges as wind
turbine manufacturers in relation to
connecting panels and distributing the energy.
And as well as that they have to deal with
adverse rooftop conditions such as UV, ozone,
temperature and moisture. With its wide-
ranging expertise Draka is well placed to offer
cables that can meet those specific demands.
“Solar energy is still a relatively small market
for us, for example with only around three
per cent of the turnover that we achieve in
wind power, but we’re convinced that it has
even greater potential in the longer term”,
says Wilhelm Engst. “As that market develops,
Draka Rubber Cable will be in an excellent
position to grow with it because of our existing
expertise, and our manufacturing and system
integration capabilities company wide.”
Wilhelm Engst, President Draka Rubber Cable
Growth by acquisition: System integrator role fits customers’ own strategy
“Solar installations leverage service capabilities”
“Capitalizing on the increasing solar demand, Draka Service in Germany is switching
its focus from mobile telephony networks to installing photovoltaic equipment. This
represents a comparable challenge in engineering terms, but one with considerably
more business potential. The unit offers turnkey engineering and installation with
short completion times, and has the extra advantage of familiarity with roof structures
which is important when adding solar installations to existing buildings. Next to that it
has a nationwide installation network and access to attractive locations, so it can offer
a complete proposition to potential solar energy investors.”
Draka Holding | 41Risk management

Risk management and internal control systems
The Board of Management, supervised by the Supervisory Board
is responsible for the adequate working of the Company’s risk
management and internal control systems. Risk management
forms an integral part of business management. The objective of
the Company’s risk management and internal control systems is
to provide a reasonable level of assurance that the Company’s
objectives are met, ensure compliance with legal requirements
and by safeguarding the integrity of the Company’s financial
reporting and its related disclosures.
In 2007, the Board of Management further improved management
reporting by extending the Company’s KPI’s and benchmarking.
Furthermore, an operational audit department has been established in
the course of 2007. The operational audit department started reviewing
the Company’s risk management and internal control systems.
The Company’s risk management approach is embedded in the
governance structure, the Company’s risk based framework of
policies and procedures and in the periodic business planning and
review cycles.
Corporate GovernanceCorporate Governance is the system by which a company is directed
and controlled. We believe that corporate governance is a critical
factor in achieving business success. Solid internal controls and high
ethical standards are key elements in good corporate governance.
In 2006 the Supervisory Board installed an Audit & Governance
Committee (‘A&GC’). The members are appointed from and by the
Supervisory Board. The tasks and responsibilities are laid down in the
A&GC charter. An important responsibility of the A&GC is to supervise
due compliance with the Company’s internal risk control systems.
In 2007, the Board of Management implemented the Code of Conduct.
The Code reflects the Company’s core values and standards and
includes the Company’s mission statements. The Code applies
throughout Draka and covers all companies over which Draka
Holding N.V. exercises control. The Board of Management has
published the Code on the Company’s website. Furthermore
Draka published a booklet explaining the Code of Conduct as
well as the Whistleblower policy, which was internally distributed.
The Company implemented a Whistleblower policy as part of the
Code of Conduct. A clear reporting and compliance system has
been developed, which provides the basis for reporting of potential
violations against the Code within Draka. The Company Secretary
serves as the Compliance Officer.
A more in-depth description of the Company’s corporate
governance model can be found on page 50.
Risk based framework of policies and proceduresThe Board of Management implemented an internal control
framework describing the group’s main policies, procedures and
risks. The framework has been discussed with the Supervisory
Board, which approved it early 2007.
An operational audit department started in the course of 2007 and
has developed a methodology to review the Group’s operating
companies and functional departments in relation to these policies,
procedures and risks. Based on this methodology the operational
audit department conducted reviews at several operating companies
and functional departments. The findings and recommendations of
these reviews have been discussed with responsible management
and have been reported to the Board of Management.
The findings will be used to further strengthen the internal controls
within the Group and to update the policies, procedures and risks.
Further the Board of Management has improved the standardised
management reporting by activity including KPI’s and benchmarking
between these activities and its peers. This allows Corporate Control
to review and control the financial and operational performance
of these activities in more depth. In the course of 2007 Corporate
Control started the Corporate Language project reviewing all the
definitions in relation to the standard management reporting.
The project was finalized and implemented at the end of 2007.
Business planning and review processThe Company has a budget and internal reporting process with fixed
procedures and detailed guidelines. The Board of Management
periodically discusses in business reviews the financial performance,
operational and financial risks of its activities. The division’s financial
performance is evaluated and compared to the approved budgets,
historic performance and developments in the markets and competi-
tive environment. On a quarterly basis forecasts are evaluated and
updated if deemed necessary. The company has installed clear proce-
dures and cascading authority levels to approve capital expenditures.
In view of all the above, the Board of Management believes that
- in relation to the financial reporting risks - the Company’s risk
management and internal control systems have operated properly
during 2007 and provide a reasonable degree of certainty that
the consolidated financial statements are free from material
misstatement. The Board of Management has no indication that
these systems will not operate properly during 2008.
It should be noted that the above does not imply that these systems and
procedures provide certainty as to the realization of operational and
financial business objectives, nor can they prevent misstatements,
inaccuracies, fraud and non-compliance with rules and regulations.
The actual effectiveness of this process can only be assessed on the
basis of the results over a longer period. In a rapidly changing world
with constant new challenges, ever-increasing demands are placed
on the internal risk management process. This means that these
processes have to be reviewed and updated if deemed necessary.
The policy of the Board of Management remains focused on the
constant assessment and improvement of the risk management
system. This process and their monitoring are periodically discussed
by the Board of Management with the Audit & Governance
Committee and the Supervisory Board.
Amsterdam, 6 March 2008
Sandy Lyons, Chairman and CEO
Frank Dorjee, CFO
42 | Draka Holding Risk management

To the Shareholders,
For Draka Holding N.V., 2007 was a successful year. It was the third
consecutive year of substantially improving results by all divisions.
The strong performance was driven by our successes in the market
place and the consistent execution of our cost saving programmes,
supported by favourable market conditions. We made further
progress in the implementation of our strategy.
The cost control programmes of the Triple S project, which was
initiated in 2005, are well on schedule and made a substantial
contribution to the increased profitability in 2007.
We were pleased to have completed the acquisition of the 49.9%
interest of Alcatel-Lucent in Draka Comteq B.V. Through this trans-
action, Draka acquired full ownership of Draka Comteq. Draka
Comteq is a leading company in the field of optical fiber and optical
fiber cable and was created on 1 July 2004 by combining the world-
wide optical fiber and communication cable activities of Draka and
Alcatel-Lucent. From the initial establishment of the joint venture,
Draka Comteq was controlled by Draka and its results were,
therefore, consolidated in Draka’s consolidated financial statements.
To finance the takeover price of € 209 million for this acquisition
and to support Draka’s growth strategy, Draka arranged a new
revolving credit facility of € 625 million with a syndicate of five
relationship banks. This new facility replaces the earlier credit
facility of € 370 million contracted in October 2005 and a
subordinated loan of € 77.5 million.
In the first half of 2007, the Elevator Products division in Asia
strengthened its position by forming a second jointly owned
company, named Nantong Zhongyao Draka Elevator Products Co.,
Ltd., which has resulted in further extending our product range.
Further in December 2007, Draka agreed to buy DeBiase Lift
Components S.R.L. in Milan (Italy). With this small acquisition
Draka further strengthened its leading position as a worldwide
manufacturer and supplier to the global elevator industry and
solidified its position as a total elevator solutions provider for
customers of all sizes with a variety of elevator needs. The
transaction was closed on 10 January 2008.
A number of changes in the composition of the Board of
Management took place in 2007. Sandy Lyons was appointed as a
member of the Board of Management as of 1 September. Sandy
Lyons succeeded Ingolf Schulz as Chairman and Chief Executive
Officer of Draka Holding with effect of 1 October. Christian Raskin
stepped down from the Board of Management on 31 August and
Ingolf Schulz stepped down from the Board of Management at
the end of the year. Both Christian Raskin and Ingolf Schulz are
still advising the Board of Management.
Expression of gratitudeThe Supervisory Board would like to express its gratitude to Christian
Raskin and Ingolf Schulz for their contributions. Further the
Supervisory Board wishes to thank the Board of Management and
all employees for their efforts made over the past year, which led
to Draka’s further growth during the year.
Financial statements and dividendThe Board of Management has submitted the financial statements,
drawn up for the year 2007, to the Supervisory Board. These state-
ments, included on pages 59 to 112 of this report, have been audited
by KPMG Accountants N.V. (the auditors’ report is shown on page 116)
and have been carefully reviewed by Draka’s Supervisory Board.
The Supervisory Board recommends the General Meeting to adopt
these financial statements in accordance with the proposal by the
Board of Management, including a dividend payment of € 24.2
million on ordinary shares (€ 0.68 per ordinary share of € 0.50)
and of € 5.4 million on preference shares. Furthermore, we invite
the General Meeting to ratify all actions taken by the Board of
Management and the Supervisory Board during 2007.
Composition of the Supervisory BoardThe composition of the Supervisory Board remained unchanged
in 2007. At the General Meeting of Shareholders on 11 May 2007,
both Fritz Fröhlich and Rob van Oordt were reappointed as members
of the Supervisory Board. In 2008, no members of the Supervisory
Board will retire on the basis of the retirement schedule.
Activities of the Supervisory BoardThe Supervisory Board met on six occasions in 2007 in the presence
of the Board of Management. These meetings dealt, among other
things, with the acquisition of the 49.9% Draka Comteq shares
owned by Alcatel-Lucent, the refinancing program, the composition
and development of the Board of Management, the Company’s top
structure, Company performance, corporate strategy and its
implementation, the risks associated with the Company, internal risk
management and control systems, management and development,
acquisition policy, the financial statements, the annual report,
corporate governance and compliance.
The Supervisory Board also met frequently in 2007 in the absence
of the Board of Management. Matters dealt with at these meetings
included the functioning of the Board of Management and the
functioning of the Supervisory Board, the composition of and
succession within the Supervisory Board, the expertise of the
individual members of the Supervisory Board and the composition
of and succession within the Board of Management. Outside the
Supervisory Board meetings there were frequent contacts between
individual members of the Supervisory Board and members of the
Board of Management concerning company affairs. The meetings of
the Supervisory Board were attended by all its members, except for
one meeting on which one member was absent. In the context of
the periodic visits paid to the operations, a visit was made during
the year under review to Draka in Nürnberg, Germany.
Corporate GovernanceIn the interest of good corporate governance, the Supervisory
Board has established three subcommittees of the Supervisory
Board: the Audit & Governance Committee, the Remuneration &
Nomination Committee and the Strategy Committee.
Report of the Supervisory Board
Draka Holding | 43Report of the Supervisory Board

The Audit & Governance Committee met on six occasions in 2007,
in the presence of the Chief Financial Officer and the Chief
Executive Officer. At these meetings we discussed the Company’s
performance, the management letter and the role of KPMG
Accountants, Corporate governance, risk management and
internal control procedures and status, as well as legal affairs and
the 2007 audit plan.
The Remuneration & Nomination Committee met on five occasions
in 2007. The meetings focussed on the functioning and the
composition of the Board of Management as well as the
remuneration, pension schemes and contractual arrangements
of the Board of Management members. They also considered the
management and succession structure within Draka.
The Strategy Committee met on six occasions in 2007 and reviewed
the strategy of Draka Holding and its key businesses. The
committee made recommendations to the Supervisory Board
concerning strategic priorities and potential investments.
The various aspects of Corporate Governance are discussed in
detail on pages 50-51.
Remuneration Report
This report provides a description of the remuneration policies of
the Board of Management and the Supervisory Board of Draka
Holding N.V., as applied in 2007, as well as the remuneration policies
planned for 2008.
Prior to the General Meeting of 11 May 2007, the Supervisory Board
proposed several changes to the remuneration policy for the
members of the Board of Management. The adjusted remuneration
policy was adopted by the General Meeting of 11 May 2007 and
included the following changes:
• the labour market peer group was amended;
• the short term and long term incentive plans were
disentangled (in line with market practice);
• short term incentives are fully paid out in cash;
• long term incentives consist of an annual conditional grant
of performance shares for which the vesting, after three
years, might vary between 0 % and 200 %;
• the peer group for Draka’s long term incentive plan which is based
on TSR (Total Shareholder Return) performance, was amended.
This remuneration report consists of three parts. The first section
is a description of the remuneration policy of the Board of
Management applicable in 2007 and includes the remuneration
structure of the Board of Management. The second section
describes the remuneration of the Board of Management in 2007
and briefly discusses the remuneration policy for the Board of
Management to be followed in 2008. The third section describes
the remuneration policy applicable to and the remuneration
received by the Supervisory Board in 2007.
This remuneration report is available on Draka’s website
(www.draka.com).
Remuneration Policy Board of Management 2007GeneralThe remuneration policy of the Board of Management is designed
to ensure that the Company is able to attract, motivate and retain
qualified and expert members of the Board, as required in order
to achieve Draka’s strategic objectives.
The underlying principles of the remuneration policy for 2007
and subsequent years can be described as follows:
• the total level of remuneration of the Board of Management
will be in line with a labour market peer group consisting of
European companies with comparable activities and / or
similar in terms of size and / or complexity;
• the labour market peer group has been amended during 2007
due to changes in the activities and organisational structures
within some of the labour market peers.
Independent remuneration advisors, who use statistical models in
order to gear the remuneration details of the companies to
Draka’s size, can be consulted by the Company’s Remuneration &
Nomination Committee.
Draka’s labour market peer group consists of the following companies:
Draka’s labour market peer group Bekaert (Belgium) Nexans (France)
Daetwyler (Switzerland) NKT Holding (Denmark)
Fugro (The Netherlands) Prysmian (Italy)
Hagemeyer (The Netherlands) SBM Offshore (The Netherlands)
Legrand (France) Stork (The Netherlands)
Leoni (Germany) Telent (UK)
The remuneration levels of the members of the Board of Manage-
ment were aligned with this European labour market peer group.
Remuneration structure The total remuneration package of the members of the Board of
Management consists of:
• base salary;
• short term incentive;
• long term incentive;
• pension arrangement.
Base salaryIn 2007, we have reconsidered the base salaries and aligned them
to the median market levels of the European labour market peer
group.
Short term incentive (bonus)In line with market practice, the short term and long term
incentive plans were disentangled from 2007 onwards. The
short term incentive is now paid out annually fully in cash.
44 | Draka Holding Report of the Supervisory Board

The annual pay out, in terms of the short term incentive, is based
on the following performance criteria:
• 1/3rd based on the Company’s Earnings before Interest & Tax
(‘EBIT’);
• 1/3rd based on the Company’s average Net working capital as
percentage of the yearly revenue;
• 1/3rd based on the discretionary judgment and proposals by the
Remuneration & Nomination Committee to the Supervisory
Board, related to so-called ‘milestones’ and applying a ‘test of
reasonableness’.
If the pre-set targets for 2007 are met, a target bonus of 60%
of the base salary can be achieved by the members of the Board
of Management. In the event of outstanding performance, a
maximum bonus of 90% of the base salary may be achieved by
the members of the Board of Management. If performance is
below a certain threshold, no bonus will be paid.
Draka regards this combination of performance measures as a
proper reflection of the short-term operational performance of
the Company. The specific details of the targets are not publicly
disclosed since these qualify as competition-sensitive and hence
commercially confidential information. On the advice of its
Remuneration & Nomination Committee, the Supervisory Board
reviews the short term incentive objectives each year in order
to guarantee that they are challenging, realistic and in
accordance with Draka’s strategy.
Long term incentive Following the disentanglement of the previously applicable short
term and long term incentive plans, the long term incentive now
consists of an annual conditional grant of performance shares.
After a three year period, these performance shares might vest
(i.e. become unconditional) based on Draka’s TSR performance.
Draka’s TSR performance will be measured against the following
companies:
Draka’s TSR performance peer groupAndrew Corp (NASDAQ)
Belden CDT (NYSE)
Commscope (NYSE)
Daetwyler (Swiss Stock Exchange)
Fugro (Euronext Amsterdam)
Fujikura (Tokyo Stock Exchange)
Hagemeyer (Euronext Amsterdam)
General Cable Corp (NYSE)
Leoni (Frankfurt Stock Exchange)
Nexans (Euronext Paris)
SBM Offshore (Euronext Amsterdam)
Stork (Euronext Amsterdam)
Superior Essex (NASDAQ)
The table below reflects the number of shares (as a percentage of
the initially granted number of shares) each member of the Board
of Management will receive in relation to the relative TSR position
Draka will have achieved three years after the initial share grant.
In line with the principles of the Dutch Corporate Governance
Code, vested shares must be held an additional two years from
the moment of vesting.
Position Number of shares that will vest (as percentage of numbers of shares initially granted)
1 200%
2 166 2/3%
3 133 1/3%
4 100%
5 83 1/3%
6 66 2/3%
7 50%
8 - 14 0%
The annual conditional grant of performance shares equals 55%
of the base salary. In extraordinary circumstances, the Supervisory
Board has the authority to grant additional (performance) shares.
Pension arrangementsIn principle, the pension arrangements are in line with the median
level of the country of origin of each member of the Board of
Management.
Loans The Company does not grant loans, guarantees or the like to
members of the Board of Management of Draka.
Remuneration Board of Management 2007
As per 30 September 2007, Ingolf Schulz stepped down as Chief
Executive Officer of Draka Holding N.V. and, subsequently, stepped
back from the Board of Management on 31 December 2007. He
was succeeded, on 1 October 2007, by Sandy Lyons as Chief
Executive Officer of Draka Holding N.V. Sandy Lyons had already
been appointed as member of Draka’s Board of Management on
1 September 2007 and had been CEO of Draka Comteq since
1 December 2004. Christian Raskin stepped down from the Board
of Management on 31 August 2007.
The remuneration of Draka’s Board of Management substantially
changed in 2007, as a result of an in-depth review.
Base salary As a result of this review, the base salaries of the Board of
Management were brought in line with the labour market peer
group resulting in increases for Ingolf Schulz of 8%, Frank Dorjee of
4% and Christian Raskin of 3%. Sandy Lyons new (CEO) base salary
was determined in line with the approved remuneration policy.
Short term incentive With regard to the 2007 short term incentive, financial targets are
achieved on a level, which results in a 60% pay-out for the annual
bonus. With regard to the discretionary part, the Supervisory Board
decided to pay out 20% of the base salary. Therefore, the
Supervisory Board decided to pay out 80% (of the maximum
Draka Holding | 45Report of the Supervisory Board

90%) of the base salary to the members of the Board of
Management over 2007.
The bonus pay-outs over the financial year 2007 are presented
in the remuneration table on page 48.
Long term incentiveIn 2007, the Supervisory Board used its authority to grant Ingolf
Schulz 15,603 conditional performance shares and Frank Dorjee
12,394 conditional performance shares. In addition, as extra
appreciation for their contributions during the last three years,
Ingolf Schulz and Frank Dorjee were awarded a so called ‘one off
grant’ of one year conditional performance shares, of 15,603 and
12,394 each. The General Meeting approved this grant on 11 May 2007.
Pensions Ingolf Schulz has a defined benefit scheme based on an annual
accrual of 2.5% per annum.
Sandy Lyons has a deferred compensation arrangement under
Section 401K of the United States Internal Revenue Service Code.
Under this arrangement Sandy Lyons is allowed to defer a limited
part of his compensation for retirement purposes under the same
conditions as all participants in this plan. In addition, Sandy Lyons
is entitled to receive annually a deferred payment of no more
than 85% of his base salary. This deferred payment can be
allocated to a private retirement plan.
46 | Draka Holding Report of the Supervisory Board
The acquisition in mid-2006 of a facility
in Durango, Mexico, that had recently
been closed down by its owner proved to
be a golden opportunity for Draka’s
Transport division. “It was full of assets
and almost ready to go”, says the
division’s President Christian Schütte.
“We had already realised that investing
in a regional production facility was a
‘must’ to be able to serve the major
North American market.”
Customers of Draka Transport are the wiring
harness manufacturers to the primary
automotive and aircraft industries, of which
there are just a handful around the world.
Themselves faced with tough cost pressures,
these ‘tier 1’ suppliers are increasingly shifting
their production to low-cost countries. As a
‘tier 2’ supplier, Draka Transport has to make
sure it follows the harness manufacturers so
it can continue to serve them on a local basis.
“Logistics costs are high because of the many
different part numbers”, Christian Schütte
explains. “For example in America there are
14 basic cable colours and stripes, which add
up to a huge number of possible combinations.
That’s why it’s so important to be located close
to the customer. The new Mexico facility is
ideally placed for the North American market.
All the major manufacturers are present there,
including the automotive OEMs themselves and
their suppliers, with most of the production
output going to the NAFTA region.”
Aircraft opportunities
Mexico also offers opportunities in the
aircraft industry. For example harnesses for
the Airbus A380 are manufactured by a tier
1 supplier in nearby Chihuahua, which Draka
Transport currently supplies from France.
Switching production to Durango would save
cost and shorten the logistics lines, especially
in view of Airbus’ plans for a big production
increase between now and 2012. Another
benefit of such a move would be to put
production into the dollar zone, where the
customer is also located. All global airlines
require new aircraft to be sold in US dollar.
Therefore, Airbus asks its supplier to sell
parts in US dollar, too.
Production start-up at the Durango facility was
very rapid. After going through customers’
qualifying procedures, the first production
samples were shipped in November 2006.
The full ramp-up was in March 2007, and in
mid-2007 capacity was further increased by
installing three additional lines.
Careful preparation
The start of production was preceded by a
long period of careful preparation, with the
“Globalisation means being close to the customer”
Growth by globalisation: new facility in Mexico opens up North American market

Frank Dorjee has a defined contribution pension scheme, which is
structured as follows as from 1 January 2006:
• 1 January 2006 until reaching
the age of 54 23.0% of his base salary
• Age 55 – 59 28.6% of his base salary
• As from age 60 36.1% of his base salary
The contribution under the pension scheme of Frank Dorjee is
based on the base salary minus a social security offset (in 2007:
€ 11,872). In 2007 Frank Dorjee has received a one-off € 140,000
extra contribution to his pension plan as compensation for
earlier commitments.
The defined contribution scheme of Christian Raskin is based
on a flat rate contribution of his annual base salary, or € 57,750.
The corresponding Dutch fiscal costs are € 90,284. So the total
costs in relation to Christian Raskin amount to € 148,034.
Overview The table on page 48 shows the direct remuneration of the
Board of Management for 2007. As a result of him stepping
down from the Board of Management on 30 August 2007, the
table reflects the remuneration of 8 months for Christian
Raskin. Please note that Sandy Lyons was employed by Draka
for the whole year 2007 but that the table only reflects the
remuneration for Sandy Lyons over the period 1 September 2007
Draka Holding | 47Report of the Supervisory Board
first visits starting several years ago and
followed by an exploration of the possibilities
of production in the NAFTA zone. “At that
time we already had a lot of support from
customers because of the lack of qualified
suppliers in the region”, says Christian Schütte.
“We then quickly reached the decision to
invest in the region, and were fortunate to
find the Durango facility which we were able
to bring on-line in a very short time.”
Draka Transport sees opportunities in other
regions, for example China and Brazil. It already
has a factory in China serving the local
operations of European manufacturers. The
local Chinese manufacturers are not yet fully
“Room for growth on Durango site”
“Part of the reason we were able to make such a fast start in the new Durango facility
was because we were able to recruit staff from the former workforce. The department
leaders were still there, and we took on around 60 per cent of the old team. After that
we started an intensive training program to bring them up to the required level to
operate at full capacity. Another advantage we have here is a large area of land, which
could enable us to double the production area if necessary. That will enable us quickly
to take advantage of the growth opportunities in the region.”
aligned with safety and quality standards in the
rest of the world, but when they do so in the
coming years they will also be an attractive
target market. Many of the division’s global
customers are already in Brazil, and this is
another potentially attractive country for
cable manufacturing operations. “Again
it’s a question of following your customers,
and offering them a global service at a local
level”, Christian Schütte concludes.
Christian Schütte,
President Draka Transport

until 31 December 2007 (reflecting his 2007 tenure as member of
the Board of Management of the Company).
2007 Direct Remuneration Board of Management
Amounts in € Short term Long term Base salary incentive incentive Pension Allowances* Total
Sandy Lyons 167,100 143,333 - 143,311 70,385 524,129
Ingolf Schulz 538,051 428,000 326,906 320,233 50,575 1,663,765
Frank Dorjee 425,000 340,000 298,283 235,090 - 1,298,373
Christian Raskin 263,333 158,000 14,554 100,262 30,819 566,968
* ‘Allowances’ primarily reflect the gross compensation for housing costs, education and daycare.
The long term incentive reflects the fair value of shares,
(conditionally) granted to the members of the Board of
Management. The actual grant of shares depends on the
Company’s future performance in relation to the peer group.
The members of the Board of Management do not have options
on ordinary Draka Holding N.V. shares.
Shareholdings by the members of Draka’s Board of Management
(at 31 December 2007) are as follows:
Number of conditionally Number of shares granted performance shares
Sandy Lyons - -
Frank Dorjee 9,940 24,788
Employment contracts The members of the Board of Management have been appointed
for a definite period.
Sandy Lyons’ current employment was entered into on 1 September
2007 for a period of four years and will, therefore, end on 31 August
2011. The contract provides for a notice period of three months in
case of termination by Sandy Lyons and of six months in case of
termination by the Company. An exit arrangement has been agreed
with Sandy Lyons of a full year’s base salary in case of termination
of employment without cause before the end of his term.
Frank Dorjee’s current employment contract was entered into on
1 June 2007 for a period of four years and will, therefore, end on
31 May 2011. The employment contract provides for a notice period
of three months in case of termination by Frank Dorjee and of six
months in the case of termination by the Company. An exit
arrangement has been agreed with Frank Dorjee under which a full
year’s base salary plus the average bonus received over the previous
three years would be paid if the employment contract were to be
terminated before 31 May 2011 due to any other reason than cause.
As stated previously, Christian Raskin stepped down from the
Board of Management as per 31 August 2007 and Ingolf Schulz as
per 31 December 2007. Christian Raskin and Ingolf Schulz remain
employed by Draka as advisers to the Board of Management.
Remuneration policy Board of Management 2008The remuneration policy for the members of the Board of
Management, as adopted by the General Meeting on 11 May 2007,
will be continued in 2008. In line with this the base salaries of the
Board of Management will increase with 3.25% to € 516,250 for
Sandy Lyons and to € 438,813 for Frank Dorjee.
Because of the (intended) take-over of some of Draka’s peers,
the composition of the peer groups needs to be amended in 2008.
Remuneration policy Supervisory Board 2007The remuneration policy for the members of the Supervisory Board
is based on the median level of Draka’s European labour market
peer group, which is equal to the peer group for the Board of
Management.
In accordance with good governance, the remuneration of the
Supervisory Board is not dependent on the results of the Company.
Consequently, neither stock options nor performance shares are
granted to Supervisory Board members by way of remuneration. If
any shareholdings in Draka are held by Supervisory Board members,
they serve as a long-term investment in the Company. The Company
does not provide any loans to its Supervisory Board members.
A set of regulations are in place containing rules governing
ownership of and transactions in securities by Supervisory Board
members other than securities issued by Draka.
Since 1 June 2006, the Supervisory Board has established three
Supervisory Board subcommittees: the Audit & Governance
Committee, the Remuneration & Nomination Committee and the
Strategy Committee.
The following fees for the members of the Supervisory Board and
its specialized Committees are applicable:
Deputy Chairman Chairman Members
Supervisory Board € 60,000 € 55,000 € 50,000
Audit & Governance Committee € 10,000 € 6,000
Remuneration & Nomination Committee € 7,500 € 5,000
Strategy Committee € 7,500 € 5,000
In addition to the fixed fee, members of the Supervisory Board are
entitled to an expense allowance of € 907.56 per year and are
reimbursed for travel and accommodation expenses.
48 | Draka Holding Report of the Supervisory Board
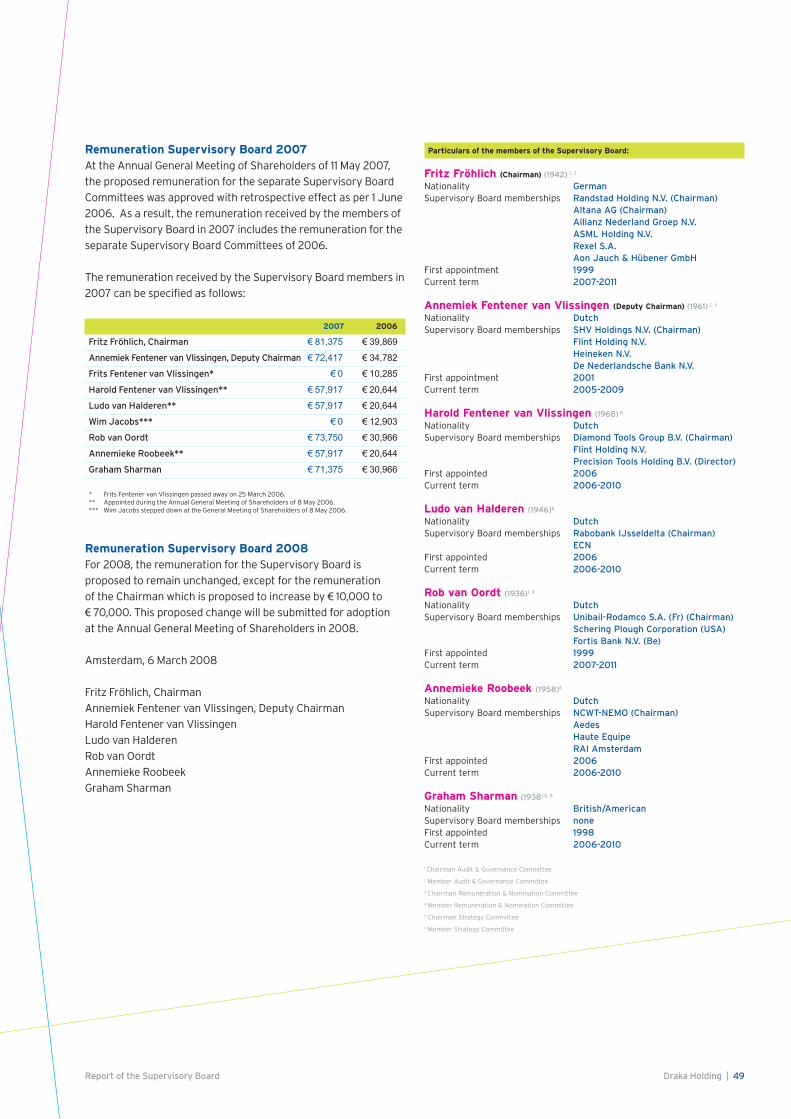
Remuneration Supervisory Board 2007At the Annual General Meeting of Shareholders of 11 May 2007,
the proposed remuneration for the separate Supervisory Board
Committees was approved with retrospective effect as per 1 June
2006. As a result, the remuneration received by the members of
the Supervisory Board in 2007 includes the remuneration for the
separate Supervisory Board Committees of 2006.
The remuneration received by the Supervisory Board members in
2007 can be specified as follows:
2007 2006
Fritz Fröhlich, Chairman € 81,375 € 39,869
Annemiek Fentener van Vlissingen, Deputy Chairman € 72,417 € 34,782
Frits Fentener van Vlissingen* € 0 € 10,285
Harold Fentener van Vlissingen** € 57,917 € 20,644
Ludo van Halderen** € 57,917 € 20,644
Wim Jacobs*** € 0 € 12,903
Rob van Oordt € 73,750 € 30,966
Annemieke Roobeek** € 57,917 € 20,644
Graham Sharman € 71,375 € 30,966
* Frits Fentener van Vlissingen passed away on 25 March 2006.** Appointed during the Annual General Meeting of Shareholders of 8 May 2006.*** Wim Jacobs stepped down at the General Meeting of Shareholders of 8 May 2006.
Remuneration Supervisory Board 2008 For 2008, the remuneration for the Supervisory Board is
proposed to remain unchanged, except for the remuneration
of the Chairman which is proposed to increase by € 10,000 to
€ 70,000. This proposed change will be submitted for adoption
at the Annual General Meeting of Shareholders in 2008.
Amsterdam, 6 March 2008
Fritz Fröhlich, Chairman
Annemiek Fentener van Vlissingen, Deputy Chairman
Harold Fentener van Vlissingen
Ludo van Halderen
Rob van Oordt
Annemieke Roobeek
Graham Sharman
Particulars of the members of the Supervisory Board:
Fritz Fröhlich (Chairman) (1942) 2, 3
Nationality GermanSupervisory Board memberships Randstad Holding N.V. (Chairman)
Altana AG (Chairman) Allianz Nederland Groep N.V. ASML Holding N.V. Rexel S.A. Aon Jauch & Hübener GmbH
First appointment 1999Current term 2007-2011
Annemiek Fentener van Vlissingen (Deputy Chairman) (1961) 2, 4
Nationality DutchSupervisory Board memberships SHV Holdings N.V. (Chairman)
Flint Holding N.V. Heineken N.V. De Nederlandsche Bank N.V.
First appointment 2001Current term 2005-2009
Harold Fentener van Vlissingen (1968) 6
Nationality DutchSupervisory Board memberships Diamond Tools Group B.V. (Chairman)
Flint Holding N.V. Precision Tools Holding B.V. (Director)
First appointed 2006Current term 2006-2010
Ludo van Halderen (1946)6
Nationality DutchSupervisory Board memberships Rabobank IJsseldelta (Chairman)
ECNFirst appointed 2006Current term 2006-2010
Rob van Oordt (1936)1, 4
Nationality DutchSupervisory Board memberships Unibail-Rodamco S.A. (Fr) (Chairman)
Schering Plough Corporation (USA) Fortis Bank N.V. (Be)
First appointed 1999Current term 2007-2011
Annemieke Roobeek (1958)6
Nationality DutchSupervisory Board memberships NCWT-NEMO (Chairman)
Aedes Haute Equipe RAI Amsterdam
First appointed 2006Current term 2006-2010
Graham Sharman (1938) 2, 5
Nationality British/AmericanSupervisory Board memberships noneFirst appointed 1998Current term 2006-2010
1 Chairman Audit & Governance Committee
2 Member Audit & Governance Committee
3 Chairman Remuneration & Nomination Committee
4 Member Remuneration & Nomination Committee
5 Chairman Strategy Committee
6 Member Strategy Committee
Draka Holding | 49Report of the Supervisory Board

General
The Board of Management and Supervisory Board of Draka Holding
endorse the Dutch Corporate Governance Code (the ‘Code’) and
recognize their integral responsibility for correctly balancing the
interests of the various stakeholders against the interests of the
Company. Unless stated otherwise, Draka Holding follows the
best-practice (‘Bp’) provisions included in the Code.
Any substantial changes in Draka Holding’s corporate governance
structure or in the manner in which Draka complies with this Code
will be presented to the General Meeting of Shareholders
(hereinafter referred to as ‘the General Meeting’).
Governance structure
Draka Holding N.V. is a public limited liability company under Dutch
law. Draka Holding is registered in Amsterdam, the Netherlands.
The management of Draka Holding is entrusted to the Board of
Management, under the supervision of the Supervisory Board.
The General Meeting of ShareholdersGeneral Meetings are held at least once a year. The General Meeting
discusses the Annual Report, adopts the financial statements,
declares the dividend, discharges the members of the Board of
Management and the members of the Supervisory Board from
liability in the exercise of their respective managing and
supervising duties and appoints the auditor.
The General Meeting appoints, suspends and dismisses the
members of the Board of Management and of the Supervisory
Board. On the proposal of the Supervisory Board, the General
Meeting decides on the adoption of the proposed remuneration
policy for the Board of Management. Resolutions of the Board of
Management and Supervisory Board, resulting in a material
change in the identity or character of the Company or its business
are subject to the approval of the General Meeting.
The General Meeting decides on the issue of new shares. The General
Meeting can delegate this power to another company body. At
present, this authorisation to issue (and to grant rights to acquire)
shares has been granted to the Board of Management, subject to
Supervisory Board approval, for a period of eighteen months,
starting from the General Meeting of 11 May 2007. This power is
limited to a maximum of 10% of the issued share capital on the date
of issue. This restriction does not apply to the issue of any class B
preference shares.
Draka has three types of shares: ordinary, preference and class B
preference shares. As at 31 December 2007, only ordinary and
preference shares had been issued. No class B preference shares
have so far been issued.
The General Meeting also decides on the acquisition of outstanding
shares.
One or more shareholders individually or collectively, representing
at least one hundredth of the entire issued capital or whose shares
at the date of the notice calling the meeting have a stock market
value of at least two hundred and fifty thousand euros (€ 250,000),
may submit proposals for discussion at the General Meeting no later
than sixty days before the meeting, in writing to the Board of
Management or the Chairman of the Supervisory Board. These
proposals will be included in the agenda unless, in the opinion of
the Supervisory Board and the Board of Management, the Company
has an important interest to not include them.
Role of the Supervisory BoardThe responsibilities, tasks and working methods of the Supervisory
Board are laid down in the Articles of Association and the Charters
of the Supervisory Board of Draka Holding and its subcommittees.
The Supervisory Board is responsible for supervising all the policies
and activities of the Board of Management and gives advice wherever
this is appropriate. In doing so the Supervisory Board takes into
account the interests of all the relevant parties, internally as well as
externally. In performing their task, the members of the Supervisory
Board focus on the interests of the Company and the business
associated with it. For that purpose, the Board of Management
timely provides the Supervisory Board with the data required for
performing this task.
Members of the Supervisory Board are appointed by the General
Meeting following proposals by the Supervisory Board. The General
Meeting and the Central Works Council can make recommendations
for appointment to the Supervisory Board. The Central Works
Council may recommend one third of the Supervisory Board
members to be nominated by the Supervisory Board unless the
Supervisory Board objects to such recommendation on the grounds
that the recommended person would, in its view, not be capable
of properly performing his or her duties as a member of the
Supervisory Board or in case the Supervisory Board would no longer
have the required composition as the result of such appointment.
The remuneration of the Supervisory Board is determined by the
General Meeting.
The composition of the Supervisory Board takes into account the
nature of the Company, its activities and the desired expertise
and background of its members. The Supervisory Board
retirement schedule is drawn up along the principles as expressed
in the Code and is designed to prevent an unnecessary number of
appointments or reappointments at the same time. The
Supervisory Board of Draka Holding currently consists of seven
members.
The Supervisory Board established three subcommittees. In view of
the scale, diversity and complexity of the matters to be discussed,
the committees contribute towards more effective decision making
by the Supervisory Board. The composition of these subcommittees
is as follows:
1) Audit & Governance Committee: Rob van Oordt (Chairman),
Annemiek Fentener van Vlissingen, Fritz Fröhlich and Graham
Sharman (members).
Corporate Governance
50 | Draka Holding Corporate Governance

2) Remuneration & Nomination Committee: Fritz Fröhlich
(Chairman), Annemiek Fentener van Vlissingen and Rob van
Oordt (members).
3) Strategy Committee: Graham Sharman (Chairman),
Annemieke Roobeek, Ludo van Halderen and Harold Fentener
van Vlissingen (members).
The role, responsibilities and tasks of the Supervisory Board and its
subcommittees are laid down in specific charters for the
Supervisory Board and each subcommittee. The charters also record
the working methods and composition. The Supervisory Board
profile, as well as all the charters, including compositions of the
Supervisory Board and each of its subcommittees, are available
at the Draka Holding website (www.draka.com).
Although Draka Holding agrees with the Code, its principles and
best-practice provisions, there are some aspects where Draka
deviates from the Code:
• The Supervisory Board includes two members who do not qualify
as independent, Annemiek Fentener van Vlissingen and Harold
Fentener van Vlissingen, which is a deviation from Bp III 2.1.
• The Supervisory Board has not introduced a maximum term of
membership of the Supervisory Board because of the need of
the Company to have long-term access to the required
expertise, which is a deviation from Bp III 3.5.
• Draka Holding’s Supervisory Board has a combined remuneration
and nomination committee. As Draka Holding attaches great
value to the coordinating role of the Chairman of the Supervisory
Board, especially in respect of the selection and nomination
process of Supervisory Board and Board of Management
members, the Chairman of the Supervisory Board is also Chairman
of the Remuneration & Nomination Committee, which is a
deviation from Bp III 5.11.
Role of the Board of ManagementThe Board of Management is responsible for the management and
the successful realization of the long term strategy of Draka Holding
and its operating companies. Board of Management members are
appointed by the General Meeting, from among candidates nominated
by the Supervisory Board. The General Meeting may suspend or
dismiss Board of Management members at any time. A resolution
to dismiss a Board of Management member, not following the
proposal of the Supervisory Board, can only be carried out by an
absolute majority of the cast votes by a quorum of shareholders
representing more than one third of the capital in issue.
In the event of a conflict of interest between Draka Holding and a
member of the Board of Management, Draka Holding will be
represented either by a member of the Board of Management or of
the Supervisory Board to be designated by the Supervisory Board.
In 2007, the composition of the Board of Management has
substantially changed. Christian Raskin, Chief Strategy Officer,
retired and stepped down from the Board of Management on 31
August 2007. Ingolf Schulz was Chairman and Chief Executive
Officer until 30 September 2007 and stepped down from the
Board of Management as per 31 December 2007. After his
appointment to the Board of Management, on 1 September 2007,
Sandy Lyons has served Chairman and Chief Executive Officer of
the Board of Management since 1 October 2007.
Particulars of the Board of Management
Sandy Lyons (1956): CEO and Chairman of the Board from 1 October 2007
Nationality AmericanSupervisory Board memberships noneAppointed 2007
Frank Dorjee (1960): CFO
Nationality DutchSupervisory Board memberships noneAppointed 2005
Ingolf Schulz (1948): CEO and Chairman of the Board until 30 September 2007
Nationality GermanSupervisory Board memberships noneAppointed 2004
Christian Raskin (1947): CSO until 31 August 2007
Nationality BelgianSupervisory Board memberships noneAppointed 2002
Code of Conduct and Whistleblower policy Draka Holding actively promotes awareness throughout the
Company of the importance of good corporate governance. In the
framework of good corporate governance, the Board of Management
and the Supervisory Board of Draka Holding introduced a Code of
Conduct in 2007, which reflects Draka Holding’s core values and
standards and includes a clear Mission Statement for all employees
within Draka. This Code of Conduct applies throughout Draka and
covers all companies affiliated with Draka Holding. Next to the Code
of Conduct a Whistleblower procedure has been introduced. For the
purpose of this policy, a compliance system has been developed,
which provides the basis for effective reporting of potential abuses
within Draka. As part of Draka’s corporate governance policy and
procedures, the Company Secretary serves as Compliance Officer.
As such, she is also the prime employee contact as part of the
Whistlerblower scheme.
Draka Holding | 51Corporate Governance

Share information
Stock exchange listingDraka Holding N.V. shares have been listed on Euronext Amsterdam since 1991. In March 2001, the share was
included for the first time in the Next150 index (symbol: DRAK, fund code: 34781, ISIN code: NL0000347813).
From 4 March 2008, Draka is listed on Euronext’s AMX (Amsterdam Midkap) index. Draka’s market capitalisation
at year-end 2007 amounted to around € 820 million.
Since 8 July 2002, options on Draka shares have been traded on Euronext Amsterdam Derivative Markets. In
addition, subordinated convertible bonds have been traded on the exchange since 22 September 2005. This is a
five-year convertible bond loan (4% coupon, nominal € 100 million) maturing on 20 September 2010, further
details of which can be found on page 117. The subordinated convertible bond loan (5% coupon, nominal
€ 95.2 million outstanding) which matured on 15 April 2007 was repaid at 100% of the outstanding principal.
Share price performance of Draka Holding N.V. (October 1991 – March 2008)
Capital and sharesThe authorised capital of Draka Holding N.V. is composed as follows (all shares have a nominal value of € 0.50):
2007 Authorised Issued
Ordinary bearer shares and registered shares 58,000,000 35,571,009
Preference shares 1 12,000,000 5,046,257
Class B preference shares 1,2 70,000,000 -
Authorised capital 140,000,000 40,617,266
1 Not tradable on the Amsterdam stock exchange2 No Class B shares have been issued sofar
As at 31 December 2007, the number of issued and fully paid-up shares was 40,617,266 representing an amount
of € 20,308,633. The increase of 3,603 in the number of ordinary shares compared with year-end 2006 was due
52 | Draka Holding Share information
��������������������������������������������������������������������
�
���
���
���
���
����
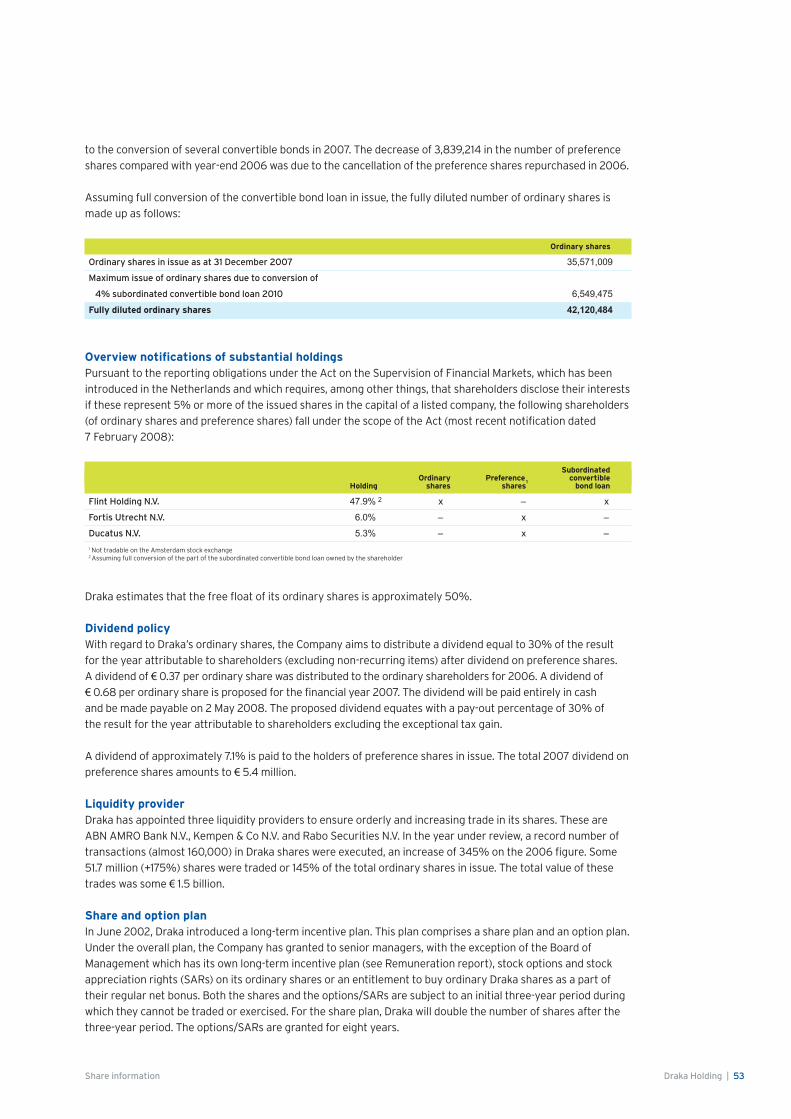
to the conversion of several convertible bonds in 2007. The decrease of 3,839,214 in the number of preference
shares compared with year-end 2006 was due to the cancellation of the preference shares repurchased in 2006.
Assuming full conversion of the convertible bond loan in issue, the fully diluted number of ordinary shares is
made up as follows:
Ordinary shares
Ordinary shares in issue as at 31 December 2007 35,571,009
Maximum issue of ordinary shares due to conversion of
4% subordinated convertible bond loan 2010 6,549,475
Fully diluted ordinary shares 42,120,484
Overview notifications of substantial holdingsPursuant to the reporting obligations under the Act on the Supervision of Financial Markets, which has been
introduced in the Netherlands and which requires, among other things, that shareholders disclose their interests
if these represent 5% or more of the issued shares in the capital of a listed company, the following shareholders
(of ordinary shares and preference shares) fall under the scope of the Act (most recent notification dated
7 February 2008):
Subordinated Ordinary Preference convertible Holding shares shares
1 bond loan
Flint Holding N.V. 47.9% 2 x – x
Fortis Utrecht N.V. 6.0% – x –
Ducatus N.V. 5.3% – x –
1 Not tradable on the Amsterdam stock exchange2 Assuming full conversion of the part of the subordinated convertible bond loan owned by the shareholder
Draka estimates that the free float of its ordinary shares is approximately 50%.
Dividend policyWith regard to Draka’s ordinary shares, the Company aims to distribute a dividend equal to 30% of the result
for the year attributable to shareholders (excluding non-recurring items) after dividend on preference shares.
A dividend of € 0.37 per ordinary share was distributed to the ordinary shareholders for 2006. A dividend of
€ 0.68 per ordinary share is proposed for the financial year 2007. The dividend will be paid entirely in cash
and be made payable on 2 May 2008. The proposed dividend equates with a pay-out percentage of 30% of
the result for the year attributable to shareholders excluding the exceptional tax gain.
A dividend of approximately 7.1% is paid to the holders of preference shares in issue. The total 2007 dividend on
preference shares amounts to € 5.4 million.
Liquidity providerDraka has appointed three liquidity providers to ensure orderly and increasing trade in its shares. These are
ABN AMRO Bank N.V., Kempen & Co N.V. and Rabo Securities N.V. In the year under review, a record number of
transactions (almost 160,000) in Draka shares were executed, an increase of 345% on the 2006 figure. Some
51.7 million (+175%) shares were traded or 145% of the total ordinary shares in issue. The total value of these
trades was some € 1.5 billion.
Share and option planIn June 2002, Draka introduced a long-term incentive plan. This plan comprises a share plan and an option plan.
Under the overall plan, the Company has granted to senior managers, with the exception of the Board of
Management which has its own long-term incentive plan (see Remuneration report), stock options and stock
appreciation rights (SARs) on its ordinary shares or an entitlement to buy ordinary Draka shares as a part of
their regular net bonus. Both the shares and the options/SARs are subject to an initial three-year period during
which they cannot be traded or exercised. For the share plan, Draka will double the number of shares after the
three-year period. The options/SARs are granted for eight years.
Draka Holding | 53Share information

As at 31 December 2007, the number of outstanding options/SARs amounted to 448,380 and the number of
assigned shares to 22,594. The stock option/SARs exercise prices and share allocation prices are as follows:
Number of shares Number of options/SARs Exercise price
2002 – 12,812 € 24.26
2003 – 13,270 € 7.42
2004 – 26,468 € 11.63
2005 5,998 102,261 € 10.05
2006 8,386 141,728 € 13.51
2007 8,210 151,841 € 28.02
Total 22,594 448,380
54 | Draka Holding Share information
Long term Research & Development is
behind the innovative products that the
Mobile Network Cable division offers its
customers. The results of that are
demonstrated by the world-leading range
of technically advanced products. “But
there’s more to innovation than products
alone”, says Mika Höijer, President of Draka
Mobile Network Cable. “The way we deliver
those products to our customers, and the
services we offer, are just as important.”
small components they need. That saves them
time on-site and allows them to complete the
job as quickly as possible. And of course we
ensure reliable delivery, so customers know
they will have the products they need on
site, when they need them.”
Ways to reduce costs
Cost is also an important factor, especially for
mobile network operators who are subject to
strong competitive pressures. “That’s why
we’re constantly looking for ways to reduce
costs without compromising on quality”,
says Mika Höijer. “Our process development
department is always working on
improvements that will result in a better
end-product at a lower cost than before. Just
one example is our unique foaming process,
which gives a more waterproof cable while
at the same time allowing the line speed to
be increased. We have also introduced
continuous welding of the outer conductor
which is made of very thin copper tape that
“Innovation leader in products, but also in services”
“The performance and durability of our cables
are vital aspects that our customers depend
on, and it goes without saying that all our
products meet the most stringent demands
in those areas. But we also have to answer a
lot of other requirements”, Mika Höijer
emphasises. “For example making our products
easier to use, and easier to install under tough
field conditions. Our RFA feeder cables
combine high strength and protection with
excellent flexibility. That ensures easy
handling and installation, while reducing the
risk of breakage to an absolute minimum.”
Detailed instructions and training
“We provide detailed instructions and training
to help installation companies work with our
cables, as well as special tools – for example
to efficiently cut cables to length and fit
connectors. And we further support installers
by putting together complete, ready-to-install
packages including extras like connectors,
grounding kits, EMPs, clamps and all the other
Growth by innovation: saving cost, simplifying installation and maximising customer service

Prevention of insider tradingUnder Section 5:65 of the Dutch Financial Supervision Act (Wft), Draka is subject to a regulation on the holding of
and effecting transactions in shares and other financial instruments. This regulation applies within Draka to the
Board of Management, Supervisory Board and Directors. In addition, around 100 employees at Draka are subject
to this regulation. ‘Closed periods’ apply to these employees, during which they are not permitted to trade in Draka
securities. The Company Secretary has been appointed as compliance officer and is responsible for enforcing the
Company’s Code of Conduct and for communication with the Dutch Authority for the Financial Markets.
Draka Holding | 55Share information
keeps weight down and saves material. In
our tandem process, continuous welding is
followed directly by jacketing which enables
us further to increase the efficiency of the
production line. At the same time scrap rates
are reduced, making an additional
contribution to cost savings.”
Saving cost and weight
Another way in which the division has
responded to customers’ needs is with a new
family of aluminium feeder cables. By using
an aluminium outer conductor instead of the
traditional copper, these new cables allow cost
savings to be made while still maintaining
performance at the required standards. Thanks
to the lighter aluminium outer conductor they
also offer attractive weight savings. “These
are just a few of the ways in which we go
further than ever to be the number 1 choice
for our customers”, Mika Höijer concludes.
Mika Höijer, President Draka Mobile Network Cable
“We’re always listening to the customer’s needs”
“Exactly what our customers want to buy from us depends strongly on the region. In Europe
we usually supply complete, ready-to-install packages to mobile operators, while in emerging
markets our customers are also OEMs who offer turnkey projects and put together the
materials they need by themselves. But the important thing as far as we’re concerned is to
listen carefully to the needs and preferences of the individual customer. Whether they relate
to the products and specifications – even including requirements for custom developments
– to delivery and logistics, or to supporting services. We aim to provide a responsive service
that gives customers exactly what they need, where and when they need it.”

General Meeting of ShareholdersThe General Meeting of Shareholders held on 11 May 2007, at which 67.8% of the total shares in issue were
represented, adopted the following resolutions:
• adoption of the 2006 financial statements and dividend;
• ratification of the actions of the Board of Management and the Supervisory Board with regard to their
management and supervision, respectively, in 2006;
• reappointment of Fritz Fröhlich as Chairman of the Supervisory Board and Rob van Oordt as a member of the
Supervisory Board of Draka Holding N.V.;
• approval and adoption of the proposals by the Board of Management and the Supervisory Board relating to:
• the remuneration of the members of the Supervisory Board;
• the remuneration policy for the Board of Management;
• reappointment of the auditors, KPMG Accountants N.V., for the 2007 financial year;
• designation of the Board of Management as the body authorised to resolve to issue shares, grant rights to
subscribe for shares and restrict or exclude statutory pre-emptive rights for a period ending on 11 November 2008;
• authorisation for the company to acquire its own shares:
• preference shares with serial numbers 1, 2, 4, 6, 9 and 10 in the Company’s capital, which were repurchased
on 29 December 2006;
• ordinary shares up to a maximum of 10% of the capital currently in issue, for a period not exceeding 18
months;
• cancellation of all preference shares held by Draka Holding N.V. (serial numbers 1, 2, 4, 6, 9 and 10).
Extraordinary General Meeting of ShareholdersThe Extraordinary General Meeting of Shareholders held on 30 August 2007, at which 58.7% of the total shares
in issue were represented, resolved to appoint Sandy Lyons as a member of the Board of Management of Draka
Holding N.V.
Investor relationsDraka is committed to maintaining a continuous dialogue with all stakeholders by pursuing an open and active
communication policy. In this way, Draka provides insights into its strategy, objectives, product and market
developments and financial results.
Draka published information on the development of its business on four occasions last year. In addition to publishing
its annual figures for 2006 and the interim figures for 2007, Draka released two trading updates in 2007, in June
and again in November. When announcing the annual figures for 2006 and the interim figures for 2007, meetings
were organised for journalists and analysts to provide further background to the results and to enable those
present to ask questions. A webcast was also organised on these two occasions, enabling interested parties who
could not be present to listen to the discussions on the annual figures for 2006 and the interim figures for 2007.
On Friday, 16 November 2007, for the third year in succession, Draka organised a theme day for journalists, analysts
and institutional investors to provide an opportunity for the Company to discuss part of its activities in greater
detail. This time the meeting was held at Draka’s operating company in Eindhoven (Netherlands), where
developments within the Optical Fiber division were explained in greater depth. The central theme was ‘innovation
in optical fiber’ and the discussion covered such areas as current and future market developments, Draka’s market
position and how it distinguishes itself from the competition and the investments in innovation that enable Draka
to maintain its competitive edge and move into new markets. As in the past, the theme day included a tour of the
factory. Draka intends to organise another theme meeting in 2008.
Draka conducted a very active investor relations policy in 2007, whereby the members of the Board of
Management gave briefings on the strategy, activities and results of the Company. Draka management met with a
large number of investors in various financial centres in Europe and North America, throughout the year and
especially after the publication of the annual figures for 2006 and the interim figures for 2007. Approximately
235 one-on-one meetings with investors were held in 2007 (2006: 135). Furthermore, on four occasions Draka gave
presentations to groups of private investors which were followed by a tour of the factory in Amsterdam-Noord.
Draka’s 2006 annual report was awarded a ‘certificate of transparency’ by the Scenter research bureau. In a
survey of 99 quoted and unquoted companies, Draka was joint 11th with a score of 8.2. This score is a measure of
transparency in terms of policy and strategy against ten criteria.
56 | Draka Holding Share information

Other informationFurther information on the Draka share and the activities of the Company can be found on the website at
www.draka.com. Also posted on the website is an interactive version of the annual report which includes a
comprehensive search function. It is also possible to refer queries to Draka’s Director Investor Relations,
Michael Bosman (tel: +31 20 568 9805, e-mail: [email protected]).
Key figures per ordinary share (x € 1) 2007 1 2006
1 2005
1 2004
1 2003
Shareholders’ equity (excluding preference shares) 9.51 9.85 10.13 8.84 11.16
Result for the year attributable to shareholders
after dividend on preference shares 2.46 0.57 0.12 (0.67) 0.12
Dividend 0.68 0.37 0.00 0.00 0.10
Pay-out 30% 2 30% 2 0% 0% 83%
Highest share price 42.20 26.60 14.30 20.90 16.85
Lowest share price 19.75 11.70 9.95 8.75 4.10
Market price at year-end 23.00 25.80 13.23 10.70 15.60
Price-earnings ratio on basis of year-end price 9.3 54.9 110.3 (13.9) 130.0
Price of convertible bond 2010 at year-end 156% 168% 103% – –
1 According to IFRS as adopted by the EU 2 Based on earnings per share excluding non-recurring items
Financial calendar
24 April 2008 Annual General Meeting of Shareholders at the Sheraton Amsterdam Airport Hotel, Schiphol
28 April 2008 Ex-dividend date
2 May 2008 Declaration of dividend for 2007
11 June 2008 Publication of trading update for the first half of 2008
1 September 2008 Publication of first-half year results for 2008 (before start of trading),
followed by a meeting for the press and analysts
13 November 2008 Publication of trading update for the second half of 2008
Draka Holding | 57Share information


Financial statements2007
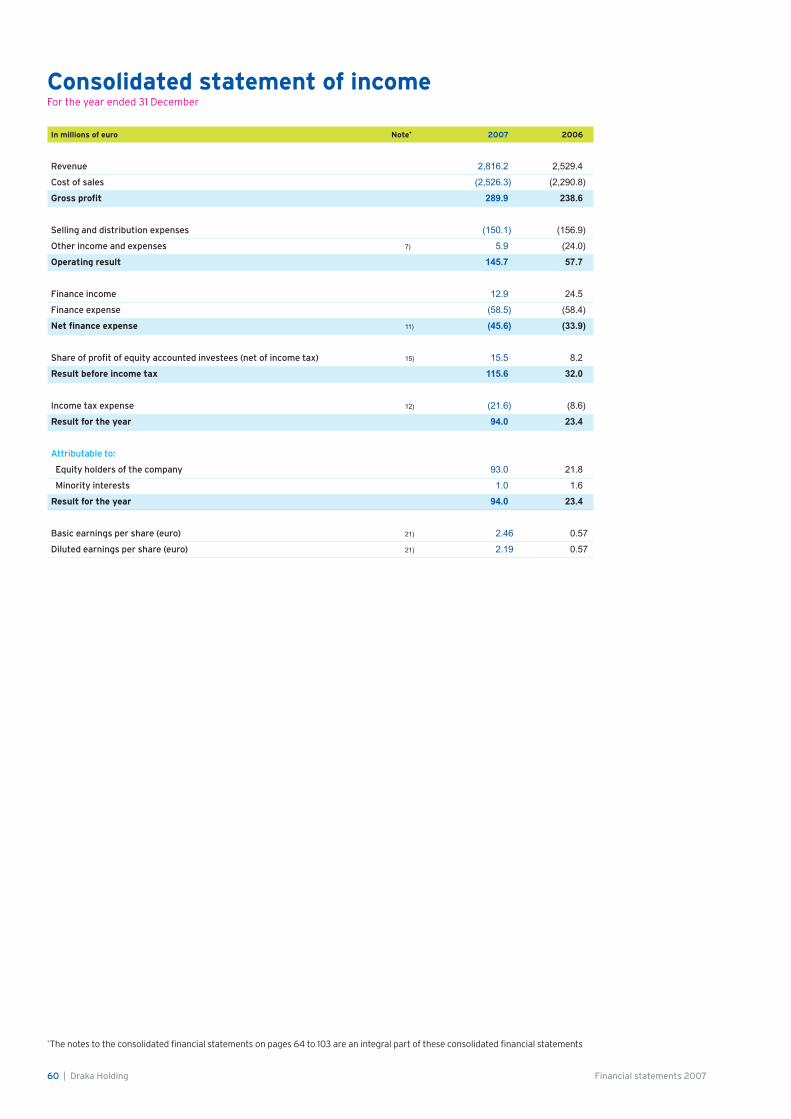
Consolidated statement of incomeFor the year ended 31 December
In millions of euro Note* 2007 2006
Revenue 2,816.2 2,529.4
Cost of sales (2,526.3) (2,290.8)
Gross profit 289.9 238.6
Selling and distribution expenses (150.1) (156.9)
Other income and expenses 7) 5.9 (24.0)
Operating result 145.7 57.7
Finance income 12.9 24.5
Finance expense (58.5) (58.4)
Net finance expense 11) (45.6) (33.9)
Share of profit of equity accounted investees (net of income tax) 15) 15.5 8.2
Result before income tax 115.6 32.0
Income tax expense 12) (21.6) (8.6)
Result for the year 94.0 23.4
Attributable to:
Equity holders of the company 93.0 21.8
Minority interests 1.0 1.6
Result for the year 94.0 23.4
Basic earnings per share (euro) 21) 2.46 0.57
Diluted earnings per share (euro) 21) 2.19 0.57
*The notes to the consolidated financial statements on pages 64 to 103 are an integral part of these consolidated financial statements
60 | Draka Holding Financial statements 2007

Consolidated balance sheetAs at 31 December
In millions of euro Note* 2007 2006
Assets
Non-current assets
Property, plant and equipment 13) 538.0 531.7
Intangible assets 14) 101.0 96.5
Investments in equity accounted investees 15) 87.0 94.9
Deferred tax assets 12) 46.3 52.7
Other non-current financial assets 16) 24.9 32.2
Total non-current assets 797.2 808.0
Current assets
Inventories 17) 441.0 433.7
Trade and other receivables 18) 470.1 458.8
Income tax receivable 4.8 2.4
Cash and cash equivalents 19) 39.4 42.1
Total current assets 955.3 937.0
Total assets 1,752.5 1,745.0
Equity
Shareholders’ equity
Share capital 20.4 20.4
Share premium 311.4 311.4
Retained earnings 98.8 103.0
Other reserves (15.8) (7.9)
Total equity attributable to equity holders of the company 414.8 426.9
Minority interests 12.8 12.2
Total equity 20, 37) 427.6 439.1
Liabilities
Non-current liabilities
Interest-bearing loans and borrowings 22) 527.3 268.2
Other interest-bearing liability 23) - 127.7
Provision for employee benefits 24) 92.2 93.3
Other provisions 25) 13.2 26.1
Deferred tax liabilities 12) 31.1 26.1
Total non-current liabilities 663.8 541.4
Current liabilities
Bank overdrafts 19) 34.9 32.0
Interest-bearing loans and borrowings 22) 49.4 107.2
Trade and other payables 26) 534.4 566.6
Income tax payable 29.9 26.8
Other provisions 25) 12.5 31.9
Total current liabilities 661.1 764.5
Total liabilities 1,324.9 1,305.9
Total equity and liabilities 1,752.5 1,745.0
*The notes to the consolidated financial statements on pages 64 to 103 are an integral part of these consolidated financial statements
Draka Holding | 61Financial statements 2007

Consolidated statement of cash flowsAs at 31 December
In millions of euro Note* 2007 2006
Result for the year 94.0 23.4
Adjustments for:
Depreciation 13) 48.2 49.6
Amortisation 14) 4.3 5.1
Impairments 13) - 6.3
Finance income 11) (12.9) (24.5)
Finance expense 11) 58.5 58.4
Share of profit of equity accounted investees 15) (15.5) (8.2)
Equity-settled share-based payments 10) 1.5 0.9
Income tax expense 12) 21.6 8.6
199.7 119.6
Changes in inventories 17) (7.3) (70.1)
Changes in trade receivables 18) (11.9) (39.6)
Changes in trade payables 26) (14.8) 93.4
Changes in other working capital (14.9) 28.1
Changes in provisions (2.0) 12.0
Other - 0.5
148.8 143.9
Interest paid (41.8) (39.9)
Income tax paid (10.4) (1.3)
Application of provisions 24, 25) (31.4) (22.8)
Net cash from operating activities 65.2 79.9
Dividends received 15) 21.7 2.1
Proceeds from sale of property, plant and equipment 2.3 8.6
Acquisition of minority interest 3) (209.0) -
Acquisition of subsidiaries and associates, net of cash acquired 3) (0.8) (30.0)
Acquisition of intangible assets 14) (7.3) (1.9)
Acquisition of property, plant and equipment 13) (64.2) (45.6)
Net cash used in investing activities (257.3) (66.8)
Dividends paid (ordinary and preference shares) (14.6) -
Redeemable preference shares issued - 76.6
Redeemable preference shares redeemed - (129.5)
Convertible subordinated bond redeemed (95.2) -
Subordinated loan issued - 77.5
Subordinated loan redeemed (77.5) -
Movement in multicurrency facility 365.0 -
Shares acquired under long-term incentive plans (4.3) -
Shares delivered under long-term incentive plans 1.3 -
Movements in other bank loans 13.0 (14.2)
Net cash from financing activities 22) 187.7 10.4
Net increase/(decrease) in cash and cash equivalents (4.4) 23.5
Cash and cash equivalents at 1 January (net of bank overdrafts) 10.1 (13.1)
Exchange rate fluctuations on cash and cash equivalents (1.2) (0.3)
Cash and cash equivalents at 31 December (net of bank overdrafts) 19) 4.5 10.1
*The notes to the consolidated financial statements on pages 64 to 103 are an integral part of these consolidated financial statements
62 | Draka Holding Financial statements 2007

Consolidated statement of changes in total equity*
In millions of euro Reserve Preference for shares Share- Share Share Translation Hedging treasury dividend Retained holders’ Minority Total capital premium reserve reserve shares reserve earnings equity Interests equity
Balance as at 1 January 2006 17.9 237.3 12.1 11.2 - - 81.7 360.2 10.1 370.3
Foreign exchange translation differences - - (17.2) - - - - (17.2) (0.2) (17.4)
Effective portion of fair value changes of
cash flow hedges (net of income tax) - - - (15.4) - - - (15.4) - (15.4)
Total income and expenses recognised
directly in equity - - (17.2) (15.4) - - - (32.6) (0.2) (32.8)
Result for the year - - - - - 1.4 20.4 21.8 1.6 23.4
Total recognised income and expense - - (17.2) (15.4) - 1.4 20.4 (10.8) 1.4 (9.4)
Preference shares issued 2.5 74.1 76.6 - 76.6
Share-based payments - - - - - 0.9 0.9 - 0.9
Effect of acquisitions and divestments - - - - - - 0.7 0.7
Total direct changes in equity 2.5 74.1 - - - - 0.9 77.5 0.7 78.2
Balance as at 31 December 2006 20.4 311.4 (5.1) (4.2) - 1.4 103.0 426.9 12.2 439.1
Foreign exchange translation differences - - (13.1) - - - - (13.1) (0.8) (13.9)
Effective portion of fair value changes
of cash flow hedges (net of income tax) - - - 1.2 - - - 1.2 - 1.2
Total income and expenses recognised
directly in equity - - (13.1) 1.2 - - - (11.9) (0.8) (12.7)
Result for the year - - - - - 5.4 87.6 93.0 1.0 94.0
Total recognised income and expense - - (13.1) 1.2 - 5.4 87.6 81.1 0.2 81.3
Share-based payments - - - - - - 1.5 1.5 - 1.5
Shares acquired under long-term
incentive plans - - - - (4.3) - - (4.3) - (4.3)
Shares delivered under long-term
incentive plans - - - - 4.3 - (3.0) 1.3 - 1.3
Dividends paid - - - - - (1.4) (13.2) (14.6) - (14.6)
Waiver of put option on minority interest - - - - - - - - 131.9 131.9
Effect of acquisition minority interest - - - - - - (77.1) (77.1) (131.9) (209.0)
Effect of acquisitions and divestments - - - - - - - - 0.4 0.4
Total direct changes in equity - - - - - (1.4) (91.8) (93.2) 0.4 (92.8)
Balance as at 31 December 2007 20.4 311.4 (18.2) (3.0) - 5.4 98.8 414.8 12.8 427.6
*The notes to the consolidated financial statements on pages 64 to 103 are an integral part of these consolidated financial statements
Draka Holding | 63Financial statements 2007

Notes to the consolidated financial statementsContents
1. General 65
2. Significant accounting policies 65
3. Acquisitions of subsidiaries and minority interest 76
4. Financial risk management 76
5. Critical accounting estimates and assumptions 80
6. Segment reporting 82
7. Other income and expenses 83
8. Employee benefit expense 83
9. Remuneration of the Board of Management and Supervisory Board 83
10. Share-based payments 83
11. Net finance expense 86
12. Taxes 86
13. Property, plant and equipment 89
14. Intangible assets 90
15. Investments in equity accounted investees 91
16. Other non-current financial assets 92
17. Inventories 92
18. Trade and other receivables 93
19. Cash and cash equivalents 93
20. Total equity 93
21. Earnings per share 93
22. Interest-bearing loans and borrowings 94
23. Other interest-bearing liability 96
24. Provision for employee benefits 96
25. Other provisions 98
26. Trade and other payables 99
27. Financial instruments 99
28. Derivative financial instruments 102
29. Commitments and contingent liabilities 102
30. Related parties 103
31. Events after the balance sheet date 103
64 | Draka Holding Notes to the consolidated financial statements 2007

1. GeneralDraka Holding N.V. (“the Company”) is a company domiciled in Amsterdam, The Netherlands and is engaged
worldwide in the development, production and sale of cable and cable systems. The activities are subdivided into
two groups: Draka Cableteq, which is responsible for the low-voltage and special-purpose cable activities, and
Draka Comteq, which handles the communication cable activities. The consolidated financial statements of the
Company for the year ended 31 December 2007 comprise the Company and its subsidiaries (together referred to
as “the Group”) and the Group’s interest in equity accounted investees.
A summary of the main subsidiaries is included on page 38 of this Annual report.
The financial statements were authorised for issue by the Board of Management on 6 March 2008. The financial
statements are tabled for adoption by the Annual General Meeting of Shareholders on 24 April 2008.
The information concerning the subsidiaries that are included in the consolidated financial statements which is
required under article 414 of Part 9, Book 2, of the Netherlands Civil Code, is filed at the trade register of the
Chamber of Commerce in Amsterdam. The Company financial statements on pages 104 to 112 have been drawn
up in accordance with article 402, Part 9, Book 2 of the Netherlands Civil Code.
These consolidated financial statements serve as exemption regarding the otherwise obligatory filing pursuant
to § 264b HGB of the German Commercial Code (“Handelsgesetzbuch”) of statutory financial statements of
Draka Comteq Berlin GmbH & Co. KG and Draka Comteq Germany GmbH & Co. KG.
2. Significant accounting policies(a) Statement of complianceThe consolidated financial statements have been prepared in accordance with International Financial Reporting
Standards (“IFRS”) as adopted by the European Union (“EU”) and in accordance with Part 9 of Book 2 of the
Netherlands Civil Code.
IFRS includes the application of International Financial Reporting Standards including International Accounting
Standards (IAS) and related Interpretations of the International Financial Reporting Interpretations Committee
(IFRIC) and Interpretations of the Standing Interpretations Committee (SIC).
(I) Standards, amendment and interpretations effective in 2007 relevant to the Group:
IFRS 7, ‘Financial instruments: Disclosures’, and the complementary amendment to IAS 1, ‘Presentation of financial
statements – Capital disclosures’, introduces new disclosures relating to financial instruments. Accordingly, we
have adopted the applicable requirements of IFRS 7 in the notes to the Group financial statements.
IFRIC 8, ‘Scope of IFRS 2’, requires consideration of transactions involving the issuance of equity instruments,
where the identifiable consideration received is less than the fair value of the equity instruments issued in order
to establish whether or not they fall within the scope of IFRS 2. This standard did not have a material impact on
the Group’s financial statements.
IFRIC 10, ‘Interim financial reporting and impairment’, prohibits that impairment losses recognised in an interim
period on goodwill and certain investments in equity instruments and in financial assets carried at cost are reversed
at a subsequent balance sheet date. This standard did not have any impact on the Group’s financial statements.
(II) Standards, amendments to and interpretations of existing standards that are relevant to the Group that are
not yet effective and have not been early adopted by the Group
The following standards, amendments to and interpretations of existing standards have been published and are
mandatory for the Group’s accounting periods beginning on or after 1 January 2008 or later periods. The Group
has not early adopted them:
• IFRIC 11, ‘IFRS 2 – Group and treasury share transactions’ provides guidance on whether share-based
transactions involving treasury shares or involving Group entities (for example, options over a parent’s shares)
should be accounted for as equity settled or cash-settled share-based payment transactions in the stand-
alone accounts of the parent and Group companies. This interpretation is not expected to have a material
impact on the Group’s consolidated financial statements.
• IAS 23 (Amendment), ‘Borrowing costs’ (effective from 1 January 2009). The amendment to the standard is
still subject to endorsement by the European Union. It requires an entity to capitalise borrowing costs directly
attributable to the acquisition, construction or production of a qualifying asset (one that takes a substantial
period of time to get ready for use or sale) as part of the cost of that asset. The option of immediately expensing
Draka Holding | 65Notes to the consolidated financial statements 2007

those borrowing costs will be removed. The Group will apply IAS 23 (Amended) from 1 January 2009 but it
is not expected to have a material impact given the insignificance of qualifying assets.
• IFRS 8, ‘Operating segments‘ (effective from 1 January 2009). IFRS 8 replaces IAS 14 and aligns segment
reporting with the requirements of the US standard SFAS 131, ‘Disclosures about segments of an enterprise
and related information’. The new standard requires a ‘management approach’, under which segment
information is presented on the same basis as that used for internal reporting purposes. The Group will apply
IFRS 8 from 1 January 2009. The expected impact is still being assessed in detail by management.
• IFRIC 14, ‘IAS 19 – The limit on a defined benefit asset, minimum funding requirements and their interaction’
(effective from 1 January 2008). IFRIC 14 provides guidance on assessing the limit in IAS 19 on the amount of
the surplus that can be recognised as an asset. It also explains how the pension asset or liability may be
affected by a statutory or contractual minimum funding requirement. The Group will apply IFRIC 14 from
1 January 2008, but it is not expected to have a material impact on the Group’s accounts.
(b) Basis of preparationThe financial statements are presented in euro, rounded to the nearest decimal million. They are prepared on
the historical cost basis except that the following assets and liabilities are stated at their fair value: derivative
financial instruments, financial instruments held for trading, financial instruments classified as available-for-sale
and the other interest-bearing liability. Non-current assets and disposal groups held-for-sale are stated at the
lower of their carrying amount and fair value less costs to sell.
The preparation of financial statements in conformity with IFRS requires management to make judgements,
estimates and assumptions that affect the application of policies and reported amounts of assets and liabilities,
income and expenses. The estimates and associated assumptions are based on historical experience and various
other factors that are believed to be reasonable under the circumstances, the results of which form the basis of
making the judgements about carrying values of assets and liabilities that are not readily apparent from other
sources. Actual results may differ from these estimates.
The estimates and underlying assumptions are reviewed on an ongoing basis. Revisions to accounting estimates
are recognised in the period in which the estimate is revised if the revision affects only that period, or in the
period of the revision and future periods if the revision affects both current and future periods.
Judgements made by management in the application of IFRS that have significant effect on the financial
statements and estimates with a significant risk of material adjustment in the next year are discussed in note 5.
(c) Basis of consolidation(I) Subsidiaries
Subsidiaries are entities controlled by the Company. Control exists when the Company has the power, directly or
indirectly, to govern the financial and operating policies of an entity so as to obtain benefits from its activities. In
assessing control, potential voting rights that presently are exercisable or convertible are taken into account. The
financial statements of subsidiaries are included in the consolidated financial statements from the date that control
commences until the date that control ceases.
(II) Associates
Associates, included in equity accounted investees on the balance sheet, are those entities over which the
Group has the ability to exercise significant influence, but not control, over the financial and operating policies.
The consolidated financial statements include the Group’s share of the total recognised gains and losses of
associates on an equity accounted basis, from the date that significant influence commences until the date that
significant influence ceases. When the Group’s share of losses exceeds its interest in an associate, the Group’s
carrying amount is reduced to nil and recognition of further losses is discontinued except to the extent that
the Group has incurred legal or constructive obligations or made payments on behalf of an associate.
(III) Joint ventures
Joint ventures, included in equity accounted investees on the balance sheet, are those entities over whose
activities the Group has joint control, established by contractual agreement. The consolidated financial
statements include the Group’s share of the total recognised gains and losses of joint ventures on an equity
accounted basis, from the date that joint control commences until the date that joint control ceases.
(IV) Other investments
Other investments are financial interests over whose activities the group has no significant influence, and has
66 | Draka Holding Notes to the consolidated financial statements 2007

no control. These investments are carried at fair value and changes are recognised in the income statement.
Furthermore dividends are accounted for in the income statement when these become due. If an equity
investment does not have a quoted market price in an active market and other methods of determining fair
value do not result in a reasonable estimate, the investment is measured at cost less impairment losses.
(V) Transactions eliminated on consolidation
Intragroup balances and any unrealised gains and losses or income and expenses arising from intragroup
transactions, are eliminated in preparing the consolidated financial statements.
Unrealised gains arising from transactions with associates and jointly controlled entities are eliminated to the
extent of the Group’s interest in the entity. Unrealised losses are eliminated in the same way as unrealised gains,
but only to the extent that there is no evidence of impairment.
(d) Foreign currency(I) Foreign currency transactions
Transactions in foreign currencies are translated to the respective functional currencies of Group entities at the
exchange rates at the dates of the transactions. Monetary assets and liabilities denominated in foreign currencies
at the balance sheet date are translated at the exchange rate at that date. Foreign exchange differences arising
on translation of monetary items are recognised in the income statement. Non-monetary assets and liabilities
that are measured in terms of historical cost in a foreign currency are translated using the exchange rate at the
date of the transaction. Non-monetary assets and liabilities denominated in foreign currencies that are stated at
fair value are translated to euro at foreign exchange rates at the dates the fair value was determined.
(II) Foreign operations
The assets and liabilities of foreign operations, including goodwill and fair value adjustments arising on
consolidation as from 1 January 2004, are translated to euro at foreign exchange rates at the balance sheet date.
Goodwill and fair value adjustments arising on consolidation relating to acquisitions from before 1 January 2004
are denominated in euro. The revenues and expenses of foreign operations are translated to euro at rates
approximating the foreign exchange rates at the dates of the transactions. As from 1 January 2004 foreign
exchange differences arising from the translation of the net investment in foreign operations, and of related
hedges are taken to translation reserve, a separate component of equity. When a foreign operation is disposed of,
in part or in full, the relating accumulated translation differences are transferred to profit or loss as part of the
gain or loss on disposal.
(e) Derivative financial instrumentsThe Group uses derivative financial instruments to hedge its exposure to copper, foreign exchange and interest
rate risks arising from operational, financing and investment activities. In accordance with its risk management
policy, the Group does not hold or issue derivative financial instruments for trading purposes. However, derivatives
that do not qualify for hedge accounting are accounted for as trading instruments.
Derivative financial instruments are initially recognised at fair value. Subsequent to initial recognition, derivative
financial instruments are stated at fair value. The gain or loss on remeasurement to fair value is recognised
immediately in profit or loss. However, where derivatives qualify for hedge accounting, recognition of any resultant
gain or loss depends on the nature of the item being hedged (see accounting policy f).
The fair value of interest rate swaps is the estimated amount that the Group would receive or pay to terminate the
swap at the balance sheet date, taking into account current interest rates and the current creditworthiness of the
swap counterparties. The fair value of forward contracts is their quoted market price at the balance sheet date.
(f) HedgingThe fair values of various derivative instruments used for hedging purposes are disclosed in note 28.
Movements on the hedging reserve in shareholders’ equity are shown in note 37. Given the nature of the Group‘s
hedging derivatives, the full fair value is classified as a current asset or liability.
(I) Cash flow hedges
Where a derivative financial instrument is designated as a hedge of the variability in cash flows of a recognised
asset or liability, or a highly probable forecasted transaction, the effective part of any gain or loss on the
derivative financial instrument is recognised directly in equity. When the forecasted transaction subsequently
results in the recognition of a non-financial asset or non-financial liability, or the forecast transaction for a non-
Draka Holding | 67Notes to the consolidated financial statements 2007

financial asset or non-financial liability the associated cumulative gain or loss is removed from equity and included
in the initial cost or other carrying amount of the non-financial asset or liability. If a hedge of a forecasted
transaction subsequently results in the recognition of a financial asset or a financial liability, the associated gains
and losses that were recognised directly in equity are reclassified into profit or loss in the same period or periods
during which the asset acquired or liability assumed affects profit or loss. For cash flow hedges, other than those
covered by the preceding two policy statements, the associated cumulative gain or loss is removed from equity and
recognised in the income statement in the same period or periods during which the hedged forecast transaction
affects profit or loss. The ineffective part of any gain or loss is recognised immediately in the income statement.
When a hedging instrument expires or is sold, terminated or exercised, or the entity revokes designation of the
hedge relationship but the hedged forecast transaction is still expected to occur, the cumulative gain or loss at
that point remains in equity and is recognised in accordance with the above policy when the transaction occurs.
If the hedged transaction is no longer expected to take place, the cumulative unrealised gain or loss recognised
in equity is recognised immediately in the income statement.
(II) Fair value hedges
Changes in the fair value of derivatives that are designated and qualify as fair value hedges are recorded in
the income statement, together with any changes in the fair value of the hedged asset or liability that are
attributable to the hedged risk. In 2006 and 2007 the Group did not have any fair value hedges in place.
(III) Hedge of monetary assets and liabilities
Where a derivative financial instrument is used to hedge economically the foreign exchange exposure of a
recognised monetary asset or liability, no hedge accounting is applied and any gain or loss on the hedging
instrument is recognised in the income statement.
(g) Property, plant and equipment(I) Owned assets
Items of property, plant and equipment are stated at cost less accumulated depreciation (see below) and
impairment losses (see accounting policy m). Self constructed assets are stated at cost. Depreciation on these
assets starts upon usage.
Where components of an item of property, plant and equipment have different useful lives, they are accounted
for as separate items of property, plant and equipment.
(II) Leased assets
Leases in terms of which the Group assumes substantially all the risks and rewards of ownership are classified as finance
leases. Assets acquired by way of finance lease are stated at an amount equal to the lower of its fair value and the
present value of the minimum lease payments at inception of the lease, less accumulated depreciation (see below) and
impairment losses (see accounting policy m). Lease payments are accounted for as described in accounting policy v.
(III) Subsequent expenditure
The costs of replacing part of an item of property, plant and equipment is recognised in the carrying amount of
the item if it is probable that the future economic benefits embodied within the part will flow to the Group and its
cost can be measured reliably. All other costs are recognised in the income statement as an expense as incurred.
(IV) Disposal
Gains and losses on disposal of an item of property, plant and equipment are determined by comparing the
proceeds from disposal with the carrying amount of property, plant and equipment and are recognised net within
other income in profit or loss.
(V) Depreciation
Depreciation is charged to the income statement on a straight-line basis over the estimated useful lives of each
component of an item of property, plant and equipment. Land is not depreciated.
The estimated useful lives are as follows:
• land and buildings 30 - 50 years
• plant and equipment 8 - 20 years
• fixtures and fittings 3 - 10 years
The depreciation methods, useful lives and residual values are reassessed annually.
68 | Draka Holding Notes to the consolidated financial statements 2007

(h) Intangible assets(I) Goodwill
All business combinations are accounted for by applying the purchase method. Goodwill represents amounts
arising on acquisition of subsidiaries and is determined as the difference between the cost of the acquisition
and the fair value of the net identifiable assets acquired. Goodwill in respect of acquisitions that occurred before
January 1, 2001 has been written-off to equity.
Goodwill is stated at cost less any accumulated impairment losses. Goodwill is allocated to cash generating units
and is not amortised but is tested annually for impairment (see accounting policy m). In respect of equity accounted
investees, the carrying amount of goodwill is included in the carrying amount of the investment in the equity
accounted investee. Negative goodwill arising on an acquisition is recognised directly in the income statement.
(II) Research and development
Expenditure on research activities, undertaken with the prospect of gaining new scientific or technical
knowledge and understanding, is recognised in the income statement as an expense as incurred.
Expenditure on development activities, whereby research findings are applied to a plan or design for the
production of new or substantially improved products and processes, is capitalised if the product or process is
technically and commercially feasible and the Group has sufficient resources to complete development. The
expenditure capitalised includes the cost of materials, direct labour and an appropriate proportion of overheads.
Other development expenditure is recognised in the income statement as an expense as incurred. Capitalised
development expenditure is stated at cost less accumulated amortisation (see below) and impairment losses
(see accounting policy m).
(III) Other intangible assets
Other intangible assets that are acquired by the Group are stated at cost less accumulated - amortisation (see
below) and impairment losses (see accounting policy m).
Expenditure on internally generated goodwill and brands is recognised in the income statement as an expense
when incurred.
(IV) Subsequent expenditure
Subsequent expenditure on capitalised intangible assets is capitalised only when it increases the future
economic benefits embodied in the specific asset to which it relates. All other expenditure is expensed as incurred.
(V) Amortisation
Amortisation is charged to the income statement on a straight-line basis over the estimated - useful lives of
intangible assets unless such lives are indefinite. Goodwill and intangible assets with an indefinite useful life are
systematically tested for impairment at each balance sheet date.
Other intangible assets are amortised from the date they are available for use. The estimated useful lives are as follows:
• patents and licenses 3 - 15 years
• development costs 5 years
• software 3 years
• other 5 - 7 years
The amortisation methods, useful lives and residual values are reassessed annually.
(i) Financial assets The group classifies its financial assets in the following categories: at fair value through profit or loss, loans and
receivables, and available for sale. The classification depends on the purpose for which the financial assets were
acquired. Management determines the classification of its financial assets at initial recognition.
(I) Financial assets at fair value through profit or loss
Financial assets at fair value through profit or loss are financial assets held for trading. A financial asset is
classified in this category if acquired principally for the purpose of selling in the short-term. Derivatives are also
categorised as held for trading unless they are designated as hedges. Assets in this category are classified as
current assets.
Draka Holding | 69Notes to the consolidated financial statements 2007

(II) Loans and receivables
Loans and receivables are non-derivative financial assets with fixed or determinable payments that are not
quoted in an active market. They are included in current assets, except for maturities greater than 12 months
after the balance sheet date. These are classified as non-current assets. The Group’s loans and receivables
comprise loans presented as non-current financial assets, trade and other receivables and cash and cash
equivalents in the balance sheet (see accounting policy k and l).
(III) Available-for-sale financial assets
Available-for-sale financial assets are non-derivatives that are either designated in this category or not classified
in any of the other categories. They are included in non-current assets unless management intends to dispose of
the investment within 12 months of the balance sheet date. In 2006 and 2007 the Group did not have any
available-for-sale financial assets.
Investments are initially recognised at fair value plus transaction costs for all financial assets not carried at fair
value through profit or loss. Financial assets carried at fair value through profit or loss are initially recognised
at fair value and transaction costs are expensed in the income statement. Financial assets are derecognised
when the rights to receive cash flows from the investments have expired or have been transferred and the
group has transferred substantially all risks and rewards of ownership. Available-for-sale financial assets and
financial assets at fair value through profit or loss are subsequently carried at fair value. Changes in the fair
value of financial assets classified as available-for-sale are recognised in equity. When securities classified as
available for sale are sold or impaired, the accumulated fair value adjustments recognised in equity are
included in the income statement. Loans and receivables are carried at amortised cost using the effective
interest method.
The fair values of quoted investments are based on current bid prices. If the market for a financial asset is not
active (and for unlisted securities), the group establishes fair value by using valuation techniques. These include
the use of recent arm’s length transactions, reference to other instruments that are substantially the same and
discounted cash flow analysis.
(j) Inventories(I) Inventories
Inventories are stated at the lower of cost and net realisable value. Net realizable value is the estimated selling
price in the ordinary course of business, less the estimated costs of completion and selling expenses, taking into
account the allowance for risk of obsolete inventory.
The cost of inventories is based on the weighted average purchase price (first in first out) and includes expenditure
incurred in acquiring the inventories and bringing them to their existing location and condition. In the case of
manufactured inventories as finished goods and semi finished goods, cost includes an appropriate share of
overheads based on normal operating capacity.
(II) Work in progress
Work in progress is stated at cost plus profit recognised to date (see accounting policy t) less a provision for
foreseeable losses and less progress billings. Cost includes all expenditure related directly to specific projects
and an allocation of fixed and variable overheads incurred in the Group’s contract activities based on normal
operating capacity.
(k) Trade and other receivables Trade and other receivables, other than derivative financial instruments presented in this balance sheet line
item, are stated at amortised cost less impairment losses (see accounting policy m).
(l) Cash and cash equivalentsCash and cash equivalents comprise cash balances and call deposits. Bank overdrafts that are repayable on
demand and form an integral part of the Group’s cash management are included as a component of cash and cash
equivalents for the purpose of the statement of cash flows.
(m) ImpairmentThe carrying amounts of the Group’s assets other than inventories (see accounting policy j) and deferred tax
assets (see accounting policy w), are reviewed at each reporting date to determine whether there is any indication
of impairment. If any such indication exists, the asset’s recoverable amount is estimated (see accounting policy m(I)).
70 | Draka Holding Notes to the consolidated financial statements 2007

For goodwill, assets that have an indefinite useful life and intangible assets that are not yet available for use, the
recoverable amount is estimated annually at 31 December of each year. An impairment loss is recognised whenever
the carrying amount of an asset or its cash-generating unit exceeds its recoverable amount. Impairment losses
are recognised in the income statement.
Impairment losses recognised in respect of cash-generating units are allocated first to reduce the carrying amount
of any goodwill allocated to cash-generating units (group of units) and then, to reduce the carrying amount of the
other assets in the unit (group of units) on a pro rata basis.
(I) Calculation of recoverable amount
The recoverable amount of receivables carried at amortised cost is calculated as the present value of estimated
future cash flows, discounted at the original effective interest rate (i.e., the effective interest rate computed at
initial recognition of these financial assets). Receivables with a short duration are not discounted.
The recoverable amount of other assets is the greater of their fair value less costs to sell and value in use. In
assessing value in use, the estimated future cash flows are discounted to their present value using a pre-tax
discount rate that reflects current market assessments of the time value of money and the risks specific to the
asset. For an asset that does not generate largely independent cash inflows, the recoverable amount is determined
for the cash-generating unit to which the asset belongs.
(II) Reversals of impairment
An impairment loss in respect of receivables carried at amortised cost is reversed if the subsequent increase in
recoverable amount can be related objectively to an event occurring after the impairment loss was recognised.
An impairment loss in respect of an investment in an equity instrument classified as available for sale is not
reversed through profit or loss. If the fair value of a debt instrument classified as available-for-sale increases
and the increase can be objectively related to an event occurring after the impairment loss was recognised
in profit or loss, the impairment loss shall be reversed, with the amount of the reversal recognised in profit
or loss.
An impairment loss in respect of goodwill is not reversed.
In respect of other assets, an impairment loss is reversed if there is an indication that the impairment loss may
no longer exist and there has been a change in the estimates used to determine the recoverable amount.
An impairment loss is reversed only to the extent that the asset’s carrying amount does not exceed the carrying
amount that would have been determined, net of depreciation or amortisation, if no impairment loss had been
recognised.
(n) Share capital(I) Preference share capital
Preference share capital is classified as equity if it is non-redeemable and any dividends are discretionary, or is
redeemable but only at the Company’s option. Dividends on preference share capital classified as equity are
recognised as distributions within equity.
Preference share capital is classified as a liability if it is redeemable on a specific date or at the option of the
shareholders or if dividend payments are not discretionary. Dividends thereon are recognised in the income
statement as interest expense on an accrual basis.
(II) Repurchase of share capital
When share capital recognised as equity is repurchased, the amount of the consideration paid, including
directly attributable costs, is recognised as a change in equity. Repurchased shares are classified as treasury
shares and presented as a deduction from total equity. When treasury shares are sold or reissued subsequently,
the shares are removed from the reserve for treasury shares on a FIFO basis. The amount received is
recognised as an increase in equity, and the resulting surplus or deficit on the transaction is transferred to / from
retained earnings.
(III) Dividends
Dividends are recognised as a reduction in equity in the period in which they are declared.
Draka Holding | 71Notes to the consolidated financial statements 2007

(o) Convertible subordinated bondsConvertible subordinated bonds that can be converted to share capital at the option of the holder, where the
number of shares issued does not vary with changes in their fair value, are accounted for as compound financial
instruments. Transaction costs that relate to the issue of a compound financial instrument are allocated to the
liability and equity components in proportion to the allocation of proceeds. The equity component is recognised
initially at the difference between the fair value of the compound instruments as a whole and the fair value of
the liability component. Subsequent measurement of the liability component is amortised cost by using the
effective interest method. The equity element is not remeasured subsequent to initial recognition. The
repurchase price of convertible subordinated bonds is allocated to the liability and equity component. This
allocation is based on a non-convertible debt the Group could have issued at repurchase date.
(p) Interest-bearing liabilities(I) Interest-bearing borrowings
Interest-bearing borrowings are recognised initially at fair value less attributable transaction costs. Subsequent to
initial recognition, interest-bearing borrowings are stated at amortised cost using the effective interest method.
(II) Other interest-bearing liability
The financial liability arising from the put option to acquire a minority interest is recognised at the present value
of the estimated exercise price of the option, with changes recognised through the income statement.
(q) Employee benefits(I) Defined contribution plans
A defined contribution plan is a post-employment benefit plan under which an entity pays fixed contributions
into a separate entity and will have no legal or constructive obligation to pay further amounts. Obligations for
contributions to defined contribution pension plans are recognised as an expense in the income statement as
incurred.
(II) Defined benefit plans
A defined benefit plan is a post-employment benefit plan other than a defined contribution plan. A significant
part of the Group’s defined benefit plans are funded with plan assets that have been segregated and restricted
in pension funds, trusts or have been insured to provide for the pension benefits to which the Group has
committed itself. The Group’s net obligation in respect of defined benefit pension plans is calculated separately
for each plan by estimating the amount of future benefit that employees have earned in return for their service
in the current and prior periods; that benefit is discounted to determine its present value, and the fair value of
any plan assets is deducted. The discount rate is the yield at the balance sheet date on high quality government
or corporate bonds that have maturity dates approximating to the terms of the Group’s obligations. The
calculation is performed by a qualified actuary using the projected unit credit method.
Pension costs in respect of defined benefit plans primarily represent the increase in the actuarial present value
of the obligation for pension benefits based on the employee service during the year and the interest on this
obligation in respect of employee service in previous years, net of the expected return on plan assets.
When the benefits of a plan are improved, the portion of the increased benefit relating to past service by
employees is recognised as an expense in the income statement on a straight-line basis over the average period
until the benefits become vested. To the extent that the benefits vest immediately, the expense is recognised
immediately in the income statement.
All actuarial gains and losses as at 1 January 2004, the date of transition to IFRS, were recognised. In respect of
actuarial gains and losses that arise subsequent to 1 January 2004 in calculating the Group’s obligation in respect
of a plan, to the extent that any cumulative unrecognized actuarial gain or loss exceeds 10 per cent of the greater
of the present value of the defined benefit obligation and the fair value of plan assets, that portion is recognised
in the income statement over the expected average remaining working lives of the employees participating in the
plan. Otherwise, the actuarial gain or loss is not recognised. Where the calculation results in a benefit to the Group,
the recognised asset is limited to the net total of any unrecognised actuarial losses and past service costs and
the present value of any future refunds from the plan or reductions in future contributions to the plan.
(III) Long-term service benefits
The Group’s net obligation in respect of long-term service benefits, other than pension plans, is the amount of
future benefit that employees have earned in return for their service in the current and prior periods.
72 | Draka Holding Notes to the consolidated financial statements 2007

The obligation is calculated using the projected unit credit method and is discounted to its present value and the
fair value of any related assets is deducted. The discount rate is the yield at the balance sheet date on high
quality corporate bonds that have maturity dates approximating to the terms of the Group’s obligations.
(IV) Share-based payment transactions
The fair value of options and shares granted that are equity settled, is recognised as an employee benefit expense
with a corresponding increase in equity. The fair value is measured at grant date and spread over the period
during which the employees become unconditionally entitled (the vesting period). The fair value of the options
granted is measured using a binomial option pricing model, taking into account the terms and conditions upon
which the options were granted. The fair value of the shares granted to the Board of Management is measured
using the Monte Carlo approach. At each balance sheet date, the company revises its estimates of the number of
options and shares that are expected to vest. It recognises the impact of the revision of original estimates, if any,
in the income statement, with a corresponding adjustment to equity.
The fair value of the amount payable to employees in respect of stock appreciation rights (SARs), which are
settled in cash, is recognized as an expense, with a corresponding increase in liabilities, over the period that the
employees become unconditionally entitled to payment. The liability is remeasured at each reporting date and at
settlement date. Any changes in the fair value of the liability are recognised as employee benefit expense in the
income statement.
(r) ProvisionsA provision is recognised in the balance sheet if, as a result of a past event, the Group has a present legal or
constructive obligation, and it is probable that an outflow of economic benefits will be required to settle the
obligation, and such outflow can be estimated reliably. If the effect is material, provisions are determined by
discounting the expected future cash flows at a pre-tax rate that reflects current market assessments of the
time value of money and, where appropriate, the risks specific to the liability.
(I) Warranties
A provision for warranties is recognised when the underlying products or services are sold. The provision is
based on historical warranty data and a weighting of all possible outcomes against their associated probabilities.
(II) Restructuring
A provision for restructuring is recognised when the Group has approved a detailed and formal restructuring
plan, and the restructuring has either commenced or has been announced publicly. Future operating costs are
not provided for.
(III) Onerous contracts
A provision for onerous contracts is recognised when the expected benefits to be derived by the Group from a
contract are lower than the unavoidable cost of meeting its obligations under the contract.
(s) Trade and other payablesTrade and other payables, other than derivative financial liabilities, are stated at amortised cost.
(t) RevenueRevenue from the sale of goods is recognised in the income statement when the significant risks and rewards of
ownership have been transferred to the buyer. Revenue from services rendered is recognised in the income
statement in proportion to the stage of completion of the transaction at the balance sheet date. The stage of
completion is assessed by reference to surveys of work performed. No revenue is recognised when there are
significant uncertainties regarding recovery of the consideration due, associated costs and the possible return
of goods cannot be estimated reliably, there is continuing management involvement with the goods, and the
amount of revenue cannot be measured reliably.
(u) Government grantsGovernment grants are recognised in the balance sheet initially as deferred income when there is reasonable
assurance that they will be received and that the Group will comply with the conditions attaching to them.
Grants that compensate the Group for expenses incurred are recognised in the income statement on a
systematic basis in the same periods in which the expenses are incurred. Grants that compensate the Group for
the cost of an asset are recognised in the income statement as cost of sales on a systematic basis over the
useful life of the asset.
Draka Holding | 73Notes to the consolidated financial statements 2007

(v) Expenses(I) Operating lease payment
Payments made under operating leases are recognised in the income statement on a straight-line basis over the
term of the lease. Lease incentives received are recognised in the income statement as an integral part of the
total lease expense.
(II) Finance lease payments
Minimum lease payments are apportioned between the finance charge and the reduction of the outstanding
liability. The finance charge is allocated to each period during the lease term so as to produce a constant periodic
rate of interest on the remaining balance of the liability.
(III) Finance income and expense
Finance income and expense comprise interest expense on borrowings calculated using the effective interest
method, dividends on preference shares classified as liabilities, interest receivable on funds invested, dividend
income, foreign exchange gains and losses, and gains and losses on hedging instruments that are recognised in
the income statement (see accounting policy f). Further, this caption includes fair value adjustments of the
financial liability arising from the put option to acquire a minority interest.
Interest income is recognised in the income statement as it accrues, using the effective interest method.
Dividend income is recognised in the income statement on the date the entity’s right to receive payments is
established which in the case of quoted securities is the ex-dividend date. The interest expense component of
finance lease payments is recognised in the income statement using the effective interest rate method.
Foreign currency gains and losses are reported on a net basis.
(w) Income taxIncome tax on the profit or loss for the year comprises current and deferred tax. Income tax is recognised in the
income statement except to the extent that it relates to items recognised directly in equity, in which case it is
recognised in equity.
Current tax is the expected tax payable on the taxable income for the year, using tax rates enacted or
substantively enacted at the balance sheet date applicable in the several jurisdictions in which the Group
operates, and any adjustment to tax payable in respect of previous years.
Deferred tax is provided using the balance sheet liability method, providing for temporary differences between
the carrying amounts of assets and liabilities for financial reporting purposes and the amounts used for
taxation purposes. Deferred tax is measured at the tax rates that are expected to be applied to the temporary
differences when they reverse, based on the laws that have been enacted or substantively enacted at the
balance sheet date. A change in tax rates is reflected in the period in which the change has been enacted or
substantively enacted.
The following temporary differences are not provided for: the initial recognition of assets or liabilities that affect
neither accounting nor taxable profit, and differences relating to investments in subsidiaries to the extent
that they will probably not reverse in the foreseeable future, and the Company is able to control the timing of
the reversal. In addition, deferred tax is not recognised for taxable temporary differences arising on the initial
recognition of goodwill.
A deferred tax asset, including assets arising from tax loss carry forwards, is recognised only to the extent that
it is probable that future taxable profits will be available against which the asset can be utilised. Deferred tax
assets are reduced to the extent that it is no longer probable that the related tax benefit will be realised. Deferred
tax assets and liabilities are not discounted.
(x) Earnings per shareBasic earnings per share (“EPS”) are calculated by dividing the profit or loss attributable to holders of ordinary
shares of the Group by the weighted average number of ordinary shares outstanding during the period. In order
to calculate diluted EPS, profit or loss attributable to holders of ordinary shares, and the weighted number of
shares outstanding, are adjusted for the effects of all dilutive potential ordinary shares. Potential ordinary
shares are treated as dilutive when, and only when, their conversion to ordinary shares decrease the calculated
earnings per share or increase the calculated loss per share.
74 | Draka Holding Notes to the consolidated financial statements 2007

(y) Consolidated statement of cash flowsThe consolidated statement of cash flows is prepared using the indirect method, in which the movement of cash
and cash equivalents, net of bank overdrafts, is based on net result as presented in the consolidated statement
of income. Foreign currency cash flows are translated at the exchange rate at the date of the cash flow or using
appropriate averages. Changes that have not resulted in cash flows such as translation differences, business
combinations, financial leases, fair value changes, conversions of debt to equity, equity settled share based
payments etc., have been eliminated for the purpose of preparing this statement. Dividends paid to ordinary
shareholders are included in financing activities. Dividends received are classified as investing activities.
Interest paid is included in operating activities. Bank overdrafts that are repayable on demand and form an
integral part of the Group’s cash management are included as a component of cash and cash equivalents for the
purpose of the statement of cash flows.
(z) Segment reportingA segment is a distinguishable component of the Group that is engaged either in providing products or
services (business segment), or in providing products or services within a particular economic environment
(geographical segment), which is subject to risks and rewards that are different from those of other
segments.
Segment information is presented in respect of the Group’s business and geographical segments. The primary
format, business segments, is based on the Group’s management and internal reporting structure.
Inter-segment pricing is determined on an arm’s length basis.
Segment results, assets and liabilities include items directly attributable to a segment as well as those that can
be allocated on a reasonable basis. Unallocated items comprise mainly corporate assets and expenses, such as
loans and borrowings and income tax assets and liabilities.
Segment capital expenditure is the total cost incurred during the period to acquire segment
assets that are expected to be used for more than one period.
(I) Business segments
The Group comprises the following main business segments:
• Draka Cableteq develops, produces and sells low-voltage and special-purpose cable for applications in premises
and for Original Equipment Manufacturer (OEM) applications.
• Draka Comteq develops, produces and sells optical fiber, optical fiber cables and copper cables to the
telecommunications and data communications markets.
(II) Geographical segments
The Cableteq and Comteq segments are managed on a worldwide basis, but operate in seven principal
geographical areas; The Netherlands, United Kingdom, Scandinavia, Germany, Rest of Europe, Americas and Asia.
In presenting information on the basis of geographical segments, segment revenue is based on the geographical
location of customers. Segment assets are based on the geographical location of the assets.
(aa) Non-current assets held for sale and discontinued operationsImmediately before classification as held for sale, the measurement of the assets (and all assets and liabilities in
a disposal group) is brought up-to-date in accordance with applicable IFRSs. Then, on initial classification as held
for sale, non-current assets and disposal groups are recognised at the lower of carrying amount and fair value
less costs to sell.
Impairment losses on initial classification as held for sale are included in the income statement, even when
there is a revaluation. The same applies to gains and losses on subsequent remeasurement.
A discontinued operation is a component of the Group’s business that represents a separate major line of
business or geographical area of operations or is a subsidiary acquired exclusively with a view to resale.
Classification as a discontinued operation occurs upon disposal or when the operation meets the criteria to be
classified as held for sale, if earlier. A disposal group that is to be abandoned may also qualify.
Draka Holding | 75Notes to the consolidated financial statements 2007

3. Acquisitions of subsidiaries and minority interest(I) Acquisition of minority interest
On December 27, 2007 the Group acquired the remaining 49.9% share in Draka Comteq B.V. from Alcatel Lucent
N.V. for € 209 million in cash. The carrying amount of Draka Comteq’s total assets in the consolidated financial
statements on the date of acquisition was € 535.3 million. The Group recognised the increase in the parent
shareholder’s interest and related decrease in minority interest of € 131.9 million directly in equity, as the Group
already controlled Draka Comteq B.V. The premium on the purchase of the minority shares (€ 77.1 million) was
also recognised directly in equity. See also note 23.
(II) Acquisition of subsidiary
In January 2007 the Group established together with Zhongyao Mechanic Electric Co the subsidiary Nantong
Zhongyao Draka Elevator products Co ltd. The group acquired 75% of the shares and has control.
On June 26, 2007 Nantong Zhongyao Draka Elevator products Co Ltd. acquired part of the assets and liabilities
of Zhongyao Mechanic Electric Co. The purchase price consideration amounted to € 2.3 million, which was
agreed to pay in two instalments. In 2008 The Group will pay the second term amounting to € 0.7 million.
The total amount of goodwill recognised in connection with the acquisition amounts to € 1.2 million.
If the entity Nantong Zhongyao had started on 1 January 2007, Group’s revenue would have increased by
approximately € 7 million and net income would not have been materially changed.
4. Financial risk management
4.1 Financial risk factorsThe Group has exposure to the following risks from its use of financial instruments:
• Credit risk
• Liquidity risk
• Market risk
(I) Currency risk
(II) Interest rate risk
(III) Price risk
(IV) Other market risk
This note presents information about the Group’s exposure to each of the above risks, its objectives, policies and
procedures for measuring and managing risk, and its management of capital. Further quantitative disclosures are
included throughout these consolidated financial statements.
The Board of Management has overall responsibility for the establishment and oversight of the Group’s risk
management and control system. Risk management forms an integral part of business management. The Board
has implemented a group wide, risk based internal control system, which was approved by the Supervisory
Board. The management of risks from use of financial instruments that are strongly related to the Group’s
operations is carried out by the operational Group entities within the authority and limits set by the Board of
management. Certain risks are consolidated and mitigated through hedge transactions with external parties by
central functions, such as Group treasury and the Group procurement department.
The Group’s risk management policies are established to identify and monitor the risks faced by the Group.
Furthermore appropriate risk limits and controls are set, risks are monitored and adherence to limits is
monitored in order to minimise potential adverse effects on the Group’s financial performance. Risk
management policies and systems are reviewed and updated regularly to reflect changes in market conditions,
in the Group’s activities and in order to improve the risk management system. The Group, through its training,
management standards and procedures, aims to develop a disciplined and constructive control environment in
which all employees understand their roles and obligations.
The Audit and Governance Committee oversees how management monitors compliance with the Group’s risk
management policies and procedures and reviews the adequacy of the risk management control system in relation
to the risks faced by the Group. The operational audit department that was established early 2007, assists the
Committee in its oversight role. The operational audit department systematically reviews the effectiveness of the
internal control system at the different layers within the Group, the results of which are reported to the Board of
Management, the Audit and Governance Committee and, as the case may be, to the Supervisory Board.
76 | Draka Holding Notes to the consolidated financial statements 2007

(a) Credit riskCredit risk is the risk of financial loss to the Group if a customer or counterparty to a financial instrument fails to
meet its contractual obligations.
Trade receivablesThe Group’s exposure to credit risk mainly arises from its trade receivables. Draka’s trade receivable position
accounted for approximately 23.5 % of the balance sheet total in 2007 (2006: 22.9%), with an average credit
term of approximately 53 days (2006: 58 days). This relatively long credit term is explained by the Group’s
activities in Asia and Southern Europe, where long payment terms are common.
The credit risk in respect of trade receivables is managed and mitigated through alert and active policies. An
important element is the insurance of trade receivables through an A-rated insurance company. Since mid
2006, management of Draka decided to insure its exposure to credit risk (including political risk) on trade
receivables. First in 2006, the credit insurance was implemented at the Draka Comteq division with a further roll
out to the Cableteq division in early 2007. In general, for each customer with forecasted outstanding receivables
in excess of € 5,000 (or the equivalent thereof) a limit is requested from the insurance company. By agreement
with the insurer, certain customers, governmental or such related public customers, representing a zero risk of
default are exempt from the credit insurance policy. As part of its insurance coverage, the insurer provides
Draka with access to a database concerning the credit risk associated with each customer. This enables each
business unit to manage it risk by monitoring customer receivables against the insurance credit limits. Trade
receivables in excess of the amounts covered by the insurance policy are subject to periodic review by the
business unit’s management and financial control. If receivables are past due in excess of 90 days, the
receivable is taken over by the insurance company; 180 days after original due dates or - immediately if default
is established to be irrevocable - Draka receives payment under the insurance policy. The indemnity under the
insurance policy is 90% for default risk and 95% for political risk. The maximum indemnification per annum
under the insurance policy is € 30 million.
Excluded from the insurance policy are those trade receivables that originated in periods before the insurance
policy was implemented. Furthermore the insurance policy does not cover every country yet. The exposure to credit
risk on these receivables is monitored on an ongoing basis, with credit evaluations and approval procedures
performed on all customers requiring credit over a certain amount.
At 31 December 2007 an amount of € 91.9 million (22.3% of the total trade receivables) is considered at risk, of
which € 47.7 million is at debtors of which the credit limit application is still pending or was denied by the credit
insurer and € 44.2 million are debtors in countries were the credit insurance program was not yet implemented
or where the insurer is not licensed.
Non-current financial assetsThe exposure to credit risk on the non-current financial assets is monitored on an on-going basis by reviewing
financial statements, credit reports and other available external information.
Cash and cash equivalentsGiven the high credit ratings of the banks and counterparties in respect of derivative financial instruments, the
management of the Company believes the credit risk to be limited.
GuaranteesAt December 31, 2007, guarantees in the amount of € 6.1 million were outstanding (2006: € 50.9 million)
(b) Liquidity risk Liquidity risk is the risk that the Group will not be able to meet its financial obligations as they fall due. Prudent
liquidity risk management implies maintaining sufficient cash and cash equivalents and having the availability
and flexibility of funding through an adequate amount of (committed) credit facilities. The Group aims to have
its debt mature in a controlled and gradual way, so as to minimize the refinancing risk. Further management
aims to stabilize operating working capital (definition: inventories plus trade receivables minus trade payables)
at 18-20% of revenues in order to control the cash flow. Management uses forecasts of cash flows to manage its
cash and liquidity position.
Furthermore, the Group focuses within its cash management system on the coverage of potential growth and the
compliance with debt covenants, both financial and non-financial.
Draka Holding | 77Notes to the consolidated financial statements 2007

The Group maintains the following lines of credit:
• A committed multicurrency revolving credit facility of € 625 million for general corporate purposes and the
execution of the Group strategy. This facility has replaced the existing € 370 million multicurrency revolving
facility and the € 77.5 million subordinated loan;
• For the purpose of financing working capital the Group has an additional € 63.8 million in short term bank
credit lines available. Furthermore, local subsidiaries of the Group have worldwide € 49 million in bank overdraft
provided by local banks.
For the committed multicurrency revolving credit facility, interest is payable at the relevant interbank interest
rate plus 115 basis points. This margin varies with the ratio senior net debt divided by EBITDA. For undrawn portions
of the facility a commitment fee of 35% of the applicable margin per annum is payable.
The credit facility agreement includes debt covenants that relate to solvency ratio’s and net profit and includes
a change of ownership clause in respect of significant parts of the Group. In 2007 the Group complied with all
covenants.
(c) Market riskMarket risk is the risk that changes in market prices, such as foreign exchange rates, interest rates, commodities
and equity prices will affect the Group’s income or the value of its financial instruments. The object of market risk
management is to manage and control market risk exposures within acceptable parameters, while optimising
the return.
(I) Currency risk
The Group operates internationally and is exposed to currency risk arising from various currency exposures.
Currency risk arises from net investments in foreign operations and from monetary financial instruments and
forecasted sales and purchases that are denominated in a currency other than the respective functional
currencies of the Group entities, primarily the euro (€), Pound Sterling (GBP) and U.S. dollar (USD). The
currencies in which these balances and forecasted transactions are primarily denominated are euro, GBP and USD.
The Group’s investments in subsidiaries having a functional currency other than the euro are in principle not
hedged, unless cash in- and outflows related to these investments are assessed to have an unacceptable effect
on the Group’s liquidity position as a result of payments in respect of borrowings and equity being primarily
denominated in euros.
Management has set up a policy to require Group companies to manage their currency risk against their functional
currency. Group companies are required to hedge their entire currency exposure in respect of cash, trade
receivables and trade payables denominated in a foreign currency. Upon contracting sales orders, the Group also
hedges its estimated foreign currency exposure in respect of forecasted sales and purchases. To manage their
currency risk arising from future commercial transactions and recognised monetary financial instruments, entities
in the group use forward contracts, transacted with Group treasury.
In respect of other monetary assets and liabilities denominated in foreign currencies, the Group ensures that its
net exposure is kept to an acceptable level by buying or selling foreign currencies at spot rates when necessary to
address short-term imbalances.
Group treasury consolidates the Group’s currency risk and enters into forward exchange contracts with external
parties to ensure the Group’s exposure is kept within the limits set by the Board of Management. Group treasury
uses forward exchange contracts to hedge the Group’s foreign currency risk. Most of the forward exchange
contracts have maturities of less than one year after the balance sheet date. When necessary, the forward exchange
contracts are rolled over at maturity.
Certain external forward exchange contracts are entered into as an economic hedge of the Group’s currency
exposure on future firm transactions denominated in foreign currencies. Hedge accounting is not applied for these
instruments. All fair value changes arising on these instruments are recognised in the income statement.
(II) Interest rate risk
It is the Group’s policy to ensure that its long-term commitments are not exposed to changes in interest rates.
Short-term liabilities are in principle on a floating interest basis. To reduce the interest exposure of its long-term
commitments the Group might enter into derivative contracts.
78 | Draka Holding Notes to the consolidated financial statements 2007

(III) Price risk
In its manufacturing process the Group uses raw materials, like copper, preforms for optical fiber, aluminium, pvc
and other polymers. These raw materials account for approximately 70% of total operating costs. In particular, the
Group is exposed to fluctuations in the price of copper. Copper prices have recently been very volatile. A change
in price of these materials may alter the operating margin of the Group and impact working capital requirements.
The risks related to copper price fluctuations might impact operating profit.
To reduce these risks to an acceptable level, taking into account the position at risk and the commercial structures
in place for price setting applicable to the individual business units, the Group enters into derivative contracts
through the London Metal Exchange (‘LME’). At 31 December 2007 the fair value of these derivatives amounts to
a liability of € 5.0 million (2006: € 5.7 million).
The Group does not enter into commodity contracts other than to meet the Group’s expected usage and sale
requirements. Such contracts are settled net.
(IV) Other market risk
Equity price risk arises from securities held for meeting the Group’s defined benefit pension obligations. These
funds are managed through external pension funds. Further reference is made to note 24.
4.2 Capital risk managementThe Group’s objective when managing capital is in the first place to safeguard the Group’s ability to continue as
a going concern in order to provide returns to shareholders and benefits for other stakeholders. In addition the
Group wants to maintain an optimal capital structure to reduce the cost of capital, maintain investor, creditor and
market confidence and sustain future development of the business.
The Group sets the amount of capital in proportion to risk. The Group manages the capital structure and makes
adjustments to it in the light of changes in economic conditions and the risk characteristics of the underlying
assets. Assets with a long-term life are financed via equity and long-term funding; working capital needs via a
mix of medium term and short term funding. In order to maintain or adjust the capital structure, the group may
adjust the amount of dividends paid to shareholders, return capital to shareholders, issue new shares or sell
assets to reduce debt.
For capital risk management the Group focuses on guarantee capital, consisting of shareholders’ equity, the
provision for deferred tax liabilities and the long-term portion of the subordinated loans. At 31 December 2007
the guarantee capital amounts to € 537.5 million (2006: € 619.5 million). Based on the nature of the underlying
assets and similar financial covenants included in the Group’s debt arrangements, the Group’s target is to achieve
a ratio for guarantee capital as a percentage of total invested capital in excess of 25%. In 2007, guarantee
capital as a percentage of total invested capital was 30.7% (2006: 35.5%)
With regard to the Company’s ordinary shares, management aims to distribute a dividend equal to 30% of the
net income (excluding non-recurring items) after preference dividend. A dividend of € 0.68 per share, payable in
cash, is proposed for the financial year 2007, representing a percentage as defined above of 30% (2006: € 0.37
per ordinary share, or 30%).
Another important financial objective in respect of capital risk management for the medium term is to establish
healthy interest coverage, implying EBITDA/interest to exceed a ratio of 4.5. In 2007 interest coverage as defined
was 4.3 (2006: 3.4).
In principle, the Group purchases its own shares on the market to satisfy its obligation under its employee share and
share option plans. The shares are bought at dates approximating the actual exercise date of the share options or
the delivery date of shares under the existing share plans. The Group does not have a defined share buy back plan.
There were no changes in the Group’s approach to capital management during the year.
Draka Holding | 79Notes to the consolidated financial statements 2007

5. Critical accounting estimates and assumptionsThe estimates and assumptions that have a significant risk of causing a material adjustment to the carrying
amounts of assets and liabilities within the next financial year are discussed below.
(a) Estimated impairment of goodwillThe Group tests annually and whenever events or changes in circumstances indicate that the carrying value may
not be recoverable, whether goodwill has suffered any impairment, in accordance with the accounting policy
stated in note m. In determining the recoverable amount of cash generating units, the Group uses standard
valuation techniques, such as the market comparison approach and the income approach. The market
comparison approach is based upon a comparison of the cash-generating unit to similar entities engaged in an
actual merger or acquisition or to public companies whose shares are actively traded. The income approach
involves estimating the present value of the future cash flows of the cash generating unit by using projections of
cash flows that the business is expected to generate, and discounting these cash flows at a given rate of return.
Each of these methodologies requires the use of management estimates and assumptions, such as growth rates
for revenues, expenses, effective tax rates, returns on working capital and capital expenditure, among others.
The Group also estimates a discount rate and a terminal growth rate in the calculations. See for further reference
on the carrying amount of goodwill note 14.
The Group performs the required impairment test at 31 December of each year or when events or circumstances
indicate impairment may be necessary. No impairments for goodwill were recognised in 2007 and 2006.
(b) Property, plant and equipmentProperty, plant and equipment is valued at historical cost, less depreciation or at the recoverable amount
whenever impairment has taken place. Depreciation is calculated using the straight-line method based on the
estimated useful life, taking into account any residual value. The assets’ residual values and useful lives are based
on our best estimates, and adjusted if appropriate, at each balance sheet date. See for further reference on the
carrying amount of property, plant and equipment note 13.
(c) Deferred income tax assetsSeveral of the Group’s subsidiaries have significant carried forward tax losses and deductible temporary
differences between book and tax balances. The majority of the deferred income tax assets relating to carried
forward tax losses were not recognized as at 31 December 2007. These deferred income tax assets were not
recognized based on management’s assessment of the probability criteria as stated in the applicable accounting
standards in light of the multiple years of tax losses incurred in the relevant tax jurisdictions. Future utilization of
the carried forward tax losses and deductible temporary differences will be dependent on the Group’s ability to
successfully generate taxable income in the carry forward period. The remaining term of usage of the carried
forward tax losses are disclosed in note 12. Recognition of such deferred tax assets in the future may result in
material tax benefits in the period in which such determination is made. See for further reference on the carrying
amount of deferred income tax assets note 12.
(d) Income taxesThe group is subject to income taxes in numerous jurisdictions. Significant judgment is required in determining
the worldwide provision for income taxes. There are many transactions and calculations for which the ultimate
tax determination is uncertain during the ordinary course of business. The group recognises liabilities for
anticipated tax audit issues based on estimates of whether additional taxes will be due. Where the final tax
outcome of these matters is different from the amounts that were initially recorded, such differences will impact
the income tax and deferred tax provisions in the period in which such determination is made. See for further
reference on income taxes note 12.
(e) Provision for employee benefitsThe consolidated balance sheet includes liabilities with respect to defined benefit pension plans and other long-
term benefits. The pension and post-retirement benefit costs and credits are based on actuarial calculations
carried out by an independent consultant. Inherent in these calculations are assumptions, including discount
rates, rate of salary increase and expected return on plan assets. Changes in pension and post-retirement costs may
occur in the future as a consequence of changes in interest rates, expected return on assets or other assumptions.
The discount rate is based on the return of high-quality fixed-income corporate bonds, using an index based on
stated bonds. This index is marked up taking into account that corporate bonds bear an additional risk and the
fact that pension liabilities have a longer duration than the state bonds. Based on the available information we
80 | Draka Holding Notes to the consolidated financial statements 2007

set the discount rate as per 31 December 2007 at 5.6%. A change of 50 basis points to the discount rate applied
would not increase or decrease the employee benefit expense significantly.
For a detailed discussion of the other underlying assumptions, expected future funding obligations and expected
future payments, see note 24 to the consolidated financial statements. It is expected that the future payments
will have no material impact on future cash flows and that there is no material uncertainty in the funding of the
obligation itself.
(f) Other provisionsThe Group recognised provisions regarding restructuring, warrantees and onerous contracts. Significant
judgement is required in the determination of these provisions such as outcome of legislation and the
assumptions underlying the determination. See for further reference on the carrying amount of other provisions
note 25.
(g) Financial instrumentsThe determination of the fair value of certain financial instruments requires significant judgement of
management regarding underlying assumptions and estimates like discount rates, credit risks and yield curves.
Further reference is made to notes 22 and 23.
Draka Holding | 81Notes to the consolidated financial statements 2007

6. Segment reportingBusiness segments
In millions of euro Not allocated to Draka Cableteq Draka Comteq segments /eliminations Consolidated 2007 2006 2007 2006 2007 2006 2007 2006
Revenue from external customers 2,180.0 1,936.2 636.2 593.2 - - 2,816.2 2,529.4
Intersegment transactions 86.4 76.3 67.9 63.3 (154.3) (139.6) - -
Revenue 2,266.4 2,012.5 704.1 656.5 (154.3) (139.6) 2,816.2 2,529.4
Operating result (excluding non- recurring items) 147.3 99.6 13.1 5.5 (14.7) (14.5) 145.7 90.6
Non-recurring items - (6.1) - (26.8) - - - (32.9)
Operating result 147.3 93.5 13.1 (21.3) (14.7) (14.5) 145.7 57.7
Net finance expense (45.6) (33.9)
Share of profit of equity accounted investees 8.2 5.8 7.3 2.4 - - 15.5 8.2
Income tax expense (21.6) (8.6)
Result for the year 94.0 23.4
Capital expenditure 47.0 26.5 23.9 20.2 0.6 0.8 71.5 47.5
Depreciation and amortisation 36.5 37.4 15.6 17.1 0.4 0.2 52.5 54.7
Impairments - - - 6.3 - - - 6.3
Segment operating liabilities 497.0 594.1 404.9 258.7 (249.6) (134.9) 652.3 717.9
Segment assets 1,436.7 1,492.6 462.1 463.1 (233.3) (305.6) 1,665.5 1,650.1
Investments in equity accounted investees 29.3 24.1 57.7 70.8 - - 87.0 94.9
Total assets 1,466.0 1,516.7 519.8 533.9 (233.3) (305.6) 1,752.5 1,745.0
Geographical segments
In millions of euro The Netherlands United Kingdom Scandinavia Germany 2007 2006 2007 2006 2007 2006 2007 2006
Revenue from external customers 244.5 208.8 205.5 194.4 481.3 429.7 234.1 259.0
Total assets 447.7 361.5 74.3 127.7 224.1 245.4 185.1 223.1
Capital expenditure 10.0 7.1 0.8 1.3 8.4 6.7 4.5 3.4
In millions of euro Rest of Europe North America Asia Other regions 2007 2006 2007 2006 2007 2006 2007 2006
Revenue from external customers 772.3 704.1 308.7 296.6 331.4 256.8 238.4 180.0
Total assets 429.6 414.6 150.9 164.8 169.3 155.1 71.5 52.8
Capital expenditure 24.5 16.6 9.8 7.3 9.8 4.7 3.7 0.4
In millions of euro Consolidated 2007 2006
Revenue from external customers 2,816.2 2,529.4
Total assets 1,752.5 1,745.0
Capital expenditure 71.5 47.5
82 | Draka Holding Notes to the consolidated financial statements 2007

7. Other income and expenses
In millions of euro Note 2007 2006
Increase in provision “Stop, Swap & Share” project - (22.6)
Increase in other provisions (2.2) (6.3)
Increase in provisions 25) (2.2) (28.9)
Release of unused provisions and other 8.1 8.9
“Stop, Swap & Share” project expensed as incurred - (4.0)
5.9 (24.0)
8. Employee benefit expense
In millions of euro Note 2007 2006
Wages and salaries 315.6 295.9
Social security charges 65.1 64.4
Contributions to defined contribution plans 24) 9.9 13.1
Expenses related to defined benefit plans 24) 5.2 7.5
Share-based payments 10) 1.5 0.9
- 397.3 381.8
During 2007, the average number of employees was 9,346 (2006: 8,762). The number of employees at
31 December 2007 was 9,547 (31 December 2006: 9,145), of which 1,064 were employed by Dutch group
companies (1,096 in 2006).
9. Remuneration of the Board of Management and Supervisory BoardThe remuneration of the current and former members of the Board of Management in 2007 amounted to
€ 4.1 million (2006: € 5.2 million) and the remuneration of the Supervisory Board in 2007 amounted to
€ 0.5 million (2006: € 0.2 million). See note 41 for additional details on remuneration.
10. Share-based paymentsIn June 2002 Draka Holding N.V. introduced a long-term incentive plan. This plan is divided into an option plan
and a share plan. In May 2007 the option plan was amended. Certain employees will no longer receive stock
option grants, but stock appreciation rights (SARs) instead that entitles these employees to a cash payment.
The amount of the cash payment is determined based on the increase in the share price between grant date and
vesting date. In May 2006 Draka Holding N.V. introduced a share plan for the Board of Management. This plan
was refined in May 2007 by disentangling the short-term and long-term incentive plan. Prior to 2006, members
of the Board of Management participated in the general incentive plan.
Share optionsUnder the option plan, the Company has granted share options on its ordinary shares to qualifying members of
senior management. The options are granted for eight years (contractual life of the options), with a three-year
vesting period during which they cannot be exercised. The Board of Management must approve any exceptions
to this policy.
Share option arrangements granted before 7 November 2002 exist. The recognition and measurement
principles in IFRS 2 have not been applied to these grants in accordance with the transitional conditions
provided by IFRS 1 and IFRS 2.
Draka Holding | 83Notes to the consolidated financial statements 2007

The following table summarizes option activity for the year ended December 31, 2007:
Weighted average Weighted remaining Number of average contractual options exercise price life in years Range of exercise prices
Outstanding at January 1, 2007 362,769 € 11.65 7.1 € 7.42 € 13.51
Outstanding at January 1, 2007 23,450 € 24.26 4.0 € 24.26 € 24.26
Forfeited during the period (6,896) € 13.51 7.0 € 7.42 € 13.51
Forfeited during the period (585) € 24.26 3.0 € 24.26 € 24.26
Exercised during the period (72,146) € 10.86 5.4 € 7.42 € 13.51
Exercised during the period (10,053) € 24.26 3.0 € 24.26 € 24.26
Granted during the period 126,222 € 28.02 7.5 € 28.02 € 28.02
Outstanding at December 31, 2007 283,727 € 11.80 5.8 € 7.42 € 13.51
Outstanding at December 31, 2007 139,034 € 27.67 7.0 € 24.26 € 28.02
Total outstanding at December 31, 2007 422,761 € 17.02 6.8 € 7.42 € 28.02
Exercisable options at December 31, 2007 52,550 € 13.65 3.8 € 7.42 € 24.26
The following table summarizes option activity for the year ended December 31, 2006:
Weighted average Weighted remaining Number of average contractual options exercise price life in years Range of exercise prices
Outstanding at January 1, 2006 250,912 € 9.80 7.2 € 7.42 € 11.63
Outstanding at January 1, 2006 30,870 € 24.26 5.0 € 24.26 € 24.26
Forfeited during the period (1,336) € 11.25 7.3 € 7.42 € 11.63
Forfeited during the period (7,420) € 24.26 4.0 € 24.26 € 24.26
Exercised during the period (50,201) € 8.57 5.4 € 7.42 € 11.63
Granted during the period 163,394 € 13.51 8.0 € 13.51 € 13.51
Outstanding at December 31, 2006 362,769 € 11.65 7.1 € 7.42 € 13.51
Outstanding at December 31, 2006 23,450 € 24.26 4.0 € 24.26 € 24.26
Total outstanding at December 31, 2006 386,219 € 12.41 6.9 € 7.42 € 24.26
Exercisable options at December 31, 2006 64,174 € 14.35 5.0 € 7.42 € 24.26
The weighted average share price at the date of exercise, for share options exercised in 2007 was € 33.40
(2006: € 15.95).
The fair value of the services received in return for share options granted are measured by reference to the fair value
of share options granted. The estimate of the fair value of the services received is measured based on a binomial
option pricing model. Expectations of early exercise are incorporated into the binomial option pricing model. The
assumptions used for determination of the fair value of options granted in 2007 and 2006 were as follows:
Fair value of share options and assumptions at measurement date 2007 2006
Fair value at measurement date € 12.31 € 6.24
Share price € 28.02 € 13.51
Exercise price € 28.02 € 13.51
Assumptions used:
Expected volatility (expressed as weighted average volatility used
in the modelling under binomial option pricing model) 42.5% 43.3%
Option term 8 years 8 years
Expected dividends 1.3% 0.2%
Risk-free interest rate (based on national government bonds) 4.6% 4.1%
The expected volatility is based on the historic volatility (calculation based on the weighted average remaining life
of the share options), adjusted for any expected changes to future volatility due to public available information.
84 | Draka Holding Notes to the consolidated financial statements 2007

Share options are granted under a service condition with no market or other performance conditions associated
with the share option grants.
Share plans
Matching sharesUnder the share plan, Draka Holding N.V. has granted qualifying members of its senior management the right to
use part of their regular bonus to acquire ordinary Draka Holding N.V. shares. The shares cannot be transferred for
an initial period of three years. If the employee remains employed during this three year period (the vesting period),
the Company will double the number of shares. The fair value of the 2007 grant of matching shares amounts to
€ 26.94 (2006: € 13.51), which is equal to the share price at the date of the bonus conversion discounted for
forfeited dividend. At the end of 2007 the number of matching shares outstanding to senior management was
22,594 (2006: 16,595). Matching shares arrangements granted before 7 November 2002 exist. The recognition
and measurement principles in IFRS 2 have not been applied to these grants in accordance with the transitional
conditions provided by IFRS 1 and IFRS 2.
Share plans Board of ManagementUnder the share plan, as approved by the General Meeting of Shareholders in 2006, Draka Holding N.V. has granted
members of the Board of Management the right to use part of their regular bonus to acquire ordinary Draka
Holding N.V. shares. The shares cannot be transferred for an initial period of three years. After three years the
Company will multiply the number of shares, based on Draka’s Total Shareholder Return (“TSR”) compared to a
peer group. At the end of 2007 the number of shares outstanding was 16,186 (2006: 10,983).
The estimate of the fair value of the shares received is measured based on the Monte Carlo approach. The fair
value of the 5,203 shares granted in 2007 amounted to € 44.22 (grant 2006: € 16.27).
The long term incentive plan was disentangled from the short term incentive plan after approval by the General Meeting
of Shareholders in May 2007 and consists of an annual conditional grant of performance shares which equals 55% of
base salary. After a three year period, these performance shares might vest based on Draka’s TSR performance
measured against a peer group. In 2007 27,997 performance shares were conditionally granted to members of the
Board of Management. The fair value of the shares at measurement date amounted to € 28.35. Further, the
Supervisory Board used its authority in 2007, which was subject to approval by the General Meeting of Shareholders,
to grant additional performance shares in extraordinary circumstances. The number of additional performance
shares conditionally granted and delivered to members of the Board of Management amounted to 27,997. The fair
value of the shares at measurement date amounted to € 28.35. At the end of 2007 the total number of shares
(conditionally issued or issuable) under the share plans with the Board of Management was 72,180 (2006: 10,983).
See note 41 for additional details on options and shares of the Board of Management.
The following table summarizes matching shares activity for senior management and Board of Management:
Number of shares Number of shares Number of shares Number of shares senior Board of senior Board of management Management management Management 2007 2007 2006 2006
Outstanding at January 1 16,595 10,983 13,892 -
Forfeited during the period (101) - (1,021) -
Exercised during the period (2,110) - (4,726) -
Granted during the period 8,210 61,197 8,450 10,983
Total outstanding at December 31 22,594 72,180 16,595 10,983
Stock Appreciation Rights (SARs)Under this plan, the Company has granted SARs on its ordinary shares to qualifying Dutch members of senior
management. The SARs are granted for eight years (contractual life of the SARS), with a three-year vesting period
during which they cannot be exercised. The Board of Management must approve any exceptions to this policy.
SARs are granted under a service condition with no market or performance conditions associated. In 2007
25,619 SARs were granted to senior management. The fair value of SARs at grant date is determined using the
binomial option pricing model with the same assumptions used as for the determination of the fair value of the
options granted. (see page 84 for further details). The fair value of the liability is remeasured at each reporting
date and at settlement date.
Draka Holding | 85Notes to the consolidated financial statements 2007

Total amounts recognised in the income statement in respect of all share-based payments amounted to
€ 1.5 million (2006: € 0.9 million).
11. Net finance expenseRecognised in statement of income
In millions of euro 2007 2006
Interest income (2.5) (1.1)
Change in fair value of the other interest-bearing liability (8.1) (23.3)
Net foreign exchange gain (1.8) -
Net gain on remeasurement of derivatives through the income statement (0.5) (0.1)
Finance income (12.9) (24.5)
Interest expense 40.0 31.0
Dividend cumulative preference shares - 7.7
Interest expense on the other interest-bearing liability 12.2 14.0
Fee expenses 6.3 5.5
Net foreign exchange loss - 0.2
Finance expense 58.5 58.4
Net finance expense 45.6 33.9
In the fee expenses of 2007 a one-off charge of € 3.8 million is included (2006: € 1.4 million) as a result of the
refinancing of the Group’s balance sheet.
For further details on finance income and expenses related to the other interest-bearing liability, reference is
made to note 23.
12. TaxesTotal income tax expense recognised in the income statement amounted to € 21.6 million in 2007 (2006: € 8.6
million). The components of income taxes are as follows:
Recognised in the income statement
In millions of euro 2007 2006
Current income tax (expense)/benefit
Current year (24.8) (12.0)
Prior periods 13.8 -
Total current income tax (expense)/benefit (11.0) (12.0)
Deferred income tax (expense)/benefit
Origination and reversal of temporary differences 8.5 (9.2)
Change in tax rate (4.7) 1.0
Benefits of tax losses carry forward previously unrecognised 0.3 12.8
Usage of tax losses carry forward (13.8) -
Prior periods (0.9) (1.2)
Total deferred income tax (expense)/benefit (10.6) 3.4
Total income tax (expense)/benefit (21.6) (8.6)
In January 2008 the Group finalised discussions with the Dutch tax authorities regarding the fiscal return of
2003. The Group recognized a tax income amounting to € 7.7 million in 2007 which anticipated the outcome of
the discussions.
86 | Draka Holding Notes to the consolidated financial statements 2007

Reconciliation of effective tax rate
In millions of euro 2007 2007 in % 2006 2006 in %
Result for the year 94.0 23.4
Total income tax expense / (benefit) 21.6 8.6
Result before tax 115.6 100% 32.0 100%
Income tax calculated at tax rates applicable
in the respective tax jurisdictions 30.5 26% 10.4 33%
Effect of change in tax rates 4.7 4% (1.0) -3%
Non-tax deductible expenses 3.5 3% 5.3 17%
Tax exempt income (9.5) -8% (5.7) -18%
Loss carry forwards not recognised 2.4 2% 20.0 63%
Effect of tax losses recognised (0.3) 0% (12.8) -40%
Prior periods (8.4) -7% (5.3) -17%
Other (1.3) -1% (2.3) -7%
21.6 19% 8.6 27%
The weighted average applicable tax rate was 26 % (2006: 33%). The decrease is caused by a change in the
profitability of the Group’s subsidiaries in the respective tax jurisdictions. Furthermore the decrease is affected
by the reduction of the enacted tax rate in the Netherlands from 29.6% to 25.5% as of January 1, 2007.
Recognised directly in equityThe deferred income tax expense recognised directly in shareholders’ equity during the year amounted to
€ 0.2 million (2006: benefit of € 6.2 million).
Deferred income taxDeferred income tax assets and liabilities are offset when there is a legally enforceable right to offset current
tax assets against current tax liabilities and when the deferred income taxes relate to the same fiscal authority.
Deferred tax assets and liabilities relate to the following balance sheet captions, of which the movements in
temporary differences during the year are as follows (without taking into consideration the offsetting of
balances):
In millions of euro Recognised Effects of Recognised in share- movements Balance in income holders’ in foreign Balance 1 Jan 06 statement equity exchange 31 Dec 06
Property, plant and equipment (34.7) (12.6) - (0.2) (47.5)
Intangible assets 14.8 1.4 - (0.1) 16.1
Financial fixed assets (0.2) 0.2 - - -
Receivables (7.6) 1.1 4.7 (0.1) (1.9)
Inventories (2.9) (2.4) - (0.2) (5.5)
Interest-bearing loans and borrowings 7.9 6.8 - - 14.7
Employee benefits 6.3 2.1 - (0.1) 8.3
Provisions 14.5 (9.9) - - 4.6
Other current liabilities 0.3 (0.7) 1.5 - 1.1
Tax value of loss carry-forwards recognised 20.0 17.4 - (0.7) 36.7
18.4 3.4 6.2 (1.4) 26.6
Deferred tax assets 52.5 52.7
Deferred tax liabilities 34.1 26.1
Net deferred tax position 18.4 26.6
Draka Holding | 87Notes to the consolidated financial statements 2007

In millions of euro Recognised Effects of Recognised in share- movements Balance in income holders’ in foreign Balance 1 Jan 07 statement equity exchange 31 Dec 07
Property, plant and equipment (47.5) 7.7 - 0.4 (39.4)
Intangible assets 16.1 (4.0) - (0.2) 11.9
Financial fixed assets - (0.5) - - (0.5)
Receivables (1.9) 1.8 - - (0.1)
Inventories (5.5) 1.8 - (0.1) (3.8)
Interest-bearing loans and borrowings 14.7 4.0 - - 18.7
Employee benefits 8.3 (0.8) - (0.2) 7.3
Provisions 4.6 (6.5) - - (1.9)
Other current liabilities 1.1 0.5 (0.2) (0.1) 1.3
Tax value of loss carry-forwards recognised 36.7 (14.6) - (0.4) 21.7
26.6 (10.6) (0.2) (0.6) 15.2
Deferred tax assets 52.7 46.3
Deferred tax liabilities 26.1 31.1
Net deferred tax position 26.6 15.2
Deferred income tax assets are recognized for temporary tax deductible differences and tax loss carry-forwards
to the extent that the Group has sufficient temporary taxable differences relating to the same tax authority and
the same taxable entity, which will result in taxable amounts against which the temporary tax deductible
differences and unused tax losses can be utilized before they expire or that the realization of the related tax
benefit through future taxable profits is probable. Management considers tax strategies in making this
assessment.
In 2006 deferred tax assets in respect of tax loss carry forwards were recognised in several countries in excess
of available temporary taxable differences. This recognition is substantiated by the improving economic
conditions in the relevant tax jurisdictions that support the convincing evidence required by applicable
accounting standards. For this purpose management uses a limited number of years of future forecasts.
Unrecognised deferred tax assetsDeferred tax assets have not been recognised in respect of the following items:
In millions of euro 2007 2006
Deductible temporary differences 10.0 -
Tax losses 181.2 243.0
191.2 243.0
Deferred tax assets have not been recognised in respect of these items because it is not probable that in the
foreseeable future taxable profit will be available against which the Group can utilise the benefits thereof.
The expiration of total tax losses is presented in the table below:
In millions of euro 2007 2006
Within 1 year 9.8 3.6
Within 2 - 5 years 84.3 28.1
After 5 years and thereafter 71.7 271.8
Indefinite 489.6 471.8
655.4 775.3
The amounts included in the tables above are partly based on internal calculations in the absence of final tax
assessments (see note 5(d)).
88 | Draka Holding Notes to the consolidated financial statements 2007

13. Property, plant and equipment
In millions of euro Land and Plant and Fixtures Under buildings equipment and fittings construction Total
Balance as at 1 January 2006
Cost 441.4 999.2 93.5 23.6 1,557.7
Accumulated depreciation and impairments (214.5) (728.4) (78.2) (0.8) (1,021.9)
Carrying amount 226.9 270.8 15.3 22.8 535.8
Acquisitions 5.8 9.1 0.7 1.4 17.0
Capital expenditure 1.2 21.9 6.4 16.1 45.6
Depreciation charge for the year (9.4) (36.6) (3.4) (0.2) (49.6)
Impairment losses (0.3) (6.0) - - (6.3)
Reclassification 12.0 (3.0) 15.0 (22.5) 1.5
Disposals (9.1) (0.6) - (0.6) (10.3)
Effect of movements in foreign exchange 0.2 (1.2) (0.1) (0.9) (2.0)
Total changes 0.4 (16.4) 18.6 (6.7) (4.1)
Balance as at 31 December 2006
Cost 449.3 963.7 102.1 17.3 1,532.4
Accumulated depreciation and impairments (222.0) (709.3) (68.2) (1.2) (1,000.7)
Carrying amount 227.3 254.4 33.9 16.1 531.7
Capital expenditure 4.6 24.3 5.9 29.4 64.2
Depreciation charge for the year (9.4) (34.6) (4.2) - (48.2)
Impairment losses - - - - -
Reclassification 3.9 15.3 (1.4) (18.7) (0.9)
Disposals (0.4) (0.6) (0.7) (0.2) (1.9)
Effect of movements in foreign exchange (2.0) (2.5) (1.7) (0.7) (6.9)
Total changes (3.3) 1.9 (2.1) 9.8 6.3
Balance as at 31 December 2007
Cost 458.8 961.9 96.2 27.2 1,544.1
Accumulated depreciation and impairments (234.8) (705.6) (64.4) (1.3) (1,006.1)
Carrying amount 224.0 256.3 31.8 25.9 538.0
In 2006 and 2007 the Group has reclassified assets to/from property, plant and equipment to/from intangible assets.
Depreciation and Impairment lossesThe depreciation and impairment charge for an amount of € 48.2 million (2006: € 55.9 million) is recognised in
the income statement as cost of sales.
In 2006 under Draka Comteq’s Stop, Swap & Share project particular property, plant and equipment became
idle and therefore assets for an amount of € 6.3 million have been impaired.
The Group has not reversed any impairment loss in 2007 and 2006.
Leased property, plant and equipmentThe Group leases land, buildings, plant and equipment under a number of finance lease-agreements. At 31
December 2007, the net carrying amount of leased property, plant and equipment was € 29.1 million (2006:
€ 28.0 million). The leased land, buildings, plant and equipment secures lease obligations (see note 22).
SecurityAt 31 December 2007, mortgages have been granted as security for debts to credit institutions of € 13.0 million
(2006: € 3.1 million) (see note 22).
Property, plant and equipment under constructionThe balance mainly represents equipment under construction for own use.
Draka Holding | 89Notes to the consolidated financial statements 2007

14. Intangible assets
In millions of euro Patents Development Goodwill and licences costs Software Other Total
Balance as at 1 January 2006
Cost 71.1 21.9 0.9 35.3 4.7 133.9
Accumulated amortisation and impairments - (3.9) (0.6) (27.3) (0.9) (32.7)
Carrying amount 71.1 18.0 0.3 8.0 3.8 101.2
Acquisitions 3.0 - - - - 3.0
Additions - 0.8 - 1.1 - 1.9
Amortisation charge for the year - (1.2) (0.3) (3.1) (0.5) (5.1)
Reclassification (2.0) - - 0.1 0.4 (1.5)
Effect of movements in foreign exchange (1.3) (0.8) - (0.6) (0.3) (3.0)
Total changes (0.3) (1.2) (0.3) (2.5) (0.4) (4.7)
Balance as at 31 December 2006
Cost 70.8 22.0 0.9 37.1 4.6 135.4
Accumulated amortisation and impairments - (5.2) (0.9) (31.6) (1.2) (38.9)
Carrying amount 70.8 16.8 - 5.5 3.4 96.5
Acquisitions 1.2 - - - - 1.2
Additions 1.1 1.7 0.4 5.0 0.2 8.4
Amortisation charge for the year - (1.1) (0.1) (2.9) (0.2) (4.3)
Reclassification (0.9) 1.7 0.2 0.9 (1.9) -
Disposals - - - (0.1) (0.1) (0.2)
Effect of movements in foreign exchange (0.3) (0.1) (0.1) (0.1) - (0.6)
Total changes 1.1 2.2 0.4 2.8 (2.0) 4.5
Balance as at 31 December 2007
Cost 71.9 25.1 1.6 39.2 2.0 139.8
Accumulated amortisation and impairments - (6.1) (1.2) (30.9) (0.6) (38.8)
Carrying amount 71.9 19.0 0.4 8.3 1.4 101.0
In 2006 and 2007 the Group has reclassified assets to/from property, plant and equipment to/from intangible assets.
Furthermore an amount of € 0.9 million is reclassified from goodwill to investments in equity accounted investees.
GoodwillAcquisitions include goodwill arising from acquisitions in subsidiaries (as stated in note 3). The acquisition of
€ 1.2 million relates to Nantong Zhongyao Draka Elevator Products, Co Ltd.
In 2006 the Group acquired 100% of the shares of Draka Kabeltechnik GmbH (previously named Cornelia Thies
Kabeltechnik). As part of the purchase price consideration, the Group agreed an earn-out arrangement with the
prior shareholder. The value of the corresponding liability depends on the performance of the Draka Kabeltechnik
in the five years after acquisition. In 2007 the Group upwardly adjusted the estimate of the Company’s future
performance. The corresponding increase in the liability of € 0.8 million is recognised in goodwill. In addition the
Group recognised an amount of € 0.3 million of goodwill in 2007 relating to an adjustment to the determination
of the provisional goodwill amount of Cornelia Thies Kabeltechnik GmbH in 2006.
Amortisation and impairment chargeThe amortisation and impairment charge for an amount of € 4.3 million (2006: € 5.1 million) is recognised in the
income statement as cost of sales.
Impairment loss and subsequent reversalThe Group has not incurred nor reversed any impairment losses in 2007 and 2006.
Impairment tests for cash-generating units containing goodwillThe following significant carrying amount of goodwill relates to:
90 | Draka Holding Notes to the consolidated financial statements 2007
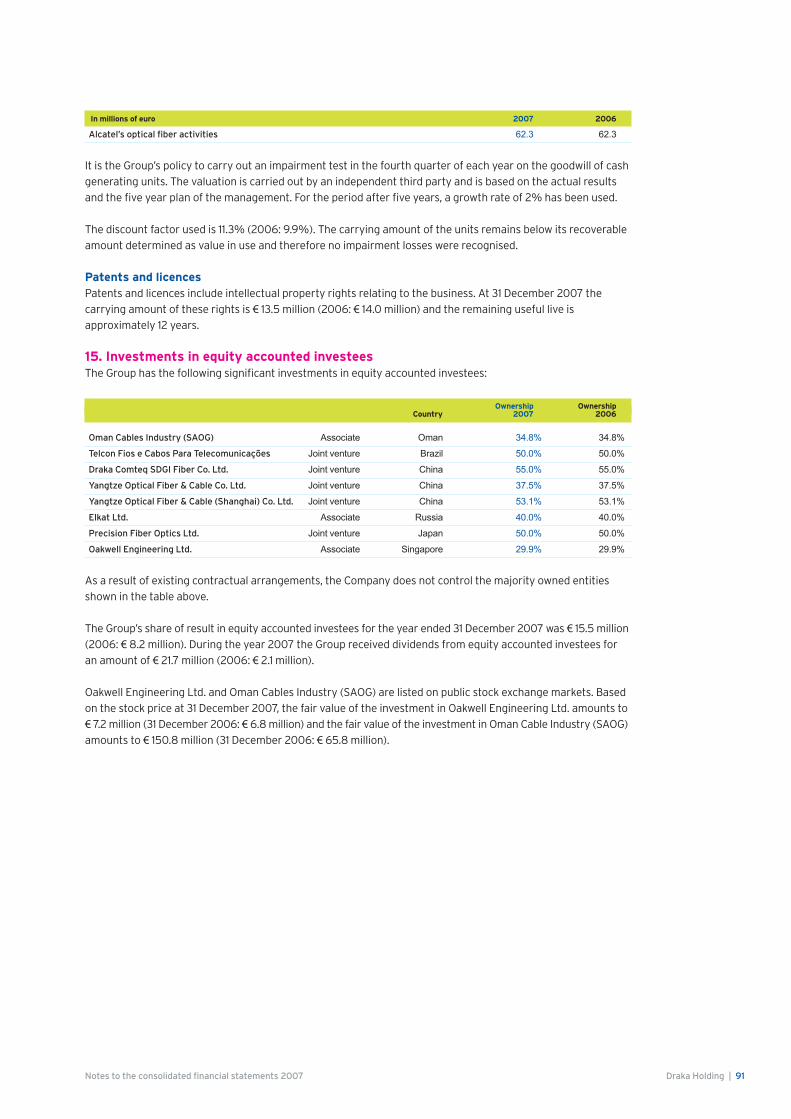
In millions of euro 2007 2006
Alcatel’s optical fiber activities 62.3 62.3
It is the Group’s policy to carry out an impairment test in the fourth quarter of each year on the goodwill of cash
generating units. The valuation is carried out by an independent third party and is based on the actual results
and the five year plan of the management. For the period after five years, a growth rate of 2% has been used.
The discount factor used is 11.3% (2006: 9.9%). The carrying amount of the units remains below its recoverable
amount determined as value in use and therefore no impairment losses were recognised.
Patents and licencesPatents and licences include intellectual property rights relating to the business. At 31 December 2007 the
carrying amount of these rights is € 13.5 million (2006: € 14.0 million) and the remaining useful live is
approximately 12 years.
15. Investments in equity accounted investeesThe Group has the following significant investments in equity accounted investees:
Ownership Ownership Country 2007 2006
Oman Cables Industry (SAOG) Associate Oman 34.8% 34.8%
Telcon Fios e Cabos Para Telecomunicações Joint venture Brazil 50.0% 50.0%
Draka Comteq SDGI Fiber Co. Ltd. Joint venture China 55.0% 55.0%
Yangtze Optical Fiber & Cable Co. Ltd. Joint venture China 37.5% 37.5%
Yangtze Optical Fiber & Cable (Shanghai) Co. Ltd. Joint venture China 53.1% 53.1%
Elkat Ltd. Associate Russia 40.0% 40.0%
Precision Fiber Optics Ltd. Joint venture Japan 50.0% 50.0%
Oakwell Engineering Ltd. Associate Singapore 29.9% 29.9%
As a result of existing contractual arrangements, the Company does not control the majority owned entities
shown in the table above.
The Group’s share of result in equity accounted investees for the year ended 31 December 2007 was € 15.5 million
(2006: € 8.2 million). During the year 2007 the Group received dividends from equity accounted investees for
an amount of € 21.7 million (2006: € 2.1 million).
Oakwell Engineering Ltd. and Oman Cables Industry (SAOG) are listed on public stock exchange markets. Based
on the stock price at 31 December 2007, the fair value of the investment in Oakwell Engineering Ltd. amounts to
€ 7.2 million (31 December 2006: € 6.8 million) and the fair value of the investment in Oman Cable Industry (SAOG)
amounts to € 150.8 million (31 December 2006: € 65.8 million).
Draka Holding | 91Notes to the consolidated financial statements 2007

Summary financial information of material equity accounted investees at 100 per cent based on December 2007 available information:
In millions of euro Non- Non- Result Current current Total Current current Total for assets assets assets liabilities liabilities liabilities Revenue Expenses the year
2007
Oman Cables Industry (SAOG) 162.4 38.0 200.4 142.1 9.0 151.1 413.5 390.4 23.1
Telcon Fios e Cabos Para Telecomunicações 29.6 10.4 40.0 18.1 2.9 21.0 73.4 68.5 4.9
Draka Comteq SDGI Fiber Co. Ltd. 9.2 4.5 13.7 2.0 - 2.0 10.3 10.1 0.2
Yangtze Optical Fiber & Cable Co. Ltd. 108.6 99.1 207.7 84.3 18.9 103.2 208.6 192.7 15.9
Yangtze Optical Fiber & Cable (Shanghai) Co. Ltd. 11.8 11.4 23.2 13.4 - 13.4 23.6 22.9 0.7
Elkat Ltd. 25.8 7.1 32.9 5.8 - 5.8 359.5 356.0 3.5
2006
Oman Cables Industry (SAOG) 136.4 34.1 170.5 123.9 14.3 138.2 248.4 236.0 12.4
Telcon Fios e Cabos Para Telecomunicações 24.5 8.5 33.0 15.6 2.1 17.7 56.4 52.7 3.7
Draka Comteq SDGI Fiber Co. Ltd. 8.9 5.8 14.7 2.5 - 2.5 14.8 14.3 0.5
Yangtze Optical Fiber & Cable Co. Ltd. 110.6 115.8 226.4 53.1 29.4 82.5 207.9 200.3 7.6
Yangtze Optical Fiber & Cable (Shanghai) Co. Ltd. 9.7 8.8 18.5 9.0 - 9.0 22.2 21.9 0.3
Elkat Ltd. 25.9 7.8 33.7 9.2 0.1 9.3 390.0 386.4 3.6
Oakwell Engineering Limited 39.6 9.2 48.8 26.4 1.7 28.1 69.3 68.1 1.2
For 2007 with respect to Oakwell Engineering Limited no financial information was available.
16. Other non-current financial assets
In millions of euro 2007 2006
Receivables 15.5 22.7
Promissory note 8.2 8.0
Other investments 1.2 1.5
24.9 32.2
The fair value of the other non-current financial assets, cannot be determined reliably because there are no
observable market prices for these assets. Therefore, a valuation technique has been used. The fair value does
not differ significantly from the carrying amounts.
17. Inventories
In millions of euro 2007 2006
Raw materials and consumables 117.4 105.3
Work in progress 27.8 30.7
Semi finished goods 52.5 59.3
Finished goods 243.3 238.4
441.0 433.7
In 2007 raw materials and consumables and changes in work in progress, semi finished goods and finished goods
recognised as cost of sales amounted to € 1,869.8 million (2006: € 1,664.5 million). In 2007 the write-down of inventories
to net realisable value amounted to € 15.2 million (2006: € 8.6 million). The write-down is included in cost of sales.
At 31 December 2007, inventories have been pledged for an amount of € 2.4 million (2006: € 1.7 million).
92 | Draka Holding Notes to the consolidated financial statements 2007

18. Trade and other receivables
In millions of euro Note 2007 2006
Trade receivables 409.1 397.2
Trade receivables due from associates 2.5 2.5
Other current receivables and prepayments 56.1 57.4
Fair value derivatives 28) 2.4 1.7
470.1 458.8
At 31 December 2007, other current receivables include retentions of € 0.7 million (2006: € 1.7 million) relating
to construction contracts in progress.
Trade receivables are shown net of impairment losses. The Group established an allowance for impairment that
represents its estimate of incurred losses in respect of trade and other receivables and investments. The impairment
loss amounted to € 8.9 million at 31 December 2007, representing 2.2% of trade receivables (2006: € 11.1 million or
2.8%). In 2007, expenses relating to the impairment of trade receivables of € 1.5 million were recognized in the
consolidated statement of income, representing 0.05% of revenue (2006: € 2.1 million, or 0.08% of revenue).
The Group’s exposure to credit and currency risks and impairment losses related to trade and other receivables
are disclosed in notes 4 and 27.
19. Cash and cash equivalents In millions of euro 2007 2006
Cash and cash equivalents 39.4 42.1
Bank overdrafts (34.9) (32.0)
Cash and cash equivalents in the statement of cash flows 4.5 10.1
Cash and cash equivalents are freely available.
20. Total equityTotal equity consists of shareholders’ equity attributable to the equity holders of the Company of € 414.8 million
(2006: € 426.9 million) and minority interests of € 12.8 million (2006: € 12.2 million). See note 37 for additional
details on shareholders’ equity.
21. Earnings per shareBasic earnings per shareBasis earnings per share is calculated by dividing the profit attributable to ordinary equity holders of the Company
by the weighted average number of ordinary shares during the year excluding ordinary shares purchased by the
company and held as treasury shares.
Profit attributable to ordinary equity holders
In millions of euro 2007 2006
Result for the year 93.0 21.8
Dividends on redeemable cumulative preference shares (5.4) (1.4)
Result attributable to ordinary equity holders 87.6 20.4
Weighted average number of ordinary shares
In thousands of shares 2007 2006
Issued common shares as at 1 January 35,567 35,567
Effect of treasury shares held (5) -
Effect of conversion of convertible subordinated bonds notes 1 -
Weighted average number of ordinary shares at 31 December 35,563 35,567
Draka Holding | 93Notes to the consolidated financial statements 2007

Basic earnings per share (euro)
Basic earnings per share 2.46 0.57
Diluted earnings per shareDiluted earnings per share is calculated by adjusting the weighted average number of ordinary shares
outstanding to assume conversion of all dilutive potential ordinary shares. The Company has two categories of
dilutive potential ordinary shares: convertible subordinated bonds notes and share options and shares under
the long-term incentive plan.
Profit attributable to equity holders (diluted)
In millions of euro 2007 2006
Profit attributable to ordinary equity holders 87.6 20.4
After-tax effect of interest
on convertible subordinated bonds notes 4.9 -
Profit attributable to ordinary equity holders (diluted) 92.5 20.4
Weighted average number of ordinary shares (diluted)
In thousands of shares 2007 2006
Weighted average number of ordinary shares (basic) 35,563 35,567
Effect of long-term incentive plans 243 -
Effect of conversion of convertible subordinated bonds notes 6,511 -
Weighted average number of ordinary shares (diluted) at 31 December 42,317 35,567
Diluted earnings per share (euro)
Diluted earnings per share 2.19 0.57
The average market value of the Company’s ordinary shares for purposes of calculating the dilutive effect of share
options and shares was based on quoted market prices for the period that the options and shares were outstanding.
The estimated number of shares that were issuable in respect of the convertible debt arrangements for the year
2006 are not included in the diluted earnings per share for that year as these instruments had an antidilutive
impact on the reported profit attributable to ordinary equity holders.
22. Interest-bearing loans and borrowings
In millions of euro 2007 2006 Carrying 2007 Carrying 2006 amount Fair value amount Fair value
Non-current liabilities
Convertible subordinated bonds 91.6 156.3 89.0 167.9
Subordinated loans - - 77.5 77.5
Bank facilities and loans 412.5 412.5 78.5 78.5
Finance leases 23.2 22.2 23.2 23.2
527.3 591.0 268.2 347.1
Current liabilities
Convertible subordinated bonds - - 94.3 95.8
Bank facilities and loans 44.6 44.6 4.8 4.8
Dividends on redeemable preference shares - - 4.0 4.0
Current portion of finance leases 4.8 4.8 4.1 4.1
49.4 49.4 107.2 108.7
Total interest-bearing loans and borrowings 576.7 640.4 375.4 455.8
94 | Draka Holding Notes to the consolidated financial statements 2007

In millions of euro Convertible Bank subordinated facilities Finance bonds and loans Leases Total
Effective interest rate 7.0% 6.2% 8.9%
Due in 2008 - 44.6 4.8 49.4
Due between 2008 - 2012 91.6 412.5 11.0 515.1
Due after 2012 - - 12.2 12.2
Total interest-bearing loans and borrowings 91.6 457.1 28.0 576.7
Of which included in non-current 91.6 412.5 23.2 527.3
Of which included in current - 44.6 4.8 49.4
Total interest-bearing loans and borrowings 91.6 457.1 28.0 576.7
The effective interest rates as stated in the table above, includes the impact of interest rate swaps.
The fair value of interest-bearing loans and borrowings has been estimated by calculating the discounted value of
the loan and borrowings portfolio using an estimated yield curve, appropriated for the contract terms in effect at
the end of the year. The carrying amounts of current portion of interest-bearing loans and borrowings approximate
their fair value. Quoted market prices and interest rates prevailing on the balances sheet date were used in
determining fair values.
The Group has hedged the interest rate risk on part of the multicurrency revolving credit facility. More
information about the Group’s exposure to interest rate and foreign currency risk has been disclosed in note 27.
Convertible subordinated bonds
5 per cent. Convertible Subordinated Bonds due 2007
In millions of euro 2007 2006
Balance at 1 January 94.3 91.4
Amortisation of interest expense 0.9 2.9
Redemption at face value (95.2) -
Carrying amount of liability at 31 December - 94.3
In April 2007 the 5% convertible subordinated bond was redeemed at face value of € 95.2 million.
4 per cent. Convertible Subordinated Bonds due 2010
In millions of euro 2007 2006
Balance at 1 January 89.0 86.5
Conversion of convertible subordinated bonds notes (0.1) -
Amortisation of interest expense 2.7 2.5
Carrying amount of liability at 31 December 91.6 89.0
In September 2010, noteholders have the option to convert the notes into ordinary Draka Holding N.V. shares at
a conversion price of € 15.26. Notes that are not converted into ordinary shares will be redeemed at face value in
September 2010. The face value of the convertible notes amounted to € 99.9 million at 31 December 2007
(2006: € 100 million).
Subordinated loansIn 2007 the proceeds of the new multicurrency facility were used to redeem the subordinated loan. The proceeds
of subordinated loan in 2006 were mainly used for the redemption of redeemable preference shares.
Bank facilities and loansThe bank facilities and loans comprise a combination of a committed multicurrency revolving credit facility of
€ 625 million and various bilateral facilities on Group level as well as local facilities to various subsidiaries. The
Draka Holding | 95Notes to the consolidated financial statements 2007

multicurrency facility expires in 2012 with an option to extend one year.
The interest-bearing liabilities, except the convertible subordinated bonds, relate to various credit facilities from
(a syndicate of) lending institutions. The interest payable of the multicurrency revolving credit facility is variable
and based on the relevant interbank interest rate plus a mark-up of 115 basis points. If certain conditions are not
met the loans become payable on demand. See note 4.1 b.
The bank loans are secured over land and buildings with a carrying amount of € 13.0 million (2006: € 3.1 million)
(see note 13).
Finance lease liabilitiesFinance lease liabilities are payable as follows:
In millions of euro Present value Present value of Future minimum of minimum Future minimum minimum lease lease payments Interest lease payments lease payments Interest payments 2007 2007 2007 2006 2006 2006
Less than one year 7.1 2.3 4.8 6.3 2.2 4.1
Between one and five years 18.3 7.3 11.0 17.4 8.6 8.8
More than five years 17.4 5.2 12.2 20.6 6.2 14.4
42.8 14.8 28.0 44.3 17.0 27.3
Under the terms of the lease agreements, no contingent rents are payable.
23. Other interest-bearing liabilityAs per 1 July 2004 Alcatel N.V. obtained a put option right which could be exercised in accordance with a specific
valuation and pricing protocol as from 1 July 2006 pursuant to which it may sell its shares in Draka Comteq B.V. to
the Group. According to IAS 32/39, which is applied as from 1 January 2005 the liability relating to the put option is
estimated at its present value. On December 27, 2007 Alcatel Lucent N.V. waived their right to require Draka to
purchase the 49.9%. Upon the waiver the Group derecognised the related other interest bearing liability and
recognised the 49.9% shareholding of Alcatel as minority interest classified under total equity. The value of the
interest bearing liability on December 27 amounted to € 131.9 million. In 2007 the Group recognised € 12.2 million
(2006: € 14.0 million) finance expense in the income statement and the fair value change in the liability of € 8.1 million
(2006: € 23.3 million) as finance income. Subsequent to the waiver the Group acquired the remaining 49.9% shares
from Alcatel. See further note 3.
Since no quoted market price exist for the valuation of the present value of estimated exercise price of the put
option, valuation techniques have been used to calculate the interest bearing liability. The valuation is derived from
the fair value of Draka Comteq B.V., which valuation is carried out by an independent third party. The fair value of the
interest-bearing liability is based on estimates of management.
24. Provision for employee benefitsDefined benefit plansEmployee benefit plans have been established in many countries in accordance with the legal requirements,
customs and the local situation in the country involved. In Europe a significant part of the employees are
covered by defined benefit plans. The benefits provided by these plans are based on employees service years
and compensation levels. The measurement date for all defined benefit plans is 31 December.
Contributions are made by the Group, as necessary, to provide assets to meet the benefits payable to defined
benefit pension plan participants. These contributions are based on various factors including funded status,
legal and tax considerations as well as local customs.
In the Netherlands the Group participates in a multi-employer pension plan. This pension plan is externally
funded in PME, the Dutch industry wide pension fund for the Metalelektro. In accordance with IAS 19 the related
pension scheme should be treated as a defined benefit plan. Since the assets and liabilities of this multi-
employer plan can not be allocated in a systematic way to the employers the Group applies the exemption
mentioned in paragraph 19.30 of IAS and treats the scheme as a defined contribution plan. The pension fund
has a surplus. The coverage ratio per 31 December 2007 on the basis of the actual market interest rate amounts
to 133% (2006: 129%). The Group has no obligation to fund any deficits and is not entitled to any surpluses.
96 | Draka Holding Notes to the consolidated financial statements 2007

In millions of euro 2007 2006
Present value of unfunded obligations 61.3 65.9
Present value of funded obligations 243.6 263.1
Fair value of plan assets (256.2) (259.4)
Unrecognised net assets 8.1 7.3
Present value of net obligations 56.8 76.9
Unrecognised actuarial gains and (losses) 24.0 6.5
Recognised liability for defined benefit obligations 80.8 83.4
Liability for long-service leave 11.4 9.9
Total employee benefits 92.2 93.3
Actual return on plan assets 12.9 20.7
The unrecognised net assets primarily relate to a pension plan in the Netherlands, whereby the group is unable to
control the surplus assets. The 2007 contribution to the Group’s multi employer plan (PME) amounted to € 4.4 million
(2006: € 2.7 million).
Movement in the liability for defined benefit obligations
In millions of euro 2007 2006
Liability for defined benefit obligations at 1 January 329.0 320.2
Benefits paid by the plan (12.0) (11.8)
Current service costs 4.8 6.1
Interest on obligation 14.6 14.1
Actuarial losses (or) gains (19.9) (2.5)
Benefits paid by the employer (2.9) (2.7)
Employee contributions 1.2 1.1
Curtailments and settlements - (2.3)
Effect of exchange rate fluctuations (9.9) 6.8
Liability for defined benefit obligations at 31 December 304.9 329.0
Movement in plan assets
In millions of euro 2007 2006
Fair value of plan assets at 1 January 259.4 243.4
Benefits paid by the plan (12.0) (11.8)
Employer contribution 4.5 4.2
Employee contribution 1.2 1.1
Expected return on plan assets 14.3 13.1
Actuarial (losses) or gains (1.4) 7.6
Effect of exchange rate fluctuations (9.8) 1.8
Fair value of plan assets at 31 December 256.2 259.4
Expense recognised in the statement of income
In millions of euro 2007 2006
Interest on obligation (14.6) (14.1)
Current service costs (4.8) (6.1)
Expected return on plan assets 14.3 13.1
Curtailment - (0.4)
Amortization unrecognised net gain or loss (0.1) -
(5.2) (7.5)
The 2008 expense is not expected to differ significantly from the 2007 expense recognised in the income statement.
The expected return on plan assets is based on actual historical weighted returns.
Draka Holding | 97Notes to the consolidated financial statements 2007

The Group also sponsors defined contributions and similar types of plans for a significant number of salaried
employees. The total costs amounted to € 9.9 million (2006: € 13.1 million).
Actuarial assumptionsPrincipal weighted average actuarial assumptions at the balance sheet date:
2007 2006 2005
Discount rate at 31 December 5.6% 4.9% 4.6%
Expected return on plan assets at 31 December 6.2% 5.6% 5.4%
Future salary increases 2.9% 2.8% 2.8%
Future pension increases 1.9% 1.7% 1.7%
The plan assets consist primarily of bonds, listed shares and related instruments. The majority of these plan assets
relate to pension plans in the Netherlands. The allocation of the investments per asset category for the pension
plans in the Netherlands at 31 December 2007 and 2006 is approximately as follows:
2007 2006
Shares and related instruments 30% 30%
Bonds 69% 69%
Other 1% 1%
Historical information
In millions of euro 2007 2006 2005
Present value of the defined benefit obligation 304.9 329.0 320.2
Fair value of plan assets 256.2 259.4 243.4
Deficit in plan (48.7) (69.6) (76.8)
Experience adjustments arising on plan liabilities (2.5) 0.1 (25.1)
Experience adjustments arising on plan assets (1.5) 5.5 10.9
Other employee benefit provisionsIn several countries the Group established jubilee and long service plans in accordance with local customs. The
provision resulting from these plans is recognised under other employee benefits. The Group has applied the same
actuarial assumptions as those used in the actuarial calculation of the defined benefit post retirement plans. All
actuarial gains or losses have been recognised in the income statement.
25. Other provisions
In millions of euro Onerous Warranties Restructuring contracts Other Total
Balance at 31 December 2006 7.9 33.0 6.0 11.1 58.0
Provisions made during the year 0.7 0.4 0.7 0.4 2.2
Provisions used during the year (1.3) (18.6) (6.0) (0.7) (26.6)
Provisions reversed during the year (3.6) (1.2) (0.1) (3.2) (8.1)
Reclassifications (0.3) (2.8) 1.4 1.7 -
Effect of exchange rate fluctuations - (0.2) (0.1) 0.5 0.2
Balance at 31 December 2007 3.4 10.6 1.9 9.8 25.7
Non-current 1.2 4.0 1.2 6.8 13.2
Current 2.2 6.6 0.7 3.0 12.5
WarrantiesThe provision for product warranty reflects the estimated costs of replacement and free-of-charge services that
will be incurred by the Group with respect to products sold. The Group expects to incur most of the liability
within the time frame of 4 years.
98 | Draka Holding Notes to the consolidated financial statements 2007

RestructuringIn August 2006 the Group announced a restructuring in connection with Draka Comteq’s Stop Swap and Share
project. In 2007 a substantial part of the restructuring has taken place. This resulted in a use of the provision of
approximately € 13.0 million. The restructuring is expected to be completed in 2009. The remainder of the
recognised restructuring provision mainly relates to this project. In 2006 a restructuring provision was
recognised of € 3.3 million regarding Cableteq’s Stop Swap and Share project. During 2007 the provision was
fully used. € 2.3 million relates to the usage of several other restructuring plans in the Group.
Onerous contractsThe Group has non-cancellable lease for facilities which are no longer used due to changes in activities. The
facilities are (partly) sublet where possible, but rental income is lower than the rental expense. The net
obligation under the contracts was provided for.
Other provisionsOther provisions include among other things, expected losses on projects and provisions for plant dismantling
and removal costs. The Group expects to incur most of the liability within the time frame of 4 years.
26. Trade and other payables
In millions of euro Note 2007 2006
Trade payables 399.2 414.0
Non-trade payables and accrued expenses 129.6 146.5
Fair value derivatives 28) 5.6 6.1
534.4 566.6
27. Financial instruments Credit risk
Exposure to credit riskThe carrying amount of financial assets represents the maximum credit exposure. The maximum exposure to
credit risk at the reporting date was:
Carrying amount Note 2007 2006
Receivables 16) 15.5 22.7
Promissory note 16) 8.2 8.0
Other investments 16) 1.2 1.5
Trade receivables 18) 409.1 397.2
Trade receivables due from associates 18) 2.5 2.5
Other receivables 18) 51.2 53.8
Fair value derivatives 28) 2.4 1.7
Cash and cash equivalents 19) 39.4 42.1
529.5 529.5
Impairment lossesThe aging of trade receivables at the reporting date was:
Gross Impairment Gross Impairment 2007 2007 2006 2006
Not past due 325.6 0.3 328.8 0.3
Past due 0-30 66.8 1.1 52.3 1.7
Past due 31-90 13.6 0.8 17.5 1.3
Past due 91-365 8.9 0.8 7.0 2.0
More than one year 5.6 5.9 5.2 5.8
420.5 8.9 410.8 11.1
Draka Holding | 99Notes to the consolidated financial statements 2007

The movement in the allowance for impairment in respect of trade receivables during the year was as follows:
Carrying amount 2007 2006
Balance at 1 January 11.1 14.7
Impairment loss recognised 1.5 2.1
Write off against financial asset (1.1) (3.8)
Reversal of impairment loss (2.3) (1.6)
Translation differences (0.3) (0.3)
Balance at 31 December 8.9 11.1
The allowance account in respect of trade receivables is used to record impairment losses unless the Group is
satisfied that no recovery of the amount owing is possible; at that point the amounts considered irrevocable are
written off against the financial asset directly.
Liquidity riskThe following are the contractual maturities of financial liabilities at December 31, 2007:
31 December 2007 Contractual cash flows Carrying (principal Less than 6-12 More than amount values) 6 months months 1-2 years 2-5 years 5 years
Non-derivative financial liabilities
Convertible subordinated debt 91.6 (99.9) - - - (99.9) -
Bank facilities and loans 457.1 (456.8) (34.4) (10.1) (3.0) (409.2) (0.1)
Finance lease liabilities 28.0 (28.0) (2.4) (2.4) (4.9) (6.1) (12.2)
Trade and other payables *) 528.8 (528.8) (528.8) - - - -
Bank overdrafts 34.9 (34.9) (34.9) - - - -
Derivative financial liabilities
Foreign exchange derivatives 0.6 (0.6) (0.2) (0.4) - - -
Commodities 5.0 (5.0) (4.5) (0.4) (0.1) - -
*) Excludes derivatives (shown separately)
The Multicurrency facility expires in 2012 with an option to extend one year. Drawings under this facility typically
have a tenor of one or three months.
The following are the contractual maturities of financial liabilities at December 31, 2006:
31 December 2006 Contractual cash flows More (principal Less than 6-12 1-2 2-5 than Carrying amount values) 6 months months years years 5 years
Non-derivative financial liabilities
Convertible subordinated debt 183.8 (195.2) (95.2) - - (100.0) -
Subordinated loans 77.5 (77.5) - - - (77.5) -
Bank facilities and loans 82.8 (81.6) (2.0) (1.6) (31.6) (46.4) -
Dividends on redeemable preference shares 4.0 (4.0) (4.0) - - - -
Finance lease liabilities 27.3 (27.3) (1.5) (2.6) (5.2) (3.6) (14.4)
Trade and other payables *) 560.5 (560.5) (560.5) - - - -
Bank overdrafts 32.0 (32.0) (32.0) - - - -
Derivative financial liabilities
Foreign exchange derivatives 0.4 (0.4) (0.3) (0.1) - - -
Commodities 5.7 (5.7) (7.5) 1.7 - 0.1 -
*) Excludes derivatives (shown separately)
100 | Draka Holding Notes to the consolidated financial statements 2007

Currency riskThe following significant exchange rates applied during the year
Average rate Reporting date spot rate 2007 2006 2007 2006
Euro 1.00 1.00 1.00 1.00
USD 0.73 0.80 0.68 0.76
GBP 1.46 1.47 1.36 1.49
Sensitivity analysisA 10 percent strengthening or weakening of the euro against the aforementioned currencies at 31 December
2007 would have changed equity and profit or loss by an amount less than € 1.0 million. This analysis assumes
all other variables remain constant and excludes the effect of translating financial data denominated in a
functional currency other than the euro – the reporting currency of the Group. The forward exchange contracts
have been included in this estimation.
Interest rate riskAt the reporting date the interest rate profile of the Group’s interest-bearing financial instruments was:
Carrying amount 2007 2006
Fixed rate instruments
Financial assets 8.2 8.0
Financial liabilities 119.6 214.6
Floating rate instruments
Financial assets 39.4 42.1
Financial liabilities 492.0 192.8
Fair value sensitivity analysis for fixed rate instrumentsThe Group does not account for any fixed rate financial assets and liabilities at fair value through profit or loss,
and the Group does not designate derivatives (interest rate swaps) as hedging instruments under a fair value
hedge accounting model. Therefore a change in interest rates at the reporting date would not affect profit or loss.
Cash flow sensitivity analysis for variable rate instrumentsA change of 100 basis points in interest rates at the reporting date would have increased (decreased) equity and
profit or loss by the amounts shown below. This analysis assumes that all other variables, in particular foreign
currency rates, remain constant.
Profit or loss Equity 100 bp increase 100 bp decrease 100 bp increase 100 bp decrease
31 December 2007
Variable rate instruments (4.3) 4.3 - -
Interest rate derivatives 1.5 (1.4) 1.5 (1.6)
Cash flow sensitivity net (2.8) 2.9 1.5 (1.6)
31 December 2006
Variable rate instruments (1.4) 1.4 - -
Interest rate derivatives 1.4 (1.5) - -
Cash flow sensitivity net - (0.1) - -
Price riskIn the ordinary course of its business the Company has an exposure of a portion of its inventory (core inventory).
The effect of copper price sensitivities on the Company’s operating result depends on its ability to pass the
fluctuations on to its customers and existing commercial agreements.
For further information on financial instruments reference is made to note 4 financial risk management.
Draka Holding | 101Notes to the consolidated financial statements 2007

28. Derivative financial instrumentsDerivative financial instruments comprise:
In millions of euro 2007 2006 Assets Liabilities Assets Liabilities
Interest rate derivatives - cash flow hedges 0.7 - - -
Interest rate derivatives - fair value through profit or loss 1.6 - 1.1 -
Forward foreign exchange contracts -
fair value through profit or loss 0.1 0.6 0.6 0.4
Forward copper contracts - cash flow hedges - 5.0 - 5.7
Total 2.4 5.6 1.7 6.1
The following tables indicate the periods in which the cash flows associated with derivatives that are cash flow
hedges are expected to occur and are expected to impact profit or loss:
31 December 2007 Carrying Expected Less than 6-12 1-2 2-5 More than amount cash flows 6 months months years years 5 years
Interest rate derivatives
Assets:
cash flow hedges 0.7 0.8 0.2 0.2 0.3 0.1 -
Forward copper contracts (commodities)
Liabilities:
cash flow hedges 5.0 (5.0) (4.5) (0.4) (0.1) - -
31 December 2006 Carrying Expected Less than 6-12 1-2 2-5 More than amount cash flows 6 months months years years 5 years
Forward copper contracts (commodities)
Liabilities:
cash flow hedges 5.7 (5.7) (7.5) 1.7 - 0.1 -
29. Commitments and contingent liabilitiesInvestment and supplier commitmentsDuring the year ended 31 December 2007, the Group entered into contracts to purchase property, plant and
equipment for an amount of € 5.1 million (2006: € 1.2 million). These commitments are expected to be settled in
2008.
Commitments under rental and lease agreementsLeases as lesseeNon-cancellable operating lease rentals are payable as follows:
In millions of euro 2007 2006
Less than one year 10.4 11.5
Between one and five years 24.4 24.0
More than five years 28.8 40.2
63.6 75.7
The Group leases factories, warehouse facilities, machinery and equipment under operating leases. These leases
expire at various dates during the next 20 years, with an option to renew the lease after expiry date. The leases
do not include any significant contingent rentals.
Some of the leased properties have been sublet by the Group. Sublease payments of € 2.4 million (2006:
€ 22.5 million) are expected to be received until expiry date. The Group has recognised a provision of € 1.9 million
(2006: € 6.0 million) in respect of one of these leases (see note 25).
During the year ended 31 December 2007, € 16.0 million (2006: € 9.1 million) was recognised as an expense in the
income statement in respect of operating leases. An amount of € 1.1 million was recognised as income in the income
statement in respect of subleases (2006: € 1.4 million).
102 | Draka Holding Notes to the consolidated financial statements 2007

GuaranteesGuarantees have been issued to an amount of € 6.1 million (2006: € 50.9 million).
30. Related partiesIdentity of related partiesThe Group has a related party relationship with its subsidiaries, associates and joint ventures and with its directors
and executive officers. In addition, for an overview of important shareholders in the Group reference is made to
Share Information, Disclosure of Major Holdings in Listed Companies Act in this Annual report. For an overview
of the remuneration of the Board of Management and Supervisory Board, reference is made to note 41.
Transactions with associates and joint ventures (equity accounted investees)During the year ended 31 December 2007, associates and joint ventures purchased goods from the Group in the
amount of € 3.2 million (2006: € 7.0 million) and at 31 December 2007 associates and joint ventures owed the
Group € 4.6 million (2006: € 5.0 million). At 31 December 2007 the Group’s trade receivables from associates and
joint ventures amounted to € 4.5 million (2006: € 3.8 million) and trade payables to associates and joint ventures
amounted to € 0.8 million (2006: € 1.7 million). Transactions with associates and joint ventures are priced on an
arm’s length basis. During the year ended 31 December 2007, the Group received dividends from associates and
joint ventures for an amount of € 21.7 million (2006: € 2.1 million).
31. Events after the balance sheet dateDeBiase Lift Components S.R.L On 10 January 2008, the Group acquired 100% of the shares of DeBiase Lift Components S.R.L in Milan. The
purchase consideration was satisfied partly in cash and partly through a contingent consideration based on the
future performance of the company. The first instalment equal to € 1.2 million is paid on the closing date and the
second instalment is equal to € 0.3 million and is expected to be paid in the course of 2008.
DB Lift Components’ product scope covers distribution of cable, wire rope, electrical & mechanical components
and hardware. The acquisition will be consolidated in the Group’s financial statements as from January 2008.
Draka Holding | 103Notes to the consolidated financial statements 2007

Company financial statements Company Balance sheet as at 31 December
(before appropriation of the result)
In millions of euro Note* 2007 2006
Assets
Non-current assets
Intangible fixed assets 34) 1.0 2.0
Tangible fixed assets 1.1 0.9
Financial fixed assets 35) 1,026.4 1,035.6
Total non-current assets 1,028.5 1,038.5
Current assets
Trade and other receivables 36) 866.5 570.7
Cash in bank and in hand 36.2 -
Total current assets 902.7 570.7
Total assets 1,931.2 1,609.2
Equity
Shareholders’ equity
Share capital 20.4 20.4
Share premium 311.4 311.4
Translation reserve (18.2) (5.1)
Hedging reserve (3.0) (4.2)
Reserve for equity accounted investees 30.5 36.7
Retained earnings (19.3) 45.9
Unappropriated result for the year 87.6 20.4
Preference shares dividend reserve 5.4 1.4
Total shareholders’ equity 37) 414.8 426.9
Liabilities
Non-current liabilities
Interest-bearing loans and borrowings 38) 587.9 331.7
Total non-current liabilities 587.9 331.7
Current liabilities
Interest-bearing loans and borrowings 38) 746.1 586.5
Trade and other payables 39) 182.4 264.1
Total current liabilities 928.5 850.6
Total liabilities 1,516.4 1,182.3
Total equity and liabilities 1,931.2 1,609.2
Statement of income for the years ended 31 December
Income after taxes from investments in group companies 35) 88.2 34.1
Other income (loss) after taxes 4.8 (12.3)
Result attributable to the shareholders 93.0 21.8
*The notes to the company financial statements on pages 105 to 112 are an integral part of these company financial statements
104 | Draka Holding Company financial statements 2007

Notes to the company financial statementsContents
32. General 106
33. Principles for the measurement of assets and liabilities and the determination of the result 106
34. Intangible fixed assets 106
35. Financial fixed assets 106
36. Trade and other receivables 107
37. Shareholders’ equity 107
38. Interest-bearing loans and borrowings 109
39. Trade and other payables 109
40. Financial instruments 110
41. Remuneration of the Board of Management and Supervisory Board 111
42. Commitments and contingent liabilities 112
Draka Holding | 105Notes to the company financial statements 2007

32. GeneralThe company financial statements (hereinafter also referred to as the ‘statutory financial statements of the
Company’) are part of the 2007 financial statements of Draka Holding N.V. and are prepared in compliance with
the legal requirements of Part 9, Book 2, of the Netherlands Civil Code.
With respect to the company statement of income, the Company made use of the exemption provided under section
2:402 of the Netherlands Civil Code, which allows the Company to present only the profit from Group companies
after income tax and other income and expenses after income tax.
33. Principles for the measurement of assets and liabilities and the determination of the result
Draka Holding N.V. has applied the option in section 2:362 (8) of the Netherlands Civil Code to use the same
principles of valuation and determination of result for the statutory financial statements as those applied for the
consolidated financial statements. Unless otherwise described in the notes to the statutory financial statements,
reference should be made to the notes to the consolidated financial statements for details of the accounting
principles adopted in these statutory financial statements.
34. Intangible fixed assets
In millions of euro Goodwill Software Total
Balance as at 1 January 2007
Cost 1.6 0.7 2.3
Accumulated amortisation - (0.3) (0.3)
Carrying amount 1.6 0.4 2.0
Reclassification (0.9) - (0.9)
Amortisation charge for the year - (0.1) (0.1)
Total changes (0.9) (0.1) (1.0)
Balance as at 31 December 2007
Cost 0.7 0.7 1.4
Accumulated amortisation - (0.4) (0.4)
Book value 0.7 0.3 1.0
An amount of € 0.9 million is reclassified from goodwill to investments in equity accounted investees.
GoodwillGoodwill is determined based on the accounting principles applied in the consolidated financial statements
(note 2 (h-I). Goodwill acquired through a direct investment in Group companies is presented in the statutory
balance sheet of the Company. The goodwill arising on direct investments prior to January 1, 2001 was written of
the reserves. Goodwill acquired through indirect investments in Group companies is capitalised within the carrying
value of the entities that have directly acquired these investments.
35. Financial fixed assetsGroup companies or ‘subsidiaries’ are all entities (including special purpose entities) over which the Company has
the power to govern the financial and operating policies, generally accompanying a shareholding of more than
one half of the voting rights. The existence and effect of potential voting rights that are currently exercisable or
convertible are considered when assessing whether the Company controls another entity.
Investments in Group companies are measured using the net asset value method. The net asset value and results
of Group companies are determined on the basis of the accounting policies that are applied in the consolidated
financial statements. The accounting policies of Group companies are changed where necessary to ensure
consistency with the policies adopted by the Company.
If losses of Group companies that are allocable to the Company exceed the carrying value of the interest in the
Group company (including separately presented goodwill, if any, and including other non-secured receivables),
further losses are not recognized unless the Company has incurred obligations or made payments on behalf of
the Group company to satisfy obligations of the Group company. In such a situation, the Company recognizes
106 | Draka Holding Notes to the company financial statements 2007

a provision up to the extent of this obligation. Unrealized gains and losses on transactions between Group
companies, if any, are eliminated.
In millions of euro Investments Investments in equity in equity accounted accounted Amounts Investments investees investees from group in group (included in (Company companies companies group companies) only) and other Total
Balance as at 1 January 2007 393.2 80.2 14.7 547.5 1,035.6
Share in result 72.7 8.7 6.8 - 88.2
Additions 5.0 - - - 5.0
Dividend received - (21.1) (0.6) - (21.7)
Financing and other movements (38.6) - 0.9 47.2 9.5
Acquisition minority interest (77.1) - - - (77.1)
Translation differences (10.5) (0.8) (1.8) - (13.1)
Balance as at 31 December 2007 344.7 67.0 20.0 594.7 1,026.4
Draka Holding N.V. is at the head of the group and has capital interests in subsidiaries, associates and joint
ventures presented on page 38.
36. Trade and other receivables
In millions of euro 2007 2006
Receivables from group companies 851.4 545.8
Other receivables 15.1 24.9
866.5 570.7
Receivables from group companies and other receivables are mainly due within 1 year. Other receivables include
an amount of € 2.3 million (2006 € 1.3 million) of fair value derivatives in relation to interest rate swaps and
forward foreign exchange contracts.
37. Shareholders’ equityFor both the years ended 31 December 2007 and 31 December 2006, the total of capital and reserves that are
attributable to the Company’s equity holders included in the statutory financial statements is equal to the capital
and reserves attributable to the Company’s equity holders as presented in the consolidated financial statements.
Certain reserves have been presented separately in the Company balance sheet, whereas for consolidated purposes
these have been summarised as retained earnings and other reserves.
Authorised and issued share capitalAt 31 December 2007, the authorised and issued share capital consisted of:
• 58,000,000 ordinary registered or bearer shares with a nominal value of € 0.50 each, of which 35,571,009 were
issued and fully paid (2006: 35,567,406). Excluding the number of shares that have been repurchased, the
number of ordinary shares issued and outstanding is 35,570,075 (31 December 2006: 35,567,406);
• 82,000,000 preference shares A and B with a par value each of € 0.50 per share, of which 2,675,000 preference
shares A were issued and fully paid and of which 2,371,257 preference shares B were issued and fully paid.
The holders of ordinary and preference shares are entitled to receive dividends as declared from time to time and
are entitled to vote at meetings of the Company. All shares rank equally with regard to the Company’s residual
assets, except that preference shareholders participate only to the extent of the face value of the shares adjusted
for any dividends in arrears. In respect of the Company’s shares that are held by the Group (see below), all rights
are suspended until those shares are reissued.
All current preference shares are held by two banks, Fortis and Ducatus. The preference shares have a remaining
maturity of 5 years with annual dividends of 7.11% for the preference shares A held by Fortis and 7.06% for the
preference shares B held by Ducatus.
In 2006 Draka entered into an agreement with the Rabobank and ING for the purpose of repurchasing the
Draka Holding | 107Notes to the company financial statements 2007

preference shares held by these Banks. In the agreement it was established where a division was made between
economic ownership and legal ownership. In that agreement it was laid down that the economic ownership was
transferred on the day of payment which was 29 December 2006 and the legal transfer would occur after
shareholders approval on 11 May 2007. On 11 May 2007 the General Meeting of Shareholders authorised the
Board of Management to purchase the preference share from ING Bank and Rabobank. The shareholders
approval was for the repurchase and redemption of the preference shares. On the 24 July 2007 the courts in
Amsterdam issued a deed of non-protest. Consequently the repurchased preference shares were cancelled.
Treasury sharesThe Company acquires ordinary shares to cover obligations under its long-term incentive plans. Shares are
generally acquired just prior to employees exercising their options or when shares are to be delivered. The
acquired shares are subsequently delivered to the eligible employees. At 31 December 2007 the Company owns
934 shares and the amount paid to acquire the shares was € 32,744 (see note 2 (n)).
Movements in the number of shares in 2006 and 2007 that are issued and fully paid are as follows:
In numbers of shares Ordinary shares Treasury shares Preference shares
Balance at 1 January 2006 35,567,406 - 8,885,471
Preference shares issued - - -
Balance at 31 December 2006 35,567,406 - 8,885,471
Withdrawal of preference shares - - (3,839,214)
Conversion of convertible subordinated bonds notes 3,603 - -
Movement in own shares (934) 934 -
Balance at 31 December 2007 35,570,075 934 5,046,257
The maximum increase in the number of ordinary shares due to the conversion of the convertible bonds is 6,549,475
(2006: 8,373,449), corresponding to 18.4% (2006: 23.5%) of the ordinary shares as at 31 December 2007.
The movement schedule of capital and reserves attributable to the shareholders of the Company in 2006 and
2007 is presented below:
In millions of euro Ordinary shares Preference share Reserve Preference Reserve Unapprop- Trans- for shares for equity riated Share Share Share Share lation treasury Hedging dividend accounted Retained result for capital premium capital premium reserve shares reserve reserve investees earnings the year Total
Balance as at 1 January 2006 17.9 237.3 - - 12.1 - 11.2 - 30.6 46.7 4.4 360.2
Appropriation of the result 2005 - - - - - - - - - 4.4 (4.4) -
Foreign exchange translation differences - - - - (17.2) - - - - - - (17.2)
Effective portion of fair value changes
of cash flow hedges (net of income tax) - - - - - - (15.4) - - - - (15.4)
Result for the year - - - - - - - 1.4 6.1 (6.1) 20.4 21.8
Preference shares issued - - 2.5 74.1 - - - - - - - 76.6
Share-based payments - - - - - - - - - 0.9 - 0.9
Balance as at 31 December 2006 17.9 237.3 2.5 74.1 (5.1) - (4.2) 1.4 36.7 45.9 20.4 426.9
Appropriation of the result 2006 - - - - - - - - - 20.4 (20.4) -
Foreign exchange translation differences - - - - (13.1) - - - - - - (13.1)
Effective portion of fair value changes
of cash flow hedges (net of income tax) - - - - - - 1.2 - - - - 1.2
Dividends paid - - - - - - - (1.4) - (13.2) - (14.6)
Result for the year - - - - - - - 5.4 (6.2) 6.2 87.6 93.0
Effect of acquisition minority interest - - - - - - - - - (77.1) - (77.1)
Share-based payments - - - - - - - - - 1.5 - 1.5
Shares acquired under long-term
incentive plans - - - - - (4.3) - - - - - (4.3)
Shares delivered under long-term
incentive plans - - - - - 4.3 - - - (3.0) - 1.3
Balance as at 31 December 2007 17.9 237.3 2.5 74.1 (18.2) - (3.0) 5.4 30.5 (19.3) 87.6 414.8
108 | Draka Holding Notes to the company financial statements 2007

Translation reserveThe translation reserve comprises all foreign exchange differences arising since 1 January 2004 from the
translation of the financial statements of foreign operations. The reserve is not available for distribution to
shareholders. To the extent the translation reserve is negative, it reduces the amount that can be freely
distributed out of reserves.
Hedging reserveThe hedging reserve is not available for distribution to shareholders. To the extent the hedging reserve is
negative, it reduces the amount that can be freely distributed out of reserves.
Reserves for equity accounted investeesReserve for equity accounted investees amounting € 30.5 million (2006: € 36.9 million), relates to the Group’s
share in their result that has not been distributed as dividend.
Legal reservesThe legal reserves of the Company comprise the translation reserve, the hedging reserve and the reserves for
equity accounted investees and are not available for distribution to shareholders.
DividendsA proposal will be made to the Annual General Meeting of Shareholders to pay a cash dividend of € 0.68 per
share over the result after tax for 2007 and a dividend on redeemable preference shares for an amount of
€ 5.4 million. The remainder will be added to retained earnings.
38. Interest-bearing loans and borrowings
In millions of euro Note 2007 2006
Non-current liabilities
Convertible subordinated bonds 22) 91.6 89.0
Subordinated loans 22) - 77.5
Bank facilities and loans 407.1 76.2
Group companies 89.2 89.0
587.9 331.7
Current liabilities -
Convertible subordinated bonds 22) - 94.3
Bank facilities and loans 746.1 488.2
Dividends on redeemable preference shares 22) - 4.0
746.1 586.5
39. Trade and other payables
In millions of euro 2007 2006
Trade creditors 115.2 192.1
Payables to group companies 44.0 30.9
Other current liabilities, accruals and deferred income 23.2 41.1
182.4 264.1
Trade and other payables are mainly due within 1 year.
Other current liabilities, accruals and deferred income include an amount of € 5.0 million (2006: € 5.7 million) of
fair value derivatives in relation to raw material transactions.
Draka Holding | 109Notes to the company financial statements 2007

40. Financial instruments Credit risk
Exposure to credit riskThe carrying amount of financial assets represents the maximum credit exposure. The maximum exposure to
credit risk at the reporting date was:
Carrying amount 2007 2006
Investments in group companies and equity accounted investees 431.7 488.1
Amounts from group companies 582.2 539.5
Promissory note 8.2 8.0
Other investments 0.3 -
Receivables from group companies 851.4 545.8
Other receivables 11.7 23.6
Fair value derivatives 2.3 1.3
Cash and cash equivalents 36.2 -
1,924.0 1,606.3
Liquidity riskThe following are the contractual maturities of financial liabilities at December 31, 2007:
31 December 2007 Contractual cash flows Less Carrying (principal than 6-12 More than amount values) 6 months months 1-2 years 2-5 years 5 years
Non-derivative financial liabilities
Convertible subordinated debt 91.6 (99.9) - - - (99.9) -
Bank facilities and loans 408.2 (408.2) - (1.1) - (407.1) -
Loans from group companies 89.2 (89.2) - - - - (89.2)
Trade and other payables *) 177.4 (177.4) (177.4) - - - -
Bank overdrafts 745.0 (745.0) (745.0) - - - -
Derivative financial liabilities
Commodities 5.0 (5.0) (4.5) (0.4) (0.1) - -
*) Excludes derivatives (shown separately)
The following are the contractual maturities of financial liabilities at December 31, 2006:
31 December 2006 Contractual cash flows Less Carrying (principal than 6-12 More than amount values) 6 months months 1-2 years 2-5 years 5 years
Non-derivative financial liabilities
Convertible subordinated debt 183.3 (195.2) (95.2) - - (100.0) -
Subordinated loans 77.5 (77.5) - - - (77.5) -
Bank facilities and loans 77.3 (80.7) (3.4) (1.1) (30.0) (46.2) -
Loans to group companies 89.0 (89.0) - - - - (89.0)
Dividends on redeemable preference shares 4.0 (4.0) (4.0) - - - -
Trade and other payables *) 258.4 (258.4) (258.4) - - - -
Bank overdrafts 487.1 (487.1) (487.1) - - - -
Derivative financial liabilities
Commodities 5.7 (5.7) (7.5) 1.7 - 0.1 -
*) Excludes derivatives (shown separately)
110 | Draka Holding Notes to the company financial statements 2007

41. Remuneration of the Board of Management and Supervisory Board Board of ManagementThe remuneration of members of the Board of Management is determined by the Supervisory Board. The
Company’s policy concerning remuneration is designed to ensure that the Company is able to attract and retain
suitable qualified members of the Board of Management. The remuneration package consists of a base salary, a
short-term incentive (bonus) payment and a long-term incentive in the form of shares. In addition, individual
pension schemes are in place for the members of the Board of Management.
The remuneration is determined annually in light of the tasks and responsibilities of the individual members of
the Board of Management. Based on pre-set targets, the levels of the bonus payments made to members of the
Board of Management are determined annually by the Supervisory Board after the end of the financial year. In
addition to the financial targets, the Supervisory Board has set discretionary targets for the individual members
of the Board of Management on the basis of which the bonus is calculated.
The remuneration paid to the current and former members of Draka’s Board of Management in 2007 and 2006
was as follows:
In thousands of euro Pension Short-term Long-term Salary charges incentive incentive Allowances Total2007
Ingolf Schulz 538 320 428 327 51 1,664
Frank Dorjee 425 235 340 298 - 1,298
Christian Raskin 1) 263 100 158 15 31 567
Sandy Lyons 2) 167 144 143 - 70 524
1,393 799 1,069 640 152 4,053
2006
Garo Artinian 3) 369 124 115 7 119 734
Ingolf Schulz 481 847 446 25 38 1,837
Frank Dorjee 405 90 364 13 - 872
Christian Raskin 385 148 347 22 53 955
Sandy Lyons 3) 203 203 243 - 139 788
1,843 1,412 1,515 67 349 5,186
1) Period 01/01/2007 - 31/08/2007 2) Period 01/09/2007 - 31/12/2007 3) Period 01/01/2006 - 30/06/2006
The long-term incentive reflects the fair value of shares (conditionally) granted to members of the Board of
Management. The actual grant of shares depends on the Company’s future performance in relation to the peer group.
Allowances primary reflect the gross compensation for housing costs, education and daycare.
The number of ordinary shares owned by and conditionally granted to members of the Board of Management
on 31 December 2007 was as follows:
Number of shares owned 2007 2006
Frank Dorjee 9,940 4,737
Number of conditionally granted performance shares 2007 2006
Frank Dorjee 24,788 -
The shares of all Board of Management members have been granted as part of the long-term incentive plan as
detailed in note 10.
Draka Holding | 111Notes to the company financial statements 2007

Supervisory BoardThe remuneration of the members of the Supervisory Board is fixed and independent of the Company’s
financial results. Members of the Supervisory Board are also entitled to reimbursement of incurred costs.
At the Annual General Meeting of Shareholders of 11 May 2007, the proposed remuneration for the separate
Supervisory Board Committees was approved with retrospective effect as per 1 June 2006. As a result, the
remuneration received by the members of the Supervisory Board in 2007 includes the remuneration for the
separate Supervisory Board Committees of 2006.
The remuneration of the members of the Supervisory Board was as follows (x € 1,000):
In thousands of euro 2007 2006
Fritz Fröhlich 81.4 39.8
Annemiek Fentener van Vlissingen 72.4 34.7
Harold Fentener van Vlissingen 3) 57.9 20.6
Ludo van Halderen 3) 57.9 20.6
Rob van Oordt 73.8 30.9
Annemieke Roobeek 3) 57.9 20.6
Wim Jacobs 2) - 12.9
Graham Sharman 71.4 30.9
Frits Fentener van Vlissingen 1) - 10.2
472.7 221.2
1) Frits Fentener van Vlissingen passed away on 25 March 2006.2) Wim Jacobs stepped down at the Annual General Meeting of Shareholders held on 8 May 2006.3) Appointed at the General Meeting of Shareholders held on 8 May 2006
As at 31 December 2007, Fritz Fröhlich owned nil ordinary shares of Draka Holding N.V. (2006: 850).
42. Commitments and contingent liabilitiesThe Company has assumed joint and several liabilities for debts arising from legal actions of its Dutch
subsidiaries, in accordance with Article 403, section 1, Part 9, Book 2 of the Netherlands Civil Code. The debts of
these subsidiaries amounted to € 42.3 million (2006: € 40.2 million).
Draka Holding N.V. forms a fiscal unity with several Dutch Group companies for the Dutch income tax.
Consequently Draka Holding is jointly and severally liable for any debts arising from the fiscal unity.
The Company has issued guarantees in respect of credit facilities granted to subsidiaries of € 33.0 million
(2006: € 38.5 million).
Amsterdam, 6 March 2008
Board of ManagementSandy Lyons, Chairman and CEO
Frank Dorjee, CFO
Supervisory BoardFritz Fröhlich, Chairman
Annemiek Fentener van Vlissingen, Deputy Chairman
Harold Fentener van Vlissingen
Ludo van Halderen
Rob van Oordt
Annemieke Roobeek
Graham Sharman
112 | Draka Holding Notes to the company financial statements 2007


Article 31 (1-12) of the Articles of Association states:
1. The profit evidenced by the annual accounts, as adopted and approved, shall be used first of all to pay the
holders of Class B preference shares a dividend the percentage of which shall be equal to the average
interest on deposits applied by the European Central Bank plus two and a half, increased by the debit interest
surcharge commonly applied by the large banks in the Netherlands, weighted by the number of days to which
the dividend payment relates. The amount of dividend is calculated on the basis of the paid-up portion of the
nominal value. If any profit distribution referred to in the previous sentences cannot be made, whether in full
or in part, on the grounds that the profit does not permit any such distribution, the deficit shall be charged
against the distributable part of the Company’s equity.
2. Subsequently, a dividend is paid on each preference share of a specific class. The amount and method of
adopting the dividend shall be determined with the issue of the relevant class by the body authorised to issue
the shares in question, all of this subject to the Supervisory Board’s approval. The dividend shall be expressed
as a percentage of the yield basis for the preference shares of the relevant class, as referred to in Article 8
paragraph 2 sub b. The resolution to issue preference shares of a specific class may provide:
• that the dividend will be amended and readopted in accordance with the previous two sentences on the dates
set out in the resolution (the “Dividend Review Dates”);
• that any deficit arising from the fact that the profit realised in a given year is insufficient to allow for payment
of the full dividend on preference shares of the relevant class shall be charged against the profit of the next
financial year(s) in which the profit is sufficient to allow for any such payment;
• that any deficit arising from the fact that the profit realised in a given year is insufficient to allow for payment
of the full dividend on preference shares of the relevant class shall be charged, where possible, against the
Company’s freely distributable reserves;
• that the dividend to be paid on the relevant preference shares shall be subordinated to the dividend to be
paid on preference shares of any other class or classes.
3. The Board of Management shall annually decide, subject to approval by the Supervisory Board, which portion
of the distributable profit after application of paragraphs 1 and 2 of this Article is to be reserved.
4. The portion of the profit which remains after payment of dividends on the preference shares and retention in
any reserve shall be distributed as dividend to the ordinary shareholders.
5. The Board of Management may resolve to pay interim distributions, if the Supervisory Board so approves.
6. The Company may only distribute profit to its shareholders up to the distributable portion of the Company’s
equity.
7. Deficits may only be charged against the statutory reserves in so far as permitted by statute.
8. The profit shall be distributed after adoption of the annual accounts which confirm the lawfulness of the
distribution.
9. Interim dividends may be paid only if it is evident from the interim financial accounts that the requirement of
paragraph 6 of this Article is satisfied. The interim financial accounts must depict the Company’s financial
position no earlier than as at the first day of the third month prior to that in which the resolution to pay an
interim dividend is made public. The interim accounts shall be prepared with due observance of generally
accepted principles of valuation. The amounts to be reserved by statute shall be included in the financial
accounts, which are to be signed by the members of the Board of Management. If the signature of any of
these members is missing, this fact and the underlying reason shall be duly reported. The interim financial
accounts shall be deposited at the office of the Commercial Register within eight days of the date on which
the resolution to distribute an interim dividend is announced.
10. The shares held by the Company in its own capital shall be counted in the calculation of the profit distribution.
11. Resolutions to pay interim dividends and other distributions shall be made public without delay.
12. Any claims by shareholders for payment of dividends shall lapse after five years.
Other informationAppropriation of result as provided for by the Articles of Association
114 | Draka Holding Other information 2007

Proposed appropriation of result
The following proposal will be presented to the shareholders for adoption at the Annual General Meeting of
Shareholders.
Net income for the year 2007 will be appropriated as follows (including comparative amounts):
In millions of euro 2007 2006
Reserve for equity accounted investees (6.2) 6.1
Dividend preference shares 5.4 1.4
Dividend ordinary shares 24.2 13.2
Other reserves 69.6 1.1
93.0 21.8
Draka Holding | 115Other information 2007

Auditors’ reportTo: The general meeting of shareholders of Draka Holding N.V.
Report on the financial statements
We have audited the accompanying 2007 financial statements of Draka Holding N.V., Amsterdam, as set out on
page 59 to 112. The financial statements consist of the consolidated financial statements and the company
financial statements. The consolidated financial statements comprise the consolidated balance sheet as at 31
December 2007, the consolidated profit and loss account, the consolidated statement of changes in equity and
the consolidated cash flow statement for the year then ended, and a summary of significant accounting policies
and other explanatory notes. The company financial statements comprise the company balance sheet as at 31
December 2007, the company profit and loss account for the year then ended and the notes.
Management’s responsibilityThe Board of Management is responsible for the preparation and fair presentation of the financial statements in
accordance with International Financial Reporting Standards as adopted by the European Union and with Part 9
of Book 2 of the Netherlands Civil Code, and for the preparation of the Board of Management report in
accordance with Part 9 of Book 2 of the Netherlands Civil Code. This responsibility includes: designing,
implementing and maintaining internal control relevant to the preparation and fair presentation of the financial
statements that are free from material misstatement, whether due to fraud or error; selecting and applying
appropriate accounting policies; and making accounting estimates that are reasonable in the circumstances.
Auditors’ responsibilityOur responsibility is to express an opinion on the financial statements based on our audit. We conducted our audit
in accordance with Dutch law. This law requires that we comply with ethical requirements and plan and perform
the audit to obtain reasonable assurance that the financial statements are free from material misstatement.
An audit involves performing procedures to obtain audit evidence about the amounts and disclosures in the
financial statements. The procedures selected depend on the auditors’ judgment, including the assessment of
the risks of material misstatement of the financial statements, whether due to fraud or error.
In making such risk assessments, the auditor considers internal control relevant to the entity’s preparation and fair
presentation of the financial statements in order to design audit procedures that are appropriate in the circumstances,
but not for the purpose of expressing an opinion on the effectiveness of the entity’s internal control. An audit also
includes evaluating the appropriateness of accounting policies used and the reasonableness of accounting
estimates made by management, as well as evaluating the overall presentation of the financial statements.
We believe that the audit evidence we have obtained is sufficient and appropriate to provide a basis for our
audit opinion.
Opinion with respect to the consolidated financial statementsIn our opinion, the consolidated financial statements give a true and fair view of the financial position of Draka
Holding N.V. as at 31 December 2007, and of its result and its cash flow for the year then ended in accordance
with International Financial Reporting Standards as adopted by the European Union and with Part 9 of Book 2
of the Netherlands Civil Code.
Opinion with respect to the company financial statementsIn our opinion, the company financial statements give a true and fair view of the financial position of Draka Holding N.V.
as at 31 December 2007, and of its result for the year then ended in accordance with Part 9 of Book 2 of the
Netherlands Civil Code.
Report on other legal and regulatory requirements
Pursuant to the legal requirement under 2:393 sub 5 part e of the Netherlands Civil Code, we confirm, to the
extent of our competence, that the Board of Management report as set out on page 14 to 25 is consistent with
the financial statements as required by 2:391 sub 4 of the Netherlands Civil Code.
Amsterdam, 6 March 2008
KPMG ACCOUNTANTS N.V.
E. Eeftink RA
116 | Draka Holding Auditors’ report 2007

TRUSTEE REPORT4 per cent. Convertible Subordinated Bonds 2005 due 2010 with principal amount of EUR 100,000,000 of Draka
Holding N.V.
In compliance with the provisions of article 17, paragraph b 2 of the trust deed executed before Mr. R.J.J.
Lijdsman on September 22, 2005, we report as follows.
As a result of the cash dividend payment per May 18 2007 of € 0.37 per share, the conversion price was adjusted
from EUR 15.52 to EUR 15,26.
Unless previously purchased, redeemed or converted as provided in the trust deed, the bonds will be redeemed
at par on September 22, 2010. Up to and including September 15, 2010 the bonds are convertible into ordinary
shares Draka Holding N.V. of EUR 0.50 nominal value on payment of the applicable conversion price. The current
conversion price is EUR 15.26.
During the year 55 bonds of € 1,000.-- have been offered for conversion. The outstanding amount of the bonds per
31 December 2007 was EUR 99,945,000. The trustee is authorised irrevocably by Draka Holding N.V. to issue as
many ordinary shares as required to allow full conversion of all outstanding bonds.
Draka Holding N.V. is authorised to redeem early all of the outstanding bonds:
1. on or after October 13, 2008, provided that within a period of 30 subsequent trading days, ending 5 trading
days prior to the announcement of early redemption, the closing price of the ordinary shares in Draka
Holding N.V. on Euronext Amsterdam N.V. for not less than 20 trading days shall have been at least 130% of
the then applicable conversion price;
2. if at least 90% of the bonds originally issued has been converted or purchased.
In case of a “Change of Control” as referred to in the trust deed, Draka Holding N.V. will offer bond holders the
opportunity to redeem their bonds early.
Amsterdam, 9 January 2008
N.V. Algemeen Nederlands Trustkantoor ANT
L.J.J.M. Lutz
Draka Holding | 117Trustee report 2007

TEN YEARS OF DRAKA HOLDING N.V. 2007
4 2006
4 2005
4 2004
4 2003 2002 2001 2000
2 1999 1998
RESULTS (x € million)
Revenue 2,816 2,529 1,879 1,684 1,420 1,499 1,917 1,810 1,108 705
EBITDA 198 112 89 56 103 53 250 227 138 102
Operating result 146 58 31 (4) 42 (10) 189 171 100 79
Result before income tax 116 32 (8) (36) 8 (49) 153 132 89 67
Result for the year 93 22 4 (9) 11 (25) 118 97 67 55
BALANCE SHEET (x € million)
Shareholders’ equity 415 427 360 445 362 383 430 340 260 216
Guarantee capital 1 538 620 702 624 563 618 556 503 450 285
Total assets 1,753 1,745 1,638 1,604 1,279 1,386 1,549 1,435 1,328 585
Current assets -/- non-interest
bearing current liabilities 344 280 302 380 355 402 455 467 467 145
PER ORDINARY SHARE (x € 1)
Shareholders’ equity
(excluding preference shares) 9.51 9.85 10.13 8.84 11.16 12.13 14.98 10.65 10.31 12.44
Result for the year after dividend
on preference shares 2.46 0.57 0.12 (0.67) 0.12 (1.62) 5.43 4.58 3.75 3.19
Proposed dividend 0.68 0.37 - - 0.10 - 1.63 1.37 1.02 0.96
Pay-out 30% 30% - - 83% 0% 30% 30% 30% 30%
Highest share price 42.20 26.60 14.30 20.90 16.85 45.71 67.35 89.40 49.30 44.47
Lowest share price 19.75 11.70 9.95 8.75 4.10 7.15 36.35 46.80 19.80 20.65
Market price at year end 23.00 25.80 13.23 10.70 15.60 9.45 39.50 57.40 49.30 23.28
Price / Earnings ratio on basis of price
at year end 9.3 54.9 110.3 (16.0) 130.0 (5.8) 7.3 12.5 14.2 7.3
Price of convertible subordinated bond 2007
at year end - 101% 100% 100% 94% 70% - 255% 195% 117%
Price of convertible subordinated bond 2010
at year end 156% 168% 103% - 94% 70% - 255% 195% 117%
RATIOS (in %)
Operating result / Revenue 5.2 2.3 1.6 (0.3) 3.0 (0.7) 9.9 9.4 9.0 11.1
ROTA 3 6.6 1.9 (0.5) (2.5) 0.7 (3.4) 10.6 9.5 9.3 12.8
Result for the year / Revenue 3.3 0.9 0.2 (0.5) 0.8 (1.7) 6.1 5.3 6.1 7.8
Result for the year / Average shareholders’ equity
(excluding preference shares) 27.0 6.1 1.3 (2.4) 3.0 (6.2) 30.5 32.2 28.3 28.9
Shareholders’ equity / Total assets 23.7 24.5 22.0 27.7 28.3 27.6 27.8 23.7 19.6 36.9
Guarantee capital / Total assets 30.7 35.5 42.8 38.9 44.0 44.6 35.9 35.1 34.1 48.7
OTHER RATIOS
Current ratio 1.4 1.2 1.4 1.4 1.5 1.3 1.1 1.3 1.4 1.6
Quick ratio 0.8 0.7 0.8 0.8 0.8 0.7 0.6 0.8 0.9 0.8
Revenue of total assets 1.6 1.5 1.1 1.0 1.1 1.1 1.2 1.2 0.8 1.2
1 Shareholders’ equity, provision for deferred taxation and long-term part of convertible subordinated bond and other subordinated loans2 Changed for comparison purposes (years before 2000 have not been restated)3 Result before income tax / Average total assets (prior years are changed accordingly)4 IFRS
118 | Draka Holding Ten years of Draka Holding N.V.

Colophon
Publication
Draka Holding N.V.
Design and production
Communicatie & Onderneming
(www.commond.nl)
Photography
Frans Strous
Getty Images

Draka Holding N.V.
De Boelelaan 7
Building ‘Officia I’
1083 HJ Amsterdam
P.O. Box 75979
1070 AZ Amsterdam
The Netherlands
t +31(20) 568 98 65
f +31(20) 568 98 99
i www.draka.com