Embed Size (px)
Citation preview

The Spread of Airborne Infectious Disease
Christopher Chao, PhD Department of Mechanical Engineering
The Hong Kong University of Science and Technology, China
Workplace and Indoor Aerosols 2012
http://www.eat.lth.se/aerosols2012
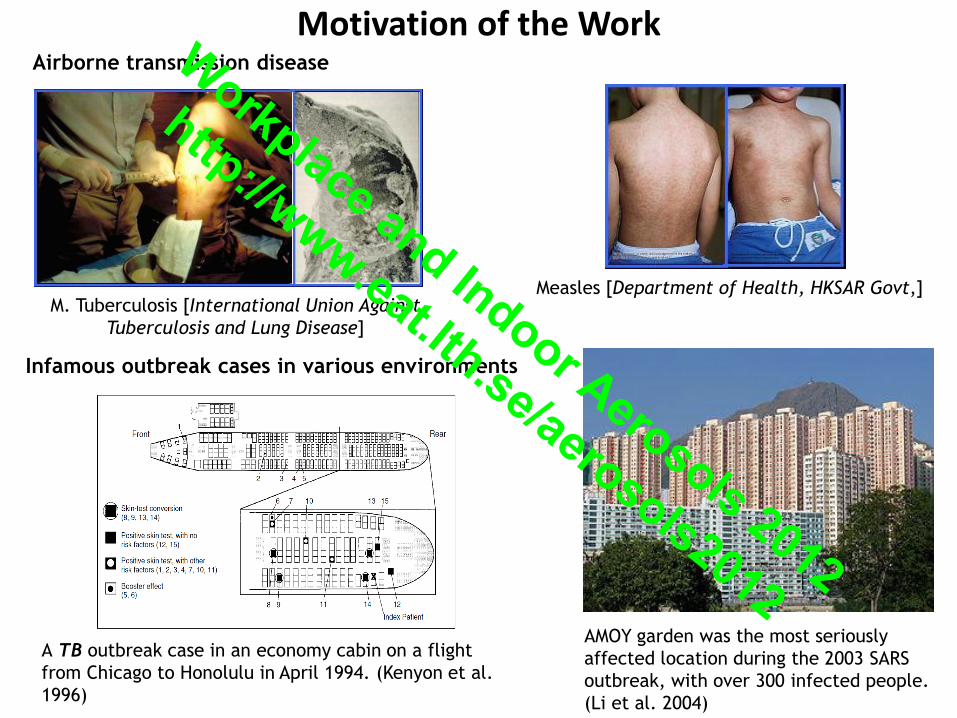
Motivation of the Work
AMOY garden was the most seriously
affected location during the 2003 SARS
outbreak, with over 300 infected people.
(Li et al. 2004)
A TB outbreak case in an economy cabin on a flight
from Chicago to Honolulu in April 1994. (Kenyon et al.
1996)
Infamous outbreak cases in various environments
Airborne transmission disease
M. Tuberculosis [International Union Against
Tuberculosis and Lung Disease]
Measles [Department of Health, HKSAR Govt,]
Workplace and Indoor Aerosols 2012
http://www.eat.lth.se/aerosols2012
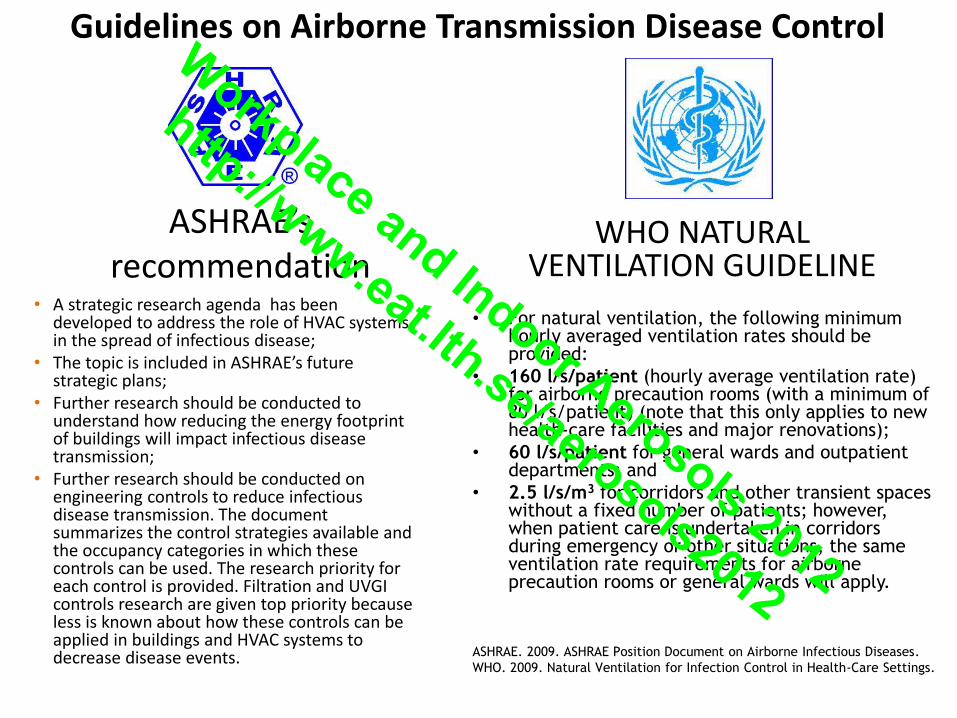
ASHRAE’s recommendation
• A strategic research agenda has been developed to address the role of HVAC systems in the spread of infectious disease;
• The topic is included in ASHRAE’s future strategic plans;
• Further research should be conducted to understand how reducing the energy footprint of buildings will impact infectious disease transmission;
• Further research should be conducted on engineering controls to reduce infectious disease transmission. The document summarizes the control strategies available and the occupancy categories in which these controls can be used. The research priority for each control is provided. Filtration and UVGI controls research are given top priority because less is known about how these controls can be applied in buildings and HVAC systems to decrease disease events.
WHO NATURAL VENTILATION GUIDELINE
ASHRAE. 2009. ASHRAE Position Document on Airborne Infectious Diseases.
WHO. 2009. Natural Ventilation for Infection Control in Health-Care Settings.
• For natural ventilation, the following minimum hourly averaged ventilation rates should be provided:
• 160 l/s/patient (hourly average ventilation rate) for airborne precaution rooms (with a minimum of 80 l/s/patient) (note that this only applies to new health-care facilities and major renovations);
• 60 l/s/patient for general wards and outpatient departments; and
• 2.5 l/s/m3 for corridors and other transient spaces without a fixed number of patients; however, when patient care is undertaken in corridors during emergency or other situations, the same ventilation rate requirements for airborne precaution rooms or general wards will apply.
Guidelines on Airborne Transmission Disease Control Workplace and Indoor Aerosols 2012
http://www.eat.lth.se/aerosols2012
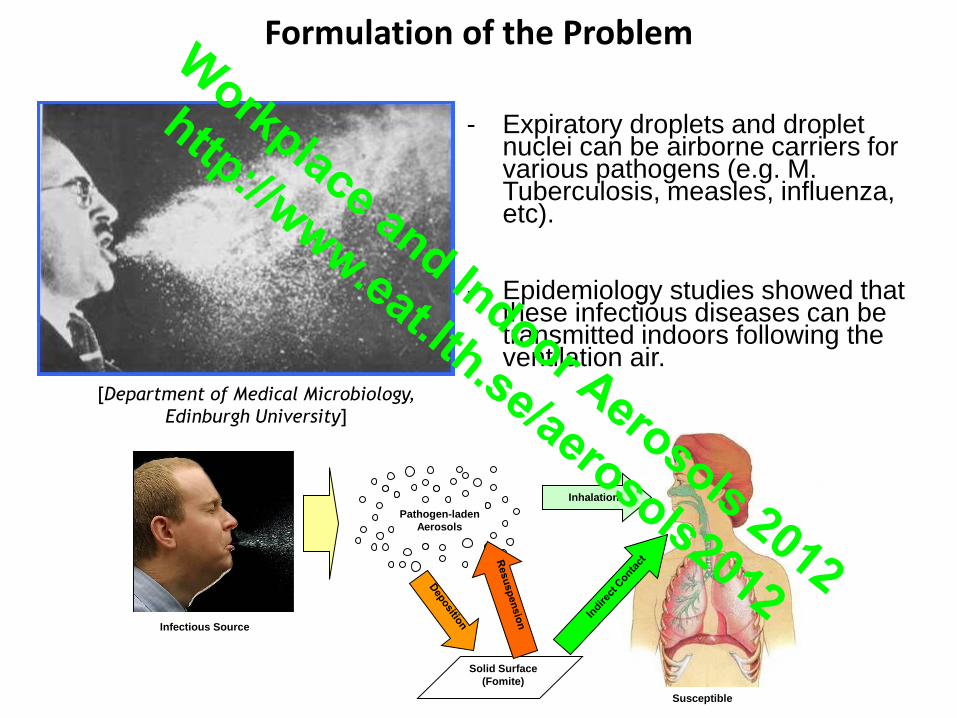
Formulation of the Problem
Infectious Source
Susceptible
Solid Surface
(Fomite)
Inhalation
Pathogen-laden
Aerosols
- Expiratory droplets and droplet nuclei can be airborne carriers for various pathogens (e.g. M. Tuberculosis, measles, influenza, etc).
- Epidemiology studies showed that these infectious diseases can be transmitted indoors following the ventilation air.
[Department of Medical Microbiology,
Edinburgh University]
Workplace and Indoor Aerosols 2012
http://www.eat.lth.se/aerosols2012
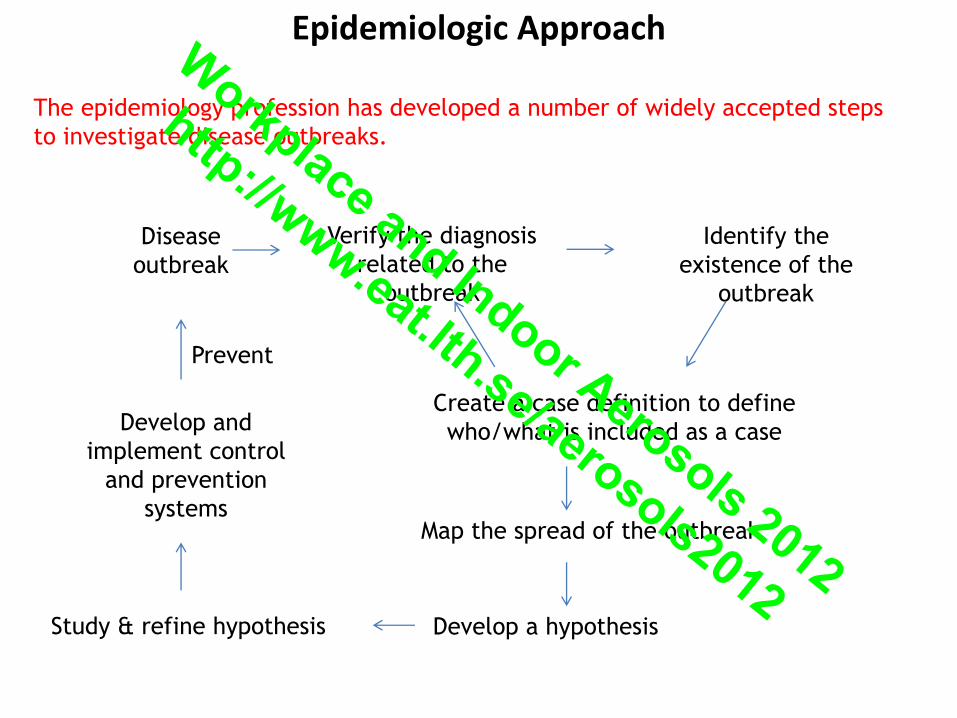
Epidemiologic Approach
The epidemiology profession has developed a number of widely accepted steps
to investigate disease outbreaks.
Verify the diagnosis
related to the
outbreak
Identify the
existence of the
outbreak
Create a case definition to define
who/what is included as a case
Map the spread of the outbreak
Develop a hypothesis Study & refine hypothesis
Disease
outbreak
Develop and
implement control
and prevention
systems
Prevent
Workplace and Indoor Aerosols 2012
http://www.eat.lth.se/aerosols2012
Study of airborne infectious disease
• Size distribution of the exhaled droplets
• How the droplets disperse?
• What are their fates? Deposited? Exhausted?
• Any chance to re-suspend from the surfaces?
• What is the infection risk?
• Any method to reduce the infection risk?
Workplace and Indoor Aerosols 2012
http://www.eat.lth.se/aerosols2012
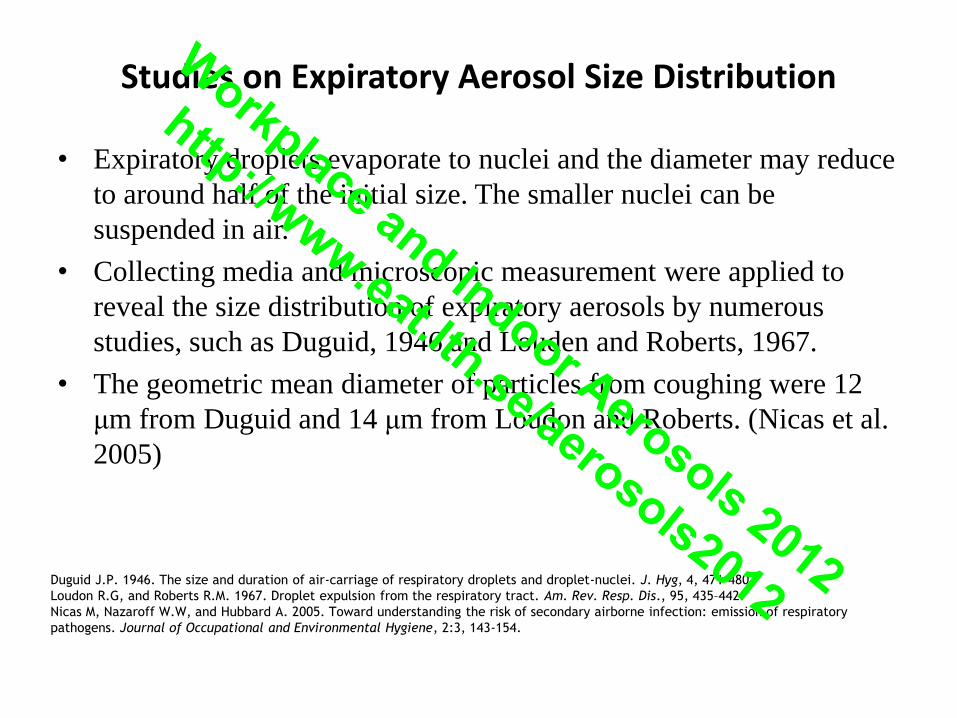
Studies on Expiratory Aerosol Size Distribution
• Expiratory droplets evaporate to nuclei and the diameter may reduce
to around half of the initial size. The smaller nuclei can be
suspended in air.
• Collecting media and microscopic measurement were applied to
reveal the size distribution of expiratory aerosols by numerous
studies, such as Duguid, 1946 and Louden and Roberts, 1967.
• The geometric mean diameter of particles from coughing were 12
μm from Duguid and 14 μm from Loudon and Roberts. (Nicas et al.
2005)
Duguid J.P. 1946. The size and duration of air-carriage of respiratory droplets and droplet-nuclei. J. Hyg, 4, 471–480.
Loudon R.G, and Roberts R.M. 1967. Droplet expulsion from the respiratory tract. Am. Rev. Resp. Dis., 95, 435–442.
Nicas M, Nazaroff W.W, and Hubbard A. 2005. Toward understanding the risk of secondary airborne infection: emission of respiratory
pathogens. Journal of Occupational and Environmental Hygiene, 2:3, 143-154.
Workplace and Indoor Aerosols 2012
http://www.eat.lth.se/aerosols2012
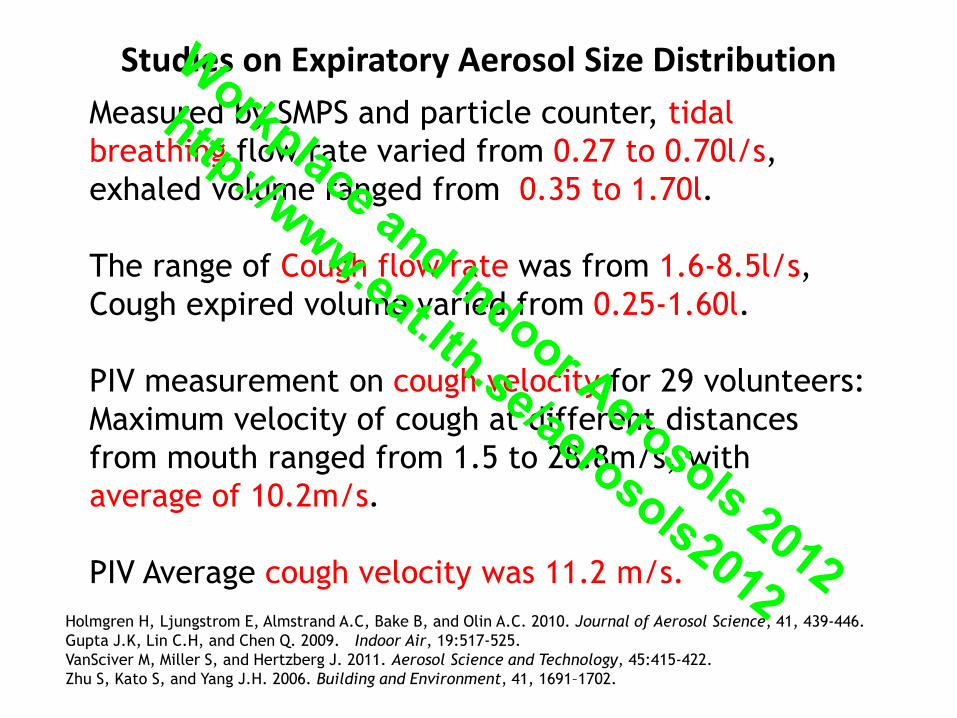
Measured by SMPS and particle counter, tidal
breathing flow rate varied from 0.27 to 0.70l/s,
exhaled volume ranged from 0.35 to 1.70l.
The range of Cough flow rate was from 1.6-8.5l/s,
Cough expired volume varied from 0.25-1.60l.
PIV measurement on cough velocity for 29 volunteers:
Maximum velocity of cough at different distances
from mouth ranged from 1.5 to 28.8m/s, with
average of 10.2m/s.
PIV Average cough velocity was 11.2 m/s.
Studies on Expiratory Aerosol Size Distribution
Holmgren H, Ljungstrom E, Almstrand A.C, Bake B, and Olin A.C. 2010. Journal of Aerosol Science, 41, 439-446.
Gupta J.K, Lin C.H, and Chen Q. 2009. Indoor Air, 19:517-525.
VanSciver M, Miller S, and Hertzberg J. 2011. Aerosol Science and Technology, 45:415-422.
Zhu S, Kato S, and Yang J.H. 2006. Building and Environment, 41, 1691–1702.
Workplace and Indoor Aerosols 2012
http://www.eat.lth.se/aerosols2012

Methods Size (μm)
Heymann et al. 1899 Solid impaction (glass slide with microscope) 30-500
Strauz et al. 1926 Solid impaction (glass slide with microscope) 70-85
Jennision, 1942 High-speed photography >100
Duguid et al. 1946 Solid impaction (glass slide with microscope) 100-125
Gerone et al. 1966 Solid impaction, Liquid impaction <1.0-1.0
Loudon et al. 1967 Solid impaction (paper with microscope) 55.5
Papineni et al. 1997 Optical particle counter <0.6
Fennelly et al. 2004 Solid impaction (multi-stages impactor) ≦3.3
Yang et al. 2007 APS, SMPS 0.62-15.9
Xie et al. 2009 Solid impaction (glass slide with microscope), Dust monitor 50-75
Wainwright et al. 2009 Solid impaction (multi-stages impactor) ≦3.3
Li et al. 2008 Solid impaction (glass slide with microscope), Dust monitor 50-100
Morawska et al. 2008 APS 0.1-1.0
Chao et al. 2009 IMI 4-8
Morawska et al. 2009 APS 0.4-10.0
Li et al. 2010 APS, IMI, microscope >50
Johnson et al. 2011 APS, droplet deposition analysis 0.7->20
Gralton J, Tovey E, McLaws M.L, and Rawlinson W.D. 2011. The role of particle size in aerosolised pathogen transmission: a
review. Journal of Infection, 62, 1-13.
Studies on Expiratory Aerosol Size Distribution Workplace and Indoor Aerosols 2012
http://www.eat.lth.se/aerosols2012
• Cough jet velocity
• Size distribution
– Interferometric Mie Imaging, APS, Droplet Deposition Analysis
– Evaporation of droplets
– Respiratory activities
– Origins
Studies on Expiratory Aerosol Size Distribution Workplace and Indoor Aerosols 2012
http://www.eat.lth.se/aerosols2012
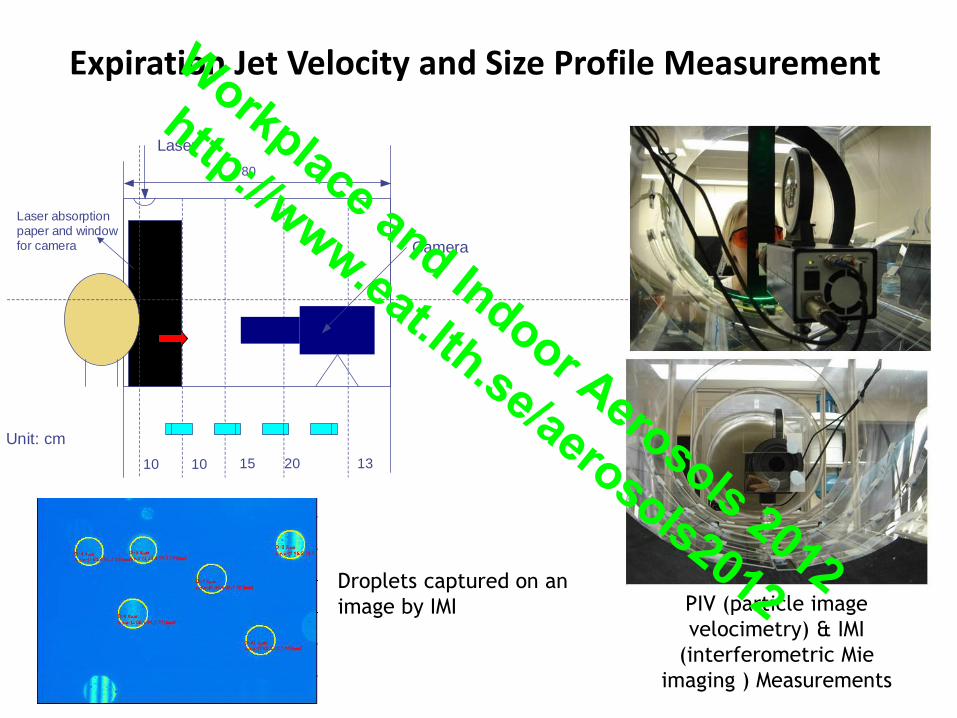
80
10 10 15 13
Laser
Laser absorption paper and window for camera
20
Unit: cm
Camera
Expiration Jet Velocity and Size Profile Measurement
PIV (particle image
velocimetry) & IMI
(interferometric Mie
imaging ) Measurements
Droplets captured on an
image by IMI
Workplace and Indoor Aerosols 2012
http://www.eat.lth.se/aerosols2012
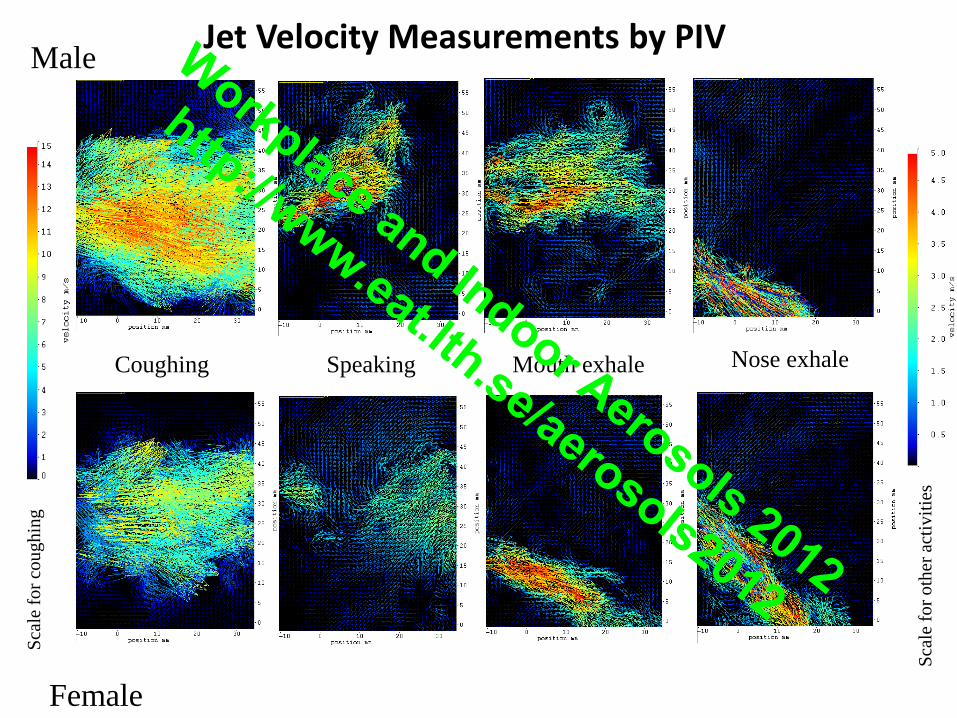
Coughing Speaking Mouth exhale Nose exhale
Sca
le f
or
cou
gh
ing
Sca
le f
or
oth
er a
ctiv
itie
s
Male
Female
Jet Velocity Measurements by PIV Workplace and Indoor Aerosols 2012
http://www.eat.lth.se/aerosols2012
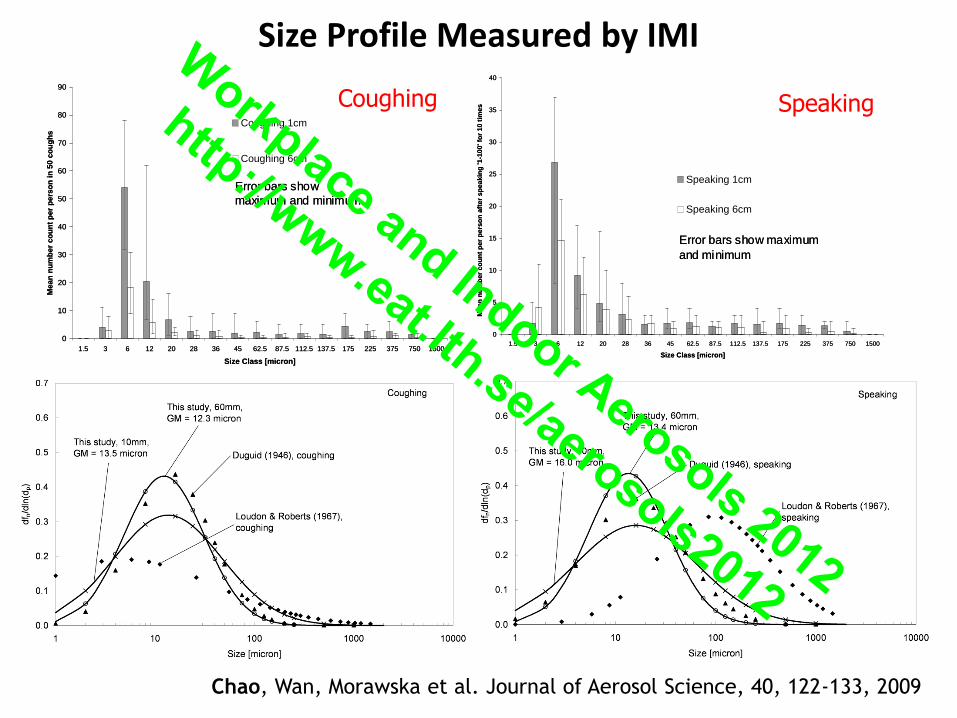
Size Profile Measured by IMI
0
10
20
30
40
50
60
70
80
90
1.5 3 6 12 20 28 36 45 62.5 87.5 112.5 137.5 175 225 375 750 1500
Size Class [micron]
Mea
n n
um
be
r c
ou
nt
pe
r p
ers
on
in
50
co
ug
hs
Coughing 1cm
Coughing 6cm
Error bars show
maximum and minimum
0
10
20
30
40
50
60
70
80
90
1.5 3 6 12 20 28 36 45 62.5 87.5 112.5 137.5 175 225 375 750 1500
Size Class [micron]
Mea
n n
um
be
r c
ou
nt
pe
r p
ers
on
in
50
co
ug
hs
Coughing 1cm
Coughing 6cm
Error bars show
maximum and minimum
0
5
10
15
20
25
30
35
40
1.5 3 6 12 20 28 36 45 62.5 87.5 112.5 137.5 175 225 375 750 1500
Size Class [micron]
Me
an
nu
mb
er
co
un
t p
er
pers
on
aft
er
sp
ea
kin
g '1
-10
0' fo
r 10
tim
es
Speaking 1cm
Speaking 6cm
Error bars show maximum
and minimum
0
5
10
15
20
25
30
35
40
1.5 3 6 12 20 28 36 45 62.5 87.5 112.5 137.5 175 225 375 750 1500
Size Class [micron]
Me
an
nu
mb
er
co
un
t p
er
pers
on
aft
er
sp
ea
kin
g '1
-10
0' fo
r 10
tim
es
Speaking 1cm
Speaking 6cm
Error bars show maximum
and minimum
Coughing Speaking
Chao, Wan, Morawska et al. Journal of Aerosol Science, 40, 122-133, 2009
Workplace and Indoor Aerosols 2012
http://www.eat.lth.se/aerosols2012
Exhaled droplets size modes
• Expiratory droplets generation modes
– Breathing: bronchiolar fluid film burst in the respiratory bronchioles (~0.8 μm)
– Laryngeal: vibration of the vocal folds in the larynx (~0.8-1.2 μm)
– Oral: large droplets form between the lips and the epiglottis where saliva is present (~200 μm)
• Coughing, speaking are combinations of the above modes
Johnson et al. Journal of Aerosol Science. 2011.
Morawska L, Johnson G.R, Ristovski Z.D, Hargreaves M, Mengersen K, Corbett S, Chao C.Y.H, Li Y, and
Katoshevski D. 2009. Journal of Aerosol Science, 40, 256-269.
Workplace and Indoor Aerosols 2012
http://www.eat.lth.se/aerosols2012
The Fate of the Exhaled Aerosols
• The expiratory droplets may evaporate to half of the initial size within a short time.
• Small droplets can be suspended in air for a long time. Large droplets settle on floor in a few seconds.
• Size change occurs during transport and deposition.
Workplace and Indoor Aerosols 2012
http://www.eat.lth.se/aerosols2012
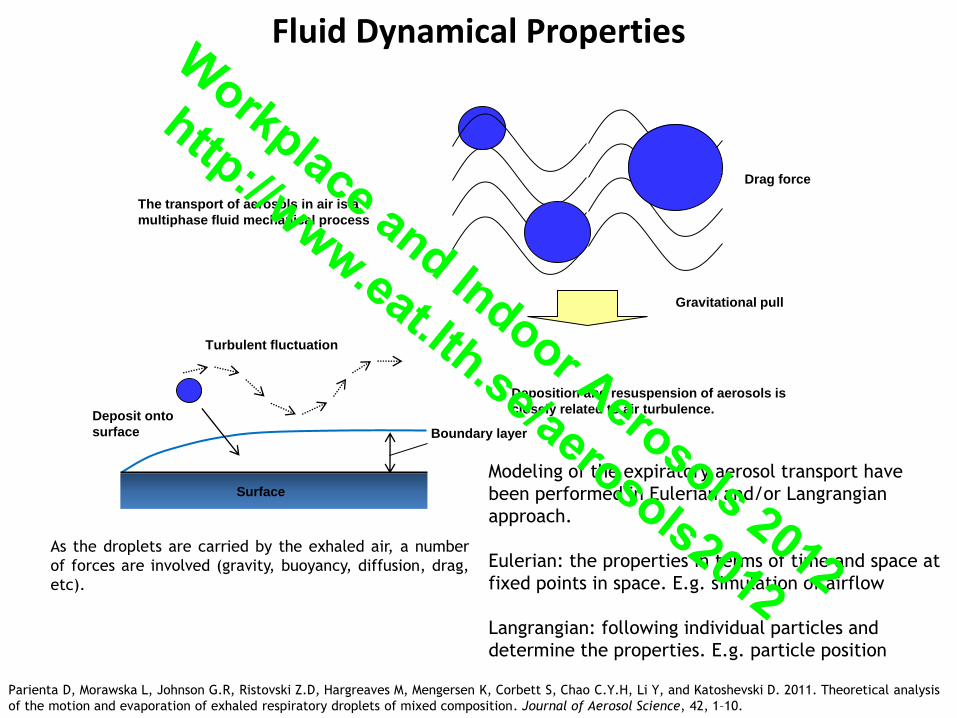
Fluid Dynamical Properties
Boundary layer
Surface
Drag force
Gravitational pull
Deposit onto
surface
Turbulent fluctuation
The transport of aerosols in air is a
multiphase fluid mechanical process
Deposition and resuspension of aerosols is
closely related to air turbulence.
As the droplets are carried by the exhaled air, a number
of forces are involved (gravity, buoyancy, diffusion, drag,
etc).
Parienta D, Morawska L, Johnson G.R, Ristovski Z.D, Hargreaves M, Mengersen K, Corbett S, Chao C.Y.H, Li Y, and Katoshevski D. 2011. Theoretical analysis
of the motion and evaporation of exhaled respiratory droplets of mixed composition. Journal of Aerosol Science, 42, 1–10.
Modeling of the expiratory aerosol transport have
been performed in Eulerian and/or Langrangian
approach.
Eulerian: the properties in terms of time and space at
fixed points in space. E.g. simulation of airflow
Langrangian: following individual particles and
determine the properties. E.g. particle position
Workplace and Indoor Aerosols 2012
http://www.eat.lth.se/aerosols2012
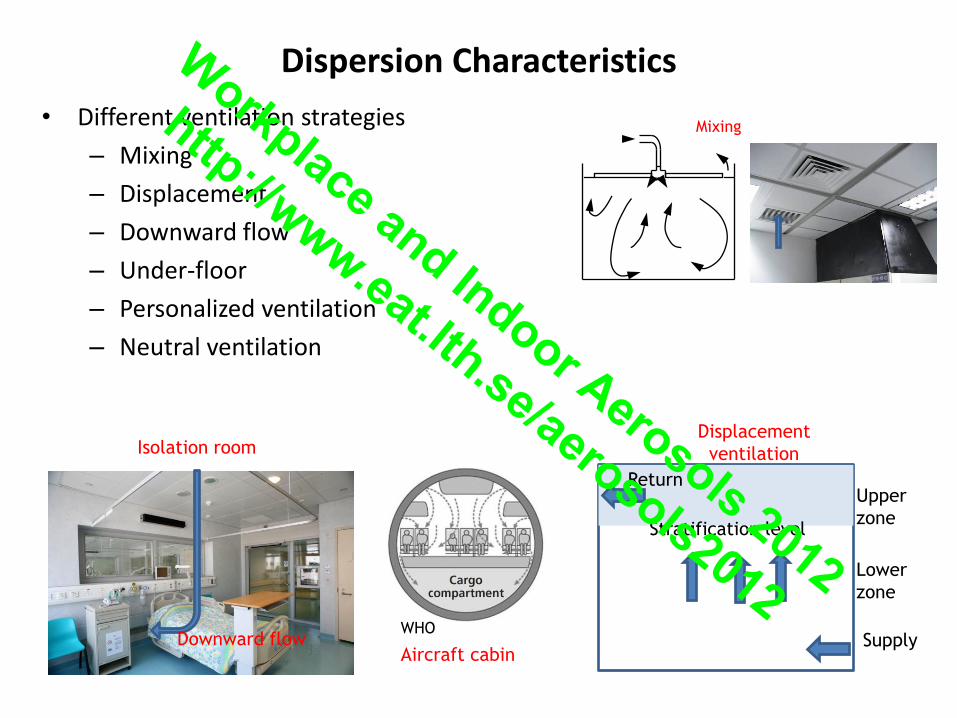
Dispersion Characteristics
• Different ventilation strategies
– Mixing
– Displacement
– Downward flow
– Under-floor
– Personalized ventilation
– Neutral ventilation
WHO
Displacement
ventilation
Mixing
Isolation room
Aircraft cabin Downward flow
Supply
Return
Stratification level
Upper
zone
Lower
zone
Workplace and Indoor Aerosols 2012
http://www.eat.lth.se/aerosols2012
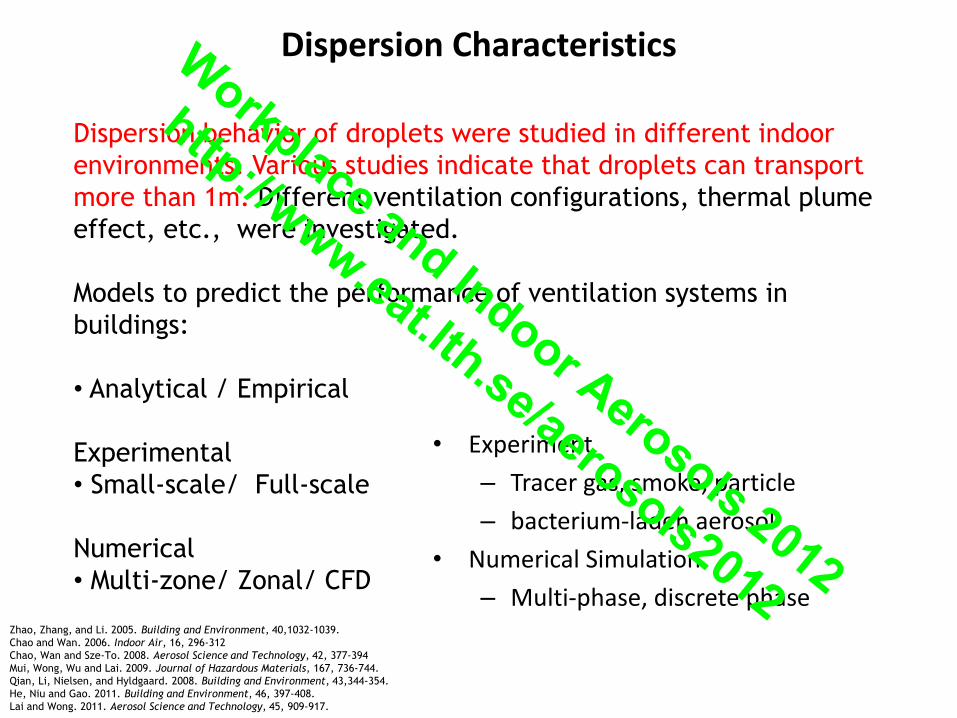
• Experiment
– Tracer gas, smoke, particle
– bacterium-laden aerosol
• Numerical Simulation
– Multi-phase, discrete phase Zhao, Zhang, and Li. 2005. Building and Environment, 40,1032-1039.
Chao and Wan. 2006. Indoor Air, 16, 296-312
Chao, Wan and Sze-To. 2008. Aerosol Science and Technology, 42, 377-394
Mui, Wong, Wu and Lai. 2009. Journal of Hazardous Materials, 167, 736-744.
Qian, Li, Nielsen, and Hyldgaard. 2008. Building and Environment, 43,344-354.
He, Niu and Gao. 2011. Building and Environment, 46, 397-408.
Lai and Wong. 2011. Aerosol Science and Technology, 45, 909-917.
Dispersion behavior of droplets were studied in different indoor
environments. Various studies indicate that droplets can transport
more than 1m. Different ventilation configurations, thermal plume
effect, etc., were investigated.
Models to predict the performance of ventilation systems in
buildings:
• Analytical / Empirical
Experimental
• Small-scale/ Full-scale
Numerical
• Multi-zone/ Zonal/ CFD
Dispersion Characteristics Workplace and Indoor Aerosols 2012
http://www.eat.lth.se/aerosols2012
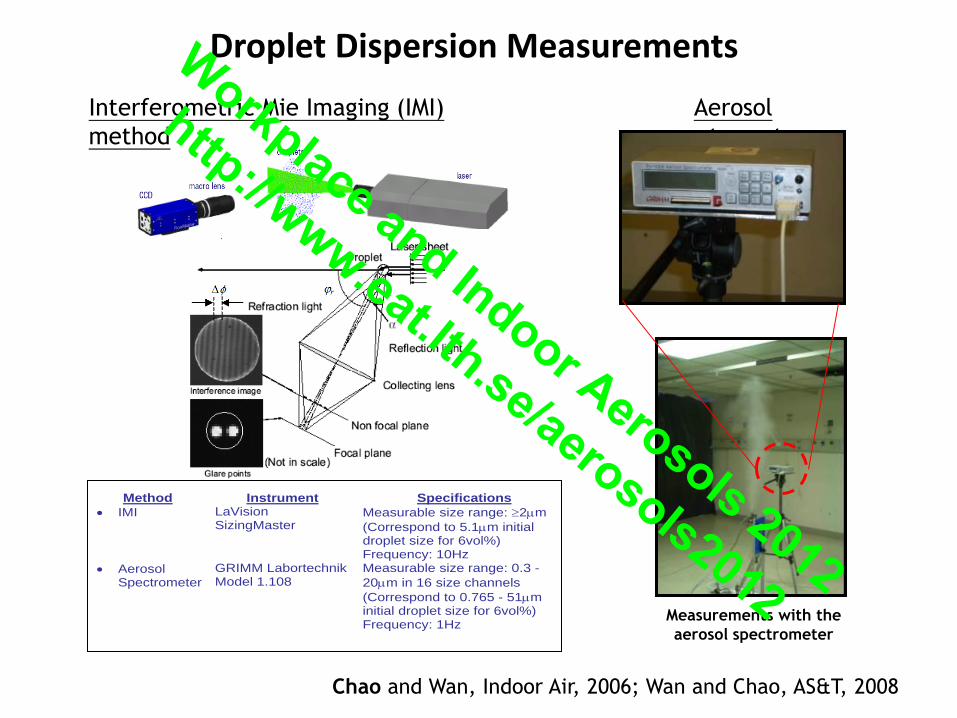
Droplet Dispersion Measurements
Interferometric Mie Imaging (IMI)
method
Aerosol
spectrometer
Method Instrument Specifications
IMI LaVision SizingMaster
Measurable size range: 2m
(Correspond to 5.1m initial droplet size for 6vol%) Frequency: 10Hz
Aerosol Spectrometer
GRIMM Labortechnik Model 1.108
Measurable size range: 0.3 -
20m in 16 size channels
(Correspond to 0.765 - 51m initial droplet size for 6vol%) Frequency: 1Hz
Measurements with the
aerosol spectrometer
Chao and Wan, Indoor Air, 2006; Wan and Chao, AS&T, 2008
Workplace and Indoor Aerosols 2012
http://www.eat.lth.se/aerosols2012
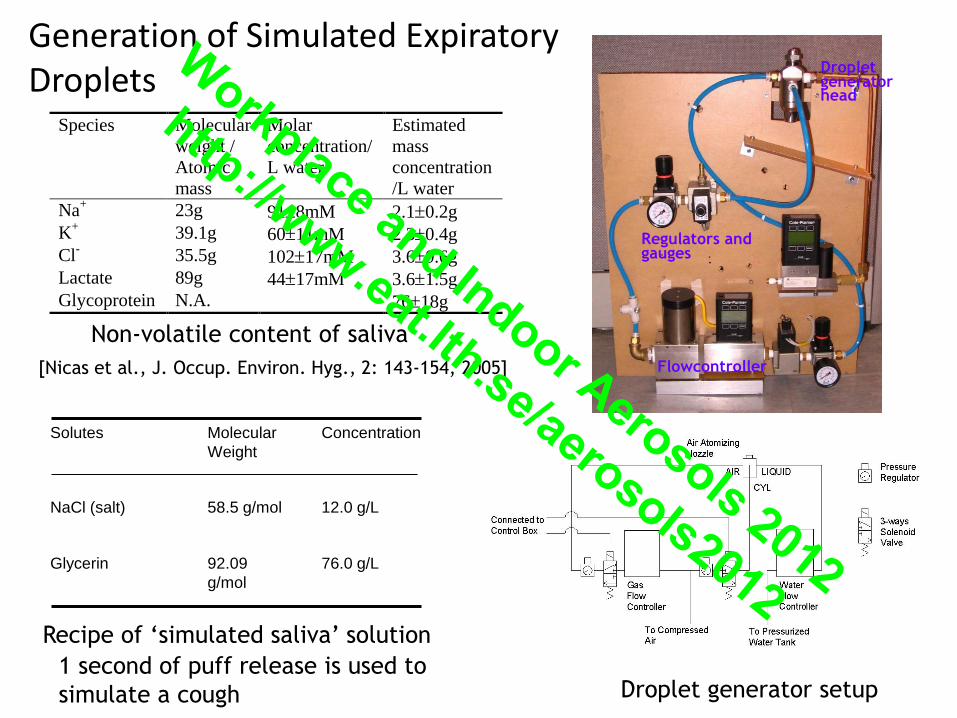
Generation of Simulated Expiratory Droplets
Droplet generator setup
Recipe of ‘simulated saliva’ solution
Regulators and gauges
Droplet generator head
Flowcontroller
Species Molecular
weight /
Atomic
mass
Molar
concentration/
L water
Estimated
mass
concentration
/L water
Na+ 23g 918mM 2.10.2g
K+
39.1g 6011mM 2.30.4g
Cl- 35.5g 10217mM 3.60.6g
Lactate 89g 4417mM 3.61.5g
Glycoprotein N.A. 7618g
Non-volatile content of saliva
[Nicas et al., J. Occup. Environ. Hyg., 2: 143-154, 2005]
Solutes
Molecular
Weight
Concentration
NaCl (salt)
58.5 g/mol
12.0 g/L
Glycerin
92.09
g/mol
76.0 g/L
1 second of puff release is used to
simulate a cough
Workplace and Indoor Aerosols 2012
http://www.eat.lth.se/aerosols2012
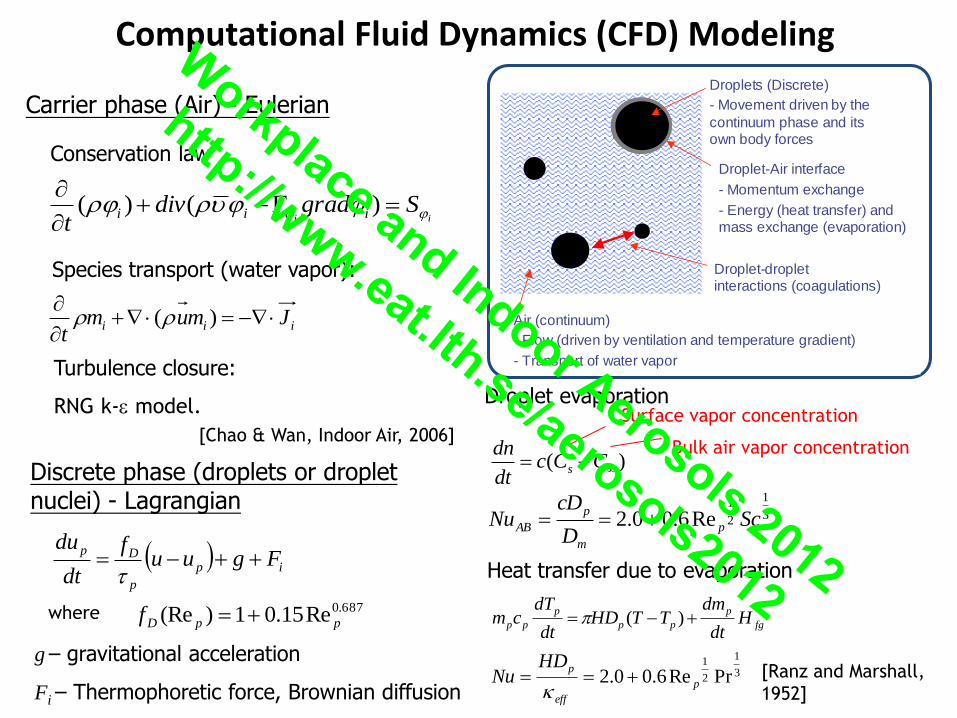
Computational Fluid Dynamics (CFD) Modeling
Discrete phase (droplets or droplet nuclei) - Lagrangian
g – gravitational acceleration
Fi – Thermophoretic force, Brownian diffusion
ip
p
DpFguu
f
dt
du
687.0Re15.01)(Re ppDf where
Droplet evaporation
)( CCcdt
dns
3
1
2
1
Re6.00.2 ScD
cDNu p
m
p
AB
Surface vapor concentration
Bulk air vapor concentration
Heat transfer due to evaporation
fg
p
pp
p
pp Hdt
dmTTHD
dt
dTcm )(
3
1
2
1
PrRe6.00.2 p
eff
pHDNu
[Ranz and Marshall,
1952]
Carrier phase (Air) - Eulerian
Conservation law
iii Jmumt
)(
Species transport (water vapor):
Turbulence closure:
RNG k- model.
[Chao & Wan, Indoor Air, 2006]
iiSgraddiv
tiii
)()(
Air (continuum)
- Flow (driven by ventilation and temperature gradient)
- Transport of water vapor
Droplets (Discrete)
- Movement driven by the
continuum phase and its own body forces
Droplet-Air interface
- Momentum exchange
- Energy (heat transfer) and mass exchange (evaporation)
Droplet-droplet interactions (coagulations)
Workplace and Indoor Aerosols 2012
http://www.eat.lth.se/aerosols2012
Modeling Approach
Stochastic tracking of turbulent motions
'uuu Carrier phase instantaneous
velocity
The particle under the influence of the same eddy
until
1) t > Te (eddy lifetime)
2) d(t) > Le (eddy length scale),
time needed = Tcross (eddy crossing time)
[Gosman & Ioannides, 1981]
u
up0
d(t1)
xp0
xp1
xp0 + ut1
2Le
Time = 0 Time = t1
Fluid flow path
particle flow path
u
up0
d(t1)
xp0
xp1
xp0 + ut1
2Le
Time = 0 Time = t1
Fluid flow path
particle flow path
2'' uu
The fluctuating part
Where is a random number sampled from a
Gaussian pdf with zero mean, unit variance
3
2'2
ku and
[ Crowe et al., 1998; Graham, 1996 ; Lu, 1995; Wang & James, 1999]
Near wall correction for turbulence anisotropy
2'' ufu v )1( 02.0 y
v efwhere
keuk y 202.02 )1('2
3'
define
kewvu y
3
2)1(''' 02.0222
For y+ 80
Workplace and Indoor Aerosols 2012
http://www.eat.lth.se/aerosols2012
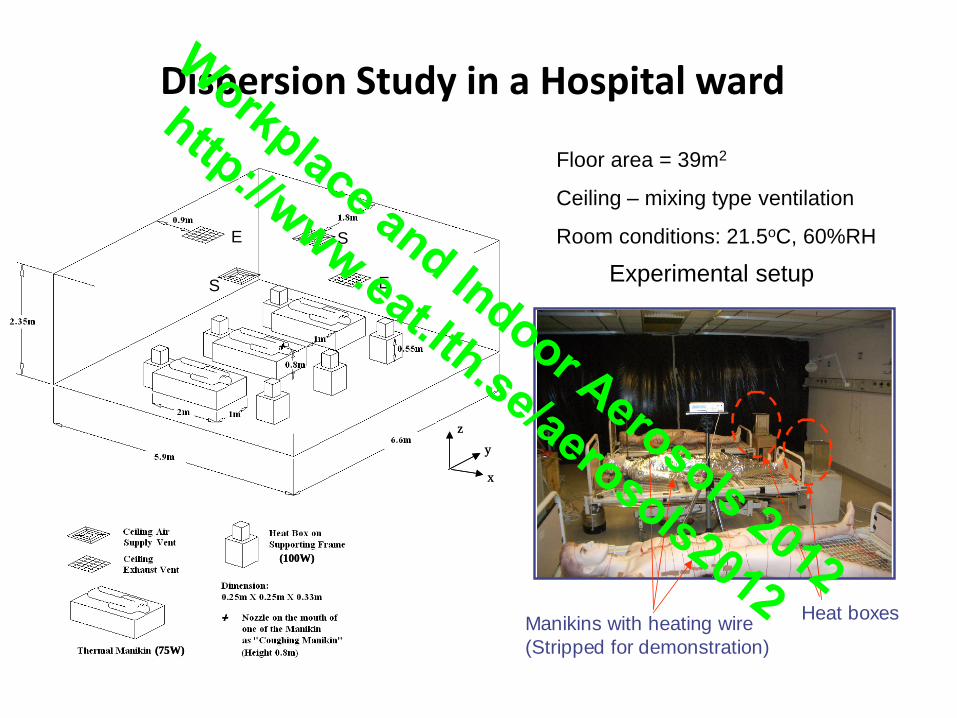
Dispersion Study in a Hospital ward
Experimental setup
Floor area = 39m2
Ceiling – mixing type ventilation
Room conditions: 21.5oC, 60%RH
Manikins with heating wire
(Stripped for demonstration)
Heat boxes
(75W)
(100W)
(75W)
(100W)
(75W)
(100W)
S
SE
E
y
x
z
y
x
z
(75W)
(100W)
(75W)
(100W)
(75W)
(100W)
S
SE
E
y
x
z
y
x
z
(75W)
(100W)
(75W)
(100W)
(75W)
(100W)
S
SE
E
y
x
z
y
x
z
Workplace and Indoor Aerosols 2012
http://www.eat.lth.se/aerosols2012
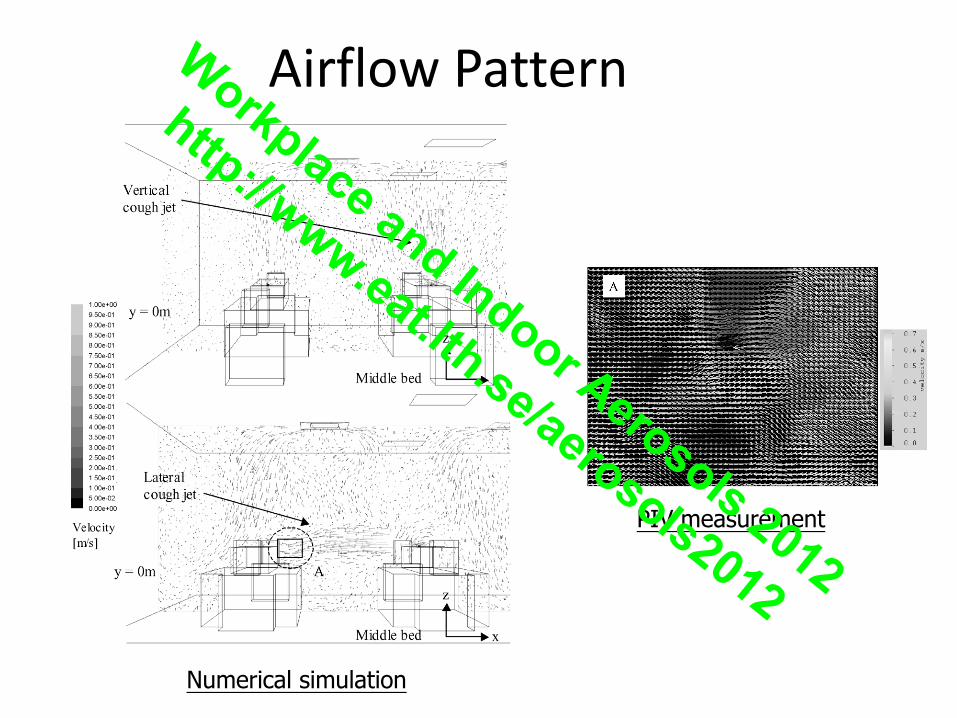
Airflow Pattern
Numerical simulation
PIV measurement
Workplace and Indoor Aerosols 2012
http://www.eat.lth.se/aerosols2012
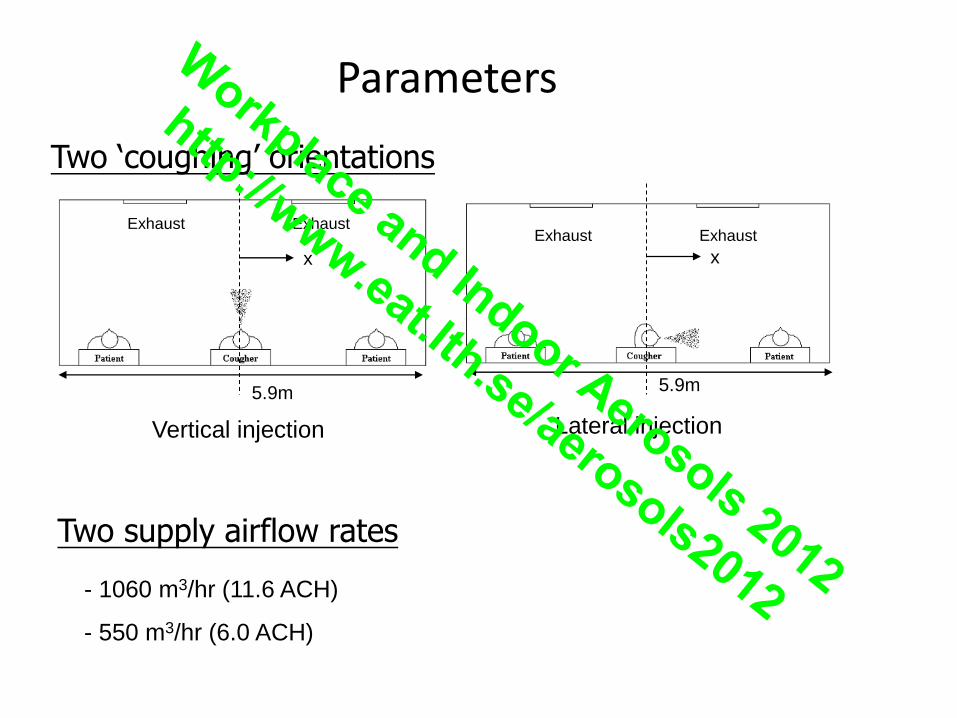
Parameters
Exhaust Exhaust Exhaust Exhaust
Vertical injection Lateral injection
x x
5.9m 5.9m
Two ‘coughing’ orientations
Two supply airflow rates
- 1060 m3/hr (11.6 ACH)
- 550 m3/hr (6.0 ACH)
Workplace and Indoor Aerosols 2012
http://www.eat.lth.se/aerosols2012
0
0.2
0.4
0.6
0.8
1
1.2
1.4
1.6
1.8
2
2.2
1 10 100 1000
Time after the 'cough', t [s]
Me
an
vert
ica
l po
sitio
n, z [m
]
1.5 micron, exp, 11.6 ACH 12 micron, exp, 11.6 ACH1.5 micron, num, 11.6 ACH1.5 micron, num, 6.0 ACH12 micron, num, 11.6 ACH12 micron, num, 6.0 ACH
0
0.2
0.4
0.6
0.8
1
1.2
1.4
1.6
1.8
2
2.2
1 10 100 1000
Time after the 'cough', t [s]
Me
an
ve
rtic
al p
ositio
n,
z [m
]
28 micron, exp, 11.6 ACH
45 micron, exp, 11.6 ACH
28 micron, num, 11.6 ACH
28 micron, num, 6.0 ACH
45 micron, num, 11.6 ACH
45 micron, num, 6.0 ACH
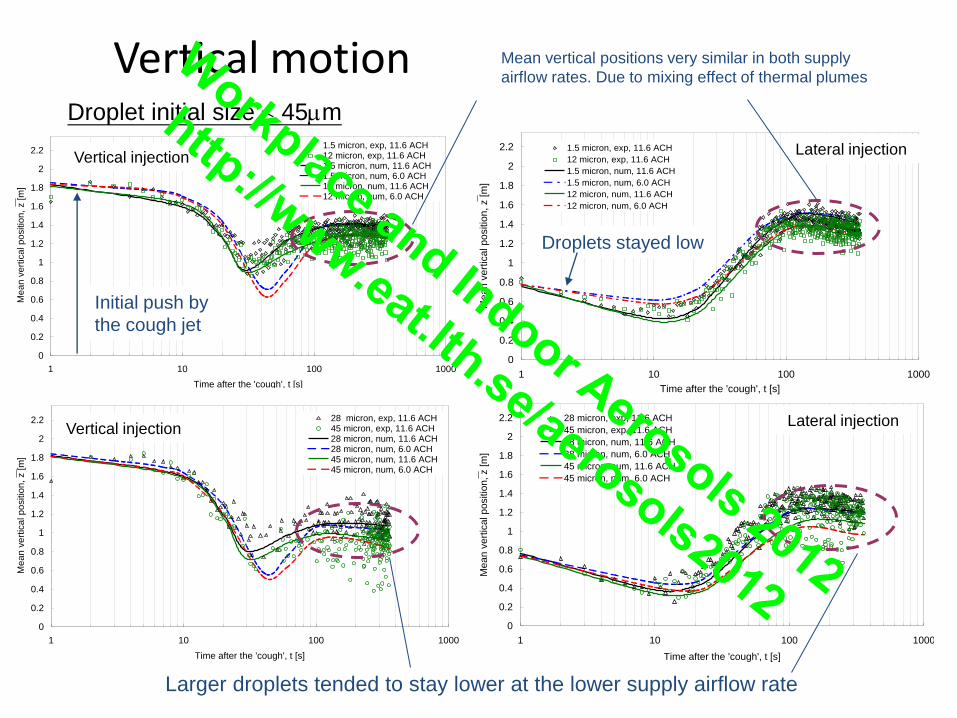
Vertical motion Droplet initial size 45m
0
0.2
0.4
0.6
0.8
1
1.2
1.4
1.6
1.8
2
2.2
1 10 100 1000
Time after the 'cough', t [s]
Me
an
vert
ica
l po
sitio
n, z [m
]
28 micron, exp, 11.6 ACH45 micron, exp, 11.6 ACH 28 micron, num, 11.6 ACH28 micron, num, 6.0 ACH45 micron, num, 11.6 ACH45 micron, num, 6.0 ACH
0
0.2
0.4
0.6
0.8
1
1.2
1.4
1.6
1.8
2
2.2
1 10 100 1000
Time after the 'cough', t [s]
Mean
ve
rtic
al po
sitio
n, z [m
]
1.5 micron, exp, 11.6 ACH
12 micron, exp, 11.6 ACH
1.5 micron, num, 11.6 ACH
1.5 micron, num, 6.0 ACH
12 micron, num, 11.6 ACH
12 micron, num, 6.0 ACH
Mean vertical positions very similar in both supply
airflow rates. Due to mixing effect of thermal plumes
Larger droplets tended to stay lower at the lower supply airflow rate
Vertical injection
Vertical injection
Lateral injection
Lateral injection
Droplets stayed low
Initial push by
the cough jet
Workplace and Indoor Aerosols 2012
http://www.eat.lth.se/aerosols2012
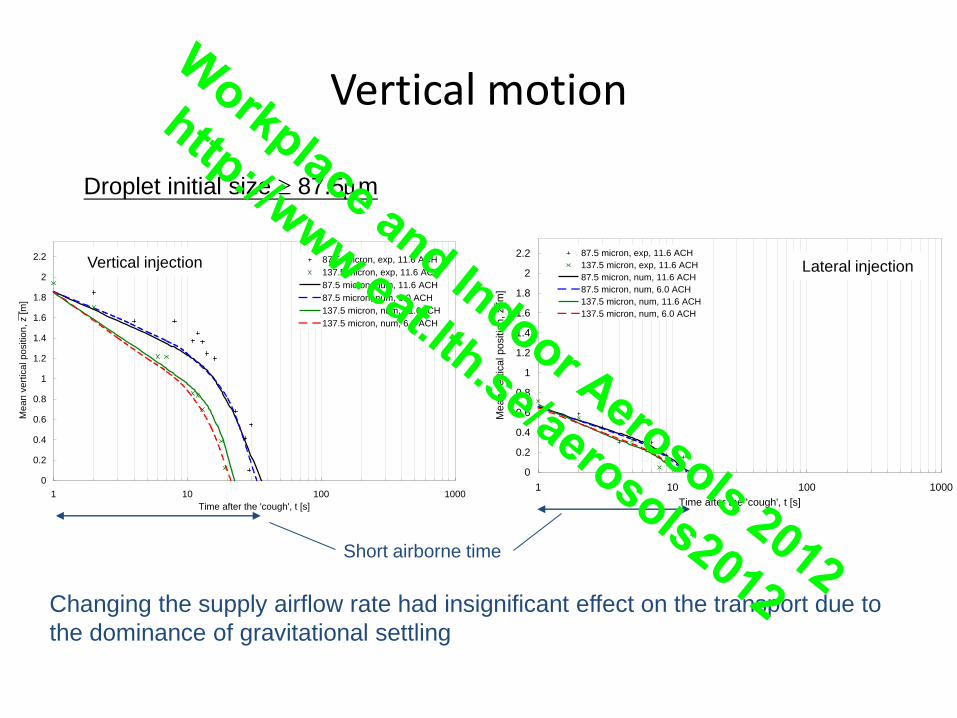
Vertical motion
Droplet initial size 87.5m
0
0.2
0.4
0.6
0.8
1
1.2
1.4
1.6
1.8
2
2.2
1 10 100 1000
Time after the 'cough', t [s]
Me
an
vert
ica
l po
sitio
n, z [m
]
87.5 micron, exp, 11.6 ACH
137.5 micron, exp, 11.6 ACH
87.5 micron, num, 11.6 ACH
87.5 micron, num, 6.0 ACH
137.5 micron, num, 11.6ACH
137.5 micron, num, 6.0 ACH
0
0.2
0.4
0.6
0.8
1
1.2
1.4
1.6
1.8
2
2.2
1 10 100 1000
Time after the 'cough', t [s]M
ea
n v
ert
ica
l p
ositio
n,
z [
m]
87.5 micron, exp, 11.6 ACH
137.5 micron, exp, 11.6 ACH
87.5 micron, num, 11.6 ACH
87.5 micron, num, 6.0 ACH
137.5 micron, num, 11.6 ACH
137.5 micron, num, 6.0 ACH
Vertical injection Lateral injection
Changing the supply airflow rate had insignificant effect on the transport due to
the dominance of gravitational settling
Short airborne time
Workplace and Indoor Aerosols 2012
http://www.eat.lth.se/aerosols2012
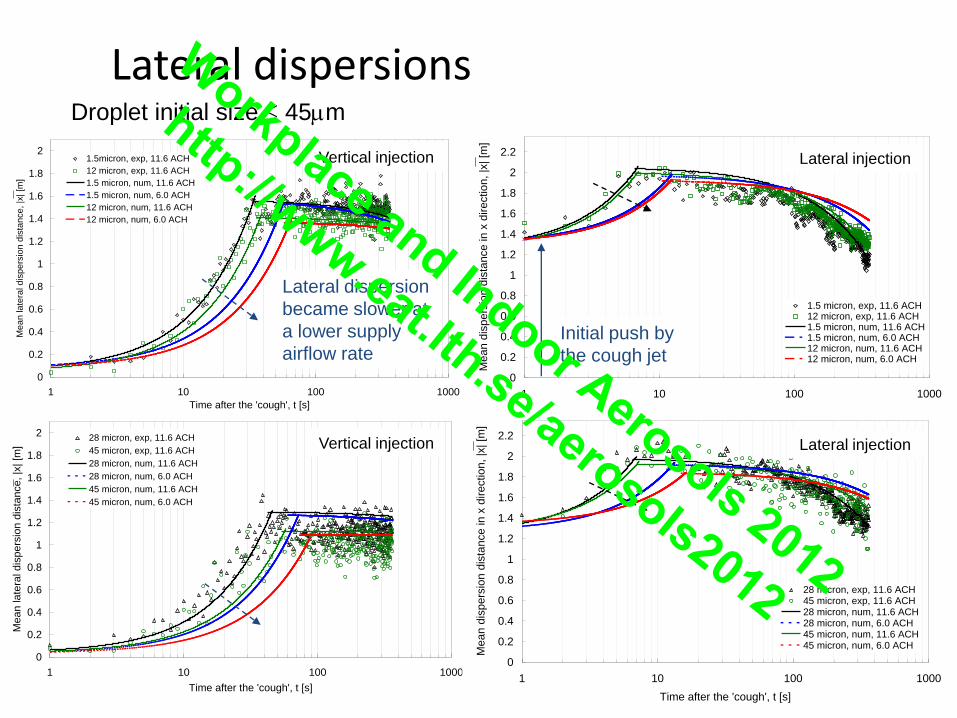
Lateral dispersions Droplet initial size 45m
0
0.2
0.4
0.6
0.8
1
1.2
1.4
1.6
1.8
2
1 10 100 1000
Time after the 'cough', t [s]
Me
an
la
tera
l d
isp
ers
ion
dis
tan
ce
, |x
| [m
]
28 micron, exp, 11.6 ACH
45 micron, exp, 11.6 ACH
28 micron, num, 11.6 ACH
28 micron, num, 6.0 ACH
45 micron, num, 11.6 ACH
45 micron, num, 6.0 ACH
0
0.2
0.4
0.6
0.8
1
1.2
1.4
1.6
1.8
2
2.2
1 10 100 1000
Time after the 'cough', t [s]
Me
an
dis
pe
rsio
n d
ista
nce
in
x d
ire
ctio
n,
|x| [m
]
1.5 micron, exp, 11.6 ACH12 micron, exp, 11.6 ACH1.5 micron, num, 11.6 ACH1.5 micron, num, 6.0 ACH12 micron, num, 11.6 ACH12 micron, num, 6.0 ACH
0
0.2
0.4
0.6
0.8
1
1.2
1.4
1.6
1.8
2
1 10 100 1000
Time after the 'cough', t [s]
Mea
n late
ral d
ispe
rsio
n d
ista
nce
, |x
| [m
]
1.5micron, exp, 11.6 ACH
12 micron, exp, 11.6 ACH
1.5 micron, num, 11.6 ACH
1.5 micron, num, 6.0 ACH
12 micron, num, 11.6 ACH
12 micron, num, 6.0 ACH
0
0.2
0.4
0.6
0.8
1
1.2
1.4
1.6
1.8
2
2.2
1 10 100 1000
Time after the 'cough', t [s]
Me
an
dis
pe
rsio
n d
ista
nce
in
x d
ire
ctio
n,
|x| [m
]
28 micron, exp, 11.6 ACH45 micron, exp, 11.6 ACH28 micron, num, 11.6 ACH28 micron, num, 6.0 ACH45 micron, num, 11.6 ACH45 micron, num, 6.0 ACH
Lateral dispersion
became slower at
a lower supply
airflow rate
Vertical injection Lateral injection
Vertical injection Lateral injection
Initial push by
the cough jet
Workplace and Indoor Aerosols 2012
http://www.eat.lth.se/aerosols2012
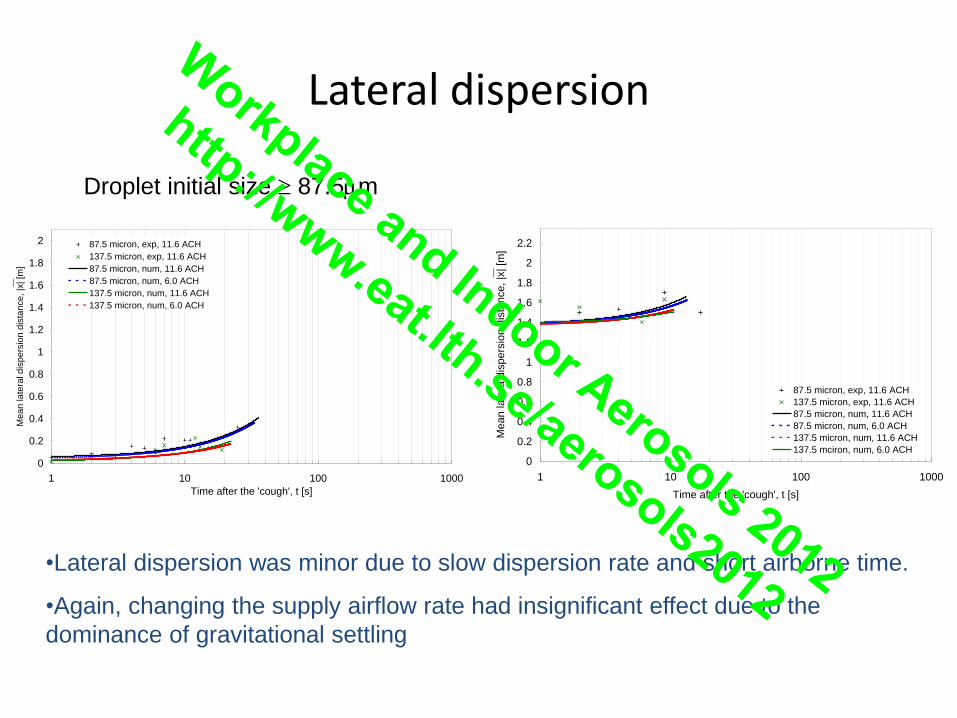
Lateral dispersion
Droplet initial size 87.5m
0
0.2
0.4
0.6
0.8
1
1.2
1.4
1.6
1.8
2
1 10 100 1000
Time after the 'cough', t [s]
Me
an
la
tera
l d
isp
ers
ion
dis
tan
ce
, |x
| [m
]
87.5 micron, exp, 11.6 ACH
137.5 micron, exp, 11.6 ACH
87.5 micron, num, 11.6 ACH
87.5 micron, num, 6.0 ACH
137.5 micron, num, 11.6 ACH
137.5 micron, num, 6.0 ACH
0
0.2
0.4
0.6
0.8
1
1.2
1.4
1.6
1.8
2
2.2
1 10 100 1000
Time after the 'cough', t [s]M
ea
n la
tera
dis
pe
rsio
n d
ista
nce
, |x
| [m
]
87.5 micron, exp, 11.6 ACH
137.5 micron, exp, 11.6 ACH
87.5 micron, num, 11.6 ACH
87.5 micron, num, 6.0 ACH
137.5 micron, num, 11.6 ACH
137.5 mciron, num, 6.0 ACH
•Lateral dispersion was minor due to slow dispersion rate and short airborne time.
•Again, changing the supply airflow rate had insignificant effect due to the
dominance of gravitational settling
Workplace and Indoor Aerosols 2012
http://www.eat.lth.se/aerosols2012
Droplet Dispersion in Aircraft Cabin (DTU Study)
‘Coughing’ point
200 L/s
100 L/s 20 L/s
Y
Workplace and Indoor Aerosols 2012
http://www.eat.lth.se/aerosols2012
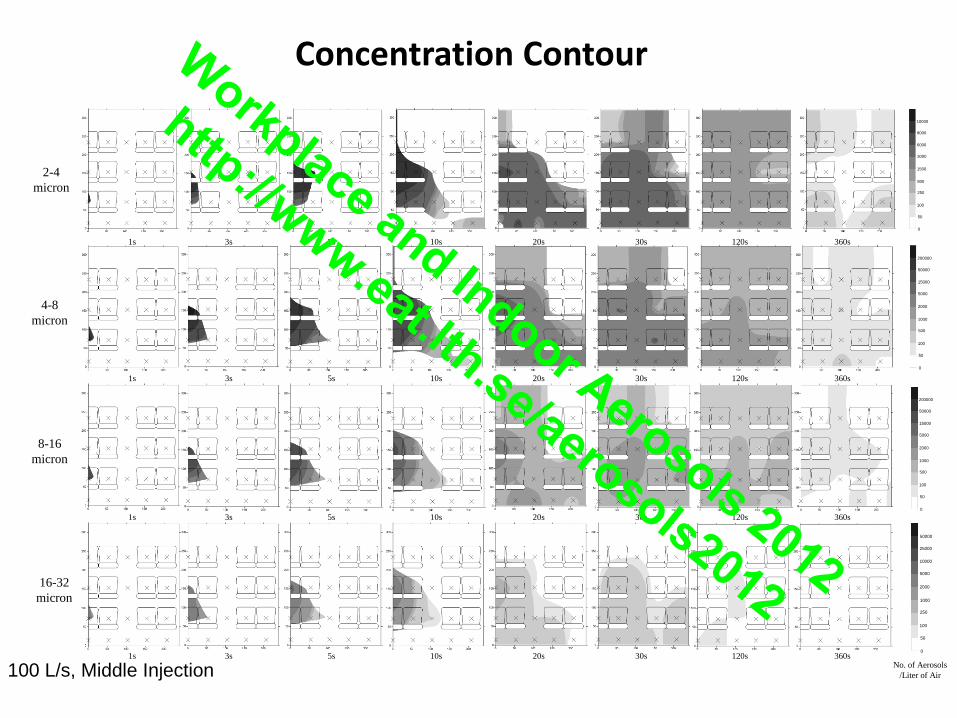
Concentration Contour
No. of Aerosols
/Liter of Air
1s 3s 5s 10s 20s 30s 120s 360s
1s 3s 5s 10s 20s 30s 120s 360s
1s 3s 5s 10s 20s 30s 120s 360s
1s 3s 5s 10s 20s 30s 120s 360s
4-8
micron
16-32
micron
2-4
micron
8-16
micron
50
0
100
250
800
1500
3000
6000
8000
10000
50
0
100
500
1000
2000
5000
15000
50000
200000
50
0
100
500
1000
2000
5000
15000
50000
200000
50
0
100
250
1000
2000
5000
10000
25000
50000
100 L/s, Middle Injection
Workplace and Indoor Aerosols 2012
http://www.eat.lth.se/aerosols2012
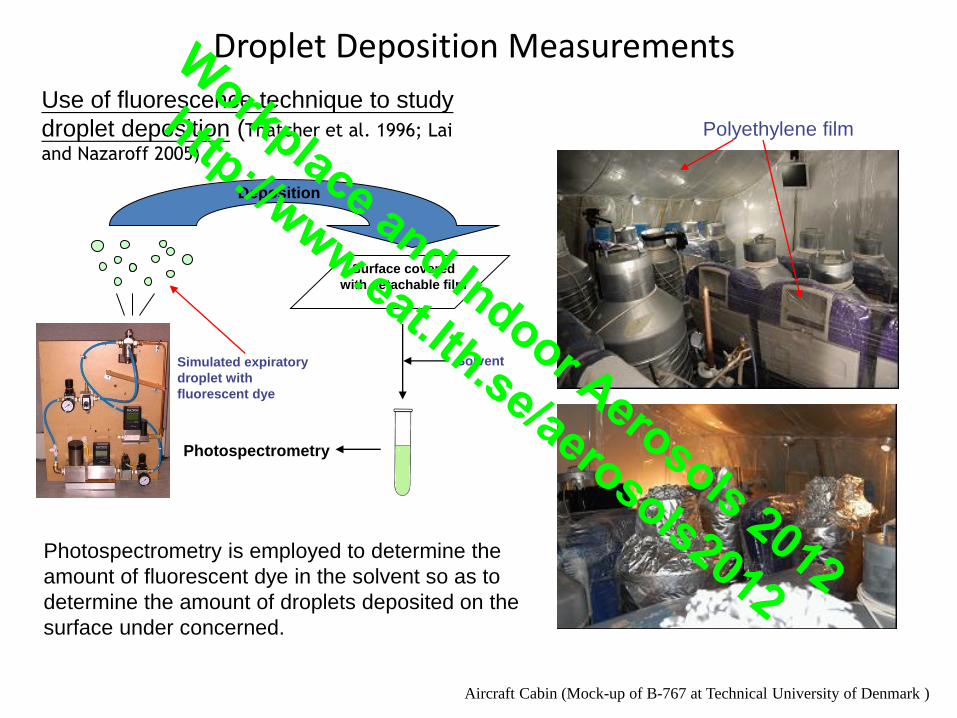
Droplet Deposition Measurements
Use of fluorescence technique to study
droplet deposition (Thatcher et al. 1996; Lai
and Nazaroff 2005)
Polyethylene film
Simulated expiratory
droplet with
fluorescent dye
Surface covered
with detachable film
Deposition
Solvent
Photospectrometry
Photospectrometry is employed to determine the
amount of fluorescent dye in the solvent so as to
determine the amount of droplets deposited on the
surface under concerned.
Aircraft Cabin (Mock-up of B-767 at Technical University of Denmark )
Workplace and Indoor Aerosols 2012
http://www.eat.lth.se/aerosols2012
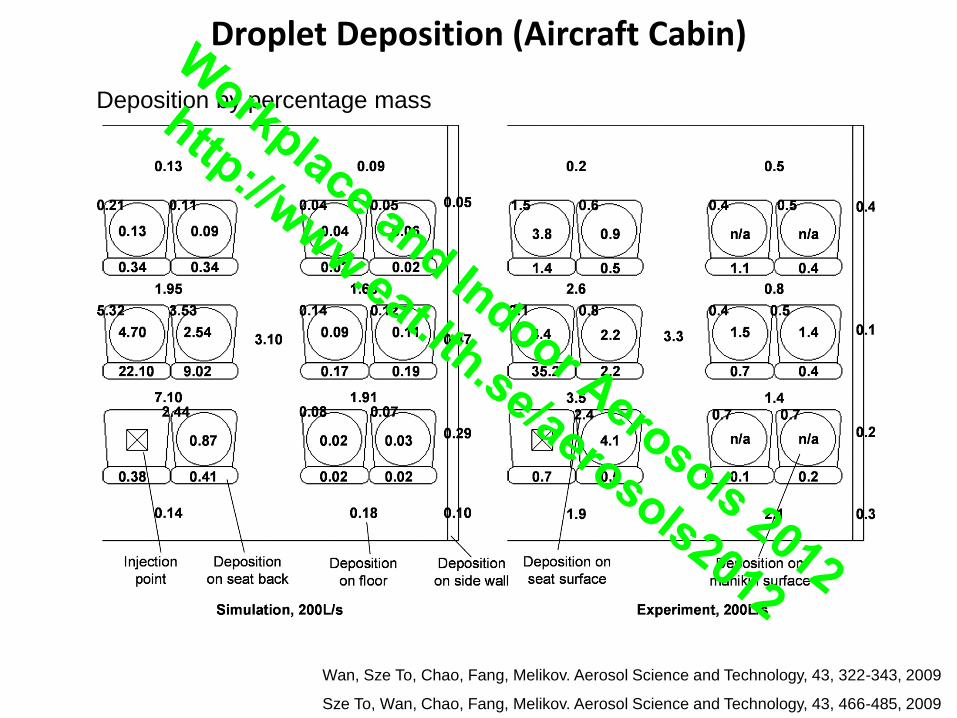
Droplet Deposition (Aircraft Cabin)
Deposition by percentage mass
Wan, Sze To, Chao, Fang, Melikov. Aerosol Science and Technology, 43, 322-343, 2009
Sze To, Wan, Chao, Fang, Melikov. Aerosol Science and Technology, 43, 466-485, 2009
Workplace and Indoor Aerosols 2012
http://www.eat.lth.se/aerosols2012
Exposure and Infection Risk Assessment for Respiratory Diseases
Generation Exposure Transport
Intake (Respiratory
Deposition)
Air Turbulence
-Air turbulence plays an important role on both the
transport and intake of aerosolized pathogen;
-Any estimated exposure level to aerosolized
pathogens should be regarded as an expected value
rather than an exact value;
-Exposure and/or risk assessment models should be
able to consider these randomness.
Workplace and Indoor Aerosols 2012
http://www.eat.lth.se/aerosols2012
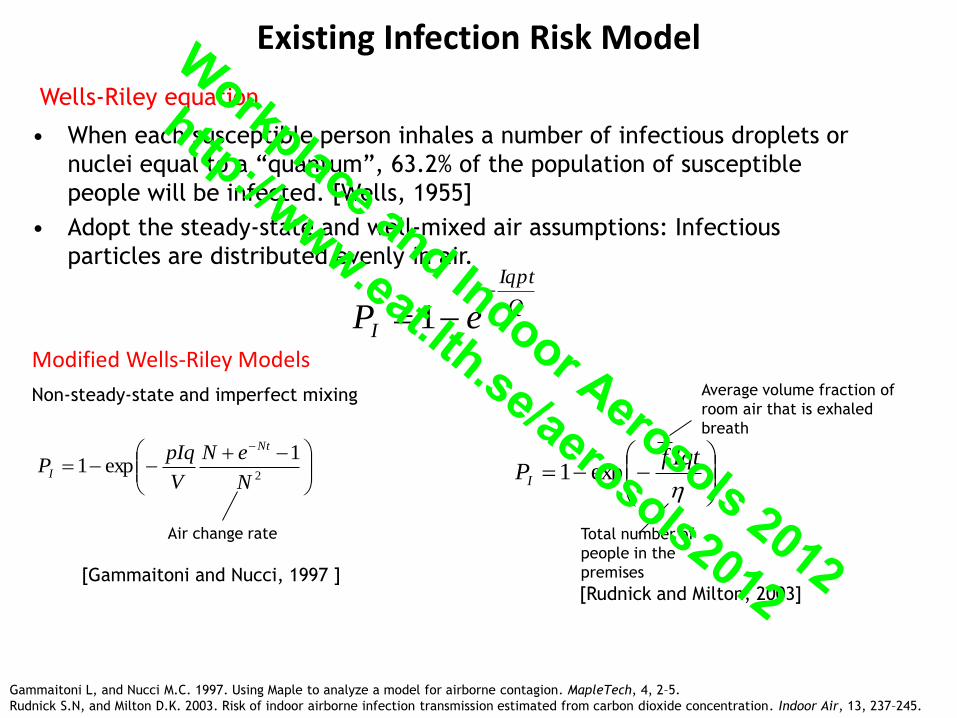
Modified Wells-Riley Models
Existing Infection Risk Model
Wells-Riley equation
• When each susceptible person inhales a number of infectious droplets or
nuclei equal to a “quantum”, 63.2% of the population of susceptible
people will be infected. [Wells, 1955]
• Adopt the steady-state and well-mixed air assumptions: Infectious
particles are distributed evenly in air.
Q
Iqpt
I eP
1
Non-steady-state and imperfect mixing
[Gammaitoni and Nucci, 1997 ]
Air change rate Total number of
people in the
premises
Average volume fraction of
room air that is exhaled
breath
[Rudnick and Milton, 2003]
2
1exp1
N
eN
V
pIqP
Nt
I
IqtfPI exp1
Gammaitoni L, and Nucci M.C. 1997. Using Maple to analyze a model for airborne contagion. MapleTech, 4, 2–5.
Rudnick S.N, and Milton D.K. 2003. Risk of indoor airborne infection transmission estimated from carbon dioxide concentration. Indoor Air, 13, 237–245.
Workplace and Indoor Aerosols 2012
http://www.eat.lth.se/aerosols2012
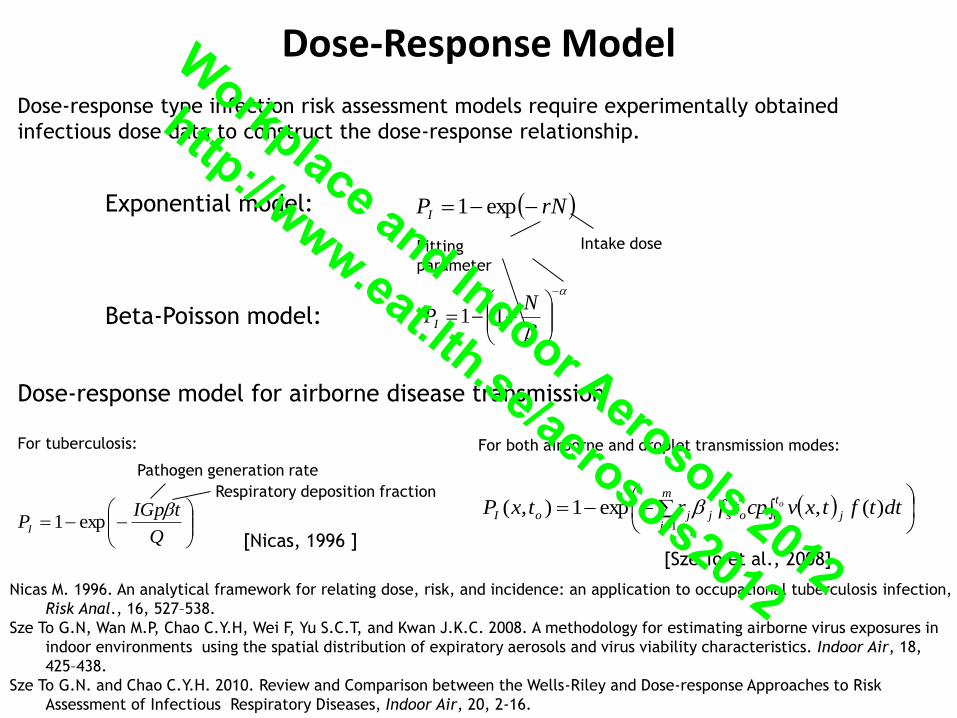
Dose-Response Model
[Nicas, 1996 ]
For tuberculosis:
Pathogen generation rate
[Sze To et al., 2008]
Q
tIGpPI
exp1
Respiratory deposition fraction
m
j
t
josjjoIo dttftxvcptfrtxP
10
)(,exp1),(
For both airborne and droplet transmission modes:
Dose-response model for airborne disease transmission
rNPI exp1Exponential model:
Fitting
parameter
Intake dose
Beta-Poisson model:
NPI 11
Dose-response type infection risk assessment models require experimentally obtained
infectious dose data to construct the dose-response relationship.
Nicas M. 1996. An analytical framework for relating dose, risk, and incidence: an application to occupational tuberculosis infection,
Risk Anal., 16, 527–538.
Sze To G.N, Wan M.P, Chao C.Y.H, Wei F, Yu S.C.T, and Kwan J.K.C. 2008. A methodology for estimating airborne virus exposures in
indoor environments using the spatial distribution of expiratory aerosols and virus viability characteristics. Indoor Air, 18,
425–438.
Sze To G.N. and Chao C.Y.H. 2010. Review and Comparison between the Wells-Riley and Dose-response Approaches to Risk
Assessment of Infectious Respiratory Diseases, Indoor Air, 20, 2-16.
Workplace and Indoor Aerosols 2012
http://www.eat.lth.se/aerosols2012

Indirect Contact Pathway
fs, fh, fm : frequency of coughing/hand-to-contaminated
surface contact/ hand-to-mucous membrane contact.
Nx : amount of pathogen on the contaminated surface
after a cough.
cm, ch : fraction of pathogen transferred to the mucous
membrane from hand/transferred to hand from the
contaminated surface.
b : a constant related to the survivability of the
pathogen on hand.
1 2
3
B
ec
eccA
e
ecN
f
fnE
h
mm
h
h
m
f
b
h
f
b
f
f
hh
f
b
f
b
mx
h
sm
1
11
1
1
2
12
11
1111
m
mmm
f
b
m
f
bn
n
mh
f
b
mh
f
b
mh
ec
eccecnceccnn
mm
hm
m
h
m
hmm
m
hm
m
h
m
h
f
b
mf
f
h
f
b
mf
f
h
f
f
h
f
bn
n
m
f
b
mf
fn
h
f
b
mh
f
f
h
f
fn
h
eccecc
cececcecc
c
c
111111
111111111
11
11
Exposure after nth hand-to-
mucous membrane contact:
A:
B:
t
hmmtm dtNfcE0
,
Integral form:
tbfc
bfcafc
Nffctbfctafc
afcbfc
afc
NfNfc
N mm
mmhh
xshhmmhh
hhmm
hh
xsshh
h
exp1expexp
0
Workplace and Indoor Aerosols 2012
http://www.eat.lth.se/aerosols2012
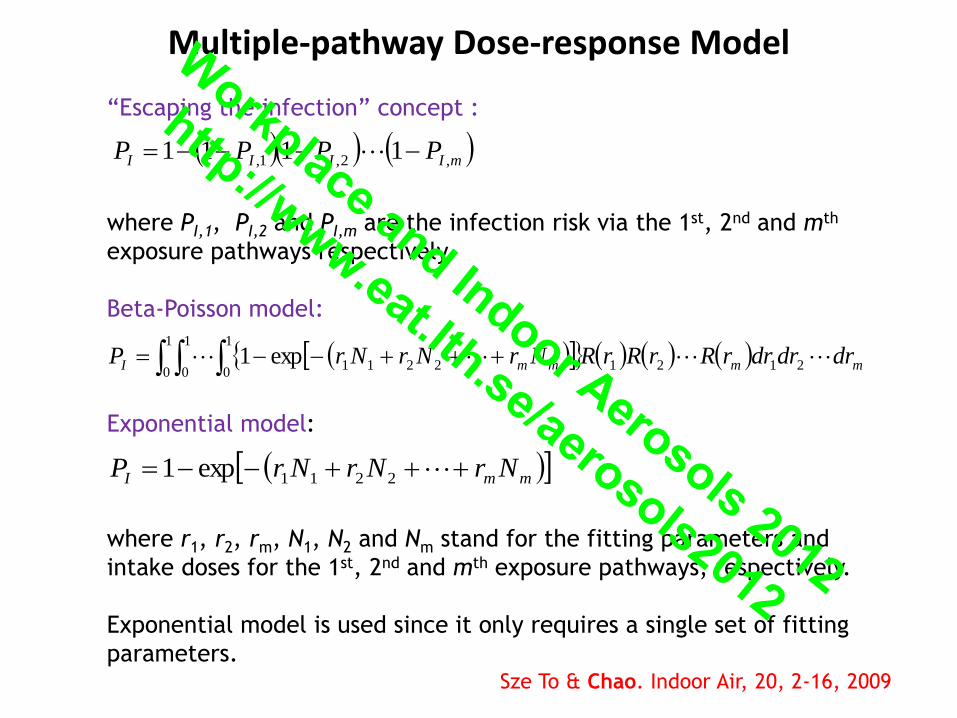
Multiple-pathway Dose-response Model
“Escaping the infection” concept :
where PI,1, PI,2 and PI,m are the infection risk via the 1st, 2nd and mth
exposure pathways respectively.
Beta-Poisson model:
Exponential model:
where r1, r2, rm, N1, N2 and Nm stand for the fitting parameters and
intake doses for the 1st, 2nd and mth exposure pathways, respectively.
Exponential model is used since it only requires a single set of fitting
parameters.
mmI NrNrNrP 2211exp1
mmmmI drdrdrrRrRrRNrNrNrP 2121
1
0
1
0
1
02211exp1
mIIII PPPP ,2,1, 1111
Sze To & Chao. Indoor Air, 20, 2-16, 2009
Workplace and Indoor Aerosols 2012
http://www.eat.lth.se/aerosols2012

Parameter Value Remarks Reference
c virus concentration 5 105 TCID50 Median concentration from 7 patients Murphy et al., 1973
r
Fitting parameter
ID50 = 1.8 TCID50
r = 0.385
Infectious dose for aerosols 3 m
(mean value of the range: 0.6-3.0)
β = 0.6.
Alfard et al., 1966
ID50 = 223.5 TCID50
r = 0.0031
Nasal infectious dose, for larger
aerosols and mucous membrane
(mean value of the range: 127-
320)
Douglas, 1975
f(t)
Viability
75% after aerosolization, 1%/min
additional decay within 15
minutes
Extrapolated from Figure 2B. Under
21oC, 5% RH.
Schaffer et al., 1976
fs Cough frequency 18 cough/hr Median cough frequency of 60 patients Loudon & Brown, 1967
fh Hand contact
frequency
3 /hr Assumption
fm
Nasal/eye membrane
contact frequency
0.7 /hr Frequency of eye-rubbing and nose-
picking of 124 adults
Hendley et al., 1973
ch
Hand transfer efficiency
0.00251Af/Ac
Af: Area of the fingerpad
Ac: Area of the contaminated surface.
Transfer efficiency of influenza virus to
fingerpad from porous material is
around 0.251%
Beam et al., 1982
cm
Membrane transfer
efficiency
1 Assumption
b Viability on hand ~6.4 /hr Influenza virus survived on skin for
more than 0.03 day
Walther & Ewald, 2004
Target Pathogen: Influenza A virus Workplace and Indoor Aerosols 2012
http://www.eat.lth.se/aerosols2012
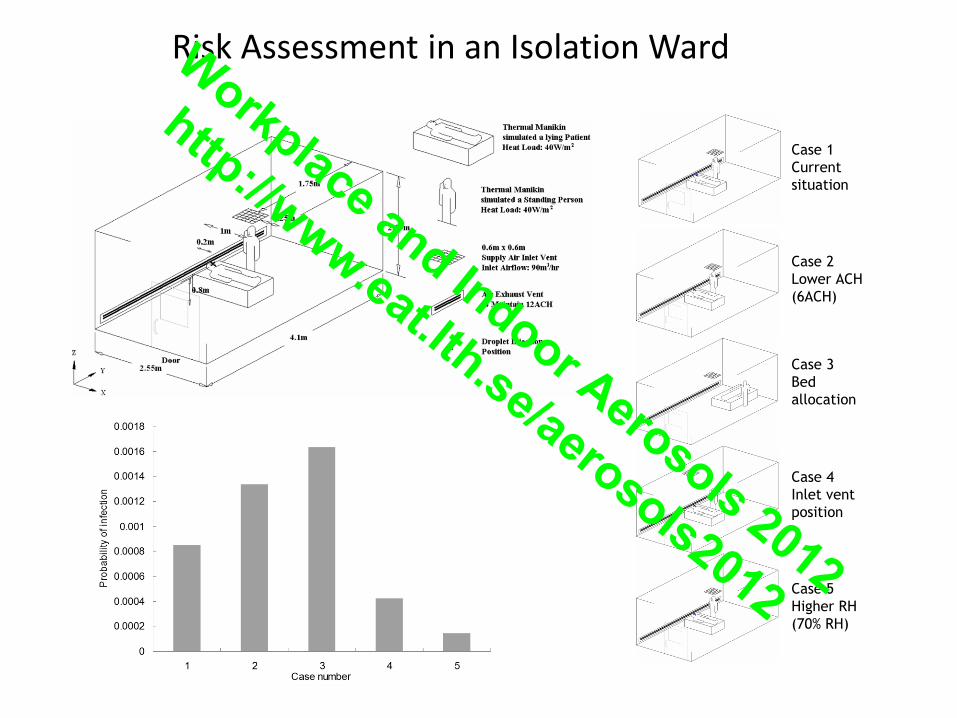
Risk Assessment in an Isolation Ward
Case 1
Current
situation
Case 2
Lower ACH
(6ACH)
Case 3
Bed
allocation
Case 4
Inlet vent
position
Case 5
Higher RH
(70% RH)
Workplace and Indoor Aerosols 2012
http://www.eat.lth.se/aerosols2012
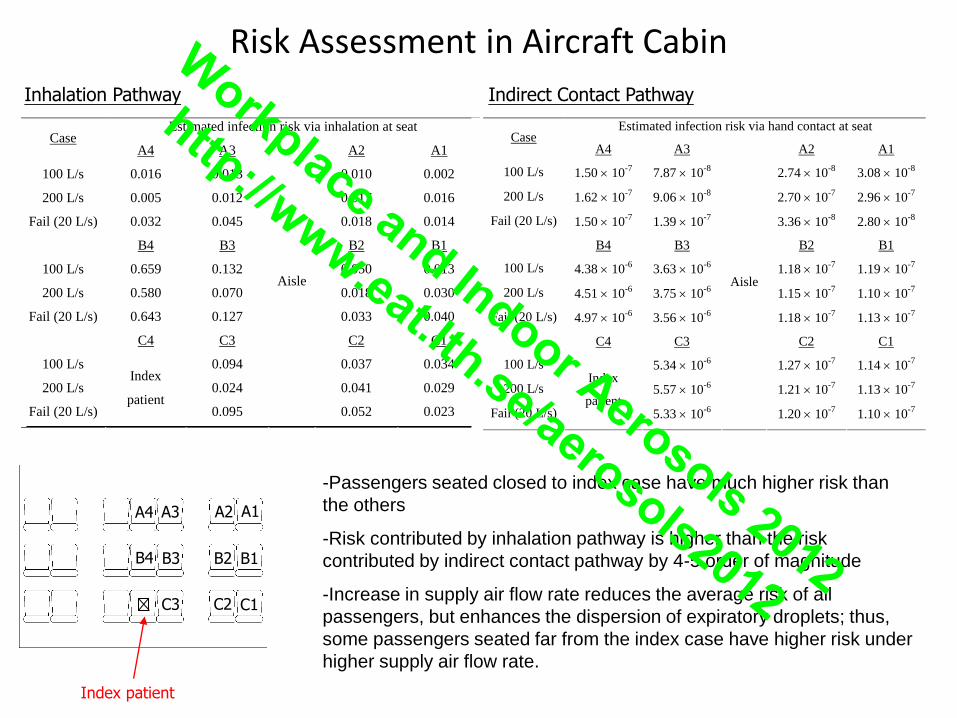
Estimated infection risk via inhalation at seat Case
A4 A3 A2 A1
100 L/s 0.016 0.013 0.010 0.002
200 L/s 0.005 0.012 0.017 0.016
Fail (20 L/s) 0.032 0.045 0.018 0.014
B4 B3 B2 B1
100 L/s 0.659 0.132 0.050 0.013
200 L/s 0.580 0.070 0.018 0.030
Fail (20 L/s) 0.643 0.127 0.033 0.040
C4 C3 C2 C1
100 L/s 0.094 0.037 0.034
200 L/s 0.024 0.041 0.029
Fail (20 L/s)
Index
patient 0.095
Aisle
0.052 0.023
Risk Assessment in Aircraft Cabin
B3
A4 A3
B4
A2 A1
B1 B2
C3 C1 C2
Index patient
Inhalation Pathway
Estimated infection risk via hand contact at seat Case
A4 A3 A2 A1
100 L/s 1.50 10-7
7.87 10-8
2.74 10-8
3.08 10-8
200 L/s 1.62 10-7
9.06 10-8
2.70 10-7
2.96 10-7
Fail (20 L/s) 1.50 10-7
1.39 10-7
3.36 10-8
2.80 10-8
B4 B3 B2 B1
100 L/s 4.38 10-6
3.63 10-6
1.18 10-7
1.19 10-7
200 L/s 4.51 10-6
3.75 10-6
1.15 10-7
1.10 10-7
Fail (20 L/s) 4.97 10-6
3.56 10-6
1.18 10-7
1.13 10-7
C4 C3 C2 C1
100 L/s 5.34 10-6
1.27 10-7
1.14 10-7
200 L/s 5.57 10-6
1.21 10-7
1.13 10-7
Fail (20 L/s)
Index
patient 5.33 10
-6
Aisle
1.20 10-7
1.10 10-7
Indirect Contact Pathway
-Passengers seated closed to index case have much higher risk than
the others
-Risk contributed by inhalation pathway is higher than the risk
contributed by indirect contact pathway by 4-5 order of magnitude
-Increase in supply air flow rate reduces the average risk of all
passengers, but enhances the dispersion of expiratory droplets; thus,
some passengers seated far from the index case have higher risk under
higher supply air flow rate.
Workplace and Indoor Aerosols 2012
http://www.eat.lth.se/aerosols2012
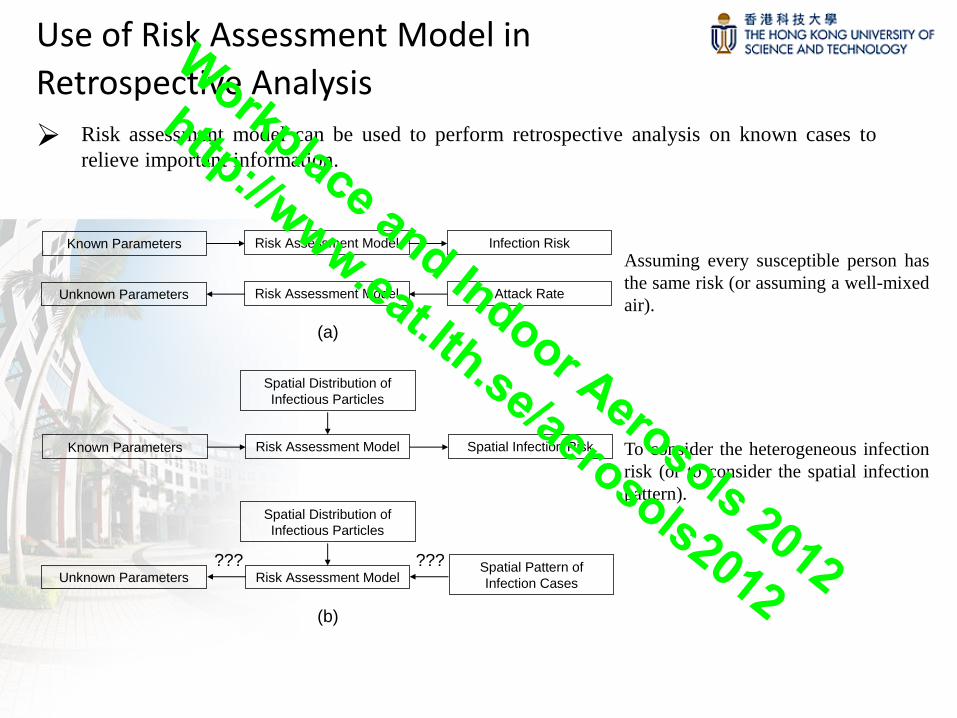
Use of Risk Assessment Model in
Retrospective Analysis
Risk assessment model can be used to perform retrospective analysis on known cases to
relieve important information.
Known Parameters Spatial Infection RiskRisk Assessment Model
Unknown ParametersSpatial Pattern of
Infection CasesRisk Assessment Model
??? ???
Spatial Distribution of
Infectious Particles
Spatial Distribution of
Infectious Particles
Known Parameters Infection RiskRisk Assessment Model
Unknown Parameters Attack RateRisk Assessment Model
(a)
(b)
Assuming every susceptible person has
the same risk (or assuming a well-mixed
air).
To consider the heterogeneous infection
risk (or to consider the spatial infection
pattern).
Workplace and Indoor Aerosols 2012
http://www.eat.lth.se/aerosols2012
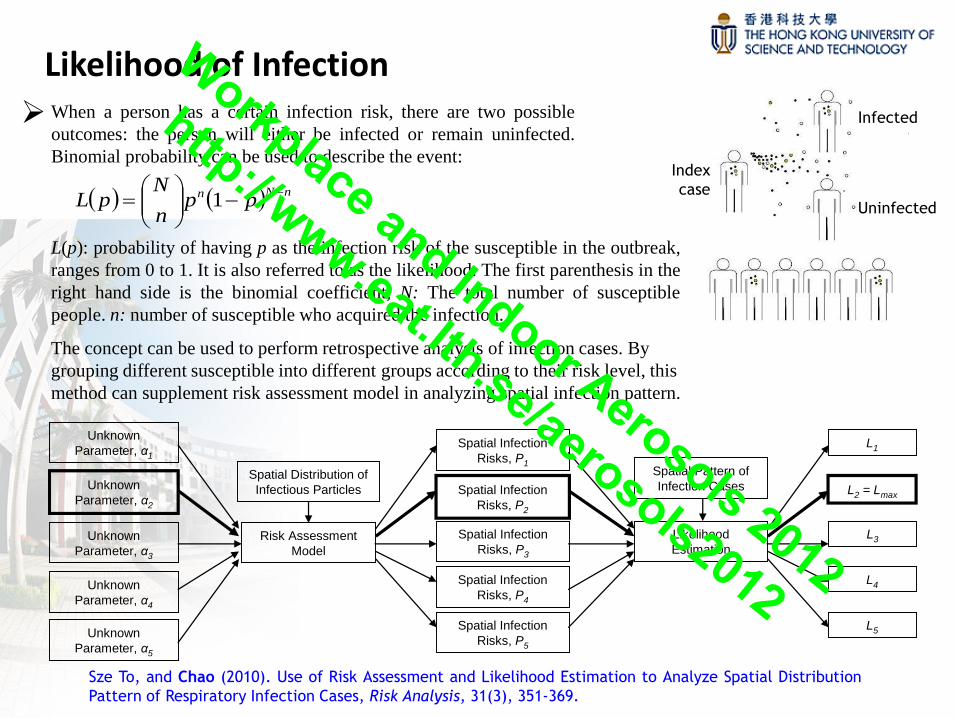
Likelihood of Infection
L(p): probability of having p as the infection risk of the susceptible in the outbreak,
ranges from 0 to 1. It is also referred to as the likelihood. The first parenthesis in the
right hand side is the binomial coefficient, N: The total number of susceptible
people. n: number of susceptible who acquired the infection.
The concept can be used to perform retrospective analysis of infection cases. By
grouping different susceptible into different groups according to their risk level, this
method can supplement risk assessment model in analyzing spatial infection pattern.
Sze To, and Chao (2010). Use of Risk Assessment and Likelihood Estimation to Analyze Spatial Distribution
Pattern of Respiratory Infection Cases, Risk Analysis, 31(3), 351-369.
When a person has a certain infection risk, there are two possible
outcomes: the person will either be infected or remain uninfected.
Binomial probability can be used to describe the event:
Infected
Uninfected
Index
case nNn ppn
NpL
1
Unknown
Parameter, α3
Spatial Infection
Risks, P3
Risk Assessment
Model
Spatial Distribution of
Infectious Particles
Spatial Pattern of
Infection Cases
Likelihood
Estimation
Unknown
Parameter, α4
Unknown
Parameter, α5
Unknown
Parameter, α2
Unknown
Parameter, α1
Spatial Infection
Risks, P4
Spatial Infection
Risks, P5
Spatial Infection
Risks, P2
Spatial Infection
Risks, P1
L3
L4
L5
L2 = Lmax
L1
Workplace and Indoor Aerosols 2012
http://www.eat.lth.se/aerosols2012
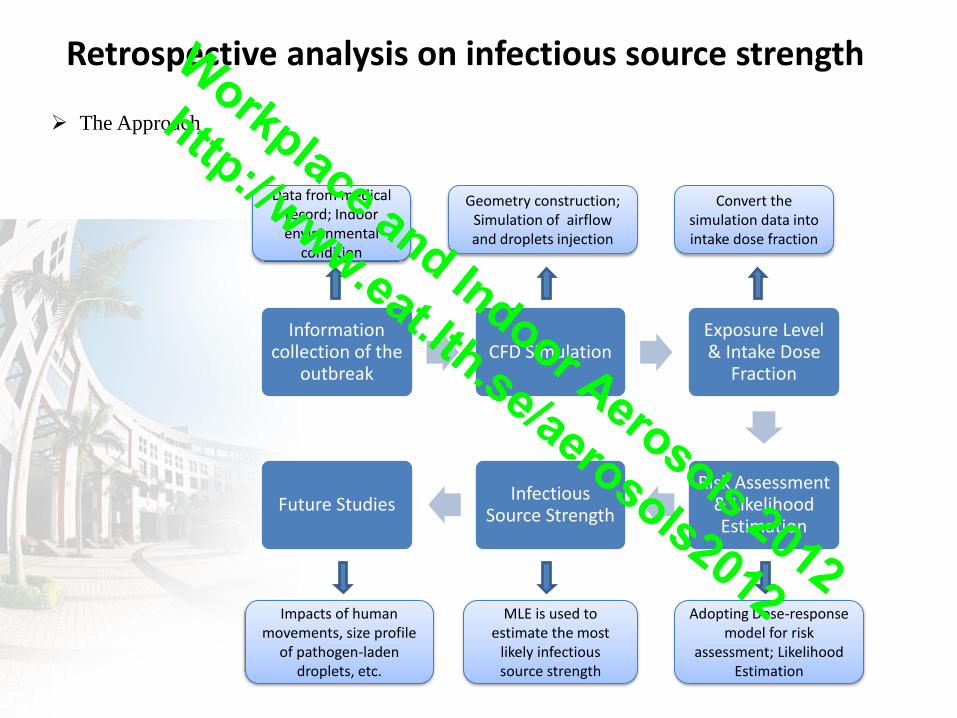
Retrospective analysis on infectious source strength
Information collection of the
outbreak CFD Simulation
Exposure Level & Intake Dose
Fraction
Risk Assessment & Likelihood Estimation
Infectious Source Strength
Future Studies
Data from medical record; Indoor environmental
condition
Geometry construction; Simulation of airflow and droplets injection
Convert the simulation data into intake dose fraction
Adopting Dose-response model for risk
assessment; Likelihood Estimation
MLE is used to estimate the most
likely infectious source strength
The Approach
Impacts of human movements, size profile
of pathogen-laden droplets, etc.
Workplace and Indoor Aerosols 2012
http://www.eat.lth.se/aerosols2012
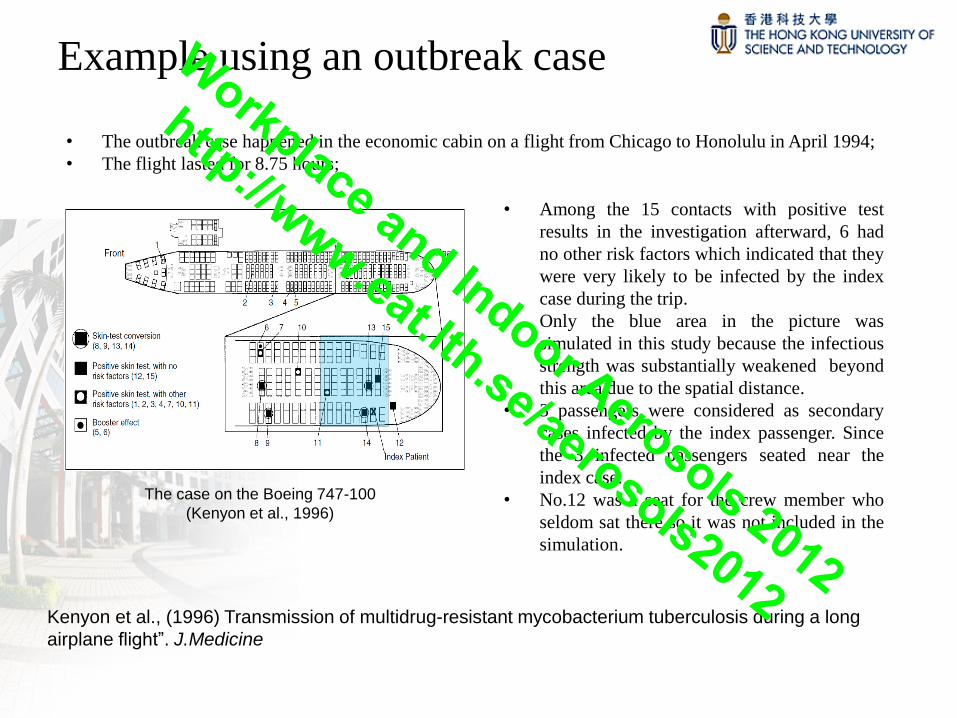
Example using an outbreak case
The case on the Boeing 747-100
(Kenyon et al., 1996)
• The outbreak case happened in the economic cabin on a flight from Chicago to Honolulu in April 1994;
• The flight lasted for 8.75 hours;
• Among the 15 contacts with positive test
results in the investigation afterward, 6 had
no other risk factors which indicated that they
were very likely to be infected by the index
case during the trip.
• Only the blue area in the picture was
simulated in this study because the infectious
strength was substantially weakened beyond
this area due to the spatial distance.
• 3 passengers were considered as secondary
cases infected by the index passenger. Since
the 3 infected passengers seated near the
index case.
• No.12 was a seat for the crew member who
seldom sat there so it was not included in the
simulation.
Kenyon et al., (1996) Transmission of multidrug-resistant mycobacterium tuberculosis during a long
airplane flight”. J.Medicine
Workplace and Indoor Aerosols 2012
http://www.eat.lth.se/aerosols2012
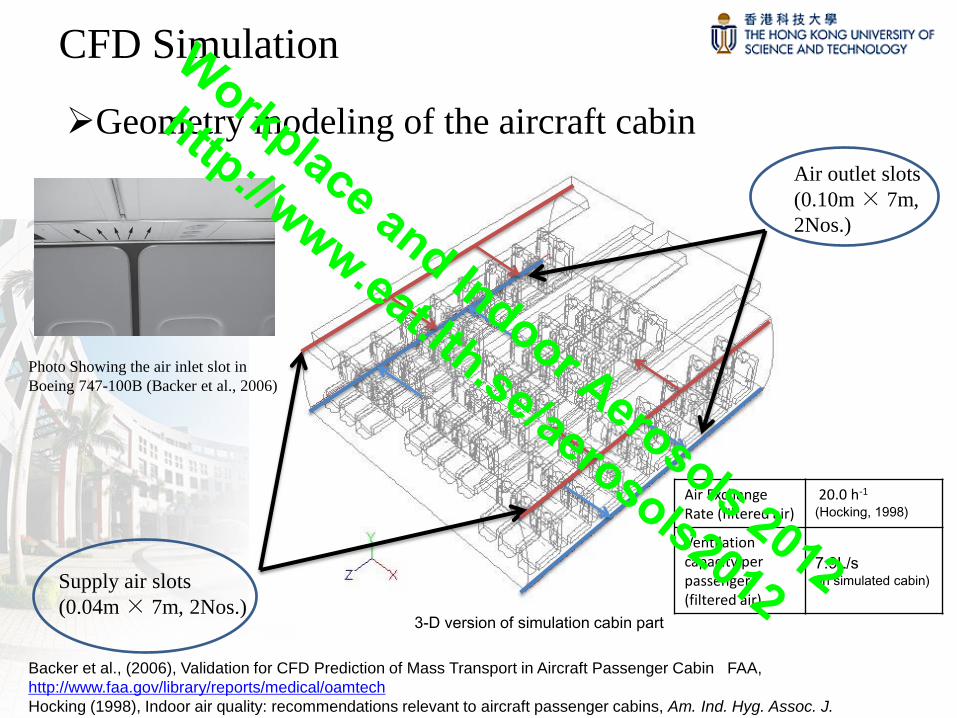
CFD Simulation
Supply air slots
(0.04m × 7m, 2Nos.)
Air outlet slots
(0.10m × 7m,
2Nos.)
Geometry modeling of the aircraft cabin
3-D version of simulation cabin part
Photo Showing the air inlet slot in
Boeing 747-100B (Backer et al., 2006)
Backer et al., (2006), Validation for CFD Prediction of Mass Transport in Aircraft Passenger Cabin FAA,
http://www.faa.gov/library/reports/medical/oamtech
Hocking (1998), Indoor air quality: recommendations relevant to aircraft passenger cabins, Am. Ind. Hyg. Assoc. J.
Air Exchange Rate (filtered air)
20.0 h-1 (Hocking, 1998)
Ventilation capacity per passenger (filtered air)
7.9L/s (in simulated cabin)
Workplace and Indoor Aerosols 2012
http://www.eat.lth.se/aerosols2012
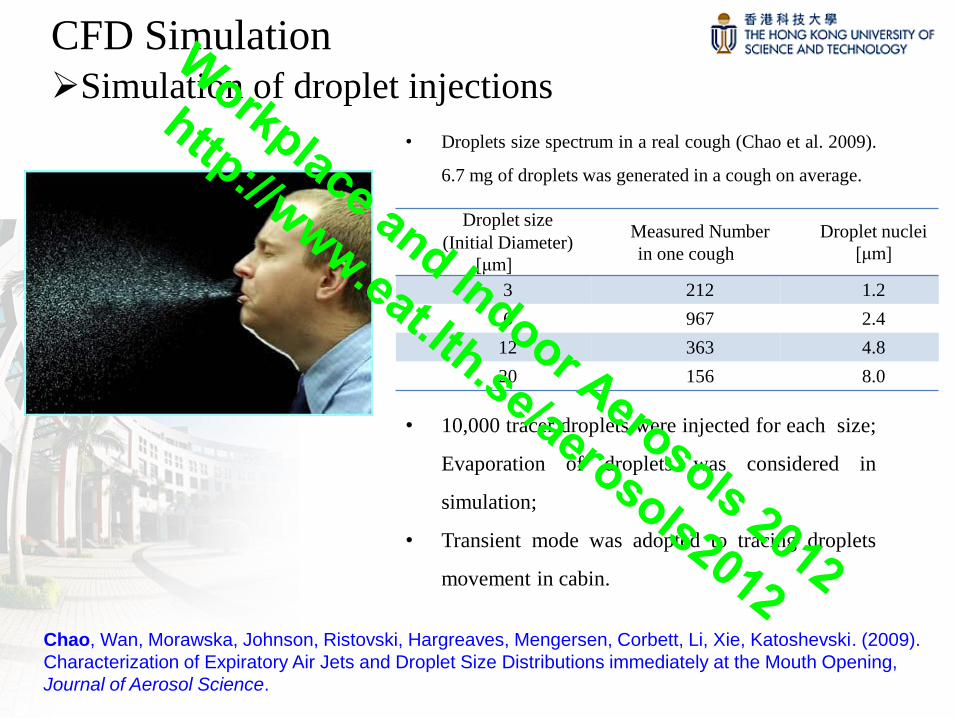
CFD Simulation
Droplet size (Initial Diameter)
[μm]
Measured Number
in one cough
Droplet nuclei
[μm]
3 212 1.2
6 967 2.4
12 363 4.8
20 156 8.0
Simulation of droplet injections
• Droplets size spectrum in a real cough (Chao et al. 2009).
6.7 mg of droplets was generated in a cough on average.
• 10,000 tracer droplets were injected for each size;
Evaporation of droplets was considered in
simulation;
• Transient mode was adopted to tracing droplets
movement in cabin.
Chao, Wan, Morawska, Johnson, Ristovski, Hargreaves, Mengersen, Corbett, Li, Xie, Katoshevski. (2009).
Characterization of Expiratory Air Jets and Droplet Size Distributions immediately at the Mouth Opening,
Journal of Aerosol Science.
Workplace and Indoor Aerosols 2012
http://www.eat.lth.se/aerosols2012
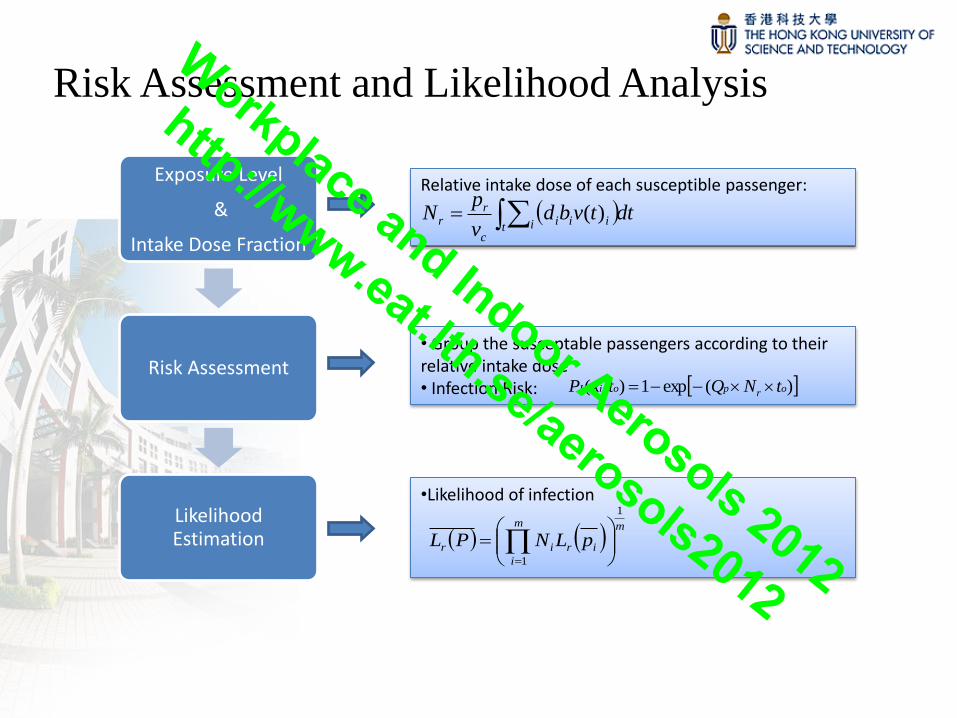
Risk Assessment and Likelihood Analysis
Relative intake dose of each susceptible passenger:
• Group the susceptable passengers according to their relative intake dose • Infection Risk:
•Likelihood of infection
Exposure Level
&
Intake Dose Fraction
Risk Assessment
Likelihood Estimation
mm
i
irir pLNPL
1
1
)(exp1),( orpoiI tNQtxP
t i iii
c
rr dttvbd
v
pN )(
Workplace and Indoor Aerosols 2012
http://www.eat.lth.se/aerosols2012
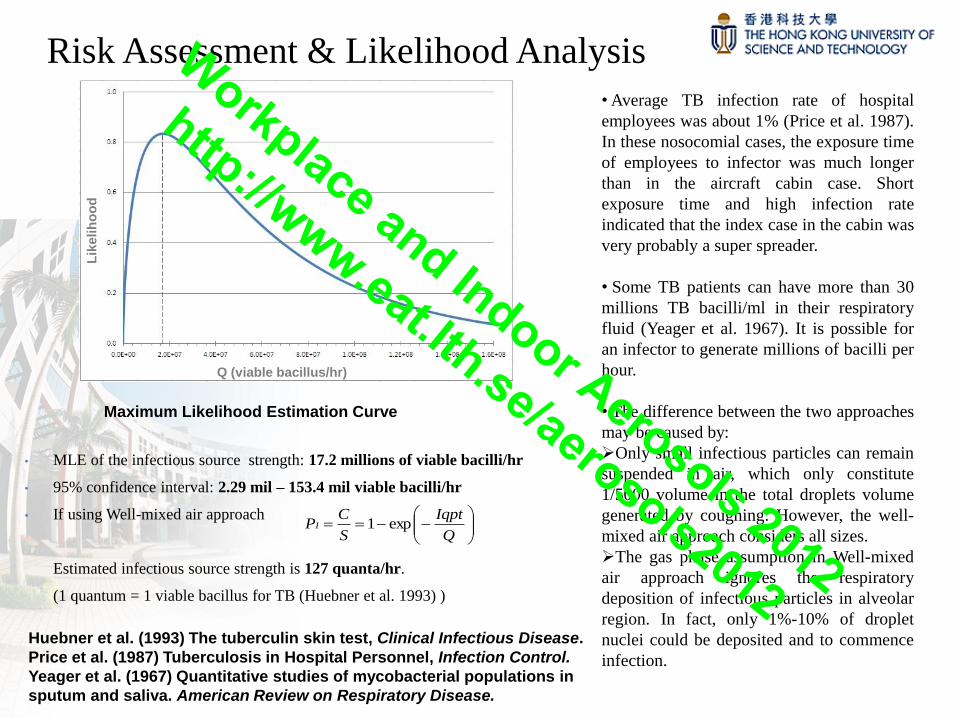
• MLE of the infectious source strength: 17.2 millions of viable bacilli/hr
• 95% confidence interval: 2.29 mil – 153.4 mil viable bacilli/hr
• If using Well-mixed air approach
Estimated infectious source strength is 127 quanta/hr.
(1 quantum = 1 viable bacillus for TB (Huebner et al. 1993) )
Risk Assessment & Likelihood Analysis
Maximum Likelihood Estimation Curve
• Average TB infection rate of hospital
employees was about 1% (Price et al. 1987).
In these nosocomial cases, the exposure time
of employees to infector was much longer
than in the aircraft cabin case. Short
exposure time and high infection rate
indicated that the index case in the cabin was
very probably a super spreader.
• Some TB patients can have more than 30
millions TB bacilli/ml in their respiratory
fluid (Yeager et al. 1967). It is possible for
an infector to generate millions of bacilli per
hour.
• The difference between the two approaches
may be caused by:
Only small infectious particles can remain
suspended in air, which only constitute
1/5000 volume in the total droplets volume
generated by coughing. However, the well-
mixed air approach considers all sizes.
The gas phase assumption in Well-mixed
air approach ignores the respiratory
deposition of infectious particles in alveolar
region. In fact, only 1%-10% of droplet
nuclei could be deposited and to commence
infection.
Q
Iqpt
S
CPI exp1
Huebner et al. (1993) The tuberculin skin test, Clinical Infectious Disease.
Price et al. (1987) Tuberculosis in Hospital Personnel, Infection Control.
Yeager et al. (1967) Quantitative studies of mycobacterial populations in
sputum and saliva. American Review on Respiratory Disease.
Lik
elih
oo
d
Q (viable bacillus/hr)
Workplace and Indoor Aerosols 2012
http://www.eat.lth.se/aerosols2012
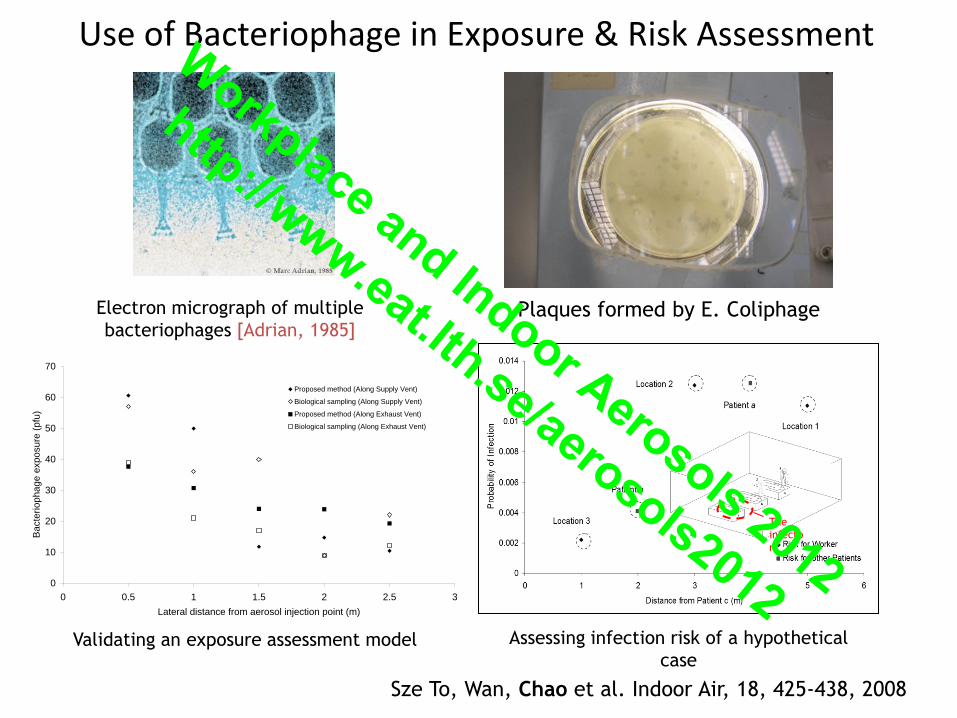
Use of Bacteriophage in Exposure & Risk Assessment
Plaques formed by E. Coliphage
0
10
20
30
40
50
60
70
0 0.5 1 1.5 2 2.5 3
Lateral distance from aerosol injection point (m)
Ba
cte
rio
ph
ag
e e
xp
osu
re (
pfu
)
Proposed method (Along Supply Vent)
Biological sampling (Along Supply Vent)
Proposed method (Along Exhaust Vent)
Biological sampling (Along Exhaust Vent)
Electron micrograph of multiple
bacteriophages [Adrian, 1985]
The
infecto
r
Sze To, Wan, Chao et al. Indoor Air, 18, 425-438, 2008
Validating an exposure assessment model Assessing infection risk of a hypothetical
case
Workplace and Indoor Aerosols 2012
http://www.eat.lth.se/aerosols2012
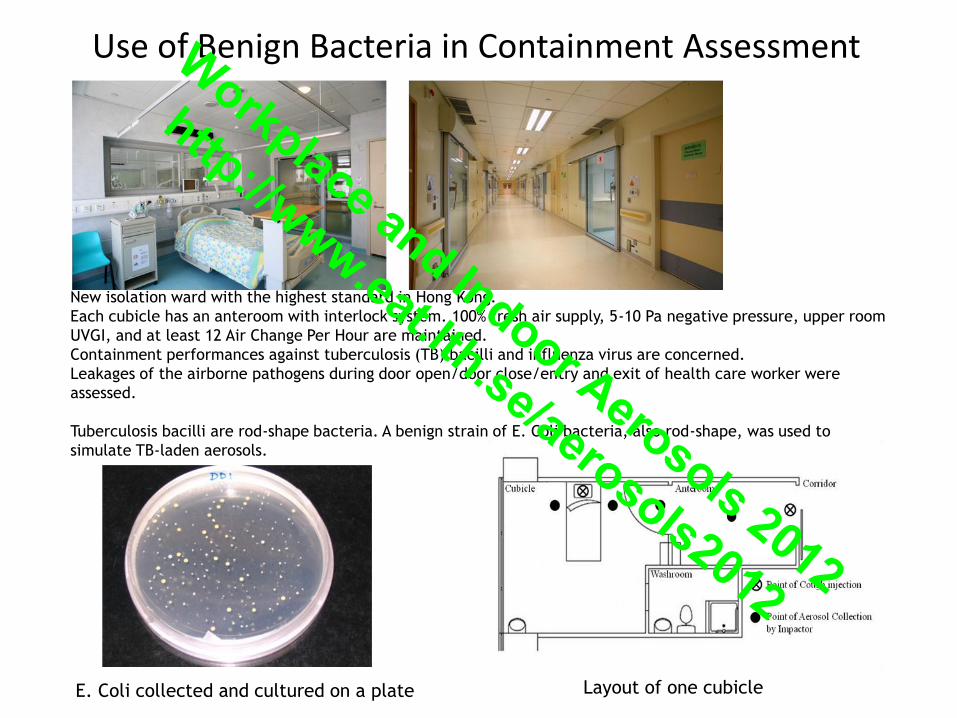
Use of Benign Bacteria in Containment Assessment
Layout of one cubicle E. Coli collected and cultured on a plate
New isolation ward with the highest standard in Hong Kong.
Each cubicle has an anteroom with interlock system. 100% fresh air supply, 5-10 Pa negative pressure, upper room
UVGI, and at least 12 Air Change Per Hour are maintained.
Containment performances against tuberculosis (TB) bacilli and influenza virus are concerned.
Leakages of the airborne pathogens during door open/door close/entry and exit of health care worker were
assessed.
Tuberculosis bacilli are rod-shape bacteria. A benign strain of E. Coli bacteria, also rod-shape, was used to
simulate TB-laden aerosols.
Workplace and Indoor Aerosols 2012
http://www.eat.lth.se/aerosols2012
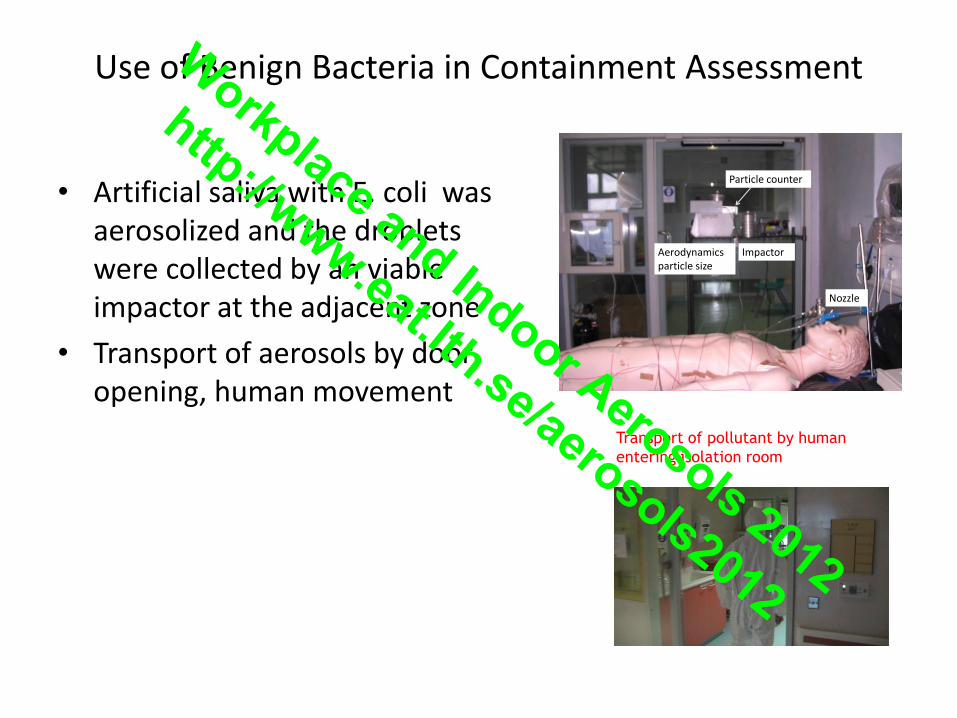
Transport of pollutant by human
entering isolation room
Use of Benign Bacteria in Containment Assessment
• Artificial saliva with E. coli was aerosolized and the droplets were collected by an viable impactor at the adjacent zone
• Transport of aerosols by door opening, human movement
Impactor
Particle counter
Aerodynamics particle size
Nozzle
Workplace and Indoor Aerosols 2012
http://www.eat.lth.se/aerosols2012
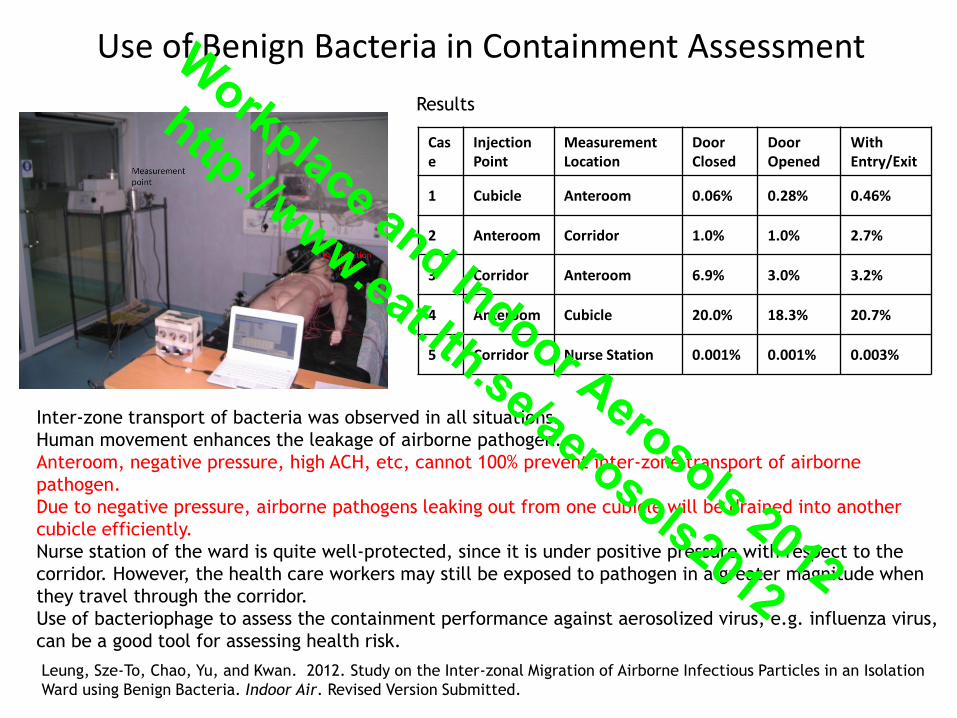
Use of Benign Bacteria in Containment Assessment
Results
Case
Injection Point
Measurement Location
Door Closed
Door Opened
With Entry/Exit
1 Cubicle Anteroom 0.06% 0.28% 0.46%
2 Anteroom Corridor 1.0% 1.0% 2.7%
3 Corridor Anteroom 6.9% 3.0% 3.2%
4 Anteroom Cubicle 20.0% 18.3% 20.7%
5 Corridor Nurse Station 0.001% 0.001% 0.003%
Inter-zone transport of bacteria was observed in all situations.
Human movement enhances the leakage of airborne pathogen.
Anteroom, negative pressure, high ACH, etc, cannot 100% prevent inter-zone transport of airborne
pathogen.
Due to negative pressure, airborne pathogens leaking out from one cubicle will be drained into another
cubicle efficiently.
Nurse station of the ward is quite well-protected, since it is under positive pressure with respect to the
corridor. However, the health care workers may still be exposed to pathogen in a greater magnitude when
they travel through the corridor.
Use of bacteriophage to assess the containment performance against aerosolized virus, e.g. influenza virus,
can be a good tool for assessing health risk.
Leung, Sze-To, Chao, Yu, and Kwan. 2012. Study on the Inter-zonal Migration of Airborne Infectious Particles in an Isolation
Ward using Benign Bacteria. Indoor Air. Revised Version Submitted.
Workplace and Indoor Aerosols 2012
http://www.eat.lth.se/aerosols2012
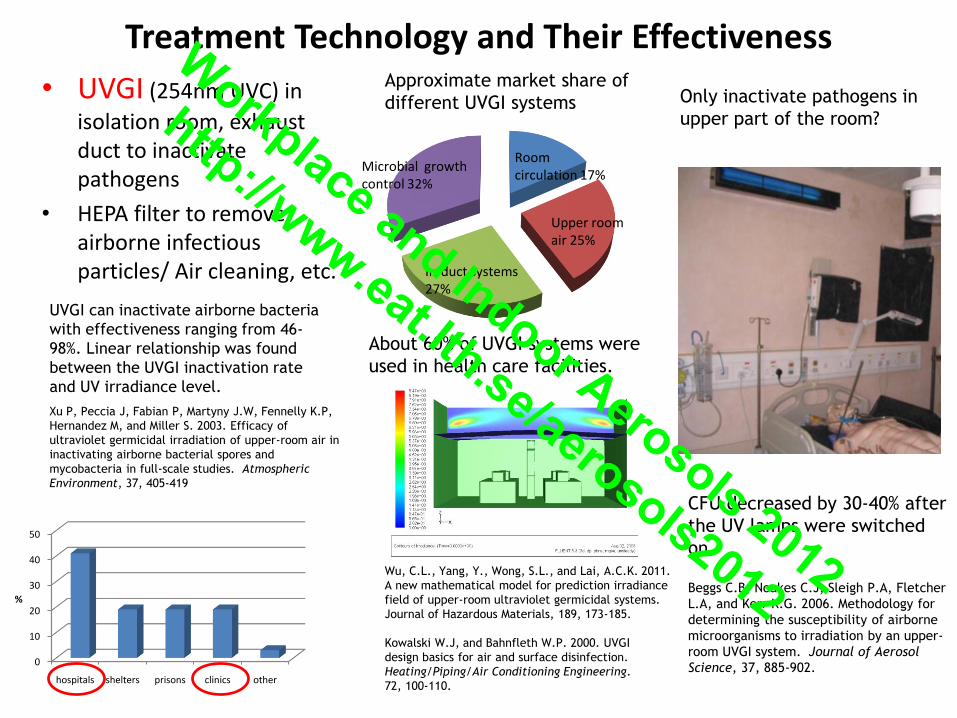
Treatment Technology and Their Effectiveness
• UVGI (254nm UVC) in
isolation room, exhaust duct to inactivate pathogens
• HEPA filter to remove airborne infectious particles/ Air cleaning, etc.
Xu P, Peccia J, Fabian P, Martyny J.W, Fennelly K.P,
Hernandez M, and Miller S. 2003. Efficacy of
ultraviolet germicidal irradiation of upper-room air in
inactivating airborne bacterial spores and
mycobacteria in full-scale studies. Atmospheric
Environment, 37, 405-419
Only inactivate pathogens in
upper part of the room?
Beggs C.B, Noakes C.J, Sleigh P.A, Fletcher
L.A, and Kerr K.G. 2006. Methodology for
determining the susceptibility of airborne
microorganisms to irradiation by an upper-
room UVGI system. Journal of Aerosol
Science, 37, 885-902.
CFU decreased by 30-40% after
the UV lamps were switched
on.
Kowalski W.J, and Bahnfleth W.P. 2000. UVGI
design basics for air and surface disinfection.
Heating/Piping/Air Conditioning Engineering.
72, 100-110.
Approximate market share of
different UVGI systems
About 60% of UVGI systems were
used in health care facilities.
UVGI can inactivate airborne bacteria
with effectiveness ranging from 46-
98%. Linear relationship was found
between the UVGI inactivation rate
and UV irradiance level.
In-duct systems 27%
Upper roomair 25%
Room circulation 17%
Microbial growth control 32%
0
10
20
30
40
50
hospitals shelters prisons clinics other
%
Wu, C.L., Yang, Y., Wong, S.L., and Lai, A.C.K. 2011.
A new mathematical model for prediction irradiance
field of upper-room ultraviolet germicidal systems.
Journal of Hazardous Materials, 189, 173-185.
Workplace and Indoor Aerosols 2012
http://www.eat.lth.se/aerosols2012
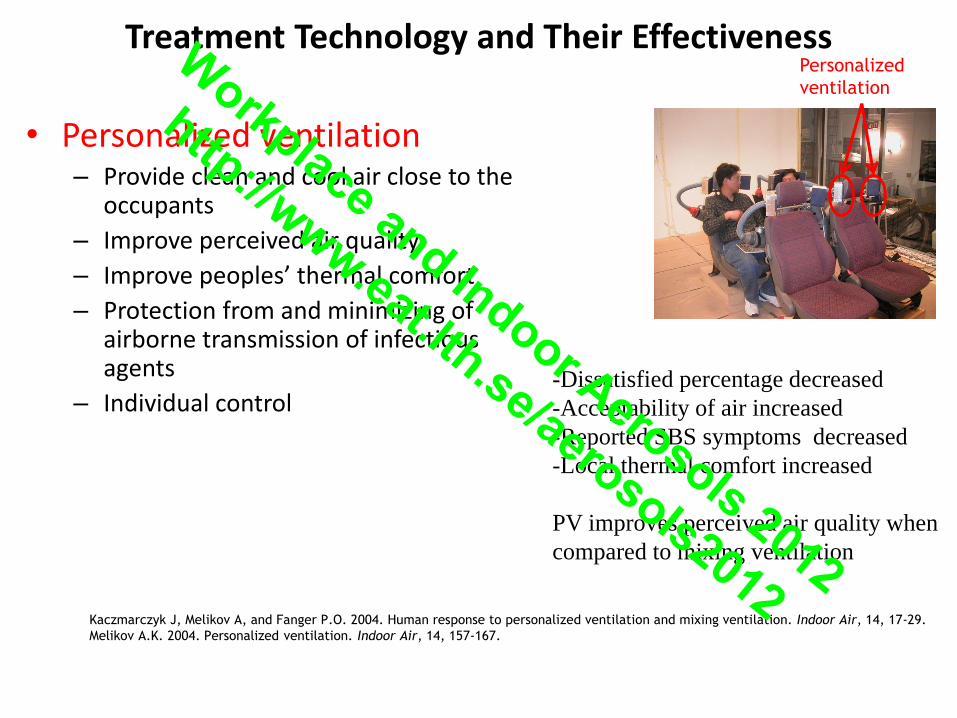
• Personalized ventilation – Provide clean and cool air close to the
occupants
– Improve perceived air quality
– Improve peoples’ thermal comfort
– Protection from and minimizing of airborne transmission of infectious agents
– Individual control
Kaczmarczyk J, Melikov A, and Fanger P.O. 2004. Human response to personalized ventilation and mixing ventilation. Indoor Air, 14, 17-29.
Melikov A.K. 2004. Personalized ventilation. Indoor Air, 14, 157-167.
-Dissatisfied percentage decreased
-Acceptability of air increased
-Reported SBS symptoms decreased
-Local thermal comfort increased
PV improves perceived air quality when
compared to mixing ventilation
Personalized
ventilation
Treatment Technology and Their Effectiveness Workplace and Indoor Aerosols 2012
http://www.eat.lth.se/aerosols2012
Pantelic J, Sze To G.N, Tham K.W, Chao C.Y.H,
and Khoo Y.C.M. 2009. Personalized ventilation
as a control measure for airborne transmissible
disease spread. J.R. Soc. Interface, 6, S715-S726.
Melikov A.K. 2004. Personalized ventilation. Indoor Air, 14, 157-167.
Probability of infection decreased
27%-65% with PV
Air distribution, applicability and energy:
Transport of pollution with PV and other
ventilation system. Energy saving by using
PV.
Control strategies for PV (and other
ventilation systems)
Treatment Technology and Their Effectiveness Workplace and Indoor Aerosols 2012
http://www.eat.lth.se/aerosols2012
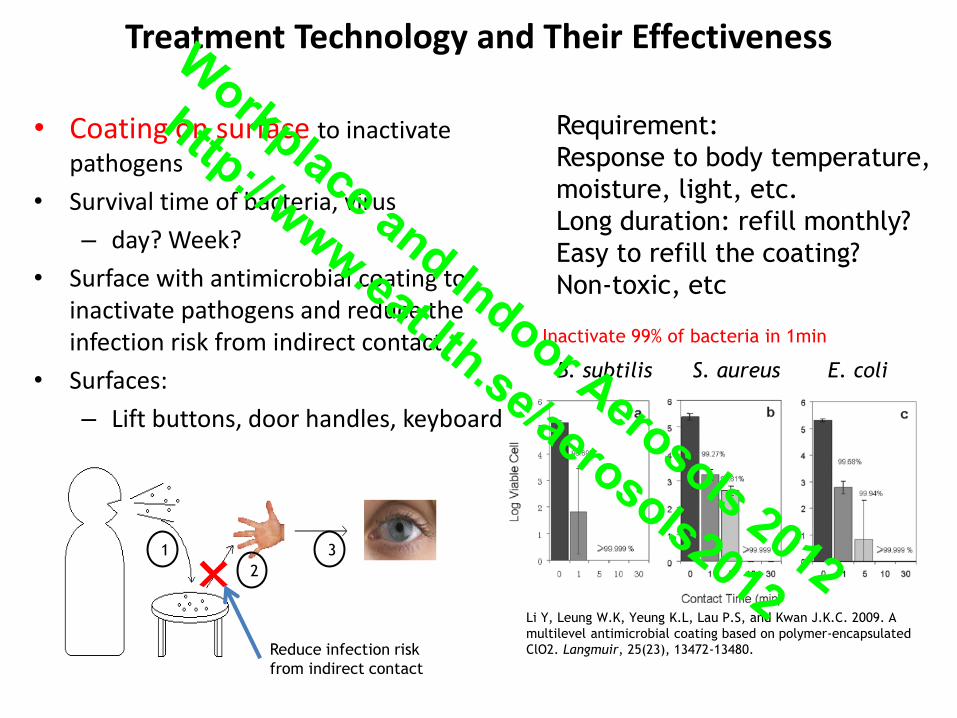
• Coating on surface to inactivate
pathogens
• Survival time of bacteria, virus
– day? Week?
• Surface with antimicrobial coating to inactivate pathogens and reduce the infection risk from indirect contact
• Surfaces:
– Lift buttons, door handles, keyboards
1
2
3
Li Y, Leung W.K, Yeung K.L, Lau P.S, and Kwan J.K.C. 2009. A
multilevel antimicrobial coating based on polymer-encapsulated
ClO2. Langmuir, 25(23), 13472-13480. Reduce infection risk
from indirect contact
B. subtilis S. aureus E. coli
Requirement:
Response to body temperature,
moisture, light, etc.
Long duration: refill monthly?
Easy to refill the coating?
Non-toxic, etc
Inactivate 99% of bacteria in 1min
Treatment Technology and Their Effectiveness Workplace and Indoor Aerosols 2012
http://www.eat.lth.se/aerosols2012
Recent work: Resuspension of infectious droplets
• Re-suspension of infectious particle, ultrafine particle
– Origin - Walking, vacuum cleaning, sweeping, bed making
• Wind turbulence, vibration
– Mechanism - Lifting/ Sliding/ Rolling
– Material - Solid particle, droplet, pathogen-laden droplet
Workplace and Indoor Aerosols 2012
http://www.eat.lth.se/aerosols2012
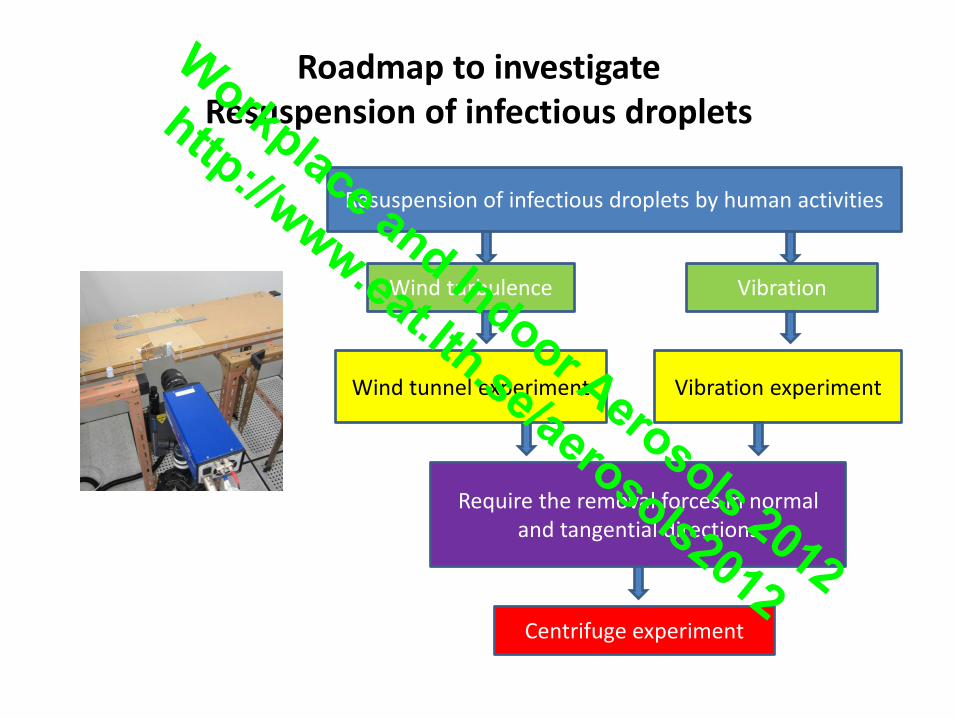
Roadmap to investigate Resuspension of infectious droplets
Resuspension of infectious droplets by human activities
Wind turbulence Vibration
Wind tunnel experiment Vibration experiment
Require the removal forces in normal and tangential directions
Centrifuge experiment
Workplace and Indoor Aerosols 2012
http://www.eat.lth.se/aerosols2012
Centrifuge Experiment
(Removal force/ weight)
Centrifuge experiment to determine the removal forces distribution.
The removal force is smaller in tangential direction than normal
direction.
Smaller removal force to weight ratio for larger particles.
0
25
50
75
100
1 100 10000 1000000
Rrm
ain
ing
frac
tio
n (
%)
log10 (RW2/g)
Normal (51um)
Tangential (51 um)
Normal (16um)
Tangential (16um)
Polystyrene
Particle (PS) 51um 16um
Workplace and Indoor Aerosols 2012
http://www.eat.lth.se/aerosols2012
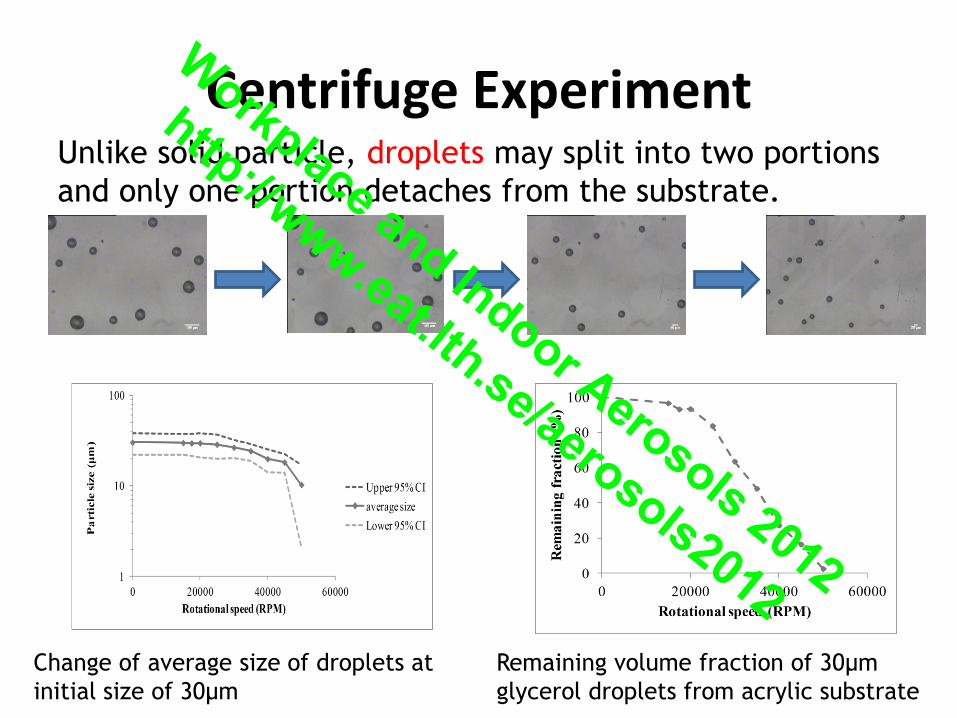
Centrifuge Experiment
Remaining volume fraction of 30μm
glycerol droplets from acrylic substrate
Change of average size of droplets at
initial size of 30μm
Unlike solid particle, droplets may split into two portions
and only one portion detaches from the substrate.
Workplace and Indoor Aerosols 2012
http://www.eat.lth.se/aerosols2012
Resuspension Modeling by Wind Turbulence
• Assume resuspension by rolling, angular velocity is described by
•Adhesion force Fa was found by centrifuge
experiments with normal force
•Ratio of a to b is the ratio of tangential force to
normal force by Centrifuge experiments
cos2
sin22
mga
bmgFa
Fa
bFdt
dI aLD
P
dp
x
a
b
Fa
FL
FD
mg
Angular velocity is modeled by Langevin equation.
The fluctuating angular velocity is represented by a white noise Wiener process.
tdWTT
dtttd
22
Timescale for energy
dissipation during rolling Model constant
(Drag)
(Lift)
Workplace and Indoor Aerosols 2012
http://www.eat.lth.se/aerosols2012
• Resuspension occurs when ω is
larger than a critical value
• A better fit than the RRH model
(Reeks, Reed & Hall 1988) and
Rock’n Roll model (Reeks & Hall 2001)
10-1
100
101
0
0.2
0.4
0.6
0.8
1
friction velocity (m/s)
frac
tio
n r
emai
nin
g a
fter
1s
Rock'n Roll model
C0=0
RRH model
C0=1e-3
Particle at rest, = 0
> 0?
Particle is resuspened
Yes
Yes
No
No
Find.
Particle unmoved, = 0
Particle rolling
> c?
t t+t
Fu, Chao, et al. 2012. Particle Resuspension in a Wall Bounded Turbulent Flow. Journal of Aerosol Science,
under revision after review.
Algorithm of the Monte Carlo simulation
Resuspension modeling by Wind Turbulence
Workplace and Indoor Aerosols 2012
http://www.eat.lth.se/aerosols2012
Wind tunnel Experiment
Wind
Wind tunnel Microscope
with camera
Cross-section: 20mm X
200mm
The wind tunnel is 3m long
before the test section to
have a fully developed
turbulence at the test
section. The particles were
assumed to be in the viscous
sub-layer.
Test
section
The particles were aerosolized using a nebulizer
and deposited on a substrate. The substrate was
put in the test section for the experiment
Workplace and Indoor Aerosols 2012
http://www.eat.lth.se/aerosols2012
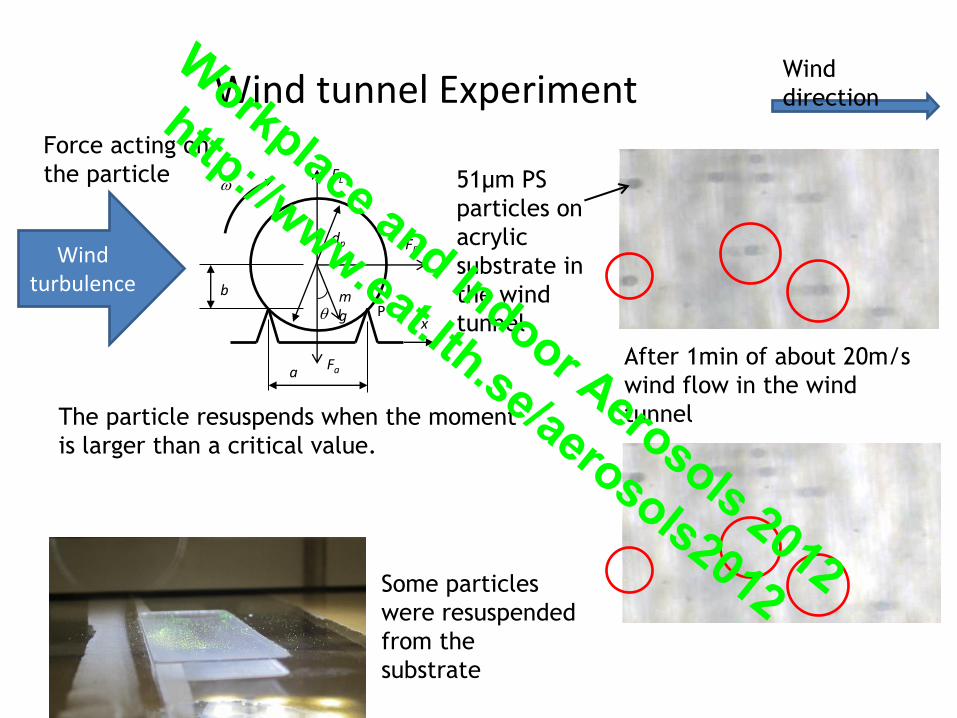
Wind tunnel Experiment Wind
direction
51μm PS
particles on
acrylic
substrate in
the wind
tunnel
After 1min of about 20m/s
wind flow in the wind
tunnel
Wind turbulence
Force acting on
the particle
The particle resuspends when the moment
is larger than a critical value.
Some particles
were resuspended
from the
substrate
P
dp
x
a
b
Fa
FL
FD
mg
Workplace and Indoor Aerosols 2012
http://www.eat.lth.se/aerosols2012

• Different thoughts between medical community and engineering community
Collaboration
between
different
expertise Scientists
Education
Architects,
engineers
Medical
expert,
clinicians
Final Remark Workplace and Indoor Aerosols 2012
http://www.eat.lth.se/aerosols2012