Embed Size (px)
Citation preview

Journal of Advanced Ceramics 2016, 5(2): 126–136 ISSN 2226-4108DOI: 10.1007/s40145-016-0181-5 CN 10-1154/TQ
Research Article
www.springer.com/journal/40145
Photocatalytic and electrochemical properties of single‐ and
multi‐layer sub‐stoichiometric titanium oxide coatings prepared by
atmospheric plasma spraying
Pavel CTIBORa,*, Ramachandran Chidambaram SESHADRIb, Jiri HENYCHc, Vaclav NEHASILd, Zdenek PALAa, Jiri KOTLANa
aMaterials Engineering Department, Institute of Plasma Physics AS CR, Za Slovankou 3, Prague 8, Czech Republic bCenter for Thermal Spray Research, Department of Materials Science & Engineering,
The State University of New York at Stony Brook, NY 11794-2275, USA cInstitute of Inorganic Chemistry AS CR, Husinec-Rez 250 68, Czech Republic
dDepartment of Surface and Plasma Science, Faculty of Mathematics and Physics, Charles University, V Holesovickach 2, Prague 8, Czech Republic
Received: December 14, 2015; Revised: January 21, 2016; Accepted: January 22, 2016
© The Author(s) 2016. This article is published with open access at Springerlink.com
Abstract: We studied the photocatalytic and electrochemical impedance properties of two different sub-stoichiometric titania powders deposited using plasma spraying. Two different commercial powders with markedly diverse mean size as well as size distribution were chosen. Thermal oxidation of these as-received powders was carried out to restore the O/Ti ratio to be 2.0. By this way, another two kinds of feedstock powders were obtained. Total of four kinds of feedstock powders were used in the experiments. All powders were sprayed using identical plasma spraying parameters. For some spraying runs, carbon steel served as the substrate, and for others, the previously sprayed titania coating from a different kind of feedstock. Combinations of single- and double-layer coatings were studied. Porosity, microstructure, phase composition, chemical composition, band gap based on reflectance measurement, and photocatalytic activity were examined. Electrochemical impedance spectroscopy demonstrated substantial differences between samples sprayed from the fine and coarse powders. Coatings from oxidized powders were slightly more photocatalytic. High spraying distance used for several of them was good for obtaining low band gap, whereas surface roughness and phase composition were not substantially different compared to standard spraying distance coatings.
Keywords: titanium dioxide; stoichiometry; feedstock; photocatalysis; spectroscopic techniques
1 Introduction
Plasma sprayed coatings are produced by introducing powder particles of the feedstock material into a
plasma jet, which melts them and propels towards the substrate. The formation of a coating depends on the interaction between a droplet and the substrate or the previously deposited layers, i.e., the spreading of a droplet, the formation of a splat (lamella), and its solidification. The difference in the degree of a splat flattening results in the difference in porosity and its shape as well as size distribution, and these factors
* Corresponding author. E-mail: [email protected]

J Adv Ceram 2016, 5(2): 126–136
www.springer.com/journal/40145
127
could also affect the bonding between lamellae. The bonding between lamellae affects markedly the cohesion and elastic properties of the coating. Among a variety of ceramic materials, TiO2 is often sprayed because of its interesting physical properties, including sliding response, tunability of electrical properties, and high energy light-activated photochemical activity known as photocatalysis.
Generally, the photo-decomposition efficiency of organic pollutants on a surface of TiO2 photocatalyst is influenced dramatically by the phase composition of TiO2. Since the TiO2 photocatalytic reaction is a surface reaction, surface states are important as regards the presence of the vacancies and impurities [1]. Plasma sprayed coatings with reasonable potential for various photocatalytic applications are reported. One possibility is to perform the coatings from spray-dried powders [2]. Another way is to apply thermal posttreatment [3]. Using of nanometric powders is tested as well [4]. Links between microstructure and photocatalytic activity are established for certain simple cases [5]. Coatings were sprayed on conventional as well as special substrates as foamed aluminum [6] or PET plates [7] in the past.
A thorough comparison of plasma sprayed coatings based on feedstock materials with different size ranges is a challenging task and this topic is up to now not very often reported in literature. Chromium oxide powders with three different grain size distributions (fine: 5.6–22.5 µm, medium: 22.5–45 µm, coarse: 25–75 µm) were deposited by atmospheric plasma spraying onto mild steel surfaces using an F4 plasma torch [8]. Clear correlations were found between feedstock size distribution and surface roughness parameters.
Also spraying of amorphous Fe-based alloy by the same plasma torch type brought significant differences between coatings sprayed from different size powders (median size: D50
= 33, 66, 84 µm) [9]. In this experiment, as usual for commercial powders, larger mean size represented also larger size distribution: 53, 60, and 67 µm interval between minimum (D10) and maximum (D90) for the three different kinds of powders, respectively. Results showed that the coating fabricated using the finest powders possessed the densest structure with the lowest porosity and the least cracks among the three kinds of coatings.
In the case of spraying silicon powders with different mean sizes (31, 79, and 114 mm), oxidation during spraying took place and affected the studied
coatings [10]. The degree of oxidation was dependent on the powder size.
The target of our current investigation is to utilize commercial TiO2 feedstock powders for developing a ceramic duplex coating, in which the bottom layer is formed by depositing fine powders, i.e., a coating with superior mechanical properties, in other words, the “load-bearing” coating, and a topcoat from coarser powders with large roughness and enhanced photocatalytic behavior due to (besides other possible effects) large surface area and high open porosity. Both the base coating and the topcoat are made from TiO2 to maximize the bonding quality between them and minimize the thermal expansion mismatch and any delamination problems at the coating interface.
Commercial titanium oxide spraying powders are usually produced by fusing and crushing with O/Ti ratio just below 2.0 [11]. In our investigation the thermal oxidation of as-received powders was carried out to restore the O/Ti ratio to be 2.0. Both the as-received and oxidized powders were plasma spraying deposited, and their mechanical, photocatalytic, and electrochemical impedance properties were evaluated and compared.
2 Experimental
2. 1 Powders and spraying
Two different kinds of commercial titanium oxide powders with markedly diverse mean size as well as size distribution were considered in this study. The finer powders were Metco 102 (Oerlikon-Metco, Westbury, NY, USA), fused and crushed with median size D50 =
26 µm and size distribution between 11 and 45 µm. The coarser powders used were Metco 6232B (Oerlikon-Metco, Westbury, NY, USA), agglomerated and sintered with median size D50 =
89 µm and size distribution between 45 and 130 µm.
Each kind of the powders was divided into two parts, and one part was thermally oxidized (Fig. 1). The thermal oxidation procedure was carried out in a laboratory oven which maintained a temperature of 700 ℃ for 4 h. The heating and cooling rate was 10 ℃/min.
The powders were deposited using a Plasmatechnik F4MB-XL (Oerlikon-Metco, Westbury, NY, USA) gas-stabilized plasma torch at ambient atmosphere. For all spraying runs, the plasma parameters were

J Adv Ceram 2016, 5(2): 126–136
www.springer.com/journal/40145
128
maintained at constant values, summarized in Table 1. In addition to the aforementioned spraying runs, two alternative samples were sprayed at a longer spraying distance of 200 mm (to increase the porosity and surface roughness of the coatings deposited using the coarse powders), and this spraying condition is indicated as “alt.” in Table 1.
The substrates were 230 mm × 25.4 mm × 3 mm (l × b × h) AISI 1008 low carbon steel beams. The powders were fed by Plasmatechnik Twin Ten volumetric feeder (Oerlikon-Metco, Westbury, NY, USA) with detailed settings slightly varied for individual spraying runs as it was dictated by feedstock density and size.
Just before spraying, the substrates were preheated using the plasma torch (i.e., plasma jet without powders). The temperature at the moment of spraying deposition was maintained at 280 ℃. The spraying deposition cycle was preserved the same for all samples, which lasted for 4.5 min for each spraying run. At the end of each spraying cycle, the temperature was measured by a thermocouple attached to the back side of the substrate. The temperature at the end of coating deposition was found to be 400 and 230 ℃, when sprayed under 100 and 200 mm spraying distance, respectively. The coating thickness was 0.4–0.5 mm in the case of coating sprayed with 100 mm spraying distance and 0.1–0.2 mm for 200 mm spraying distance.
Table 1 Plasma spraying parameters
Torch current (A)/nozzle diameter (mm) 550/8 Torch power (kW) 35 Plasma gas, flow rate (L/min) Ar, 50/H2, 5 Spraying distance (mm) 100 (alt. 200) Torch transversal speed (m/s) 0.8 Powder feed rate (g/min) 30
The behavior of the powders in plasma jet and later in the coating could be influenced also by their shape and character. The fine powders were fused and crushed, whereas the coarse powders were agglomerated and sintered. The melting of the coarse powders was easier, so the “pure” effect of powder size could be diminished by this way. For example, when similar feedstock size was used, agglomerated and sintered powders had much better wear resistance [12,13]. These results were achieved for AT13 two-component system, while for TiO2, results are not available. For the plasma gun F4 used would be difficult to melt fused and crushed TiO2 particles with size up to 130 µm, so we utilized the mentioned two kinds of powders as a compromise.
Sample nomenclature in the study: samples are labeled C for coarse (as-received) powders, F for fine (as-received) powders, COX for oxidized coarse powders, FOX for oxidized fine powders. For double layers, labels “C-on-F” and “COX-on-F” are used. For double layers with the alternative (high) spraying distance, labels “C-on-F h” and “COX-on-F h” are used. Other combinations are not included in the present paper.
2. 2 Characterization of feedstock powders and
deposited coatings
Powder X-ray diffraction (XRD) was performed using D8 Discover Bruker theta–2theta Bragg–Brentano diffractometer using Cu Kα radiation and 1D LynxEye detector (we measured 2θ range from 10° to 80° with 0.03° step and 77 s scanning time in each step). The obtained diffraction patterns provided information not only about the phase composition of feedstock powders and coatings, but also about the corresponding grain sizes. The size of crystallites was represented by average size of coherently scattering domains which was calculated employing the fundamental parameter approach [14] implemented in TOPAS 4.2 software for Rietveld refinement [15].
Porosity of the coatings was measured by image analysis of cross-sectional micrographs taken by a CCD camera. For analysis of optical micrographs, the software Lucia G (Laboratory Imaging, Czech Republic) was used. Reported values were the averages from 10 frames analyzed at 250× magnification. In addition to simple quantification of porosity, other factors were also examined. The size of individual pores was expressed as equivalent diameter
Fig. 1 The as-received coarse powders “C” (Metco 6232B) (left) and its thermally oxidized powders “COX” (right).

J Adv Ceram 2016, 5(2): 126–136
www.springer.com/journal/40145
129
(ED). Circularity (CIR) of pores (i.e., 2D projections of 3D objects) was equal to 0 for line and 1 for circle. Plasma sprayed coatings contained typically pores flattened parallel to the surface as a result of the lamellae (so-called splat) formation.
Microhardness was measured using a Hanemann microhardness head (Zeiss, Germany) mounted on an optical microscope with a fixed load of 1 N and a Vickers indenter. Twenty indentations made on randomly selected areas on the cross-section of each sample were analyzed. The surface roughness was recorded by the Surtronic 3P (Taylor Hobson, UK) using contact technique.
The reflectance measurement technique adopted in this work was realized using ultra-violet/visible/near- infrared (UV/Vis/NIR) spectrometer (Shimadzu, Japan). Prior to the actual measurement, the calibration process was conducted using the BaSO4 reference mirror in order to minimize the error from environment. The accuracy guaranteed by the manufacturer is that of wavelength ±0.3 nm, and the uncertainty of the measurement is less than 0.2%. The wavelength of incident light used for the reflectance measurement was in the range from 250 to 2000 nm, and the diameter of the measured area was about 2 cm. The corresponding band gap energy was estimated after converting the reflectance curves to absorbance and recalculated to get energy units [16].
The surface chemical composition of the powders and
coatings was measured under an X-ray photoelectron spectroscopy (XPS) unit. Experiments were carried out in an ultra-high vacuum chamber with a base pressure lower than 5×10⁷ Pa. XPS experiments were performed using an Omicron EA 125 multi-channel hemispherical analyzer with Al Kα line (1486.6 eV) as a primary photon source. To exclude charging effects during the XPS measurements, photoelectron binding energies (EB) were corrected with reference to the Ti 2p3/2 peak of TiO2, which was assumed to be positioned at a constant binding energy EB =
458.8 eV. The chemical composition of the coatings was
checked also by energy-dispersive X-ray microanalysis (EDS) with a desktop scanning electron microscope Phenom ProX (Phenom-World, Eindhoven, the Netherlands). This analysis was taken at 15 kV electron beam voltage using the same area for each sample (15 µm × 15 µm).
Kinetics of the photocatalytic degradation of butane C4H10 (0.87%) was measured by using a home-made stainless steel batch photo-reactor [17] with a Narva
black-light fluorescent lamp at wavelength 365 nm (input power: 8 W, light intensity: 6.3 mW/cm2). Gas concentration was measured with a quadrupole mass spectrometer JEOL JMS-Q100GC and a gas chromatograph Agilent 6890N. A high-resolution gas chromatography column (19091P-QO4, J&W Scientific) was also used. The sample from the reactor was taken via automatic sampling valve in 1 h interval. The reactor, which has a total volume of 3.5 L, was filled with oxygen at a flow rate of 1 L/min. Blank tests with a layer without titania were performed to establish the effect of photolysis and catalysis on the conversion of butane. The UV irradiation detected that there was no
(or immeasurable) depletion or conversion of butane, as a testing gas, into CO and/or CO2. The injection volume of butane into the photo-reactor was 30 mL.
The electrochemical impedance spectroscopy (EIS) was done on as-sprayed samples immersed in an electrolyte and placed in an electrochemical cell containing platinum wire as the counter electrode and a saturated calomel electrode (SCE) as the reference electrode. The electrolyte was simulated seawater with composition of 95 wt% H2O and 5 wt% NaCl. Electrochemical measurements were carried out with FAS2 electrochemical integrated tester (“femtostat”), produced by Gamry Device Company of America. EIS spectra of the coatings were measured at the open circuit potential. The signal amplitude was 10 mV, and the measurement frequency ranged from 10 kHz to 0.01 Hz.
3 Results and discussion
3. 1 Phase composition
The XRD patterns presented in Fig. 2 reveal that after oxidative annealing, both kinds of powders are almost of pure rutile composition (with anatase of about 1 wt% in the coarse powders and less than 0.5 wt% in the finer powders) which is richer in oxygen than both as-received powders. In the inset of Fig. 2, there is a Rietveld refinement of the coarse powders Metco 6232B, documenting that the dominant phases are Ti4O7 and Ti3O5, or the so-called titania Magnéli phases with n = 3, 4 in TinO2n1 [18], while the minor phases are Magnéli phase with n = 5 and potassium titanium bronze [19]. The fine powders Metco 102 in the as-received state are composed of mainly Magnéli titania with n = 9, 8, 5 and about 17 wt% of rutile,

J Adv Ceram 2016, 5(2): 126–136
www.springer.com/journal/40145
130
according to quantitative Rietveld refinement, with minor phases of n = 7, 10, 6.
The coatings were measured by XRD on the as-sprayed surfaces, and as illustrated in Fig. 3, there is very small difference in the patterns of (i) F and FOX, (ii) C and C-on-F, and (iii) COX-on-F and COX-on-F h. The Rietveld refinements of all the rutile containing coatings are notable by bad fit of (002) profile at ~ 64° 2θ and by occurrence of broad diffuse reflections on the 2θ angles in the vicinity of rutile reflections (these are marked by asterisks in Fig. 3). Gardon et al. [20] analysed Magnéli titania based feedstock powders sprayed by atmospheric plasma spraying (APS), and the diffraction pattern of the as-sprayed coating presented in their article also shows broad diffuse reflections in the 2θ positions close to rutile ones. However, since the XRD patterns served only for
phase identification and their detailed analysis was not perfomed, the authors abstained from discussing this feature further. The same feature was observed during a study of preferred orientation in plasma sprayed TiO2 and they attributed the reflections to suboxides [21]. Hence, we introduced nanocrystalline titania suboxides into the Rietveld model, but such efforts were fruitless as none of the Magnéli phases, i.e., n = 3, 4, …, 9, led to satisfactory result in Rietveld refinement.
The overall integral intensity of the broad diffuse reflections is in fact substantial, and the phase manifested by these reflections cannot be omitted. Pursuing this goal, we introduced into the pattern fitting rutile phase with crystallite size smaller than 10 nm. For such phase, the Rietveld refinement resulted in a satisfactory fit. One of the results with such structure model is in Fig. 4; due to the bad fit of (002) rutile profile, all the refinements were performed only in the range from 15° to 60° 2θ. Even with the
nanocrystalline rutile, the fit of measured intensities is not perfect, especially for (211) reflection, which is at higher angle than the fit. However, when the pairs of F and FOX on one side and COX-on-F and COX-on-F h on the other are to be compared, the latter has less of the nanocystalline phase and the sizes of crystallites of the standard rutile are too big to be evaluated by XRD. Whereas there is more of anatase in the F and FOX pair and the coarser rutile crystallites have average size about 80 nm. There is virtually no difference between the as-sprayed surface of C and C-on-F. Both are formed by about 40 wt% of Magnéli titania phases with n = 3, 4, i.e., the same phases as in the feedstock material. The results of quantitative Rietveld refinement are summarized in Tables 2 and 3. Please note that the error is estimated to reach about 15% due to the presence of nanocrystalline phase.
Fig. 4 Result of Rietveld refinement of “COX-on-F h” pattern with structural model including anatase, rutile (violet partial pattern), and nanocrystalline titanium oxide phase (green partial pattern).
Fig. 2 Powder XRD patterns of as-received and oxidized powders. The inset shows Rietveld refinement of “C” pattern. Anatase (A) and rutile (R) profiles are marked by their Miller indices.
Fig. 3 Powder XRD patterns of coatings with denoted anatase (A) and rutile (R) reflections. The asterisks mark presence of broad diffuse reflections.
J Adv Ceram 2016, 5(2): 126–136
www.springer.com/journal/40145
131
Table 2 XRD-based phase composition of powders
Powder Dominant phase
F Ti9O17 (~36 wt%), Ti8O15 (~23 wt%), rutile (~17 wt%), Ti5O9 (~10 wt%)
FOX Rutile C Ti4O7 (~58 wt%), Ti3O5 (~34 wt%)
COX Rutile
Table 3 Characteristics of the coatings: microhardness, phase composition, band gap energy, and photo-induced butane concentration drop (photocat.)
Sample Microhardness
(GPa) Phase composition
(%) Ebg(1)/
Ebg(2) (eV)Photocat.*
(%)
F 11.4±1.5 Rutile ~51 Nanocryst. ~47 Anatase ~2
3.80/3.27 3.9
FOX 10.8±2.0 Rutile ~50 Nanocryst. ~48 Anatase ~2
3.75/3.253.9
C 11.4±2.9 3.75/3.25 3.9
C-on-F 10.6±1.7
Ti4O7 ~26 Ti3O5 ~13(17) Rutile ~26 Nanocryst. ~31
3.75/3.22 3.7
COX-on-F 12.7±2.1 Rutile ~66 Nanocryst. ~33 Anatase ~1
3.65/3.20 3.8
COX-on-F h 10.7±1.7 Rutile ~72 Nanocryst. ~27 Anatase <1
3.65/3.15 3.9
* Average butane concentration drop per hour.
3. 2 Microstructure, porosity, and roughness
The values of porosity and other parameters of pores indicate presence of small differences among majority of coatings. For coatings sprayed using thermally oxidized powders, the majority of values (including microhardness) are slightly better (i.e., higher circularities, smaller sizes or pore concentrations) than for coatings sprayed from as-received powders. This means first of all lower porosity and smaller ED. Concerning the COX-on-F h, i.e., the coating sprayed under 200 mm spraying distance, its porosity value has approximately doubled compared to the other coatings. The ED of pores is slightly higher and the number of pores per square millimeter is relatively lower when compared to the other coatings. Further, the circularity of pores is found to be high in this coating, which indicates the existence of larger globular pores (cf. also Fig. 5).
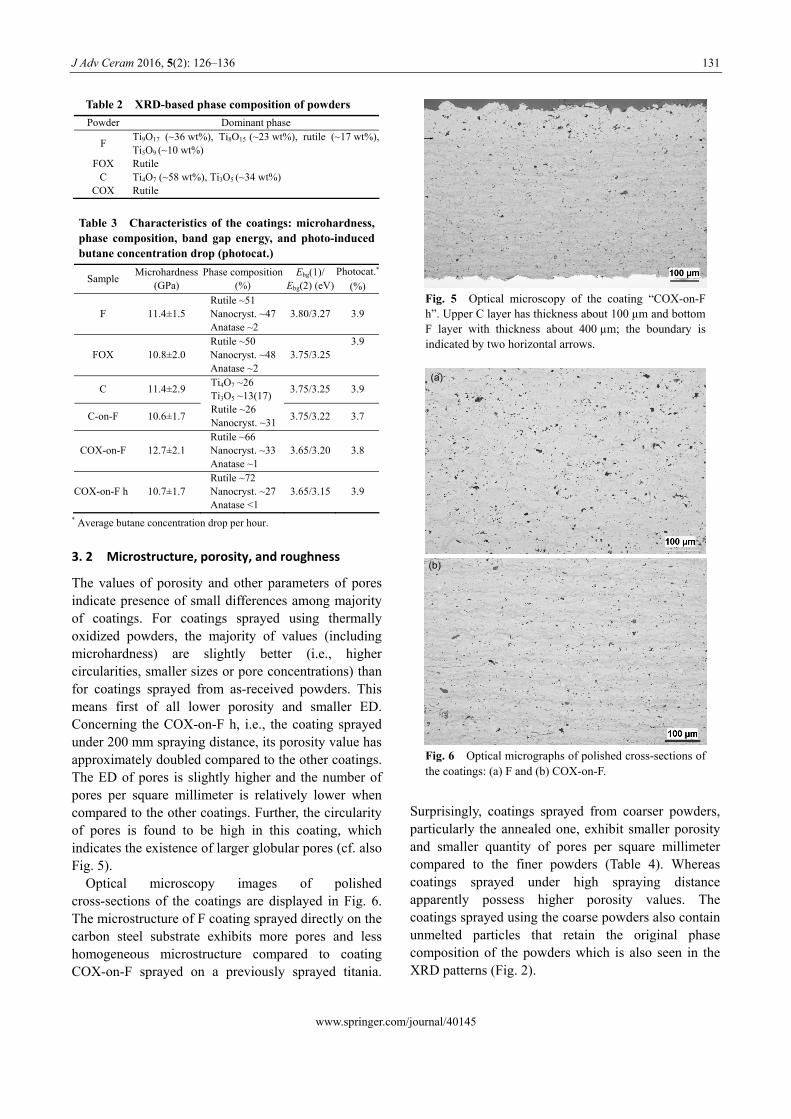
Optical microscopy images of polished cross-sections of the coatings are displayed in Fig. 6. The microstructure of F coating sprayed directly on the carbon steel substrate exhibits more pores and less homogeneous microstructure compared to coating COX-on-F sprayed on a previously sprayed titania.
Surprisingly, coatings sprayed from coarser powders, particularly the annealed one, exhibit smaller porosity and smaller quantity of pores per square millimeter compared to the finer powders (Table 4). Whereas coatings sprayed under high spraying distance apparently possess higher porosity values. The coatings sprayed using the coarse powders also contain unmelted particles that retain the original phase composition of the powders which is also seen in the XRD patterns (Fig. 2).
Fig. 5 Optical microscopy of the coating “COX-on-F h”. Upper C layer has thickness about 100 µm and bottom F layer with thickness about 400 µm; the boundary is indicated by two horizontal arrows.
Fig. 6 Optical micrographs of polished cross-sections of the coatings: (a) F and (b) COX-on-F.
(a)
(b)
J Adv Ceram 2016, 5(2): 126–136
www.springer.com/journal/40145
132
Table 4 Details of porosity, equivalent diameter of pores, circularity, minimum circularity in the measured images, and number of pores per square millimeter
Sample Porosity (%) ED (µm) Circularity CIRmin Number of pores (mm2)F 3.3±0.6 5.45 0.596 0.105 7729
FOX 3.1±0.4 4.99 0.578 0.109 11722 C 3.4±1.0 5.60 0.560 0.081 7901
C-on-F 3.2±0.5 5.41 0.490 0.076 10915 COX-on-F 2.0±0.3 5.37 0.581 0.088 6668
COX-on-F h 6.1±1.3 6.80 0.630 — 6787
Surface roughness values of the samples are summarized in Table 5. The coatings sprayed using the fine powders have markedly smoother surface. Both Ra (arithmetic average) and Rymax (maximum height of the profile) values are less the half of the values observed for coatings sprayed using the coarse powders. A large spraying distance does not contribute to the increase in surface roughness value. Because of the powder size as well as its character—fused and crushed fine powders versus agglomerated and sintered coarse powders, the difference in the resulting roughness is relatively high.
3. 3 Chemistry, photochemistry, and
electrochemistry
The band gap estimation of coatings was done assuming direct transition of charge carriers between the valence band and conduction band [22] (Table 3). The main absorption edge at Ebg(1) corresponds to non-stoichiometric titania features in rutile, and the secondary absorption edge at Ebg(2) corresponds to an absorption tail of delocalized electronic states [23,24] with a low excitation energy [25,26]. The highest values are detected for F coating and the lowest for COX-on-F and COX-on-F h. Since the difference among the coatings is small, a prediction of the photocatalytic behavior of individual coating cannot be done. The values of Ebg(1) are higher than tabulated values (3.2 eV for rutile), which means that for the photoactivation, radiation with higher energy will be necessary. In general, this finding is not advantageous for photocatalytic activity [27].
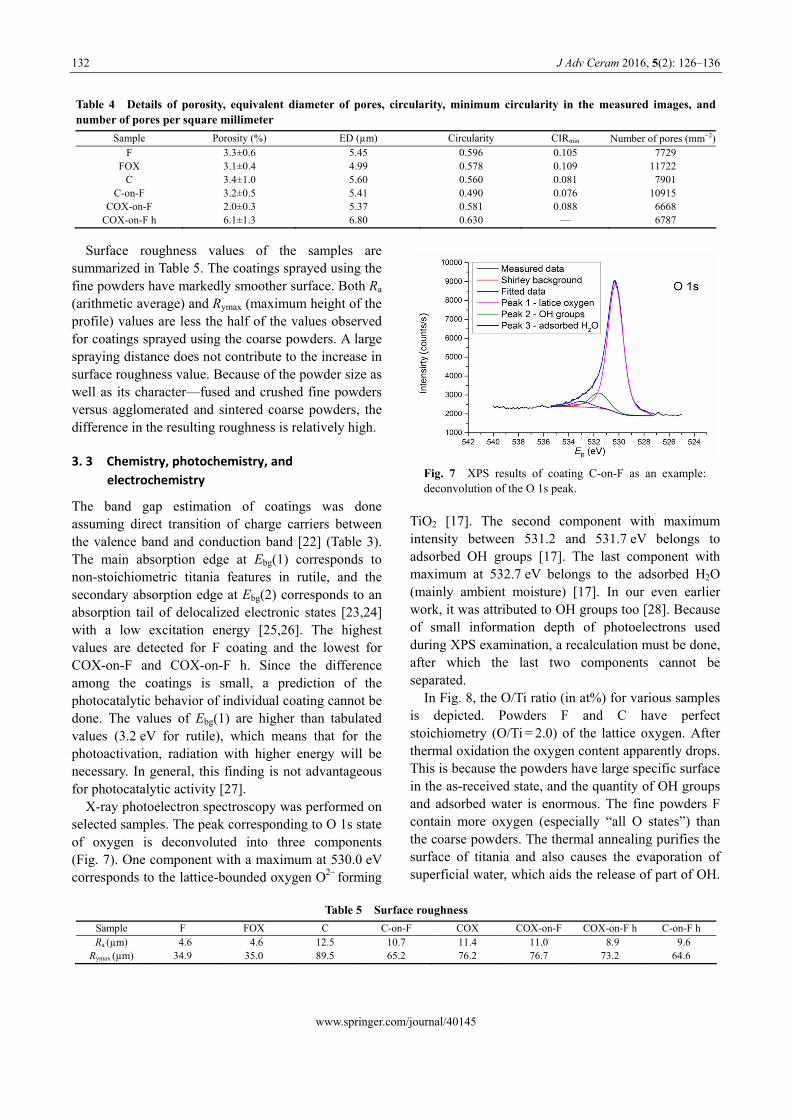
X-ray photoelectron spectroscopy was performed on selected samples. The peak corresponding to O 1s state of oxygen is deconvoluted into three components (Fig. 7). One component with a maximum at 530.0 eV corresponds to the lattice-bounded oxygen O2– forming
TiO2 [17]. The second component with maximum intensity between 531.2 and 531.7 eV belongs to adsorbed OH groups [17]. The last component with maximum at 532.7 eV belongs to the adsorbed H2O (mainly ambient moisture) [17]. In our even earlier work, it was attributed to OH groups too [28]. Because of small information depth of photoelectrons used during XPS examination, a recalculation must be done, after which the last two components cannot be separated.
In Fig. 8, the O/Ti ratio (in at%) for various samples is depicted. Powders F and C have perfect stoichiometry (O/Ti = 2.0) of the lattice oxygen. After thermal oxidation the oxygen content apparently drops. This is because the powders have large specific surface in the as-received state, and the quantity of OH groups and adsorbed water is enormous. The fine powders F contain more oxygen (especially “all O states”) than the coarse powders. The thermal annealing purifies the surface of titania and also causes the evaporation of superficial water, which aids the release of part of OH.
Table 5 Surface roughness
Sample F FOX C C-on-F COX COX-on-F COX-on-F h C-on-F h Ra (µm) 4.6 4.6 12.5 10.7 11.4 11.0 8.9 9.6
Rymax (µm) 34.9 35.0 89.5 65.2 76.2 76.7 73.2 64.6
Fig. 7 XPS results of coating C-on-F as an example: deconvolution of the O 1s peak.

J Adv Ceram 2016, 5(2): 126–136
www.springer.com/journal/40145
133
After spraying, the lattice oxygen content decreases and this is typical for plasma sprayed titania coatings [26]. The APS deposited titania coating generally becomes darker and semiconductive because of the presence of Ti3+ ions, which is a result of in-flight chemical reduction. Simultaneously, a secondary (plasma-induced) purification of surface takes place, which reduces “all O states” contents. This phenomenon is most pronounced for COX coating, followed by C coating, and less pronounced for F coating in which starting powders have a large specific surface area.
When we look on columns representing electron dispersion spectroscopy (EDS) data that takes into account composition deeper under surface than XPS (up to 1 µm versus only few nm), we see that F coating is richer in oxygen than C and COX coatings. This is because in the case of fine powders F, at the spraying more mass is in contact with oxygen from air, and after coating build-up this superficial droplet layers represent more mass of the coating. In opposite, in the coarse powder case, the coating is mostly built from the internal mass of particles that retain its original composition, which is in the case of Metco 6232B more oxygen depleted (cf. Table 2).
Comparison of the photocatalytic efficiency of samples expressed as the kinetics of butane decomposition is shown in Fig. 9 and Table 3. The kinetics of butane decomposition is similar for all studied coatings. The subtle differences show that better are those coatings which are sprayed from the powders without (Magnéli) suboxides, i.e., thermally oxidized. The strong differences in the surface roughness do not affect the butane decomposition results.
We have continuously observed formation of two products of photocatalytic reactions: carbon monoxide and carbon dioxide. The gain parameter C of carbon dioxide is only between 0 and 1. Much more important
is the gain of carbon monoxide, displayed in Fig. 10. We see the maximum gain, about 4.5, for the F and FOX coatings. Those coatings have maximum content of the nanocrystalline rutile phase according to XRD, and in the same time finer rutile (non-nano) crystallites, and moreover maximum of anatase (Table 3). From Fig. 10, we can deduce that for F and FOX coatings, the photochemical reaction is mostly complete, whereas for the other coatings the reaction semi-products are more chemically complicated, not detectable by our analyzer. Concerning the roughness effect, the coatings F and FOX with the lowest Ra and Rymax parameters
exhibit the highest carbon monoxide production. Concerning the diffent presence of OH groups, shown above as higher for all oxidated powder-based coatings, no influence of it onto photocatalysis is proven. (In general, superficial OH groups form OH radicals under UV light and it could promote photocatalysis, as demonstated elsewhere [25].)
Fig. 8 XPS and EDS results of O/Ti ratio for various samples.
Fig. 9 Kinetics of the photocatalytic decomposition of butane.
Fig. 10 Kinetics of the photocatalytically activated gain of carbon monoxide as a main product of butane decomposition.

J Adv Ceram 2016, 5(2): 126–136
www.springer.com/journal/40145
134
Electrochemical impedance spectroscopy of as-sprayed samples expressed as Nyquist plot is shown in Fig. 11. The curves characterizing five compared samples could be sorted into three categories. In the first group are coatings sprayed with fine powders (F: as-received, FOX: oxidized). Those coatings have maximum content of the nanocrystalline rutile phase according to XRD, and also finer rutile (non-nano) crystallites, and maximum of anatase (Table 3). The right, low-frequency branch of their Nyquist curves have similar height in terms of imaginary impedance Z″. In the second group are coatings sprayed with coarse powders (C: as-received, COX: oxidized). The low-frequency branch of their Nyquist plots have similar height in terms of Z″, which is smaller than for the first group. Sample COX-on-F represents thermally oxidized coarse powders sprayed onto a coating produced using as-received fine powders. Its Z″ is even lower. The time constant (relaxation time of charge carriers activated by the external field) differs for groups of samples with different Z″. Possible source of dispersion of time constant is the dispersion of capacitances arising from atomic-scale surface inhomogeneities such as grain boundaries, crystal faces on a polycrystalline electrode [29]. The samples sprayed with the fine powders have the highest impedance (i.e., resistivity and/or polarizability). This should be due to many grain boundaries in the ultra-fine rutile phase. Above mentioned two samples are followed by the samples sprayed with the coarse powders. They exhibit, according to XRD, phase mix composed of rutile and Magnéli (i.e., conductive) phases. The impedance of the double-layered coating, COX-on-F, is the lowest. That is because the
macroscopic effect of the boundary between COX topcoat and F sub-layer is not as important as the character of coating on the crystal size level.
Semiconductive TiO2 ceramics with finer crystallites represent an environment with more barriers for a charge carrier movement, which is advantageous for photocatalysis. The excited electrons and holes have before recombination more time to take place in reactions leading to the polutant (butane) decomposition [27].
Concerning the influence of powder thermal oxidation, we could adopt discussion opened with Sharma et al. [30]. The authors of this reference oxidatively annealed the as-sprayed coatings, which were oxygen-deficient, and showed that the splat boundaries are more electrically conductive in the as-sprayed material but become more insulating than the splat core after annealing. It is because of preferable re-oxidation of splat boundaries. Similarly, in our case, the coatings sprayed from oxidized powders are less chemically reduced than the coatings from the original powders. Splat boundaries would be similarly oxygen-deficient after spraying but the splat cores would be more electrically insulating in the oxidized powder-based coatings (COX and FOX) because the short dwell time in the plasma is not able to reduce the splat cores. However, our EIS measurements were done in salty water, so we had a two-component system: water and porous coating, and for such a complex system it was impossible to discriminate between splat cores and splat boundaries of the coating.
Coatings from oxidized powders are slightly more photocatalytic. High spraying distance used is good for obtaining of low band gap, whereas surface roughness and phase composition (i.e., other factors believed to influence the photocatalytic character of the TiO2 films) are not markedly different compared to standard spraying distance coatings. Fine powder based coating produces more CO than the others at photocatalysis. This may be a sign of absence of chemically more complicated reaction semi- products, but clear evidence is not reached in our experiments. Probably, a thermal posttreatment of the sprayed coatings could help us in the near future to obtain more precise answers.
Concerning the spraying itself, our opinion is (however difficult to quantify persuasively) that spraying of powders that are already oxygen depleted leads to less pronounced further oxygen depletion at
Fig. 11 Electrochemical impedance spectroscopy expressed as Nyquist plots.
J Adv Ceram 2016, 5(2): 126–136
www.springer.com/journal/40145
135
spraying compared to spraying of exactly stoichiometric TiO2 powders.
4 Conclusions
Titanium oxide coatings were deposited using two different commercial powders with markedly diverse mean size as well as particle size distribution. One half of each kind of powders was thermally oxidized. The thermal oxidation improved markedly the stoichiometry of the powders. After spraying, the coatings from oxidized feedstock powders showed slightly better character in majority of criteria (microstructure, superficial chemical purity). The photocatalysis was partly influenced by the crystallite size of rutile phase. In electrochemical spectroscopy, the main criterion sorting the coatings was also the presence of ultra-fine rutile or a mix of them with the Magnéli phases. The feedstock size itself and also the single-layer/bi-layer character is less important. The original presumption that the fine powder-based coatings would be structurally and mechanically superior and the coarse powder-based coatings would be photochemicaly superior was not confirmed at all. Titanium oxide was proven as a material with low sensitivity to initial powder character from the viewpoint of microstructure but slightly higher sensitivity from the standpoint of photochemical and electrochemical character, governed by phase composition and crystallite size.
Acknowledgements
The authors thank to Prof. S. Sampath, State University of New York at Stony Brook, for allowing the access to the thermal spray facility of CTS and for fruitful discussions on the experiments. The authors also thank to Dr. I. Beshajova, Faculty of Electrical Engineering, CTU Prague, for assistance at EDS measurement.
References
[1] Herrmann J-M. Heterogeneous photocatalysis: Fundamentals and applications to the removal of various types of aqueous pollutants. Catal Today 1999, 53: 115–129.
[2] Berger-Keller N, Bertrand G, Filiatre C, et al. Microstructure of plasma-sprayed titania coatings deposited from spray-dried powder. Surf Coat Technol 2003, 168: 281–290.
[3] Colmenares-Angulo J, Zhao S, Young C, et al. The effects of thermal spray technique and post-deposition treatment on the photocatalytic activity of TiO2 coatings. Surf Coat Technol 2009, 204: 423–427.
[4] Lee C, Choi H, Lee C, et al. Photocatalytic properties of nano-structured TiO2 plasma sprayed coating. Surf Coat Technol 2003, 173: 192–200.
[5] Bozorgtabar M, Rahimipour M, Salehi M, et al. Structure and photocatalytic activity of TiO2 coatings deposited by atmospheric plasma spraying. Surf Coat Technol 2011, 205: S229–S231.
[6] Chen H, Lee SW, Kim TH, et al. Photocatalytic decomposition of benzene with plasma sprayed TiO2-based coatings on foamed aluminum. J Eur Ceram Soc 2006, 26: 2231–2239.
[7] Kanazawa T, Ohmori A. Behavior of TiO2 coating formation on PET plate by plasma spraying and evaluation of coating’s photocatalytic activity. Surf Coat Technol 2005, 197: 45–50.
[8] Reisel G, Heimann RB. Correlation between surface roughness of plasma-sprayed chromium oxide coatings and powder grain size distribution: A fractal approach. Surf Coat Technol 2004, 185: 215– 221.
[9] Zhang H, Xie Y, Huang L, et al. Effect of feedstock particle sizes on wear resistance of plasma sprayed Fe-based amorphous coatings. Surf Coat Technol 2014, 258: 495–502.
[10] Niu Y, Liu X, Ding C. Phase composition and microstructure of silicon coatings deposited by air plasma spraying. Surf Coat Technol 2006, 201: 1660–1665.
[11] Skopp A, Kelling N, Woydt M, et al. Thermally sprayed titanium suboxide coatings for piston ring/cylinder liners under mixed lubrication and dry-running conditions. Wear 2007, 262: 1061–1070.
[12] Matikainen V, Niemi K, Koivuluoto H, et al. Abrasion, erosion and cavitation erosion wear properties of thermally sprayed alumina based coatings. Coatings 2014, 4: 18–36.
[13] Wang M, Shaw LL. Effects of the powder manufacturing method on microstructure and wear performance of plasma sprayed alumina–titania coatings. Surf Coat Technol 2007, 202: 34–44.
[14] Cheary RW, Coelho A. A fundamental parameters approach to X-ray line-profile fitting. J Appl Cryst 1992, 25: 109–121.
[15] Rietveld HM. Line profiles of neutron powder-diffraction peaks for structure refinement. Acta Cryst 1967, 22: 151–152.
[16] Christy AA, Kvalheim OM, Velapoldi RA. Quantitative analysis in diffuse reflectance spectrometry: A modified Kubelka-Munk equation. Vib Spectrosc 1995, 9: 19–27.
[17] Ctibor P, Píš I, Kotlan J, et al. Microstructure and properties of plasma-sprayed mixture of Cr2O3 and TiO2. J Therm Spray Techn 2013, 22: 1163–1169.
[18] Andersson S, Collén B, Kuylenstierna U, et al. Phase analysis studies on the titanium–oxygen system. Acta Chem Scand 1957, 11: 1641–1652.
[19] Sasaki T, Watanabe M, Fujiki Y. Structure of K1.0Ti8O16

J Adv Ceram 2016, 5(2): 126–136
www.springer.com/journal/40145
136
and K0.0Ti8O16. Acta Cryst 1993, B49: 838–841. [20] Gardon M, Dosta S, Guilemany JM, et al. Improved, high
conductivity titanium sub-oxide coated electrodes obtained by atmospheric plasma spray. J Power Sources 2013, 238: 430–434.
[21] Li JF, Ding CX. Crystalline orientation of plasma sprayed TiO2 coatings. J Mater Sci Lett 1998, 17: 1747–1749.
[22] Reddy KM, Manorama SV, Reddy AR. Bandgap studies on anatase titanium dioxide nanoparticles. Mater Chem Phys 2003, 78: 239–245.
[23] Moustakas NG, Kontos AG, Likodimos V. Inorganic– organic core–shell titania nanoparticles for efficient visible light activated photocatalysis. Appl Catal B: Environ 2013, 130–131: 14–24.
[24] Tsuyumoto I, Uchikawa H. Nonstoichiometric
orthorhombic titanium oxide, TiO2δ and its thermochromic properties. Mater Res Bull 2004, 39: 1737–1744.
[25] Barajas-Ledesma E, García-Benjume ML, Espitia-Cabrera I, et al. Determination of the band gap of TiO2–Al2O3 films as a function of processing parameters. Mat Sci Eng B 2010, 174: 71–73.
[26] Ctibor P, Neufuss K, Chraska P. Microstructure and slurry abrasion resistance of plasma sprayed titania coatings.
J Therm Spray Techn 2006, 15: 689–694. [27] Fujishima A, Zhang X, Tryk DA. TiO2 photocatalysis and
related surface phenomena. Surf Sci Rep 2008, 63: 515–582.
[28] Ctibor P, Štengl V, Píš I, et al. Plasma sprayed TiO2: The influence of power of an electric supply on relations among stoichiometry, surface state and photocatalytic decomposition of acetone. Ceram Int 2012, 38: 3453–3458.
[29] Lasia A. Electrochemical Impedance Spectroscopy and its Applications. New York: Springer-Verlag, 2014.
[30] Sharma A, Gouldstone A, Sampath S, et al. Anisotropic electrical conduction from heterogeneous oxidation states in plasma sprayed TiO2 coatings. J Appl Phys 2006, 100: 114906.
Open Access The articles published in this journal are distributed under the terms of the Creative Commons Attribution 4.0 International License (http://creativecommons.org/licenses/ by/4.0/), which permits unrestricted use, distribution, and reproduction in any medium, provided you give appropriate credit to the original author(s) and the source, provide a link to the Creative Commons license, and indicate if changes were made.