Embed Size (px)
Citation preview

165
ANCHORAGE OF TRANSVERSE REINFORCEMENT IN RECTANGULAR REINFORCED CONCRETE COLUMNS
IN SEISMIC DESIGN
H. Tanaka 1 , R. Park 2 , B. McNamee 3
SYNOPSIS
Four reinforced concrete columns with 400 mm (15.7 in) square cross sections were tested under axial compressive load and cyclic flexure to simulate severe seismic loading. The longitudinal reinforcement consisted of eight bars. The transverse reinforcement consisted of square perimeter hoops surrounding all longitudinal bars and cross ties between the intermediate longitudinal bars. The major variable of the study was the type of anchorage used for the hoops and cross ties. The anchorage details involved arrangements of perimeter hoops with 135 ° end hooks, cross ties with 90° and/or 180° end hooks, and cross ties and perimeter hooks with tension splices. Conclusions were reached with regard to the effectiveness of the tested anchorage details in columns designed for earthquake resistance.
KEYWORDS
Columns, cross-ties, detailing, ductility, earthquake resistance, rectangular hoops, reinforced concrete, reinforcement anchorage, tension splices, transverse reinforcement.
LIST OF SYMBOLS steel stress
ch
"sh
f 1
c
area of reinforcing bar area of concrete core measured to outside of peripheral hoop area of concrete core measured to outside of peripheral hoop gross area of column section total effective area of hoop bars and cross ties in direction under consideration per hoop set
= area of shear reinforcement per hoop set
= web width = neutral axis depth, or smaller of
the distance measured from the concrete side face to the centre of bar or one-half of clear spacing of spliced bars plus a half bar diameter, but not larger than 3d^
= distance from extreme compression fibre to centroid of the tension reinforcement
= bar diameter = concrete compressive stress = concrete compressive cylinder
strength
Associate Professor, Akashi Technological College, Japan. Professor of Civil Engineering, University of Canterbury, New Zealand. Professor of Civil Engineering, Drexel University, U.S.A.
h"
h c
H H u
K I
M. AC I
SlKP
yield strength of transverse reinforcement distance from centre of central stub to horizontal load pins at ends of column units width of concrete core measured to outside of peripheral hoop width of concrete core measured to centres of peripheral hoop horizontal force theoretical ultimate horizontal load given by Eq. 16 distance from section of maximum moment to section of zero moment development length equivalent plastic hinge length measured moment in column at face of central stub maximum measured moment in column at face of central stub theoretical flexural strength calculated using ACI concrete compressive stress block theoretical flexural strength calculated using the modified Kent and Park concrete compressive stress distribution
= axial compressive load on column = centre to centre spacing of hoop
sets = centre to centre spacing of hoop
sets given by Eq. given by Eq.
10 9
BULLETIN OF THE NEW ZEALAND NATIONAL SOCIETY FOR EARTHQUAKE ENGINEERING, Vol 18, No 2, JUNE 1985

166
V c = given by Eq. 12 V = factored (ultimate) shear force u Z m = given by Eq. 17 c c = compressive cylinder strain ecc = c o m P r e s s i v e cylinder strain at
extreme fibre of core concrete e = steel strain s
A = horizontal displacement = given in Fig. 17
A F C = given in Fig. 17 A = horizontal displacement at first y yield
^ _ curvature = rotation per unit length or strength reduction factor
d> = curvature at first yield p = ratio of volume of transverse
reinforcement to volume of concrete core
p = A /b d w s w 0 = rotation of central stub due to
unsymmetrical plastic hinging y = nominal displacement ductility
N factor = A / A Y
y R = real displacement ductility factor = A . / A or A , / A .
t y b y 1 . INTRODUCTION
Considerable efforts have been made in recent years to develop improved seismic design provisions for reinforced concrete columns in bridge substructures and building frames. The need for effective design provisions has been emphasised by damage caused to bridges and buildings during severe earthquakes. For example, the San Fernando earthquake in Southern California in February 1971 caused extensive damage to a number of recently constructed reinforced concrete columns in bridges and buildings, mainly because of inadequate detailing of those structural members for ductility (see Fig. 1 ) .
The most important design consideration for ductility in the potential plastic hinge region of reinforced concrete columns is the provision of sufficient transverse reinforcement in the form of rectangular arrangements of hoops, with or without cross ties, or circular spirals or circular hoops, in order to confine the compressed concrete, to prevent buckling of the longitudinal bars, and to prevent shear failure. Anchorage failure of the transverse reinforcement must be prevented if that reinforcement is to function effectively. Seismic design codes normally specify design provisions for the quantity, spacing and anchorage of transverse reinforcement in the potential plastic hinge region of columns.
The New Zealand concrete design code [1] specifies that hoops and cross tie reinforcement in reinforced concrete columns shall be anchored either by end hooks formed by a 135 ° turn around a longitudinal bar plus an extension of at least eight hoop or cross tie bar diameters at the free end of the bar
into the core concrete, or by welding the bar ends. These anchorage details can result in a complicated reinforcement fixing job, especially on site. This is because the hoops and cross ties need first to be placed over the ends of longitudinal bars and then shifted along the longitudinal bars to their correct position in the reinforcing cage. That is, the hoops and cross ties cannot be inserted directly through the side of the cage into their correct position.
In order to ease the difficulty of placing transverse reinforcement several alternative details for cross ties which simplify the fabrication of reinforcing cages have been used in the United States and other countries. One alternative detail involves the use of cross ties with 90° and 135° end hooks alternating along the member. Such cross ties can be inserted directly into the position from each side of the cage (see Fig. 2b) after the hoops are in place. Another alternative detail involves the use of 'J1
bars which have a 135° end hook and are inserted from each side of the cage and lapped in the core concrete (see Fig. 2c). Such 'J' bars can be used if the column size permits development of the tension splice. A further alternative detail is to use 'U' bars which are inserted from each side of the cage and lapped in the core concrete (see Fig. 2d). This 'U 1 bar detail is not recommended for transverse bars passing around the longitudinal bars in the corners of columns since the tension splice will not be effective in the cover concrete if the cover concrete spalls at large column deformations during severe seismic loading.
It should be emphasised that there is no great difficulty in fabricating standard reinforcing cages incorporating transverse reinforcement with 135° end hooks and no tension splices (see Fig. 2a), providing the fabrication is off site. In factory conditions cranes are readily available and reinforcing cages can be fabricated in the most convenient positions. However, the fabrication of cages on site in formwork using transverse reinforcement with 135° end hooks and no splices can cause difficulty. The alternative transverse reinforcement details shown in Fig. 2b, c and d may be effective enough to be used in a number of cases, for example where columns need only to be detailed for limited ductility.
This paper describes test results obtained from four reinforced concrete columns which contained the various arrangements of transverse reinforcement shown in Fig. 2. The columns were loaded under axial compressive load and cyclic flexure in the inelastic range to simulate severe seismic loading. The performance of the columns at various levels of displacement ductility factor was compared.

167
Fig. 1 Damage Caused to Some Reinforced Concrete Columns in Bridge and Building Structures During the 19 71 San Fernando Earthquake.
^ (a) Standard Hoop and Cross Tie with 135° End Hook
"7 (b) Alternating 90°
and 135° End Hooks
(c) Overlapping "J" Bars with Tension Splices
id) Overlapping "U " Bars with Tension Splices
Minimum Values
y 0 NZS 3101(1) 8dD 135°
ACI 318 (2) 10db 135°
6db 90% SEAOC (3) 10dD 135°
CEB-FP(4) 10dD 135°
AIJ (5) 6dD 135°
Where alternated with 135° end hooks
Fig. 2 Standard and Alternative Details Fig. 3 Anchorage of Transverse Reinforcement for Anchoring Transverse Around a Longitudinal Bar According Reinforcement for Reinforced to Some Codes. Concrete Columns.

168
2. COMPARISON OF NEW ZEALAND, UNITED STATES, EUROPEAN AND JAPANESE CODE PROVISIONS FOR THE ANCHORAGE OF TRANSVERSE REINFORCEMENT
It is of interest to compare the design provisions for the anchorage of rectangular transverse reinforcement given by some current seismic design codes in New Zealand, United States, Europe and Japan. Some code recommendations for the anchorage of the ends of transverse bars which are bent around longitudinal bars are shown in Fig. 3.
The New Zealand code, NZS 3101 [1], requires at least a 135 ° turn and an 8d, extension at the free end of the bar into the core concrete. Fig. 4, which is taken from the Commentary of NZS 3101, illustrates typical arrangements of transverse reinforcement in potential plastic hinge regions of rectangular columns. NZS 3101 also requires that the longitudinal reinforcement be placed not further apart between centres than 200 mm (7.9 in) and that the centre to centre spacing across the column section between cross linked longitudinal bars be not further apart than 200 mm (7.9 in).
The American Concrete Institute building code, ACI 318-83 [2], includes in its Commentary the example of transverse reinforcement by one hoop and three cross ties in the potential plastic hinge region of a rectangular column shown in Fig. 5. Anchorage of the hoop bars is achieved with a 135° turn and a 10d, extension. The cross ties have a 135^ turn and a 10d^ extension at one end and a 90° turn and a 6d^ extension at the other end. Consecutive cross ties have their 90° hooks on opposite sides of the column, evidently to counter the possible loss of efficiency of the 90° hook which is not embedded in the concrete core when the cover concrete spalls. Note that the AC I building code, requires the centre to centre spacing across the column section between cross linked bars to be not greater than 14 in (365 m m ) .
The recommendations of the Structural Engineer 1s Association of California [3] includes in its Commentary the examples of transverse reinforcement provided in potential plastic hinge regions shown in Fig. 6. The use of cross ties with tension splices ('J' bars) is illustrated in this figure.
The second draft of the seismic design appendix to the model code of the European Concrete Committee - International Federation of Prestressing [4] requires the ends of transverse bars to be anchored by at least a 135 ° turn and a 10d, extension of the free end of the bar into tne core concrete. Typical details of transverse reinforcement are similar to those in Fig. 4.
The code of the Architectural Institute of Japan [5] requires the ends of transverse bars to be anchored by at least a 135° turn. In the appendix of the commentary a 6d, extension of the free end
of the transverse bar into the core concrete is specified.
3. PREVIOUS RESEARCH INTO ANCHORAGE OF TRANSVERSE REINFORCEMENT
There has been some previous research into the anchorage of transverse reinforcement in reinforced concrete columns subjected, to seismic loading.
The New Zealand code specified end anchorage for hoops and cross ties, comprising a 135 ° turn and an 8d^ extension at the free end, has been shown by extensive tests on columns subjected to compressive load and cyclic flexure conducted at the University of Canterbury to give effective anchorage, even at high displacement ductility factors [6] .
Moehle and Cavanagh [7] have tested reinforced concrete columns under concentric monotonic compression with various transverse reinforcement details linking the intermediate longitudinal bars. It was found that the use of cross ties with a 90° turn at one end and a 135° turn at the other end, placed so that consecutive cross ties have their 90° hooks on opposite sides of the columns, were almost as effective as cross ties with 135 ° hooks at both ends. The columns of Moehle and Cavanagh were tested under monotonic compression and it is apparent that cyclic flexure, as in seismic loading, would impose a worse loading condition. Oesterle et al [8] have tested reinforced concrete walls with vertical boundary members containing reinforcement which was detailed as for columns. The use of cross ties with a 90° turn at one end and a 135° turn at the other end, alternated end for end over the height of the boundary members, was found to result in satisfactory behaviour during seismic load reversals in the inelastic range. The boundary elements were subjected to cyclic eccentric tension-compression loading. It is possible that for columns subjected to significant compressive loading, as well as cyclic flexure, greater deterioration of the transverse bar anchorage at the 90° turn may occur. This is because the free end of the bar with a 90° turn will be in the spalled cover concrete, rather than embedded in the core concrete, and the transverse bar will be required to undergo tensile strains well into the plastic range in order to confine the compressed concrete. It is also of note that some bending errors which resulted in hoop bar hooks having a turn of less than 135° at the ends, due to poor execution of work, was listed as one of the causes for the failure and collapse of reinforced concrete columns in the 1968 Tokachi-oki earthquake in Japan [5,9].
With regard to the tension splice detail for cross ties, such as shown in Fig. 6, Oesterle et al [8] recommended that it should not be used in the plastic hinge regions of vertical boundary members of walls. They state that because of severe cracking that can develop in boundary elements under inelastic load reversals, it is likely that the tension

169
^200'$200 ^200'
(a) Single hoop pius two (b) Single hoop plus two supplementary cross ties supplementary cross ties bent around longitudinal bars. bent around hoop.
>200 Hoops
<200 k a 1
m 3 (c) Two overlapping hoops
- preferred detail
(d) Two overlapping hoops
- not preferred to (c).
Fig. 4 Examples of Transverse Reinforcement in Columns Using Hoops With and Without Cross Ties According to Commentary on NZS 3101 [1]. (Dimensions in mm, 1 in = 25.4 m m ) .

170 Consecutive cross ties shall hove their 90-degree hooks on opposite sides of column. * —
10 dfc Extension
/-6d|) Extension t — 7 — — r L • « n 1 — >
X
r / i )
X
„ — * — J x Shall not exceed 14inches
Fig. 5 Example of Transverse Reinforcement in Column According to Commentary of ACI 318-83 [2]. (1 in = 25.4 m m ) .
h " FOR A " S H C R O S S I N G X - X A X I S
T E N S I O N S P L I C E
6 M A X . PER A C I - 3 1 8 - W H E R E A L T E R N A T E B A R S
A R E T I E D .
h / 1 h" / ^
1 /L •
• \k ft^-i
1 y —i vj
- S U P P L E M E N T A R Y T I E S
E N G A G E H O O P , T I E
S E C U R E L Y T O L O N G I T .
R E I N F O R C E M E N T .
1 8 0 ° B E N D S M A Y B E
M O R E C O N V E N I E N T F O R
P L A C E M E N T T H A N
1 3 5 ° B E N D S P E R M I T T E D
B Y C O D E .
H O O P S A N D S U P P L E M E N T A R Y
C R O S S T I E S C O N T R I B U T E
T O A " S h A S R E Q U I R E D B Y
E . G . 3 0 - 6 O R 3 0 - 7 .
, 6" M A X . P E R A C I - 3 1 8 W H E R E A L T E R N A T E BARS
A R E T I E D .
C O V E R M A Y B E
R E D U C E D T O 1 / 2 "
F O R E N D S O F
S U P P L E M E N T A R Y
C R O S S T I E S .
" j " B A R S M A Y B E U S E D
I F C O L U M N S I Z E P E R M I T S
D E V E L O P M E N T O F T E N S I O N
S P L I C E . W I R E T O G E T H E R A T
E N D S .
Fig. 6 Example of Transverse Reinforcement in Columns According to the Commentary of the SEAOC Recommendations [3]. (1 in = 25.4 m m ) .

171
splices in the cross ties would eventually become ineffective. It is also of note that the anchorage of transverse reinforcement by tension splices in the cover concrete without welding was shown to be a poor detail in the 1971 San Fernando earthquake [10], where circular bridge columns failed due to ineffective anchorage of lapped circular hoops when the cover concrete spalled.
It is evident that more tests are needed on reinforced concrete columns subjected to seismic loading to compare the performance of various anchorage details for transverse reinforcement. The importance of good detailing of reinforcement in reinforced concrete structures designed for earthquake resistance cannot be overemphasised . Significant protection against damage will be provided by properly detailed reinforcement.
4. TESTS ON REINFORCED CONCRETE COLUMNS SUBJECTED TO COMBINED AXIAL LOAD AND CYCLIC FLEXURE AND WITH VARIOUS ANCHORAGE DETAILS FOR TRANSVERSE REINFORCEMENT
4.1 Principal Dimensions and Loading Arrangements
Fig. 7 shows the principal dimensions and the loading arrangements for the four reinforced concrete column units which were constructed and tested. The column units had a total height of 3.9m (12 ft 9.5 in) and 400 mm (15.7 in) square cross section. The central stub, reinforced so as to prevent failure occurring in that part of the test unit, simulated an adjoining beam, footing, or pier cap.
During the tests the column axial compressive load was held constant at P = 0.2f 1A , where f 1 = concrete compressive cylindSr strength and A = gross area of column cross section. ^ A reversible horizontal load H was applied at mid-height to the central stub.
4.2 Details of the Reinforcement and Concrete
In each of the four column units the longitudinal reinforcement was eight 2 0 mm (0.79 in) diameter deformed bars of Grade 380 steel, arranged symmetrically around the perimeter of the column cross section as shown in Figs. 8 and 9. This longitudinal reinforcement was 1.57% of the gross area of the column cross section. The measured yield and ultimate strengths of the longitudinal reinforcement was 474 MPa and 721 MPa, respectively. Fig. 10 shows the measured stress-strain curve.
The transverse reinforcement in each of the four column units was from 12 mm (0.47 in) diameter deformed bar of Grade 275 steel, arranged as shown in Fig. 9. The measured yield and ultimate strengths of the transverse reinforcement was 333 MPa and 481 MPa, respectively. Fig. 10 shows the measured stress-strain curve. The centre to centre spacing of the transverse reinforcement set was 80 mm (3.15 in) in the 400 mm (15.7 in) long regions of column adjacent to the central stub and 160 mm
(6.30 mm) elsewhere (see Fig. 8 ) .
The variable in this study was the type of transverse hoops and cross ties present in the units (see Fig. 9 ) . Unit 1 had hoops with 135 ° end hooks and cross ties with 180° end hooks. Unit 2 had hoops with 135° end hooks and cross ties with 180° and 90° end hooks alternating from side to side along the column. Unit 3 had lapped 'U 1 bar hoops and lapped 'J1 bar cross ties with 180° end hooks. Unit 4 had hoops with 135° end hooks and lapped 5 J 1 bar cross ties with 180° end hooks. In all columns the extension of the end of the hoop or cross ties beyond the 90°, 135° or 180° turn was 6, 8 and 5 transverse bar diameters, respectively. All transverse reinforcement was deformed bar.
The concrete was cast with the column units in a horizontal position. The concrete was normal weight, with a slump of 7 5 mm (3.0 in) and a maximum aggregate size of 20 mm (0.79 in) . All column unites were cast at the same time from the sam^" :' batch of concrete. After casting the concrete was damp cured for 28 days. At the test age of about 2 months the compressive strength of the concrete as measured from 100 mm (3.9 in) diameter by 200 mm (7.9 in) cylinders was 25.6 MPa (3,770 psi) and the modulus of rupture as measured from 152 mm (6.0 in) x 152 mm (6.0 in) x 473 mm (18.6 in) prisms was 3.6 MPa (520 psi).
4.3 Comparison of the Transverse Reinforcement in the Columns With Code Requirements
The transverse reinforcement provided in the column units is compared with the requirements of the New Zealand and American Concrete Institute codes below.
In all the following calculations the strength reduction factor (j) is assumed to be 1.0.
(a) The length of the potential plastic hinge regions in the column units adjacent to the central stub in all column units was 400 mm (15.7 in).
NZS 3101 : When PQ £ 0. 3f'A c|>,this length is to be not SeSs than the longer cross section dimension (400 m m ) , and where the moment exceeds 0.8 of the maximum moment (320 m m ) . Hence 400 mm (15.7 in) governs.
ACI 318-83 : When P > 0.If 1A , this length is to Se not lesi than the depth of the member at the joint face (400 m m ) , one-sixth of the clear span of the member (533 m m ) , and 18 in (457 m m ) . Hence 533 mm (21.0 in) governs.
Hence only the NZS code is complied with.
(b) The centre to centre spacing of transverse reinforcement in potential plastic hinge regions of all column units was 80 mm (3.1 in).

172
NZS 3101
ACI 318-83
This spacing is to be not greater than one-fifth of the least lateral dimension of the cross section (80 m m ) , six times the diameter of the longitudinal bar to be restrained (120 m m ) , and 200 mm. Hence 80 mm (3.1 in) governs.
This spacing is to be not greater than one-quarter of the minimum member dimension (100 m m ) , and 4 in (102 m m ) . Hence 100 mm (3.9 in) governs.
Hence both codes are complied with.
(c) The length of the tension splice in the 'J' bar cross ties of Units 3 and 4 was 288 mm (11.3 in) and in the ! U I bar perimeter hoops of Unit 3 was 204 mm (8.0 in)
NZS 3101 This length is not to be smaller than
3 8 OA, c/f7" c
(mm) (1)
but not less than 300 mm, where A, = bar area and c = smaller or the distance measured from the concrete side to the bar centre or one half of clear spacing of spliced bars but not larger than 3d^ where d^ = bar diameter. For the units A, = 113 mm , c = 36 mm and f^ = 25.6 MPa. Eq. 1 gives 2§6 mm and therefore £, = 300 mm (11.8 in). a
ACI 318-83 : Assuming a Class C splice, this length is not to be smaller than
1.7£ d = 1.7 x 0.04A b (2)
(3)
2
but not less than 1.7 x 0.0004d Kf , (in) b yh
For the units A, = 0.175 in f = 48,300 psi, f = 3,710 psi and d b = 0.47 i n 2 . Eq. 3 is critical and gives 1.7£ d = 15.4 in (392 m m ) .
Hence both codes are not complied with.
(d) The extension of the free end of the cross ties was 60 mm (2.4 in) beyond the 180° turn and 72 mm (2.8 in) beyond the 90° turn. The extension of the free end of the square hoop was 96 mm (3.8 in) beyond the 135° turn.
NZS 3101
ACI 318-83
The extension is to be at least 8d, = 96 mm (3.8 in) beyond the 135° and 180° turn (90° turns are not permitted) .
The extension is to be at least 10d b = 120 mm (4.7 in)
3D° and 135° turns beyond 181 and 6d,
beyond 90° turns.
Hence the extensions were less than required by the codes in most cases.
(e) The total area of hoop bars and cross ties per hoop set in the potential plastic hinge regions of all column units was A g h = 3 x <TF x 6 2) = 339 m m 2 (0.53 in 2) , assuming that all three transverse bars are effective.
NZS 3101 : This area is not to be smaller than
fA ^ f A_, = 0. 3 S l_h H - i| -p— x sh
and
0.5 + 1.25 |>f 'A c g (4)
A , = 0.12s, h" T
sh h f yh 0.5 +
1.25 (f)f 1A e g (5)
where s^ = centre to centre spacing of hoop sets, h" = width of concrete core measured to outside of peripheral hoop, A = gross area of column slction, A c = area of concrete core measured to outside of peripheral hoop, f f = concrete compressive cylinder strength, f = yield strength of transverse reinforcement, and P =
e compressive load on column. For the units s, = 80 mm, h" = 320 mm, A /A = 1 . 5 6 3 , f = 25.6 MPa, gf ? = 333 MPa and
^ 0 . 2 . E Q . 4 P /(j)f'A gives sh
c g249 mm2 and Eq. 5 gives 177 mm2.
Hence A , sh governs. 249 m m 2 (0.39 in 2)
ACI 318-83 : This area is not to be less than
sh
and
A s h
0.3sh U-2 c l A c h
f 1
c
0.12sh c f
(6)
(7) yh
where s = centre to centre spacing of hoop sets, h = width of concrete core measured to centres of peripheral hoop, = area of concrete core measured to outside of peripheral hoop, and the other notation is as for Eqs. 4 and 5. For the unit A
Eq. 6 gives , = 32 0 mm^ and Eq. 7 gives
A s n ^ 2 2 7 Hence A , -9 o sn n z (0.50 in^) governs.
Hence both codes are complied with.
72 mm (2.8 in)

Pe 173
150:
1600mm
400
H_ 2
Note: Loads H can be reversed
J600mm
mo:
H
Central stub
400
400 SECTION A-A
H_ 2
Fig. 7 Principal Dimensions and Loading Arrangements for the Column Units.
600
1800
150
Loading direction
200\
Loading plate
(Wmm 11
Transverse Reinf. -D12
Longitudinal Reinf. -HD20
Sleeve for pin (50mm 01
Anchor plate (11mm ft I All dimensions
in millimetres
Fig. 8 Longitudinal Section of Column Units Showing Details of Reinforcement.

174
400
180°hook with 5db extension
135° hook with 8dD
extension
m • 1 i -90°hook
with 6dD
extension
STANDARD UNIT WITH HOOPS AND CROSS TIES
UNIT!
CROSS TIES WITH 180° AND 90° HOOKS ALTERNATING FROM SIDE TO SIDE ALONG COLUMN
UNIT 2
180°hook with 5d^ extension
^90° turn with 21ofo extension
(lido of tension) splice
Loading Direction
24 dh of tension splice
NOTE: Bar laps were not welded
LAPPED PERIMETER HOOPS "U" BARS AND 'J " CROSS TIES
UNIT 3
^135° hook with 8dfr extension
LAPPED CROSS TIES OF "J " BARS
UNIT 4
Fig. 9 Transverse Sections of Columns Showing Details of Reinforcement.
AXIAL
All dimensions in millimetres
Fig. 10 Measured Stress-Strain Curves for the Reinforcing Steel (1 MPa = 145 psi).
Fig. 11 Loading Arrangements and Potentiometer Positions.

175
(f) The total area of shear reinforcement per hoop set in the potential plastic hinge regions of all column units was „ A = 3 x (tt x 6 2) = 339 m m 2 (0.53 in) , assuming all three transverse bars are effective.
NZS 3101 This area is to be not smaller than
V V / f y h ( r a m } ( 8 )
where v. = V /b d (MPa) (9) i u w
0.1 (MPa) (10) f'A c g
where V factored (ultimate)
ACI 31£
shear force, b = web width, w . s = centre to centre spacing of hoop sets, d = distance from extreme compression fibre to centroid of tension reinforcement, p = A /b d,
-t _ w _ s w and A = area of tension reinforcement. For the units, V = theoretical ultimate horizontal load/2= 158 kN (35.4 kips), b = 400 mm, d = 335 mm, p = 9^2/(400 x 335) = 0.00703, ¥' = 25.6 MPa, f , = 333 MPa, s c= 80 mm, and y
P /f'A = 0.2. e c g Eqs. 8 to 10 give A = 27 mm (0.04 in 2) . [Outsicle the potential plastic hinge region v is greater than given by Eqs. 8 to 10 and the required A is even smaller]. v This area is to be not smaller than
moment in the upper and in the lower half of each test unit was similar to that in a column between the face of an adjoining member and a point of contraflexure. The horizontal load cycles were applied statically. During the tests the axial load applied by the DARTEC machine was adjusted to compensate for the component of axial load introduced into the column by the members of the horizontal load frame which were pinned to the column ends.
During each test, once the required level of axial load had been applied, the next step was to determine the "first yield" displacement of the column. The first yield displacement was defined as that obtained assuming elastic cracked section behaviour up to the theoretical ultimate horizontal load. The theoretical ultimate horizontal load was computed using the measured stress-strain relation for the longitudinal reinforcement, the ACI rectangular compressive stress block with the measured concrete cylinder strength, strength reduction factor <J> of unity, and an extreme fibre concrete compressive strain of 0.003. In the test the elastic cracked section stiffness was obtained from an initial cycle of horizontal loading of up to ± 0.7 5 of the theoretical ultimate horizontal load, H , calculated including the P-A effect. T^e horizontal displacements of the central stub reached in each direction at a load of 0.7 5H were averaged and divided by 0.75 to find fee first yield displacement A .
The subsequent horizontal load cycles were displacement controlled and consisted of two cycles each to nominal displacement ductility factors y N = A/A of ± 2, ± 4, ± 6, ± 8 and sometimes higher, where A = maximum horizontal displacement of the central stub.
4.5 Instrumentation
(V - V ) s 9
A v = % J (in 2) (ID yh
where V = 2(1 + o n n ;L ) Zf^b d c 2 0 0 OA c w g
(lb) (12)
For the units^Eqs. 11 and 12 give A v = 0.004 in (2 m m 2 ) . [Outside the potential plastic hinge -region required A is 0.007 in (5 m m 2 ) ] . v
Hence both codes are complied with.
4.4 Testing Procedure
The constant axial load of P = 0.2f 1A = 819 kN (184 kips) was e
applied to each column unit by a 10 MN DARTEC electro-hydraulic universal testing machine through cylindrical steel bearings which allowed free rotation at the ends of the columns. The reversible horizontal load was applied to the central stub by a double acting 500 kN MTS electro-hydraulic servo jack which could be load or displacement controlled. Fig. 11 shows the test set up. The distribution of bending
The horizontal displacement of the central stub was measured by three linear potentiometers mounted on a rigid frame. The three potentiometers were positioned with a vertical spacing of 150 mm (5.9 in) and hence the rotation of the central stub could also be calculated. The horizontal displacement measured by the centre potentiometer and the horizontal load measured by the load cell were used to drive an X-Y plotter during testing to trace out the load-displacement hysteresis loops.
In order to obtain the distribution of curvature along the columns, and the concrete strains, a further series of pairs of linear potentiometers were placed at 16 0 mm (6.3 in) centres up and down the length of each column adjacent to the central stub. These potentiometers were mounted on 8 mm (0.31 in) diameter steel rods which passed through the concrete in the plane of the column section and at right angles to the neutral axis. The rods had been cast in the concrete but the cover concrete surrounding the end of each rod was not present over a depth of 25 mm (1.0 in) and a diameter of 30 mm (1.2 in) in order to avoid interference by crushed

176 cover concrete. The positions of the potentiometers are illustrated in Fig. 11.
Electrical resistance strain gauges were attached at various locations on the hoops, cross ties and longitudinal reinforcement within the potential plastic hinge regions.
4.6 TEST RESULTS
4.6.1 General Observations and Horizontal Load-Displacement Behaviour
Horizontal load versus horizontal displacement hysteresis loops measured for all column units are shown in Figs. 12 to 15. Also shown in those figures are the theoretical ultimate horizontal loads, H , calculated as described in Section 4.4. u
The slope of the theoretical ultimate horizontal load lines is due to the P - A effect which decreases the horizontal load carrying capacity of the column with increasing horizontal displacement. The measured hysteresis loops shown in Figs. 12 to 15 for behaviour up to a nominal displacement ductility factor - 6 illustrate stable behaviour, good energy dissipation and limited reduction in strength. All column units reached a higher flexural strength than the calculated theoretical strength. Fig. 16 shows the damage visible in the most critical region of the columns at the end of testing.
The plastic rotation occurred unsymmetrically either above or below the central stub in most of the column units. Further excursions to greater horizontal displacements led to a concentration of the rotation in the plastic hinge which had formed first. This behaviour could be detected by the measured rotation of the central stub and was visibly obvious at the last stages in some tests. Fig. 17 shows the implication of unsymmetrical plastic hinging which results in a rotation 6 of the central stub. To account for the concentration of plastic rotation in only one plastic hinge in a column unit, the quantity 0h has to be added to the horizontal displacement A measured at the centre of the central stub. The rotation 6 was calculated from the difference in the displacements measured by the two linear potentiometers at the top and bottom positions on the central stub. The ductility factor calculated from (A + 0h) is referred to as the real displacement ductility factor, y R, and that calculated from A/A (ignoring 9) is referred to as the nominXl displacement ductility factor.
Table 1 lists the measured first yield displacements (defined in Section 4.4), the range of maximum moments measured at the peaks of the loading cycles to u = ± 2 , ± 4 and ± 6, and the real and nominal displacement ductility factors at some stages of loading. The ratio of the maximum moment measured in the second cycle to nominal = ± 6 to the maximum moment measured for each column unit varied between 0.88 and 0.96, as listed in Table 1. It can be concluded that for real displacement ductility factors up to at least 6, the behaviour of all column units was satisfactory , except perhaps for Unit 3.
During the final stage of testing the visible damage was crushing of concrete and slight or serious buckling of the longitudinal compression reinforcement. (See Fig. 16). In the case of Unit 2 the 90° hooks in the cross ties were observed to commence to open at a real displacement ductility factor of about 9, and in the case of Unit 3 the 90° bends in the square perimeter hoops formed of lapped 'U' bars commenced to open at a real displacement ductility factor of about 7, and in the next cycle of loading the strength of the members rapidly degraded due to buckling of the longitudinal reinforcement and ineffective confinement of the concrete. Note that the laps in the 1U' bars in Unit 3 were in the faces of the column parallel to the neutral axis.
4.6.2 Concrete Compression Strains and Buckling of Longitudinal Reinforcement
Initial crushing of the cover concrete was observed near or at peak load during the first cycle to a nominal displacement factor of =. 2 at concrete surface compressive strains which varied between 0.004 and 0.0073. Substantial spalling off of the cover concrete occurred during loading to = 4 at concrete surface compressive strains of 0.011 to 0.017. These surface strains were calculated from the potentiometer readings for the 160 mm (6.3 in) gauge length adjacent to the central stub. The nominal displacement ductility factors when first crushing and spalling off of the cover concrete was observed are marked on Figs. 12 to 15.
The gradual nature of the observed spalling of the cover concrete meant that a sudden degradation of horizontal load carrying capacity did not occur. Hence it would appear to be unnecessary to adopt a limiting compressive strain at which cover concrete is assumed to be suddenly lost in analytical moment-curvature studies, but rather the full range of the stress-strain curve for unconfined concrete for the cover concrete could be used.
The calculated compressive strains on the surface of the core concrete at various real displacement ductility factors are shown in Fig . 18. The linear relationship between these two quantities for the four column units is apparent until a real displacement ductility factor of about 10 is reached when the strains in Units 2 and 3 increased more rapidly, evidently because of the less effective confinement from the cross ties with 90° and 180° end hooks and the perimeter hoop formed from 1U' bars with tension splices.
Buckling of longitudinal reinforcement was observed in all column units and commenced at the stages marked in Figs. 12 to 15. In the case of Units 1 and 4, only incipient buckling was visible in the final stages of testing. In the case of Units 2 and 3 the buckling in the final stages of testing was more serious. In Units 1 and 4 the buckling occurred between hoops, while for Units 2 and 3 it occurred over a longer length, as illustrated in Fig. 19. It can be concluded that cross ties with 90° end hooks and peripheral

E — n *
L j
Real Displacement Ductility Factor (top side - first cycle)
2.0 3.5 5.5 83 12.0 15.9
Nominal Displacement Ductility Factor L 2 & 6 8 12
incipient buckling of longitudinal reinforcement
Hu (Theoretical)
~8 -6 -L -2 J-&00 Nominal Displacement Ductility Factor
I I I I -12.7 -KU -6.1 -22
Real Displacement Ductility Factor (top side - first cycle J
HORIZONTAL DISPLACEMENT (mm)
1st cycle 2nd cycle
o First yielding of tension reinforcement
v First visible crushing of cover concrete
• Onset of spalling off of cover concrete
Fig. 12 Measured Horizontal Load-Displacement Loops for Unit 1.
Real Displacement Ductility Factor (bottom side-first cycfe )
2J 5.5 93 133 18.1 22.2
I I I I I I Nominal Displacement Ductility Factor
Commencement of opening out of 90° hook of supplementary tie
Commencement of visible buckling of longitudinal
reinforcement
(Theoretical)
(Theoretical)
-8 -6 - 4 -2 Nominal Displacement Ductility Factor
15 -82 -5.1 • Real Displacement Ductility
(top side- first cycle)
2.2 Factor
<r HORIZONTAL DISPLACEMENT (mm)
-— 1st cycle — 2nd cycle o First yielding of
tension reinforcement First yielding of compression reinforcement First visible crushing of cover concrete Onset of spalling off of cover concrete
Fig. 13 Measured Horizontal Load-Displacement Loops for Unit 2.

Real Displacement Ductility Factor (bottom side - first cycle ) 2.0 4.9 9.1 U>.1
Nominal Displacement Ductility Factor 2 £ 6 8
Commencement of opening out of 90° turn of square hoop
(Theoretical! -Large buckling of long, reinf
-8 -6 -L -2 Nominal Displacement Ductility Factor
I I I I -M.5 -9.8 -5.7 -2.0
Real Displacement Ductility Factor (bottom side- first cycle 1
HORIZONTAL DISPLACEMENT (mm)
— 1st cycle - - 2nd cycle o First yielding of
tension reinforcement First yielding of compression reinforcement First visible crushing of cover concrete Onset of spoiling of off cover concrete
Fig. 14 Measured Horizontal Load-Displacement Loops for Unit 3.
1 — 1
UNIT 4
Real Displacement Ductility Factor (bottom side - first cycle I
19 5.0 9.0 13.0 17.3 2U
Nominal Displacement Ductility Factor 2 £ 6 8 12
Commencement of visible buckling of
long, reinf.
Hu
(Theoretical)
-8 -6 -L -2 Nominal Displacement Ductility Factor
I I I I -13.5 -9.9 -62 -22
Real Displacement Ductility Factor (bottom side - first cycle )
0 100
HORIZONTAL DISPLACEMENT (mm)
— 2nd cycle First yielding of tension reinforcement
First visible crushing of cover concrete Onset of spoiling off of cover concrete
Fig. 15 Measured Horizontal Load-Displacement Loops for Unit 4.

179
(a) Unit 1 at y = 12. The transverse (b) Unit 2 at y = 12. The 90° hooks at reinforcement is still effective. one end of the interior cross ties
have opened.
Fig. 16 Visible Damage to Column Units at Final Stages of Testing.

Fig. 18 Extreme Fibre Core Concrete Compressive Strains With Real Displacement Ductility Factor.

1 8 1
hoops with tension splices were less effective for controlling the buckling of longitudinal bars.
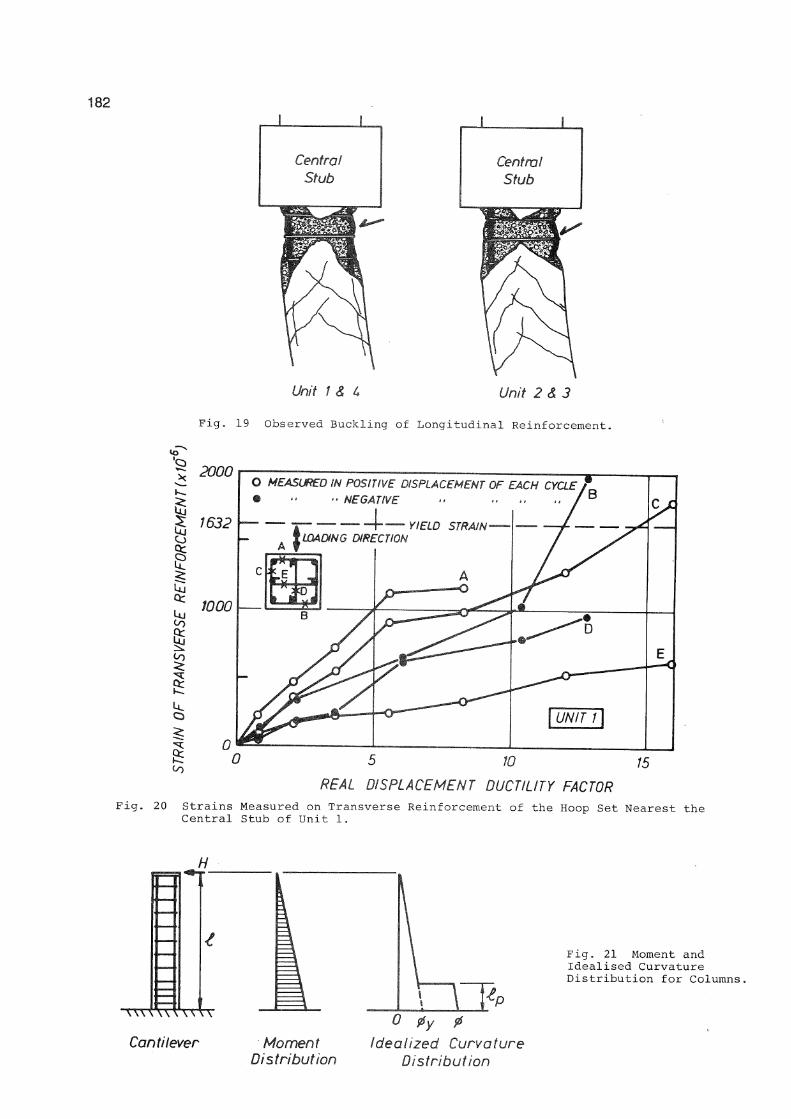
4.6.3 Strains in Transverse Reinforcement
Strains measured by electrical resistance strain gauges on the transverse reinforcement of Unit 1 are shown plotted against the real displacement ductility factors in Fig.20. The strains plotted are the average of pairs of strains measured on opposite sides of the bar. The individual strain readings indicated that there was significant bending of the transverse reinforcement and hence averaging of the pairs of strain readings was necessary to obtain the axial tensile strain.
For Unit 1, the average strains measured seldom reached yield, even at the final stages of testing. The highest strains recorded were on the square hoops (gauges A, B and C) and these eventually reached yield strain on the hoop sides in the direction of horizontal load and at right angles to it. The strains recorded on the cross tie in the direction of loading (gauge D) reached about 59% of yield, but the strains recorded on the other cross tie, which was very close to the neutral axis, reached only about 38% of yield (gauge E ) .
For Unit 2, the strains measured on the cross tie with alternating 90° and 180° end hooks in the direction of loading indicated a reduction in strain at a real displacement ductility factor of about 13, which coincided with the commencement of visible buckling of the longitudinal reinforcement.
For Unit 3 the strains measured on the lapped 1U' bar hoops showed an abrupt decrease when a real displacement ductility factor of 9 was reached, which coincided with the serious opening of the 90° corner bends of those bars and a degradation of the moment of resistance of the column. Corresponding to this decrease in peripheral hoop strain, the strain in the cross tie nearest and parallel to the neutral axis became larger, indicating that the loss of confinement by the peripheral hoops had resulted in a deepening of the neutral axis position. The deepening of the neutral axis position at this stage was confirmed by the change in the calculated position as obtained from the extreme fibre strains measured on the column faces by the pairs of linear potentiometers.
For Unit 4, the strains measured on the 1 J 1 bar cross ties at positions D and E in Fig. 20 were very similar to the strains measured at the same positions on the cross ties with a 180° end hook of Unit 1 at corresponding real displacement ductility factors. Therefore, it can be concluded that the anchorage by tension splices of the 'J' bars was effective as far as these columns were concerned. However, it should be noted that the maximum measured strain on the 1 J ! bars was up to 60% of the yield strain, which was similar to the maximum strain measured on cross ties of Unit 1. This means that the effectiveness of anchorage
by tension splices of 'J 1 bars was not fully investigated in these tests because the tension force induced in the 1 J 1 bars was well below the yield tension force of those transverse bars. It should also be noted that at the peaks of applied moment the measured neutral axis depth increased from about 0.3 to 0.6 of the section depth, in proportion to the increase of displacement ductility factor. That is, the neutral axis depth increased in proportion to the extent of damage to the concrete in the compression zone. Hence there was always vertical compressive stress present over part of the length of the tension splices for Units 3 and 4.
4.6.4 Curvature Distribution, Curvature Ductility and Equivalent Plastic Hinge Length
The curvature distribution measured up the height of the columns showed that yielding of the column generally was spread over the end 400 mm (15.7 in) of column adj acent to the central stub.
The curvature at first yield, <j) , defined as the average curvature measured in the 160 mm (6.3 in) gauge length nearest the central stub in the initial cycle of horizontal loading at ± 0.75 of the theoretical ultimate horizontal load divided by 0.75, is tabulated for the column units in Table 1. The curvature ductility factors § I § reached at that critical section in plastic hinge regions of the column units at various stages of loading is also listed in Table 1.
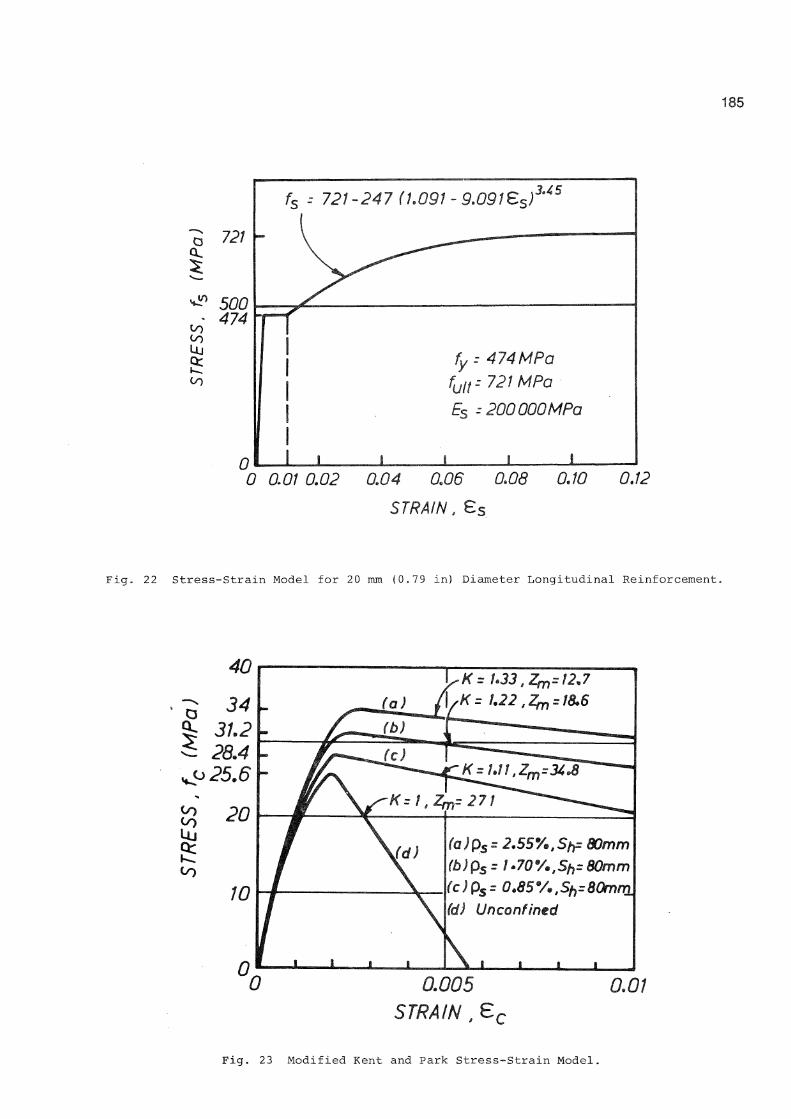
The equivalent plastic hinge length was calculated for all test units at measured deformations corresponding to the attainment of a nominal displacement ductiluty factor of ± 6. Eq. 13, which is based on the assumed curvature distribution illustrated in Fig. 21, was used.
v A t = (-F • ¥ ) + <* - v £ P V - lf\
(13)
where A ^ , A F C = real horizontal displacement at y N = ±6 in the second cycle, I = distance from face of central stub to point of zero moment at end of column {- 1600 mm in these tests), and = equivalent plastic hinge length. ^ The range of values for the equivalent plastic hinge length so calculated was 172 to 281 mm, with an average of 234 mm which corresponds to 0.59 of the overall depth of the column section.
4.7 THEORETICAL CONSIDERATIONS
4.7.1 Theoretical Flexural Strength
The theoretical flexural strengths of the column units were calculated using the requirements of strain compatibility and equilibrium [11]. It was assumed that the stress-strain relation for the longitudinal reinforcement was as shown in Fig. 22, which was a very close fit to the
182
I
1 I ct to
1 O
Unit 1 & U Unit 2 & 3
Fig. 19 Observed Buckling of Longitudinal Reinforcement.
2000
1632 h—
1000
P 0 5 10 to
REAL DISPLACEMENT DUCTILITY FACTOR Fig. 20 Strains Measured on Transverse Reinforcement of the Hoop Set Nearest the
Central Stub of Unit 1.
H
Fig. 21 Moment and Idealised Curvature Distribution for Columns.
Cantilever Moment Idealized Curvature Distribution Distribution

183 measured curve. The flexural strengths were were calculated using two concrete compressive stress distributions, namely:
1. The ACI rectangular stress block with the measured f' value and an extreme fibre concrete compressive strain of 0.003.
2. The concrete compressive stress distribution given by the modified Kent and Park stress-strain relationship for concrete confined by rectangular arrangements of transverse reinforcement [12]. In the analysis the extreme fibre concrete compressive strain was increased from zero by increments of 0.00001 until the calculated moment became a maximum. This extreme fibre concrete strain at the maximum moment was found to be 0.00456. The stress-strain equations are:
For e < 0.002K c
Kf ' c
2e 0.002K 0.002K
For e > 0.002K c
f c = K f c [ 1 - V e c - ° - 0 0 2 K )
where K 1 + P f u
5 y h
f 8
c
(14)
(15)
(16)
where e concrete compressive strain, f c = concrete compressive stress, f 1
concrete compressive cylinder c
strength, p ratio of volume of transverse reinforcement to volume of concrete core, f ^ = yield strength of transverse reinforcement, h" = width of concrete core of section measured to outside of perimeter hoop, and s^ = centre to centre spacing of hoop sets. For the concrete core of the column units t\ MPa, h" 0.0255.
25.6 MPa, f h - 333 = 320 mm, s^ = 80 mm Xnd p g = For the concrete cover
P s = 0 was assumed (that is, the cover concrete was assumed to behave as unconfined concrete). The concrete stress-strain relations so defined are shown in Fig 23, where curve (a) is for the core concrete and curve (d) is for the cover concrete
The theoretical flexural strength for the column units calculated using the ACI rectangular concrete compressive stress block was 252 kNm (186 kip ft). The theoretical flexural strength calculated using the modified Kent and Park stress-strain relations for the concrete was 265 kNm (195 kip ft). The neutral axis depth at the theoretical flexural strength obtained using the Kent and Park model
was 0.34 of the section depth.
As shown in Table 1, the maximum moments measured in the column units in loading cycles to nominal displacement ductility factors of = ± 2, ± 4 and ± 6 exceeded the theoretical value calculated using the ACI rectangular concrete compressive stress block by 11 to 15%,and exceeded the theoretical value calculated using the modified Kent and Park stress-strain relations for the concrete by 5 to 9%.
It is evident that using a concrete compressive stress distribution which accounted for the enhancement of concrete compressive strength due to confinement by transverse reinforcement gives a more realistic calculated value for the flexural strength.
The remaining difference between the theoretical flexural strength and the maximum measured moments can be attributed to the additional confinement of the stiff central stub which would have strengthened the column section adjacent to the stub face. The visual impression of the damaged zones of all column units confirmed that the cover concrete there was confined and constrained from spalling off until a nominal displacement ductility factor of more than 6 was reached. If the confinement of the column at the face of the stub is assumed to be that provided by the transverse reinforcement at a spacing of 40 mm (that is one half of actual spacing in the potential plastic hinge region), the theoretical flexural strength given by the modified Kent and Park stress-strain relations for the concrete becomes 272 kNm (201 kip ft) which is 3% higher than the flexural strength of 265 kNm (195 kip ft) calculated ignoring the additional confinement from the stub. This would require the critical section for the column at which the flexural strength is 265 kNm to be 41 mm (1.6 in) from the stub face. It is likely that the additional confinement provided by the central stub was higher than assumed above. To obtain the measured column flexural strength at the stub face would require the critical section at which the flexural strength is 265 kNm to be 75 to 133 mm (3.0 to 5.2 in) from the stub face. Previous tests [13] have found this critical section to be at about 0.5c away from the stub face, where c = neutral axis depth. In the current test series 0.5c ranged between about 60 to 120 mm (2.4 to 4.7 in) which gives a position for the critical section in agreement with the previous tests.
4.7.2 Theoretical Assessment of the Effectiveness of the Confinement from the Arrangements of Transverse Reinforcement
In order to as of the various types reinforcement used i moment-curvature ana The analyses satisfi strain compatibility The stress-strain re longitudinal reinfor 22 was assumed, and
sess the effectiveness of transverse
n the test units, lyses were conducted. ed the requirements of and equilibrium [11].
lation for the cement shown in Fig. the stress-strain

184 relation for concrete in compression used was the modified Kent and Park relationship given by Eqs. 14 to 17, with the cover concrete assumed to act as if unconfined and the core concrete as if confined. The moment and curvature corresponding to a range of extreme fibre concrete compression strains were computed to trace the moment-curvature relations.
In Fig. 23, the stress-strain curve marked (a) is for the core concrete and is obtained from Eqs. 14 to 17 assuming that all three transverse bars in each direction are effective and hence that the volumetric ratio of transverse steel is p = 0.0255. Curves (b) and (c) are for when p is two thirds of 0.0255 and one-third of S0.0255 respectively, keeping the width of the confined core and the spacing of transverse reinforcement the same. If the confinement from transverse reinforcement bars is lost (for example, if some tension splices or end anchorages become ineffective), the stress-strain curve for the concrete will tend to curve (b) or in the worst case to curve (c).
Figs. 24 to 27 show the measured moment curvature curves for Units 1 to 4 in the first cycle to nominal displacement ductility factors of y N = + 2, + 4, + 6 and + 8, compared with theoretical monotonic moment-curvature relations.
For Unit 1 in Fig. 2 4 the theoretical moment-curvature relation marked (A) was obtained using stress-strain curve (a) of Fig. 23 and hence assuming that all the confining steel is fully effective. It is apparent that the envelope curve of measured moment-curvature response agrees well with the theoretical monotonic moment-curvature relation and hence that the confining steel was effective.
For Unit 2 in Fig. 25 the theoretical moment-curvature relation marked (A), obtained using stress-strain curve (a) in Fig. 23, agrees quite well with the envelope of the measured curves up to a real displacement ductility factor u of about 13. It is noticeable that tne measured curvatures associated with the y values are about the same as for Unit 1 at least until y = 9. This means that the anchorage of the 90° end hooks of the cross ties was still as competent as that of the 180° end hooks of Unit 1 at y R = 9.
For Unit 3 in Fig. 26 the theoretical moment-curvature relations marked (A) and (C) were obtained using stress-strain curves (a) and (c) of Fig. 23, respectively. It can be seen that eventually the measured moment-curvature curves approached theoretical relation marked (C), which was based on confinement from only one-third of the original volumetric ratio of transverse reinforcement. This result confirms that the confinement provided by the lapped 1 U 1 bars making up the perimeter hoops of Unit 3 became ineffective in the final stages of loading.
For Unit 4 in Fig. 27 the theoretical moment-curvature relation obtained using stress-strain curve (a) of Fig. 23 agrees
well with the envelope of the measured curves. Hence it was apparent that the confining steel was fully effective as for Unit 1.
The divergence between the two theoretical moment-curvature relations which are marked (A) and (C) in Figs. 24 to 27 would have been greater if the columns had been subjected to a higher axial load than the 0.2f'A used in these tests. This is because the moment-curvature relation is more dependent on the stress-strain relation of the concrete when the axial load level is high. This is illustrated in Fig. 28 by the theoretical moment-curvature relations calculated for the column units using the three stress-strain relations for the concrete and for axial load levels of 0.2f^A and 0.4f'A . It is evident that tests on columns°w2th a higher axial compressive load than the 0.2f'A used in these tests may have indicated Ca^greater dependence of column behaviour on cross tie effectiveness.
5. CONCLUSIONS
Four reinforced concrete columns, with 4 00 mm (15.7 in) square cross sections were tested under axial compressive load and cyclic flexure to simulate severe seismic loading. The longitudinal reinforcement consisted of eight bars. The transverse reinforcement consisted of square perimeter hoops surrounding all longitudinal bars and cross ties between the intermediate longitudinal bars. The major variable of the study was the type of anchorage used for the hoops and cross ties. The quantity of transverse reinforcement in the column satisfied both New Zealand and United States seismic code provisions. The anchorage details used for that reinforcement did not always satisfy those codes. The columns were subjected to reversed horizontal loading consisting of two cycles to nominal displacement ductility factors of ± 2, ± 4, ± 6, ±8 and sometimes higher. The axial load level was 0.2f 1A , which resulted in a neutral axis deptfi §f 0.3 to 0.6 the section depth at the peaks of applied moment. The transverse reinforcement was from deformed bar with a yield strength of 333 MPa (48,300 psi).
The following conclusions were reached for these columns:
1. With regard to the anchorage of the ends of the transverse reinforcement with bar diameter d^ in potential plastic hinge regions by bending around longitudinal bars: (a) Satisfactory behaviour was observed
for: Perimeter hoops with a 135° end turn and an 8d^ extension into the core concrete. Interior cross ties with a 180° end turn and a 5d^ extension into the core concrete. 1 J 1 bar interior cross ties with end anchorage as above and with 24d^ tension splices in the core concrete. However it should be noted that the
185
D
to
to
721
500 474
0
-- 721-247 (1.091 -9.091SS) 3' 4 5
I I I I
fy = 474MPa I I I I f u l t - . 721 MPa
1 1 1
Es --200 000MPa
! i i i i 1 0 0.01 0.02 0.04 0.06 0.08
STRAIN, Es
0.10 0.12
Fig. 22 Stress-Strain Model for 20 mm (0.79 in) Diameter Longitudinal Reinforcement.
Fig. 23 Modified Kent and Park Stress-Strain Model.

186
0 100 200 300 CURVA TURE (x JO' 61/mm)
Fig. 24 Comparison of Theoretical Monotonic and Measured Cyclic Moment-Curvature Relations for Unit 1.
CURVATURE (x W' 6 1/mm)
Fig. 25 Comparison of Theoretical Monotonic and Measured Cyclic Moment-Curvature Relations for Unit 2.

187
Ecc=2.89%
Theory (monotonic hading) ® P s- 2.55%, s = 80mm
© ps = 0.85 % , s =80 mm
Experiment Unit J , bottom side First cycle of each displacement ductility factor-
•cc. Extreme compression fiber strain of core concrete
100 200 300
CURVATURE (* 10' 6l/mm)
WO
fig. 2 6 Comparison of Theoretical Monotonic and Measured Cyclic Moment-Curvature Relations for Unit 3.
CURVATURE (* 10 6 l/mm I
Fig. 27 Comparison of Theoretical Monotonic and Measured Cyclic Moment-Curvature Relations for Unit 4.

188
Yielding of compression and tension reinforcement
Yielding of compression reinforcement
0 0
Yielding of tension reinforcement
_ „ m i ©
Pe = 0.2£Ag
— £ --O.Cf^Ag
© p s =2.55% , s =80mm ® p s =1.70% , s =80mm © p s - 0.85% , s =80mm
€cc= Concrete compressive strain at extreme fiber of core concrete
i I i _ 100 200 300
CURVATURE (x 10~ 61/mm) WO
Fig. 28 Comparison of Theoretical Moment-Curvature Relations for Columns With Two Different Axial Load Levels.

189
maximum measured strain i n the 'J' bars was up to 60% of the yield strain. This means that the effectiveness of anchorage by the tension splices was not fully investigated in these tests.
(b) The behaviour of interior cross ties with a 9 0° turn and 6d^ extension at one end and a 18 0° turn and 5d^ extension at the other end, placed so that consecutive cross ties have their 90° end hook on opposite sides of the column, behaved satisfactorily up to a real displacement ductility factor of about 9. Beyond that displacement level the 90° end hooks commenced to open and the effectiveness of those end hooks was reduced.
(c) The behaviour of perimeter hooks formed from 'U 1 bars lapped in the cover concrete with a 17d^ tension splice was satisfactory up to a real displacement ductility factor of about 7. Beyond that displacement level there was a rapid degradation of strength due to the splice in the cover concrete becoming ineffective as the cover concrete was lost and the 90° corner turns of the 'U 1 bar opened. This transverse reinforcement detail is to be discouraged.
2. With regard to the flexural strength reached by the columns: (a) The maximum measured flexural
strength exceeded the theoretical flexural strength calculated using the ACI concrete compressive rectangular stress block and the measured material strengths by 11 to 15%.
(b) A more accurate theoretical estimate of the maximum measured flexural strength was obtained using the modified Kent and Park stress-strain curve for compressed concrete which takes into account the enhancement of concrete strength and ductility due to the confinement by transverse reinforcement. Also, it was evident that additional confinement of the critical section of the column was caused by the presence of the adjacent stub which simulated an adjoining beam or other member.
ACKNOWLEDGEMENTS
This investigation was carried out in the Department of Civil Engineering of the University of Canterbury by Professor B. McNamee while on leave from Drexel University, U.S.A., and by Associate Professor H. Tanaka while on leave from Akashi Technological College, Japan, together with Professor R. Park of the University of Canterbury.
Thanks are due to technicians Messrs A.M. Bell and G.E. Hill for assistance with the construction and testing of the column units.
The financial assistance provided by the National Roads Board and the University of Canterbury to carry out this investigation is gratefully acknowledged.
REFERENCES
(1) "Code of Practice for the Design of Concrete Structures (NZS 3101, Part 1: 1982) " and "Commentary on the Design of Concrete Structures (NZS 3101, Part 2:1982)", Standards Association of New Zealand, Wellington.
(2) "Building Code Requirements for Reinforced Concrete (ACI 318-83)" and "Commentary on Building Code Requirements for Reinforced Concrete (ACI 318-8 3 ) " , American Concrete Institute, Detroit, 1983.
(3) "Recommended Lateral Force Requirements and Commentary", Seismology Committee, Structural Engineers Association of California, San Francisco, 1975.
(4) "Seismic Design of Concrete Structures. Second Draft of an Appendix to the CEB-FIP Model Code", Bulletin d'Information No. 149, Comite Euro-International du Beton, Paris, March 1982.
(5) "Reinforced Concrete Structures. Design Code and Interpretation (Commentary)", Architectural Institute of Japan, Tokyo, 1982.
(6) Priestley, M.J.N, and Park, R., "Strength and Ductility of Bridge Substructures", Research Report No. 84-20, Department of Civil Engineering, University of Canterbury, December 1984, p.120.
(7) Moehle, J.P. and Cavanagh, T., "Confinement Effectiveness of Cross Ties in Reinforced Concrete", Structural Engineering, Proceedings of the American Society of Civil Engineers (to be published).
(8) Oesterle, R.G., Fiorato, A.E. and Corley, W.G., "Reinforcement Details for Earthquake Resistant Structural Walls", Concrete International:Design and Construction, V.2 , No. 12 , December 1980, pp.55-66.
(9) Ziro Suzuki, Chief Editor, "General Report on the Tokachi-oki Earthquake of 1968", Keigaku Publishing Co. Ltd, Tokyo, 1971, p.754.
(10) Jennings, P.C., Editor, "Engineering Features of the San Fernando Earthquake February 9, 1971", Earthquake Engineering Research Laboratory, California Institute of Technology, Pasadena, 1971, p.512.
(11) Park, R. and Paulay, T., "Reinforced Concrete Structures", John Wiley and Sons, New York, 1975, p.769.

190
(12) Park, R., Priestley, M.J.N, and Gill, W.D., "Ductility of Square Confined Concrete Columns", Journal of Structural Division, Proceedings of American Society of Civil Engineers, Vol. 108, No. ST4, April 1982, pp.929-950.
(13) Priestley, M.J.N., Park, R. and Potangaroa, R.T., "Ductility of Spirally-Confined Concrete Columns", Journal of Structural Division, Proceedings of American Society of Civil Engineers, Vol. 107, No. ST1, January 1981, pp.181-202.
TABLE 1 ; TEST RESULTS FROM COLUMN UNITS
Column Unit
First Yield Displacement
A y
mm
First Yield Curvature
y
xlO 1/miti
Maximum Moment Measured in Loading Cycles to y N= ±2, ±4 and ± 6
M max kNm
At Nominal Displacement Ductility Factor Vi = ± 6 in Second Cycle
At Final Stage of Test
Comparison of Maximum Measured Moments and Theoretical Flexural Strengths
Column Unit
First Yield Displacement
A y
mm
First Yield Curvature
y
xlO 1/miti
Maximum Moment Measured in Loading Cycles to y N= ±2, ±4 and ± 6
M max kNm
^N ^R M * y
M y
M M max max M M AC I MKP
Column Unit
First Yield Displacement
A y
mm
First Yield Curvature
y
xlO 1/miti
Maximum Moment Measured in Loading Cycles to y N= ±2, ±4 and ± 6
M max kNm
^N ^R M max * y M
max y M M max max M M AC I MKP
1 10.9 22.6 279 + 6 -6
6.2 10. 6
0.94 0.91
9.2 +12 11. 4
i
15. 9 0.94 20.0 1.11 1.05
2 10.9 21. 6 284 +6 -6
9.6 8.4
0.94 0.88
10.8 !+12 12. 4!
22. 3 0.85 32.8 1.13 1.07
3 9.6 | 18.4 i
290 + 6 -6
9.4 10.0
0. 91 0.88
11.8. -8 14.6
-14. 5 0.66 25. 0 1.15 1.09
4 10.0 ! 19.8 285 + 6 -6
9.2 10. 0
0.96 0.94
11. 91 +12 13.o;
21. 4 0.94 25.5 1.13 1.08
Note: 1 mm = 0.039 in. 1 kNm = 0.7375 kip ft. M = measured moment in column at face of central stub. M = maximum measured moment in column at face of central stub max M A C I = t n e o r e t i c a l flexural strength calculated using ACI concrete compressive stress block. MMKP = t n e o r e t i c a l flexural strength calculated using the modified Kent and Park
concrete compressive stress distribution.


![Wave guide: Rectangular Wave Guide Transverse Magnetic [TM] … · 2020. 4. 11. · Now we will discuss here Transverse Magnetic (TM) mode. In this case of the TM mode, the magnetic](https://img.dokumen.tips/doc/110x75/60b9abc8488dd125f969e9b9/wave-guide-rectangular-wave-guide-transverse-magnetic-tm-2020-4-11-now-we.jpg)


![ACI Code Torsion Equations Modified for Rectangular ... · PDF filepredict the torsional strength ofa rectangular beam section with a transverse open ... According to the ACI code(1],](https://img.dokumen.tips/doc/110x75/5aade0447f8b9a25088b86ec/aci-code-torsion-equations-modified-for-rectangular-the-torsional-strength-ofa.jpg)