Embed Size (px)
Citation preview
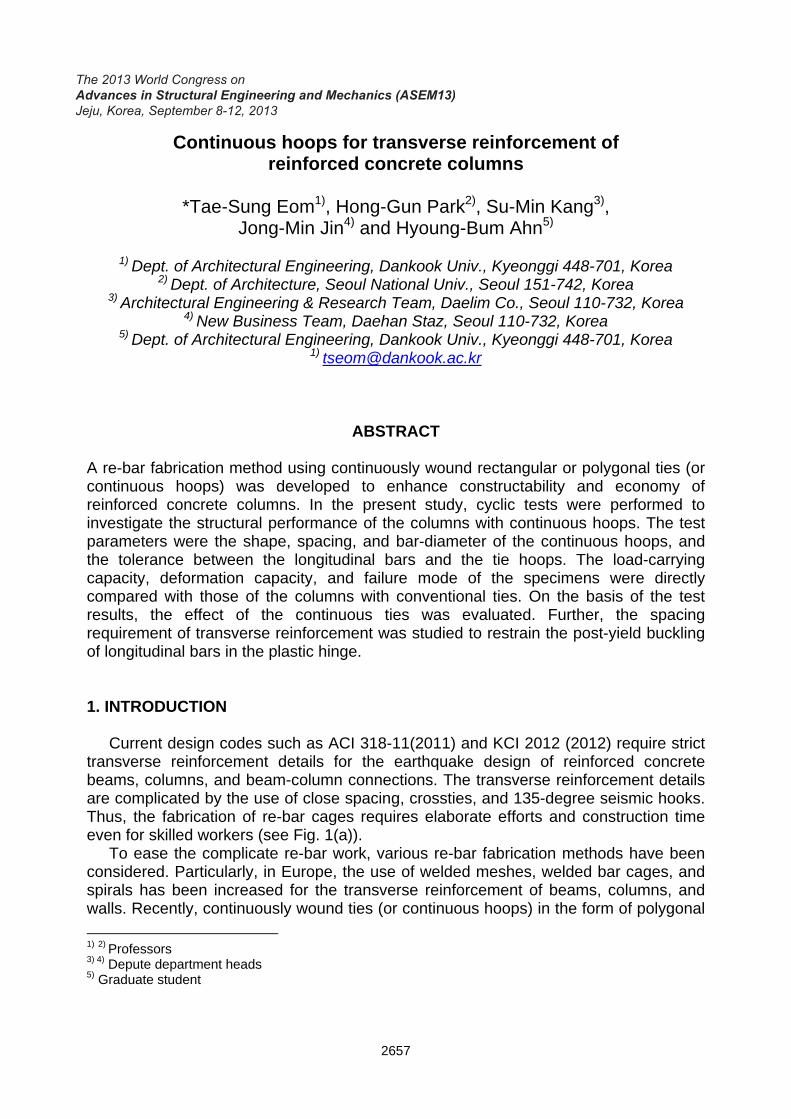
Continuous hoops for transverse reinforcement of reinforced concrete columns
*Tae-Sung Eom1), Hong-Gun Park2), Su-Min Kang3),
Jong-Min Jin4) and Hyoung-Bum Ahn5)
1) Dept. of Architectural Engineering, Dankook Univ., Kyeonggi 448-701, Korea
2) Dept. of Architecture, Seoul National Univ., Seoul 151-742, Korea 3) Architectural Engineering & Research Team, Daelim Co., Seoul 110-732, Korea
4) New Business Team, Daehan Staz, Seoul 110-732, Korea 5) Dept. of Architectural Engineering, Dankook Univ., Kyeonggi 448-701, Korea
ABSTRACT
A re-bar fabrication method using continuously wound rectangular or polygonal ties (or continuous hoops) was developed to enhance constructability and economy of reinforced concrete columns. In the present study, cyclic tests were performed to investigate the structural performance of the columns with continuous hoops. The test parameters were the shape, spacing, and bar-diameter of the continuous hoops, and the tolerance between the longitudinal bars and the tie hoops. The load-carrying capacity, deformation capacity, and failure mode of the specimens were directly compared with those of the columns with conventional ties. On the basis of the test results, the effect of the continuous ties was evaluated. Further, the spacing requirement of transverse reinforcement was studied to restrain the post-yield buckling of longitudinal bars in the plastic hinge. 1. INTRODUCTION Current design codes such as ACI 318-11(2011) and KCI 2012 (2012) require strict transverse reinforcement details for the earthquake design of reinforced concrete beams, columns, and beam-column connections. The transverse reinforcement details are complicated by the use of close spacing, crossties, and 135-degree seismic hooks. Thus, the fabrication of re-bar cages requires elaborate efforts and construction time even for skilled workers (see Fig. 1(a)). To ease the complicate re-bar work, various re-bar fabrication methods have been considered. Particularly, in Europe, the use of welded meshes, welded bar cages, and spirals has been increased for the transverse reinforcement of beams, columns, and walls. Recently, continuously wound ties (or continuous hoops) in the form of polygonal
1) 2) Professors 3) 4) Depute department heads 5) Graduate student
2657
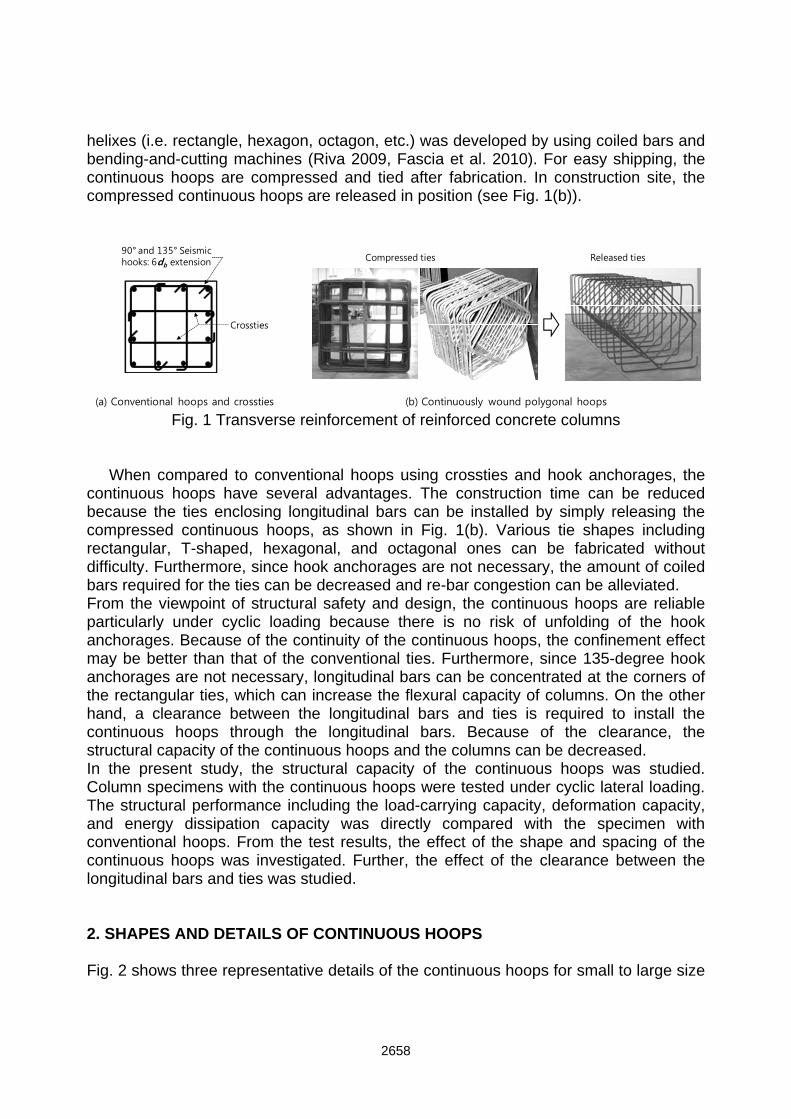
helixes (i.e. rectangle, hexagon, octagon, etc.) was developed by using coiled bars and bending-and-cutting machines (Riva 2009, Fascia et al. 2010). For easy shipping, the continuous hoops are compressed and tied after fabrication. In construction site, the compressed continuous hoops are released in position (see Fig. 1(b)).
Crossties
90° and 135° Seismic hooks: 6db extension
(a) Conventional hoops and crossties (b) Continuously wound polygonal hoops
Compressed ties Released ties
Fig. 1 Transverse reinforcement of reinforced concrete columns
When compared to conventional hoops using crossties and hook anchorages, the continuous hoops have several advantages. The construction time can be reduced because the ties enclosing longitudinal bars can be installed by simply releasing the compressed continuous hoops, as shown in Fig. 1(b). Various tie shapes including rectangular, T-shaped, hexagonal, and octagonal ones can be fabricated without difficulty. Furthermore, since hook anchorages are not necessary, the amount of coiled bars required for the ties can be decreased and re-bar congestion can be alleviated. From the viewpoint of structural safety and design, the continuous hoops are reliable particularly under cyclic loading because there is no risk of unfolding of the hook anchorages. Because of the continuity of the continuous hoops, the confinement effect may be better than that of the conventional ties. Furthermore, since 135-degree hook anchorages are not necessary, longitudinal bars can be concentrated at the corners of the rectangular ties, which can increase the flexural capacity of columns. On the other hand, a clearance between the longitudinal bars and ties is required to install the continuous hoops through the longitudinal bars. Because of the clearance, the structural capacity of the continuous hoops and the columns can be decreased. In the present study, the structural capacity of the continuous hoops was studied. Column specimens with the continuous hoops were tested under cyclic lateral loading. The structural performance including the load-carrying capacity, deformation capacity, and energy dissipation capacity was directly compared with the specimen with conventional hoops. From the test results, the effect of the shape and spacing of the continuous hoops was investigated. Further, the effect of the clearance between the longitudinal bars and ties was studied. 2. SHAPES AND DETAILS OF CONTINUOUS HOOPS Fig. 2 shows three representative details of the continuous hoops for small to large size
2658
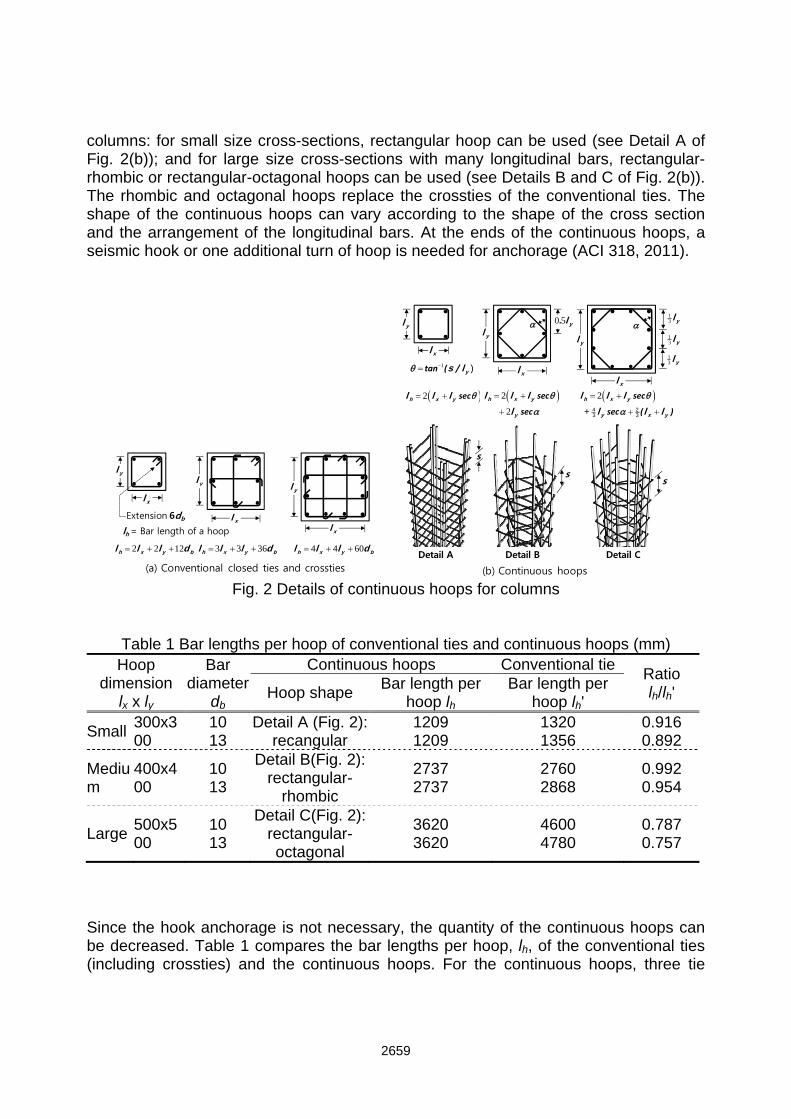
columns: for small size cross-sections, rectangular hoop can be used (see Detail A of Fig. 2(b)); and for large size cross-sections with many longitudinal bars, rectangular-rhombic or rectangular-octagonal hoops can be used (see Details B and C of Fig. 2(b)). The rhombic and octagonal hoops replace the crossties of the conventional ties. The shape of the continuous hoops can vary according to the shape of the cross section and the arrangement of the longitudinal bars. At the ends of the continuous hoops, a seismic hook or one additional turn of hoop is needed for anchorage (ACI 318, 2011).
2 2 12 x yh bl l l d 3 3 36 x yh bl l l d 4 4 60 x yh bl l l d
yl
xl
Extension 6db
yl
xl
yl
xllh = Bar length of a hoop
(a) Conventional closed ties and crossties
s
(b) Continuous hoops
ss
2 secx yhl l l
yl
xl
2
4 23 3+
sec
sec ( )
x yh
y x y
l l l
l l l
yl
xl
yl
xl
2
2
sec
sec
x yh
y
l l l
l
0 5. yl13 yl
13 yl
13 yl
1 )tan ( / ys l
Detail A Detail B Detail C
Fig. 2 Details of continuous hoops for columns
Table 1 Bar lengths per hoop of conventional ties and continuous hoops (mm) Hoop
dimension lx x ly
Bar diameter
db
Continuous hoops Conventional tie Ratio lh/lh' Hoop shape
Bar length per hoop lh
Bar length per hoop lh'
Small 300x300
10 13
Detail A (Fig. 2): recangular
1209 1209
1320 1356
0.916 0.892
Medium
400x400
10 13
Detail B(Fig. 2): rectangular-
rhombic
2737 2737
2760 2868
0.992 0.954
Large 500x500
10 13
Detail C(Fig. 2): rectangular-octagonal
3620 3620
4600 4780
0.787 0.757
Since the hook anchorage is not necessary, the quantity of the continuous hoops can be decreased. Table 1 compares the bar lengths per hoop, lh, of the conventional ties (including crossties) and the continuous hoops. For the continuous hoops, three tie
2659
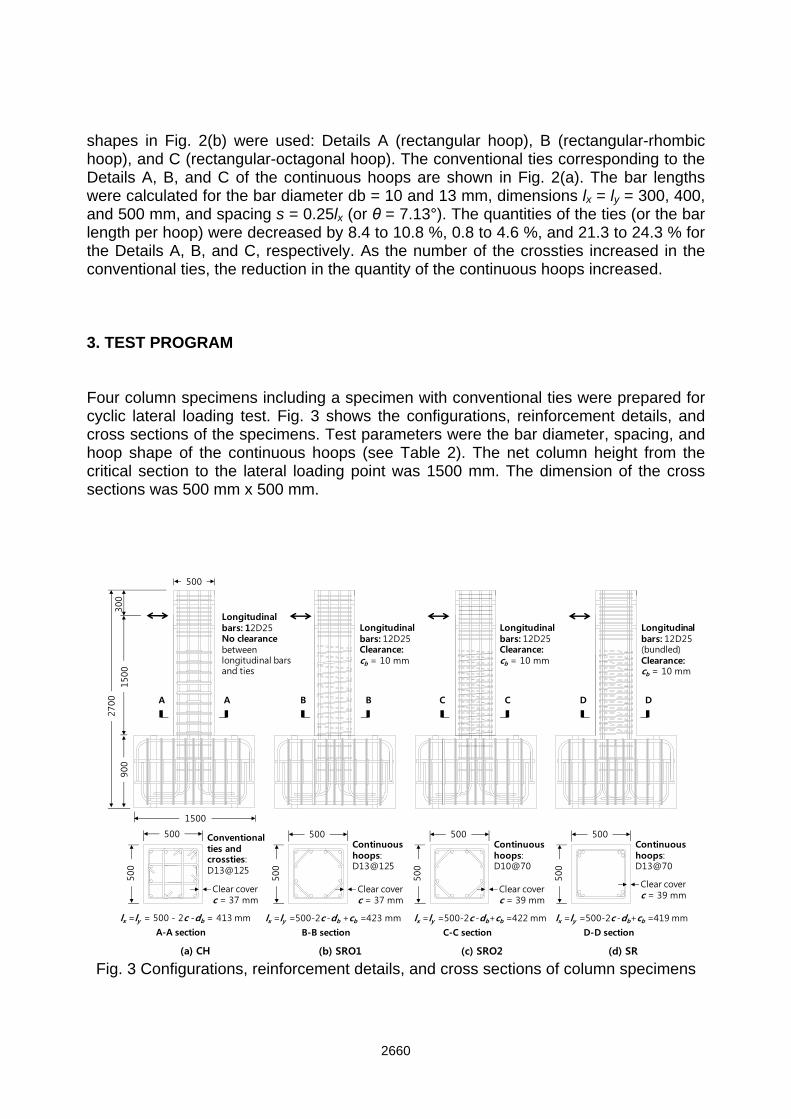
shapes in Fig. 2(b) were used: Details A (rectangular hoop), B (rectangular-rhombic hoop), and C (rectangular-octagonal hoop). The conventional ties corresponding to the Details A, B, and C of the continuous hoops are shown in Fig. 2(a). The bar lengths were calculated for the bar diameter db = 10 and 13 mm, dimensions lx = ly = 300, 400, and 500 mm, and spacing s = 0.25lx (or θ = 7.13°). The quantities of the ties (or the bar length per hoop) were decreased by 8.4 to 10.8 %, 0.8 to 4.6 %, and 21.3 to 24.3 % for the Details A, B, and C, respectively. As the number of the crossties increased in the conventional ties, the reduction in the quantity of the continuous hoops increased. 3. TEST PROGRAM Four column specimens including a specimen with conventional ties were prepared for cyclic lateral loading test. Fig. 3 shows the configurations, reinforcement details, and cross sections of the specimens. Test parameters were the bar diameter, spacing, and hoop shape of the continuous hoops (see Table 2). The net column height from the critical section to the lateral loading point was 1500 mm. The dimension of the cross sections was 500 mm x 500 mm.
500
(a) CH
2700
300
A A
1500
500
B B C C D D
500
Clear cover c = 37 mm
lx =ly = 500 - 2c -db = 413 mm
A-A section
Conventional ties and crossties:D13@125
(b) SRO1
500
500
Clear cover c = 37 mm
lx =ly =500-2c -db +cb =423 mm
B-B section
Continuous hoops:D13@125
(c) SRO2
500
500
Clear cover c = 39 mm
lx =ly =500-2c -db+cb =422 mm
C-C section
Continuous hoops:D10@70
(d) SR
500
500
Clear cover c = 39 mm
lx =ly =500-2c -db+cb =419 mm
D-D section
Continuous hoops:D13@70
Longitudinal bars: 12D25Clearance:cb = 10 mm
Longitudinal bars: 12D25Clearance:cb = 10 mm
Longitudinal bars: 12D25 (bundled)Clearance:cb = 10 mm
Longitudinal bars: 12D25No clearance between longitudinal bars and ties
900
1500
Fig. 3 Configurations, reinforcement details, and cross sections of column specimens
2660
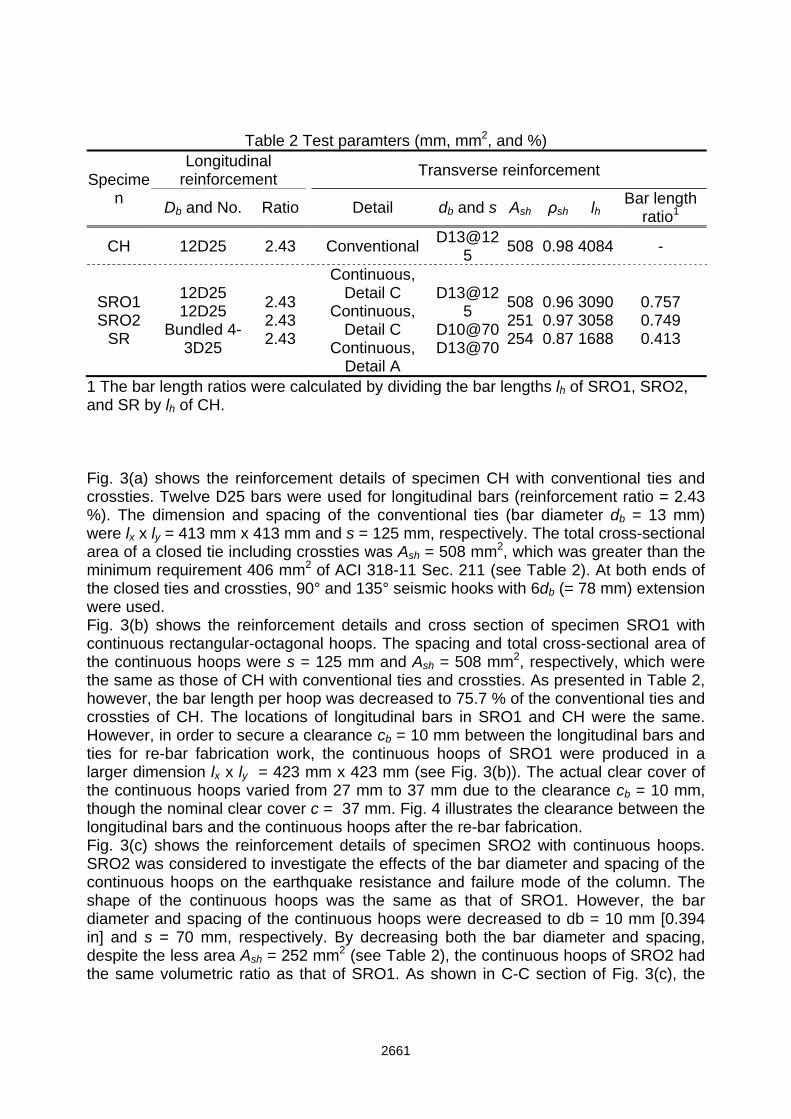
Table 2 Test paramters (mm, mm2, and %)
Specimen
Longitudinal reinforcement
Transverse reinforcement
Db and No. Ratio Detail db and s Ash ρsh lh Bar length
ratio1
CH 12D25 2.43 Conventional D13@12
5 508 0.98 4084 -
SRO1 SRO2
SR
12D25 12D25
Bundled 4-3D25
2.43 2.43 2.43
Continuous, Detail C
Continuous, Detail C
Continuous, Detail A
D13@125
D10@70D13@70
508251254
0.96 0.97 0.87
3090 3058 1688
0.757 0.749 0.413
1 The bar length ratios were calculated by dividing the bar lengths lh of SRO1, SRO2, and SR by lh of CH. Fig. 3(a) shows the reinforcement details of specimen CH with conventional ties and crossties. Twelve D25 bars were used for longitudinal bars (reinforcement ratio = 2.43 %). The dimension and spacing of the conventional ties (bar diameter db = 13 mm) were lx x ly = 413 mm x 413 mm and s = 125 mm, respectively. The total cross-sectional area of a closed tie including crossties was Ash = 508 mm2, which was greater than the minimum requirement 406 mm2 of ACI 318-11 Sec. 211 (see Table 2). At both ends of the closed ties and crossties, 90° and 135° seismic hooks with 6db (= 78 mm) extension were used. Fig. 3(b) shows the reinforcement details and cross section of specimen SRO1 with continuous rectangular-octagonal hoops. The spacing and total cross-sectional area of the continuous hoops were s = 125 mm and Ash = 508 mm2, respectively, which were the same as those of CH with conventional ties and crossties. As presented in Table 2, however, the bar length per hoop was decreased to 75.7 % of the conventional ties and crossties of CH. The locations of longitudinal bars in SRO1 and CH were the same. However, in order to secure a clearance cb = 10 mm between the longitudinal bars and ties for re-bar fabrication work, the continuous hoops of SRO1 were produced in a larger dimension lx x ly = 423 mm x 423 mm (see Fig. 3(b)). The actual clear cover of the continuous hoops varied from 27 mm to 37 mm due to the clearance cb = 10 mm, though the nominal clear cover c = 37 mm. Fig. 4 illustrates the clearance between the longitudinal bars and the continuous hoops after the re-bar fabrication. Fig. 3(c) shows the reinforcement details of specimen SRO2 with continuous hoops. SRO2 was considered to investigate the effects of the bar diameter and spacing of the continuous hoops on the earthquake resistance and failure mode of the column. The shape of the continuous hoops was the same as that of SRO1. However, the bar diameter and spacing of the continuous hoops were decreased to db = 10 mm [0.394 in] and s = 70 mm, respectively. By decreasing both the bar diameter and spacing, despite the less area Ash = 252 mm2 (see Table 2), the continuous hoops of SRO2 had the same volumetric ratio as that of SRO1. As shown in C-C section of Fig. 3(c), the
2661
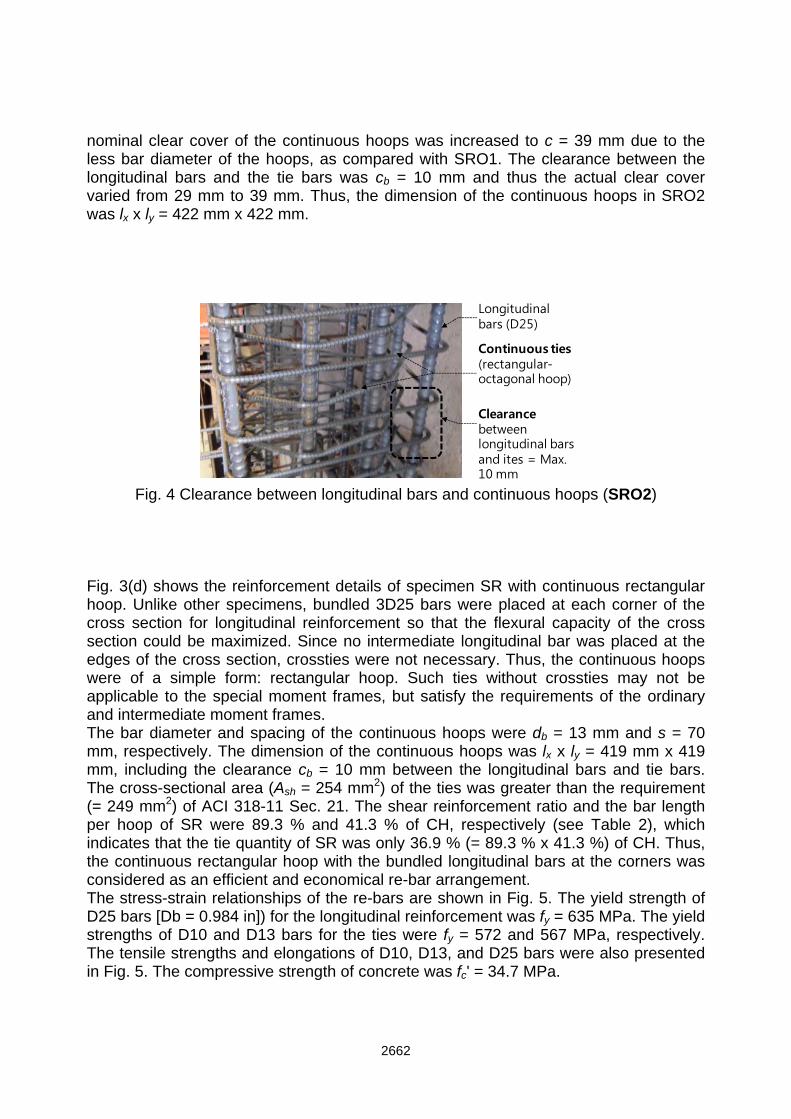
nominal clear cover of the continuous hoops was increased to c = 39 mm due to the less bar diameter of the hoops, as compared with SRO1. The clearance between the longitudinal bars and the tie bars was cb = 10 mm and thus the actual clear cover varied from 29 mm to 39 mm. Thus, the dimension of the continuous hoops in SRO2 was lx x ly = 422 mm x 422 mm.
Longitudinal bars (D25)
Continuous ties (rectangular-octagonal hoop)
Clearancebetween longitudinal bars and ites = Max. 10 mm
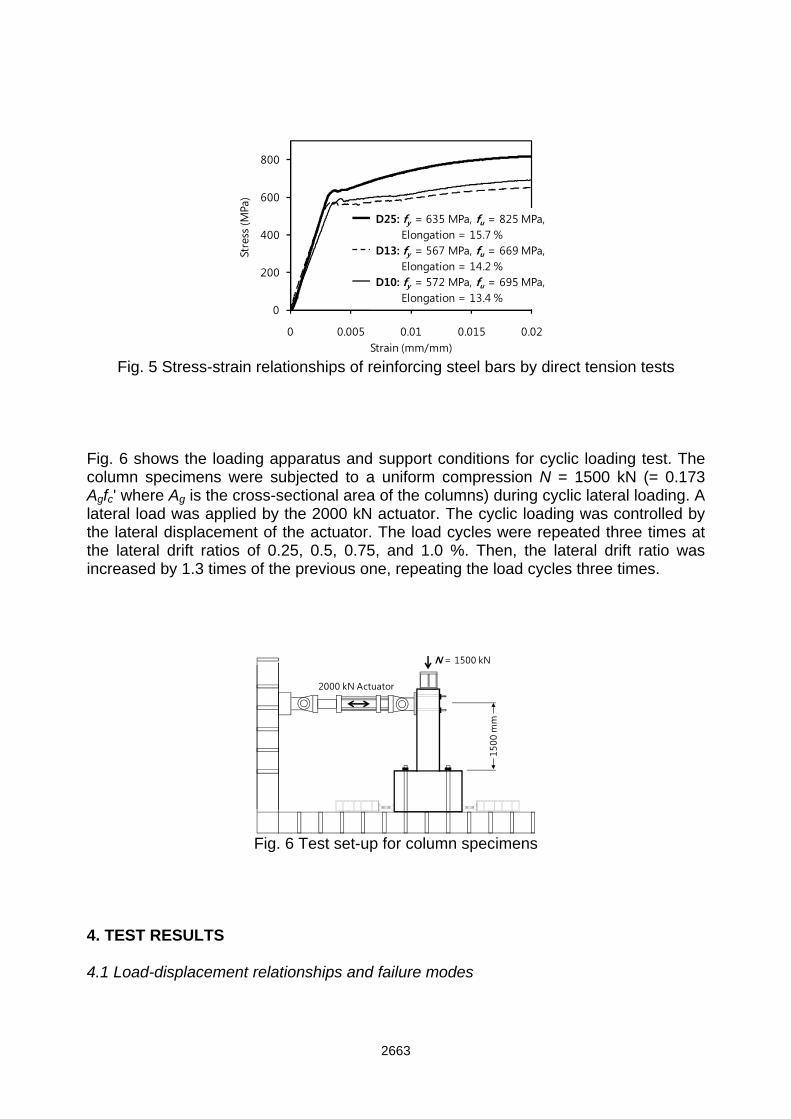
Fig. 4 Clearance between longitudinal bars and continuous hoops (SRO2) Fig. 3(d) shows the reinforcement details of specimen SR with continuous rectangular hoop. Unlike other specimens, bundled 3D25 bars were placed at each corner of the cross section for longitudinal reinforcement so that the flexural capacity of the cross section could be maximized. Since no intermediate longitudinal bar was placed at the edges of the cross section, crossties were not necessary. Thus, the continuous hoops were of a simple form: rectangular hoop. Such ties without crossties may not be applicable to the special moment frames, but satisfy the requirements of the ordinary and intermediate moment frames. The bar diameter and spacing of the continuous hoops were db = 13 mm and s = 70 mm, respectively. The dimension of the continuous hoops was lx x ly = 419 mm x 419 mm, including the clearance cb = 10 mm between the longitudinal bars and tie bars. The cross-sectional area (Ash = 254 mm2) of the ties was greater than the requirement (= 249 mm2) of ACI 318-11 Sec. 21. The shear reinforcement ratio and the bar length per hoop of SR were 89.3 % and 41.3 % of CH, respectively (see Table 2), which indicates that the tie quantity of SR was only 36.9 % (= 89.3 % x 41.3 %) of CH. Thus, the continuous rectangular hoop with the bundled longitudinal bars at the corners was considered as an efficient and economical re-bar arrangement. The stress-strain relationships of the re-bars are shown in Fig. 5. The yield strength of D25 bars [Db = 0.984 in]) for the longitudinal reinforcement was fy = 635 MPa. The yield strengths of D10 and D13 bars for the ties were fy = 572 and 567 MPa, respectively. The tensile strengths and elongations of D10, D13, and D25 bars were also presented in Fig. 5. The compressive strength of concrete was fc' = 34.7 MPa.
2662
0
200
400
600
800
0 0.005 0.01 0.015 0.02
D25: fy = 635 MPa, fu = 825 MPa,Elongation = 15.7 %
D13: fy = 567 MPa, fu = 669 MPa,Elongation = 14.2 %
D10: fy = 572 MPa, fu = 695 MPa,Elongation = 13.4 %
Strain (mm/mm)
Stre
ss (M
Pa)
Fig. 5 Stress-strain relationships of reinforcing steel bars by direct tension tests
Fig. 6 shows the loading apparatus and support conditions for cyclic loading test. The column specimens were subjected to a uniform compression N = 1500 kN (= 0.173 Agfc' where Ag is the cross-sectional area of the columns) during cyclic lateral loading. A lateral load was applied by the 2000 kN actuator. The cyclic loading was controlled by the lateral displacement of the actuator. The load cycles were repeated three times at the lateral drift ratios of 0.25, 0.5, 0.75, and 1.0 %. Then, the lateral drift ratio was increased by 1.3 times of the previous one, repeating the load cycles three times.
2000 kN Actuator
1500
mm
N = 1500 kN
Fig. 6 Test set-up for column specimens
4. TEST RESULTS 4.1 Load-displacement relationships and failure modes
2663
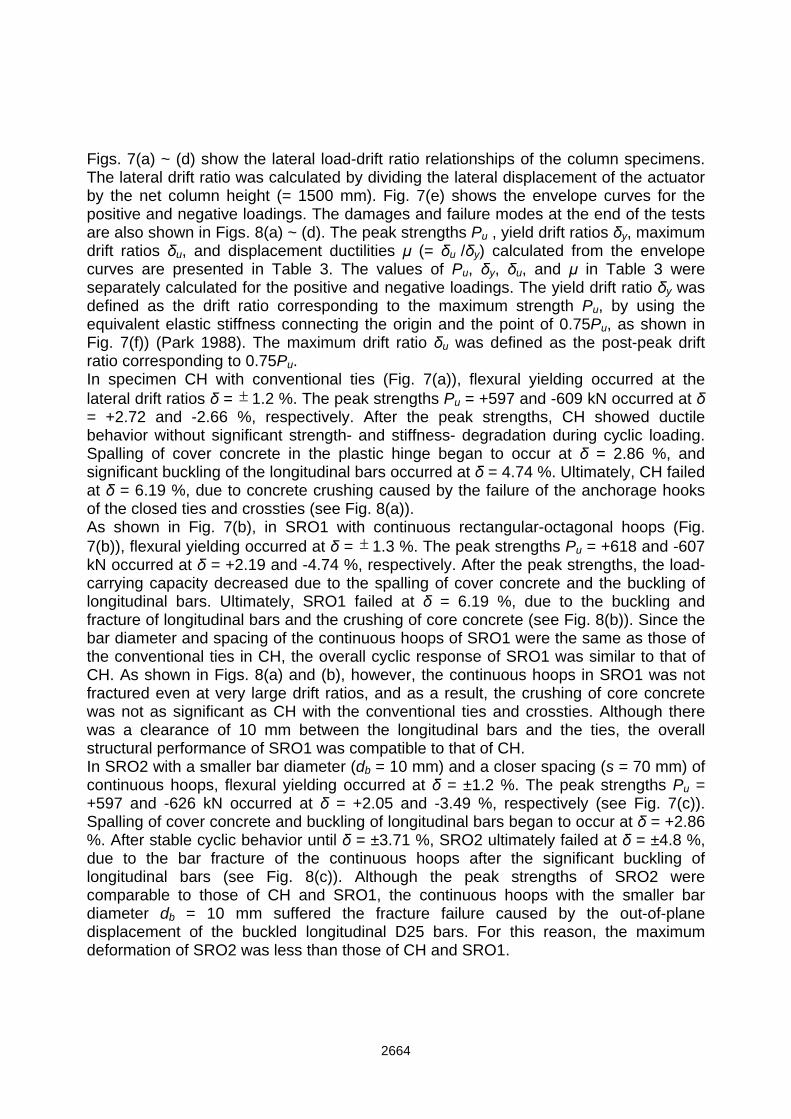
Figs. 7(a) ~ (d) show the lateral load-drift ratio relationships of the column specimens. The lateral drift ratio was calculated by dividing the lateral displacement of the actuator by the net column height (= 1500 mm). Fig. 7(e) shows the envelope curves for the positive and negative loadings. The damages and failure modes at the end of the tests are also shown in Figs. 8(a) ~ (d). The peak strengths Pu , yield drift ratios δy, maximum drift ratios δu, and displacement ductilities μ (= δu /δy) calculated from the envelope curves are presented in Table 3. The values of Pu, δy, δu, and μ in Table 3 were separately calculated for the positive and negative loadings. The yield drift ratio δy was defined as the drift ratio corresponding to the maximum strength Pu, by using the equivalent elastic stiffness connecting the origin and the point of 0.75Pu, as shown in Fig. 7(f)) (Park 1988). The maximum drift ratio δu was defined as the post-peak drift ratio corresponding to 0.75Pu. In specimen CH with conventional ties (Fig. 7(a)), flexural yielding occurred at the lateral drift ratios δ = 1.2 %. The peak strengths Pu = +597 and -609 kN occurred at δ = +2.72 and -2.66 %, respectively. After the peak strengths, CH showed ductile behavior without significant strength- and stiffness- degradation during cyclic loading. Spalling of cover concrete in the plastic hinge began to occur at δ = 2.86 %, and significant buckling of the longitudinal bars occurred at δ = 4.74 %. Ultimately, CH failed at δ = 6.19 %, due to concrete crushing caused by the failure of the anchorage hooks of the closed ties and crossties (see Fig. 8(a)). As shown in Fig. 7(b), in SRO1 with continuous rectangular-octagonal hoops (Fig. 7(b)), flexural yielding occurred at δ = 1.3 %. The peak strengths Pu = +618 and -607 kN occurred at δ = +2.19 and -4.74 %, respectively. After the peak strengths, the load-carrying capacity decreased due to the spalling of cover concrete and the buckling of longitudinal bars. Ultimately, SRO1 failed at δ = 6.19 %, due to the buckling and fracture of longitudinal bars and the crushing of core concrete (see Fig. 8(b)). Since the bar diameter and spacing of the continuous hoops of SRO1 were the same as those of the conventional ties in CH, the overall cyclic response of SRO1 was similar to that of CH. As shown in Figs. 8(a) and (b), however, the continuous hoops in SRO1 was not fractured even at very large drift ratios, and as a result, the crushing of core concrete was not as significant as CH with the conventional ties and crossties. Although there was a clearance of 10 mm between the longitudinal bars and the ties, the overall structural performance of SRO1 was compatible to that of CH. In SRO2 with a smaller bar diameter (db = 10 mm) and a closer spacing (s = 70 mm) of continuous hoops, flexural yielding occurred at δ = ±1.2 %. The peak strengths Pu = +597 and -626 kN occurred at δ = +2.05 and -3.49 %, respectively (see Fig. 7(c)). Spalling of cover concrete and buckling of longitudinal bars began to occur at δ = +2.86 %. After stable cyclic behavior until δ = ±3.71 %, SRO2 ultimately failed at δ = ±4.8 %, due to the bar fracture of the continuous hoops after the significant buckling of longitudinal bars (see Fig. 8(c)). Although the peak strengths of SRO2 were comparable to those of CH and SRO1, the continuous hoops with the smaller bar diameter db = 10 mm suffered the fracture failure caused by the out-of-plane displacement of the buckled longitudinal D25 bars. For this reason, the maximum deformation of SRO2 was less than those of CH and SRO1.
2664
-800
-600
-400
-200
0
200
400
600
800
-8.0 -6.0 -4.0 -2.0 0.0 2.0 4.0 6.0 8.0
-800
-600
-400
-200
0
200
400
600
800
-8.0 -6.0 -4.0 -2.0 0.0 2.0 4.0 6.0 8.0
-800
-600
-400
-200
0
200
400
600
800
-8.0 -6.0 -4.0 -2.0 0.0 2.0 4.0 6.0 8.0
(a) CH
Lateral drift ratio (%)
Lateral drift ratio (%)
Late
ral l
oad
(kN
)La
tera
l loa
d (k
N)
(c) SRO2
0 n nP P N0 533 kNnP
0 533 kNnP
Failure sequence:① Cover spalling② Bar buckling (D25)③ Tie bar fracture (D10)④ Core concrete crushing
-800
-600
-400
-200
0
200
400
600
800
-8.0 -6.0 -4.0 -2.0 0.0 2.0 4.0 6.0 8.0
-800
-600
-400
-200
0
200
400
600
800
-8.0 -6.0 -4.0 -2.0 0.0 2.0 4.0 6.0 8.0
Lateral drift ratio (%)
Lateral drift ratio (%)
Late
ral l
oad
(kN
)La
tera
l loa
d (k
N)
(b) SRO1
(d) SR
0 533 kNnP
0 594 kNnP
Failure sequence:① Cover spalling② Bar buckling (D25)③ Bar fracture (D25)④ Core concrete crushing
Failure sequence:① Cover spalling② Bundled bar buckling (3D25)③ Cover spalling and core concrete crushing
597 kNuP
609 kNuP
618 kNuP
607 kNuP
597 kNuP
626 kNuP
635 kNuP
665 kNuP
Lateral drift ratio (%)
Late
ral l
oad
(kN
)
(e) Envelope curves
CHSRO1SRO2SR La
tera
l loa
d (k
N)
Lateral drift ratio (%)
(f) Definition of yield and maximum drift ratio
uP
0 75. uP
yu
u
y
Envelope curve
Displacement ductility
Failure sequence:① Cover spalling② Bar buckling (D25)③ Hook anchorage failure of ties (D13)④ Core concrete crushing
Fig. 7 Lateral load-drift ratio relationships of column specimens
In SR with bundled longitudinal 3D25 bars and continuous rectangular hoops, flexural yielding occurred at δ = ±1.3 %. The peak strengths Pu = +635 and -665 kN occurred at δ = +2.08 and -2.07 %, respectively (see Fig. 7(d)). By placing the bundled longitudinal bars at the corners of the cross-section, the peak strengths of SR were increased by 6.15 ~ 7.78 %, when compared to CH, SRO1, and SRO2. The load-carrying capacity began to decrease after δ = ±3.71 % due to spalling of cover concrete and buckling of longitudinal bars. Ultimately, the specimen failed at δ = ±4.8 % due to significant spalling of cover concrete and crushing failure of core concrete following the buckling of the bundled longitudinal bars (see Fig. 8(d)). The maximum deformation of SR was the same as that of SRO2, but was less than those of CH and SRO1. Although
2665
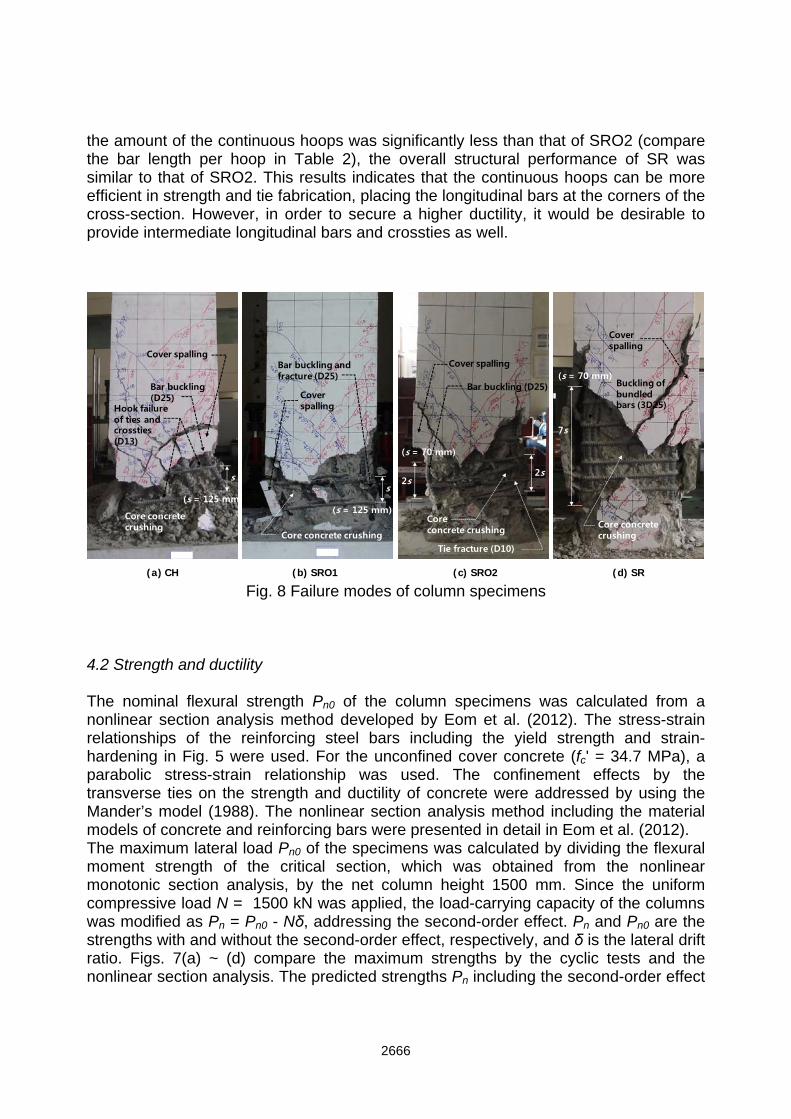
the amount of the continuous hoops was significantly less than that of SRO2 (compare the bar length per hoop in Table 2), the overall structural performance of SR was similar to that of SRO2. This results indicates that the continuous hoops can be more efficient in strength and tie fabrication, placing the longitudinal bars at the corners of the cross-section. However, in order to secure a higher ductility, it would be desirable to provide intermediate longitudinal bars and crossties as well.
(a) CH (c) SRO2(b) SRO1 (d) SR
Cover spalling
Bar buckling (D25)
Hook failure of ties and crossties (D13)
Core concrete crushing
Cover spalling
Bar buckling and fracture (D25)
Core concrete crushing
Cover spalling
Bar buckling (D25)
Tie fracture (D10)
Core concrete crushing
2s
(s = 70 mm)
2s
s
(s = 125 mm)
s
(s = 125 mm)
Cover spalling
Buckling of bundled bars (3D25)
Core concrete crushing
7s
(s = 70 mm)
Fig. 8 Failure modes of column specimens
4.2 Strength and ductility The nominal flexural strength Pn0 of the column specimens was calculated from a nonlinear section analysis method developed by Eom et al. (2012). The stress-strain relationships of the reinforcing steel bars including the yield strength and strain-hardening in Fig. 5 were used. For the unconfined cover concrete (fc' = 34.7 MPa), a parabolic stress-strain relationship was used. The confinement effects by the transverse ties on the strength and ductility of concrete were addressed by using the Mander’s model (1988). The nonlinear section analysis method including the material models of concrete and reinforcing bars were presented in detail in Eom et al. (2012). The maximum lateral load Pn0 of the specimens was calculated by dividing the flexural moment strength of the critical section, which was obtained from the nonlinear monotonic section analysis, by the net column height 1500 mm. Since the uniform compressive load N = 1500 kN was applied, the load-carrying capacity of the columns was modified as Pn = Pn0 - Nδ, addressing the second-order effect. Pn and Pn0 are the strengths with and without the second-order effect, respectively, and δ is the lateral drift ratio. Figs. 7(a) ~ (d) compare the maximum strengths by the cyclic tests and the nonlinear section analysis. The predicted strengths Pn including the second-order effect
2666
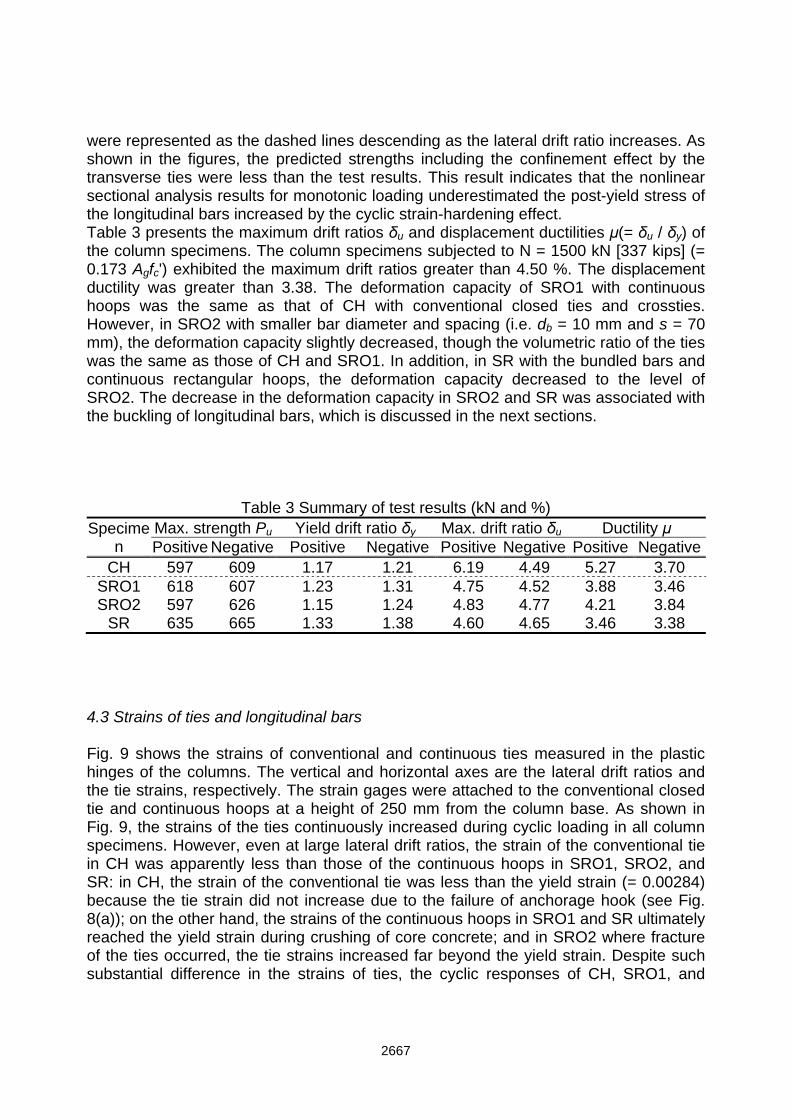
were represented as the dashed lines descending as the lateral drift ratio increases. As shown in the figures, the predicted strengths including the confinement effect by the transverse ties were less than the test results. This result indicates that the nonlinear sectional analysis results for monotonic loading underestimated the post-yield stress of the longitudinal bars increased by the cyclic strain-hardening effect. Table 3 presents the maximum drift ratios δu and displacement ductilities μ(= δu / δy) of the column specimens. The column specimens subjected to N = 1500 kN [337 kips] (= 0.173 Agfc') exhibited the maximum drift ratios greater than 4.50 %. The displacement ductility was greater than 3.38. The deformation capacity of SRO1 with continuous hoops was the same as that of CH with conventional closed ties and crossties. However, in SRO2 with smaller bar diameter and spacing (i.e. db = 10 mm and s = 70 mm), the deformation capacity slightly decreased, though the volumetric ratio of the ties was the same as those of CH and SRO1. In addition, in SR with the bundled bars and continuous rectangular hoops, the deformation capacity decreased to the level of SRO2. The decrease in the deformation capacity in SRO2 and SR was associated with the buckling of longitudinal bars, which is discussed in the next sections.
Table 3 Summary of test results (kN and %) Specime
n Max. strength Pu Yield drift ratio δy Max. drift ratio δu Ductility μ Positive Negative Positive Negative Positive Negative Positive Negative
CH 597 609 1.17 1.21 6.19 4.49 5.27 3.70 SRO1 SRO2
SR
618 597 635
607 626 665
1.23 1.15 1.33
1.31 1.24 1.38
4.75 4.83 4.60
4.52 4.77 4.65
3.88 4.21 3.46
3.46 3.84 3.38
4.3 Strains of ties and longitudinal bars Fig. 9 shows the strains of conventional and continuous ties measured in the plastic hinges of the columns. The vertical and horizontal axes are the lateral drift ratios and the tie strains, respectively. The strain gages were attached to the conventional closed tie and continuous hoops at a height of 250 mm from the column base. As shown in Fig. 9, the strains of the ties continuously increased during cyclic loading in all column specimens. However, even at large lateral drift ratios, the strain of the conventional tie in CH was apparently less than those of the continuous hoops in SRO1, SRO2, and SR: in CH, the strain of the conventional tie was less than the yield strain (= 0.00284) because the tie strain did not increase due to the failure of anchorage hook (see Fig. 8(a)); on the other hand, the strains of the continuous hoops in SRO1 and SR ultimately reached the yield strain during crushing of core concrete; and in SRO2 where fracture of the ties occurred, the tie strains increased far beyond the yield strain. Despite such substantial difference in the strains of ties, the cyclic responses of CH, SRO1, and
2667
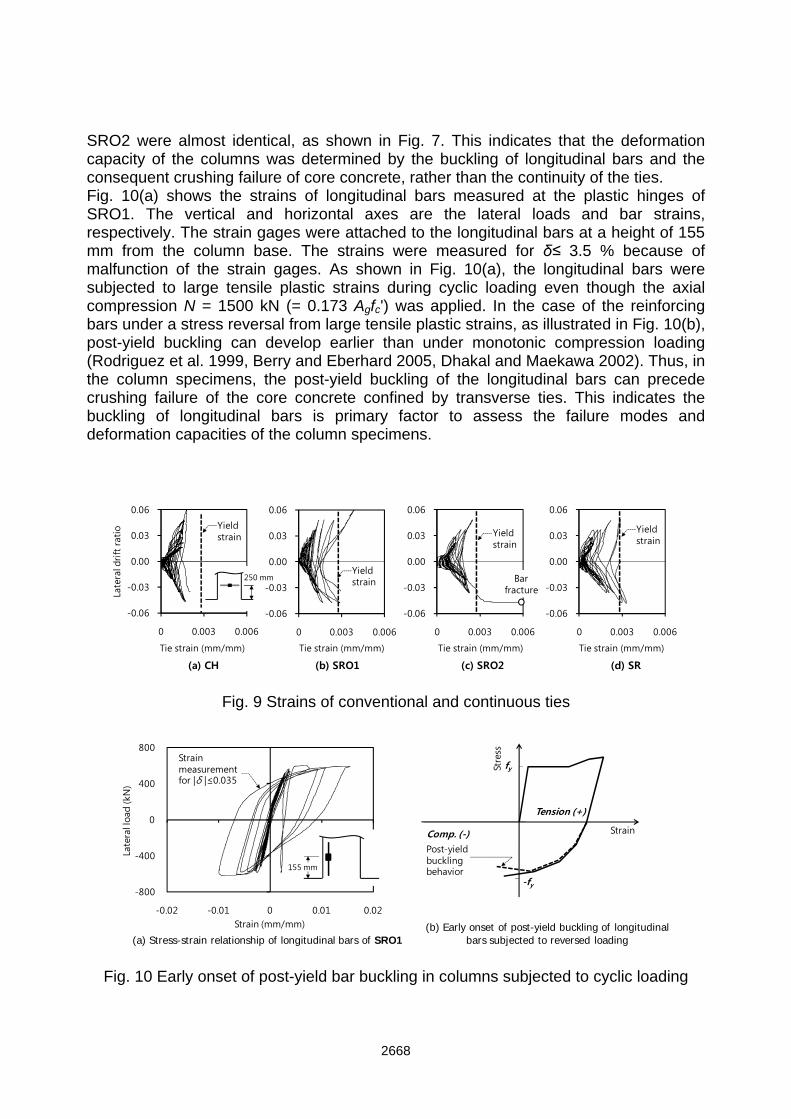
SRO2 were almost identical, as shown in Fig. 7. This indicates that the deformation capacity of the columns was determined by the buckling of longitudinal bars and the consequent crushing failure of core concrete, rather than the continuity of the ties. Fig. 10(a) shows the strains of longitudinal bars measured at the plastic hinges of SRO1. The vertical and horizontal axes are the lateral loads and bar strains, respectively. The strain gages were attached to the longitudinal bars at a height of 155 mm from the column base. The strains were measured for δ≤ 3.5 % because of malfunction of the strain gages. As shown in Fig. 10(a), the longitudinal bars were subjected to large tensile plastic strains during cyclic loading even though the axial compression N = 1500 kN (= 0.173 Agfc') was applied. In the case of the reinforcing bars under a stress reversal from large tensile plastic strains, as illustrated in Fig. 10(b), post-yield buckling can develop earlier than under monotonic compression loading (Rodriguez et al. 1999, Berry and Eberhard 2005, Dhakal and Maekawa 2002). Thus, in the column specimens, the post-yield buckling of the longitudinal bars can precede crushing failure of the core concrete confined by transverse ties. This indicates the buckling of longitudinal bars is primary factor to assess the failure modes and deformation capacities of the column specimens.
-0.06
-0.03
0.00
0.03
0.06
0 0.003 0.006
-0.06
-0.03
0.00
0.03
0.06
0 0.003 0.006
-0.06
-0.03
0.00
0.03
0.06
0 0.003 0.006
-0.06
-0.03
0.00
0.03
0.06
0 0.003 0.006
(a) CH (b) SRO1 (c) SRO2 (d) SR
Tie strain (mm/mm)
Late
ral d
rift rat
io
Tie strain (mm/mm) Tie strain (mm/mm) Tie strain (mm/mm)
Yield strain
Yield strain
Yield strain
Yield strain
250 mm Bar fracture
Fig. 9 Strains of conventional and continuous ties
-800
-400
0
400
800
-0.02 -0.01 0 0.01 0.02Strain (mm/mm)
Late
ral l
oad
(kN
)
155 mm
Strain
Stre
ss
fy
-fy
Post-yield buckling behavior
Tension (+)
Comp. (-)
(a) Stress-strain relationship of longitudinal bars of SRO1(b) Early onset of post-yield buckling of longitudinal
bars subjected to reversed loading
Strain measurement for |δ |≤0.035
Fig. 10 Early onset of post-yield bar buckling in columns subjected to cyclic loading
2668
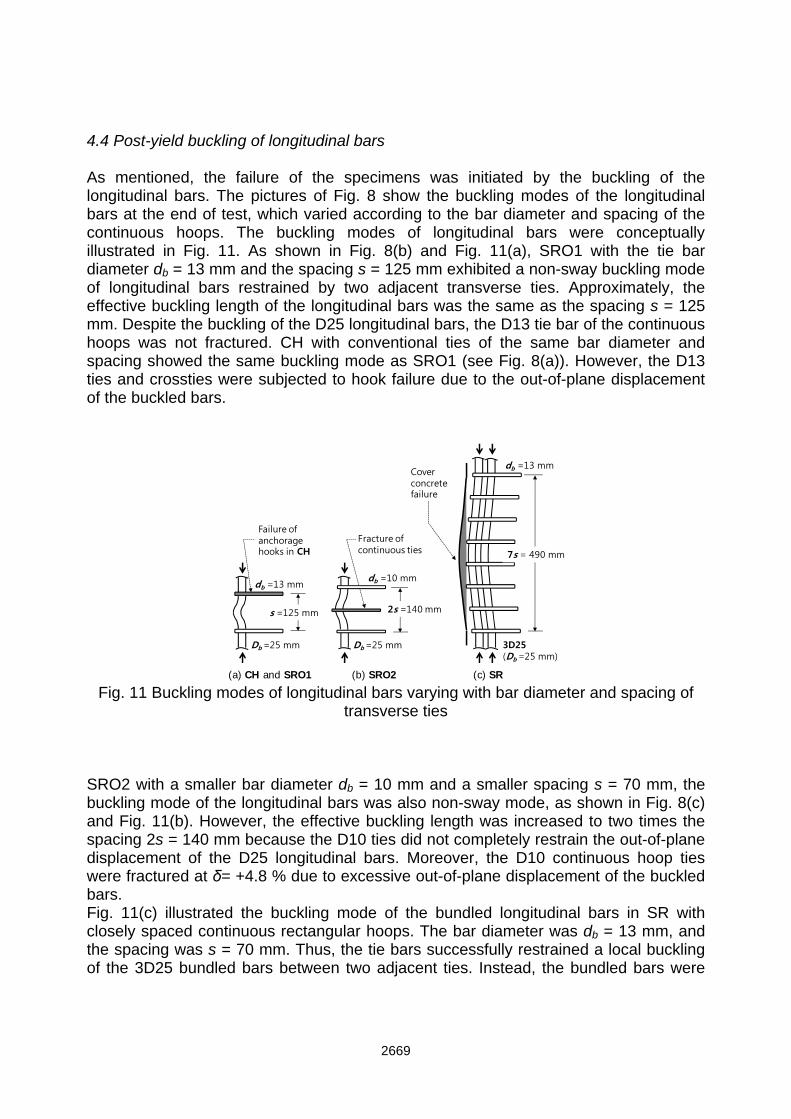
4.4 Post-yield buckling of longitudinal bars As mentioned, the failure of the specimens was initiated by the buckling of the longitudinal bars. The pictures of Fig. 8 show the buckling modes of the longitudinal bars at the end of test, which varied according to the bar diameter and spacing of the continuous hoops. The buckling modes of longitudinal bars were conceptually illustrated in Fig. 11. As shown in Fig. 8(b) and Fig. 11(a), SRO1 with the tie bar diameter db = 13 mm and the spacing s = 125 mm exhibited a non-sway buckling mode of longitudinal bars restrained by two adjacent transverse ties. Approximately, the effective buckling length of the longitudinal bars was the same as the spacing s = 125 mm. Despite the buckling of the D25 longitudinal bars, the D13 tie bar of the continuous hoops was not fractured. CH with conventional ties of the same bar diameter and spacing showed the same buckling mode as SRO1 (see Fig. 8(a)). However, the D13 ties and crossties were subjected to hook failure due to the out-of-plane displacement of the buckled bars.
2s =140 mms =125 mm
Db =25 mm
db =13 mm
Db =25 mm
db =10 mm
3D25 (Db =25 mm)
db =13 mm
7s = 490 mm
(a) CH and SRO1 (b) SRO2 (c) SR
Failure of anchorage hooks in CH
Fracture of continuous ties
Cover concrete failure
Fig. 11 Buckling modes of longitudinal bars varying with bar diameter and spacing of
transverse ties SRO2 with a smaller bar diameter db = 10 mm and a smaller spacing s = 70 mm, the buckling mode of the longitudinal bars was also non-sway mode, as shown in Fig. 8(c) and Fig. 11(b). However, the effective buckling length was increased to two times the spacing 2s = 140 mm because the D10 ties did not completely restrain the out-of-plane displacement of the D25 longitudinal bars. Moreover, the D10 continuous hoop ties were fractured at δ= +4.8 % due to excessive out-of-plane displacement of the buckled bars. Fig. 11(c) illustrated the buckling mode of the bundled longitudinal bars in SR with closely spaced continuous rectangular hoops. The bar diameter was db = 13 mm, and the spacing was s = 70 mm. Thus, the tie bars successfully restrained a local buckling of the 3D25 bundled bars between two adjacent ties. Instead, the bundled bars were
2669
subjected to a non-sway buckling developing over the buckling length 7s = 490 mm, as shown in Fig. 8(d) and Fig. 11(c). This is because as compared with SRO1, the out-of-place force of the bundled bars due to the post-yield buckling was significantly increased. As a result, the spalling of cover concrete occurred over the extended buckling zone of 490 mm. 5. SUMMARY AND CONCLUSIONS The rectangular or polygonal continuous hoops are an efficient construction method which can reduce construction time and re-bar cost. In the present study, cyclic tests were performed to investigate the structural performance of the columns with continuous hoops. The test parameters were the shape, spacing, and bar-diameter of the continuous hoops, and the tolerance between the longitudinal bars and the ties. The load-carrying capacity, deformation capacity, and failure mode of the specimens were directly compared with those of a column with conventional ties. The major findings are as follows. 1) The continuous hoops can be used for diverse sizes and shapes of column cross-sections including rectangular, T-shaped, hexagonal, octagonal, and circular shapes. Since the continuous hoops do not require anchorage hooks, the bar length per hoop can be saved by as much as 25 %, when compared with conventional ties. 2) When 13 mm diameter bars with spacing of 125 mm was used for ties, the load-carrying capacity and deformation capacity of the columns with the continuous rectangular - octagonal hoops were the same as those of the column with conventional ties and crossties. The 10 mm clearance between the longitudinal bars and the continuous hoops, which is required for the fabrication of the continuous hoops, did not affect the structural capacity of the column. 3) When the continuous rectangular - octagonal hoops with the bar diameter 10 mm and the spacing 70 mm were used for ties, despite the same volumetric ratio of ties, the deformation capacity was decreased due to the bar fracture of continuous hoops. This is because the D10 ties were too small to restrain the out-of-plane displacement of the D25 longitudinal bars growing significantly after post-yield buckling. 4) For the column specimen where all longitudinal bars were concentrated only at the corners of the continuous rectangular hoops, the load-carrying capacity was increased by 6.15 to 7.78 %, despite 63.1 % less volume of transverse ties. However, the deformation capacity was decreased. Such re-bar detail may be applicable to the ordinary and intermediate moment frames. ACKNOWLEDGEMENT This research was financially supported by DAEHAN STAZ and the Basic Science Research Program through the National Research Foundation of Korea (NRF), funded by the Ministry of Education, Science, and Technology (No. 2012R1A1A1003282). The authors are grateful for their support.
2670
REFERENCES ACI Committee 318, Building Code Requirements for Structural Concrete (ACI 318-11)
and Commentary, American Concrete Institute, Farmington Hills, MI, 2011. Berry, M. P. and Eberhard, M. O., "Practical Performance Model for Bar Buckling",
Journal of Structural Engineering, ASCE, 131(7), 2005, pp.1060-1070. Dhakal, R. P. and Maekawa, K., "Modeling for Postyield Buckling of Reinforcement",
Journal of Structural Engineering, ASCE, 128(9), 2002, pp.1139-1147. Eom, T-S., Hwang, H-J., Park, H-G., Lee, C-N., and Kim, H-S., "Flexural Test for
Prefabricated Composite Columns Using Steel Angle and Reinforcing Bar", Journal of the Korean Society of Steel Construction, 24(5), 2012, pp.535-547.
Fascia, F., Chiara, D. M., Piasanti, G., and Iovino, R. Continuous Stirrup with Vertical Arms and Variable Pitch for Reinforced Concrete Structures, Schnell S.p.A. 2010, p.74.
Korean Concrete Institute, Concrete Structure Design Code (KCI 2012), Korean Concrete Institute, Seoul, pp.324.
Mander, J. B., Priestley M. J. N., and Park, R., "Theoretical Stress-Strain Model for Confined Concrete," Journal of Structural Engineering, ASCE, 114(8), 1988, pp.1804-1826.
Park. R, "State-of-the-Art Report on Ductility Evaluation from Laboratory and Analytical Testing", Proceedings of 9th World Conference on Earthquake Engineering, Tokyo-Kyoto, Japan, 8, 1988, pp.605-616.
Riva, P., Cyclic Response of Column-to-Foundation Joints with Continuous Stirrups "SPIREX", Schnell Technical Report, 2009, p. 47.
Rodriguez, M. E., Botero, J. C., and Villa, J., "Cyclic Stress-Strain Behavior of Reinforcing Steel Including Effect of Buckling", Journal of Structural Engineering, ASCE, 125(6), 1999, pp.605-612.
2671