Embed Size (px)
Citation preview
ANALYZING ACOUSTIC MARKERS OF
EMOTION IN ARABIC SPEECH
A DISSERTATION IS SUBMITTED TO THE UNIVERSITY OF MANCHESTER FOR THE DEGREE OF THE MASTER OF
PHILOSOPHY (MPHIL) IN THE FACULTY OF SCIENCE AND ENGINEERING
2017
By
Muna Bin Othman
School of Computer Science
Supervisor: Prof. Allan Ramsay
1
Contents
Abstract ......................................................................................................................................9
Declaration................................................................................................................................ 10
Copyright .................................................................................................................................. 11
Dedication ................................................................................................................................. 12
Acknowledgement .................................................................................................................... 13
1. CHAPTER ONE : INTRODUCTION ................................................................................ 14
1.1 Introduction ................................................................................................................ 14
1.2 The area of problem .................................................................................................... 15
1.3 Research Aim ............................................................................................................. 16
1.4 Research Tasks ........................................................................................................... 16
1.5 Thesis Structure. ......................................................................................................... 16
2. CHAPTER TWO : EMOTIONS AND SPEECH RECOGNITION .................................... 18
2.1 Introduction ................................................................................................................ 18
2.2 Speech ........................................................................................................................ 18
2.2.1 What is speech? ................................................................................................... 18
2.2.2 Human Speech production ................................................................................... 20
2.3 Speech and emotion ................................................................................................... 24
2.3.1 What are emotions ? ............................................................................................. 24
2.3.2 Categories of emotion .......................................................................................... 25
2.3.3 Emotion in natural speech ................................................................................... 28
2.3.4 The acoustic correlates of emotions in human speech ........................................... 29

2
2.3.5 Cultural aspects of emotional speech ................................................................... 31
2.3.6 Applications for detecting emotion in human speech ............................................ 33
2.4 Summary .................................................................................................................... 36
3. CHAPTER THREE : ISSUES FOR ARABIC SPEECH PROCESSING ............................ 37
3.1 Introduction ................................................................................................................ 37
3.2 Mapping written forms to phonetic sequences ............................................................. 37
3.2.1 Writing system, Semi-vowels, Diacritics .............................................................. 37
3.2.2 Arabic phonetic system (Arabic phonology) ......................................................... 43
3.2.3 Grapheme-to-phoneme ......................................................................................... 45
3.3 Prosodic Features ........................................................................................................ 48
3.3.1 Intensity ............................................................................................................... 50
3.3.2 Duration ............................................................................................................... 52
3.3.3 Intonation............................................................................................................. 54
3.4 Dialects of Arabic ....................................................................................................... 55
3.5 Summary .................................................................................................................... 56
4. CHAPTER FOUR: CONSTRUCTION AND VALIDATION OF THE CORPUS............. 58
4.1 Introduction ................................................................................................................ 58
4.2 Corpus design ............................................................................................................. 59
4.2.1 Selection of actor ................................................................................................. 62
4.2.2 Selection of emotions ........................................................................................... 63
4.2.3 Design of material texts ....................................................................................... 64
4.2.4 Database collection .............................................................................................. 66
4.2.4.1 Recording process of data ............................................................................ 66
4.2.4.2 Labeling the data.......................................................................................... 68
4.2.4.3 Evaluation of the data ................................................................................... 68

3
4.2.4.4 Results and analysis ...................................................................................... 70
4.3 Summary .................................................................................................................... 79
5. CHAPTER FIVE: EXTRACTING AND ANALYSING THE RELEVANT PROSODIC
FEATURES .............................................................................................................................. 80
5.1 Introduction ................................................................................................................ 80
5.2 The Annotation Process .............................................................................................. 80
5.2.1 Overview of the HTK Toolkit .............................................................................. 81
5.2.2 Requirements of the HTK Toolkit ........................................................................ 83
5.2.2.1 Data preparation............................................................................................ 84
5.2.2.2 Generating the Pronunciation Dictionary (Lexicon) ...................................... 86
5.2.2.3 The Task Grammar ....................................................................................... 89
5.2.3 The Experiment and Preliminary Result from the HTK Toolkit ............................ 91
5.2.3.1 Building and Training the Model ................................................................. 92
5.2.3.2 Evaluating the Model .................................................................................... 93
5.2.3.3 The Results of Automatic Speech Alignment in the HTK Toolkit ................ 94
5.2.4 Annotation with the Praat Program ...................................................................... 96
5.3 Extraction of Prosodic Features ................................................................................... 99
5.4 Summary .................................................................................................................. 103
6. CHAPTER SIX : CLASSIFICATION.............................................................................. 104
6.1 Introduction .............................................................................................................. 104
6.2 Classifying phonemes ............................................................................................... 105
6.2.1 The experiments and Dataset description............................................................ 105
6.2.2 Experiment I : Performance Evaluation of a set of classifiers ............................. 109
6.2.2.1 Classifiers Used .......................................................................................... 110
6.2.2.2 Experimental results of Experiment I ......................................................... 117

4
6.2.3 Experiment II : Exploring which feature is important ......................................... 125
6.2.3.1 Dataset Description of Experiment II ......................................................... 126
6.2.3.2 Experimental results of Experiment II ........................................................ 126
6.2.4 Experiment III : The effect of excluding neutral emotion ................................... 130
6.2.4.1 Dataset Description of Experiment III ........................................................ 131
6.2.4.2 Experimental results of Experiment III ....................................................... 132
6.2.5 Summary ........................................................................................................... 133
6.3 Classifying utterances ............................................................................................... 134
6.3.1 Experimental results of the experiment ............................................................. 134
6.3.2 Summary ........................................................................................................... 138
6.4 Conclusion ................................................................................................................ 138
7. CHAPTER SEVEN : CONCLUSION .............................................................................. 140
7.1 Conclusion ................................................................................................................ 140
7.2 Future work .............................................................................................................. 141
8. References ....................................................................................................................... 143
9. APPENDICES ................................................................................................................. 154
Appendix A: Questionnaire ..................................................................................................... 154
Appendix B : Python programs ............................................................................................... 156
Appendix C : The result of experiments before and after adding the missing emotions ............ 159

5
List of Tables
Table 2.1: Emotion and speech parameters (Murray & Arnott, 1993) ........................................ 31
Table 3.1: Different shapes of Arabic letters with SAMPA and IPA symbols ........................... 39
Table 3.2: List of Arabic consonants with IPA symbols............................................................. 43
Table 3.3: Arabic vowel ............................................................................................................ 44
Table 3.4: Arabic diphthongs in different positions (Khalifa, Obaid, Naji, & Daoud, 2011) ....... 45
Table 4.1: Selected sentences .................................................................................................... 64
Table 4.2: Labeling for emotions ............................................................................................... 68
Table 4.3: An example of listener response ............................................................................... 70
Table 4.4: Confusion matrix for the listeners’ responses ............................................................ 71
Table 4.5: Confusion matrix for the listeners responses without neutral emotion ....................... 72
Table 4.6: Evaluation of happy emotion by listeners ................................................................. 73
Table 4.7: Evaluation of neutral emotion by listeners ............................................................... 74
Table 4.8: Evaluation of sad emotion by listeners ...................................................................... 75
Table 4.9: Evaluation of anger emotion by listeners .................................................................. 76
Table 4.10: The expressive data recognised by subjective human evaluation ............................. 78
Table 4.11: The number of final expressive selected sentences .................................................. 79
Table 6.1: dataset attribute information ................................................................................... 108
Table 6.2: The expressive utterances used of our dataset ......................................................... 108
Table 6.3: The features are used in each experiment with different learning algorithms ........... 117
Table 6.4: Simulation Result of six chosen Algorithms............................................................ 122
Table 6.5: Error Rate Evaluation Parameters for classifiers ..................................................... 124
Table 6.6: Details of five datasets ............................................................................................ 126
Table 6.7: The features are used in each experiment with DecisionTable algorithms ............... 126
Table 6.8: The result of using two features with DecisionTable algorithm ............................... 128
Table 6.9: The result of using one feature with DecisionTable algorithm ................................. 128
Table 6.10: Confusion matrix for DecisionTable obtained with 10 fold cross-validation with
using all features .............................................................................................................. 130
Table 6.11: The features are used in each experiment without Neutral Emotion (E00) ............ 132
Table 6.12: Confusion matrix of all utterances ........................................................................ 135
Table 6.13: The result of six experiments with missing emotions ............................................ 136

6
Table 6.14: Confusion matrix of all utterances after adding the missing emotions ................... 137
Table 6.15: The result of six experiments with adding of missing emotions ............................. 137

7
List of Figures
Figure 2.1: Waveform of sound ................................................................................................. 19
Figure 2.2: Speech organs ......................................................................................................... 21
Figure 2.3: IPA vowel chart ...................................................................................................... 22
Figure 2.4: A diagram of the human ear (Bosi & Goldberg, 2012) ............................................. 23
Figure 2.5: Plutchik’s Wheel of Emotions ................................................................................. 25
Figure 2.6: Circumplex Model of Emotions (Posner, Russell, & Peterson, 2005) ....................... 27
Figure 2.7: PANA Model (Watson & Tellegen, 1985) ............................................................... 27
Figure 3.1: Prosodic dependencies ............................................................................................ 48
Figure 4.1: Phonemes frequency ............................................................................................... 65
Figure 4.2: Sound recorder of Praat program ............................................................................. 67
Figure 5.1: The process of extracting the features. .................................................................... 80
Figure 5.2: Two major processing stages in HTK toolkit (Sjölander, 2009). .............................. 82
Figure 5.3: Data preparation of our Data ................................................................................... 84
Figure 5.4: Pronunciation dictionary file ................................................................................... 89
Figure 5.5: The task grammar designed for the first sentence. .................................................... 90
Figure 5.6: Wav_config file....................................................................................................... 92
Figure 5.7: Forced alignment (Young et al., 2002). .................................................................... 94
Figure 5.8: The files used in recognising the test data ................................................................ 94
Figure 5.9: Recognition output (recognized transcription_ recout.mlf) ...................................... 96
Figure 5.10: A TextGrid window in Praat software ................................................................... 97
Figure 5.11: SCP_files .............................................................................................................. 98
Figure 5.12: TextGrid file of sample1.wav ................................................................................ 99
Figure 5.13: The extracted information.................................................................................... 100
Figure 5.14: CSV file with suitable names for recorded data. .................................................. 101
Figure 5.15: First lines of the features database from CSV file. ............................................... 102
Figure 6.1: The framework for the classification of emotional speech..................................... 104
Figure 6.2: ARFF file of our dataset ........................................................................................ 107
Figure 6.3: Decision tree algorithm ......................................................................................... 112
Figure 6.4: Multilayer Perceptron ............................................................................................ 115

8
Figure 6.5: Experiment Environment window ......................................................................... 119
Figure 6.6: Preprocessing of E00 ............................................................................................. 131
9
Abstract
ANALYZING ACOUSTIC MARKERS OF EMOTION IN ARABIC SPEECH
Muna Bin Othman
A dissertation submitted to the University of Manchester for the degree of Master
of Philosophy (MPHIL), 2017
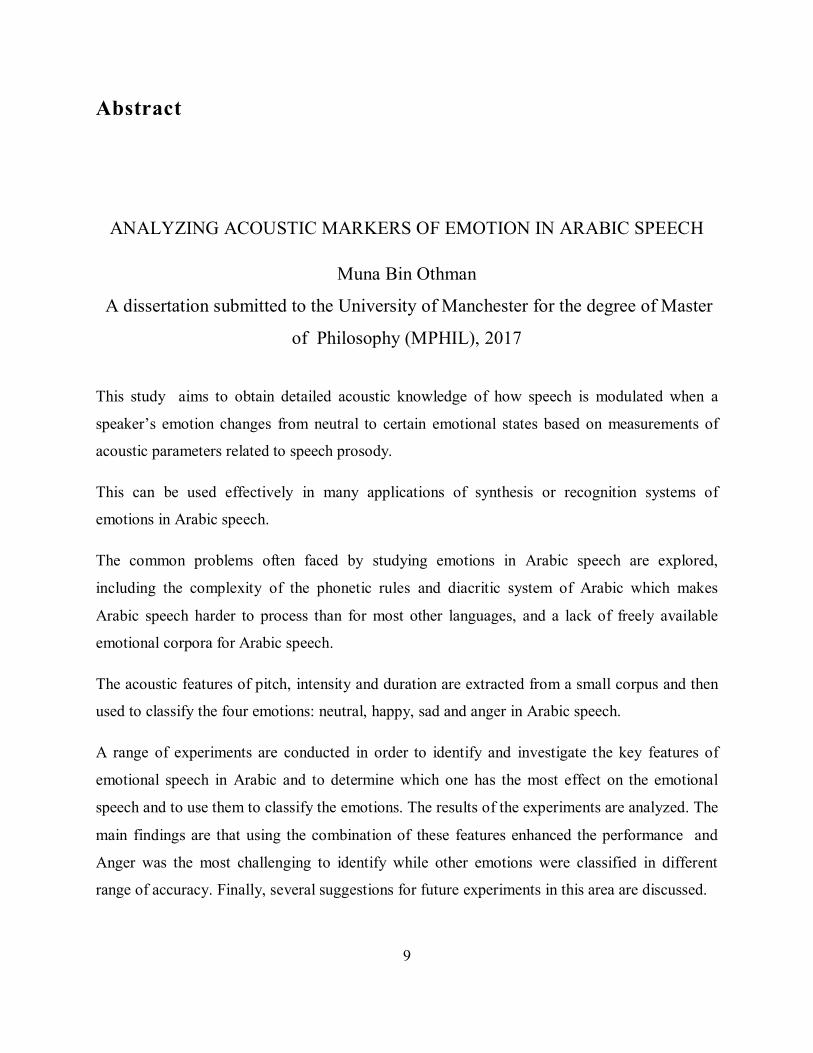
This study aims to obtain detailed acoustic knowledge of how speech is modulated when a
speaker’s emotion changes from neutral to certain emotional states based on measurements of
acoustic parameters related to speech prosody.
This can be used effectively in many applications of synthesis or recognition systems of
emotions in Arabic speech.
The common problems often faced by studying emotions in Arabic speech are explored,
including the complexity of the phonetic rules and diacritic system of Arabic which makes
Arabic speech harder to process than for most other languages, and a lack of freely available
emotional corpora for Arabic speech.
The acoustic features of pitch, intensity and duration are extracted from a small corpus and then
used to classify the four emotions: neutral, happy, sad and anger in Arabic speech.
A range of experiments are conducted in order to identify and investigate the key features of
emotional speech in Arabic and to determine which one has the most effect on the emotional
speech and to use them to classify the emotions. The results of the experiments are analyzed. The
main findings are that using the combination of these features enhanced the performance and
Anger was the most challenging to identify while other emotions were classified in different
range of accuracy. Finally, several suggestions for future experiments in this area are discussed.

10
Declaration
No portion of the work referred to in this dissertation has been submitted in support of an
application for another degree or qualification of this or any other university or other institute of
learning.

11
Copyright
i. The author of this thesis (including any appendices and/or schedules to this thesis) owns
certain copyright or related rights in it (the “Copyright”) and s/he has given The
University of Manchester certain rights to use such Copyright, including for
administrative purposes.
ii. Copies of this thesis, either in full or in extracts and whether in hard or electronic copy,
may be made only in accordance with the Copyright, Designs and Patents Act 1988 (as
amended) and regulations issued under it or, where appropriate, in accordance with
licensing agreements which the University has from time to time. This page must form
part of any such copies made.
iii. The ownership of certain Copyright, patents, designs, trademarks and other intellectual
property (the “Intellectual Property”) and any reproductions of copyright works in the
thesis, for example graphs and tables (“Reproductions”), which may be described in this
thesis, may not be owned by the author and may be owned by third parties. Such
Intellectual Property and Reproductions cannot and must not be made available for use
without the prior written permission of the owner(s) of the relevant Intellectual Property
and/or Reproductions.
iv. Further information on the conditions under which disclosure, publication and
commercialisation of this thesis, the Copyright and any Intellectual Property and/or
Reproductions described in it may take place is available in the University IP Policy (see
http://documents.manchester.ac.uk/DocuInfo.aspx?DocID=24420), in any relevant
Thesis restriction declarations deposited in the University Library, The University
Library’s regulations (see http://www.library.manchester.ac.uk/about/regulations/) and in
The University’s policy on Presentation of Theses

12
Dedication
To my mother Fatima.

13
Acknowledgement
All praise is due to Allah, who guided me to this. I would like to express my sincere gratitude to
my supervisor; Prof. Allan Ramsay. I’m greatly indebted to his assistance, guidance and support.
I am very grateful for my mother, husband and my friends whom I consider as my sisters. Thank
you for believing in me and supporting me.
Finally, I hope this thesis be a useful addition to the research activities of Arabic natural
language processing
MUNA

14
1. CHAPTER ONE : INTRODUCTION
1.1 Introduction
Speech is the most important of the different forms of communication used in daily life.
It occurs via the variations in air pressure that are caused by the articulatory system in the
production of the human voice (Dutoit, 1997).
Speech also conveys certain information to listeners about the language being spoken, and about
the gender and emotional state of speakers. This is achieved by the use of natural acoustic effects
of the voices, which are very important in representing a speaker’s feelings and emotional state.
In fact, people can convey and recognise emotions easily, even in a language which they do not
understand, and adding the ability express emotion in synthetic speech would substantially
improve its quality. This makes the emotions a part of speech and one of the core components in
human communication.
Understanding how emotions are expressed in speech and embedding them as a component of
speech processing can be useful for speech technology tools that perform specific tasks by
making them more natural and effective.
In the field of speech synthesis, it is important to introduce emotional characteristics into
synthetic speech in order to provide more freedom of expression from a machines to speak like
humans, which is important to a growing variety of cases of the use of speech synthesis.
There are many studies that have contributed towards the creation of expressive speech synthesis
aimed at an achieving a more natural result during human-computer interaction (Cahn,
1989),(Murray & Arnott, 1993).
Several target applications can be found, such as emotional greetings and reading applications
for blind people. Speech recognition is another area which has received much attention from
researchers attempting to enable computers to automatically recognise the emotional or physical
state of humans from their speech.

15
It is particularly useful for enhancing the naturalness of speech-based human machine interaction
(Schuller, Rigoll, & Lang, 2004), (Dellaert, Polzin, & Waibel, 1996), (Koolagudi, Maity,
Vuppala, Chakrabarti, & Rao, 2009).
Applications of emotion recognition systems include tasks such as emotion/problem recognition
in automatic dialog systems, emotion recognition for psychologic alanalysis and lie detection in
forensic investigations (Zotter, 2003). In addition, information from customers’ behaviour in call
centre conversations could be analysed (Lee & Narayanan, 2005) and information about the
mental states of car drivers could be used by onboard driving systems to keep them alert while
driving (Schuller et al., 2004).
There seem to be a number of parameters, such as pitch, speech rate etc., which can be examined
and measured when looking for properties of speech which correlate with multiple
emotions(Murray & Arnott, 1993),(Scherer, 2003), (Shami & Verhelst, 2007).
The aim of this research is to investigate how the emotional states affect Arabic speech and to
extract the key features of selected emotional states from samples of recorded human speech.
1.2 The area of problem
Although the Arabic language is spoken throughout the Arab world and is known by millions of
people as an official language in 24 different countries, and has a religious value for more than
1.6 billion Muslims worldwide, it has gained less attention in the field of speech systems in
general, and of emotional speech corpora in particular, compared with other languages. It is
noted that this may be due to limitations in natural language processing (NLP) in Arabic (El-
Imam, 1989). In recent years there have been advances in Natural Language Processing (NLP)
and Digital Signal Processing (DSP) which improved the quality and naturalness of available
Arabic voices. All of that was in the area of processing of speech. Although, there has been a
great increase in the demand for speech systems, and adding emotions to these systems and their
applications has become one of the major trends in this field, to our knowledge there has been
very little work on developing emotionally expressive voices for the language.

16
1.3 Research Aim The main aim of this research is to find the acoustic correlates of emotion in spoken Arabic.
This is important because people express their attitudes to what they are saying by changes in the
characteristics of the sounds they are producing, and because if synthetic speech is generated
without understanding how it expresses emotion then it may well express unintended emotions.
1.4 Research Tasks
In order to achieve our aim, there are a number of tasks that have to be carried out.
These tasks can be related to the research aim as below:
RT: In order to find out what the acoustic correlates of emotions are, we have to do two things:
RTA, we have to start by gaining a good understanding of what emotions are by examining the
psychological literature, previous studies, research papers, and library and internet searches on
theories of emotion to illustrate how researchers have responded to what is assumed about
these emotions. These studies also include the conclusions made by anthropologists, particularly
from observations of cultural-specific emotions.
RTB, we need to obtain a database of Arabic speech which expresses different emotions ( anger,
sadness, happiness and neutral), marking them up for emotion, and then extracting from them
the acoustic features, in an attempt to find, either by inspection or by machine learning, what the
significant features are. This material will be discussed in chapter 5.
Existing speech corpora for Arabic do not contain a lot of emotional materials, so cannot
easily be used. Due to the lack of Arabic speech corpora marked up for emotion, a decision was
made to record a number of Arabic sentences spoken by a trained actor aiming to express
different emotional states (anger, sadness, happiness and neutral state).
1.5 Thesis Structure.
The rest of the thesis will be organised as follows:
• Chapter two begins by firstly giving background information about the field of speech
processing. The chapter starts with the basic definition of speech terms and the

17
mechanism of human speech production before taking a look into the process of speech
processing in general with its applications in speech synthesis and speech recognition.
Secondly, this chapter also explains the concept of emotions from different points of
view and how they are expressed in speech, and discusses the existing emotional speech
of some applications. Lastly, it discusses the cultural aspects of emotional speech and
gives examples from corpora of emotional speech.
• Chapter three explains the relevant properties of the Arabic language. This chapter is
divided into five sections. Section 1 introduces the chapter. Section 2, Mapping written
forms to phonetic sequences, introduces some characteristics of Arabic, such as the
writing system, diacritics, semi-vowels, and the Arabic phonetic system (Arabic
phonology).Section3 presents prosodic features (Intensity, duration and Intonation) of
Arabic speech. Section 4 discusses one of the challenges for Arabic text to speech,
which is dialects of Arabic. The chapter ends with a summary in Section 5.
• The aim of Chapter four is to report on the design and validation of an Arabic emotional
speech corpus. A brief introduction is presented in Section 1. Section 2 discusses the
different ways of creating a corpus of emotional speech and gives some reasons why the
data were recorded by an actor, rather than finding a database of recordings of emotional
speech. This chapter also describes the problems that could arise from making our own
recordings and explains these risks. Explanations are given of which target emotions
were selected, and how the actor and materials for recording were selected. The
processing of the data for recording, labeling and evaluation by a number of native
Arabic speakers are also presented. Section 3 presents the summary of this chapter.
• Chapter five : extracting and analysing the acoustic correlate features. This chapter
gives an overview of these prosodic features and explains how they were extracted.
• Chapter six :This chapter presents the set of experiments, along with their results, which
were conducted by applying machine learning algorithms to find out which are the most
important features for identifying emotions and also to discover which utterances and
phonemes are more difficult to classify.
• Chapter seven : conclusion and future work.

18
2. CHAPTER TWO: EMOTIONS AND SPEECH
RECOGNITION
2.1 Introduction
The aim of this work is to find the acoustic correlates of emotions in spoken Arabic as a basis for
identifying the emotional content of Arabic speech. Therefore, it is worthwhile to go into a short
overview to see how emotions are expressed in normal human speech. In fact, to understand
how emotions are expressed in speech we have to understand the basics of what speech is and
how human speech is produced; and we also have to know what emotions are. It is also good to
know a little bit about some applications of detecting emotion in human speech such as in the
areas of speech synthesis systems and emotional speech recognition.
2.2 Speech
2.2.1 What is speech?
Speech is the principal means of communication between people. It has evolved over many
centuries to become the rich and elaborate language structure today.
Speech consists of the acoustic realisation of a sequence of units called morphemes (the smallest
meaning-bearing unit in a language). The way speech encodes morphemes is by using
elementary acoustic symbols known as phonemes where a phoneme is the smallest element of
sound (Rowden, 1992)that can be used to distinguish between different messages (i.e. different
morphemes). This contrasts with text, which uses graphical units known as characters for the
same task.
However, speech signals convey more than spoken words, they also contain some information
about the message content and meaning, about the nature of the transmission medium, and about
the identity and condition of the speaker.

19
Physically, sound is any vibration (wave) travelling through the air or other medium which can
be heard when it reaches a person's ear. Figure 2.1 shows the waveform of a simple sound.
Figure 2.1: Waveform of sound
A pure note corresponds to a sound wave where the pressure along the signal varies as simple
sinusoidal wave. Such a wave involves displacement of each particle in the medium through
which the sound is travelling around a mean position, where the displacement also varies
sinusoidally with time. The time for a complete cycle of this motion is referred to as the period.
The wavelength is, equivalently, the distance between two pressure peaks at an instant or the
velocity of sound in the medium divided by the frequency.
All sound signals possess the attribute of intensity and many possess the properties of pitch and
timbre.
Intensity refers to the energy in the signal. Loudness refers to the listener’s
experience of that energy. The link between the two is that perceived loudness is
proportional to the log of energy, i.e. if one sound has four times the intensity of
another it will be perceived as being twice as loud, if the first has nine times the
energy of the second it will be perceive as being three times as loud.
Pitch refers to how high or low a sound is. For simple sounds the pitch is determined
by the frequency, with sounds with a low frequency sounding deeper than ones with a

20
high frequency. For speech, the perceived pitch is not straightforwardly linked to the
frequency and is typically found by using auto-correlation.
Timbre-tone or tone quality has been defined as the characteristic auditory coloring of
an individual's voice, derived from a variety of laryngeal and superalaryngeal features
and running continuously through the individual's speech (Trask, 1996). It depends
primarily on the waveform of the sound wave. Timbre helps your ears distinguish one
type of sound production from another.
2.2.2 Human Speech production
The human speech production system is an interesting and complex mechanism, in this
subsection I will explain how speech is created by the human vocal system.
Sound production requires two things: Power/energy source and vibrating element; in human
speech production, air is the power source that comes from the lungs while the vocal cords are
the vibrating element. So, all sounds are produced by some movements of air which goes up the
windpipe (trachea) and into the larynx and out of the body through the vocal tract (i.e. mouth or
nose).These produced sounds are conveyed by the ear to the brain for processing.
There are a set of unique vocal characteristics which a speaker has to enable other listeners to
recognize him from his voice, these characteristics are related to the physiology of the
speaker(Hansen & Hasan, 2015; Rodman, 1999).
There are a set of components of the human speech system which play a major role in the speech
production process which can be grouped into three systems: respiratory system; lungs
generating air stream, phonatory system includes larynx and vocal folds and articulatory system;
and vocal tract. The ways in which sounds are produced is through organs of speech
(articulators), as shown in Figure 2.2.

21
Figure 2.2: Speech organs
Speech sounds are generated by forcing the air from the lungs to pass through the folds of the
vocal cords that are present in the larynx. When the air flow increases, complex pressure
differences are created by the glottis, leading to the vibration of vocal folds in a way resembling
the reed in a wind instrument. The produced sounds are called ‘voiced’ sounds and the whole
process is called phonation. The stress on the vocal folds determines the frequencies of the vowel
sounds (Wheddon & Linggard, 1990).
The basic sounds of a language are called phonemes which are considered as a working
definition of the perceptual unit of language and the manifestation of each phoneme depends on
the word being spoken and the position of the phoneme within the word.
There are three aspects of studying phonemes as scientists of phonetics suggest :
Acoustic phonetics deals with the physical properties (acoustic aspects) of the sounds of
language.
Auditory phonetics is concerned with how listeners perceive the sounds of language.
Articulatory phonetics focuses on how the vocal tract or organs produce the sounds of
language.
A typical speech utterance consists of a string of vowel and consonant phonemes whose temporal
and spectral characteristics change with time.
22
Consonants in English are described according to three features: place of articulation; manner of
articulation; whether the vocal cords vibrate in articulation, that is if they are voiced. Their
formation depends upon an aggressive (outward-flowing) airstream initiating in the lungs. and
can be produced as result of obstruction of airflow in the vocal tract.
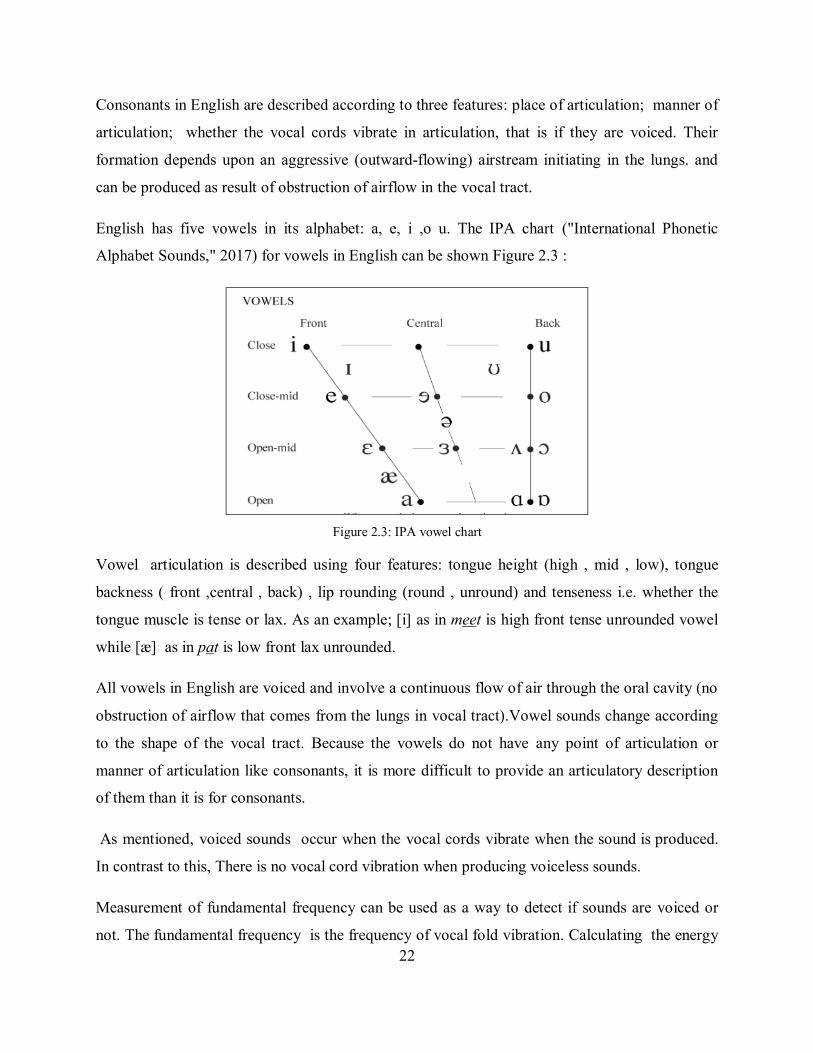
English has five vowels in its alphabet: a, e, i ,o u. The IPA chart ("International Phonetic
Alphabet Sounds," 2017) for vowels in English can be shown Figure 2.3 :
Figure 2.3: IPA vowel chart
Vowel articulation is described using four features: tongue height (high , mid , low), tongue
backness ( front ,central , back) , lip rounding (round , unround) and tenseness i.e. whether the
tongue muscle is tense or lax. As an example; [i] as in meet is high front tense unrounded vowel
while [æ] as in pat is low front lax unrounded.
All vowels in English are voiced and involve a continuous flow of air through the oral cavity (no
obstruction of airflow that comes from the lungs in vocal tract).Vowel sounds change according
to the shape of the vocal tract. Because the vowels do not have any point of articulation or
manner of articulation like consonants, it is more difficult to provide an articulatory description
of them than it is for consonants.
As mentioned, voiced sounds occur when the vocal cords vibrate when the sound is produced.
In contrast to this, There is no vocal cord vibration when producing voiceless sounds.
Measurement of fundamental frequency can be used as a way to detect if sounds are voiced or
not. The fundamental frequency is the frequency of vocal fold vibration. Calculating the energy

23
in a section of the signal (signal frame) is another way to identify voiced and unvoiced sounds
where a voiced sound has more energy than an unvoiced sound.
Next, a brief explanation to how humans hear the sounds. Hearing is a complex process of
picking up sound and attaching meaning to it.
The ear can be divided into three parts leading up to the brain : the outer ear, middle ear and the
inner ear as shown in Figure 2.4.
Figure 2.4: A diagram of the human ear (Bosi & Goldberg, 2012)
Waves enter the outer ear (called the pinna or auricle) and they travel through the ear canal and
make their way toward the middle ear. These waves reach the part of the middle ear called the
eardrum (a piece of thin skin stretched tight), and cause the eardrum to vibrate. These sound
vibrations are carried to the three tiny bones of the middle ear, which turn waves into vibrations
and then delivers them to the inner ear. The vibrations in the inner ear go into the cochlea (a
small, curled tube in the inner ear). When the sound vibrations hit the liquid in the cochlea, these
vibrations cause the sensory hairs in the cochlea to move. The sound vibrations are transformed
into nerve signals and delivered to the brain via the hearing nerve, also called the “eighth nerve”.
The brain then interprets these electrical signals as sound (Bosi & Goldberg, 2012).

24
2.3 Speech and emotion
In this section, we highlight some of the different notions of emotion and ways of classifying
emotions in emotion research. Furthermore, we will describe how emotion relates to natural
speech and which features influence the recognition of emotion in speech. In addition, we
introduce cultural aspects of emotional speech and some applications for detecting emotion in
speech.
2.3.1 What are emotions ?
Emotions are internal feeling we experience, they are used to communicate in everyday life and
make speech more expressive and effective.
Researchers have not managed to agree on an objective definition of the term emotion. Different
people use the word with a variety of contextual meanings so this term is considered uncertain
and complex. This is a fundamental hurdle to overcome in proceeding with a scientific approach
towards research in the area (Schröder & Cowie, 2006).
Psychologists describe emotions in general as mental states that arise spontaneously as a result of
external or internal stimulants rather than through conscious effort.
However, some researchers claim that emotion is dependent on the influence of religion and
socio-cultural customs in addition to social phenomena and the conditioned behavior of the
group which an individual inhabits.
People can recognize the underlying emotions that other people feel by the way they express
them in speech and facial expressions (Koolagudi & Rao, 2012).
In the following section, we will describe and give categories of emotion.

25
2.3.2 Categories of emotion Before we can attempt to link acoustic features to emotions, we have to have a target set of
emotions. Unfortunately, there is no uniformly agreed set of categories for emotions, with most
categorising done on a relatively subjective basis. The reason for this is that there are a range of
emotions that can be confusing, challenging and complicated to describe because there are so
many different perspectives on them. There are, however, two commonly used approaches,
called discrete and dimensional.
In the discrete approach, a set of emotions called basic emotions which are universally
experienced in all human cultures are identified, namely happiness, sadness, disgust, fear,
surprise, and anger. These emotions can be found in human everyday communication and
are easy to understand and recognise. However, other theories and new research continue
to explore many different types of emotions and it has been found that there are far more
basic emotions than previously believed. Plutchik (Plutchik, 1990) proposed that there
are eight primary emotions joy, sadness, acceptance, disgust, fear, anger, surprise and
anticipation. The emotions that he identified, which are the foundation for all others, are
grouped into polar opposites as show in figure 2.5 where the cone’s radial dimension
represents intensity – emotions intensify as they move from the outside to the center of
the wheel. For example, a feeling of boredom can intensify to loathing if left unchecked.
Figure 2.5: Plutchik’s Wheel of Emotions

26
There are, however, numerous competing classifications, and it can be hard to compare
descriptions of the psychological properties and the associated acoustic features of
emotions when different classifications are used.
In the dimensional approach, emotions are defined according to one or more dimensions.
For example Ressel (Ressel, 1980) suggests that emotions are distributed in a two-
dimensional space, containing arousal and valence. Arousal represents the degree of
activity that is generated by a particular stimulus. It relates to the intensity of an
emotional experience and may range from energised or alert to calm or drowsy (i.e.
active or passive). Arousal may also be referred to as Activation. Valence represents the
degree to which a particular stimulus is viewed as being pleasant or unpleasant (i.e.
positive or negative). Valence may also be referred to as Evaluation.
Murray and Arnott (Murray & Arnott, 1993)and Stibbard (Stibbard, 2001), on the other
hand, suggest that there are three dimensions rather than two: Strength (corresponds to
attention – rejection), Valence (corresponds to positive – negative) and Activity
(corresponds to sleep – tension), or another example are the dimensions of pleasure,
arousal and power, e.g. Pereira (Pereira, 2000). Schlosberg (Schlosberg, 1954) named
three dimensions of emotion: "pleasantness–unpleasantness", "attention–rejection" and
"level of activation".
Several dimensional models of emotion have been developed, though there are just a few
that remain as the dominant models currently accepted by most (C. & M; David C.
Rubin; Rubin & Talarico, 2009). The two-dimensional models that are most prominent
are the circumplex model and the Positive Activation – Negative Activation (PANA)
model as shown in Figures 2.6 and 2.7.

27
Figure 2.6: Circumplex Model of Emotions(Posner, Russell, & Peterson, 2005)
Figure 2.7: PANA Model(Watson & Tellegen, 1985)
In this thesis, four emotion labels from the discrete approach are used in our experiments,
namely anger, happiness, neutral, sadness, as we will describe in Section 4.2.2. This set of
emotions appears most frequently and is most used with computational approaches, due to its
simplicity and familiarity.

28
2.3.3 Emotion in natural speech
Humans have different ways, like laughing, shouting, or crying, to express their feelings; they
also use more subtle modulations of speech. Consequently, in expressing and understanding
emotions, different types of sources need to be considered.
Emotional expression also relates to a wide range of somatic correlates, including heart rate, skin
resistivity, temperature, pupil diameter and muscle activity. For example, when feeling anger the
sympathetic nervous system is aroused, the heart rate and blood pressure increase, the mouth
becomes dry and there are occasional muscle tremors. Speech is then loud, fast and enunciated
with strong high frequency energy. Meanwhile, experiencing a bored or sad state arouses the
parasympathetic nervous system, whereby we observe decreasing of the heart rate and blood
pressure decrease and salivation increases, producing speech that is slow, low-pitched and with
little high frequency energy (Breazeal, 2000).
There are some obstacles to research into speech and emotion that make the study of emotions in
speech difficult. In particular some features, such as pitch, intensity and duration, can be used
both to encode emotions and to distinguish between different words. It can be hard to see when
a feature is being used as an emotion marker and when it is used for distinguishing between
lexical items, which can cause problems when looking at their use for encoding emotions.
Additionally, the lack of a settled approach to describing emotion and of clear, theory-based
hypotheses makes comparing different analyses difficult.
Understanding how emotions are marked by various aspects of the voice requires more intensive
work and contributions from researchers in multiple fields such as psychology, acoustics, speech
science, linguistics, medicine, engineering, and computer science (Juslin & Scherer, 2008).
However, analysis of expressed emotion can be done at three different levels according to Juslin
and Scherer :the physiological, the phonatory-articulatory and the acoustic. In physiological
level, researchers describe nerve impulses or muscle innervations patterns of the major structures
involved in the voice-production process, the phonatory-articulatory level includes describing the

29
position or movement of the major structures such as the vocal folds, while describing
characteristics of the speech wave form emanating from the mouth as the acoustic level. The
physiological and phonatory-articulatory levels can take into consideration most of the current
methods for measurement and analysis of expressed emotion, but require specialised equipment
as well as a high level of expertise. In contrast, acoustic measurement of voice cues, requiring
basic training in voice physiology and acoustics but no special equipment, is perhaps the method
that holds the greatest promise for interdisciplinary research on emotional speech.
In the next section, we present in brief some studies conducted in order to investigate the
features (parameters) of the acoustic speech signal which carry emotional information.
2.3.4 The acoustic correlates of emotions in human speech
A number of studies with a detailed analysis of recorded human emotional speech have been
carried out in order to examine specifically parameters in the speech signal that are affected by
the speaker's emotional state.
Williams and et al.(C. E. Williams & Stevens, 1972) reported two principal reasons why it is
important to study and discover speech attributes related to emotional states. Firstly, studies of
the parameters of the speech signal that relate to the emotional state of a speaker contribute
towards a general theory of speech performance. Secondly, analysis of these characteristics of
utterances may help to monitor the physiological and emotional state of an individual and hence
make it possible to respond to their needs in certain situations and it would be convenient if an
indication of this state could be obtained through analysing these parameters.
However, while identifying these characteristics is important, currently, researchers are still
attempting to delineate some of the acoustic correlates of the emotions of a speaker, and there is
debate about which features influence the recognition of emotion in speech. There is also
considerable uncertainty as to the best algorithm for classifying emotion, and which emotions to
class together.
The acoustic characteristics of emotions in the speech signal that reflect the emotional state of a
speaker have been investigated by many researchers through a number of experiments using

30
computer-based sound manipulation techniques (Banse & Scherer, 1996; Stevens & Williams,
1969; C. Williams, Stevens, & Hecker, 1970). Their results generally agree on the speech
correlates that come from physiological constraints and correspond to broad classes of basic
emotions, but are unclear when one looks at the differences between the acoustic correlates of,
for instance, fear and surprise or boredom and sadness. Certain emotional states are often
correlated with particular physiological states (Picard, 1995) which in turn have quite mechanical
and thus predictable effects on speech, especially on pitch, (fundamental frequency F0) timing
and voice quality.
Their findings refer to the fact that physiological constraints have an effect on emotions. For
example, when we get angry, heart rate, arterial tension and testosterone production increase,
cortisol (the stress hormone) decreases, and the left hemisphere of the brain becomes more
stimulated. These things by themselves will change how your voice sounds in that situation,
while by contrast, there are also things you do deliberately in order to express emotions which
might be rising intensity and pitch for example when you get angry. It is hence hard to know
whether the change in the way the sounds are produced is a result of autonomic physiological
changes associated with the emotion in question or whether it is a deliberate choice. In the long
run this may not matter for emotion detection, since whatever the cause the change will be
associated with the emotion.
All studies in the field point to the pitch (fundamental frequency) as the main vocal cue for
emotion recognition. The other acoustic variables contributing to vocal emotion signaling are
vocal energy, frequency spectral features, formants (usually only one or two first formants (F1,
F2) are considered), and temporal features (speech rate and pausing) (Banse & Scherer, 1996).
Some more recent studies have shown that voice quality, which refers specifically to those
auditory qualities that arise from variations in the voice source signal (Gobl & Chasaide, 2000)
and certain co-articulatory phenomena (Kienast & Sendlmeier, 2000), are also reasonably
correlated with certain emotions. Overall however it is generally agreed that the most crucial
aspects are those related to prosody: the pitch contour, the intensity contour and the timing of
utterances.

31
One of the most often mentioned studies in the field of emotion recognition through speech
signals is work done by Murray and Arnott (Murray & Arnott, 1993) who have summarised the
best acoustic parameters for detecting basic emotions in terms of speech rate, pitch (fundamental
frequency), intensity, duration. The acoustic characteristics for the different emotions are
presented in the Table (Murray & Arnott, 1993). Another important research on the acoustic
correlates of speaker states was accomplished by Pittam and Scherer (Pittam & Scherer, 1993).
Anger Happiness Sadness Fear Disgust Speech rate Slightly faster Faster or slower Slightly slower Much faster Very much
slower Pitch average Very much
higher Much higher Slightly slower Very much
higher Very much lower
Pitch range Much wider Much wider Slightly narrower Much wider Slightly wider Intensity Higher Higher Lower Normal Lower Voice quality Breathy, chest
tone Breathy, blaring Resonant Irregular voicing Grumbled chest
tone Pitch changes Abrupt,
onstressed syllables
Smooth, upward inflections
downward inflections
Normal Wide downward terminal inflections
articulation tense Normal slurring precise Normal Table 2.1: Emotion and speech parameters (Murray & Arnott, 1993)
In summary, acoustic parameters, such as F0, intensity and duration, which have seemingly clear
relationships with the most prominent perceptual characteristics of speech (i.e. pitch, loudness
and speech rate) have received the most attention. These parameters also tend to be the easiest to
analyze.
However, decoding emotions in speech is a complex process that is influenced by the cultural,
social, and intellectual characteristics of subjects (Petrushin, 1999). The next section introduces
the cultural aspects of emotional speech.
2.3.5 Cultural aspects of emotional speech
Many transcultural studies emphasise how language and culture play an important role in the
way vocal emotions are encoded and recognised in speech and other communication channels
(Elfenbein & Ambady, 2002). Many researchers have suggested that any theory relating to
emotion should take account of linguistic and cultural factors.

32
They also showed evidence that the way specific effects are expressed acoustically is very
similar across different cultures(Scherer, Banse, & Wallbott, 2001; Thompson & Balkwill,
2006). The latter finding suggests that the vocal expression of emotion is, to some extent, innate
(Hammerschmidt & Jürgens, 2007), so a listener can identify an emotionally spoken sentence
correctly even if it was not spoken in his or her mother language (Beier & Zautra, 1972; Kramer,
1964; Scherer et al., 2001)
Some researchers such as Ekman and et al. (Ekman & Friesen, 1971; Izard, 2001) reported that
expressions of basic emotion such as joy, anger, disgust, sadness, and fear hold certain
properties which allow them to be recognised independently regardless of culture and learning,
this would arise from the fact that at least some emotions are directly linked to physiological
changes: the changes in hormone levels that arise when person is in a dangerous situation will
predate the evolution of language, so if those changes result in things like a raised heartbeat that
then affect how quickly someone do things then this will almost certainly be uniform across
cultures.
In contrast, others claim that there are differences in how emotions are expressed across human
cultures depending on types of expressing emotions and study group (Beaupré & Hess, 2005;
Ekman et al., 1987; Elfenbein, Beaupré, Lévesque, & Hess, 2007; Matsumoto, 1993).
Pell et al in their study(Pell, Monetta, Paulmann, & Kotz, 2009) also emphasise that the ability
to understand expressed emotions in speech is partly independent of linguistic ability, although
this ability is also shaped by linguistic and cultural variables. They investigate whether basic
expressed emotions can be identified pan-culturally from a speaker’s voice and the face,
regardless of the culture or linguistic ability of the individual. They compared how Argentine
Spanish speakers (61 participants) recognise basic emotions from pseudo-utterances (“nonsense
speech”) produced in their native language and in three foreign languages (English, German,
Arabic). Results indicated that vocal expressions of basic emotions could be recognised from
vocal cues in each language at accuracy levels exceeding chance.
They found also from the perspective of language that the Arabic task was the most difficult for
the majority of participants. On the level of recognising emotions, disgust was the hardest
emotion to identify by participants, followed by joy and fear.

33
Another study conducted by Pell et al.(Pell, Paulmann, Dara, Alasseri, & Kotz, 2009) with four
different languages (English, German, Hindi, and Arabic) supported the conclusion that vocal
expressions of basic emotion in speech are largely unaffected by language or linguistic
similarity. They conducted their study of vocal expressions of six emotions (anger, disgust, fear,
sadness, happiness, pleasant surprise) and neutral expressions which were elicited from four
native speakers of each language (English, German, Hindi, and Arabic) and the recordings were
judged for their perceived emotional meaning by a group of native listeners in each language
condition. The results of analysing acoustic patterns and emotion recognition across each
language show that all emotions could be recognised strictly from vocal cues in each language at
levels exceeding chance.
The most accurately recognised emotions were anger, sadness, and fear, irrespective of language.
Also they found by analysing acoustic and discriminate function that relative pitch level and
variability (fundamental frequency) is an important feature for signaling vocal emotions in all
languages.
The debate concerning whether emotions are universal or culturally specific still goes on.
However, it has already been suggested that emotions could be both universal and recognisable
in all cultures.
2.3.6 Applications for detecting emotion in human speech
The main purpose of employing speech emotion recognition is to adapt the system’s response to
allow a highly natural speech interaction by understanding the verbal and emotion content. The
interaction between user and computer will be more meaningful if the system can recognise not
just who said something and what they said but also how it is being said (Ingale & Chaudhari,
2012).
Speech emotion recognition is particularly useful for applications which require that the response
of those systems are natural and depend on the detected emotion such as computer tutorial
applications and in-car systems in which the emotional and mental state of the driver play an
important role in her/his safety (Schuller et al., 2004).
Other applications include call centre and mobile communication (J. Ma, Jin, Yang, & Tsai,
2006). Speech emotion recognition has also been used by therapists as a diagnostic tool (France,

34
Shiavi, Silverman, Silverman, & Wilkes, 2000), and can be applied in a variety of situations to
help people with the highest levels of suffering or need, such as in a nursing home. Speech
emotion recognition can also be useful with real time applications such as verification of
emotions to analyse whether requests are genuine or analysis of voice messages in the
emergency services (Koolagudi & Rao, 2012).
El Ayadi et al (El Ayadi, Kamel, & Karray, 2011) summarise some of the reasons that make the
task of speech emotion detection challenging:
first, difficulties in determining the most significant and powerful feature when
distinguishing between emotions is due to the direct effects of many of factors such as
speaking rate and style, different speakers and sentences used.
another challenge is how a certain emotion is expressed generally depends on the
speaker, his or her culture and environment.
A further difficulty is that it is not clear which emotion the automatic emotion recogniser
will detect, especially in cases where that person may undergo a certain emotional state
for many days (long-term emotion), so other emotions will be transient and will not last
for more than a few minutes.
However, there are two different applications areas which require understanding how emotions
are expressed in speech. There are (1) synthesis of emotional speech, and (2) emotion
recognition. This section focuses on these areas in brief.
In synthesis of emotions in speech, employing the appropriate emotional expressivity in
synthetic speech leads to the increased natural quality of these systems. This fact has motivated
many researchers in this area to attempt to incorporate the expression of emotions into synthetic
speech over more than a decade.
Marc (Marc, 2001) attempts to give an overview of studies that can be found in literature
concerned with the expression of emotion in synthetic speech. These studies can be grouped
according to the type of synthesis technique employed, such as formant synthesisers which have
captured the attention of many researchers because of the high degree of control that they
provide, as in (Burkhardt, 2001; Burkhardt & Sendlmeier, 2000; Cahn, 1989; I. R. Murray,
35
1989); diphone concatenation synthesisers (Edgington, 1997; Vroomen, Collier, &
Mozziconacci, 1993) and unit selection (Iida et al., 2000; Marumoto & Campbell, 2000).
Emotion recognition systems is another an important research area today that attracts the
attention of the research community increasingly towards understanding emotions and the idea of
automatically identifying the emotional or physical state of a human from his or her voice.
There are several applications where speech emotion recognition can be developed (Gadhe,
Shaikh Nilofer, Waghmare, Shrishrimal, & Deshmukh, 2015).The recent literature on speech
emotion recognition can be found in many studies such as in (Gadhe et al., 2015; Koolagudi &
Rao, 2012) and (Ververidis & Kotropoulos, 2006).
Gadhe et al. (Gadhe et al., 2015) conducted a survey included in the present literature review of
different features addressing the importance of choosing different classification techniques to be
used for speech emotion recognition and some important issues in this area. They found that
developing an emotion recognition system depends essentially on a well-designed database and
on the selection of classifiers. They observed that the Gaussian Mixture Model is a more efficient
classifier compared with others such as the Hidden Markov Model (HMM), the Bayes classifier,
the Support Vector Machine (SVM), k-nearest neighbors (KNN), the Artificial Neural Network
(ANN) and the Maximum Likelihood Bayesian classifier. The Gaussian Mixture Model is based
on expectation-maximization algorithm or maximum a posterior (MAP) parameter estimation.
Koolagudi and et al. in their study (Koolagudi & Rao, 2012)considered the issues related to
emotional speech recognition such as different types of speech features and classification models
used for recognition of emotions from speech. In addition, emotional speech corpora and some
important issues in this area of speech emotion recognition are discussed. They concluded many
facts such as a need for a larger emotional speech database with a reasonably large number of
speakers and text prompts because the existing databases are used with a limited number of
speakers so that most of the research produces results that cannot be generalized. Also the
performance of emotion recognition can be enhanced by a consideration of linguistic contents
and the features extracted from speech which have an effect on emotion expression.
Another study conducted by Ververidis et al.(Ververidis & Kotropoulos, 2006) provides an
overview of emotional speech recognition from three facets: first, the available recent emotional
36
speech corpus, addressing a number of emotional states and speakers, the language, and the kind
of speech; second, presenting the most frequent acoustic parameters used for recognising
emotional speech and for assessing how the emotion affects them; a third reviewing appropriate
techniques in order to classify speech into emotional states. Some of their findings include the
fact that the most interesting features are pitch, formants, short-term energy, MFCCs and the
cross-section areas, in addition, the Teager energy operator-based features which refers to the
number of harmonics due to the non-linear airflow in the vocal tract that produces the speech
signal and is considered a useful feature for emotion recognition (Teager & Teager, 1990)
2.4 Summary
This chapter has given an overview of speech and emotion, pointing out the acoustic correlates
of emotions in human speech and taking a look at some cultural aspects of emotional speech,
finally, some applications of detecting emotion in human speech are presented. In the next
chapter we are going to give an overview of issues for Arabic speech processing

37
3. CHAPTER THREE : ISSUES FOR ARABIC SPEECH
PROCESSING
3.1 Introduction
The study of the phonological system of Arabic is an important step in the development of
speech systems such as text to speech (TTS) and Automatic Speech Recognition (ASR) systems.
This chapter investigates the issues related to Arabic speech processing. The chapter is structured
as follows: Section 2 considers the properties of the Arabic language through a discussion of
both its written and its phonological systems. An in-depth study is introduced for Arabic
consonants, vowels, semi-vowels, diphthongs and syllables. Section 3presents general
information about the prosodic features of Arabic language, namely Intensity, duration and
intonation, which form the basis of our work. Section 4 presents the problem of the variety of
dialects as a challenge for Arabic language speech studies. A summary of this chapter is
presented in Section 5.
3.2 Mapping written forms to phonetic sequences
In order to discuss how to get from written forms to phonetic sequences, we have first to
understand the nature of the Arabic writing system and of the set of phonemes, and then we have
to see how to map one to other.
3.2.1 Writing system, Semi-vowels, Diacritics
The Arabic writing system uses an alphabet with a set of 28 distinct characters which denote
consonants and semi-consonants (see the next section) and three that represent long vowels,
along with a set of marks called diacritics that are attached to these characters to represent short
vowels and other phonetic events. These diacritics are often omitted, which can lead to
significant problems when trying to interpret written forms (see the next section).

38
In Arabic, each consonant letter has a different shape depending on its location within the word
as shown in Table 3.1, which also presents the correspondence between the written forms and the
phonemes used in Arabic, using SAMPA (The Speech Assessment Methods Phonetic Alphabet
)for the Arabic alphabet1 and IPA (the International Phonetic Alphabet ) symbols2
ARABIC GRAPHEME IN A WORD
PHONEMIC SYMBOL (In SAMPA)
PHONEMIC SYMBOL (In IPA)
ʔ /?/ ابا ا
b/ b/ ببب ب
t/ t/ تتت ت
T/ θ/ ثثث ث
g/ dʒ/ ججج ج
X\/ ħ/ ححح ح
x/ x/ خخخ خ
d/ d/ دبد د
D/ ð/ ذبذ ذ
r/ r/ ربر ر
z/ z/ زبز ز
s/ s/ سسس س
S/ ʃ/ ششش ش
s'/ sˤ/ صصص ص
d'/ dˤ/ ضضض ض
t'/ tˤ/ ططط ط
D'/ zˤ/ ظظظ ظ
ʕ /\? / ,/'?/ ععع ع
1SAMPA for Arabic. (2017). Retrieved from http://www.phon.ucl.ac.uk/home/sampa/arabic.htm 2 IPA/Arabic (2017). Retrieved from https://en.wikipedia.org/wiki/Help:IPA/Arabic

39
G/ ɣ/ غغغ غ
f/ F/ ففف ف
q/ q/ ققق ق
k/ k/ ككك ك
l/ l/ للل ل
m/ m/ ممم م
n/ n/ ننن ن
w/ w/ وبو و
h/ h/ ههه ه
j/ j/ ييي ي
:i:/ i/ عيد ي
:a:/ a/ مال ا
:u:/ u/ فول و
i/ i/ ظل
a/ a/ حل
u/ u/ عمر
Table 3.1: Different shapes of Arabic letters with SAMPA and IPA symbols
An Arabic word can be written with consonants and vowels in certain forms of classical Arabic
writing which are used solely for text found in the Qur'an and classical Arabic literature, but in
general, short vowels are not actually written in newspapers, magazines, books, and government
documents in Modern Standard Arabic (MAS).
The vowels are represented by marks above or below the consonant letters called diacritics and
are also known as the vocalisation or the voweling. These diacritics are summarised below:
The six vowels are divided into three short vowels and three long vowels (M. Alghamdi,
2001; Alkhouli, 1990; Javed, 2013) as follows:
Short vowels:

40
- " “ , is named in the diacritic system "fathah” , this appears on top of a consonant in
order to indicate the sound of the Arabic short vowel /a/.
- " ”,is called "kasrah”, which appears under a consonant to show that the consonant is
vocalised by the sound of the Arabic short vowel /i/.
- " ", is called "dammah” in a diacritic system, which is like a comma, that appears on
top of a consonant to indicate that the consonant is vocalised by the sound of the short
vowel /u/.
Long vowels which put the stress on a given vowel, these long vowels are also
considered some sort of consonants, which are:
- Alif, which presents both long vowel /a:/ and the consonant "hamzah” (glottal stop)
/?/.
- Yaa, which presents both long vowel /i:/ and the consonant /y/.
- Waw, which presents both long vowel /u:/ and the consonant /w/.
There are another three symbols in the Arabic writing system which are called
"Tanween” and are named as tanween dammah, tanween kasrah and tanween fathah.
They appear as symbols " , , ” respectively and can be shown on any consonant to
indicate certain phonemic sequences. For example the following words: " بخيل “ /baki:lun/
(Stingy), ''“ طويل /t'awu:lin/ (tall) and “كبيرا“ /kabi:ran/ (big) have the tanween
symbols,“ , , ’’.
The Shadda, is another symbol ” ” which in general appears on a consonant to indicate
that the consonant is doubled or its pronunciation is repeated twice, for example, "
j/ that means the sound/ ”ي " qajjim/ (Valuable) has the Shadda symbol on the letter/”قي م
of the letter doubled. The Shadda also appears with diacritic marks, short vowels ( , , )
which are placed on top of the Shadda.

41
Arabic uses another diacritic called sukun '' ’’. It appears on the top of consonant and
is not followed by a vowel sound and indicates that the consonant is not provided with a
vowel, so it is not necessary to write sukun in the text.
Dagger Alif'' ـ is written as a short vertical line on top of a consonant. It الخنجرية الألف’’
indicates a long alif /a:/ sound, but the alif is normally not written. The dagger alif occurs
in a few common words, such as: ـذا ـ ـكـ ن ha:Da/ (this) and/ ه ـ .la:kin/ (but)/ل
Hamzah '' ئ, ؤ , إ ,' أ ’’and stand alone '' ء ’’ The Hamzah indicates a glottal stop
accompanied by any of the diacritic (fathah, kasrah, dammah or sukun); e.g. أحمد
(?hmad) , سؤال (question) and هدوء (quietness).
Maddah'' آ ’’, The Maddah مد ة is a diacritic like the shadow of a bird flying, which can
appear only on top of an alif '' آ ’’ and indicates a glottal stop (Hamzah) followed by
another alif representing the long /a:/;e.g. قـرآن /qur’a:n/ (the holy book).
As mentioned above, the diacritics that include short Arabic vowels, Shadda, Tanween etc., are
represented using diacritic symbols in the written form which refer to vowel phonemes in the
designated words. These diacritics are frequently omitted in most written Arabic text, leading to
a lack of essential information about the meaning of the word. Additionally, identification of the
function of the word in the sentence also makes the orthography difficult to understand, since a
single written form may correspond to numerous underlying forms, for example, the diacritic in
the top of the letter " r “ر in word مدرسة , if it was the short vowel " " fathah then the word will
be سة “ madrasah/,(school), but if was the symbol/ مدر ” Shadda, then the word will be
.mudarrisah/ (teacher)/ مدرسة
However, the reader is expected to understand the meaning of the text which requires enough
knowledge of the language in order to infer vowels from the context along with other missing
cues to enable him or her to pronounce the text correctly.
Consequently, one of the biggest challenges facing Arabic text preprocessing is that the text must
be diacritized to be read, so that each character and its diacritic must be determined to avoid
ambiguity.

42
The full diacritization of Arabic script provides useful information for pronunciation modeling
and higher level processing of developing Arabic speech and natural processing language
applications, since it is likely to reduce ambiguity in these tasks.
In synthesis of speech, it is essential for text-to-speech synthesis (TTS) applications that the
correct vowel(s) are pronounced, because the meaning of the utterance will be altered completely
by using an incorrect vowel (Ananthakrishnan, Narayanan, & Bangalore, 2005). In Automatic
Speech Recognition (ASR) systems, the absence of diacritization of Arabic text leads to many
similar word forms, and consequently, decreases predictability in the language model (Alotaibi
& Hussain, 2010). In contrast, using vocalised text can improve the accuracy of speech
recognition applications (Zitouni, Sorensen, & Sarikaya, 2006).
The problem of determining the correct vowelisation has been investigated by many researchers
in different areas of Arabic speech processing (Elshafei, Al-Muhtaseb, & Al-Ghamdi, 2002); in
(Al-Otaibi, 1988; Elshafei, Al-Muhtaseb, & Alghamdi, 2006; Kirchhoff et al., 2002; Nelken &
Shieber, 2005; Vergyri & Kirchhoff, 2004) the focus was to develop techniques for automatic
diacritization of Arabic script for applications for MSA.
There are two obvious approaches to solving the vowelisation problem: One approach is to
implement a module for automatic vowelisation in order to infer the vowels (Elshafei et al.,
2002). Generating vowels automatically requires integration of morphological, syntactical, and
semantic information (Elshafei et al., 2002).Most applications rely on automatic Arabic
diacritization as a pre-processing step to transcription (Rashwan, Al-Badrashiny, Attia, Abdou,
& Rafea, 2011). Another approach is by using electronic lexicons that provide the vowelisation
for an orthographic string (Tomokiyo, Black, & Lenzo, 2003).
However, in our work we avoided the inclusion of these levels of solutions by requiring that the
text be diacritized from the outset.

43
3.2.2 Arabic phonetic system (Arabic phonology) The phonetic system of Modern Standard Arabic (MSA) has basically 36 phonemes classified
into two types, consonants and vowels.
Arabic uses different set of consonants and vowels from English and therefore we need to have a
look at specific vowels and consonants of Arabic, these summarized in the following tables.
Table 3.2: List of Arabic consonants with IPA symbols
Arabic is particularly rich in uvular, pharyngeal, and pharyngealised ("emphatic”) sounds.
Arabic phonemes can be classified to two distinctive classes, one is pharyngeal and another is
emphatic phonemes (Ahmed, 1991; Alkhouli, 1990; Omar, 1991).
The emphatic sounds are generally considered to be /ṣ/ ص, /đ/ ض,/ŧ/ طand /ẓ/ ظ.(Sabir & Alsaeed,
2014). These sounds are also referred to by linguists as (Alhuruf AlmuTbaqa)“ الحروف
covered letters (Alsabaan, Alsharhan, Ramsay, & Ahmad) because it is produced,’’المطبقة
physiologically with retraction of the root of the tongue and raising of the back of the tongue
towards the velum (Ferrat & Guerti, 2013).

44
In Arabic, there are six vowels as mentioned before, these vowels are always voiced sounds and
they are distinguished from consonants in that the passage through which the air travels is never
so narrow as to obstruct the free flow of the airstream. There are four features for vowel
articulation which can be used to distinguish between different vowels as shown in Table 3.3:
tongue height(high, mid, and low), the part of the tongue involved (front, central and back), lip
rounding(rounded and unrounded), and tenseness or laxness of the vocal tract(tense and lax).
These features are essential or principal qualities and are most commonly found in the world’s
languages (Maddieson & Disner, 1984).
Tonge position/height Front Central Back High or closed /i/ /i:/ (Unrounded) Low or open /a/ /a:/ (Unrounded)
High or closed /u/ /u:/ (Rounded) Table 3.3: Arabic vowel
However, the spectral properties of long and short vowels are similar, but durations of long
vowels are longer than the short version(M. Alghamdi, 2001).This can lead to a different
meaning of the word, for example, two words:
jami:l/ (to lean) with long vowel/ يميل jamil/ (become bored) with short vowel /i/ and/يمل
/i:/,differ only in the vowel length, but they have two different meanings.
Two Semi-vowels: the letters( ي ,و ) ,/w/ , /j/ which can be seen in different positions within the
word (the beginning, middle or the end)have two functions. They can be realised as the
consonant sounds /w/,/j/, typically if they occur between two other vowels are at the start of a
word with a following vowel; and they can be realised as vowels, either by themselves as long
versions of the vowels /u/ or /i/ or in combinations with other vowels, forming what are called
Diphthongs.
" وأ ” /aw/- The glide begins from the vowels /a/ to the consonant /w/(pronounced like the
"ow” in "power”). As in /nawm/ نوم "sleep”.

45
" ي أ “ /aj/- in which the glide /y/ is preceded by the short vowel /a/ generates a diphthong
/ay/ (pounced like English word "eye”) as in the word /bajt/ " (بيت" house ( (Amer). Table
3.4 shows some examples of diphthongs:
Orthography IPA Examples Front Meaning Central Meaning
Winning فوز [ov] و +و
accentuated [o'v] ضوء Light
House بيت [ei] ي + ي
accentuated [e'i] خير Good
They went away نأوا Papers أوراق [ov] وا I saw رأيت Ripened ابتعث [ei] ي ا
Table 3.4: Arabic diphthongs in different positions (Khalifa, Obaid, Naji, & Daoud, 2011)
There are numerous contextual phonetic variations that can occur within Arabic sounds, such as
replacing, in the pronunciation, some consonants with other consonants. We will not be dealing
with such variations in our experiments, and we are therefore not going to discuss them in detail
here.
3.2.3 Grapheme-to-phoneme
Grapheme-to-phoneme conversion is the process of converting any sentence of the text (from the
orthographic transcription) in Arabic to its phonetic pronunciation by simple one-to-one
mapping. Grapheme-to-Phoneme also known as Letter-to-sound conversion. For example, the
phonetic pronunciation of Arabic word ’كاتب’ is /ka:tib/.
This process is considered an easy task to achieve in Arabic compared to languages which use
the Roman alphabet, because Arabic has a regular spelling system which can be modeled with
specific rules.
The grapheme-phoneme transcription is considered an important prerequisite and an essential
task for applications involving speech recognition and/or speech synthesis. In the context of

46
speech synthesis, having a tool that generates correct Grapheme-to-phoneme is a fundamental
step leads to a good performance of TTS (Polyakova & Bonafonte, 2005).
In general, transformation of a written Arabic text into a spoken utterance requires knowledge of
the Arabic language for the realisation of an automatic phonetisation system and needs a work of
analysis, comprehension and an appropriate language model.
So several works have been realised in the area of text-to-speech synthesis of phonetisation of
the Arabic text, we mention the works realised by (Ahmed, 1991); (Al-Ghamdi, Al-Muhtasib, &
Elshafei, 2004); (El-Imam, 1989, 2004; Saidane, Zrigui, & Ahmed, 2005; Zemirli, 2006);
(Imedjdouben & Houacine, 2014; Khalifa, Obaid, Naji, & Daoud, 2011).
And in the area of speech recognition as in (M. Ali, Elshafei, Al-Ghamdi, & Al-Muhtaseb,
2009), El-Imam (2004) noted that three approaches have been used for transformation of a
written text into a spoken text. They are: dictionary-based methods, rule-based methods and the
relatively newer trained data-driven methods, which are classified into three classes: the
pronunciation by analogy (PbA), statistical methods (based on stochastic theory and nearest
neighbour), and methods based on neural networks (Bigi, Péri, & Bertrand, 2012).
The first two of these methods will be discussed in the next sections.
Dictionary or Lexicon-based methods.
Words that do not follow phonemic transcription rules are transcribed by this lexicon which
contains phonological information to represent the phonemes of words directly (Alotaibi, 2012).
This lexicon or dictionary contains morphemes and their pronunciation and might contain other
syntactic and semantic information. Some errors during transcription can be generated by this
method. So we have to use some rules in order to treat these errors.
A phonetic dictionary of Arabic must take into account inflected forms of words, resulting in a
huge number of entries. However, all derived forms abide by the Arabic spelling rules. In
addition, the simplicity of the Arabic spelling system makes using a rule-based transcription
system with a dictionary of exceptional words a possible solution to the Arabic letter-to-sound

47
conversion problem (El-Imam, 2004).Speed, flexibility and simplicity can be improved by using
this approach.
Phonemic Transcription Rule-based methods.
The words which are not treated by the dictionary are transcribed by using a base of phonemic
transcription rules. In this approach, a set of rules of phonemic transcription which rely on expert
linguistic and phonetic knowledge are used. These rules are supported by a lexicon of
exceptions when the rules are not applicable, this lexicon contains a list of special words or
phrases and abbreviations that require special pronunciation attributes and the phonemic
representation of the words(Andersen et al., 1996).
The main advantage of this approach is the ability to model the linguistic knowledge of human
beings by a set of rules that can be incorporated in an expert system (Tebbi, Hamadouche, &
Azzoune).
However, rule-based systems have difficulties to change some of the rules without introducing
unwanted side effects. Furthermore, employing such systems to new tasks in other languages is
really time consuming and requires a lot of experience of phonetic knowledge (Andersen et al.,
1996).
Many of these pronunciation rules can be found in (Ahmed, 1991; M. Ali et al., 2009;Al-Ghamdi
et al., 2004; Selim & Anbar, 1987),who describe the rules of Arabic phonology which is based
on rewrite rules in order to map each grapheme to its phonemic representation.
Major challenges for a letter-to-sound conversion step raise some issues such as assimilation,
deletion, insertion, emphasis, and sound variation which are discussed earlier in this chapter.

48
3.3 Prosodic Features
Prosody is often defined on two different levels (Chentir, Guerti, & Hirst, 2009):
- an abstract, phonological level (phrase, accent and tone structure),
- a physical phonetic level (fundamental frequency, intensity and duration).
Khan, Al-Khatib, & Lahouari (2007) divided prosodic features into acoustic prosodic features
that can be gained from the audio signal directly and linguistic prosodic features that are
obtained from the word or phone transcript of a conversation on a lexical information level.
Prosody is the set of features of speech output that includes pitch, timing, pausing, speech rate,
and emphasis on words, etc. Without these features, speech would sound like reading of a list of
words. So these features are very important and are critical to speech processing tasks such as
automatic speech recognition and speech synthesis.
There are many factors that can have an effect on prosodic features of natural speech, which can
make accurate modeling very difficult (Thakur, Chettri, & Shah, 2012). Figure 3.2 shows some
of these factors.
Figure 3.1: Prosodic dependencies
Dialog act detection (Shriberg et al., 1998), (Fernandez & Picard, 2002); topic segmentation
(Swerts, 1997); identifying the dialect of a speaker automatically with considerable accuracy

49
(Biadsy & Hirschberg, 2009); sentence boundary detection (Pfeiffer, 2001); emotion detection
(Lee & Narayanan, 2005) etc., are examples of the many applications of speech that employ
prosodic features to give the language its appearance and convey the meaning of the spoken
language, in addition, providing the natural quality of the human voice.
Prosodic features are considered to be the most significant factor in emotional expression in
speech (Kuremastsu, 2008; Hashizawa, Takeda, Hamzah, & Ohyama, 2004) due to the fact that
these prosodic features can be utilised to indicate the emotional state of the speaker, for example,
expressing anger by increasing both loudness and pitch. In addition, prosodic features reflect
whether the speaker is being ironic or sarcastic, also whether the utterance is a statement, a
question, or a command.
So by analysing speech patterns of these features we can get emotional speech processing
applications which are able to recognise the user's emotional state.
Nowadays, there are numerous computational studies aimed at prosodic modeling for emotional
speech recognition, understanding and synthesis systems by using many techniques as listed by
(Rajeswari & Uma, 2012).
As an example, (Jiang, Zhang, Shen, & Cai, 2005) investigate the importance of prosody
modeling for emotional speech synthesis system by studying prosodic features and obtained
results which show that the prosody features help to obtain meaningful results for some
emotions. Also (Chabchoub & Cherif, 2012) introduce a new high quality Arabic speech
synthesis technique by modeling the parameters of the fundamental frequency and duration for
the MBROLA method. The result shows that syllables which produce reasonable natural quality
speech and durational modeling are crucial for naturalness with a significant reduction in
numbers of units of the total base developed.
Other studies have been conducted to discover the acoustic correlates of emotions in the field of
expressive TTS, such as in (Bulut et al., 2005; Salvi, Tesser, Zovato, & Cosi, 2010; Shao, Wang,
Han, & Liu, 2005) and their results proved that both prosodic (pitch, duration, intensity) and
spectral parameters should be modified to achieve a successful emotion conversion.

50
In the area of speech recognition, there are a number of studies which have proposed some
prosodic features for emotional speech. Devi, Srinivas, & Nandyala (2014), for instance,
proposed speech features such as Energy and Pitch and used SVM for classification while
features such as the Mel Frequency Cepstrum Coefficients (MFCC) was proposed in (Rawat &
Mishra, 2015) and evaluated by using neural networks.
(Meddeb, Karray, & Alimi, 2014) proposed speech features such as Linear Prediction Cepstrum
Coefficients (LPCC), Mel Frequency Cepstrum Coefficients (MFCC) in order to achieve
Intelligent Remote Control for a TV programme based on emotion in Arabic speech,
Unfortunately, a reliable set of features for discriminating emotional states in speech has not yet
been reached. It is an open question, because of difficulties of finding which features carry more
information to describe the emotional content in speech and how to combine to gain a good
recognition of emotion (Kuremastsu, 2008).
Among everything researchers have come up with, it looks as though intensity, duration and
intonation are the most practically important and therefore I am going to say more about them in
subsequent sections.
3.3.1 Intensity
The intensity of a sound, defined as power per unit area, is an acoustic property of the sound that
can be physically measured. Loudness is a psychoacoustic property of sound, in that it represents
our human perception of how “loud” or “soft” sounds of various intensities are. The relationship
between intensity and loudness is rather complex, but it is monotonic -- if one sound has a
greater intensity than another but is in all other respects similar to it then it will be perceived as
being louder. Given the difficulties associated with measuring loudness, we will use intensity as
a feature in the experiments below.
Stress reflects the degree of strength or emphasis with which a word , a syllable or phrase is
spoken.

51
The stress plays a very important role in the process of automatic generation of the intonation in
the standard Arabic language, where variation in stress may have an effect on the meaning of
word. The stressed syllables may be characterized by increased loudness, longer duration or
increased fundamental frequency (El-Bakry, Rashad, & Isma'il, 2011).
Determining if a syllable in Arabic is stressed or unstressed depends on two major factors as
reported in (Abu-Salim, 1983), first, the internal structure of the syllable particularly 'weight',
and second, the position of the stressed syllable and its relation to all other syllables in the same
word. So from these two factors we can predict about the positions and levels of the stress.
There are three categories of stress that can be applied to syllables, words and to longer units of
speech which are : primary (main) stress, secondary stress and tertiary (weak) stress. Al-Ani (Al-
Ani, 1970) notes that every Arabic word contains a single stressed syllable, with the position of
the stress within the word depending on the number ,length and shape of the syllables in the
word. Stress can be used in English as a free morpheme, in particular as a way of marking
contrast or unexpectedness ("John stole my bike" suggests that while the speaker wasn't
surprised that John stole something they were surprised that what he stole was their bike, "John
stole my bike" suggests that they are surprised he stole anything). This use of stress does not
occur in Arabic.
There are some rules which govern the place of stress in Arabic(Al-Ani, 1970). Applying these
rules can help to enhance Arabic speech technology applications:
If the word is made up of a sequence of short CV syllables, such as in: 'kataba' /C V-
CV-C V/ (he wrote), then the first syllable will receive the primary stress , and the rest
of the syllables will get the weak stress.
If a word includes a single long syllable, such as in the word: 'ka:tib' /CVV-CVC/
(writer), then this syllable will receive the primary stress, and the other syllables will
receive the weak stress.
If there are two or more long syllables, such as in the word: 'mustawda?a:tuhum' /CVC-
CVC-CV-CVV-CV-CVC/ (their deposits) ,(for masculine plural), then the long one
which is closest to the end of the word (but not the last one) will take the primary (main)

52
stress, and the long syllable which is closest to the beginning of the word (not the first
one) will get the secondary stress; other syllables receive weak stress.
From these rules we can infer that determining the number of syllables correctly is essential for
determining stress. However, there is disagreement about these rules that govern item stress in
Arabic (Zaki, Rajouani, Luxey, & Najim, 2002).
Local stress can help the hearer to determine word boundaries. So there has been a number of
studies about the importance and analysis of lexical stress in Arabic language such as (Halpern,
2009; Mitchell, 1993; Ryding, 2005);(Z. A. Ali & Ghani, 2014; Chentir et al., 2009) and (Zaki et
al., 2002).
3.3.2 Duration
The duration of a sound can be defined as the actual time taken to read and produce the element
contents of sound, which can be measured on either a spectrogram or a waveform in seconds or
milliseconds. From a phonetic perspective, duration refers to the length of a linguistic unit.
Duration can be defined also as the physical property that represents the measured duration of a
speech sound from the articulatory and acoustic points perspective (Hassan, 1981).
The duration of certain phonemes depends on the contextual realization of these phonemes
characterized both by the nature, size and the location of pauses and of word and syllable
boundaries and the stress, etc.
Duration is significant in the Arabic language due to the fact that a difference in the length of a
vowel or consonant makes a difference in meaning. Increasing the vowel duration for example
may change the meaning of the word as in words: 'katala' /cv-cv-cv/ , (he killed) and 'ka:tala'
/cvv-cv-cv/ , (he fought).
Arabic short vowels have similar spectral properties to those of their long vowel version but with
longer durations, with long vowels lasting approximately twice as long as short one.

53
At the level of the syllables of an Arabic word, the durations of the consonants and the vowel
within syllable types such as CVVC, CVCC and CVVCC are recognized to be longer than the
other remaining types.
The duration of the short vowels is between 100 and 160 ms, the value could increase to 300 ms
as (Al-Ani, 1970) has stated in his study, with the long vowels it is between200 and 350 ms.
The duration of consonants depends upon whether they occur initially, medially or finally. It also
depends on other conditions, namely on the manner of articulation, voiced or unvoiced, and
single or geminated. The duration of consonants varies from 40-375 ms.
The variation of sound duration for the Arabic language has been the subject of various studies,
according to several factors: speakers, phonological phenomena, syllabic structures, consonantal
geminating and Arabic dialects, etc. Among them, Rajouani, Ouadou, Nour, & Najim (1996)
conduct their study on developing a modular text-to-speech system for Arabic by focusing on
formalizing a set of rules to control the variations of the Arabic consonants duration in order to
improve the acceptability of text-to-speech system.
In the same field of the synthesized speech, (Hifny & Rashwan, 2002) conducted experiments
to predict the duration of Arabic phonemes by using an approach based on artificial neural
networks (NN), The model achieved correlation coefficient accuracy of 0.91.
Khabet and et al (Khabet, Zemirli, & Mosteghanemi) also described in their article a method to
develop a module to generate the sound duration of standard Arabic on continuous speech.
There are a number of studies concerning vowels in Arabic and addressing the duration of
vowels in dialects of Arabic language, we state some of them, such as the study of (M. M.
Alghamdi, 1998) which employed speakers of three Arabic dialects, Saudi, Sudanese and
Egyptian speakers, to pronounce vowels. It has shown from the results that there was significant
difference between these three dialects in the first formant frequencies, but in terms of duration,
the vowels did not show any significant difference from one another. In addition, it was found
that the behavior of the short vowels was less than half of the long vowels.

54
Another study on vowels in Arabic dialects has been addressed by Zawaydeh (1997) on
Ammani–Jordanian Arabic and results were reported that the frequencies for the first formant in
the low vowels in the uvularised environment are higher than first frequencies in the plain
environment.
Lebanese Arabic has been studied by Khattab & Al-Tamimi (2008). It was shown from the
results that there is no significant difference between the durational results for males and
females.
Hassan (1981) studied vowel duration in Iraqi Spoken Arabic, aiming to investigate whether the
factors governing the systematic variations of vowel duration are phonetic-universal or language-
specific phenomena.
However, the vowel duration has the advantage of identifying the vowel and the intelligibility of
speech (Ferguson & Kewley-Port, 2007).
3.3.3 Intonation
Intonation in many European languages as in Arabic refers to use of pitch melodies over an
utterance to convey grammatical form and discourse-level meaning, e.g. questions, statements,
contradiction, etc. The acoustical correlate of the intonation contour is the fundamental
frequency (F0), as a function of time. The pitch of F0 ranges of female speakers is large
compared to male speakers, between 160-400 Hz and between 80-160 Hz respectively.
The shapes of the intonation pattern depends on the sentence type(i.e., statements, commands,
question, etc.)
Many works have studied the intonation for the Arabic language according to several factors:
speakers, phonological phenomena, syllabic structures, consonantal geminating and Arabic
dialects, etc., typically in order to make improvement of Arabic text to speech synthesis. Eldin &
Rajouani (1999),in their study discovered the intonation characteristics of interrogatives in
standard Arabic to suggest a model for the automatic processing of the intonation pattern in a

55
Text To Synthesis system. The results show that there is no need to use a syntactic analyzer or a
lot of information about the utterance to get natural intonation.
Another study conducted by Rajouani, Loukili, & Najim (1997) described the development of
an intonative model for Arabic language of text to speech synthesis.
Zemirli & Khabet (2007) discussed treating intonation under the aspect of the lexical stress with
the level of the words in order to improve the naturalness of an Arabic Text To Speech
Synthesis system (ARAVOICE)
The intonation is a different of varieties of colloquial Arabic, there are a number of studies on
the intonation carried out in that level. For example, of colloquial Emirati Arabic in (Blodgett,
Owens, & Rockwood, 2007), Lebanese Arabic in (Chahal, 1999) and (Hellmuth, 2005) with
Cairene Arabic speakers, some results show the same pitch accent on every content word and
another show the opposite.
3.4 Dialects of Arabic
Many varieties of Arabic are spoken across the Arab world, this variety of Arabic can differ in
grammatical structure, in the lexicon and in the phonetic system.
Differences in speakers’ phonetic systems are what is generally denoted by the term 'accent'.
Accent is the way somebody pronounces words, the prosody of their speech, etc. Dialect is a
broader term that refers both to a person’s accent and the grammatical and lexical features of the
way that person talks.
The wide variety of Arabic dialects reflects the ethnic and social diversity of its speakers and can
differ within the same country.
This difference means that it can be a challenge, for example, for a Palestinian to understand and
communicate with a Moroccan.
56
Arabic dialects include the Eastern dialects of Egypt. Sudanese is spoken in most areas of north-
eastern Africa. The Gulf dialect is spoken in Saudi Arabia and parts of Yemen. The Levantine
dialect is spoken in the region around Lebanon and Syria, while the Western dialects of North
Africa of Maghreb Arabic are spoken in Saharan Africa, as well as Tunisia, Algeria, and
Morocco.
The phonetic implementation of the MSA vowel system differs according to the accents
associated with the different dialects (M. M. Alghamdi, 1998). For instance, the Levantine
dialect has at least two extra types of diphthongs /aj/ and /aw/. Similarly, the Egyptian dialect has
other extra vowels (M. Alghamdi, 2001). In addition, there are major phonological differences in
recognition of specific phonemes, such as ( , ج , ث , ض ق ).
Generally, understanding and modeling the accents associated with the various dialects of Arabic
is a major challenge for current research on Arabic speech science and technology. In the speech
synthesis field for example, (Tomokiyo et al., 2003) reported several reasons for considering
dialects as a problem for speech synthesis, first deciding whether to consider modern standard
Arabic (MSA) or the dialects to be generated. The second problem is that the limitation of the
listener base who understand MSA or dialects has to be considered. MSA is widely understood
only by communities with formal education, however, so its listener base is also limited.
In our work we deal with Modern Standard Arabic (MSA); although MSA is not every speaker's
primary version of the language, most people can understand it, since it is the standard form of
the language in formal settings and in broadcast media and hence at least comprehensible to most
people, even if it is not widely used in informal everyday speech.
3.5 Summary
Arabic is a language which offers a number of challenges for speech researchers. In this chapter
we have highlighted some of the characteristics of the Arabic language in spoken and written
form which may affect speech research.

57
The major factor is diacritization, where vowels are represented partially and must be inferred.
We discussed two obvious approaches to solving this problem, inferring the vowels
automatically or using a dictionary. The correspondence between the written form of a word and
its pronunciation in Arabic is another major factor that raises several issues. Here we focus on
highlighting the Arabic phonetic features that make the language hard to process, describing
some processes of phonological rules and explaining the designed letter-to-sound rules which
can be used to improve many applications of Arabic speech, as discussed in subsection 3.2.2.2
Prosody features as an important factor of voice quality, which includes the stress, duration and
intonation which might influence Arabic speech are discussed in Section 3.3. Moreover, we
discussed the diversity of dialects of Arabic language which is considered problematic because
they lack a fixed orthography; we also see major phonological differences in the realisation of
specific phonemes, as explained in Section 3.4.However, there are other challenges for Arabic
speech research such as the availability of databases of Arabic emotional speech, which are
discussed in Chapter 4.It is worth saying that there are other challenges facing speech processing
of Arabic which can be found in (Farghaly & Shaalan, 2009).
However, in our work, in order to overcome the problem of diacritization, we will suppose that
the text is fully diacritized in modern standard Arabic.

58
4. CHAPTER FOUR: CONSTRUCTION AND VALIDATION OF
THE CORPUS
4.1 Introduction
Emotional speech corpora are the most vital linguistic resources for studying emotional speech,
with a range of applications including recognition and synthesizes of emotional speech, as well
as for applications of other purposes such as customer-care centre and tutoring systems.
Compared to other languages, few corpora have been developed recently involving speech
studies of Arabic language, exceptions being (M. Alghamdi et al., 2008), (Makhoul, Zawaydeh,
Choi, & Stallard, 2005), (Harrag & Mohamadi, 2010), (Abushariah et al., 2012),(Selouani &
Boudraa, 2010),(Col, LaRocca, & Chouairi, 2002),("ELRA - ELRA-S0219 : NEMLAR
Broadcast News Speech Corpus," 2017). Most of these corpora have been designed for specific
applications and in a specific dialect of Arabic, most of them are private and only available with
a membership fee or exclusively reserved for subscribers, such as the speech corpora available
from the linguistic data consortium (LDC) or European language resources association (ELRA).
Moreover, these corpora are not marked up for expressive speech so cannot be exploited for the
analysis of expressivity in Arabic language.
Therefore, there is a need for an emotional speech corpus to be available for Arabic in order to
progress the study of emotion in Arabic speech. Unfortunately, collecting such data takes an
enormous amount of time and effort which we are not in a position to give. Therefore, what we
intend to do is gather sufficient data for the study of the relevant prosodic features, i.e., Pitch,
Intensity and Duration. Achieving this goal requires the design of a specific database.
This chapter introduces the stages of the construction of an Arabic emotional speech corpus with
which to conduct our experiments. It includes a set of sentences collected from Arabic news
websites recorded by a professional actor and evaluated by Arabic-speaking listeners.

59
Firstly, a brief summary of the emotional corpus is introduced, including classification.
Secondly, the construction stages for our corpus are described in subsections, discussing the
preparation of data through choice of actors, types of emotions and text material, the process of
data recording and evaluation, followed by the presentation of the evaluation results. Finally, a
summary concludes this chapter.
4.2 Corpus design
Emotional speech corpora describe what type of records will be used in experimental speech
processing of emotions. Such databases are mostly dependent on specific study goals and many
considerations are usually taken into account in order to perform the recordings in specific
environments and to distinct specifications.
Researchers (Ververidis & Kotropoulos, 2006),(Cullen, Vaughan, & Kousidis, 2008), (Scherer,
2003) have referred to different types of corpora which have been used for the study of emotions
in speech. We list three main categories in this field which are:
Elicited (Induced ) emotional speech corpora.
Acted (Simulated) emotional speech corpora.
Spontaneous (Natural) emotional speech corpora.
Each type of emotional speech database has its particular advantages and drawbacks.
Elicited emotional speech corpora is speech in which the emotions are induced by putting a
speaker under appropriate circumstances (Navas, Castelruiz, Luengo, Sánchez, & Hernáez,
2004). Sometimes these databases are recorded by asking the subjects to take part in verbal
interaction with a computer whose speech responses are in turn controlled by the human being
without the knowledge of the subjects (Batliner, Fischer, Huber, Spilker, & Nöth, 2000).
There are two approaches to inducing affective arousal. A direct way is the use of psychoactive
drugs. An example of this method is found in (Helfrich, Standke, & Scherer, 1984) where their
study compared the effects of antidepressant drugs on several vocal parameters with those of a
placebo over several hours.

60
Another way is the indirect way favored by experimental psychologists because of the degree of
control it affords. This is performed via stress induction through the completion of hard tasks
under time pressure. However, the use of elicited emotion is potentially problematic. There are a
number of drawbacks. One is the difficulty of generating similar emotional states in each of the
individuals. Another disadvantage is the generally weaker results produced by these procedures.
Acted emotional speech corpora : is using professional trained people or radio actors to record
and express emotional utterances in a conscious way.
Such a database can be collected from TV, soaps , plays , movies or serials clips. Generally, as
(C. E. Williams & Stevens, 1972), (El Ayadi et al., 2011) point out, simulated emotions tend to
be more clearly recognisable than real ones, so this is a widely used technique.
The main advantage of recording acted databases is that many aspects of the recording can be
carefully and systematically controlled such as the phonetic and prosodic speech content(Le &
Provost, 2013).
Problematic issues can arise from an extravagance of expressed emotion from actors during
recording, partly due to lack of acting ability and partly due to personal reactions to different
emotional situations. That can result in obtained data which is unrealistic in its ecological
validity (Cullen et al., 2008). In addition, some researchers (Frijda, 1988), (Darwin, 1956) argue
that there are physiological aspects to emotion inducing uncontrollable changes in speech
(Johnstone, 1996) that reflect the underlying emotion. The presence of these uncontrollable
changes may not be present in acted speech.
In summary, in using this method of recording data we must test our recordings by annotating
and assessing them for various emotions in order to recognise which emotions are being
expressed correctly by the actor.
However, there are many issues relating to corpora, such as size of database being insufficient
for development, training, and testing of emotion systems (Douglas-Cowie, Campbell, Cowie, &
Roach, 2003), the need to employ more professional speakers with different linguistic and
cultural backgrounds; the recording of different sentences that would bring new phonemic and

61
phonetic contexts, and increasing the number of simulated expressions. All of these issues can be
controlled for and taken into consideration when mapping out the goals of the research.
Spontaneous emotional speech corpora : is simply natural speech where all emotions are
collected or recorded in a real time environment , such as cockpit recordings, live news reports,
recording people on the street or on reality TV shows, conversations on TV, call center
conversations (Lee & Narayanan, 2005), etc.
Although, this kind of corpus tends to be more natural than other types there are a number of
serious drawbacks. Most importantly, it is uncontrolled and difficult to obtain and annotate.
There are no ideal conditions for recording this type of corpus, a challenge which needs to be
considered.
The resources mentioned are subject to bad recording quality, with a lack of consistency across
broadcasts which leads to varying quality of voice samples depending on the nature of the
program, whether it is recorded in a studio or outside in public spaces (as many reality television
programs are). Additionally, some may contain noise added in the real time environment.
Various other factors can affect the audio quality: noise from studio audiences, people talking
across each other and environmental noise from outside broadcasts. The equipment used can also
affect sound quality.
A major problem is the low levels of emotion expressed, meaning that huge quantities of
material have to be marked up before obtaining anything of use.
However, collecting data from broadcast media to be used as acted or spontaneous speech is
argued against by anthropological research, finding that the presence of the researcher and the
equipment distorts the reality of the situation, causing people to feel constrained and to act
unnaturally (Becker & Geer, 1957).
As mentioned above, due to the limitations of emotional corpora for Arabic speech compared to
other languages, research on emotion in Arabic amounts to little or nothing. There are also
difficulties in finding corpora containing suitable emotional texts for Arabic. This scarcity of
relevant material from the media led to the present decision to use represented emotions for this
study by recording a suitable number of sentences expressing emotions by a professional actor.

62
This has the advantage of allowing full control over the recording environment with respect to
emotional content.
The next sections present the design procedure of an Arabic emotional speech corpus through the
stages of selecting an actor to record texts expressing a major emotion, evaluating the recording
through perceptual tests and using the results to assess and specify the selected sentences to be
used to conduct our initial experiments.
4.2.1 Selection of actor
The first important task of constructing the emotional database is the selection of the actor, as the
main factor responsible for producing the expressive speech which is to be as close to the desired
emotion as possible, affecting the recordings and then the overall quality of our experiments.
There are a set of criteria for actor selection, primarily:
Ability to express the selected emotions.
Easy access to the speaker when needed.
Ability to make spontaneous sounding recordings.
The researcher made the decision to record herself enacting the data for various reasons:
She meets the necessary conditions, having good experience of acting and of performing
recordings. She has worked as a presenter of an Arabic radio station, presenting many types of
programs which required acting such as news which requires for example the ability of
delivering the content in a certain emotion to make the speech and the content more believable.
And recording children’s stories, and she is therefore familiar with the recording environment.
Recording the data herself gives the researcher the advantage of a high level of attention to her
work.
Despite the researcher being familiar with recording written material and with the environment
of recording, as she has recorded Arabic speech in her research towards obtaining her Masters
degree in the same area (Bin Othman, 2010) there nonetheless is a risk, because an actor who
knows the nature of the research and its goals might be unconsciously biased about what she is

63
doing and might over-emphasise phonemes which she thinks are interesting so that the
recordings may be influenced by these preconceptions.
While it would have been better to use recordings from several speakers, the fact that our
subjects were able to recognise the emotion that was intended for the majority of the recordings
suggests that the information that is required for expressing emotion was present in these
recordings. Given the difficulty of collecting data from multiple speakers and annotating it with
emotions, the fact that the intended emotions were detectable in our recordings gives us some
confidence that the experiments are showing us something about how emotions are encoded,
though in future work we would want to obtain recordings from more speakers.
4.2.2 Selection of emotions
The second step in creating an emotional speech corpus is the selection of emotions. One actor
simulated the following three human emotions: sadness, happiness, anger, as well as a neutral
state.
Although many categories of emotion can be discovered in speech generally, these three
emotions are the most commonly recognised as basic emotions in the literature when attempts
are made to classify them into meaningful groups (Izard, 2001; Plutchik, 1980; Parrott, 2001).
These three emotions can be further divided into the set of emotions known as the “big six
emotions” (P., Ekman, W. V. Friesen, & Ellsworth, 1982), (Douglas-Cowie et al., 2003): fear,
anger, happiness, sadness, surprise, disgust, which have in turn been split into finer-grained
categories, though there is less general agreement about the division beyond the big six. Given
the difficulty in acting out a very fine-grained set of emotions, we chose to use the three that are
most widely recognised as basic – in particular, it is extremely difficult to deliberately
differentiate between anger, fear and disgust, and attempting to do so would have been likely to
produce confusion for the listener.

64
4.2.3 Design of material texts
The third step in designing the corpus is selecting the set of sentences. Today, the newspaper is
the most accessible source of modern Arabic. The BBC website is one of the most famous
electronic newspapers of Arabic text for Arabic speakers. The dataset is an electronic archive
for the newspaper of the year 2015, presented as windows HTML files3. A set of MSA
sentences of different lengths was selected randomly from the Arabic BBC News website. These
sentences were the headlines of news reports. Table 4.1 shows these selected sentences.
S1 ط د ب ي ط جال لت زويد ت خ طفاء ر حمولة طيران ب أجهزة الأ م
Dubai plans to provide firefighters with Air Portable
dubay tuxat'it'u litazwydi rijAli AlOit'fA` biOjhzapi t'ayarAnK mahmwlp S2 فع ة ر ج ه ة التأه ب د ر واج م اني الضب اب ل ب كين في الد خ
Raise the degree of preparedness to meet the smog in Beikine
raf?'u darajapi AlttOhubi limuwAjahapi Ald'd'bAbi AlduxAny fiy bikyn
S3 ر ؤت م ن اخي التغي ر م ول ن قطة ي كون ق د ب اريس في الم ت ح
Climate Change Conference Paris may be a turning point
mu'tamaru AlttGayuri AlmanAxy fiy PArys qad yakwnu nuqt'apa tahawl S4 مة ت أمين ك ات في الأنظ يطانية الانترنت ش ر ع البر ع ات ي خض راج م ة ل م ص ار
Insurance systemsBritish Internet companies are subject to a strict review
taOmynu AlOnD'impi fiy SarikAti AlAntarnit Albryt'Aniypa yaxd'aEu limurAja?'AtK s'Arimap
S5 د بالكهرباء المخ ت حفيز ن التعافي في ي ساع ماغي السكتة م الد
Stimulating brain electricity helps recovery from stroke
tahfyzu Almux biAlkahorabA` yusA?'idu fiy Alta?'Afy mina Alsaktapi AldimAGypa
S6 حلة ن للتأك د أوروبية ف ضاء ر ياة وجود م المريخ على ح
European space flight to discover whether there is life on Mars
riholpu fad'A`K Owrwbyp lltOkudi min wujwdi hayApK ?'lY Almaryx Table 4.1: Selected sentences
3BBC Arabic, (2017). علوم وتكنولوجيا. Retrieved from http://www.bbc.com/arabic/scienceandtech

65
Table 4.1 shows the selected sentences, their meaning in English and their phonetic transcription.
There are six sentences which contain from 5-9 words and they are diacritized in advance. The
sentences contain most of the Arabic letters and phonemes, the letters are around 27 consonants
with three short vowels ( /a/, /u/, /i/)and tanween Kasrah ( /en/), two long vowels (u:,i:),
because our aim is to investigate which phonemes are the most significant.
Figure 4.1 shows the frequency of phonemes in these sentences.
Figure 4.1: Phonemes frequency
Here are some reasons why these six sentences are useful for the purpose of emotional speech
recognition in Arabic.
The dataset consists of real text of spoken Arabic, which requires a minimum of
processing.
These six sentences might be a suitable number for making a judgment about the
emotion expressed, they cover all the sounds of Arabic and they are not intrinsically
emotive and therefore it is possible to try reading them in different emotions and the
listeners will be not swayed in their judgment. Also they are easy to speak immediately
from memory, there is no need for a longer process of memorising or reading them off a
paper, which may lead to a lecturing style.

66
An actor may experience some difficulty expressing emotion when the content of
sentence refers to a certain emotion, for example, expressing sincere happiness when the
text subject is death, especially when the speaker is not a professional actor. Because the
meaning and content of sentences can play a role in the speaker's acting during recording,
this can affect assessment of these sentences by the listener in the perceptual test phase.
So most of these selected sentences are not intrinsically emotional and tend to be
sentences taken from news websites which hold neutral emotion without any clues of
emotional content..Therefore, the classification and recognition of these sentences would
be on the basis of how the sound was rather than of the intrinsic emotional content.
4.2.4 Database collection
Recording of emotional speech data collections is definitely important for researchers interested
in emotional speech analysis. In this section, the process of the creation of our own corpus will
be presented as a subsection as following:
4.2.4.1 Recording process of data
The sentences are recorded in the Arabic language in the following manner. The first sentence
was chosen and recorded directly to the computer four times in different expressive styles
(sadness, happiness, anger and neutral ). By portraying them emotionally using acted emotional
states without interruption, the actor can repeat them many times until she is satisfied with the
emotional tone of what she has simulated for the sentence in order to make the recording of the
expression as realistic as possible. However, we have to be careful about recording the same
sentence over several repetitions because that may cause the emotion to become dull and hence
unrecognisable.
There are a number of problems with acted speech(Campbell, 2000):

67
Firstly, acting out emotions like anger or sadness while speaking sentences with unrelated
content can sometimes be difficult and complex. It requires a lot of concentration and a certain
theatrical capacity in the actor.
Secondly, overacting or exaggeration by the actor may result in unnatural expression, which
differs from speech produced by a speaker when experiencing a genuine emotion(Scherer,
Banse, Wallbott, & Goldbeck, 1991).
However, in an attempt to overcome the problem of exaggeration of expressing emotions ,we use
perceptual tests in order to evaluate and validate our recordings.
The data is recorded in a quiet room on a laptop by one female actor who is able to portray
emotions in a convincing manner, four times over as mentioned (these amounted to 24 sentences
(6 sentences x 4 emotions)).
A high-quality microphone was used to make the recordings. The distance between the
speaker’s mouth and microphone was approximately 5-7 cm, and the Praat software program
(Boersma & D, 2017) was used to control the recording. Figure 4.2 shows a screenshot of the
sound recorder of the Praat program. A sampling frequency of 44100 KHz was used,16 bits
depth and mono channel.
Figure 4.2: Sound recorder of Praat program

68
4.2.4.2 Labeling the data
The recordings were saved in .wav format and labeled as the following : SxxEyy ,where S
refers to sentence and xx refers to the number of sentences and E refers to emotion and yy
refers to the code of emotion as listed in the following table:
Emotions E00 Neutral E01 Happiness E02 Sadness E03 Anger
Table 4.2: Labeling for emotions
For example : S00E00 means the first sentence with neutral emotion. Numbering of the six
sentences goes from 00 up to 05.
The total number of files recorded is thus 24 files (1 speaker x 4 emotions x 6 sentences). The
choice of which of the emotive sentences should be included in our study is evaluated in the next
section.
4.2.4.3 Evaluation of the data
As mentioned in section 4.2.4.1 above, in order to record a certain emotion of emotive sentences,
the actor could tend to over-act in order to record the data quickly and easily. Therefore, the
recording has to be verified by carrying out a perception test to check whether human listeners
can recognise the recorded emotion type and if it is close to the desired emotion; also if the actor
is able to portray emotions convincingly. The procedure for this test was adopted from Meftah
et.al (Meftah, Alotaibi, & Selouani, 2014).
The number of subjects selected amounted to 12 listeners ( 11 female and 1 male ) who did not
receive any training for the testing procedure due to the simplicity of the task. The subjects have
these two important properties:
They are fluent in spoken Arabic and have to listened to Arabic recordings.
They do not have hearing-related health problems.
69
The subjects were told that the aim of the experiment was to recognise the emotion from the set
of recordings and that they could listen to each utterance twice before they had to assign an
emotional state.
A questionnaire was designed precisely to assess the correct emotion of these speech recordings
in order to ensure data validation and establish an indication of how well the actor was
expressing the intended emotion performed over the set of recordings. The questionnaire
designed in paper format lists the recorded speech data in numbers with four different emotions.
The listener had to play and listen to audio files and fill that part in by assigning the percentage
of emotion they thought each sentence contained. The audio clips are not ordered as recorded but
listed in a random way . However, we allowed them to repeat each file twice before they needed
to make their decision. The questionnaire is presented in Appendix A.
The subjects were given 24 recordings of sentences to listen to and were asked to assign the
correct emotion for each by choosing one or two emotions from a list of four possible emotions.
For example, the listener could specify that a given sentence would comprise either 30% normal
emotion and 70% sadness emotion, or 100% sadness. We allowed the subjects to choose two
possible emotions and to give each of these a degree because we thought that there could be
overlap between two emotions. Letting people choose two emotions, rather than one, would give
us an indication of whether there is any degree of overlap between any two emotions.
The result of this questionnaire helps us to select the most appropriate sentences to be used in
our experiments.
The reports on the results obtained and discussions on the findings are presented in the following
section.

70
4.2.4.4 Results and analysis
The perception test results were analysed to determine the rate of emotion recognition. The
results are shown in the following tables. Table 4.3 shows an example of the listener's response,
including their percentage ratings.
Listener No:1
Emotions No. Utterance
Neutral (%)
Happy (%)
Sadness (%)
Anger (%)
notes
1:S00E02 80 0 20 0
Table 4.3: An example of listener response
As mentioned before, and from Table 4.3, we can see that subjects were asked to express two
views, for example, regarding the sentence S00 with sad emotion E02,the listener defines its
expression of emotion as 80% neutral and 20% sad. Because neutral emotion is an absence of
emotion, this choice means sentence S00 does not express much emotion, but what it does
express is sadness. So if it had been intended as sad, this would actually be the right emotion,
just not very much of it.
Four recordings, each intended to express one of the four emotions, were made of six distinct
sentences. Twelve subjects each listened to these 24 recordings, i.e. each subject listened to six
instances of a neutral recording, six instances of a sad recording, and so on, making 72
judgments of recordings of each intended class. Given that neutral means that no emotion was
expressed, rather than being a label for a specific emotion, we treated cases where an annotator
marked an utterance as being partly neutral and partly some concrete emotion as indicating that
they felt that utterance was weakly expressive of the concrete emotion. In the tables below, cases
where every annotator has given an utterance a mixture of neutral and the same concrete
emotion, and the overall score for the concrete emotion was greater than 5, have been labelled as
belonging to the concrete emotion rather than as neutral. We offered listeners the chance of
assigning multiple emotions to am utterance to allow for situations where a single utterance was
felt to express two differing concrete emotions, e.g. anger and sadness. It turned out that this very
seldom happened, but that people used the possibility of assigning a mixture of a concrete

71
emotion and neutral, seemingly as a way of saying that the utterance expressed the concrete
emotion, just not very strongly. We therefore assigned labels as follows:
If the highest score was something other than neutral and was over five times as high as
the score for any other concrete score then we accepted that.
If everyone gave a mixture of neutral and the same other concrete emotion, and the
overall score for the concrete emotion was reasonably high (the threshold for this was
chosen manually) it seemed sensible to assume the utterance should be classified as
belonging to the concrete emotion rather than neutral. In Table 4.6, for instance, sentence
S2 has been assigned H because, whilst most of the annotators gave a mixture of H and
N, the score for H, at 6.1, is higher than the score for N, at 5.7, and is much more than
five times the score for A. S1, S3, S4, S5 and S6 have all been classified as H because no
annotator has assigned any emotion other than H or N and the overall scores for H are all
greater than 5.
This strategy allows us to cope with the unexpected way that annotators used a mixture of neutral
and a concrete emotion to express the degree to which they felt that an utterance expressed that
emption: we accepted a concrete assignment if it had the highest score (including by comparison
with neutral) or if every single person gave the same mixture. The overall result of the test is
summarised in Table 4.4.
Assigned emotion
Neutral Sadness Happiness Anger Recognition rate
Intended emotion
Neutral 70 0 2 0 97%
Sadness 2 64 4 2 89% Happiness 5 0 66 1 92% Anger 4 8 1 59 82%
Table 4.4:Confusion matrix for the listeners’ responses
Table 4.4 shows a confusion matrix of the subjective human evaluation of sentences, for
example, the first row shows that 70 of the 72 utterances that were intended to be neutral were
judged as neutral, 0 as sad, 2 as happy and 0 as angry. The recognition accuracy of neutral is
approximately 97% which is the highest percentage of correct recognition. We can see that the

72
most easily recognisable category is neutral and then happy at 92% followed by sad at 89% and
angry at 82% of utterances.
We also find that subjects sometimes show confusion in differentiating happy, sad and angry
from neutral. However if we assumed the absence of a neutral choice, we can see that all three
emotions would be identified correctly nearly all the time. Table 4.5 shows what subjects choose
instead of neutral emotion.
Assigned emotion Sadness Happiness Anger Recognition rate
Intended emotion
Sadness 64 4 2 96%
Happiness 0 66 1 99%
Anger 8 1 59 87%
Table 4.5: Confusion matrix for the listeners responses without neutral emotion
The table above presents the recognition rate of three emotions. It is clear that the happy
expression was more recognisable than the others at 99%. The angry and sad expressions were
not recognised as well, but the result is still higher than chance.
There are four tables of target emotions (Happy, Angry, Sad, and Neutral) which show the
answers given by subjects for each simulated expression of our recordings. These tables allow us
to decide which expressive utterance should be chosen in order to conduct our experiment of
given expressions. Table 4.6 shows the results for the recordings which were intended to express
happiness.

73
Target Emotion:HAPPY:E01 Rec. Of
Happy
Emotions
SUBJECTS SUM
Rec. Emo L1 L2 L3 L4 L5 L6 L7 L8 L9 L10 L11 L12
S1 H 0.8 0.3 0.3 0.5 0.9 0.2 0.3 0.1 0.7 0.0 0.7 0.7 5.5 H S 0.0 0.0 0.0 0.0 0.0 0.0 0.0 0.0 0.0 0.0 0.0 0.0 0.0 A 0.0 0.0 0.0 0.0 0.0 0.0 0.0 0.0 0.0 0.0 0.0 0.0 0.0 N 0.2 0.7 0.7 0.5 0.1 0.8 0.7 0.9 0.3 1.0 0.3 0.3 6.5
S2
H 0.8 0.3 0.0 0.5 1.0 0.1 0.3 0.0 0.7 1.0 0.8 6.0 6.1 H S 0.0 0.0 0.0 0.0 0.0 0.0 0.0 0.0 0.0 0.0 0.0 0.0 0.0 A 0.0 0.0 0.2 0.0 0.0 0.0 0.0 0.0 0.0 0.0 0.0 0.0 0.2 N 0.2 0.7 0.8 0.5 0.0 0.9 0.7 1.0 0.3 0.0 0.2 0.4 5.7
S3
H 1.0 0.2 0.2 0.0 1.0 0.2 1.0 0.0 0.4 1.0 0.6 0.1 5.7 H S 0.0 0.0 0.0 0.0 0.0 0.0 0.0 0.0 0.0 0.0 0.0 0.0 0.0 A 0.0 0.0 0.0 0.0 0.0 0.0 0.0 0.0 0.0 0.0 0.0 0.0 0.0 N 0.0 0.8 0.8 1.0 0.0 0.8 0.0 1.0 0.6 0.0 0.4 0.9 6.3
S4
H 0.9 0.8 0.4 0.3 1.0 0.2 0.4 0.2 0.9 1.0 0.6 0.8 7.5 H S 0.0 0.0 0.0 0.0 0.0 0.0 0.0 0.0 0.0 0.0 0.0 0.0 0.0 A 0.0 0.0 0.0 0.0 0.0 0.0 0.0 0.0 0.0 0.0 0.0 0.0 0.0 N 0.1 0.2 0.6 0.7 0.0 0.8 0.6 0.8 0.1 0.0 0.4 0.2 4.5
S5
H 0.8 0.4 0.4 0.5 1.0 0.2 0.3 0.1 0.8 0.0 0.7 0.6 5.8 H S 0.0 0.0 0.0 0.0 0.0 0.0 0.0 0.0 0.0 0.0 0.0 0.0 0.0 A 0.0 0.0 0.0 0.0 0.0 0.0 0.0 0.0 0.0 0.0 0.0 0.0 0.0 N 0.2 0.6 0.6 0.5 0.0 0.8 0.7 0.9 0.2 1.0 0.3 0.4 6.2
S6
H 0.9 0.7 0.3 0.6 1.0 0.2 0.2 0.2 0.7 1.0 0.8 0.7 7.3 H S 0.0 0.0 0.0 0.0 0.0 0.0 0.0 0.0 0.0 0.0 0.0 0.0 0.0 A 0.0 0.0 0.0 0.0 0.0 0.0 0.0 0.0 0.0 0.0 0.0 0.0 0.0 N 0.1 0.3 0.7 0.4 0.0 0.8 0.8 0.8 0.3 0.0 0.2 0.3 4.7
Table 4.6: Evaluation of happy emotion by listeners
From this table we can see that almost all the subjects heard a degree of happiness in almost
every utterance. The exception was listener number 3, who heard anger rather than happiness for
sentence 2. There are five instances out of 72 where the subjects did not hear any emotion
(referred to neutral emotion) when the actor tried to express the sound as happy. Meanwhile in
the remaining 68 instances happiness, often mixed with a degree of neutrality, was heard.
As noted above, we have labelled the cases where there is no dissenting label and the overall
score for H is greater than 5 as being H.
It is clear that there is little evidence of confusing it with sadness or anger in these sentences –
people heard them all as being happy, just not terribly strongly so.

74
Target Emotion:NEUTRAL:E00 Rec. Of
Neutral
Emotions
SUBJECTS SUM
Rec. Emo L1 L2 L3 L4 L5 L6 L7 L8 L9 L10 L11 L12
S1 H 0.1 0.0 0.0 0.0 0.1 0.1 0.2 0.0 0.2 1.0 0.0 0.1 1.8 N S 0.0 0.0 0.3 0.0 0.0 0.0 0.0 0.0 0.0 0.0 0.4 0.0 0.7 A 0.0 0.0 0.0 0.0 0.0 0.0 0.0 0.0 0.0 0.0 0.0 0.0 0.0 N 0.9 1.0 0.7 1.0 0.9 0.9 0.8 1.0 0.8 0.0 0.6 0.9 9.5
S2
H 0.3 0.0 0.0 0.0 0.1 0.0 0.2 0.0 0.0 0.0 0.0 0.1 0.7 N S 0.0 0.1 0.0 0.5 0.0 0.0 0.0 0.0 0.0 0.0 0.5 0.0 1.1 A 0.0 0.0 0.0 0.0 0.0 0.0 0.0 0.0 0.0 0.0 0.0 0.0 0.0 N 0.7 0.9 1.0 0.5 0.9 1.0 0.8 1.0 1.0 1.0 0.5 0.9 10.2
S3
H 1.0 0.0 0.0 0.0 0.1 0.0 0.0 0.0 0.2 0.0 0.2 0.0 1.5 N S 0.0 0.0 0.2 0.0 0.0 0.0 0.0 0.0 0.0 0.0 0.0 0.0 0.2 A 0.0 0.0 0.0 0.0 0.0 0.0 0.1 0.0 0.0 0.0 0.0 0.0 0.1 N 0.0 1.0 0.8 1.0 0.9 1.0 0.9 1.0 0.8 1.0 0.8 1.0 10.2
S4
H 0.0 0.1 0.3 0.0 0.0 0.0 0.0 0.0 0.8 0.0 0.8 0.1 2.1 N S 0.0 0.0 0.0 0.0 0.0 0.0 0.0 0.0 0.0 0.0 0.0 0.0 0.0 A 0.0 0.0 0.0 0.0 0.0 0.0 0.0 0.0 0.0 0.0 0.0 0.0 0.0 N 1.0 0.9 0.7 1.0 1.0 1.0 1.0 1.0 0.2 1.0 0.2 0.9 9.9
S5
H 0.1 0.0 0.0 0.0 0.0 0.1 0.1 0.0 0.1 0.9 0.2 0.1 1.6 N S 0.0 0.0 0.3 0.0 0.0 0.0 0.0 0.0 0.0 0.0 0.0 0.0 0.3 A 0.0 0.0 0.0 0.0 0.0 0.0 0.0 0.0 0.0 0.0 0.0 0.0 0.0 N 0.9 1.0 0.7 1.0 1.0 0.9 0.9 1.0 0.9 0.1 0.8 0.9 10.1
S6
H 0.1 0.0 0.0 0.0 0.0 0.1 0.1 0.0 0.1 0.9 0.2 0.1 1.6 N S 0.0 0.0 0.3 0.0 0.0 0.0 0.0 0.0 0.0 0.0 0.0 0.0 0.3 A 0.0 0.0 0.0 0.0 0.0 0.0 0.0 0.0 0.0 0.0 0.0 0.0 0.0 N 0.9 1.0 0.7 1.0 1.0 0.9 0.9 1.0 0.9 0.1 0.8 0.9 10.1
Table 4.7: Evaluation of neutral emotion by listeners
From confusion matrix Table 4.4, we found that all subjects were able to recognise neutral
emotion, i.e. utterances which were not intended to carry any emotion, successfully for all
sentences to the highest degree. In every case of a sentence that was intended to sound neutral
the score was overwhelmingly in favor of that classification, though there are traces of other
emotions. There is another choice of target emotion that can arise. For example, the subjects
suggest that sentences (S1, S2, S5, S6 ) may have happy or sad emotions while one of subjects
(L7) think that S3 may have also anger and some of subjects (L2, L3, L9, L11, L12) heard the
sentences S4 as happy in addition to neutral. However, the occurrence of this was rare compared
to the score of target emotions recognised correctly. Comparing Table 4.7 with Table 4.4 , we
can note that the neutral emotion was commonly confused by the listeners. Some of them think

75
that neutral sentences tend to indicate happiness; others selected sadness and anger, suggesting
human evaluators experience difficulty in distinguishing neutral from the other three emotions.
Target Emotion:SAD:E02 Rec. Of Sad
Emotions
SUBJECTS SUM
Rec. Emo L1 L2 L3 L4 L5 L6 L7 L8 L9 L10 L11 L12
S1 H 0.0 0.0 0.0 0.0 0.0 0.0 0.0 0.0 0.0 1.0 0.0 0.0 1.0 S S 0.8 0.4 0.4 0.5 1.0 0.1 0.2 0.1 0.2 0.0 0.9 0.9 5.5 A 0.0 0.0 0.0 0.0 0.0 0.0 0.0 0.0 0.0 0.0 0.0 0.0 0.0 N 0.2 0.6 0.6 0.5 0.0 0.9 0.8 0.9 0.8 0.0 0.1 0.1 5.5
S2
H 0.0 0.0 0.0 0.0 0.0 0.0 0.0 0.0 0.0 0.0 0.0 0.0 0.0 S S 0.8 0.8 0.3 0.4 1.0 0.3 0.2 0.2 0.8 0.6 0.8 0.9 7.1 A 0.0 0.0 0.0 0.0 0.0 0.0 0.0 0.0 0.0 0.0 0.0 0.0 0.0 N 0.2 0.2 0.7 0.6 0.0 0.7 0.8 0.8 0.2 0.4 0.2 0.1 4.9
S3
H 0.0 0.0 0.0 0.0 0.0 0.0 0.0 0.0 0.0 1.0 0.0 0.0 1.0 S S 0.8 0.8 0.4 0.3 1.0 0.3 0.0 0.4 0.9 0.0 0.9 0.7 6.5 A 0.0 0.0 0.0 0.0 0.0 0.0 0.2 0.0 0.0 0.0 0.0 0.0 0.2 N 0.2 0.2 0.6 0.7 0.0 0.7 0.8 0.6 0.1 0.0 0.1 0.3 4.3
S4
H 0.0 0.0 0.0 0.0 0.0 0.0 0.0 0.0 0.0 0.0 0.0 0.0 0.0 S S 0.8 0.7 0.4 0.1 0.1 0.1 0.3 0.1 0.8 0.5 0.7 0.0 6.4 A 0.0 0.0 0.0 0.0 0.0 0.0 0.0 0.0 0.0 0.5 0.0 0.8 1.3 N 0.2 0.3 0.6 0.0 0.0 0.9 0.7 0.9 0.2 0.0 0.3 0.2 4.3
S5
H 0.0 0.0 0.0 0.0 0.0 0.0 0.0 0.0 0.0 0.0 0.0 0.0 0.0 S S 0.9 0.7 0.4 1.0 1.0 0.1 0.3 0.1 0.9 1.0 0.8 0.8 8.0 A 0.0 0.0 0.0 0.0 0.0 0.0 0.0 0.0 0.0 0.0 0.0 0.0 0.0 N 0.1 0.3 0.6 0.0 0.0 0.9 0.7 0.9 0.1 0.0 0.2 0.2 4.0
S6
H 0.0 0.0 0.0 0.0 0.0 0.0 0.0 0.0 0.0 1.0 0.0 0.2 1.2 N S 0.0 0.7 0.3 0.0 1.0 0.2 0.1 0.2 0.5 0.0 0.8 0.0 3.8 A 0.0 0.0 0.0 0.0 0.0 0.0 0.0 0.0 0.0 0.0 0.0 0.0 0.0 N 1.0 0.3 0.7 1.0 0.0 0.8 0.9 0.8 0.5 0.0 0.2 0.8 7.0
Table 4.8: Evaluation of sad emotion by listeners
Here, the majority of subjects identified all the recordings as the target emotion, namely sadness.
Again a number of utterances were marked as a mixture of sad and neutral, which indicates that
the subjects felt that the target emotion was not expressed very strongly. Curiously subject L10
consistently assigned happiness rather than sadness as the main emotion to all these utterances: it
is hard to see any reason for this.
There are three instances where subjects (L7,L10,L12) think that a sad sound could have a
degree of anger emotion. Only the subject (L10) assigns sadness utterances in three cases of

76
utterances (S1,S3,S6) that could be completely happy and in two instances where subjects
(L1,L4) said the sound of utterance S6 was completely neutral in emotion.
Target Emotion:ANGER:E03 Rec. Of Anger
Emotions
SUBJECTS SUM
Rec. Emo L1 L2 L3 L4 L5 L6 L7 L8 L9 L10 L11 L12
S1 H 0.0 0.0 0.0 0.0 0.0 0.0 0.0 0.0 0.0 0.0 0.0 0.0 0.0 A S 0.0 0.0 0.0 0.0 0.0 0.0 0.0 0.0 0.0 0.9 0.0 0.0 0.9 A 0.9 0.5 0.4 0.3 1.0 0.2 0.1 0.2 0.3 0.0 1.0 1.0 5.9 N 0.1 0.5 0.6 0.7 0.0 0.8 0.9 0.8 0.7 0.1 0.0 0.0 5.2
S2
H 0.0 0.0 0.0 0.0 0.0 0.0 0.0 0.0 0.0 0.0 0.0 0.0 0.0 A S 0.0 0.0 0.0 0.0 0.0 0.0 0.0 0.0 0.0 0.0 0.0 0.3 0.3 A 0.8 0.8 0.3 0.0 1.0 0.3 0.1 0.2 0.7 0.2 0.9 0.7 6.0 N 0.2 0.2 0.7 1.0 0.0 0.7 0.9 0.8 0.3 0.8 0.1 0.0 5.7
S3
H 0.0 0.0 0.0 0.0 0.0 0.0 0.0 0.0 0.0 0.0 0.0 0.0 0.0 A S 0.0 0.0 0.0 0.0 0.0 0.0 0.0 0.1 0.0 0.2 0.0 0.0 0.3 A 0.8 0.8 0.4 0.2 1.0 0.0 0.1 0.0 0.9 0.8 0.9 0.9 6.8 N 0.2 0.2 0.6 0.8 0.0 1.0 0.9 0.9 0.1 0.0 0.1 0.1 4.9
S4
H 0.0 0.0 0.0 0.0 0.0 0.0 0.0 0.0 0.0 0.0 0.0 0.0 0.0 A S 0.2 0.0 0.0 0.0 0.1 0.0 0.0 0.0 0.6 0.2 0.0 0.2 1.3 A 0.8 0.5 0.5 0.5 0.9 0.1 0.3 0.1 0.0 0.8 0.6 0.8 5.9 N 0.0 0.5 0.5 0.5 0.0 0.9 0.7 0.9 0.4 0.0 0.4 0.0 4.8
S5
H 0.0 0.0 0.0 0.0 0.0 0.0 0.0 0.0 0.0 0.0 0.0 0.0 0.0 N S 0.0 0.0 0.0 0.0 0.0 0.0 0.0 0.0 0.0 1.0 0.0 0.9 1.9 A 0.0 0.5 0.3 0.8 1.0 0.2 0.2 0.1 0.9 0.0 0.9 0.0 4.9 N 1.0 0.5 0.7 0.2 0.0 0.8 0.8 0.9 0.1 0.0 0.1 0.1 5.2
S6
H 0.1 0.0 0.0 0.0 0.0 0.0 0.0 0.0 0.2 0.0 0.0 0.0 0.3 N S 0.0 0.0 0.0 0.0 0.0 0.1 0.0 0.1 0.0 1.0 0.4 0.2 1.8 A 0.0 0.1 0.2 0.0 1.0 0.0 0.0 0.0 0.0 0.0 0.0 0.0 1.3 N 0.9 0.9 0.8 1.0 0.0 0.9 1.0 0.9 0.8 0.0 0.6 0.8 8.6
Table 4.9: Evaluation of anger emotion by listeners
Again, in nearly every case the intended emotion was given the highest score out of the three
main emotions, with an admixture of neutral indicating the degree to which the emotion was felt
to be expressed. In a small number of cases sadness was mixed in with anger, and a few listeners
assigned sadness rather than anger as the main emotion, though for every utterance the general
assignment was anger.
From this table we can see that the anger emotion was recognised incorrectly in some cases,
being confused with other emotions. A small number of cases (2) of subjects (L1,L9) heard
anger as a happy expression with utterance S6.

77
In most cases, if the subjects misrecognized anger then they classified it as sadness but with a
small number in (5) cases, with utterances S1, S4,S5 and S6. Overall the neutral sentences were
the most easily recognisable by the listeners. In other cases listeners often assigned a mixture of
neutral and the target emotion. This is to be expected, given that doing this can be used as a way
of marking the intensity of the expressed emotion, and may even be taken as a positive sign that
actor did not over-act during recordings
From Tables 4.8 and 4.9, we can see that some individuals classified anger as sadness and
sadness as anger, though even in these cases the majority vote was always for the target emotion.
This suggests that people can find it difficult to distinguish the difference in spoken language
between sadness and anger.
Psychologists suggest that emotions such as sadness can be detected beneath anger. Sadness is
usually an uncomfortable experience as it makes people feel vulnerable and lacking in control.
Due to this, people tend to go out of their way to avoid such feelings. One subconscious method
is to shift into an angry mode.
We can conclude from the previous four tables that subjects were able to recognise the target
emotion of recordings correctly with few mistakes. When we gave the subjects the freedom of
choosing two emotions if they are unsure what the emotion is, they always choose a mixture of
neutral and something else since neutral is absence of emotion, choosing neutral and another
emotion is a way of expressing the degree to which the actor had expressed the target emotion.
Using the scoring algorithm outlined above, we obtained the results in Table 4.6-4.9,
summarised in Table 4.10, which show that where our subjects heard any emotion at all they
heard the one that the actor had intended to express. There are cases where they felt that the
given emotion did not come across very clearly, but where there was a reasonable level of
evidence that an utterance expressed an emotion (either because that emotion had the highest
overall score or because the only other label assigned was neutral) the intended emotion was
recognised.
Our goal is to perform human emotion classification of recorded speech through listening
sessions in order to gain a set of emotive sentences. The following table shows that summaries of

78
the recordings were recognised and selected. We selected the ones with a clear majority vote for
a single emotion other than neutral, since these cases clearly did express that emotion.
Emotion Sentences Happy Neutral Anger Sad
S1 S2 S3 S4 S5 S6
Table 4.10: The expressive data recognised by subjective human evaluation
From Table 4.10, the sentence recordings S1, S2, S3 and S4 were recognised correctly all the
time for all four emotions. Meanwhile, in recording S5 anger was classified incorrectly. In
Table 4.9 we can see that subjects were confused between anger and sadness and it can be seen
that subjects think that utterance S6 which was intended to express anger could also include a
degree of sadness and happiness. There are two cases where subjects are completely convinced
that the sound is sadness and not anger. For sadness in Table 4.8, the recording S6 was confused
by the subjects as happiness, so we are not going to choose this recording.
For carrying out the next experiments, we only need the emotional speech data that can be
recognised by most listeners. Given the results on Table 4.10, we omitted the ‘angry’ versions of
S5 and S6 and the ‘sad’ version of S6 – if people did not recognise these emotions in these
recordings then they must, by definition, fail to express them, and hence would be poor
examples to use for training and testing a classifier. Thus only 21 sentences were selected from
the original 24 sentences. These sentences are then put into an emotional database and can then
be used as prosodic templates in the next experiments to extract information on acoustic
parameters of phonemes.

79
Table 4.11 shows the number of the final expressive data to be selected.
Table 4.11: The number of final expressive selected sentences
4.3 Summary
We have designed our own emotional speech corpus for Arabic containing six short sentences
with four emotions each, namely Happiness, Sadness, Anger, and in addition Neutral
emotion. These emotions are expressed by one female actor then a perceptual test involving a
number of listeners is carried out in order to evaluate the degree to which the actor is able to
express the desired emotions and to validate the recorded data for recognition of emotive
elements.
The results of the evaluation test show that subjects are able to identify the emotions in target
utterances. It can also be observed that subjects use the presence of neutral in the set of options
as a way of expressing the confidence about the level of emotion the actor expressed. However,
neutral utterances are needed to be compared with other emotive utterances.
The result also shows that people are good at recognising happy expressions, but less confident
in recognising sad and angry expressions. Once the initial corpus had been created, analysed and
evaluated the next step is to extract the basic prosodic features of these utterances, which are
discussed in the next chapter.
Desired Emotion Number of selected sentences
Neutral 6 Sadness 5
Happiness 6 Anger 4
Total no : 21

80
5. CHAPTER FIVE: EXTRACTING AND ANALYSING THE
RELEVANT PROSODIC FEATURES
5.1 Introduction
After selecting suitable sentences for use in our experiments, the next step is segmentation and
labeling of our dataset, the purpose of which is to extract the prosodic features which are
associated with four emotions (neutral state, happiness, sadness and anger) and which are
involved in the actor's expression of speech.
This step is divided into two stages. The first stage is annotation, in which the recorded speech is
transcribed and labeled, and the second is a process of extracting important prosodic information
(pitch, duration and intensity) about emotional speech. Figure 5.1 shows this process.
Figure 5.1: The process of extracting the features.
5.2 The Annotation Process
In this stage, the recordings were segmented and labeled in order to identify the boundaries of
the individual phonemes on the basis of the audio recordings and their orthographic
transcriptions in the speech samples. This process is called forced alignment of phonemes or
phonetic segmentation, a task which could be done manually or automatically. In the manual
approach, we select the sound waves, listen to them, and mark them up along with spectrogram
representations in order to decide where exactly to place the boundary of each phoneme. An

81
annotation tool, such as in Praat (Boersma & D, 2017) or ELAN (Rosenfelder, 2011), can be
used for annotation of speech data manually.
This approach is considered the most accurate, but there is a major drawback represented by the
time needed to concentrate on each chunk of phonemes from every single speech sample in the
corpus. Some estimates put this at 800 times longer than real-time (Schiel, 2003).
We therefore decided to use an automatic method of carrying out this task. There is a set of
algorithms for alignment, such as FST Aligner (Hazen, 2006), FST Aligner with disfluency
model (Liu, Shriberg, & Stolcke, 2003), and Viterbi Alignment ("Viterbi algorithm -
Wikipedia," 2017). We chose to use Viterbi alignment.
An HMM recogniser in the HTK (Sjölander, 2009)is used for the forced alignment; that is, a
known sequence of phonemes is supplied to the Viterbi algorithm to segment and align the
transcribed data. The main reasons for this choice are that we are already familiar with this
toolkit for recognition of Arabic (Bin Othman, 2010), and it is well-known and widely used for
the purpose of phonetic segmentation.
This approach requires many steps to prepare the data before using the automatic tool for the
segmentation. In the next section, we will give a brief explanation of the HTK toolkit that will be
used to align each utterance by using the Viterbi-based HVite tool in the HTK.
5.2.1 Overview of the HTK Toolkit
The name HTK refers to the “Hidden Markov Model Toolkit” developed by Cambridge
University Engineering Department (CUED) in order to build and manipulate Hidden Markov
Models (HMMs) (Sjölander, 2009).
The main function of the HTK is in speech recognition research and it involves two major
processing stages which are shown in Figure 5.2:

82
Figure 5.2: Two major processing stages in HTK toolkit (Sjölander, 2009).
Training Phase: This involves the use of a set of training tools to estimate the parameters of a
prescribed set of HMMs. This is done by using training utterances and their associated
transcriptions.
Recognition Phase: This involves using HTK recognition tools for the production of
transcriptions of unknown speech utterances.
As mentioned before, the HTK toolkit is used to automatically segment and label the phonemes
of each syllable to identify the time when each word in the transcription was spoken in the
utterance. The information will be saved and converted to a suitable format (TextGrid) for
acoustic analysis.
In our case, we model the speech input as a Hidden Markov Model (HMM) which takes a
sequence of observed features from tokens ( acoustic vectors) that can be used to decide which
state the system is in, and give them some label (phones).This is done by modeling each
label/phone as a sequence of “hidden” states.
We train the model to learn the characteristics of each state and the probability of being in a
given state, given what the spectrum is doing at that point.
During training, observations are paired with labels so that transition probabilities between states
and model vectors can be learned.
In order to identify the speech segments corresponding to individual phonemes, we train a
recognition model using the full set of utterances and then use this to carry out forced alignment

83
on each utterance in turn. Training such a model involves starting with 'flat start' models with
uniform estimates of phoneme length and refining these to make better models and hence to
produce better estimates of phoneme lengths. Whilst the training steps do include a forced
alignment step, there are subsequent steps which make use of the results of this step, so that the
best estimates of where the phoneme boundaries lie comes from the final trained model.
However, using HMMs of phones and the acoustics to determine where boundaries should be
placed has some difficulties, including bad transcriptions, unknown words, overlap, noise, and
code-switching.
In the following sections, we will explain the process for annotating our data.
5.2.2 Requirements of the HTK Toolkit
In order to conduct our experiments using the HTK, there are several important requirements for
the proper functioning of the toolkit components. These prerequisites are briefly stated below:
1. Creating a transcription file for training data based on different aspects of the words.
2. Constructing phonetic transcriptions for the model that contain the pronunciation information
of words derived from processing the transcription file.
3. Building the task grammar (grammar files) which consists of a set of variables defined by
regular expressions, which depend on a finite state-based grammar. In our experiment, different
grammar files were created called gram.txt.
4. A set of folders: This includes the training data folder (consisting of wave files- the actual
recordings). In this project, our experiments will use a dataset of recording containing about 21
files. Also included in this set are the test data folder (consisting of the speech files of the test
recogniser), and the HMM folders (containing definitions of HMMs). These three sets of folders
must be arranged in parallel with specific names.

84
5.2.2.1 Data preparation
Before using the HTK toolkit with training data, a number of data preparation steps need to be
completed to facilitate data processing by the toolkit.
For the purpose of training, the data were prepared as follows :
We used the corpus which was recorded before. This corpus includes 21 selected utterances
recorded with four different emotions. Each recording is saved to a file with the same name as
the utterance label. Figure 5.3 shows the procedure for the preprocessing of our data in order to
obtain a suitable format of HTK toolkit for our data.
Figure 5.3: Data preparation of our Data

85
As shown in Figure 5.3, Arabic text in UTF-8 code is transliterated and converted to Roman
script based on the Buckwalter transliteration4as shown in the table 4.12 with some modifications
made using a Python program called Transliterate.py (see Appendix B1). The result is a text file
which will be modified and renamed as a ‘prompts’ file.
Arabic letter Transliteration in
Buckwalter Arabic letter Transliteration in
Buckwalter Arabic letter Transliteration in
Buckwalter ء
'** o م * ذ m آ
ˡ ر r ن n أ
> **oa ز z ه h ؤ
& **ou س s و w إ
< **oi ش $ **sh ي Y **A ئ
y ي S ص { ا
A ض D F ** an ب
b ط T N **un ة
p ظ z K **in ت
t ع E a ث
v غ g u ج
j ف f i ح
H ق q ~ خ
x ك k O**"" د
d ل l
Table 4.12: Buckwalter Arabic transliteration
After obtaining the prompts file which contains all our words in the recorded sentences, we will
have a list of words that can be used to generate a pronunciation dictionary (lexicon) file. From
this we automatically extract a phonetic dictionary (by using a Python program called
4Buckwalter Arabic Transliteration. (2002). Retrieved from http://www.qamus.org/transliteration.htm

86
phonetic.py) to use when preparing the training data for the speech recogniser. The most
challenging part of this involves handling semivowels (characters which are sometimes
pronounced as vowels and sometimes as consonants) as described below. The advantage of
doing this automatically is that it would make it easy to carry out experiments with more data in
future work. Production of the pronunciation dictionary file will be explained in detail in the next
section.
5.2.2.2 Generating the Pronunciation Dictionary (Lexicon)
The pronunciation dictionary essentially consists of a list of word entries with their respective
phonetic transcriptions based on a given alphabet.
Due to the lack of existing freely available pronunciation dictionaries for Arabic and the use of a
small amount of data in our study, we decided to generate the dictionary using pronunciation
rules for Arabic.
Generating the pronunciation dictionary requires fully diacritised text. If the dictionary contained
undiacritised words like “mn” or “bkyn” then we would have no chance of producing a
phonetic transcription. We therefore start from the assumption that the text is fully diacritised.
Firstly, Arabic text will be converted to the Latin or Roman alphabet, and secondly this will be
converted to phonetic letters using Buckwalter’s Transliteration. This is the most commonly
used transliteration scheme for Arabic , developed at Xerox in the 1990s5, and has been used in
many publications.
There are some symbols or characters in the Buckwalter transliteration which have to be slightly
modified in order to be easily readable and acceptable for some of the HTK Toolkit processes,
such as $ ,>,<.
5Buckwalter Arabic Transliteration. (2002). Retrieved from http://www.qamus.org/transliteration.htm

87
However, Arabic spelling is a phonemic system with one-to-one letter to sound correspondence;
for example, phoneme names consisting of one or two letters are generally used. For instance ( ب
are mapped to /zh/,/Th/,/sh/. However, there is (ظ, ط , ش ) are mapped to /b/, /t/, /m/, and (, ت , م
no issue in mapping letters to sounds for most consonants.
We are not going to depend on a predefined set of phonemes because we think that converting
the name of a phoneme to another different letter is more important in English than Arabic. In
addition, it makes no difference for the HTK Toolkit if the letter is converted to the same or to
some other different letter or phoneme. Thus in general simply using the Buckwalter
transliteration of the text provides a reasonable set of phoneme names. The only exceptions are
the semi-vowels, where we use "w" and "y" for cases where they are being used as consonants
and "uu" and "ii" where they are being used as vowels. We thus have 44 phonemes, for which
the HTK makes 44 individual models – the first 42 entries in Table 4.12 (the last two are
diacritics that denote either the absence of a vowel in a position where one might be expected or
the doubling of the previous sound, and hence do not correspond to any specific sounds), plus
two for the distinct versions of the semi-vowels.
For vowels, as mentioned in section 3.2 ,there are two types, namely long and short vowels.
These vowels are also defined with long vowels, such as ( ي ,و ,ا), being defined as/a:/,/u:/,/i:/ and
short vowels such as ( , , , ),being defined as /a/,/u/,/i/, these modified vowels and other
consonants are shown in table 4.12 after symbols **. There is, however, a small set of letters
which cannot be mapped directly to one phoneme. Therefore, these exceptions must be taken
into consideration when constructing the dictionary.
A Python program, phonetic.py (given in Appendix B2), is used for dealing with these special
letters. The main issues relate to the semi-vowels, tā’marbūTa, shadda,hamzah, tanwῑn
andsukūn.
Next, the cases of these letters or diacritic will be explained:
The diacritic tanwῑnis defined such that ( ◌، ◌، ◌ ) are mapped to /an/, /un/, /in/.
The sukūn diacriticis not mapped to any character because sukūn it is a symbol marking
the lack of a vowel and hence represents the absence of a sound.

88
The diacritic shadda is a symbol marking consonant doubling.
We will at the same time fix the tā’marbūTa / ( ة ) ( p) , which is typically a feminine
ending. It can only appear at the end of a word. If “p” is followed by a vowel it is
pronounced “t”, otherwise it is pronounced “h”.
Hamzah, hamzah has many different shapes or spellings in Arabic script depending on its
vocalic context (Habash, Soudi, & Buckwalter, 2007). It can be a separate letter ( ء) or
can be combined with other letters: أ, ؤ, ئ. However all hamzahs are glottal stops and we
want the phonetic transliteration to contain a single item which represents this glottal
stop. We could use ( ' ) , as Buckwalter does, but this would be awkward because it
would interact badly with Python string quotes, and would probably greatly confuse the
HTK. We should therefore choose some other character so the symbol “O” will be used
instead of ('). The various single characters, hamzah-under-alif (<), hamzah-over-alif (>)
and for hamzah-on-waw (&) are thus “Oi”, “Oa” and “Ou” respectively; i.e. they are a
glottal stop followed by one of the vowels, so we will transliterate them that way.
There are two characters which sometimes behave as consonants and at other times as
vowels, as mentioned section 3.2.2; these are wow, and yaa, referred to as semi-vowels.
The purpose of these letters is to make specific short vowels sound longer or slightly
stretched. For example, yaa is used to make the kasrah sound slightly longer, while wow
is used to make the dammah sound slightly longer. The program manipulates the
semivowels, applying a rule which says that, if a semivowel is followed by a vowel (i.e.
by one of the actual vowels or by a semivowel) then the semivowel is a consonant ,
otherwise it is a vowel. The examples below illustrate this for “w” and “uu”:
o In the word “taHawl” (which means “turning up”), “w” is preceded by a vowel,
/a/,so “w” in this case is a consonant.
o In “limuwAjahapi” and “TayarAnK” (“confrontation” and “flight” in English),
“w” and “y” are preceded and followed by vowels. In these cases, “w” and “y”
are clearly pronounced as consonants
o In the word “maHmwlp” (“portable” in English), if we assume that we have a root
“m?H?m?l+p” and a pattern “a-o-w”, we can then put the elements of the pattern
into the slots in the root, “maHomwlp”, and delete the sukun because this just

89
represents silence, giving “maHmwlp”. The means that when “w” is a vowel we
should just write it as such.
o In some cases, like in the word “litazwydi” (“to provide”), we get both of the
semi-consonants together as “...wy...”. In these situations, the first
one is always a consonant and the second is a vowel.
Finally, word final “Y”, for example in the word “ElY”, refers to the preposition “'to”,
which maps to “A”, which we will deal with in our program.
However, there are a lot of complex rules discussed earlier in Chapter 3, and because we are
interesting about prosodic characteristic of vowels letters therefore applying most of these rules
does not have much effect and is beyond the aim of our study
Figure 5.4shows a screenshot of the generated pronunciation dictionary (lexicon) file.
Figure 5.4: Pronunciation dictionary file
5.2.2.3 The Task Grammar
Typical speech recognisers (e.g. HTK) are based on a set of Hidden Markov Models (HMMs),
with each word having a distinct HMM. When an unknown word is detected, it is scored against
all HMMs and the one with the maximum score is considered to be the recognised word.

90
Speech recognisers also use the lexicon (phoneme-word) to find the corresponding word in cases
in which the same phoneme sequence occurs in multiple words, while the grammar (language
structure) is used in contexts in which information is needed to narrow down the recognised
word to fit the given grammatical construction. In ordinary usage, the grammar should cover
what a user might say. However, because our concern is with using the HTK toolkit, not to
recognise the sentences, but to determine the time positions of phone boundaries in speech, we
therefore used the actual utterance of sentences as the grammar, enabling us to extract the timing
information of individual phonemes. This process is termed forced alignment.
So “dictionary” and “grammar” files have to be created to be used with the HVite tool in HTK.
The first file, the dictionary, is done and we will explain the second file in this section.
A task grammar is a language model that defines the list of words, along with their probability of
occurrence in a given sequence, that are to be recognised by the system. This language is a high
level grammar notation based on the extended Backus-Naur form (EBNF) used to specify
recognition grammars. It consists of a set of variable definitions followed by a regular expression
according to some syntactic rules describing the words to be recognised (Young et al., 2002).
The grammar file in our experiment consists of a list of the basic Arabic words which will be
used in our sentences.
In the test step for the HTK Toolkit, six grammar files will be created for each sentence. These
grammars are only used for recognition, and an example of the grammar file for the first
sentence is given in Figure 5.5.
Figure 5.5: The task grammar designed for the first sentence.

91
As shown in Figure5.5, the grammar file contains sets of predefined combinations of words
which make up a sentence. Each word in a language model or grammar has an associated list
of phonemes.
Here $SENT is a variable (referring to the sentence) the value of which is the expression
appearing on the right hand side of the assignment. Because all words in the sentence will be
used in the same order exactly, we do not need to use the symbol '|', which denotes optional
items between words.
The start and end silences(SENT-START and SENT-END) can be made optional by enclosing
them within square brackets, which denote optional items, while angle brackets denote one or
more repetitions. The system must know, via the dictionary file, the HMMs that correspond to
the grammar variables.
After writing the grammar files for all our sentences, the HParse tool will be used to convert
them automatically to a word net which will be used with the Viterbi of the HVite tool.
5.2.3 The Experiment and Preliminary Result from the HTK Toolkit
Once we have recorded the speech files, prepared the data and generated the pronunciation
dictionary, we follow the steps of the HTK Toolkit for building an acoustic model in order to
conduct the experiment.
There is a set of HTK commands that are executed using a DOS command window. This
requires many steps, each containing multiple commands. In order to effectively conduct the
experiment, a simple bash script was written to run the steps automatically to train the model. In
addition, there are some scripts that can be used for assistance during the experiment.

92
5.2.3.1 Building and Training the Model
We will briefly explain the HTK steps which were applied in order to achieve our aims of
finding the phone boundaries, extracting the required samples and investigating their phonetic
properties.
Bringert (2005) summarises the steps involved in using the HTK to train a model as below:
1. Create phone level transcriptions of the training utterances by using the dictionary.
2. Parametrise the recorded data (the HCopy tool is used for decoding the audio data) using the
settings from the HTK tutorial which are saved in a wav_config file, as shown in Figure 5.6,
with mel frequency cepstral coefficients (MFCCs), 10 ms frames, a 26 channel filter bank, and
an output of 12 MFCCs.
Figure 5.6: Wav_config file
3. Create simple prototype models, and re-estimate them using the data.
4. Use the current models for each word, select the closest pronunciation from the dictionary,
and then re-estimate the models using the new data.
5. Fix and include the silence model for HMM models, a “sp” (short pause) silence model
which refers to the types of short pauses that occur between words in normal speech, and then
use a set of monophone models to build triphone models by copying these monophone models.

93
6. Re-estimate the triphone models, with the transcriptions converted to use triphones. These sets
of triphone models are used for recognition.
7. Create tied-state triphone models, in order to make more robust models. This step requires
decision tree clustering, where models are organised in a tree, the parameters for which are
called questions. The decoder asks a question about the phone context and decides what model to
use.
Of these steps, we omit step 4, since the dictionary that we are using contains a single
pronunciation for each word and hence there is no point in carrying out this step, and we also
omit the use of triphone models, since using triphones brings very little benefit with very small
training sets. After training the model, the next step is to evaluate it. The next section explains
this process.
5.2.3.2 Evaluating the Model
In order to evaluate the recogniser in the usual case, the grammar files will be used and some
more utterances will be recorded. In our case there is no need to record more speech, as the
current data which were used as training material will also be used as test material. This would
not be the correct approach if we were trying to train the HTK as a recogniser, but this is not the
case. We are only interested in determining the point in time when particular phonemes occur in
a speech segment by achieving a forced alignment of the transcription of the audio speech
segment and are not interested in speech recognition in itself. So the steps in this phase will be
slightly different.
The HTK toolkit uses the forced aligner to extract the start and end times of phones from
recordings, which is what we need in order to align our phonemes.
The HVite tool (with -a option) in the HTK Toolkit can be used in the compute forced
alignments mode to select the best matching pronunciations. It computes a new network for each

94
input utterance using the word level transcriptions and a dictionary, and the output transcription
will just contain the words and their boundaries (Young et al., 2002).
5.2.3.3 The Results of Automatic Speech Alignment in the HTK Toolkit
As mentioned in the previous section, time boundaries of phonemes can be obtained directly
using the Viterbi alignment procedure in the HVite tool. This is done by searching time
boundaries for known sequences of HMM models for phonemes.
Figure 5.7: Forced alignment (Young et al., 2002).
Figure 5.8 describes the files used in this stage.
Figure 5.8: The files used in recognising the test data

95
The HTK's HVite command is used as follows:
HVite -A -D -T 1 -H hmm9\macros -H hmm9\hmmdefs -C config -S test.txt -l '*' -m -i
recout.mlf -w wdnet-p 0.0 -s 5.0 lexicon.txt monophones1
Config : configuration file to allow word-internal expansion.
Test.txt :lists the names of the files(MFC).
Recout.mlf :transcription output.
Wnet : compiled grammar network.
Monophones1: the input data to be recognized, containing a list of all phonemes
The parameter, -m, is used to generate model level output transcriptions. The output label file
will contain multiple levels. The first level will be the model number and the second will be the
word name (not the output symbol).
This command uses the definition of the HMMs or monophones models stored in folder hmm9
to transform the input word level transcription words.mlf to the new phone level transcription
aligned.mlf, using the pronunciations stored in the dictionary (lexicon.txt).
The output is the recout.mlf file which is the output recognition transcription file including all
phonemes with timing information. Figure 5.9 shows this file.
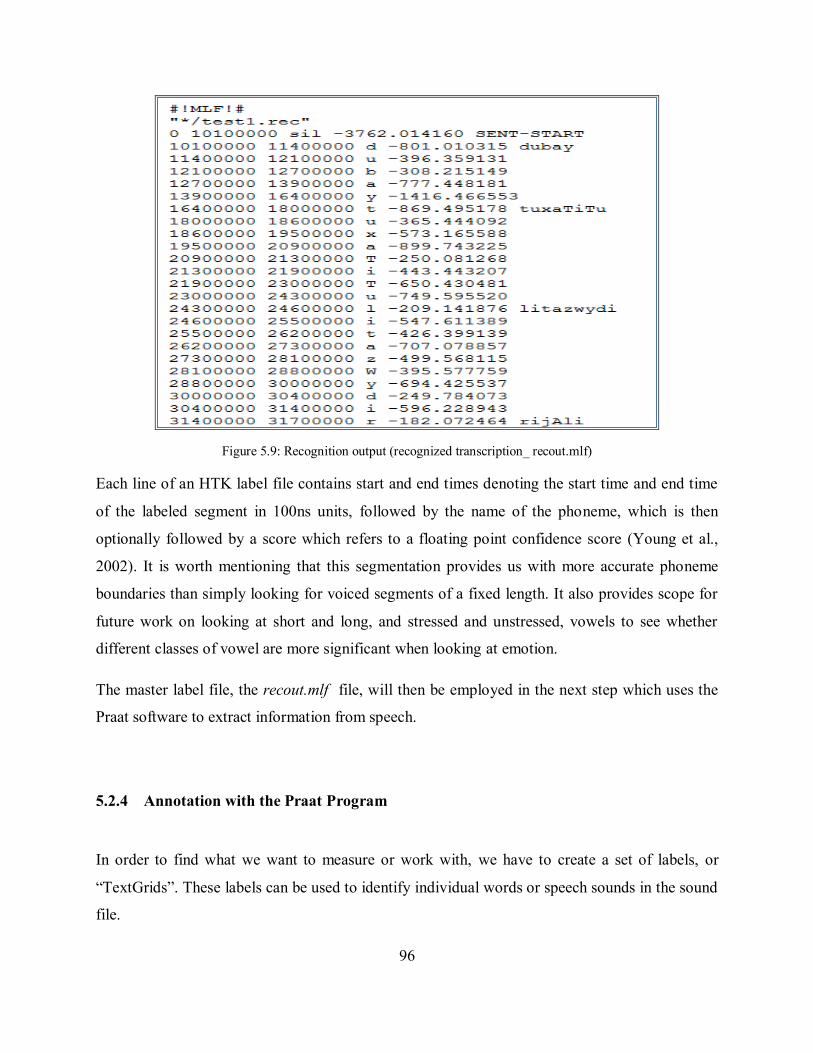
96
Figure 5.9: Recognition output (recognized transcription_ recout.mlf)
Each line of an HTK label file contains start and end times denoting the start time and end time
of the labeled segment in 100ns units, followed by the name of the phoneme, which is then
optionally followed by a score which refers to a floating point confidence score (Young et al.,
2002). It is worth mentioning that this segmentation provides us with more accurate phoneme
boundaries than simply looking for voiced segments of a fixed length. It also provides scope for
future work on looking at short and long, and stressed and unstressed, vowels to see whether
different classes of vowel are more significant when looking at emotion.
The master label file, the recout.mlf file, will then be employed in the next step which uses the
Praat software to extract information from speech.
5.2.4 Annotation with the Praat Program
In order to find what we want to measure or work with, we have to create a set of labels, or
“TextGrids”. These labels can be used to identify individual words or speech sounds in the sound
file.
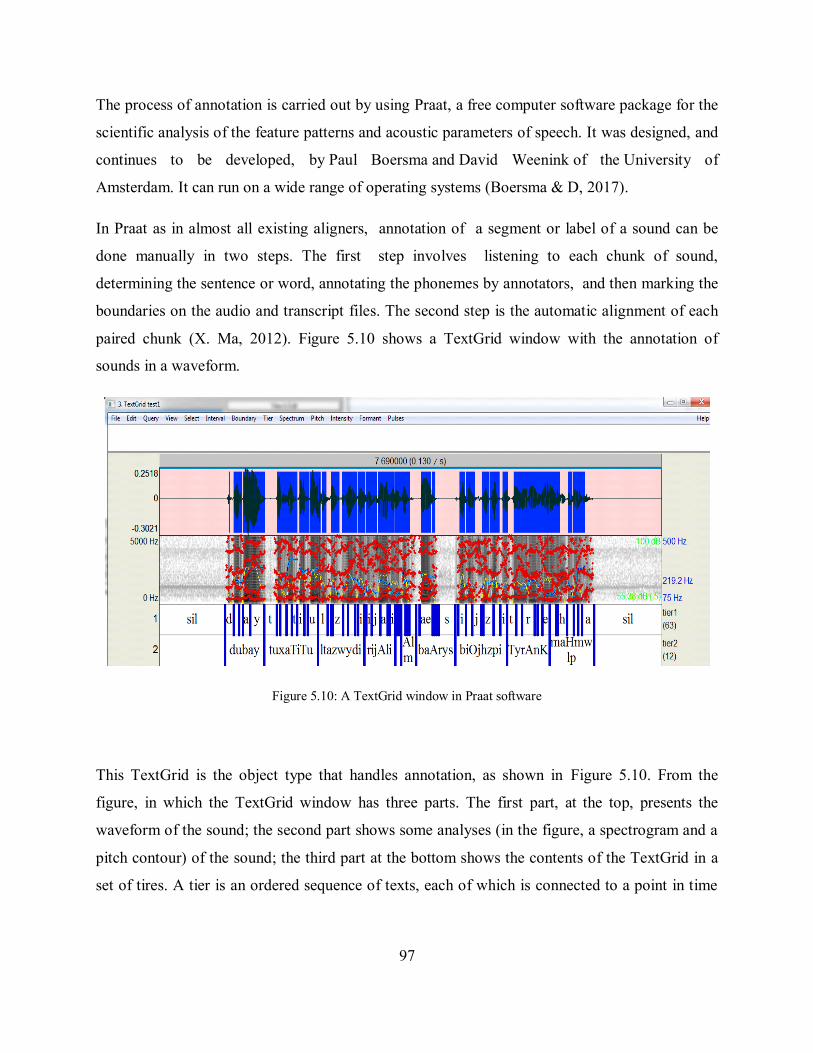
97
The process of annotation is carried out by using Praat, a free computer software package for the
scientific analysis of the feature patterns and acoustic parameters of speech. It was designed, and
continues to be developed, by Paul Boersma and David Weenink of the University of
Amsterdam. It can run on a wide range of operating systems (Boersma & D, 2017).
In Praat as in almost all existing aligners, annotation of a segment or label of a sound can be
done manually in two steps. The first step involves listening to each chunk of sound,
determining the sentence or word, annotating the phonemes by annotators, and then marking the
boundaries on the audio and transcript files. The second step is the automatic alignment of each
paired chunk (X. Ma, 2012). Figure 5.10 shows a TextGrid window with the annotation of
sounds in a waveform.
Figure 5.10: A TextGrid window in Praat software
This TextGrid is the object type that handles annotation, as shown in Figure 5.10. From the
figure, in which the TextGrid window has three parts. The first part, at the top, presents the
waveform of the sound; the second part shows some analyses (in the figure, a spectrogram and a
pitch contour) of the sound; the third part at the bottom shows the contents of the TextGrid in a
set of tires. A tier is an ordered sequence of texts, each of which is connected to a point in time
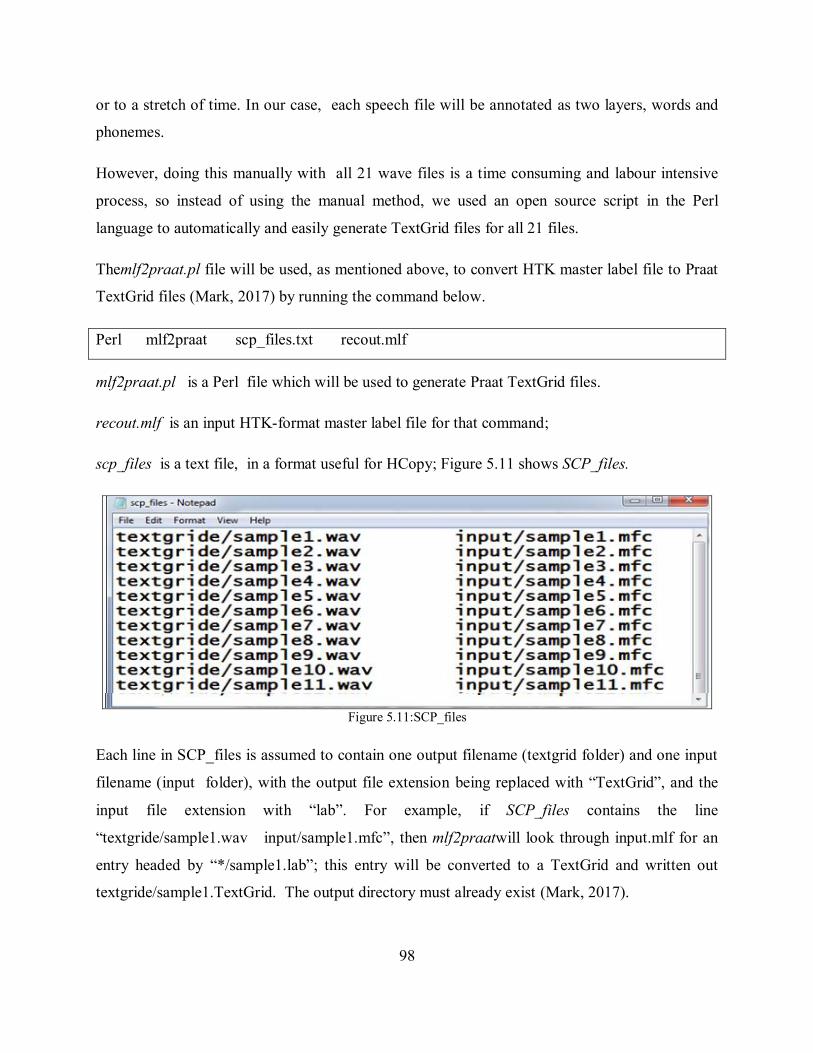
98
or to a stretch of time. In our case, each speech file will be annotated as two layers, words and
phonemes.
However, doing this manually with all 21 wave files is a time consuming and labour intensive
process, so instead of using the manual method, we used an open source script in the Perl
language to automatically and easily generate TextGrid files for all 21 files.
Themlf2praat.pl file will be used, as mentioned above, to convert HTK master label file to Praat
TextGrid files (Mark, 2017) by running the command below.
Perl mlf2praat scp_files.txt recout.mlf
mlf2praat.pl is a Perl file which will be used to generate Praat TextGrid files.
recout.mlf is an input HTK-format master label file for that command;
scp_files is a text file, in a format useful for HCopy; Figure 5.11 shows SCP_files.
Figure 5.11:SCP_files
Each line in SCP_files is assumed to contain one output filename (textgrid folder) and one input
filename (input folder), with the output file extension being replaced with “TextGrid”, and the
input file extension with “lab”. For example, if SCP_files contains the line
“textgride/sample1.wav input/sample1.mfc”, then mlf2praatwill look through input.mlf for an
entry headed by “*/sample1.lab”; this entry will be converted to a TextGrid and written out
textgride/sample1.TextGrid. The output directory must already exist (Mark, 2017).

99
Thus, the result of this step is a set of TextGrid files; for example, Figure 5.12 shows one of
these files.
Figure 5.12: TextGrid file of sample1.wav
5.3 Extraction of Prosodic Features
A speaker’s emotional speech holds a set of features. Exactly which features are the best for
identifying emotions is still an open question. However, the changes in these features will result
from a corresponding change in emotions. Therefore, extraction of these speech parameters
which represent emotions is an important factor in emotional speech recognition and synthesis
systems (Tawari & Trivedi, 2010).
What we do know is that features such as duration (measures the length of the signals), pitch
(the fundamental frequency of audio signals) and intensity (measures the power of the signal)
have been identified as important elements of emotional speech and are the most useful and
widely used features (Levin & Lord, 1975; Nwe, Foo, & De Silva, 2003; Ververidis &
Kotropoulos, 2006; C. E. Williams & Stevens, 1972).
Because of the importance of these features in identifying emotion and as the primary indicators
for detecting an unknown speaker’s emotional state, prosodic features such as duration, pitch

100
and intensity are extracted and analysed using speech analysis and the manipulation tool, Praat,
and labeled chunks of phonemes.
By using Praat we are able to obtain all of the information about these features. We are using
three modified Praat scripts which are available online (Mietta, 2017).These scripts look through
two folders, the first folder being a wav file and the second a TextGrid folder (as obtained from
the step above), open each sound and TextGrid pair, and extract the desired information about
each labeled interval. The resulting alignments from running these scripts are a set of separate
TextGrid files in text file format for word and phoneme segmentation. After obtaining these files
we run a Python program, to merge and write these three text files to one tab-delimited text file
(csv), which we can work with easily. The output is illustrated as a Screenshot in Figure 5.13.
Figure 5.13: The extracted information
As shown in Figure 5.13, we have all of the features for our samples, the first column refers to
the name of an audio file (type of expression); and the second column refers to the phones, while
the remaining columns show the statistical values (mean, median, maximum, minimum) of the
obtained of pitch, duration and intensity features.

101
The CSV file obtained above as an output is still not labeled. So we manipulate this file to have a
suitable structure for our experiments, for example by changing the first column, which contains
the names of files, by running a Python program to label suitable expressions. This code will
read the name of the file and will add a label to the end of the CSV file corresponding to the third
character of the filename. This will be done for every WAV file in the database and the results
will be saved as a database of features. Each one of the WAV files from the database has the
name of an audio file ending with a code for the emotions, from E00 to E03. For example,
S00E00 is the first audio file that expresses neutral emotion for sentence number one, as shown
in Figure 5.14.
Figure 5.14: CSV file with suitable names for recorded data.
Next, a Python program is written to modify the resulting file to a suitable format that is
accessible for a machine learning algorithm. We run the Python program to achieve the
following tasks:
Extracting the desired columns in the CSV file and the target phones;
Identifying the target class and putting this in the last column;
Replacing the “undefined” values with a question mark (?), which indicates an unknown
or missing value;
Extracting acoustic properties of particular segments.

102
In our case, we think that the segments which are interesting to look at are voiced sounds,
because voiced phonemes most clearly carry the important information about the acoustic
features of emotional speech, especially pitch, but to a lesser extent, intensity and duration. Stop
consonants in particular have low duration and intensity, and hence seem to be unlikely
candidates for carrying information about emotion. There are many Arabic sounds which are
voiced but we think that the most clearly voiced segments are vowels -- voiced stop consonants
such as /b/ and /d/, for instance, have essentially zero duration and intensity, and consequently
also have no detectable pitch. The result of the process of excluding all non-vowels from analysis
is as follows:
Figure 5.15:First lines of the features database from CSV file.
The first column of Figure 5.15 shows that only three vowels (u, a and i ) have been selected
after excluding all non-vowel sounds. Unlike English and many other languages, Arabic only has
three vowels, with a short and long version of each as mentioned in Section 3.2.1, these vowels
are associated with four emotions along with values of the three features, pitch, duration and
intensity.

103
5.4 Summary
In this chapter we have described two processes for extraction of acoustic features of Arabic
emotional speech; these are the annotation and extraction processes. We have briefly highlighted
the theoretical background of the HTK Toolkit and the requirements for conducting our
experiment for automatically obtaining the time domain phonemes for each utterance using
adapted HMM models trained by the HTK Toolkit. We then extracted the acoustic properties,
namely pitch, intensity and duration, of speech associated with four different emotions (neutral
state, happiness, sadness and anger). All manipulation of extracted features was performed using
scripts from the Praat software.
From the above investigation of the acoustic features of emotional speech, we would like to be
able to classify the emotions based on these features.
In the following chapter, we will investigate how these features can be used for the classification
of emotions in Arabic speech.

104
6. CHAPTER SIX : CLASSIFICATION.
6.1 Introduction
In the previous chapter some prosodic features are extracted using Praat as primary indicators of
the speaker’s emotional state. These features are pitch, intensity and duration of three vowels in
Arabic emotional speech which are then stored in a database where each feature is associated
with its classification label, e.g. neutral, happy, sad or angry.
The classification simply consists of using a set of previous observations obtained in order to
determine the category of a new observation or a sample. Many machine learning algorithms
can be applied to the area of emotion classification, including K-nearest neighbors (KNN),
hidden Markov model (HMM), Gaussian mixtures model (GMM), support vector machine
(SVM) and artificial neural net (ANN). Figure 6.1 shows the framework for the emotion
classification of speech.
Figure 6.1: The framework for the classification of emotional speech
As shown in Figure 6.1, the input to the system is recorded speech of different emotional classes
which are transcribed and labeled, as mentioned in Chapter 5. The features subsequently
extracted(pitch, intensity and duration) from recorded speech, as also mentioned in Chapter 5,
and saved as numbers of values. These specific features will be exploited as input (training set)
to the model of classification (classifier). The output of the classifier is a label of emotion

105
classification of the emotional contents of which are unknown. There are four classes, namely
neutral, happy, sad and angry and each label represents the corresponding emotion classification.
The structure of this chapter is as follows : the experiments used for classifying phonemes
(vowels) in this research are presented in Section 6.2 with experimental results. Classifying
utterances by conducting the experiment and its result is given in Section 6.3. Conclusions are
delivered in Section 6.4.
The next section will present those experiments conducted in order to classify the phonemes for
the dataset.
6.2 Classifying phonemes
Once the features are extracted, they are used to form the feature vector database. Each data
sample in the data base is an instance, i.e., the feature vector, and is used for classification.
In our experiments, open source software called Weka (Waikato Environment for Knowledge
Analysis) is chosen to undertake this process, of which the code and executable are freely
available and issued under license. Weka is a data mining system developed by the University of
Waikato in New Zealand that implements data mining algorithms using JAVA. Weka contains
tools for data pre-processing, classification, regression, clustering, association rules, and
visualisation. It is also well-suited for developing new machine learning schemes (Frank, Hall, &
Witten, 2016)
6.2.1 The experiments and Dataset description
The main objective of the experiments described here is primarily to investigate which of the
features extracted are the most significant for identifying emotion by analysing different
combinations of features at phonemic as well as utterance level. The Weka toolkit was
investigated in order to identify the best algorithm for achieving this task.
106
To find out which features are the most significant, we first have to discover the optimum
algorithm. By looking at the results of each Weka machine learning algorithm scheme, we note
which one has the highest recognition accuracy. Once we have found which one is the most
accurate we use it to identify the most significant features. We chose to use the Leave-One-
Feature-Out (LOFO) technique. In our case, there are four features, Pitch, Duration, Intensity and
Phone, and these are extracted in accordance with our aim, which is to provide more information
on which features are more important for speech emotion identification.
We also investigated the effect of including or excluding neutral emotion on our result, because
there will be some overlap between neutral emotion and other emotions as shown in the result of
human judgment evaluation in Chapter 4. Recall that in some cases subjects annotated utterances
as a mixture of neutral and some other emotion, which was presumably a way of indicating that
the degree to which the utterance expressed the non-neutral emotion. We decided to conduct this
experiment to investigate the possibility that if we dropped neutral emotion (E00) from our
dataset, a more noticeable increase in accuracy could be gained than we first expected.
Therefore, this experiment will be divided into three parts. Experiment I presents the process for
evaluating the effectiveness of different selected classification algorithms, Experiment II
introduces the result of choosing different subsets of features on the accuracy of the performance
of the classifier to be selected for investigation. Experiment III will present the result of
including or excluding the neutral emotion (E00).
Dataset description
The ARFF file format is the data file normally used by Weka, which consists of special tags to
indicate different elements in the data file such as attribute names, attribute types, attribute
values and the data. Our dataset which uses ARFF File format is shown in Figure 6.2.

107
Figure 6.2: ARFF file of our dataset
The file consists the following information:
- The name of the dataset
- A header which describes the attribute and its types, such as:
phone {u ,a, i} : nominal
mean_pitch (Hz) : numeric
Avg_Int (dB) : numeric
duration (Seconds) : numeric
− Data section, containing one row for each wav file. The rows have the features of that sample
separated by commas and in the last position there is the label indicating its emotion. An
example of a row is: u, 222.634491, 69.970205, 0.07, E00 which refers to feature1; feature2;
feature3; feature4;emotion label, respectively.
The dataset used in this experiment contains four features (Pitch, Intensity, Duration, Phone)
with a target class of emotions called (txt). Target class (txt) with values {E00, E01, E02, E03}
where E00 refers to Neutral emotion, E01 is Happiness, E02 is Sadness and E03 is Anger. as
shown in Table 6.1.

108
Attribute Type of Attribute
Possible values Missing values
Mean Std.Dev
Phone Nominal i, u, a (Vowels) No - - Pitch Numeric Positive number No 214.444 45.866 Intensity Numeric Positive number No 63.004 7.127
Duration Numeric Positive number No 0.067 0.039
Txt (target class) Nominal E00, E01, E02, E03 No - - Table 6.1: dataset attribute information
The dataset contains 418 instances, as shown in Table 6.2, where each instance consists of a
number of attributes representing details of prosodic information for one vowel in each
expressed emotion.
Emotions Utterances
E00 E01 E02 E03
S00 *** ***
S01
S02
S03
S04
S05 ***
No. Instances 102 116 116 84 Total = 418
Table 6.2: The expressive utterances used of our dataset
As shown in Table 6.2, six utterances S00,S01,..S05 where each recorded with four emotions
(E00, E01, E02, E03) meaning that 24 utterances were recorded.
However, when we validated the data by asking human subjects to classify the various
utterances, three utterances (S00:E00, S00:E03 and S05:E03) were not assigned the expected
emotions. We therefore excluded these utterances from the experiments: if human subjects were
unable to identify them as expressing the intended emotions then using them as training data
would provide misleading clues to the classifier, and using them as test data would also be
inappropriate.

109
6.2.2 Experiment I : Performance Evaluation of a set of classifiers
As mentioned before, the Weka Toolkit contains a number of different machine learning
algorithms. Trying to use all these algorithms is very time consuming. So we have to choose one
or two suitable algorithms rather than using all of them. However, it is worth working out which
algorithm is best by looking at its various features in some detail. Finding the best machine
learning algorithm raises the challenge of applied machine learning; however, Weka makes that
task more easy by providing built-in options that enable us to run lots of algorithms on the same
data. So once we have tested a set of algorithms from the Weka toolkit on our dataset, we can
identify the one with the best performance and use this in our experiments. It is worth
mentioning here that examining the reasons why one algorithm outperforms another is outside
the scope of this thesis.
The process of identifying the best algorithm or classifier in general is as follows:
1. Design an experiment including the dataset and any data preparation as well as the test
options, using 10-fold cross validation; this usually gives a good estimate of the accuracy
of an algorithm: cross-validation, a standard evaluation technique, is a systematic way of
running repeated percentage splits.
Having 10 folds means 90% of full data is used for training (and 10% for
testing) in each fold. Having more folds means that more of the data is used for training
in each fold, thus increasing the accuracy of the trained model, but at the same time it
means that it is necessary to train and test more models -- using 5 folds would involve
only having 80% of the data for training, but you would only have to carry out five
rounds of training and testing. With small amounts of data doing 10-fold cross validation
is a reasonable compromise, since if you only have a small amount of data then you want
to use as much of it as you can for training in each round, but training and testing will be
reasonably fast and hence having 10 rounds will not take an excessive amount of time.
2. Conduct the experiment on all features of our dataset based on phoneme level along with
selecting a set of different algorithms to be applied to our dataset.
3. Analyse the results and identify the best scoring achieved by algorithms in general.
4. Select one algorithm to be applied in the next experiment.

110
The algorithms that we use will be briefly explained in the following section in terms of how
they work.
6.2.2.1 Classifiers Used
The classifiers in WEKA are categorized into different groups such as classifiers that extract
rules, trees-based classifiers, classifiers that make use of Bayesian interface, and other
miscellaneous classifiers.
Rule-based classification
In rule-based classification, a set of (if-then-else) rules are used for classification. An if-then
rule is an expression of the form IF condition THEN conclusion In the above expression the
“IF”-part of a rule is known as the rule antecedent or precondition. And the “THEN”- part is the
rule consequent. In the rule antecedent, the condition consists of one or more attribute tests that
are logically ANDed.
The rule’s consequent contains a class prediction. If the condition in a rule antecedent holds true
for a given tuple, we say that the rule antecedent is satisfied and that the rule covers the tuple .
For example, if we are predicting that whether a student will get admission in ph.d or not, then
R1 can be written as R1: (age = 25) ^ (post graduate = yes)) (get admission in PhD = yes).
Five variants are discussed in the following subsections
DecisionTable : builds a decision table classifier. It evaluates feature subsets using best-
first search and can use cross-validation for evaluation. An option uses the nearest-
neighbor method to determine the class for each instance that is not covered by a decision
table entry, instead of the table’s global majority, based on the same set of features.
JRip: implements Ripper algorithm, it is one of the basic and most popular algorithms
which including heuristic global optimization of the rule set. Classes are examined in
increasing size and an initial set of rules for the class is generated using incremental
reduced error. JRip (RIPPER) proceeds by treating all the examples of a particular
judgment in the training data as a class, and finding a set of rules that cover all the

111
members of that class. Thereafter it proceeds to the next class and does the same,
repeating this until all classes have been covered.
OneR : short for "One Rule", is a simple classification scheme based on the value of a
single predictor, that generates one rule for each predictor in the data, and then selects the
rule with the smallest total error as its "one rule". To create a rule for a predictor, we have
to construct a frequency table for each predictor against the target. target. OneR provides
a useful baseline -- any reasonable algorithm ought to beat OneR.
Part : obtains rules from partial decision trees. The algorithm producing sets of rules
called "decision lists". It builds the tree using C4.5’s heuristics with the same user-
defined parameters as J4.8, it uses the separate-and-conquer strategy, where it builds a
rule in that manner and removes the instances it covers, and continues creating rules
recursively for the remaining instances(Frank & Witten, 1998).
ZeroR: is the simplest classification method which relies on the target and ignores all
predictors. ZeroR classifier simply predicts the majority category (class). Although there
is no predictive power in ZeroR, it is useful for determining a baseline performance as a
benchmark for other classification methods (Witten, Frank, Hall, & Pal, 2016).
Decision Tree Based Classification A decision tree is a flowchart-like tree structure, it is one of the predictive modeling approaches
used in statistics, data mining and machine learning. In decision analysis, a decision tree can be
used to visually and explicitly represent decisions and decision making. In data mining, a
decision tree describes data but not decisions; rather the resulting classification tree can be an
input for decision making (Fathima, Manimegalai, & Hundewale, 2011).
Decision tree learning uses a decision tree as a predictive model which maps observations about
an item to conclusions about the item's target value.
In these tree structures, each internal node denotes a test on an attribute, each branch represents
a result of the test, and each leaf node holds a class label. The topmost node in a tree is the root
node. We can simply obtain the rules related to the tree by traversing each leaf of the tree starting
from the node. Figure 6.3 show the shape of a decision tree.

112
Figure 6.3: Decision tree algorithm
Most decision tree classifiers perform classification in two phases: tree-growing (or building)
and tree-pruning. The tree building is done in a top-down manner. During this phase the tree is
recursively partitioned till all the data items belong to the same class label. In the tree pruning
phase the full grown tree is cut back to prevent over fitting and improve the accuracy of the tree
in bottom up fashion.
There are many specific decision-tree algorithms. Notable ones includeID3, J48 (C4.5), C5, and
REPTree (CART). As the name implies, this technique recursively separates observations in
branches to construct a tree for the purpose of improving the prediction accuracy.
Decision trees are widely used as they are easy to interpret and are not restricted to functions
that can be represented by rule "If-then-else" condition.
DecisionStump: is basically a one level decision tree, designed for use with the boosting
methods, which builds one-level binary decision trees for datasets with a categorical or
numeric class, dealing with missing values by treating them as a separate value and
extending a third branch from the stump. Trees built by RandomTree consider a given
number of random features at each node, performing no pruning.
HoeffdingTree: is an implementation of the incremental decision tree algorithm . It offers
options to create splits based on information gain or the Gini index. Predictions at the
leaves of the tree can be made by either majority class or naive Bayes models.

113
J48 : is an optimized implementation of the C4.5 decision tree learner or improved
version of the C4.5 is an efficient method for estimation and classification of fuzzy data.
The output given by J48 is the Decision tree (Quinlan, 2014).
LMT: A classification model with an associated supervised training algorithm that
combines logistic prediction and decision tree learning is logistic model tree (LMT)
(Landwehr, Hall, & Frank, 2005) . Logistic model trees use a decision tree that has linear
regression models at its leaves to provide a section wise linear regression model.
RandomForest: are defined as a group of un-pruned classification or regression trees,
trained on bootstrap samples of the training data using random feature selection in the
process of tree generation. After a large number of trees have been generated, each tree
votes for the most popular class. These tree voting procedures are collectively defined as
random forests. RF has excellent accuracy among current classifier algorithms. It also has
an effective method for estimating missing data and it maintains accuracy when a large
proportion of the data are missing.
RandomTree: it is an ensemble learning algorithm that generates lots of individual
learners. It employs a bagging idea to construct a random set of data for constructing a
decision tree. In standard tree every node is split using the best split among all variables.
In a random forest, every node is split using the best among the subset of predicators
randomly chosen at that node (Landwehr et al., 2005).
REPTree: builds a decision or regression tree using information gain/variance reduction
and prunes it using reduced-error pruning. Optimized for speed, it only sorts values for
numeric attributes once. It deals with missing values by splitting instances into pieces, as
C4.5 does.
Bayesian based classification Bayesian classification is based upon Bayes’ probability rules and depends on likelihood
functions. Four variants are discussed in following subsections.
Simple Bayes’ Classification : bayesian networks are a powerful probabilistic
representation. Bayesian algorithms predict class membership probabilities, such as the
probability that a given tuple belongs to a particular class. It learns from training data the

114
conditional probability of each attribute Ai given the class label C. Classification is then
done by applying Bayes’ rule (based on Bayes’ theorem) to compute the probability of C
given the particular instances of A1...An and then predicting the class with the highest
posterior probability (Domingos & Pazzani, 1997). This Bayesian Network consists of
two components. First component is mainly a directed acyclic graph (DAG) in which the
nodes in the graph are called the random variables and the edges between the nodes or
random variables represents the probabilistic dependencies among the corresponding
random variables. Second component is a set of parameters that describe the conditional
probability of each variable given its parents. The conditional dependencies in the graph
are estimated by statistical and computational methods. Thus the BN combine the
properties of computer science and statistics. Probabilistic models Predict multiple
hypotheses, weighted by their probabilities.
BayesNet : Probabilistic graphical model that represents random variables and
conditional dependencies in the form of a directed acyclic graph. A Simple Estimator
algorithm has been used for finding conditional probability tables for Bayes net. A K2
search algorithm was used to search network structure.
Naive Bayes: The Naive Bayes classifier is based on Bayes’ Theorem with independent
assumptions between predictors. Naive Bayesian model is easy to build without
complicated iterative parameter estimation. It analyzes all the attributes in the data
individually, which means the value of a predictor (X) on a given (C) is independent of
the values of other predictors. This assumption is called class conditional independence.
In almost all cases this assumption is not valid, which has significant effects on the
reliability of classifiers based on Bayes’ Theorem.
Other miscellaneous classification
MultilayerPerceptron (MLP) is one of the most common neural network models, it is a
class of feed forward artificial neural network that is trained using back propagation that
maps sets of input data onto a set of appropriate outputs. An MLP consists of multiple

115
layers of nodes at least three layers in a directed graph with each layer fully connected to
the next one. Except for the input nodes, each node is a neuron (or processing element)
with a nonlinear activation function. It can distinguish data that is not linearly separable
(Van Der Malsburg, 1986).
The graphical representation of MLP is shown in Figure 6.4 with one input layer, one
hidden layer and one output layer.
Figure 6.4: Multilayer Perceptron
MLPs are very flexible about incomplete, missing and noisy data. It can be updated with
fresh data and implemented in parallel hardware. When an element of this algorithm fails,
it can continue without any problem due to its parallel nature. They are useful in research
for their ability to solve problems stochastically, which often allows approximate
solutions for extremely complex problems. Also they can be used to create mathematical
models by regression analysis (Mallios, Papageorgiou, & Samarinas, 2011).6
Simple Logistics, It is a classifier used for building linear logistic regression models.
LogitBoost with simple regression functions are base learners used for fitting the logistic
models. The optimal number of LogitBoost iterations to perform is cross-validated,
which leads to automatic attribute selection (Landwehr et al., 2005).
6 Multilayer perceptron. (accessed 2018). Retrieved from: https://en.wikipedia.org/wiki/Multilayer_perceptron

116
SMO: Sequential Minimal Optimization (SMO) is used for training a support vector
classifier using polynomial or RBF kernels. It replaces all missing the values and
transforms nominal attributes into binary ones (Keerthi, Shevade, Bhattacharyya, &
Murthy, 2001). A single hidden layer neural network uses exactly the same form of
model as an SVM. k-Nearest Neighbor (IBk) One of the simplest forms of classification algorithms is
Nearest Neighbor implementations, the number of nearest neighbors (k) can be set
manually, or determined automatically using cross-validation. Such learning schemes are
depicted as statistical learning algorithms and are generated by simply storing the given
data. For the classification to be performed a distance metric is chosen and any new data
is compared against all-ready “memorized” data items. The new item is assigned to the
class which is most common amongst its k nearest neighbors (Coomans & Massart,
1982).
K-Star: K star is one of the nearest neighbour lazy learning classification method with
generalized based on transformations. It provides a reliable approach to handle symbolic
attributes, real valued attributes and missing values. Space required for the storage is very
large as compared to other algorithms and it is generally slower in evaluating the result.
Advantages of K-star: It is robust to noisy training data and it is more effective when
applied on large data set.
The results of carrying out this experiment, which is based on these algorithms, are presented in
the following section. It should be noted that our data is a mixture of features with numerical
values and the categorical feature ‘phone’. All the classifiers we have used can cope with
categorical data so long as it is so labelled in the training file.

117
6.2.2.2 Experimental results of Experiment I
Table 6.3 shows the results of the experiment aimed at finding the best classifier for our task.
Machine learning algorithms
The features are used Pitch, Intensity, Duration, Phone
(Correctly Classified Instances %)
Rules
DecisionTable 43
JRip 39
OneR 30
PART 33
ZeroR 27
Trees
DecisionStump 40
HoeffdingTree 41
J48 37
LMT 40
RandomForest 34
RandomTree 33
PEPTree 41
Bayes
BayesNet 42
NaiveBayes 41
Other miscellaneous classifiers
Logistic 42
MultilayerPerceptron 39
SimpleLogistic 40
SMO 41
IBk 30
KStar 33
Table 6.3: The features are used in each experiment with different learning algorithms

118
The first column shows a list of machine learning algorithms of the Weka toolkit from four
groups which are Rules, Trees, Bayes and other miscellaneous classifiers. The second column
shows the features used. In this first case, all features are used because in this phase we are
interested in finding the best algorithm for our experiment. The values refer to the correctly
classified instances of each experiment in percentage terms.
We make a comparison of all these algorithms to assess their performance; we use the default
settings for all the algorithms analysed.
The distribution of phonemes to emotions in our dataset is 102 examples of Neutral, 116 of
Happiness,116 of Sadness and 84 of Anger. This means that simply classifying every sentence as
Happy or Sad would score 27% (which is indeed the score returned by ZeroR).
Based on Table 6.3, we can clearly see that the performances accuracy of number of algorithms
are around or just over 40%. It is worth noting that Random Forest and Random Tree, which are
normally regarded as very effective algorithms, score poorly in these experiments. These
algorithms perform well when there are large numbers of features, since it can be difficult to
determine which features are the most significant. Given that we have a fairly small set of
features, the advantages of these algorithms are lost when they are applied to our data.
The performance scores reported in the table above are based on measure of the accuracy of
these classifiers, accuracy simply treats all examples the same and reports a percentage of correct
responses and that would be fine when we are dealing with balanced (or approximately balanced)
datasets.
Although the vast majority of research results and practical projects report that accuracy is the
default metric. We think that the classification accuracy alone may be not enough information to
make the decision of which classifier is the best for our experiments, especially given that we are
dealing with unbalanced datasets. So we are going to use other measures in order to evaluate that
numbers of classifiers and in the end choose one to carry out our experiments. In order to do that
firstly, the classifiers with higher score from each group will be chosen from Table 6.3, secondly,
these classifiers will be tested by a set of statistical measures in WEKA.

119
Approach followed:
Five algorithms are considered for evaluation which had the higher score in their groups
as listed in Table 6.3, they include:
i. Rules. DecisionTable
ii. Trees. HoeffdingTree
iii. Tree. PEPTree
iv. Bayes. BayesNet
v. Functions. Logistic
Weka tool is used for an experimental study, where Weka allows us to perform statistical
tests through the Experiment Environment interface on the different performance
measures in order to draw conclusions from the experiment. Figure 6.5 shows the
Experiment Environment window of Weka.
Figure 6.5: Experiment Environment window
Figure 6.5 gives analysis of all five algorithms experiment test, where the number of
result lines available (Got 500 results) is shown in the Source panel. This experiment
consisted of 100 runs, for 5 schemes, for 1 dataset, for a total of 500 result lines.

120
10 fold cross validation is used in this experimental study(as described earlier in section
6.2.2). The final accuracy of an algorithm will be the average of the 10 trails. There are
418 instances in our Dataset. Using 10 fold cross validation to evaluate the algorithms,
each fold will comprise of 376 training samples and 42 test samples,10 fold cross
validation is repeated ten times and results are averaged.
A corrected resampled paired t-test is performed via Weka analysis toolbar for claiming
which of these applied classifiers are better, it will compare each algorithm in pairs and
make some reasonable assumptions about the distribution of the results collected, such as
that they are drawn from a Gaussian distribution. Also by taking into account both mean
and variance of the differences between these two measures over several runs, it
calculates a t value. Using this value and desired significance level (normally 5%), the
probability that these two measurements are significantly different can be obtained by
looking at result; there are some annotations such as “v” or “*” which appear next to any
classifier results in the table which indicate that a specific result is statistically better (v)
or worse (*) than the baseline scheme (in our case, DecisionTable) at that significance
level specified (currently 0.05)
Two performance parameters will be considered for experimental evaluation:
i. Accuracy which is what we are interested in as a first pass. Also there are other
options we can use to evaluate the performance of the classifiers such as TP rate ,
FP rate, Precision, Recall, F- Measure, Kappa statistic, these measurements are
partitioned in numeric and percentage.
ii. Error rate: there are some error measures which are used to find out how far way
the predicted value is from actual known value, such as mean absolute error and
root mean squared error which are in numeric value only. Also there are the
relative absolute error and root relative squared error which are show in
percentage for references and evaluation.
The next sections show these measurements and their results.

121
Accuracy Parameters.
Accuracy: Accuracy defines percentage of correctly classified instances from the test set by the
classifier. For accuracy measurement six parameters are considered:
TP Rate: True Positive rate is proportion of examples which were classified as a class X
among all examples which truly have the X class. This shows how much the part of the
class is truly captured.
FP Rate: False Positive rate is the proportion of the examples which were incorrectly
identified and belong to another class.
Precision: is the proportion of examples which truly have class X among all those which
were classified as X. It is a measure of exactness. Positive predictive value is called as
precision: PPV= TP/TP+FP
Recall: is the proportion of examples which were classified as class X among all
examples which truly have class X. It is a measure of completeness. Negative predictive
value is called as recall: NPV= TP/TP+FN
F- measure, is a measure of a test's accuracy and is defined as the weighted harmonic
mean of the precision and recall of the test, in other words, It is combination of both
precision and recall. F-score is calculated as following:
F-score = 2 * Precision * Recall / (Precision + Recall)
Kappa statistic: is a measure of how closely the instances classified by the machine
learning classifier matched the data labeled as ground truth, controlling for the accuracy
of a random classifier as measured by the expected accuracy. Kappa result varies between
0 to 1 intervals. Higher the value of Kappa means stronger the agreement.
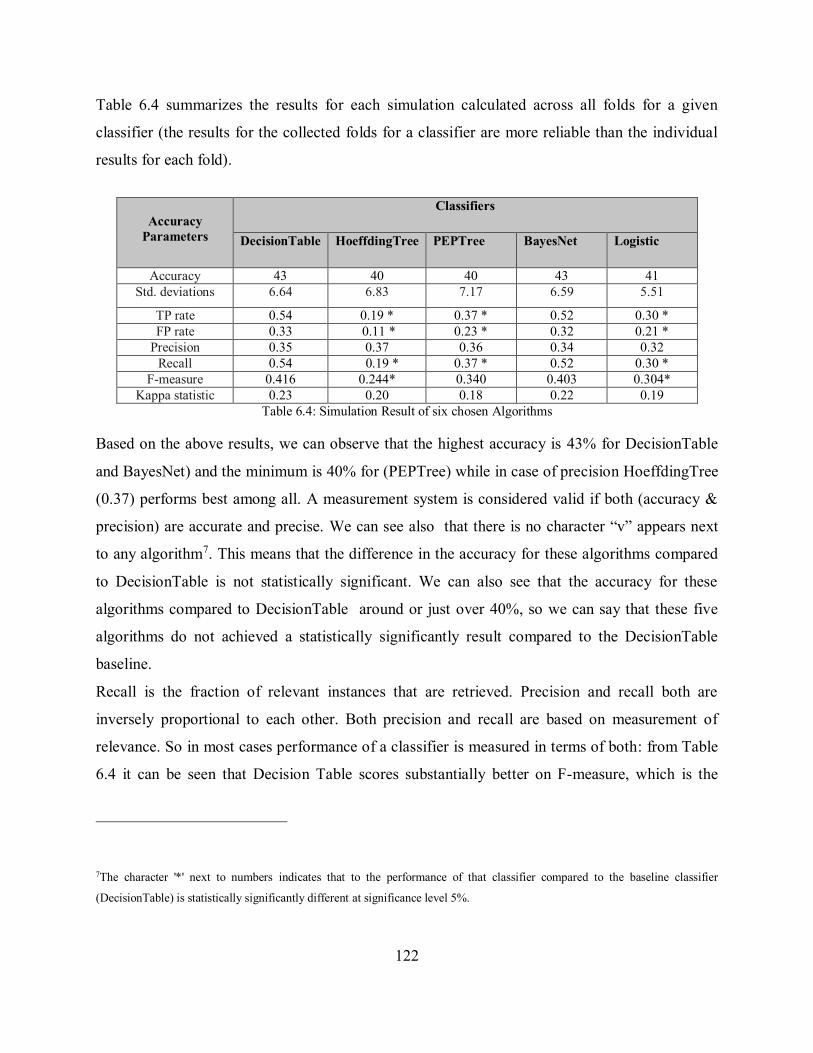
122
Table 6.4 summarizes the results for each simulation calculated across all folds for a given
classifier (the results for the collected folds for a classifier are more reliable than the individual
results for each fold).
Accuracy
Parameters
Classifiers
DecisionTable HoeffdingTree PEPTree BayesNet Logistic
Accuracy 43 40 40 43 41 Std. deviations 6.64 6.83 7.17 6.59 5.51
TP rate 0.54 0.19 * 0.37 * 0.52 0.30 * FP rate 0.33 0.11 * 0.23 * 0.32 0.21 *
Precision 0.35 0.37 0.36 0.34 0.32 Recall 0.54 0.19 * 0.37 * 0.52 0.30 *
F-measure 0.416 0.244* 0.340 0.403 0.304* Kappa statistic 0.23 0.20 0.18 0.22 0.19
Table 6.4: Simulation Result of six chosen Algorithms
Based on the above results, we can observe that the highest accuracy is 43% for DecisionTable
and BayesNet) and the minimum is 40% for (PEPTree) while in case of precision HoeffdingTree
(0.37) performs best among all. A measurement system is considered valid if both (accuracy &
precision) are accurate and precise. We can see also that there is no character “v” appears next
to any algorithm7. This means that the difference in the accuracy for these algorithms compared
to DecisionTable is not statistically significant. We can also see that the accuracy for these
algorithms compared to DecisionTable around or just over 40%, so we can say that these five
algorithms do not achieved a statistically significantly result compared to the DecisionTable
baseline.
Recall is the fraction of relevant instances that are retrieved. Precision and recall both are
inversely proportional to each other. Both precision and recall are based on measurement of
relevance. So in most cases performance of a classifier is measured in terms of both: from Table
6.4 it can be seen that Decision Table scores substantially better on F-measure, which is the
7The character '*' next to numbers indicates that to the performance of that classifier compared to the baseline classifier
(DecisionTable) is statistically significantly different at significance level 5%.

123
standard compromise between precision and recall, and for that reason we use this algorithm in
the later experiments.
Error Rate Evaluation Parameters.
The error measures used to find out how far off the predicted value is from the actual known
value. There are four parameters of error measurement:
o MAE Mean absolute error
o RMSE Root mean squared error
o RAE Relative absolute error
o RRSE Root relative squared error
Mean absolute error (MAE) measures the average magnitude of the errors in a set of
forecasts, without considering their direction. It measures accuracy for continuous
variables. Expressed in words, the MAE is the average over the verification sample of the
absolute values of the differences between forecast and the corresponding observation.
The MAE is a linear score which means that all the individual differences are weighted
equally in the average.
Root mean squared error (RMSE) is a quadratic scoring rule which measures the average
magnitude of the error. Expressing the formula in words, the difference between forecast
and corresponding observed values are each squared and then averaged over the sample.
Finally, the square root of the average is taken. Since the errors are squared before they
are averaged, the RMSE gives a relatively high weight to large errors. This means the
RMSE is most useful when large errors are particularly undesirable. Alternatively, the
relative errors are also used.
Loss functions measure the error between and the predicted value . The most common
loss functions are (Han, Pei, & Kamber, 2011):
Absolute error:|yi − yi′|
Squared error: (yi − yi′)2
Based on the above methods, the error rate is the average loss over the test set.

124
Mean absolute error:∑ |yi −yi′|d
i=1
d
Mean squared error:∑ (yi−yi′ )
2di=1
d
The mean squared error exaggerates the presence of outliers, while the mean absolute
error does not. If we take the square root of the mean squared error, the resulting error
measure is called the Root Mean Squared Error (RMSE).
The formula is defined as
Relative absolute error (RAE):∑ |yi−yi′ |d
i=1
∑ |yi−y|di=1
Relative squared error (RSE): ∑ (yi−yi′ )
2di=1
∑ (yi−y)2di=1
Where ��is the mean value of the𝑦𝑖′s of the raining data,�� =
∑ 𝑦𝑖 𝑡𝑖=1
𝑑
Table 6.5 shows simulation errors of each classifier.
Error Rate Parameters
Classifiers
DecisionTable HoeffdingTree PEPTree BayesNet Logistic
MAE 0.35 0.33 * 0.34 0.34 0.33 * RMSE 0.42 0.42 0.43 0.42 0.41 * RAE % 93 89 91 92 91 RRSE% 97.0 97.3 99.5 97.6 95.7 *
Table 6.5: Error Rate Evaluation Parameters for classifiers
MAE : Mean absolute error RMSE: Root mean squared error RAE: Relative absolute error RRSE: Root relative squared error
An algorithm which has a lower error rate will be preferred as it has more powerful classification
capability.
It is discovered from Table 6.5 that the highest error is found of MAE is found of DecisionTable
at 0.35, The rest of them average around 0.338, which is not very different from DecisionTable
rate. Similarly the root mean squared error for DecisionTable is very slightly higher than for
some of the other classifiers.
However, although the scores for Hoeffding Tree and Logistic are marked as being significantly
different from the baseline estimate and the scores for Decision Tree are not so marked, the

125
differences between the error rates for the various classifiers are extremely close and do not
provide compelling evidence for choosing one rather than another.
DecisionTables are much faster to train, which is important when there are a large number of
experiments to be carried out. Given that the difference in accuracy of the various classifiers is
marginal, the speed of DecisionTable training makes this the most attractive option for our
experiments.
6.2.3 Experiment II : Exploring which feature is important
After selecting the best learning algorithm, we need to find out which are the most significant
features in our dataset by applying that algorithm. In order to achieve this aim, we leave out one
of the features each time and see how accurate the classifier is without that feature. So, the
experiment will be repeated many times with a different number of features of our dataset each
time. This is achieved by using different datasets which contain a different number of features in
Weka.
A different dataset shown in Table 6.2 will be used with the selected algorithm to discover which
feature at phone level is more important than others.
The next experiment aims to investigate what the most important feature is for assessing the
emotional clues in speech.

126
6.2.3.1 Dataset Description of Experiment II
In this experiment, we generated five datasets from the original dataset for use in the Leave-One-
Out experiments. The details of each dataset are shown in Table 6.6.
No .EXP Description of Datasets Attributes
EXP #1 Using all features 5 (P ,I ,D , Ph, txt)
EXP #2 Dropping Pitch 4 (I ,D , Ph, txt)
EXP #3 Dropping Intensity 4 (P ,D , Ph, txt)
EXP #4 Dropping Duration 4 (P ,I , Ph, txt)
EXP #5 Dropping Phone 4 (P ,I ,D, txt) Table 6.6: Details of five datasets
The first column refers to the name of experiment, the second column describes each dataset is
used for each experiment, third column describes the features will be used, where Symbols P, I,
D, Ph and txt refer to features Pitch, Intensity, Duration, Phone and target class (txt) of dataset
respectively. The first dataset is the original dataset which contains all the features, and the other
datasets are generated from it by leaving out one of the features. The number of instances of each
dataset is 418.
6.2.3.2 Experimental results of Experiment II
Table 6.7 shows the result of our experiments by using the DecisionTable algorithm.
EXP.NO Feature Name DecisionTable algorithm (Correctly Classified Instances %)
1. Pitch, intensity, duration, phone 43%
2. intensity, duration, phone 38%
3. Pitch, duration, phone 37%
4. Pitch, intensity, phone 42%
5. Pitch, intensity, duration 43%
Table 6.7: The features are used in each experiment with DecisionTable algorithms
The first column in Table 6.7 refers to the number of the experiment with a set of features saved
in the dataset and used in each experiment in the second column.

127
The last column shows the performance scores of the classifier with these features.
Comparing the scores of each experiment, we can see that scores obtained using all features in
our experiment differ from the other experiments conducted with leaving one feature out.
However, with four classes we would expect a score of 0.25 if we simply made random choices
and 0.33 if we used three classes. Also the purpose of this experiment is to show which feature is
useful, and does not matter at this point whether that the classifier is not actually giving good
performance.
The result of conducting Experiment 1 with all the features produces a better score at 43%
compared with using three features which are (I, D, PH) at 38% in EXP 2, (P, D, PH) at 37% in
EXP 3, (P, I, PH) at 42% in EXP 4.And it generates the same score compared with the features
(P, I, D) in EXP 5. However, we observed that the combination of features that exclude pitch or
intensity generate low scores compared with others, in particular, the lowest score is seen when
intensity is absent, which indicates that intensity is the most useful feature. Also, in EXP 5, we
can see from the result of the scores of the experiment in this table that the combination of
features, namely (P, I, D), has the highest score compared with Exp 2, 3 ,4. However, absence of
the phone feature indicates that phone does not make much difference, and as a result is not as
important as a feature. This result is expected due to the fact that, when expressing the emotion
of anger for example, we change the intensity and pitch, and we do that no matter which
phoneme (vowel, in our case) is being uttered. The identity of the individual phonemes is not, of
course, by itself a likely indicator of emotion -- it would, for instance, be extremely surprising if
/a/ were more common in words that express anger than in words that express happiness.
However, it could happen that the ways in which the other features vary across different
emotions depend on which phoneme is being uttered, e.g. that the pitch of /a/ is raised in angry
utterances but that this does not happen with /i/. Given that the machine-learning algorithms we
applied look at combinations of features, it seemed worthwhile to include the identity of the
different phonemes to see whether this was in fact the case. The fact that leaving out the phone
name from the training data has no effect suggests that this is not.
As mentioned above, a set of features which are (P, I, D) in EXP 5 has the same score as using
all combination of features in EXP 1, so we are interested to see what happens if we drop one of

128
the features in this experiment. In other words, we are interested to see the accuracy of the
algorithm with the following pairs of features: (pitch, intensity), (pitch, duration) and (intensity,
duration), and then to see the result of conducting this experiment again with individual features
in order to investigate which one is more important than others individually. Tables 6.8 and 6.9
show the results. We did not carry out experiments with phone and one other feature or phone
by itself (i.e. four of the fifteen non-trivial combinations) because the initial round of
experiments confirms the hypothesis that the phone does not contribute anything useful to the
classification.
EXP.NO Feature Name DecisionTable algorithm (Correctly Classified Instances %)
1. Pitch, intensity
43 %
2. Pitch, duration
37 %
3. Intensity, duration
40 %
Table 6.8: The result of using two features with DecisionTable algorithm
EXP.NO Feature Name DecisionTable algorithm (Correctly Classified Instances %)
1. Pitch
37 %
2. Duration
28 %
3. Intensity
40 %
Table 6.9: The result of using one feature with DecisionTable algorithm
Table 6.8 shows that the pair of features (pitch and intensity) has the higher score with 43 %,
followed by the pair of features (intensity and duration) at 40%.
By comparing this result with the obtained result from Table 6.7, we note that the combination of
three features (pitch, intensity, duration) has the same classification accuracy as the use of two
features (pitch and intensity) at 43% when the duration was dropping. This indicates that
duration is less important than other features. In contrast, a lower score is obtained when the
intensity feature was dropped, as shown when using two features (pitch and duration) at score
37% in Table 6.8.

129
We can observe that including an intensity feature improves performance rather than weakens it.
Furthermore, this finding confirms the result of the previous experiments in Table 6.7.In
addition, from Table 6.9 we can see that the duration has the lowest score at 28%. Because 28%
is barely more than 25%, which is the score we would achieve if we made random choices,
duration is therefore of no use as an indicator.
Comparing Table 6.8 with Table 6.9 shows that the performance of a classifier is the same
whether including or excluding duration in these cases:
Using two features (pitch and duration ) or using pitch only of 37%
Using two features (intensity and duration) or using intensity only of 40%.
This result supports our finding that duration is the least important feature.
Consequently, from our result we can deduce that the importance of features are ordered as
following from highest to lowest: Intensity, Pitch and then Duration.
We can observe that there is no substantial difference in the performance scores when using a
number of different features compared with the use of all the features, so we are going to include
all these features in the next experiments.
Next, we use a confusion matrix table to show the number of predictions for each class compared
to the number of instances that actually belong to each class. This is very useful to get an
overview of the types of mistakes the algorithm made. This done with 10-fold cross validation
for classification of the four different emotional states in our database. Consider the algorithm
DecisionTable under the Rules group running on our dataset in Weka. For our dataset we obtain
four classes and hence we have a 4x4 confusion matrix. The number of correctly classified
instances is the sum of diagonals in the matrix; all others are incorrectly classified. From the
confusion matrix we can see how the four emotions will be classified based on using all features
of phonemes (vowels). Table 6.10 shows the result of this experiment.

130
10 fold cross-valid. Conf.Matrix DecisionTable
PREDICTED CLASS
RECALL(%) N H S A
REAL
CLASS
Neutral ( N ) 53 30 18 1 52
Happiness ( H ) 40 52 22 2 45
Sadness ( S ) 27 15 71 3 61
Anger ( A) 33 19 32 0 0
Precision (%) 35 45 50 0 Acc=43%
Table 6.10: Confusion matrix for DecisionTable obtained with 10 fold cross-validation with using all features
From the confusion matrix table it can be observed that the highest precision and recall are
achieved for the class “Sadness” at 50% and 61% respectively followed by the “Neutral” class,
and the lowest are achieved for the class “Happiness”, while the class “Anger” is not recognised
at all. The classes “Happiness”, “Sadness” and “Anger” are mixed with the class “Neutral” at all
times and vice versa. The emotions which present less misclassification by using the 10 fold
cross-validation approach are sadness and neutral emotion with 45 out of 116 instances and 49
out of 102 instances of misclassification respectively. Meanwhile the happiness emotion and
anger emotion present 64 out of 116 instances and 84 out of 84 of instances of misclassification.
6.2.4 Experiment III : The effect of excluding neutral emotion
As shown in the confusion matrix Table 6.10, we found that the three emotions were mixed with
“ Neutral” class.
Neutral emotion in all cases was the second choice of prediction for all emotions. An utterance
that was assigned a mixture of neutral and some other emotion can reasonably be interpreted as

131
being a weak example of the non-neutral emotion. We therefore decided to investigate the effect
of leaving this class (E00) out of our data, on the assumption that in many cases examples which
have been primarily classified as neutral are actually weak examples of other emotions.
6.2.4.1 Dataset Description of Experiment III
Experiment III will run with all instances of the neutral class (E00) removed and use of a
different number of features retained as in Experiment II, to assess whether there are any
substantial improvements in accuracy.
In Weka under the preprocess tab, we use the "RemoveWithValues" filter under "unsupervised--
>attribute" part, in order to remove all instances of class E00. This a step will be applied for all
datasets used in this experiment. Figure 6.6 shows screenshot of this process.
Figure 6.6: Preprocessing of E00

132
6.2.4.2 Experimental results of Experiment III
Table 6.11 shows the results of dropping neutral emotion (E00) from the target class (txt)
No.EXP The features
DecisionTable algorithm (Correctly Classified
Instances %) 1. Pitch, intensity, Duration, phone 51 %
2. intensity, duration, phone 52 %
3. Pitch, duration, phone 48%
4. Pitch, intensity ,phone 51 %
5. Pitch, intensity, duration 52 %
Table 6.11: The features are used in each experiment without Neutral Emotion (E00)
In comparing Tables 6.7 and 6.11, the accuracy of the experiment increases slightly when we
drop all instances of the neutral emotion of target class.
From our observation, the percentage increase of the scores in all cases is between 8% and 14%;
the aim of this experiment was to investigate whether leaving out E00, which is essentially the
absence of any emotion, improves the performance of the classifier on examples where a genuine
emotion is present. In other words, we want to see whether it is easier to assign the correct
emotion to an utterance which is known to express one of the major emotions than to
simultaneously decide whether it expresses any emotion and if so to determine which one. To
assess this we need to consider what the expected effect of decreasing the number of classes
would be. In particular, if we take into consideration the fact that using three classes is easier
than four, the expectation of increase in performance should accommodate this fact and should
be greater than would be predicted from random choices.
If we made random guesses with four classes (E00, E01, E02, E03) we would expect to score
0.25, but 0.33 with three classes. So to say that removing the need to decide whether some
utterance expressed an emotion at all makes a bigger difference on our result, we have to expect
the increase in the scores to be proportionally greater than with the original experiments. In other
words, if the comparison of these scores is based on one of them obtained from three classes
being more than 4/3 (1.33), then removing neutral has a greater effect on the result than
otherwise. By comparing the obtained score from Tables 6.7 and 6.11 respectively, we have the

133
scores 0.43, 0.38, 0.37, 0.42, 0.43for four classes with different sets of features, and these scores
are 0.51, 0.52, 0.48, 0.51, 0.52 for three classes. For example, if we take the first scores of these
two tables as the result of using of all features and do a simple compute by dividing the larger
number of classes by the smaller, i.e. (0.51/ 0.43) we note that the result is noticeably less than
what we expected 1.333, so there does not seem to be a useful effect here in almost any of the
cases.
As a conclusion, there was no substantial difference between the accuracy achieved by leaving
the E00 class out and including it from our target class txt. Therefore, for further experiments we
will include this class along with the other emotions.
6.2.5 Summary
To summarise this section, the first experiment was conducted to identify the best performance
of classifiers for our experiments, from the Initial experimental results we found that most
machine algorithms perform differently. So we decided to evaluate only five classification
algorithms namely DecisionTable, HoeffdingTree, PEPTree, BayesNet and Logistic. These
classifiers were experimentally evaluated based on number of accuracy and error rate using
WEKA tool with 10 cross validation test option. From the result we decided to select the
DecisionTable classifier to conduct our next experiments.
The main goal of this section was to study the effect of different combinations of three features
and their contributions to the accuracy of the classifiers.
The observed result from the experiment shows that the Intensity feature is the most important
because as we noticed if we drop the intensity feature we achieve a much worse score than if we
include it. As regards the others, it does not seem to matter which are dropped; neither does
dropping phone features make any difference. In summary, the importance of the three features
is in the order of Intensity, Pitch and then Duration. It is, perhaps, unsurprising that the deleting
the name of the phoneme as a feature makes little difference, but it was worth investigating
whether this feature would interact with the others in significant ways.

134
Regarding the second experiment conducted to see the effect of leaving out the neutral emotion
(E00) of our dataset on the performance of the classifier, the result shows that there is no real
improvement.
6.3 Classifying utterances The earlier experiments were aimed at classifying individual phonemes, but that what we are
actually interested in is classifying utterances, and the obvious way to do this is by counting the
classification of the phonemes that make up an utterance.
The main aim of this experiment is to examine the majority vote of the phonemes that make up
specific utterances via the machine learning classifier.
This experiment uses the classifier developed in Section 6.2.2 to classify the phoneme that make
up an utterance, and then simply counting their votes for the various accents. In Section 6.2.2.2
we showed that the classifier (DecisionTable), though unreliable, does do a reasonable job of
assigning individual phonemes to emotions. The question to be investigated here is whether the
aggregate accuracy when assigning complete utterances to emotions is higher than the individual
accuracy.
6.3.1 Experimental results of the experiment
Table 6.12 shows the results obtained when we classify whole utterances by counting the
classifications of the sets of phonemes that make up each utterance.

135
Conf.Matrix DecisionTable
PREDICTED CLASS
N H S A
REAL
CLASS
Neutral ( N ) 65 17 20 0
Happiness ( H ) 53 39 29 0
Sadness ( S ) 23 12 63 0
Anger ( A) 38 13 33 0
sum 179 81 145 0 overall average =
41%
Table 6.12: Confusion matrix of all utterances
The result obtained from running the six experiments for the individual utterances (S00, S01,
S02, S03, S04, S05) explained in appendix C over 21 utterances. For each of these we count the
majority vote of the phonemes that make up the utterance and assign that as the emotion for the
whole utterance.
From Table 6.12, we can see how the classifier classified these utterances according to their
emotion.
The number that are classified correctly is 167 out of the total is 405. We can see also that two
emotions, neutral and sad, were classified correctly.
The result shows that happy emotion was classified correctly 39 out of 121 instances and 82 out
of 121 instances were misclassified. Sad emotion was classified correctly 63 out of 98 and
misclassified 35 times as another emotion while anger was never classified correctly. As noted
in Section 4.2.4.4, human subjects often find it hard to distinguish between anger and sadness,
and our algorithms always classify anger as either neutral or sadness. This suggests that the
features we have used behave very similarly for anger and sadness, and that distinguishing
between these two requires further investigation. The overall classification success is 41%.

136
The result obtained from running the six experiments for the individual utterances ( in appendix
C1 ) are outlined in the following table for each utterance:
Exp. no
Emotions Utterances
E00 N
E01 H
E02
S
E03 A
1. Testing of S00 **** **** 2. Testing of S01 3. Testing of S02 4. Testing of S03 5. Testing of S04 6. Testing of S05 ****
Table 6.13: The result of six experiments with missing emotions
Table 6.13 shows the correct and incorrect classifying of each utterance, where (****) refers to
missing emotion of that utterances, and refers to correct classification of classifier of emotion
and the inverse.
By looking at the emotions we can see that the anger emotion was classified incorrectly in all
experiments, while the neutral emotion was classified correctly all the time. The sad emotion was
also classified correctly except in one case. Happy emotion was classified incorrectly in most
cases.
We notice from this experiment that E03 were misclassified almost every time, and we think the
reason may be the missing examples or instances of this emotion in our training set. Also we
missed E00 of utterance S00, so in this experiment, we are going to add an extra copy of these
utterances which are underrepresented to our training data in order to make our training dataset
balanced and repeat the experiment to find out if this is an effect of missing data.
In our case, there are a set of utterances missed in our dataset which are shown in Table 6.2 in
Section 6.2.1, such as S00E00, S00E03 and S05E03, so we are going to use extra data from other
utterances, for example from S01E00, S03E03 and S04E03 respectively. This is a way of giving
balance to our data.

137
Then, we will run a set of six experiments again manually, and each test data will be the
recordings of one sentence with their available emotions, and training data will be the recordings
of other sentences with extra copies or examples. The result for individual utterance is shown in
appendix C (C2), and the result for accounting the majority vote on all the phonemes that make
up the utterance is shown in Table 6.14.
Conf.Matrix DecisionTable
PREDICTED CLASS
N H S A
REAL
CLASS
Neutral ( N ) 54 17 38 12
Happiness ( H ) 44 39 24 9
Sadness ( S ) 26 10 79 1
Anger ( A) 37 12 33 2
sum 161 78 174 24 overall average =
40%
Table 6.14: Confusion matrix of all utterances after adding the missing emotions
The results of Tables 6.12 and 6.14 show that overall accuracy is achieved by using the method
of adding more instances, at 40%, which is slightly less than before
Also the results of the remaining five experiments in Appendix C2 show that there is a decrease
in accuracy after adding more instances of missing emotions in some cases, such as in S01 and
S03; or show the same accuracy as other utterances. However, the next, Table 6.15, outlines the
results of classifying the utterances of all experiments.
Exp.no
Emotions Utterances
E00 N
E01 H
E02
S
E03 A
1. Testing of S00 **** **** 2. Testing of S01 3. Testing of S02 4. Testing of S03 5. Testing of S04 6. Testing of S05 ****
Table 6.15: The result of six experiments with adding of missing emotions
138
These results show that adding more instances of missing emotions does not show any marked
improvement of classification, and we think maybe there is not enough information to work on.
6.3.2 Summary
For classifying the emotions of utterances in an unknown test sample, the DecisionTable
classifier has been chosen due to its proven efficiency in previous experiments.
The overall accuracy using DecisionTable classifier is 54%, made up of 83% for sad, 100% for
neutral, 33% for happy and 0% for anger.
Also this section investigated the effect of missing instances of some utterances on the prediction
accuracy of the classifier. The results show that adding more instances of missing emotions does
not produce any improvement.
6.4 Conclusion
In this chapter, we have conducted a set of experiments based on phoneme and utterances levels.
First we tried to investigate the importance of three features extracted from Arabic emotional
speech namely pitch, intensity and duration. We analysed the different combinations of these
features by using the DecisionTable classifier in Weka. This classifier was selected as result of
our experiment on various algorithms of Weka. The main findings show that the intensity feature
was the most important while the duration feature was the least. Also we found that using the
combination of three features produces differing recognition accuracy compared with using
different combinations of two or one features. However, we concluded that prosodic features are
more suitable and add meaningful information when the features are used together to classify
emotions. Also we discovered that excluding neutral emotion has no substantial effect on the
accuracy of classification.

139
Second, we investigate the accuracy of classification on the basis of different features extracted
from utterances of different emotional states.
The overall accuracy using DecisionTable classifier was 54% and also the results show that
there are two emotions classified correctly, sad and neutral at 83% and 100% for respectively,
The other emotions (happy and anger) were misclassified.
We removed some sample recordings from the training data, on the grounds that our human
subjects did not perceive them as expressing the target emotions. This left us with unbalanced
training data, which could potentially have led to the over-represented classes dominating the
classification. In order to overcome this we added extra copies of other recordings expressing
these emotions, in order to produce a more balanced training set. Unfortunately this did not have
much effect on the overall accuracy.

140
7. CHAPTER SEVEN : CONCLUSION
7.1 Conclusion The work is divided into three main parts:
Creation and evaluation of an Arabic emotional speech corpus.
Extraction and analysis of relevant prosodic features of emotional speech in Arabic.
Classification of Arabic emotion based on the details of features identified.
In the first part, we randomly select a set of six Arabic sentences from Arabic BBC news reports
and recorded them by one speaker acting out the sentences in four different emotional states:
happy, sad, angry and neutral. The dataset considered in this study consists of 24 Arabic
emotional sentences evaluated by listeners recruited for the purpose, who found that 21 sentence
were expressed successfully by the actor. These sentences were then labeled and prepared for the
next step.
The second part comprises two stages: the first stage is annotation, where recorded speech is
transcribed and labeled. An essential task here is to determine the time boundaries of phonemes
using the HTK toolkit which employs the Viterbi alignment procedure provided by the HVite
tool to align the phonemes. The second stage constitutes a process of extracting important
prosodic information from these phonemes of emotional speech, namely pitch, intensity and
duration, for classifying emotions. This is achieved by using the speech analysis and
manipulation tool Praat to extract all the information of these features.
In the third part, we attempt to classify emotions based on extracted features of emotional
speech. The Weka machine learning toolkit is used in this step. We attempt to evaluate a set of
different machine learning algorithms in Weka on our dataset to pick one high performance
algorithm. Analysis within default parameters shows that the set of algorithms performed well.

141
DecisionTable classifier is used for analysing the performance of emotion classification. Also in
this phase, we run a set of experiments with different feature combinations and analyse the
results obtained by using different combinations of features to identify the most important one.
The conclusion is that on the basis of practical implementation, intensity is the most significant
feature.
As mentioned above, a DecisionTable classifier is used to classify emotions based on feature
values extracted from the speech samples of different emotional states at the level of phonemes
and utterances. Each dataset is split into two separate files, one for training and another for
testing data in order to achieve this task.
The results show that certain emotions seem more confusing than the others, for example, anger
and happiness are more confusing than the other emotions, whereas neutral and sad emotions
were classified correctly.
In particular, the anger emotion is not recognised, and the researcher presumes this may be due
to a lack of sufficient examples of this emotion in the training set, suggesting the addition of
further examples and resulting analysis. However, the observed result did not show any
improvement in the overall emotion classification performance.
Finally, we can say that our small corpus seems to be adequate for determining which features
are most important, and it suggests that it may be possible to develop a classifier based on these
features.
7.2 Future work
Supplementary future work can be added to this study to seek improvement in many aspects
including the following:
This study achieves its results using a small sample size corpus; also we engage in
training using very little data. Therefore, the results cannot be generalised to the whole

142
population. The work may in future be extended to encompass a larger corpus of Arabic
emotional speech.
i. The corpus was recorded by only one female actor. Inclusion of new professional
speakers from other Arabic countries could in future be implemented in order to diversify
the speech corpus and provide a richer database.
ii. Recording of different sentences can provide a rich phonetic covering all syllables and
sentence types and can address issues of pronunciation variations such as deletion and
insertion etc.
iii. In our study, four states were considered: anger, happiness, sadness and a neutral state.
We think it would be desirable to have additional expressive speech types such as fear,
disgust, tiredness etc.
iv. Up until now, the perceptual test in the evaluation phase of our corpus was achieved by
only a small number of subjects – 12 (11 female and one male) – therefore, we could
employ a greater number of subjects with more of a gender balance which would increase
the dataset size and could result in better accuracy in the corpus. For example, selecting
more diverse subjects who do not speak Arabic or who have different linguistic and
cultural backgrounds would be helpful in order to make comparisons between results
from a wider range of people. Also it would be interesting to use other evaluation
methods in order to give the evaluators more options and that would potentially enhance
evaluation of expressive sentences.
v. We hope to explore a set of effective tools which can be used to generate high quality
transcriptions as well as to evaluate and compare the output of labeled material (detecting
errors in forced alignment). This is likely to yield positive results.
In order to improve results and achieve better performance, we think it is necessary to
select and extract more numerous and more diverse features, which would help acquire
more emotional detail. For the current research, the features that have been extracted are
pitch, intensity and duration. For future work, an insight into a different set of features,
such as energy, Linear Prediction cepstrum coefficients (LPCC) or Mel Frequency
cepstrum coefficients (MFCCs), could potentially improve the results.
Other learning machine techniques can be used with an appropriate choice of parameters
to gain a good improvement of accuracy in the classification.

143
8. References
Abu-Salim, I. M. (1983). A reanalysis of some aspects of Arabic phonology: A metrical
approach. Abushariah, M. A.-A. M., Ainon, R. N., Zainuddin, R., Alqudah, A. A. M., Ahmed, M. E., &
Khalifa, O. O. (2012). Modern standard Arabic speech corpus for implementing and evaluating automatic continuous speech recognition systems. Journal of the Franklin Institute, 349(7), 2215-2242.
Ahmed, M. E. (1991). Toward an Arabic text-to-speech system. The Arabian Journal for Science and Engineering, 16(4).
Al-Ani, S. H. (1970). Arabic phonology: An acoustical and physiological investigation (Vol. 61): Walter de Gruyter.
Al-Ghamdi, M. M., Al-Muhtasib, H., & Elshafei, M. (2004). Phonetic rules in Arabic script. Journal of King Saud University-Computer and Information Sciences, 16, 85-115.
Al-Otaibi, A. (1988). Speech Processing. The British Library in Association with UMI. Alghamdi, M. (2001). Arabic phonetics. Al-Toubah Bookshop, Riyadh. Alghamdi, M., Alhargan, F., Alkanhal, M., Alkhairy, A., Eldesouki, M., & Alenazi, A. (2008).
Saudi accented Arabic voice bank. Journal of King Saud University-Computer and Information Sciences, 20, 45-64.
Alghamdi, M. M. (1998). A spectrographic analysis of Arabic vowels: A cross-dialect study. Journal of King Saud University, 10(1), 3-24.
Ali, M., Elshafei, M., Al-Ghamdi, M., & Al-Muhtaseb, H. (2009). Arabic phonetic dictionaries for speech recognition. Journal of Information Technology Research (JITR), 2(4), 67-80.
Ali, Z. A., & Ghani, A. A. (2014). Word Stress Patterns in MSA: A Metrical-Based Analysis. World Journal of English Language, 4(4), 35.
Alkhouli, M. (1990). Alaswaat Alaghawaiyah. Daar Alfalah, Jordan. Alotaibi, Y. A. (2012). Comparing ANN to HMM in implementing limited Arabic vocabulary
ASR systems. International Journal of Speech Technology, 15(1), 25-32. Alotaibi, Y. A., & Hussain, A. (2010). Comparative analysis of Arabic vowels using formants
and an automatic speech recognition system. International Journal of Signal Processing, Image Processing and Pattern Recognition, 3(2), 11-22.
Alsabaan, M., Alsharhan, I., Ramsay, A., & Ahmad, H. Dealing with Emphatic Consonants to Improve the Performance of Arabic Speech Recognition.
Amer, W. An investigation into the differences between English and Arabic consonant and vowel sounds: a contrastive study with pedagogical implications. In.
Ananthakrishnan, S., Narayanan, S., & Bangalore, S. (2005). Automatic diacritization of Arabic transcripts for automatic speech recognition. Paper presented at the Proceedings of the 4th International Conference on Natural Language Processing.
Andersen, O., Kuhn, R., Lazaridès, A., Dalsgaard, P., Haas, J., & Noth, E. (1996). Comparison of two tree-structured approaches for grapheme-to-phoneme conversion. Paper presented

144
at the Spoken Language, 1996. ICSLP 96. Proceedings., Fourth International Conference on.
Banse, R., & Scherer, K. R. (1996). Acoustic profiles in vocal emotion expression. Journal of personality and social psychology, 70(3), 614.
Batliner, A., Fischer, K., Huber, R., Spilker, J., & Nöth, E. (2000). Desperately seeking emotions or: Actors, wizards, and human beings. Paper presented at the ISCA Tutorial and Research Workshop (ITRW) on Speech and Emotion.
Beaupré, M. G., & Hess, U. (2005). Cross-cultural emotion recognition among Canadian ethnic groups. Journal of cross-cultural psychology, 36(3), 355-370.
Becker, H., & Geer, B. (1957). Participant observation and interviewing: A comparison. Human organization, 16(3), 28-32.
Beier, E. G., & Zautra, A. (1972). Identification of vocal communication of emotions across cultures.
Biadsy, F., & Hirschberg, J. (2009). Using prosody and phonotactics in arabic dialect identification. Paper presented at the Tenth Annual Conference of the International Speech Communication Association.
Bigi, B., Péri, P., & Bertrand, R. (2012). Orthographic Transcription: which Enrichment is required for phonetization? Paper presented at the The eighth international conference on Language Resources and Evaluation.
Bin Othman, M. M. (2010). Experiments of Arabic Speech Recognition. (Master of Science), University of Manchester,
Blodgett, A., Owens, J., & Rockwood, T. (2007). An initial account of the intonation of Emirati Arabic. Paper presented at the Proceedings of the 16th International Congress ofPhonetic Sciences, Saarland University, Saarbrücken, Germany, August 6.
Boersma, P., Weenink,, & D. (2017). Praat: doing Phonetics by Computer. Retrieved from http://www.fon.hum.uva.nl/praat/
Bosi, M., & Goldberg, R. E. (2012). Introduction to digital audio coding and standards (Vol. 721): Springer Science & Business Media.
Breazeal, C. L. (2000). Sociable machines: Expressive social exchange between humans and robots. Massachusetts Institute of Technology,
Bringert, B. (2005). Creating Small Speech Recognizers Quickly. Bulut, M., Busso, C., Yildirim, S., Kazemzadeh, A., Lee, C. M., Lee, S., & Narayanan, S.
(2005). Investigating the role of phoneme-level modifications in emotional speech resynthesis. Paper presented at the Interspeech.
Burkhardt, F. (2001). Simulation emotionaler sprechweise mit sprachsyntheseverfahren. Reihe Berichte aus der Kommunikationstechnik. Shaker, Aachen.
Burkhardt, F., & Sendlmeier, W. F. (2000). Verification of acoustical correlates of emotional speech using formant-synthesis. Paper presented at the ISCA Tutorial and Research Workshop (ITRW) on Speech and Emotion.
C., R. D., & M, T. J. A Comparison of Dimensional Models of Emotion: Evidence from Emotions, Prototypical Events, Autobiographical Memories, and Words. 17(8), 802–808. doi:doi: 10.1080/09658210903130764
Cahn, J. E. (1989). Generating expression in synthesized speech. Massachusetts Institute of Technology,
Campbell, N. (2000). Databases of emotional speech. Paper presented at the ISCA Tutorial and Research Workshop (ITRW) on Speech and Emotion.

145
Chabchoub, A., & Cherif, A. (2012). Estimation and optimization of prosodic to improve the quality of the arabic synthetic speech. International Journal of Advances in Engineering & Technology, 2(1), 632.
Chahal, D. (1999). A preliminary analysis of lebanese arabic intonation. Paper presented at the Conference of the Australian Linguistic Society.
Chentir, A., Guerti, M., & Hirst, D. J. (2009). Detection of stressed syllables in standard Arabic. Paper presented at the Industrial Electronics, 2009. IECON'09. 35th Annual Conference of IEEE.
Col, S., LaRocca, A., & Chouairi, R. (2002). West Point Arabic Speech. LDC Catalog LDC2002S02.
Coomans, D., & Massart, D. L. (1982). Alternative k-nearest neighbour rules in supervised pattern recognition: Part 1. k-Nearest neighbour classification by using alternative voting rules. Analytica Chimica Acta, 136, 15-27.
Cullen, C., Vaughan, B., & Kousidis, S. (2008). Emotional speech corpus construction, annotation and distribution. Paper presented at the Conference papers.
Darwin, C. (1956). The Expression of the Emotions in Man and Animals. The Journal of Nervous and Mental Disease, 123(1), 90.
David C. Rubin, J. M. T. A Comparison of Dimensional Models of Emotion: Evidence from Emotions, Prototypical Events, Autobiographical Memories, and Words. 17(8), 802–808. doi:doi: 10.1080/09658210903130764
Dellaert, F., Polzin, T., & Waibel, A. (1996). Recognizing emotion in speech. Paper presented at the Spoken Language, 1996. ICSLP 96. Proceedings., Fourth International Conference on.
Devi, J. S., Srinivas, Y., & Nandyala, S. P. (2014). Automatic speech emotion and speaker recognition based on hybrid gmm and ffbnn. International Journal on Computational Sciences & Applications (IJCSA), 4(1), 35-42.
Domingos, P., & Pazzani, M. (1997). On the optimality of the simple Bayesian classifier under zero-one loss. Machine learning, 29(2-3), 103-130.
Douglas-Cowie, E., Campbell, N., Cowie, R., & Roach, P. (2003). Emotional speech: Towards a new generation of databases. Speech communication, 40(1), 33-60.
Dutoit, T. (1997). An introduction to text-to-speech synthesis (Vol. 3): Springer Science & Business Media.
Edgington, M. (1997). Investigating the limitations of concatenative synthesis. Paper presented at the Eurospeech.
Ekman, P., & Friesen, W. V. (1971). Constants across cultures in the face and emotion. Journal of personality and social psychology, 17(2), 124.
Ekman, P., Friesen, W. V., O'sullivan, M., Chan, A., Diacoyanni-Tarlatzis, I., Heider, K., . . . Ricci-Bitti, P. E. (1987). Universals and cultural differences in the judgments of facial expressions of emotion. Journal of personality and social psychology, 53(4), 712.
El Ayadi, M., Kamel, M. S., & Karray, F. (2011). Survey on speech emotion recognition: Features, classification schemes, and databases. Pattern Recognition, 44(3), 572-587.
El-Bakry, H. M., Rashad, M., & Isma'il, I. R. Diphone-Based Concatenative Speech Synthesis Systems for Arabic.
El-Bakry, H. M., Rashad, M., & Isma'il, I. R. (2011). Diphone-Based Concatenative Speech Synthesis Systems for Arabic.

146
El-Imam, Y. A. (1989). An unrestricted vocabulary Arabic speech synthesis system. IEEE Transactions on Acoustics, Speech, and Signal Processing, 37(12), 1829-1845.
El-Imam, Y. A. (2004). Phonetization of Arabic: rules and algorithms. Computer Speech & Language, 18(4), 339-373.
Eldin, S. N., & Rajouani, A. (1999). Analysis and Synthesis of Interrogative Intonation in Arabic. Paper presented at the International Congress of the Phonetic Sciences.
Elfenbein, H. A., & Ambady, N. (2002). On the universality and cultural specificity of emotion recognition: a meta-analysis. Psychological bulletin, 128(2), 203.
Elfenbein, H. A., Beaupré, M., Lévesque, M., & Hess, U. (2007). Toward a dialect theory: cultural differences in the expression and recognition of posed facial expressions. Emotion, 7(1), 131.
ELRA - ELRA-S0219 : NEMLAR Broadcast News Speech Corpus. (2017). Retrieved from http://catalog.elra.info/product_info.php?products_id=874
Elshafei, M., Al-Muhtaseb, H., & Al-Ghamdi, M. (2002). Techniques for high quality Arabic speech synthesis. Information sciences, 140(3), 255-267.
Elshafei, M., Al-Muhtaseb, H., & Alghamdi, M. (2006). Statistical methods for automatic diacritization of Arabic text. Paper presented at the The Saudi 18th National Computer Conference. Riyadh.
Farghaly, A., & Shaalan, K. (2009). Arabic natural language processing: Challenges and solutions. ACM Transactions on Asian Language Information Processing (TALIP), 8(4), 14.
Fathima, A. S., Manimegalai, D., & Hundewale, N. (2011). A review of data mining classification techniques applied for diagnosis and prognosis of the arbovirus-dengue. International Journal of Computer Science Issues (IJCSI), 8(6), 322.
Ferguson, S. H., & Kewley-Port, D. (2007). Talker differences in clear and conversational speech: Acoustic characteristics of vowels. Journal of Speech, Language, and Hearing Research, 50(5), 1241-1255.
Fernandez, R., & Picard, R. W. (2002). Dialog act classification from prosodic features using support vector machines. Paper presented at the Speech Prosody 2002, International Conference.
Ferrat, K., & Guerti, M. (2013). Classification of the Arabic emphatic consonants using time delay neural network. International Journal of Computer Applications, 80(10).
France, D. J., Shiavi, R. G., Silverman, S., Silverman, M., & Wilkes, M. (2000). Acoustical properties of speech as indicators of depression and suicidal risk. IEEE transactions on Biomedical Engineering, 47(7), 829-837.
Frank, E., Hall, M. A., & Witten, I. H. (2016). The WEKA Workbench. Online Appendix for "Data Mining: Practical Machine Learning Tools and Techniques". Morgan Kaufmann, Fourth Edition. Retrieved from http://www.cs.waikato.ac.nz/ml/weka/
Frank, E., & Witten, I. H. (1998). Generating accurate rule sets without global optimization. Frijda, N. H. (1988). The laws of emotion. American psychologist, 43(5), 349. Gadhe, R. P., Shaikh Nilofer, R., Waghmare, V., Shrishrimal, P., & Deshmukh, R. (2015).
Emotion Recognition from Speech: A Survey. International Journal of Scientific & Engineering Research, 6(4), 632-635.
Gobl, C., & Chasaide, A. N. (2000). Testing affective correlates of voice quality through analysis and resynthesis. Paper presented at the ISCA tutorial and research workshop (ITRW) on Speech and Emotion.

147
Habash, N., Soudi, A., & Buckwalter, T. (2007). On arabic transliteration. In Arabic computational morphology (pp. 15-22): Springer.
Halpern, J. (2009). Word stress and vowel neutralization in modern standard Arabic. Paper presented at the Proceedings of the Second International Conference on Arabic Language Resources and Tools, Cairo, Egypt.
Hammerschmidt, K., & Jürgens, U. (2007). Acoustical correlates of affective prosody. Journal of Voice, 21(5), 531-540.
Han, J., Pei, J., & Kamber, M. (2011). Data mining: concepts and techniques: Elsevier. Hansen, J. H., & Hasan, T. (2015). Speaker recognition by machines and humans: A tutorial
review. IEEE Signal processing magazine, 32(6), 74-99. Harrag, A., & Mohamadi, T. (2010). QSDAS: New quranic speech database for Arabic speaker
recognition. Arabian Journal for Science and Engineering, 35(2 C), 7-19. Hashizawa, Y., Takeda, S., Hamzah, M. D., & Ohyama, G. (2004). On the differences in
prosodic features of emotional expressions in Japanese speech according to the degree of the emotion. Paper presented at the Speech Prosody 2004, International Conference.
Hassan, Z. M. (1981). An experimental study of vowel duration in Iraqi spoken Arabic. University of Leeds,
Hazen, T. J. (2006). Automatic alignment and error correction of human generated transcripts for long speech recordings. Paper presented at the Ninth International Conference on Spoken Language Processing.
Helfrich, H., Standke, R., & Scherer, K. R. (1984). Vocal indicators of psychoactive drug effects. Speech Communication, 3(3), 245-252.
Hellmuth, S. (2005). Cause for concern in Cairo: why we should describe Arabic intonation. Paper presented at the workshop ‘Making Sense of Prosody’, SOAS, London.
Hifny, Y., & Rashwan, M. (2002). Duration modeling for arabic text to speech synthesis. Paper presented at the Seventh International Conference on Spoken Language Processing.
Iida, A., Campbell, N., Iga, S., Higuchi, F., & Yasumura, M. (2000). A speech synthesis system with emotion for assisting communication. Paper presented at the ISCA Tutorial and Research Workshop (ITRW) on Speech and Emotion.
Imedjdouben, F., & Houacine, A. (2014). Development of an automatic phonetization system for Arabic text-to-speech synthesis. International Journal of Speech Technology, 17(4), 417-426.
Ingale, A. B., & Chaudhari, D. (2012). Speech emotion recognition. International Journal of Soft Computing and Engineering (IJSCE), 2(1), 235-238.
International Phonetic Alphabet Sounds. (2017). Retrieved from http://www.internationalphoneticalphabet.org/ipa-sounds/ipa-chart-with-sounds/
Izard, C. (2001). Human Emotions,(1977). In: New York, Plenum Press. Javed, F. (2013). Arabic and English phonetics: A comparative study. The Criterion: An
International Journal in English, 4(4). Jiang, D.-n., Zhang, W., Shen, L.-q., & Cai, L.-h. (2005). Prosody analysis and modeling for
emotional speech synthesis. Paper presented at the Acoustics, Speech, and Signal Processing, 2005. Proceedings.(ICASSP'05). IEEE International Conference on.
Johnstone, T. (1996). Emotional speech elicited using computer games. Paper presented at the Spoken Language, 1996. ICSLP 96. Proceedings., Fourth International Conference on.
Juslin, P. N., & Scherer, K. R. (2008). Speech emotion analysis. Scholarpedia, 3(10), 4240.

148
Keerthi, S. S., Shevade, S. K., Bhattacharyya, C., & Murthy, K. R. K. (2001). Improvements to Platt's SMO algorithm for SVM classifier design. Neural computation, 13(3), 637-649.
Khabet, S., Zemirli, Z., & Mosteghanemi, M. Modeling sound duration in an Arabic text to speech system.
Khalifa, O. O., Obaid, M., Naji, A. W., & Daoud, J. I. (2011). A rule-based Arabic text-to-speech system based on hybrid synthesis technique. Australian Journal of Basic and Applied Sciences, 5(6), 342-354.
Khan, O., Al-Khatib, W. G., & Lahouari, C. (2007). detection of questions in Arabic audio monologues using prosodic features. Paper presented at the Multimedia, 2007. ISM 2007. Ninth IEEE International Symposium on.
Khattab, G., & Al-Tamimi, J. (2008). Durational cues for gemination in Lebanese Arabic. Language and Linguistics, 22, 39-55.
Kienast, M., & Sendlmeier, W. F. (2000). Acoustical analysis of spectral and temporal changes in emotional speech. Paper presented at the ISCA Tutorial and Research Workshop (ITRW) on Speech and Emotion.
Kirchhoff, K., Bilmes, J., Henderson, J., Schwartz, R., Noamany, M., Schone, P., . . . He, F. (2002). Novel speech recognition models for Arabic. Paper presented at the Johns-Hopkins University summer research workshop.
Koolagudi, S. G., Maity, S., Vuppala, A. K., Chakrabarti, S., & Rao, K. S. (2009). IITKGP-SESC: Speech Database for Emotion Analysis. Paper presented at the IC3.
Koolagudi, S. G., & Rao, K. S. (2012). Emotion recognition from speech: a review. International journal of speech technology, 15(2), 99-117.
Kramer, E. (1964). Elimination of verbal cues in judgments of emotion from voice. The Journal of Abnormal and Social Psychology, 68(4), 390.
Kuremastsu, M. (2008). An extraction of emotion in human speech using speech synthesize and classifiers for each emotion. WSEAS Transaction on Information Science and Applications, 5(3), 246-251.
Landwehr, N., Hall, M., & Frank, E. (2005). Logistic model trees. Machine learning, 59(1-2), 161-205.
Le, D., & Provost, E. M. (2013). Emotion recognition from spontaneous speech using hidden markov models with deep belief networks. Paper presented at the Automatic Speech Recognition and Understanding (ASRU), 2013 IEEE Workshop on.
Lee, C. M., & Narayanan, S. S. (2005). Toward detecting emotions in spoken dialogs. IEEE transactions on speech and audio processing, 13(2), 293-303.
Levin, H., & Lord, W. (1975). Speech pitch frequency as an emotional state indicator. IEEE Transactions on Systems, Man, and Cybernetics(2), 259-273.
Liu, Y., Shriberg, E., & Stolcke, A. (2003). Automatic disfluency identification in conversational speech using multiple knowledge sources. Paper presented at the Eighth European Conference on Speech Communication and Technology.
Ma, J., Jin, H., Yang, L. T., & Tsai, J. J.-P. (2006). Ubiquitous Intelligence and Computing: Third International Conference, UIC 2006, Wuhan, China, September 3-6, 2006. Proceedings (Lecture Notes in Computer Science), Springer-Verlag New York, Inc., Secaucus, NJ.
Ma, X. (2012). LDC Forced Aligner. Paper presented at the LREC. Maddieson, I., & Disner, S. F. (1984). Patterns of sounds: Cambridge university press.

149
Makhoul, J., Zawaydeh, B., Choi, F., & Stallard, D. (2005). BBN/AUB DARPA Babylon Levantine Arabic speech and transcripts. Linguistic Data Consortium (LDC), LDC Catalog No.: LDC2005S08.
Mallios, N., Papageorgiou, E., & Samarinas, M. (2011). Comparison of machine learning techniques using the WEKA environment for prostate cancer therapy plan. Paper presented at the Enabling Technologies: Infrastructure for Collaborative Enterprises (WETICE), 2011 20th IEEE International Workshops on.
Marc, S. (2001). Emotional Speech Synthesis: A Review. 1, 561-564. http://citeseerx.ist.psu.edu/viewdoc/download?doi=10.1.1.1.9050&rep=rep1&type=pdf
Mark, H.-J. (2017). Transcription tools. Retrieved from http://www.ifp.illinois.edu/~hasegawa/ Marumoto, T., & Campbell, N. (2000). Control of speaking types for emotion in a speech re-
sequencing system. Paper presented at the Proc. of the Acoustic Society of Japan, Spring meeting 2000.
Matsumoto, D. (1993). Ethnic differences in affect intensity, emotion judgments, display rule attitudes, and self-reported emotional expression in an American sample. Motivation and emotion, 17(2), 107-123. Marc
Meddeb, M., Karray, H., & Alimi, A. M. (2014). Intelligent remote control for TV program based on emotion in arabic speech. arXiv preprint arXiv:1404.5248.
Meftah, A., Alotaibi, Y., & Selouani, S.-A. (2014). Designing, Building, and Analyzing an Arabic Speech Emotional Corpus. Paper presented at the Workshop on Free/Open-Source Arabic Corpora and Corpora Processing Tools Workshop Programme.
Mietta, L. (2017). SpeCT - The Speech Corpus Toolkit for Praat (former title: Mietta's scripts for the Praat program). Retrieved from https://lennes.github.io/spect/
Mitchell, T. F. (1993). Pronouncing Arabic (Vol. 2): Oxford University Press. Murray, & Arnott. (1993). Toward the simulation of emotion in synthetic speech: A review of
the literature on human vocal emotion. The Journal of the Acoustical Society of America, 93(2), 1097-1108.
Murray, I. R. (1989). Simulating emotion in synthetic speech. University of Dundee, Navas, E., Castelruiz, A., Luengo, I., Sánchez, J., & Hernáez, I. (2004). Designing and
Recording an Audiovisual Database of Emotional Speech in Basque. Paper presented at the LREC.
Nelken, R., & Shieber, S. M. (2005). Arabic diacritization using weighted finite-state transducers. Paper presented at the Proceedings of the ACL Workshop on Computational Approaches to Semitic Languages.
Nwe, T. L., Foo, S. W., & De Silva, L. C. (2003). Speech emotion recognition using hidden Markov models. Speech communication, 41(4), 603-623.
Omar, A. (1991). Study of Linguistic phonetics. Aalam Alkutob, Eygpt. P., Ekman, W. V. Friesen, & Ellsworth, P. (1982). What emotion categories or dimensions can observers judge from facial behavior? Cambridge University Press, 39-55. Parrott, W. G. (2001). Emotions in social psychology: Essential readings: Psychology Press. Pell, M. D., Monetta, L., Paulmann, S., & Kotz, S. A. (2009). Recognizing emotions in a foreign
language. Journal of Nonverbal Behavior, 33(2), 107-120. Pell, M. D., Paulmann, S., Dara, C., Alasseri, A., & Kotz, S. A. (2009). Factors in the recognition
of vocally expressed emotions: A comparison of four languages. Journal of Phonetics, 37(4), 417-435.

150
Pereira, C. (2000). Dimensions of emotional meaning in speech. Paper presented at the ISCA Tutorial and Research Workshop (ITRW) on Speech and Emotion.
Petrushin, V. (1999). Emotion in speech: Recognition and application to call centers. Paper presented at the Proceedings of Artificial Neural Networks in Engineering.
Pfeiffer, S. (2001). Pause concepts for audio segmentation at different semantic levels. Paper presented at the Proceedings of the ninth ACM international conference on Multimedia.
Picard, R. W. (1995). Affective computing. Pittam, J., & Scherer, K. R. (1993). Vocal expression and communication of emotion: Guilford
Press. Plutchik, R. (1980). A general psychoevolutionary theory of emotion. Theories of emotion, 1(3-
31), 4. Plutchik, R. (1990). Emotions and psychotherapy: A psychoevolutionary perspective. In
Emotion, psychopathology, and psychotherapy (pp. 3-41): Elsevier. Polyakova, T., & Bonafonte, A. (2005). Main Issues in Grapheme-to-Phoneme Conversion for
TTS. Procesamiento del Lenguaje Natural, 35. Posner, J., Russell, J. A., & Peterson, B. S. (2005). The circumplex model of affect: An
integrative approach to affective neuroscience, cognitive development, and psychopathology. Development and psychopathology, 17(3), 715-734.
Quinlan, J. R. (2014). C4. 5: programs for machine learning: Elsevier. Rajeswari, K., & Uma, M. (2012). Prosody Modeling Techniques for Text-to-Speech Synthesis
Systems–A Survey. International Journal of Computer Applications, 39(16), 8-11. Rajouani, A., Loukili, M., & Najim, Z. (1997). A perceptual study of Arabic intonation. Paper
presented at the Intonation: Theory, Models and Applications. Rajouani, A., Ouadou, M., Nour, H., & Najim, M. (1996). Consonant duration from an Arabic
speech database. Paper presented at the Electrotechnical Conference, 1996. MELECON'96., 8th Mediterranean.
Rashwan, M. A., Al-Badrashiny, M. A., Attia, M., Abdou, S. M., & Rafea, A. (2011). A stochastic Arabic diacritizer based on a hybrid of factorized and unfactorized textual features. IEEE Transactions on Audio, Speech, and Language Processing, 19(1), 166-175.
Rawat, A., & Mishra, P. K. (2015). Emotion Recognition through Speech Using Neural Network. International Journal, 5(5).
Ressel, J. (1980). A circumplex model of affect. J. Personality and Social Psychology, 39, 1161-1178.
Rodman, R. D. (1999). Computer speech technology: Artech House, Inc. Rosenfelder, I. (2011). A short introduction to transcribing with elan. Technical Report,
University of Pennsylvania. Rowden, C. (1992). Speech Processing. In: McGraw-Hill Book company Europe. Rubin, D. C., & Talarico, J. M. (2009). A comparison of dimensional models of emotion:
Evidence from emotions, prototypical events, autobiographical memories, and words. Memory, 17(8), 802-808.
Ryding, K. C. (2005). A reference grammar of modern standard Arabic: Cambridge university press.
Sabir, I., & Alsaeed, N. (2014). A Brief Description of Consonants in Modern Standard Arabic. Linguistics and Literature Studies, 2(7), 185-189.

151
Saidane, T., Zrigui, M., & Ahmed, M. B. (2005). Arabic Speech Synthesis Using a Concatenation of Polyphones: The Results. Paper presented at the Canadian Conference on AI.
Salvi, G., Tesser, F., Zovato, E., & Cosi, P. (2010). Cluster analysis of differential spectral envelopes on emotional speech. Paper presented at the Eleventh Annual Conference of the International Speech Communication Association.
Scherer, K. R. (2003). Vocal communication of emotion: A review of research paradigms. Speech communication, 40(1), 227-256.
Scherer, K. R., Banse, R., & Wallbott, H. G. (2001). Emotion inferences from vocal expression correlate across languages and cultures. Journal of Cross-cultural psychology, 32(1), 76-92.
Scherer, K. R., Banse, R., Wallbott, H. G., & Goldbeck, T. (1991). Vocal cues in emotion encoding and decoding. Motivation and emotion, 15(2), 123-148.
Schiel, F. D., C. (2003). The Production of Speech Corpora Bavarian Archive for Speech Signals. In. Schlosberg, H. (1954). Three dimensions of emotion. Psychological review, 61(2), 81. Schröder, M., & Cowie, R. (2006). Issues in emotion-oriented computing-towards a shared
understanding. Paper presented at the Workshop on Emotion and Computing at KI. Schuller, B., Rigoll, G., & Lang, M. (2004). Speech emotion recognition combining acoustic
features and linguistic information in a hybrid support vector machine-belief network architecture. Paper presented at the Acoustics, Speech, and Signal Processing, 2004. Proceedings.(ICASSP'04). IEEE International Conference on.
Selim, H., & Anbar, T. (1987). A phonetic transcription system of Arabic text. Paper presented at the Acoustics, Speech, and Signal Processing, IEEE International Conference on ICASSP'87.
Selouani, S. A., & Boudraa, M. (2010). Algerian Arabic speech database (ALGASD): corpus design and automatic speech recognition application. Arabian Journal for Science and Engineering, 35(2C), 158.
Shami, M., & Verhelst, W. (2007). An evaluation of the robustness of existing supervised machine learning approaches to the classification of emotions in speech. Speech Communication, 49(3), 201-212.
Shao, Y., Wang, Z., Han, J., & Liu, T. (2005). Modifying spectral envelope to synthetically adjust voice quality and articulation parameters for emotional speech synthesis. Affective Computing and Intelligent Interaction, 334-341.
Shriberg, E., Stolcke, A., Jurafsky, D., Coccaro, N., Meteer, M., Bates, R., . . . Van Ess-Dykema, C. (1998). Can prosody aid the automatic classification of dialog acts in conversational speech? Language and speech, 41(3-4), 443-492.
Sjölander, K. (2009). Automatic alignment of phonetic segments. Working Papers in Linguistics, 49, 140-143.
Stevens, K., & Williams, C. (1969). On determining the emotional state of pilots during flight- An exploratory study(Pilot emotional state during stressful situations from tape recorded vocal utterances of air to ground radio communications using spectrographic analysis). Aerospace Medicine, 40, 1369-1372.
Stibbard, R. (2001). Vocal expressions of emotions in non-laboratory speech: an investigation of the Reading/Leeds Emotion in Speech Project annotation data. University of Reading,

152
Swerts, M. (1997). Prosodic features at discourse boundaries of different strength. The Journal of the Acoustical Society of America, 101(1), 514-521.
Tawari, A., & Trivedi, M. M. (2010). Speech emotion analysis: Exploring the role of context. IEEE Transactions on multimedia, 12(6), 502-509.
Teager, H., & Teager, S. (1990). Evidence for nonlinear sound production mechanisms in the vocal tract. Speech production and speech modelling, 55, 241-261.
Tebbi, H., Hamadouche, M., & Azzoune, H. Automatic Recognition and Synthesis System of Arabic Digit.
Thakur, B. K., Chettri, B., & Shah, K. B. (2012). Current Trends, Frameworks and Techniques Used in Speech Synthesis–A Survey. International Journal of Soft Computing and Engineering, 2(2), 2231-2307.
Thompson, W. F., & Balkwill, L.-L. (2006). Decoding speech prosody in five languages. Semiotica, 2006(158), 407-424.
Tomokiyo, L. M., Black, A. W., & Lenzo, K. A. (2003). Arabic in my hand: small-footprint synthesis of Egyptian Arabic. Paper presented at the Eighth European Conference on Speech Communication and Technology.
Trask, R. L. (1996). A dictionary of phonetics and phonology. Abingdon, UK: Routledge Van Der Malsburg, C. (1986). Frank Rosenblatt: Principles of neurodynamics: perceptrons and
the theory of brain mechanisms. In Brain Theory (pp. 245-248): Springer. Vergyri, D., & Kirchhoff, K. (2004). Automatic diacritization of Arabic for acoustic modeling in
speech recognition. Paper presented at the Proceedings of the workshop on computational approaches to Arabic script-based languages.
Ververidis, D., & Kotropoulos, C. (2006). Emotional speech recognition: Resources, features, and methods. Speech communication, 48(9), 1162-1181.
Viterbi algorithm - Wikipedia. (2017). Retrieved from https://en.wikipedia.org/wiki/Viterbi_algorithm
Vroomen, J., Collier, R., & Mozziconacci, S. J. (1993). Duration and intonation in emotional speech. Paper presented at the Eurospeech.
Watson, D., & Tellegen, A. (1985). Toward a consensual structure of mood. Psychological bulletin, 98(2), 219.
Wheddon, C., & Linggard, R. (1990). Speech and language processing: Chapman & Hall, Ltd. Williams, C., Stevens, K., & Hecker, M. (1970). Acoustical manifestations of emotional speech.
The Journal of the Acoustical Society of America, 47(1A), 66-66. Williams, C. E., & Stevens, K. N. (1972). Emotions and speech: Some acoustical correlates. The
Journal of the Acoustical Society of America, 52(4B), 1238-1250. Witten, I. H., Frank, E., Hall, M. A., & Pal, C. J. (2016). Data Mining: Practical machine
learning tools and techniques: Morgan Kaufmann. Young, S., Evermann, G., Gales, M., Hain, T., Kershaw, D., Liu, X., . . . Povey, D. (2002). The
HTK book. Cambridge university engineering department, 3, 175. Zaki, A., Rajouani, A., Luxey, Z., & Najim, M. (2002). Rules based model for automatic
synthesis of F0 variation for declarative arabic sentences. Paper presented at the Speech Prosody 2002, International Conference.
Zawaydeh, B. A. (1997). An acoustic analysis of uvularization spread in Ammani-Jordanian Arabic.
Zemirli, Z. (2006). ARAB_TTS: An Arabic text to speech synthesis. Paper presented at the Computer Systems and Applications, 2006. IEEE International Conference on.

153
Zemirli, Z., & Khabet, S. (2007). An effective model of stressing in an Arabic Text To Speech System. Paper presented at the Computer Systems and Applications, 2007. AICCSA'07. IEEE/ACS International Conference on.
Zitouni, I., Sorensen, J. S., & Sarikaya, R. (2006). Maximum entropy based restoration of Arabic diacritics. Paper presented at the Proceedings of the 21st International Conference on Computational Linguistics and the 44th annual meeting of the Association for Computational Linguistics.
Zotter, F. (2003). Emotional speech. at URL: http://spsc. inw. tugraz. at/courses/asp/ws03/talks/zotter. pdf.
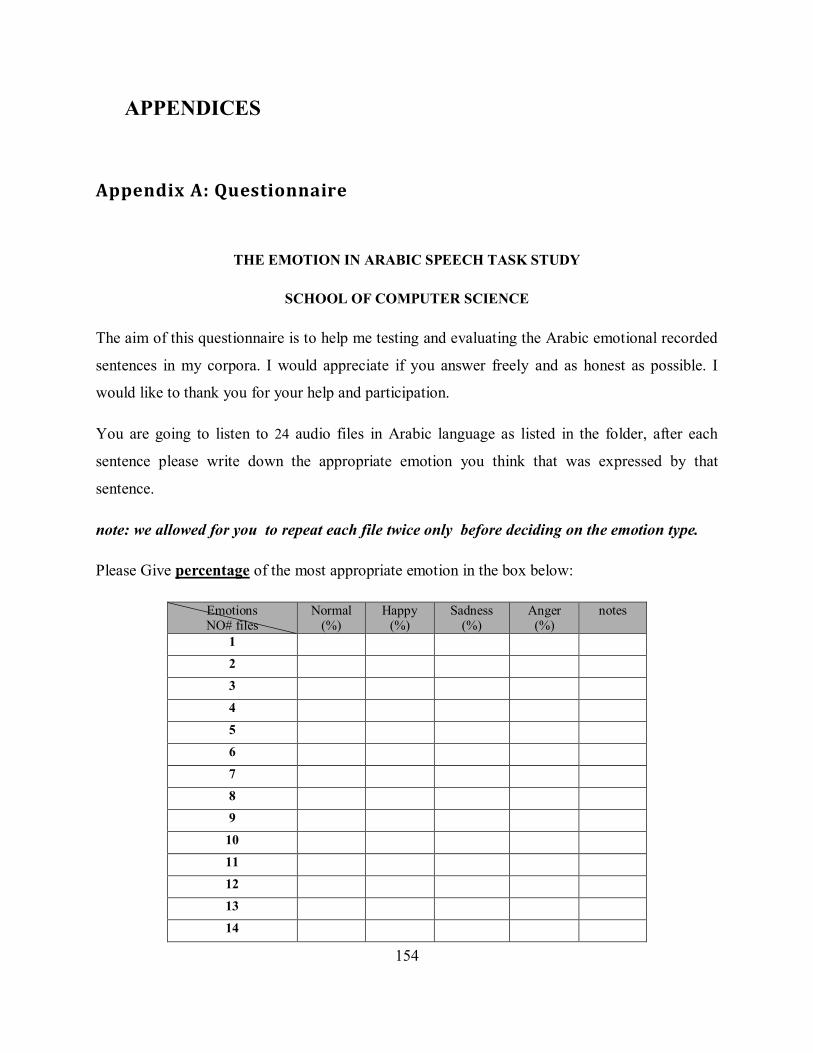
154
9. APPENDICES
Appendix A: Questionnaire
THE EMOTION IN ARABIC SPEECH TASK STUDY
SCHOOL OF COMPUTER SCIENCE
The aim of this questionnaire is to help me testing and evaluating the Arabic emotional recorded
sentences in my corpora. I would appreciate if you answer freely and as honest as possible. I
would like to thank you for your help and participation.
You are going to listen to 24 audio files in Arabic language as listed in the folder, after each
sentence please write down the appropriate emotion you think that was expressed by that
sentence.
note: we allowed for you to repeat each file twice only before deciding on the emotion type.
Please Give percentage of the most appropriate emotion in the box below:
Emotions NO# files
Normal (%)
Happy (%)
Sadness (%)
Anger (%)
notes
1
2
3
4
5
6
7
8
9
10
11
12
13
14

155
15
16
17
18
19
20
21
22
23
24 *Thank you for your participation.

156
Appendix B : Python programs
B1: Transliterate.pyprogram
"""
this is a file of stuff for transliterating from Arabic to Roman
"""
import codecs
import string
import os.path
def readAndWrite(ifileName, enc, ofileName):
"""
readAndWrite reads everything in ifileName, assuming that the encoding named by enc
was used when that file was created, and writes out the character (using the UTF-16
encoding) and the number corresponding to that character. The point of this one is to
find out what numbers correspond to the Arabic and Roman characters, so that we can
decide how to map (numbers corresponding to) Arabic characters to (numbers
corresponding to) Roman characters
"""
ifile = codecs.open(ifileName, encoding=enc)
ofile = codecs.open(ofileName, "w", "UTF-8");
characters = ifile.read()
# this bit's a loop for looking at each character in turn
for i in range(0, len(characters)):
# get the next character
c = characters[i]
# get the number that encodes it
x = ord(c)
print x
# print them out, each on a new line
ofile.write(c)
ofile.write('\r\n ')
ofile.write(str(x))
ofile.write('\r\n ')
ofile.close()
def transliterateFile(ifileName, enc, ofileName):
"""
This one reads a file of, probably Arabic, characters and uses
transliterate to swap them for Roman equivalents
"""
ifile = codecs.open(ifileName, encoding=enc)
characters = ifile.read()
numbers = []
ofile = open(ofileName, 'w')
for i in range(0, len(characters)):
n = ord(characters[i])
t = str(transliterate(n))
if t=='~': # to present ?symbol
n = ord(characters[i-1])
t = str(transliterate(n))
ofile.write(t)
else:ofile.write(t)
ofile.write('\n')
ofile.close()

157
import os
import stat
def listing(dir):
return os.listdir(dir)
def transliterateAllFiles(file, path):
top = path+"\\"+file
print "scanning "+top
try:
st = os.lstat(top)
except os.error:
print top
print "OK"
if stat.S_ISDIR(st.st_mode):
for name in listing(top):
transliterateAllFiles(name, top)
else:
transliterateFile(top, "UTF-8", path+"\\TRANSLITERATED\\"+file)
def transliterate(a):
"""
a is the number corresponding to a character. We look through all the 2-tuples in the
list of translations: if a is the first element of one of these then we want the
second (which is supposed to be the number corresponding to the Roman equivalent)
"""
translations = {1569:'`',1570:'|',1571: 'O',1572: 'W',1573: 'I',1574: '}',1575: 'A'
,1576:'b',1577: 'p',1578: 't',1579: 'v',1580: 'j',1581: 'H',1582:'x',1583: 'd',1584:
'*',1585: 'r'
,1586: 'z',1587: 's',1588: '$',1589: 'S',1590: 'D',1591: 'T',1592:'Z',1593: 'E',1594:
'g',1600: '_'
,1601: 'f',1602:'q',1603:
'k',1604:'l',1605:'m',1606:'n',1607:'h',1608:'w',1609:'Y',1610:'y',1611:'F'
,1612:'N',1613:'K',1614:'a',1615:'u',1616:'i',1617:'~',1618:'o'}
if a in translations:
return translations[a]
elif a <128:
return chr(a)
else:
return ''
import os,string
def read(ifilename):
ip = open(ifilename,"r")
word = ip.readlines()
return word
ip.close()
ifile=input ('Enter file name which you want to transliterate it to romanse file: ')
transliterateFile(ifile+'.txt', "UTF-8", ifile+'trans.txt')
op=open(ifile+'trans.txt','r')
w=read(ifile+'trans.txt')
op.close()
#to have proper format which can be used as transcription in HTK
op=open(ifile+'trans.txt','w')
for index, item in enumerate(w):
item = item.strip()
if item!='':
op.write('*/sample'+str(index)+' '+item)
op.write('\n')
op.close()

158
B2 : Phonetic.pyprogram
import os
import stat
def wlist2lexicon(wlist="C://htk//bin.win32//wlist3.txt", lexicon=False):
if isinstance(wlist, str):
wlist = [word.split("#")[0].strip() for word in open(wlist)]
transcriptions = ["%s\t\t[%s]\t\t%s" % (w,w, phontrans(w)) for w in sorted(wlist)]
if lexicon:
transcriptions += ["SENT-END\t[]\tsil", "SENT-START\t[]\tsil"]
with open(lexicon, 'w') as out:
for x in sorted(transcriptions):
out.write("%s\n"%(x))
else:
return transcriptions
def phontrans(w0):
w1 = ""
for c in w0:
if c == "~":
w1 += w1[-1]
else:
w1 += c
allographs = {"Y":"A", "F":"an", "K":"in", "N":"un",
">":"Oa", "<":"Oi", "&":"Ou", "'":"O","o":"","`":"O"}
for a in allographs:
w1 = w1.replace(a, allographs[a])
"""
fixing the semivowels. If a semivowel is followed by a vowel
(i.e. by one of the actual vowels or by a semivowel) then it is a
consonant. We will denote the consonant version of a semivowel by
its upper case equivalent, i.e. the vowel "w" is "w" and the
consonant "w" is "W".
We will at the same time fix tarmabutas. If "p" is followed by a
vowel it is pronounced "t", otherwise it is pronounced "t".
"""
w2 = ""
semivowels = set(["w", "y"])
vowels = semivowels.union(set(["a", "i", "u", "A"]))
sep =''
for i, c in enumerate(w1):
w2 +=sep
if c in semivowels and i < len(w1)-1 and w1[i+1] in vowels:
w2 += c.upper()
elif c == "p":
if i < len(w1)-1 and w1[i+1] in vowels:
w2 += "t"
else:
w2 += "h"
else:
w2 += c
sep =" "
return w2

159
Appendix C : The result of experiments before and after adding
the missing emotions
C1: The result of experiments before adding the missing emotions listed from 1 to 6 and shown in
confusion matrix:
Experiment 1:S00
Conf.Matrix DecisionTable
PREDICTED CLASS
RECALL(%) N H S A
REAL
CLASS
Neutral ( N ) 0 0 0 0 0
Happiness ( H ) 6 5 3 0 35
Sadness ( S ) 6 4 4 0 28
Anger ( A) 0 0 0 0 0
Precision (%) 0 55 57 0 Acc= 32.14%
Experiment 2:S01
Conf.Matrix DecisionTable
PREDICTED CLASS
RECALL(%) N H S A
REAL
CLASS
Neutral ( N ) 15 5 1 0 71
Happiness ( H ) 9 5 7 0 23
Sadness ( S ) 3 3 15 0 71
Anger ( A) 7 3 11 0 0
Precision (%) 44 31 44 0 Acc= 41.66%

160
Experiment 3:S02
Conf.Matrix DecisionTable
PREDICTED CLASS
RECALL(%) N H S A
REAL
CLASS
Neutral ( N ) 13 1 5 0 68
Happiness ( H ) 11 5 3 0 26
Sadness ( S ) 3 1 15 0 78
Anger ( A) 10 0 9 0 0
Precision (%) 35 71 46 0 Acc= 43.42%
Experiment 4:S03
Conf.Matrix DecisionTable
PREDICTED CLASS
RECALL(%) N H S A
REAL
CLASS
Neutral ( N ) 9 6 3 0 50
Happiness ( H ) 6 10 2 0 56
Sadness ( S ) 2 3 13 0 72
Anger ( A) 5 8 5 0 0
Precision (%) 41 37 57 0 Acc= 44.44%

161
Experiment 5:S04
Conf.Matrix DecisionTable
PREDICTED CLASS
RECALL(%) N H S A
REAL
CLASS
Neutral ( N ) 20 0 6 0 77
Happiness ( H ) 15 3 8 0 12
Sadness ( S ) 6 0 20 0 48
Anger ( A) 16 2 8 0 0
Precision (%) 35 60 48 Acc= 41.34%
Experiment 6:S05
Conf.Matrix DecisionTable
PREDICTED CLASS
RECALL(%) N H S A
REAL
CLASS
Neutral ( N ) 8 5 5 0 44
Happiness ( H ) 6 11 1 0 61
Sadness ( S ) 6 1 11 0 61
Anger ( A) 0 0 0 0 0
Precision (%) 40 65 65 0 Acc= 55.55%

162
C2: The result of Experiments after adding the missing emotions listed from 1 to 6 and shown in
confusion matrix:
Experiment 1:S00
Conf.Matrix DecisionTable
PREDICTED CLASS
RECALL(%) N H S A
REAL
CLASS
Neutral ( N ) 0 0 0 0 0
Happiness ( H ) 6 5 3 0 36
Sadness ( S ) 6 4 4 0 29
Anger ( A) 0 0 0 0 0
Precision (%) 0 56 57 0 Acc= 32.14%
Experiment 2:S01
Conf.Matrix DecisionTable
PREDICTED CLASS
RECALL(%) N H S A
REAL
CLASS
Neutral ( N ) 9 5 1 6 43
Happiness ( H ) 4 5 7 5 24
Sadness ( S ) 3 2 15 1 71
Anger ( A) 7 2 11 1 05
Precision (%) 39 36 44 08 Acc= 35.71 %

163
Experiment 3:S02
Conf.Matrix DecisionTable
PREDICTED CLASS
RECALL(%) N H S A
REAL
CLASS
Neutral ( N ) 13 1 5 0 68
Happiness ( H ) 11 5 3 0 26
Sadness ( S ) 3 1 15 0 79
Anger ( A) 10 0 9 0 0
Precision (%) 35 71 47 0 Acc=43.42 %
Experiment 4:S03
Conf.Matrix DecisionTable
PREDICTED CLASS
RECALL(%) N H S A
REAL
CLASS
Neutral ( N ) 4 7 1 6 22
Happiness ( H ) 2 11 1 4 61
Sadness ( S ) 2 3 13 0 72
Anger ( A) 4 8 5 1 07
Precision (%) 33 38 65 09 Acc= 40.27 %

164
Experiment 5:S04
Conf.Matrix DecisionTable
PREDICTED CLASS
RECALL(%) N H S A
REAL
CLASS
Neutral ( N ) 20 0 6 0 77
Happiness ( H ) 15 3 8 0 11
Sadness ( S ) 6 0 20 0 77
Anger ( A) 16 2 8 0 0
Precision (%) 35 60 48 0 Acc= 41.34 %
Experiment 6:S05
Conf.Matrix DecisionTable
PREDICTED CLASS
RECALL(%) N H S A
REAL
CLASS
Neutral ( N ) 8 4 6 0 44
Happiness ( H ) 6 10 2 0 65
Sadness ( S ) 6 0 12 0 67
Anger ( A) 0 0 0 0 0
Precision (%) 40 71 60 0 Acc=55.55 %