Embed Size (px)
Citation preview

ANALYST PRESENTATION18 JUNE 2015

Safe Harbor Statement
This presentation contains statements about management's future expectations, plans and prospects of our business thatconstitute forward-looking statements, which are found in various places throughout the press release, including , but notlimited to, statements relating to expectations of orders, net sales, product shipments, backlog, expenses, timing ofpurchases of assembly equipment by customers, gross margins, operating results and capital expenditures. The use ofwords such as “anticipate”, “estimate”, “expect”, “can”, “intend”, “believes”, “may”, “plan”, “predict”, “project”, “forecast”,“will”, “would”, and similar expressions are intended to identify forward looking statements, although not all forward lookingstatements contain these identifying words. The financial guidance set forth under the heading “Outlook” constitutes forwardlooking statements. While these forward looking statements represent our judgments and expectations concerning thedevelopment of our business, a number of risks, uncertainties and other important factors could cause actual developmentsand results to differ materially from those contained in forward looking statements, including the discovery of weaknesses inour internal controls and procedures, our inability to maintain continued demand for our products; the impact on ourbusiness of potential disruptions to European economies from euro zone sovereign credit issues; failure of anticipatedorders to materialize or postponement or cancellation of orders, generally without charges; the volatility in the demand forsemiconductors and our products and services; failure to adequately decrease costs and expenses as revenues decline,loss of significant customers, lengthening of the sales cycle, incurring additional restructuring charges in the future, acts ofterrorism and violence; inability to forecast demand and inventory levels for our products, the integrity of product pricing andprotect our intellectual property in foreign jurisdictions; risks, such as changes in trade regulations, currency fluctuations,political instability and war, associated with substantial foreign customers, suppliers and foreign manufacturing operations;potential instability in foreign capital markets; the risk of failure to successfully manage our diverse operations; thoseadditional risk factors set forth in Besi's annual report for the year ended December 31, 2014 and other key factors thatcould adversely affect our businesses and financial performance contained in our filings and reports, including our statutoryconsolidated statements. We are under no obligation to (and expressly disclaim any such obligation to) update or alter ourforward-looking statements whether as a result of new information, future events or otherwise.
June 2015 2

Agenda
I. Company Overview
II. Market
III. Technology Update
IV. Operations Review
V. Financial Review
3June 2015

I. COMPANY OVERVIEW
4June 2015

Besi Overview
• Leading assembly equipment supplier with #1 and #2 positions in key products. 28.5% addressable market share
• Broad portfolio: die attach, packaging and plating• Strategic positioning in substrate and wafer level packaging • Global mfg. operations in 7 countries; 1,680 employees
worldwide. HQ in Duiven, the Netherlands
Corporate Profile
• LTM revenue and net income of € 403.7 and € 81.6 million• Cash at 3/31/15: € 161.6 million• Total debt at 3/31/15: € 28.4 million• € 114 million of dividends and share repurchases since 2011
Financial Highlights
• Growth of <20 nano advanced packaging, smart phones, wearable devices, auto electronics, IoT and market share gains offer revenue upside
• Significant unrealized earnings potential from optimization of Asian production, supply chain efficiencies and development of common parts/platforms
Investment Considerations
5June 2015

Stock Price Information
• Approximate € 900 million market capitalization• Upgraded to Euronext AMX mid cap index on March 23, 2015
Market profile has improved significantly:
• Average daily volume:• 2013: 99,811• 2014: 117,084• 2015: 219,887
Liquidity has increased over past three years:
• Top 10 shareholders = 30% of shares outstanding. Down from 60% in 2011• Largest shareholder less than 7% currently
Share concentration has reduced:
• 40% NL• 30% US• 30% Europe ex NL
Geographic ownership has diversified:
• 6.6% currently• Dividend payout ratio of between 40-80% net income per annum
Highest dividend yield among peers
6June 2015

Summary Strategy
• Continue enhancing best in class <20 nano assembly equipment portfolio• Expand tech capabilities and applications for TCB line• IoT and wearables have potential to significantly expand addressable market
Develop new products and markets
• Leverage <20 nano expertise in flip chip, molding, multi module attach to further penetrate largest smart phone supply chains and expand in Chinese handset market
• Apply TCB tech advantage to more mainstream applications• Flip Chip/Wire Bond conversion for advanced applications can further grow market share
Increase market share in addressable markets
• Expand Asian materials sourcing and direct shipments• Expand Malaysian and Singapore operations. Increase Chinese die bonding production• Develop common platforms, common modules and common parts • Continue to reduce euro based costs. Better align USD/CHF/EUR exposure
Achieve a more scalable, flexible and lower cost manufacturing model
• Expand tech leadership in advanced packaging including wafer level assembly
Acquire companies with complementary technologies and products
7June 2015

II. MARKET
8June 2015

Die Bonding39.7%
Flip Chip15.8%
Die Sorting3.0%
Singulation9.3%
Presses11.2%
Molds13.5%
Lead Trim & Form5.5%
Plating2.0%
Assembly Equipment Market Composition
• Half of assembly market represented by die attach and wire bonding equipment
• Die Attach represents Besi’s largest addressable market
Die Attach 59%
Packaging 39%
Plating2%
Assembly Equipment Market * (2014: $4.0 billion)
Besi Addressable Market *(2014: $1.7 billion)
* Source: VLSI May 2015
Wire Bonding21.7%
Die Attach29.7%Packaging
21.8%
Plating0.9%
Other Assembly
(Inspection, Dicing)25.9%
9June 2015

Assembly Equipment Market Trends
• VLSI forecasts flat growth in 2015 and 2016 after big 2014 increase as capacity digested• Growth reaccelerates in 2017 and 2018• Besi revenue growth exceeding assembly market in 5 of past 6 years
326.9
273.7 254.9
378.8
70.0 94.9-16.3%
-6.9%
48.6%35.6%
-50%
0%
50%
100%
150%
-
100.0
200.0
300.0
400.0
2011 2012 2013 2014 YTD 2014 YTD 2015
(€m
illio
ns)
Besi Revenue Revenue YoY Growth Rate
4.44.0
3.1
4.0 4.0 3.94.6
4.9 4.8
-9.2%
-22.4%
29.1%
1.6%-2.5%
16.3%
7.7%
-2.3%
-30%
-20%
-10%
0%
10%
20%
30%
40%
0.0
1.0
2.0
3.0
4.0
5.0
6.0
2011 2012 2013 2014 2015F 2016F 2017F 2018F 2019F
(US
$ bi
llion
s)
Assembly Equipment Market Size YoY Growth Rate
Source: VLSI May 2015
10June 2015
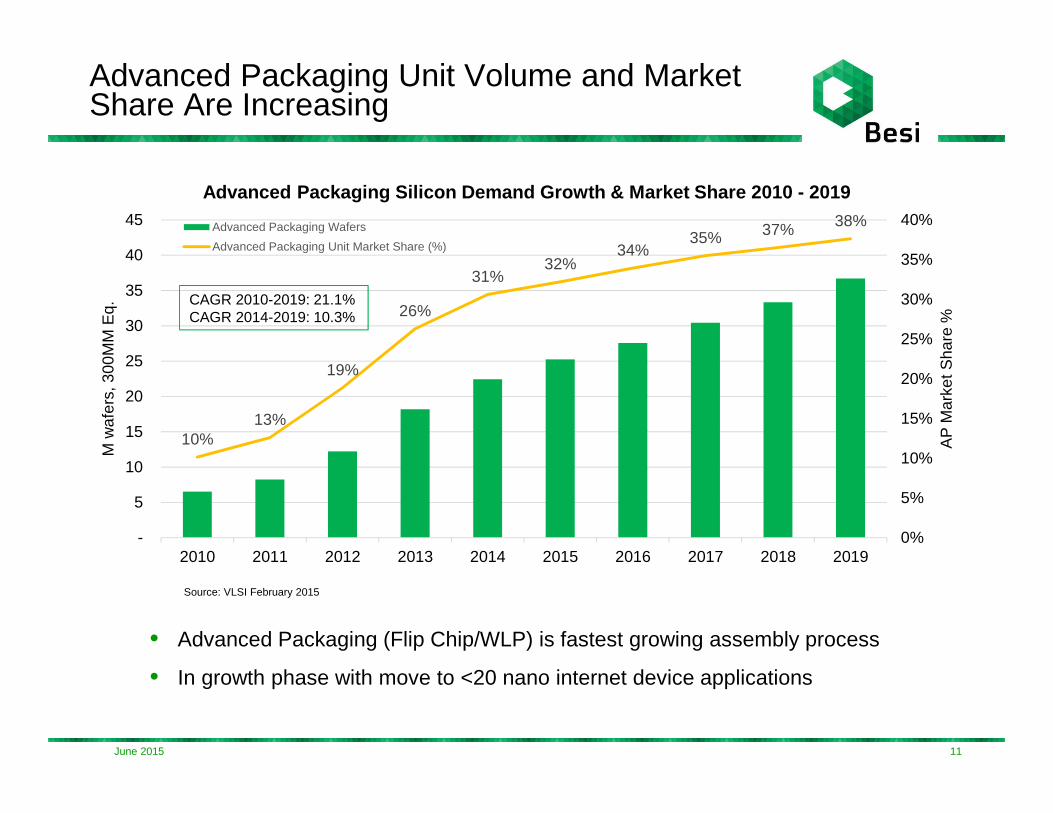
Advanced Packaging Unit Volume and MarketShare Are Increasing
• Advanced Packaging (Flip Chip/WLP) is fastest growing assembly process
• In growth phase with move to <20 nano internet device applications
Source: VLSI February 2015
10%13%
19%
26%
31%32%
34%35% 37% 38%
0%
5%
10%
15%
20%
25%
30%
35%
40%
-
5
10
15
20
25
30
35
40
45
2010 2011 2012 2013 2014 2015 2016 2017 2018 2019
AP
Mar
ket S
hare
%
M w
afer
s, 3
00M
M E
q.
Advanced Packaging Silicon Demand Growth & Market S hare 2010 - 2019
Advanced Packaging Wafers
Advanced Packaging Unit Market Share (%)
CAGR 2010-2019: 21.1%CAGR 2014-2019: 10.3%
11June 2015

Driven Primarily by Growth in Internet Connected Devices
• 35% CAGR device growth forecast over next 5 years
• Powered primarily by devices used for IoT
• Positive trajectory for smart phones, tablets, wearables, and automotive
• Significant potential revenue growth driver
12June 2015

• Spending on <25 nano nodes has increased from ~15% in 2011 to an estimated 70% of total spending in 2015
• Node shift below 20 nano = new assembly equipment capacity
Which Has Significantly Increased Semi Equipment Spending for < 25 Nano Nodes
13June 2015

New Smart Phone Designs Increase Besi’s Addressable Market Potential
• Besi systems can assemble 50% of 2012 generation components and 70% of 2014 generation components
- NewMain Components
Generation
2012
Generation
2014Manufacturer IDM/OSAT Besi system Utilized
Processor X X Apple TSMC ->Amkor/Stats/ASE 8800FCQ, AMS-W/LM
DRAM Memory X X Hynix/Micron Hynix/Micron 2100sD, FSL
NAND Flash X X Hynix/Toshiba Hynix/Amkor/Toshiba 8800FCQ, AMS-W/LM
Power Management
Apple PM IC X Dialog Dialog 2100sD
PMIC X X Qualcomm N/A
M3 Microcontroller X NXP Amkor/NXP 8800FCQ, AMS-W/LM
Accelerometer/Gyroscope/Barometric
Gyroscope X X Invensense Amkor/ASE/STM 2100xP, 2100sD, AMS-W/LM, FCL
3-ax accelerometer X Bosch Bosch evo
barometric sensor X Bosch Bosch evo
CommunicationsGeneration
2012
Generation
2014Manufacturer IDM/OSAT Besi system Utilized
Wifi/NFC
Wifi module X X Murata Murata Murata's equipment
NFC X NXP Amkor 8800FCQ, AMS-W/LM
NFC Booster IC X AMS Daca N/A
LTE
LTE Modem X Qualcomm Amkor/Stats/Spil/ASE 8800FCQ, AMS-W/LM
Low Band LTE PAD X Skyworks Skyworks 2200evo, FSL
Mid Band PAD X Skyworks Skyworks 2200evo, FSL
High Band PAD X Avago ASE/Amkor 2100xP, 2100sD, AMS-W/LM
Receiver/TransceiverRF Transceiver X X Qualcomm Amkor 2100xP, 2100sD, AMS-W/LM
RF Receiver X X Qualcomm N/A
Envelop Tracking IC X Qualcomm TSMC ->Amkor/Stats/ASE 8800FCQ, AMS-W/LM
Antenna Switch X X RFMD Amkor/ASE,/RFMD 2100xP, 2100sD
PA
PA X X Avago ASE/Amkor 2100xP, 2100sD, AMS-W/LM
PA Module X Triquint ASE 2200evo, 2100sD
Video/AudioGeneration
2012
Generation
2014Manufacturer IDM/OSAT Besi system Utilized
Camera
Back side 8M (OSI) X X Apple LG, Sharp, Mitsumi 2200evo
Front 1.2M X X Apple Cowell, Sony 2200evo
Finger print sensor X Apple ASE 2200evo
Audio
2+4 microphones X ST ST 2100 xp
Audio Codec X X Cirrus Logic Amkor 2100xP, 2100sD, AMS-W/LM
Touch screen control
Touch screen control X X Broadcom Signetics 2100sD
Touch Transmitter X TI TI FCL
14June 2015

Flip Chip/Wire Bond Process Shift Is Another Revenue Opportunity
Wire Bonding Flip Chip Bonding
Reduces board area by up to 95%.
Requires far less height
Offers higher speed electrical
performance
Greater I/O connection flexibility
More durable interconnection
method
Lower cost for high volume production,
with costs below $0.01 per connection
Flip Chip Advantages
* Source: VLSI May 2015
15
• Move to <20 nanometer can only be accomplished by use of flip chip die bonding vs. wire bonding process
• Flip chip revenue represents only 29% currently of total potential market of $1.2 billion
• Flip chip expected to gain share over next 5 years
• Growth could accelerate depending on adoption rates by key IDMs/subcons
CAGR 2014 - 2019*Flip Chip 7.4%Wire Bond 2.9%
Flip Chip$508 34%
Wire Bonding
$994 66%
2019*
Flip Chip$356 29%
Wire Bonding
$861 71%
2014*
June 2015

Besi Has Gained Share In Its Addressable Markets
• Gaining share in fastest growing segments of the assembly equipment market:• Flip chip and multi module die attach and ultra thin molding for advanced
packaging applications
Besi Market Share
Source: VLSI, May 2015 and Besi estimates 2012 2013 2014
Total Assembly Equipment Sales 8.6% 10.6% 12.7%
Besi Addressable Market 21.4% 26.0% 28.4%
Total Die Attach Equipment 26.8% 31.2% 34.7%
Die Bonding 29.7% 39.2% 38.7%
Flip Chip 22.2% 24.4% 31.8%
Other 17.1% 4.8% 9.1%
Total Packaging Equipment 11.1% 15.9% 16.4%
Molds 12.0% 19.1% 19.5%
Lead Trim & Form 15.0% 17.6% 19.0%
Singulation 5.3% 5.1% 6.8%
Total Plating 75.8% 82.3% 75.4%
16June 2015
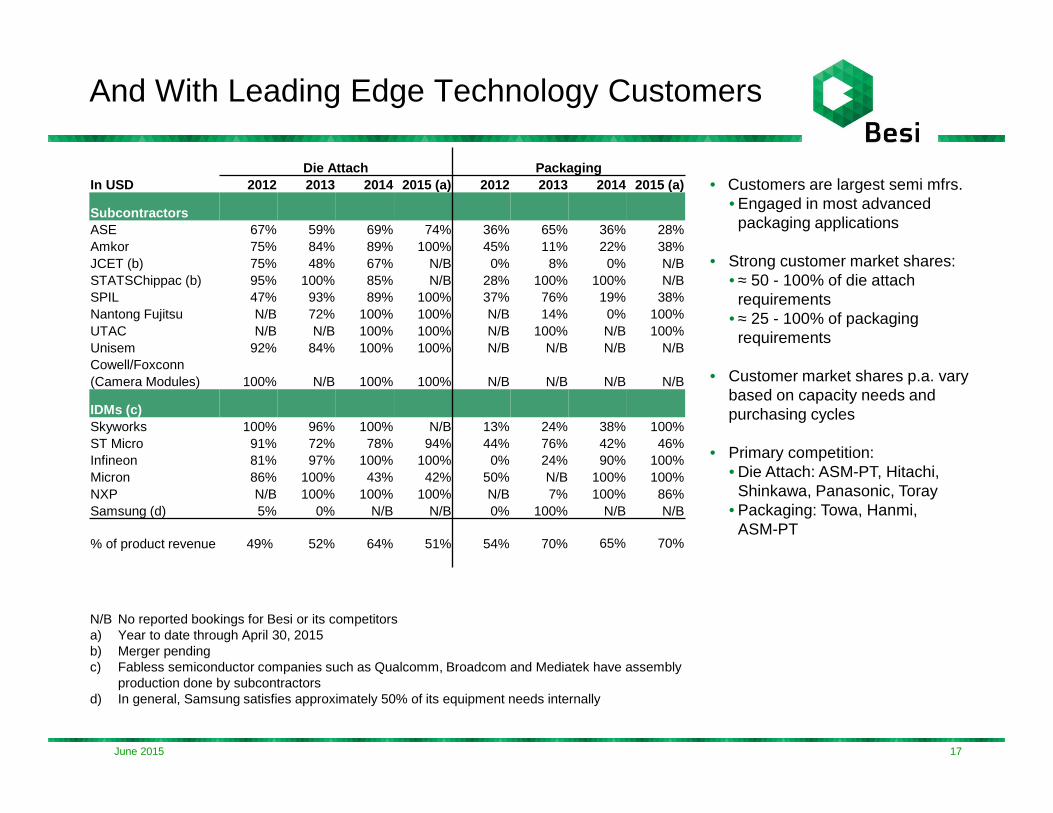
• Customers are largest semi mfrs. • Engaged in most advanced packaging applications
• Strong customer market shares:• ≈ 50 - 100% of die attach requirements
• ≈ 25 - 100% of packaging requirements
• Customer market shares p.a. vary based on capacity needs and purchasing cycles
• Primary competition:• Die Attach: ASM-PT, Hitachi,
Shinkawa, Panasonic, Toray• Packaging: Towa, Hanmi,
ASM-PT
And With Leading Edge Technology Customers
N/B No reported bookings for Besi or its competitorsa) Year to date through April 30, 2015b) Merger pendingc) Fabless semiconductor companies such as Qualcomm, Broadcom and Mediatek have assembly
production done by subcontractorsd) In general, Samsung satisfies approximately 50% of its equipment needs internally
Die Attach PackagingIn USD 2012 2013 2014 2015 (a) 2012 2013 2014 2015 (a)
SubcontractorsASE 67% 59% 69% 74% 36% 65% 36% 28%Amkor 75% 84% 89% 100% 45% 11% 22% 38%JCET (b) 75% 48% 67% N/B 0% 8% 0% N/BSTATSChippac (b) 95% 100% 85% N/B 28% 100% 100% N/BSPIL 47% 93% 89% 100% 37% 76% 19% 38%Nantong Fujitsu N/B 72% 100% 100% N/B 14% 0% 100%UTAC N/B N/B 100% 100% N/B 100% N/B 100%Unisem 92% 84% 100% 100% N/B N/B N/B N/BCowell/Foxconn
100% N/B 100% 100%(Camera Modules) N/B N/B N/B N/B
IDMs (c)Skyworks 100% 96% 100% N/B 13% 24% 38% 100%ST Micro 91% 72% 78% 94% 44% 76% 42% 46%Infineon 81% 97% 100% 100% 0% 24% 90% 100%Micron 86% 100% 43% 42% 50% N/B 100% 100%NXP N/B 100% 100% 100% N/B 7% 100% 86%Samsung (d) 5% 0% N/B N/B 0% 100% N/B N/B
% of product revenue 49% 52% 64% 51% 54% 70% 65% 70%
17June 2015

Besi 2015/2016 Growth Drivers
18June 2015
• Significant growth < 20nm end user applications: IoT, wearables• Increased TCB usage: memory applications currently, logic devices next
World tooling up for new tech cycle
Larger addressable market from increased smart phone functionality and new device introductions
• Chinese handset market: IDMs/Xiaomi, Mediatek, Huawei. Subcons/JCET, Nantong Fujitsu, ASE, Amkor
Increased market penetration
• In key electronics supply chains• Primarily at expense of Japanese suppliers lagging in innovation cycle• Flip chip and TCB gaining share from Wire Bond assembly processes• Consolidation offers positive opportunities with semi manufacturers
Increased market share

III. TECHNOLOGY UPDATE
19June 2015

Best in Class Product Portfolio
• Molding- AMS series- AMS LM 95- MMS series- FML
• Die Bonding- 2100 xPplus
- 2100 sDplus
- 2100 sD PPPplus
- 2100 hS- 2009 SSI- 2100 DS- 2100 SC
Die Attach Packaging & Plating
• Multi Module Die Attach- 2200 evo- 2200 evo plus
• Flip Chip- 8800 FCQ Sigma- 8800 CHAMEO- 8800 TCB - 2100 FC
• Trim & Form- Compact series- Power series- Compact Line XHD New
• Plating- Leadframe- Solar- Film & Foil
In Development
•Next generation Die Attach
•Next generation Packaging
•Common modules
Datacon/Esec
Datacon
Esec
Fico
Meco
Fico
New
Fico
• Singulation- FSL
New
New
• Die Sorting- DS 9000E- WTT- TTR- DLA
Datacon
NewNew
New
New
20June 2015
New
New

Besi Assembly Process Technology Steps
• Sorting and mounting chipson substrate materials
• Establish electrical interconnects
• Molding/encapsulation in packages
• Singulation/trim and form of packages
• Electro plating of leadframes, substrates and solar cells
• Flip chip, TCB and multi module die bonding and ultra thin molding are key core competencies
21June 2015

Internet of Everything is Driving Advanced Packaging Growth
22June 2015
Source: Intel
Key End Use Applications:
• Mobile internet devices
• Connectivity
• Computing power
• Big Data Analytics
• Automotive
Source: Nvidia

Requiring Changes in Process/Equipment Development
23June 2015
Today=> TomorrowFront End
Transistor Scaling
Lithography
New Structures 3D
Back End
More Contacts
Smaller Pitches
Thinner/densermore complex packages
Stacked Structures 3DFrom Simple Wire Bond to BGA/Flip Chip to Complex 3D structures with TSVs,
Microbumps and thin dies

Thin Die Usage Is Becoming Increasingly More Important in Key End Use/Process Applications
24
Memory Power Flip ChipDrivers Increased volume
Increased density
Vertical stacking to compensate for slower lateral shrink
Thermal ConductivityLower resistance
Thinner packages
Current Die Thickness
22 um 40 um 100 um
Future spec < 15 um 25 um 50 um
Examples
• Die thickness anticipated to reduce by 35-50% over next 3 years
June 2015

Besi Is Winning in Thin Die ArenaDB 2100 Example
2100 sDplus / 2100 sD PPPplus
June 2015 25
Technology Besi Spec Competition
Disc basedThin Die Ejector
No
Dual StepFusionDie Bonding
No
Fast ChangeoverDual Mode
No
Die CrackDetection
No
High Speed &High Accuracy
15.000& 10 um
No

Thermo Compression Bonding Is An Emerging Assembly Technology
TCB: Next Die Bonding Process Evolution:
• Besi has most advanced concept in the industry
• 7 Axis bondhead• 2 bond heads per system• High throughput => 2x competition• Compact design • User friendly
• Orders/production significantly expanded in 2015• Memory producers first adopters
• Principal competition: ASM PT, KLIC (in development) TORAY SHINKAWA
• Production transferred to Besi APac to reduce cost
• Added control functions and production features
26June 2015

TCB Solution in Advanced Memory Cube Application
June 2015 27
Per
form
ance
Time
Issue: Memory performance lags CPU performance
Solution: Advanced stacking design using TCB with TSV capabilities
• 15x Higher transfer speeds• 70% Less energy per bit• 90% Less space• Wire bonding process eliminated
Connected using Thermal Compression Bonding
GapIn performanceCPU-Memory
Wire Bond connections replaced by direct connection
Wire Bonded BGA Stacked Die Memory Device
TSV TCB Memory Cube

eWLB Is Another Emerging Die Bonding Technology
28June 2015
eWLB = Embedded Wafer Level Ball Grid Array
Utilized for extremely small form factors such aslogic processors
Besi Chameo FC 8800 only proven system torelocate up to 40,000 chips on carrier very precisely over whole 12“ wafer at high speed and accuracy (<2um)
• Besi‘s expanded wafer size thin molding and exposed die molding eliminates mold back grinding

Besi Packaging Technology Update
29
Key Packaging Trends
Besi Spec Competition
Ultra thin molding .12 mm One stepNo warpage
.2 mm2 stepsNegative
Narrow underfill 30 um proven 40 um
Exposed dies Foil based, no further process steps
Back grinding step required
Shielding Flexible FSL concept Limited flexibility
Larger wafer sizes 340x340 mm Same
Odd mold formats Ultra precise molding Less precise
June 2015

Besi Offers Leading Edge Molding Technology
First Generation
Product designed around SMT board and standard package
• Package is square or right angular
• Standard functionalities
Current Generation
SMT board dictated by product design. Packages become thin and multifunctional
• Very thin moldcap (<120 um)
• Narrow underfill for flip chip packages (<30um)
Next Generation
Package is defined by product
• Package has odd shapes to fit in device
• More MEMS devices => exposed die
• Shielding of products to prevent communication interference
30June 2015
First Generation
Current Generation
Evolution
Integration
Next Generation

Ultra Thin Molding Is Critical Assembly Packaging Process Technology
• Shift to <28 nano advanced electronics applications has increased Besi’s AMS-LM revenue by 100%+ over past two years
• Besi AMS-LM only system which can deliver these specs
• Currently qualified for ALL 2015 tablet and smart phone platforms
Key Features:
• Can reach .12 mm overall package thickness
• One step molding of molded underfill and bleed free products
• Flash and bleed free product
• No warping
• Mold cap polarities of +/- 5 um
31June 2015
Ultra Thin Molding exposed die with underfill TCB

Wafer and Large Area Molding Is Another Important Process Development
Besi has most advanced molding capabilities inthe industry:
• Large area molding up to 340 mm x 340 mm
• eWLB and C2 wafer applications
• Overmolded and exposed capabilities
• Exposed solder balls
• Glass and silicon interposer molding
• Thin moldcap moving to <250 mm
32June 2015

Key Development Objectives - Timetable
Development Objectives
Advanced TCB die bonding development
Introduction of next generation packaging systems
Common parts/platform activities
2015 2016
33June 2015

Summary
• Semiconductor packaging plays an increasingly important role in electronicsas IC devices get smaller, denser and more complex with increasedfunctionality
• In new technology cycle due to the Internet of Everything
• Besi product portfolio and process technology is at forefront of advanced packaging trends
34June 2015
IV. OPERATIONS REVIEW
35June 2015

Current Operational Profile
as of 31 March 2015
Europe/NA Asia
Revenue (MMs) € 33.2 35.0% € 61.7 65.0%
Headcount 664 39.5% 1,016 60.5%
• Development activities in Europe
• Production and sales/service activities in Asia
Sales Office
Production Site
Sales & Production Site
* R&D Site
Leshan
ChengduShanghai
Korea
Taiwan
PhilippinesMalaysia
Singapore*
Suzhou
Radfeld, (Austria)*Cham,(Switzerland)*
Duiven & Drunen,(The Netherlands)*
Chandler
Shenzhen
36June 2015

Asian Production Has Significantly Expanded
396
487
658 673
963
170
331
553 579
927
42.9%
68.0%
84.0% 86.0%
96.3%
0.0%
10.0%
20.0%
30.0%
40.0%
50.0%
60.0%
70.0%
80.0%
90.0%
100.0%
-
200
400
600
800
1,000
1,200
2010 2011 2012 2013 2014
% D
irect
Shi
pmen
ts
Shi
pmen
ts
Total Asian Shipments Direct Asian Shipments % Direct
37June 2015

Leading to Lower European Headcount
• Fixed European/North American headcount reduction:• Down 19.4% since 2011• Declined from 56% of total in 2009 to
39% at Q1 2015
741 680 624 602 597
802 799
810 908 933
1,543 1,479
1,434 1,510 1,530
-
200
400
600
800
1,000
1,200
1,400
1,600
1,800
2011 2012 2013 2014 Q1 2015
Hea
dcou
nt
Europe/NA Fixed HC Asia Fixed HC Total
52%
48%
54%
46%
56%
44%
60%
40%
38
61%
39%
June 2015

And Also Reduced Break Even Revenue Levels
270
235
212 207
-
50
100
150
200
250
300
2011 2012 2013 2014
(€m
illio
ns)
(13.0%)
(9.8%)(2.4%)
39June 2015
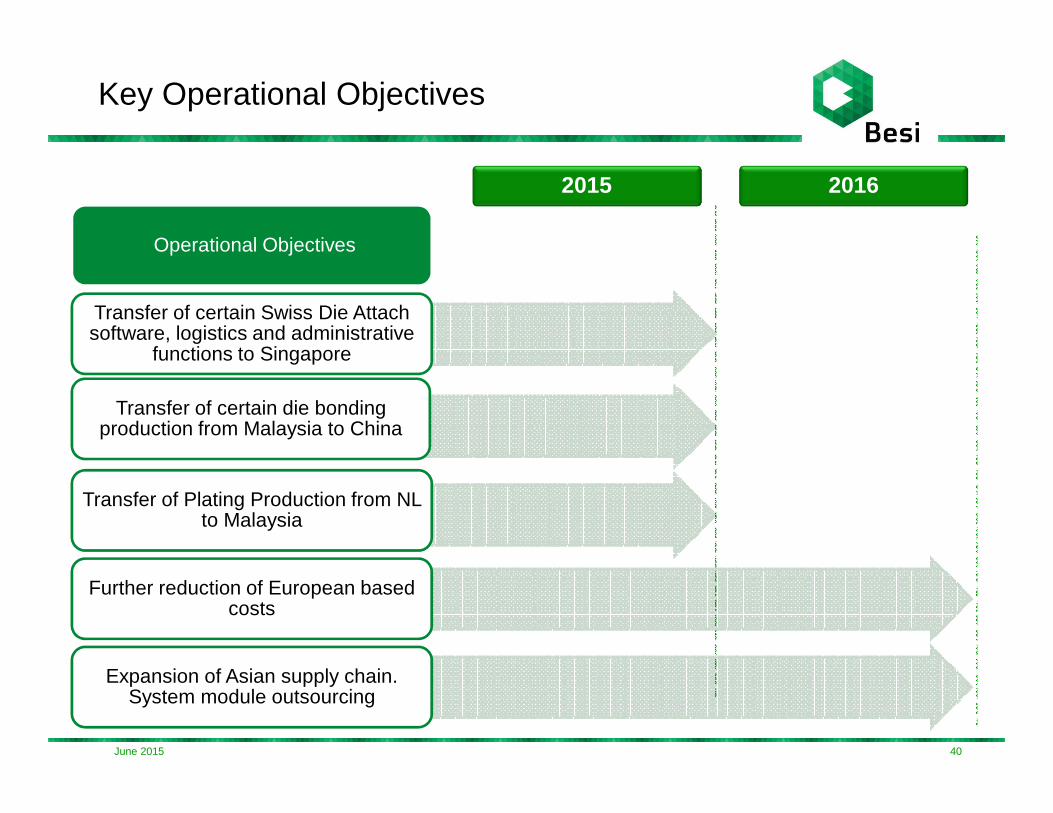
Key Operational Objectives
Operational Objectives
Transfer of certain Swiss Die Attach software, logistics and administrative
functions to Singapore
Transfer of certain die bonding production from Malaysia to China
Transfer of Plating Production from NL to Malaysia
Further reduction of European based costs
Expansion of Asian supply chain. System module outsourcing
2015 2016
40June 2015

Besi Switzerland/Singapore Function Transfer
41June 2015
• Transferring certain die attach software engineering, logistics and related admin functions by end of Q4-15
• Swiss headcount to be reduced by 55 people or 40%
• Singapore headcount to increase from 75 to 125 people
• Current Singapore facility of 17,800 sq. ft. Minimal additional capex necessary
• Annualized cost savings of approximately € 6.5 million • Includes € 0.5 million of Cham CH facility savings
• Total net pre-tax restructuring benefit of € 3.7 million recorded in Q1-15• Pension related curtailment gain of € 5.3 million• Partial offset: restructuring charges of € 1.6 million• Minimal Q2-15 impact

Besi China Die Bonding Production Transfer
42June 2015
74,000 sq. ft. Leshan facility principally manufactu res molds, mold sets and spare parts. 257 employees currently
Transferring DB 2100 SD epoxy die bonding productio n for the Chinese market from Malaysia to Besi China
• Locate production closer to end customer with potential for incremental revenue
• To be completed by year end 2015
• Potential annualized cost savings: € 1.0 million/annum
• Capex requirement: € 0.3 million
• Incremental headcount required: 42 people

Plating Production Transfer from NL to Malaysia
• Transfer underway to move plating production from Drunen, NL to Malaysia facilities by end of 2015
• Intellectual property and engineering to remain in Drunen
• Benefits:
• Increase manufacturing flexibility• Reduce cycle times• Increase revenue potential with direct Asian presence
• No material restructuring costs required
• Potential 5%+ gross margin improvement on plating production in 2016
43June 2015

Further Reduction of European Based Costs
44June 2015
• Total of 574 fixed European headcount at March 31, 2015
• Approx. 10% headcount reduction by year end 2015
Further reduction of European personnel costs
• 4 European facilities currently• Duiven NL 154,000 sq. ft. (leased)• Drunen NL 53,000 sq. ft. (leased)• Cham, CH 83,500 sq. ft. (leased)• Radfeld, AU 125,400 sq. ft.(owned)
Total 415,900 sq. ft.• Reducing footprint of Duiven and Cham facilities by 111,500 sq. ft. (27%) by end of 2016
• Potential annualized cost savings of € 1.5 million, net
Achieve cost savings from facility consolidation
Besi Switzerland Besi Austria
Besi NetherlandsDuiven
Besi NetherlandsMeco Drunen

Materials Cost Reduction Is Also a Key Priority
• Qualify and Select Asian Vendors• 75% of material is now purchased in Asia
Supply Chain Actions
• Redesign products• Increase standardization of systems
• Component parts• Modules
Development Actions
45-50% thru cycle Gross
Margin
• Material costs represent approximately 45% of revenue• Shift to Asia centric supply chain:
• Reduces transport, inventory costs and obsolescence• Improves cycle time and ramping flexibility
• Management Board reviews progress weekly component by component
45June 2015

Asia Supply Chain Transfer Progress
46June 2015
Estimated savings 2014 2015E 2016 - 2017E
Headcount € 0.9 MM € 2.8 MM € 1.0 MM
Materials Cost € 2.7 MM € 1.6 MM € 1.5 MM
Subtotal € 3.6 MM € 4.4 MM € 2.5 MM
2015 Focus 2016 - 2017 Focus
DB Spares & Module Assembly
Completed in 2015
Transfer PlatingNL-MY
Completed in 2015
Transfer DB 2100MY-China
Extend Supply Chain inside ChinaStart transfer DB 2009 and EVO MY-China
Swiss/MY transfer Transfer last remaining modules possible to Asia
WB Spares & Module Assy
Completed in 2015

V. FINANCIAL REVIEW
47June 2015

€ 70.0
€ 94.9
10.0%
18.5%
0%
5%
10%
15%
20%
25%
30%
35%
40%
45%
50%
55%
60%
65%
70%
75%
80%
85%
90%
95%
€ 0
€ 25
€ 50
€ 75
€ 100
Q1 2014 Q1 2015
Net
mar
gin
%
€m
illio
ns
Revenue Net Income
Gross Margin
OPEX
Headcount
Effective Tax Rate
11.6% 12.9%
1,569 1,680
€ 21.5 MM
€ 25.3 MM
+111
+1.3 points
+17.6%
42.3% 49.0%
+35.6%
+8.5 points
Q1-15/Q1-14 FY 2014/FY 2013
+6.7 points
€ 17.5
€ 254.9
€ 378.8
6.3%
18.8%
0%
5%
10%
15%
20%
25%
30%
35%
40%
45%
50%
55%
60%
65%
70%
75%
80%
85%
90%
95%
0 €
50 €
100 €
150 €
200 €
250 €
300 €
350 €
400 €
2013 2014
Net
mar
gin
%
€m
illio
ns
Revenue Net Income
Gross Margin
OPEX
Headcount
Effective Tax Rate
15.8% 0.3%
1,458 1,632
€ 82.7 MM
€ 93.8 MM
39.8% 43.8%
+174
-15.5 points
+13.4%
+4.0 points
+48.6%
+12.5 points
€ 71.1
€ 16.1€ 7.0
Revenue Growth and Margin Expansion Yield Increased Profitability
48June 2015

• Cyclical quarterly revenue/order patterns :• Three cycles past 3 years• Short term patterns due to customer caution and increased seasonality
• 2014 year end shows higher base line order levels than prior years
• Gross margins have improved despite cyclicality :• Increased scalability of production model• Shift to higher margin advanced packaging systems
• Lower unit costs due to:• Asian production transfer• More direct shipments• Reduction in European personnel• Favorable USD/euro starting in H2-14
Revenue/Order/Gross Margin Trends
72 65
53
70
116
104
8994.9
83
48 57
111
124
91
81
104.2
40.4%39.2%
40.1%
42.3%43.2%
45.3%
43.8%
49.0%
48.2%
35.0%
40.0%
45.0%
50.0%
55.0%
60.0%
-
20
40
60
80
100
120
140
Q2-13 Q3-13 Q4-13 Q1-14 Q2-14 Q3-14 Q4-14 Q1-15G
ross
Mar
gin
%
euro
in m
illio
ns
Revenue Orders
Gross Margin Adjusted Gross Margin
49June 2015

Net Income Trends
7.0
3.4
12.2 14.2
(0.5)(2.0)
7.5
3.3
6.5
4.41.4
7.0
22.9
21.5
19.7
17.5
9.0%6.8%
2.7%
10.0%
19.7%20.8%
22.2%
18.5%
-25%
-15%
-5%
5%
15%
25%
35%
(3)
0
3
6
9
12
15
18
21
24
Q2-13(a)
Q3-13 Q4-13(a)
Q1-14 Q2-14 Q3-14 Q4-14(a)
Q1-15(a)
(eur
o in
mill
ions
)
Net Income ex. NR Non Recurring Net Margin
50
• Quarterly net income trends reflect industry and seasonal volatility
• Profit/margin increase aided by revenue growth, through cycle gross margin expansion and opex leverage in business model
• Significant reduction in effective tax rate has also helped
• Net margin of 18.5% in Q1-15, up significantly from 10.0% in Q1-14
(a) Adjusted to exclude:• After tax net restructuring (Q1-15)• Deferred tax benefits (Q4-14)• € 0.5 million and € 2.0 million non recurring charges in Q2-13 and Q4-13, respectively
June 2015
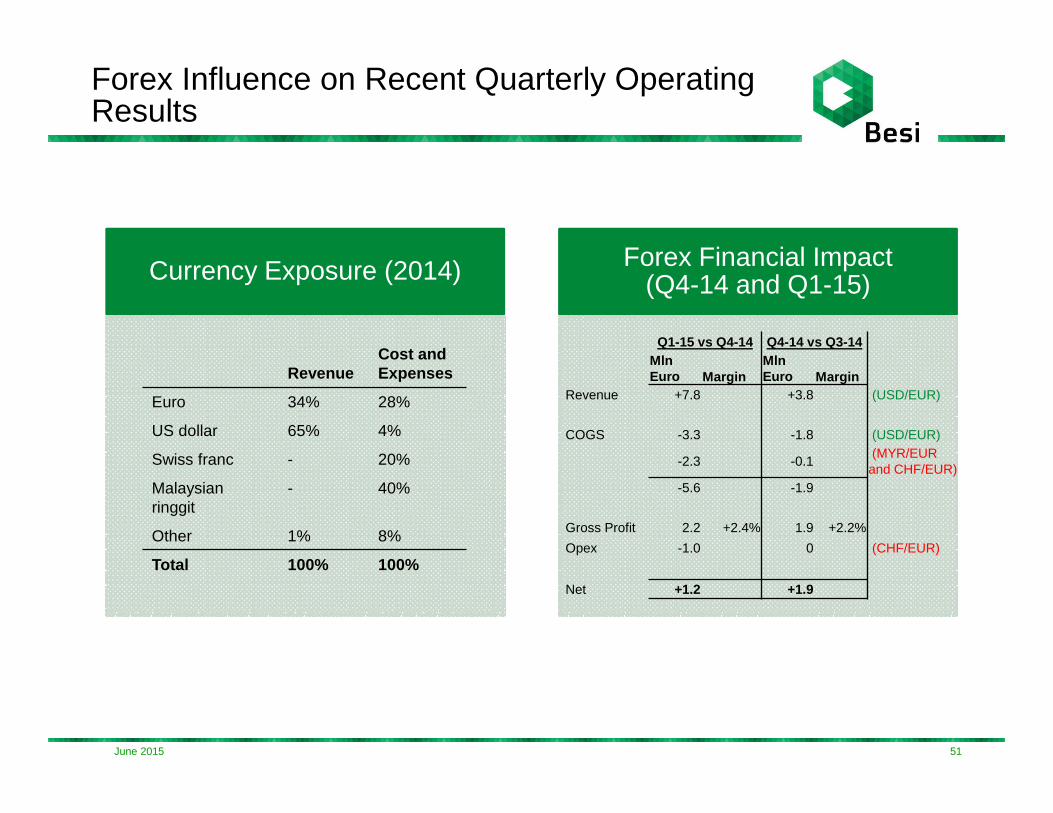
Forex Influence on Recent Quarterly Operating Results
51June 2015
Currency Exposure (2014) Forex Financial Impact (Q4-14 and Q1-15)
RevenueCost and Expenses
Euro 34% 28%
US dollar 65% 4%
Swiss franc - 20%
Malaysianringgit
- 40%
Other 1% 8%
Total 100% 100%
Q1-15 vs Q4-14 Q4-14 vs Q3-14MlnEuro Margin
MlnEuro Margin
Revenue +7.8 +3.8 (USD/EUR)
COGS -3.3 -1.8 (USD/EUR)
-2.3 -0.1(MYR/EURand CHF/EUR)
-5.6 -1.9
Gross Profit 2.2 +2.4% 1.9 +2.2%
Opex -1.0 0 (CHF/EUR)
Net +1.2 +1.9

Liquidity Trends
• Solid liquidity position• € 161.9 million cash at 3/31/15• € 4.29 per share vs. € 29.87 price (as of March 31, 2015)
• Net cash reached € 133.1 million at end of Q1 2015
• Has Been Utilized to Enhance Shareholder Value• € 114 million spent on cash dividends and
share repurchases 2011-2015• Includes May dividend payment
• Strong balance sheet helps support future organic growth and acquisition opportunities
52
81.1 78.5
89.6 91.9 83.8
105.4
135.3
161.6
24.9 22.5 18.6 19.1 21.3 19.3 17.3
28.5
56.2 56.0
71.0 72.8
62.5
86.1
118.0
133.1
0
20
40
60
80
100
120
140
160
180
Q2-13 Q3-13 Q4-13 Q1-14 Q2-14 Q3-14 Q4-14 Q1-15
(eur
o in
mill
ions
)
Cash Debt Net Cash
52June 2015

Q2-15 Guidance
Revenue Gross Margin* Operating Expenses*
Q1 Q2 Q1 Q2 Q1 Q2
€ 94.9 48.2% € 28.3
Up10-15%
• Underlying business growth continues• Revenue up approximately 10-15% vs. Q1-15 • Gross margins of 46-48%• Opex up 5-7% vs. Q1-15 due primarily to higher forex, R&D and warranty• Sequential Q2-15 and H1-15/H1-14 revenue and net income growth
Up5-7%
*excluding restructuring benefit
48%-
46%
53June 2015

Summary
Leading semi assembly equipment supplier with #1
or #2 positions in fastest growing assembly
segments
Technology leader. Best in class product portfolio
Gaining market share in advanced packaging
Scalability and profitability of business model greatly
enhanced in cyclical industry
Significant upside potential.Advanced packaging
growth, operating initiatives and optimization of Asian
production model
Committed to enhancing shareholder value.
Attractive dividend yield relative to peers
54June 2015

Financial Calendar
55
24-Jun-15 Rabobank “Made in Benelux” Conference, London, United Kingdom
23-Jul-15 2015 Second Quarter Results
12/13-Aug-15 Canaccord Genuity Growth Conference, Boston, USA
9/10-Sep-15 ING Benelux Conference, London, United Kingdom
16/18-Sep-15 Kepler Cheuvreux Autumn Conference, Paris, France
22-Oct-15 2015 Third Quarter Results
11/13-Nov-15 Morgan Stanley European TMT Conference, Barcelona, Spain
June 2015