Embed Size (px)
Citation preview

BASEMEN
,


HD28.M414\o.inoi-
WORKING PAPER
ALFRED P. SLOAN SCHOOL OF MANAGEMENT
Targeted Repurchases eind Common Stock Retxirns
Wayne H. Mikkelson
College of Business Administration
Richard S. Ruback
Sloan School of ManagementMassachusetts Institute of Technology
WP#1707-85 September 1985
MASSACHUSETTS
INSTITUTE OF TECHNOLOGY50 MEMORIAL DRIVE
CAMBRIDGE, MASSACHUSETTS 02139


/Targeted Repurchases and Common Stock Returns^
Wayne H. MikkelsonCollege of Business Administration
Richard S. RubackSloan School of Management
Massachusetts Institute of Technology
WP#1707-85 September 1985


Targeted Repurchases and Cofflmon Stock Returns
Wayne H. MikkelsonCollege of Business Administration
University of Oregon
and
Richard S. RubackSloan School of Management
Massachusetts Institute of Technology
September, 1985
COMMENTS WELCOME
Preliminary Draft : Please do not quotewithout author's permission
Part of the research was completed while Ruback was a Batterymarch ResearchFellow. This research was also supported by the National Science FoundationGrant SES-8420677.

NOV 7 1985 ;

1 . Introduction
Targeted share repurchases, popularly called greenmail, have come under
strong criticism. Critics of targeted repurchases argue that these
transactions thwart desirable takeovers and reduce the wealth of shareholders
excluded from the repurchase. It is also argued that evidence of negative
stock price responses to the announcement of a targeted repurchase supports the
position of opponents of these transactions. As a result of the objections
raised and the initial empirical evidence, federal legislation has been
proposed that requires stockholder approval of targeted repurchases under
certain circumstances.
The purpose of this paper is to provide new evidence and a different
interpretation of stock price effects for firms that buy back shares in a
targeted repurchase. Existing evidence consists primarily of average stock
price effects for the repurchasing firms at the announcement of a targeted
share repurchase. This study expands the measurement of stock price effects to
include the period in which the eventual seller's investment position was first
publicly disclosed as well as the dates of potentially important subsequent
events that are related to investment position. We estimate the total stock
price effect of all events related to the investment and the eventual
repurchase
.
The principal finding of this study is that stockholders of repurchasing
firms benefit from investments that conclude with targeted repurchases. The
average total abnormal return for our sample of repurchasing firms is 6.8%.
1. Articles by Kirkland (1984) and Boland (1984) are examples of
discussions of the greenmail debate in the financial press. In the 99thcongress, the pending targeted repurchase legislation includes S286, S420,
S476, and HR1003. Dees (1985) discusses the ethical issues associated withtargeted repurchases
.

Consistent with the results of previous studies, we find a statistically
significant decline in the stock prices of repurchasing firms of -3.8% at the
targeted repurchase announcement. But this decline is more than offset by
stock price increases that are associated with the disclosure of the initial
investment and with other related intervening announcements.
Even for targeted repurchases that follow a control contest, the negative
stock price effect of the targeted repurchase is offset by the positive effects
of preceding events that are related to the investment. The average stock
price decline for repurchasing firms is -6.3* when the targeted repurchase is
preceded by a control contest and -2.8* when no control contest precedes the
targeted repurchase. However, the stock price increases prior to the targeted
repurchase announcement are substantially larger for investments that involve
control contests. The total abnormal returns, measured from the beginning of
the investment through the targeted repurchase, are similar for the two sub-
samples: 7.1* for targeted repurchases preceded by control contests and 6.8%
for other targeted repurchases. Therefore, these two types of investments are
equally beneficial to shareholders of the repurchasing firms - even though the
stock price decline associated with the targeted repurchase announcement is
larger when it follows a control contest.
One third of the targeted repurchases are accompanied by standstill
agreements, which limit additional investments in the repurchasing firm by the
seller for a specified time period. For these repurchases, the average
abnormal stock return associated with the targeted repurchase announcement
is -9.2*. This negative announcement effect completely reverses the favorable
effects of preceding announcements. The average total abnormal return from the
initial investment through the repurchase for the repurchases that
areaccompanied by standstill agreements is 1.3*, which is not statistically
different from zero. In contrast, the average total abnormal return for

targeted repurchases that are not accompanied by standstill agreements is 9.9%,
which is statistically significant.
We investigate two explanations of the stock price declines associated
with targeted repurchase announcements. The information reversal effect
relates the stock price declines to the reversal of favorable expectations
formed prior to the targeted repurchase announcement, such as the anticipation
of a takeover bid. The effect predicts that the stock prices changes at the
time of targeted repurchase announcement are inversely related to the preceding
stock price changes and are due to the decreased likelihood of a more favorable
outcome. Therefore, the negative stock price effects of the targeted
repurchase do not necessarily reflect a decision which is contrary to the
stockholders' interest. The premium effect relates the stock price declines at
the targeted repurchase to the premium paid to the selling stockholder. The
information reversal and premium effects are not mutually exclusive. Our
results suggest that the information reversal effect is useful in explaining
the cross-sectional variations in the abnormal returns at the targeted
repurchase announcement. However, the premium effect does not appear to be
important in explaining the targeted repurchase abnormal returns for
repurchasing firms.
Overall, our evidence raises the burden of proof for those who argue that
targeted repurchases harm the repurchasing firm's shareholders. The argument
that a targeted repurchase harms shareholders requires evidence that the
targeted repurchase was dominated by an alternative course of action. Evidence
of only price effects cannot determine whether repurchases are in stockholders'
interests
.
2 . Sample Characteristics
2 . 1 Sample Design
Our final sample of 112 targeted repurchases is derived primarily from

three sources. First, we use the sample of targeted repurchases examined in
2Mikkelson and Ruback (1985). Second, citations of stock repurchases are
examined in the "reacquired shares" subject entry of The Wall Street Journal
Index for the years 1980 through 1983. Third, we use listings of targeted
repurchases compiled by two underwriting firms.
The final sample of repurchases satisfies three requirements. First, the
repurchasing firm was listed on the New York and American Stock Exchange at the
time of the targeted repurchase announcement. Second, a published report of
the initial public announcement of the targeted repurchase appeared in The Wall
Street Journal or The New York Times. Third, we could determine a date of the
Initial public disclosure that the investment position reached 5* or more of
the repurchasing firm's outstanding shares. This requirement is included so
that the stock price effect can be measured from the initial disclosure of the
investment position to the targeted repurchase announcement. The 5% level is
used because the Williams Act requires stockholders to report this level of
ownership in a schedule 13d filing within 10 days of its attainment. The Wall
Street Journal Index was examined back through the 1975 volume for an initial
public disclosure of the investment position that was eventually repurchased.
The SEC New Digest was searched around the time of an initial public disclosure
in the The Wall Street Journal for the date of a filing of Schedule 13d. We
also searched issues of the Insiders Chronicle for the date on which a 5% or
3 4greater ownership position was first attained.
2. We excluded 7 targeted repurchases included in the Mikkelson and Ruback
(1985) sample because the target firm was not listed on the American or NewYork Stock Exchange.
3. In May 1982 the SEC News Digest ceased reporting the filing date of
Schedule 13d and began reporting the date on which a 5% ownership position was
reached
.
4. The final sample does not include repurchases from a current or formerofficer of the repurchasing firm. Our requirement of identifying an "initial
date" for the investment eliminated targeted repurchases from theseindividuals. Bradley and Wakeman (1983) report the price effects of targeted
repurchases from insiders of the repurchasing firm.

2 .2 Descriptive Statistics
The distributions by calendar years of the initial disclosures of the
investment position and the targeted repurchase announcements are reported in
columns 2 and 3 of Table 1. Our sample selection restricts the announcements
of targeted repurchases to the years 1978 through 1983. More than two thirds
of the 112 targeted repurchase announcements occurred after 1980, the last year
of the sample periods of the Dann and DeAngelo (1983) and Bradley and Wakeraan
(1983) studies. The average number of trading days between the initial
investment announcement and the repurchase announcement is 299 days, or
approximately 15 months. There is substantial variation in the length of the
intervening interval. The interval is less than 100 trading days in 34 cases,
the shortest being 2 calendar days; the interval is more than 500 trading days
(approximately two years) in 20 cases.
In addition to the initial investment and targeted repurchase
announcements, we also collected the dates of Wall Street Journal reports of
related events that occurred between the initial investment and targeted
repurchase announcements. Seventy-nine observations have such related
intervening announcements. The related events include the purchase of
additional shares, a change in investment plans by the acquiring party, a
takeover attempt or proxy contest, any opposition to the investment by the
target company, developments in a lawsuit and a third party attempt to acquire
control. There is at least one intervening report that additional shares were
acquired for 56 observations. There was an intervening announcement of a
tender offer or merger proposal by the acquiring firm in only 3 cases. In
another 12 instances, the acquiring firm or individual( s) announced plans to
seek representation on the target firm's board of directors.
Table 2 presents selected summary statistics for the investments in common
stock that culminated in a targeted repurchase. Based on average sample

Table 1
Distribution by Calendar Years ofInitial Announcewent of Targeted Repurchase
Year
(1)
Nuaber of InitialInvestment Announceaents
(2)
a/Number of TargetedRepurchase Announceaents-
(3)
b/
1976
1977
1978
1979
1980
1981
1982
1983
1
2
16
20
27
24
17
5
5
8
21
24
26
28
1976-83 112 112
a/
b/
The initial investaent announcenents include a Wall Street Journalarticle if available or a report of a Schedule 13D filing in either the
SEC News Digest or the Insiders Chronicle .
The announcements were reported in The Wall Street Journal orThe New York Times
10
n "0
n 1•o nC 3•S M-o c=r 3Q) 00
wH^3 1
i-b nw-
3 OC
rf ^«O li-
re
Q. a«SOS CB
h-- re
on Q.
O i-h
re
3- re
re 3o
rf re
TO re
re r*
re re
a. re
1re r*•O S'c re
n 13- re
T3C•-5
O3-
CO
re
1
09
re
33Oc3Ore ^-'•
B ore re
3n• 3a
rt-
3rre
09
f+oo?r
o
ore
o
3"re
H

values, the size of the investment position in common stock increases
substantially from the initial Investment announcement to the targeted
repurchase announcement. The average percentage of ownership stake increases
froB 7.6* to 12.8*. The average dollar value of the initial Investment
position is $14.5 nillion and the average value of the repurchase transaction
is $30.9 Billion. The average premium paid over market value at the time of
the targeted repurchases is 19* or $4.7 million. On average the premium paid
in the targeted repurchase is 2.8* of the value of the repurchasing firm's
common stock measured two days before the targeted repurchase announcement.
Thus, the premiums paid in targeted repurchases are economically significant.
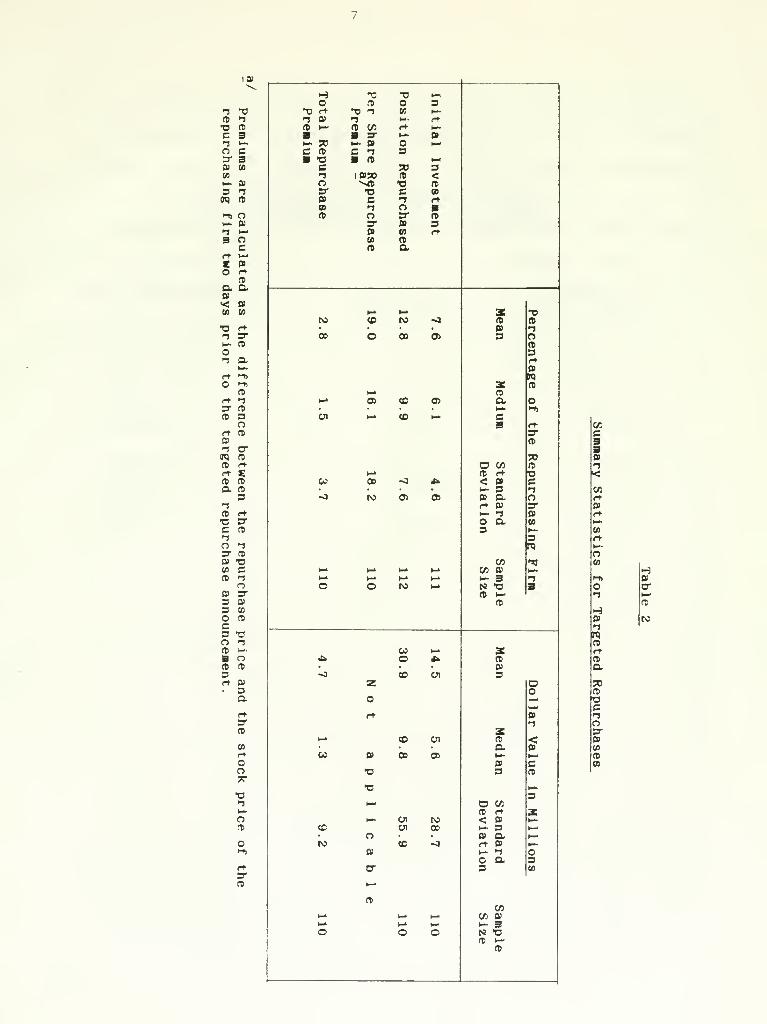
Each targeted repurchase is classified by whether it is associated with a
control contest at any time prior to the repurchase announcement and whether it
is accompanied by a standstill agreement. The first row of Table 3 indicates
that 33 repurchases, or 30* of the sample, are associated with a prior control
contest. We include an observation in the prior control contest category when
was an indication that the acquiring firm or investor sought board
representation or control, or considered seeking board representation or
control. Only 5 of the targeted repurchases were preceded by a tender offer
for control or a merger proposal. It was reported prior to another 10
repurchases that the investor was considering a takeover attempt. In 14 cases
plans to seek board representation were announced. In 10 of these cases, a
proxy contest ensued. Consideration of plans to seek representation on the
target firm's board was announced prior to another 5 repurchases. This summary
of actions that precede a targeted repurchase agreement does not support the
popular view that targeted repurchases generally thwart an outstanding takeover
attempt. Also, a standstill agreement, in addition to the targeted repurchase,
was reported in 39 cases. Fifteen targeted repurchases are associated with
both prior control contests and standstill agreements.
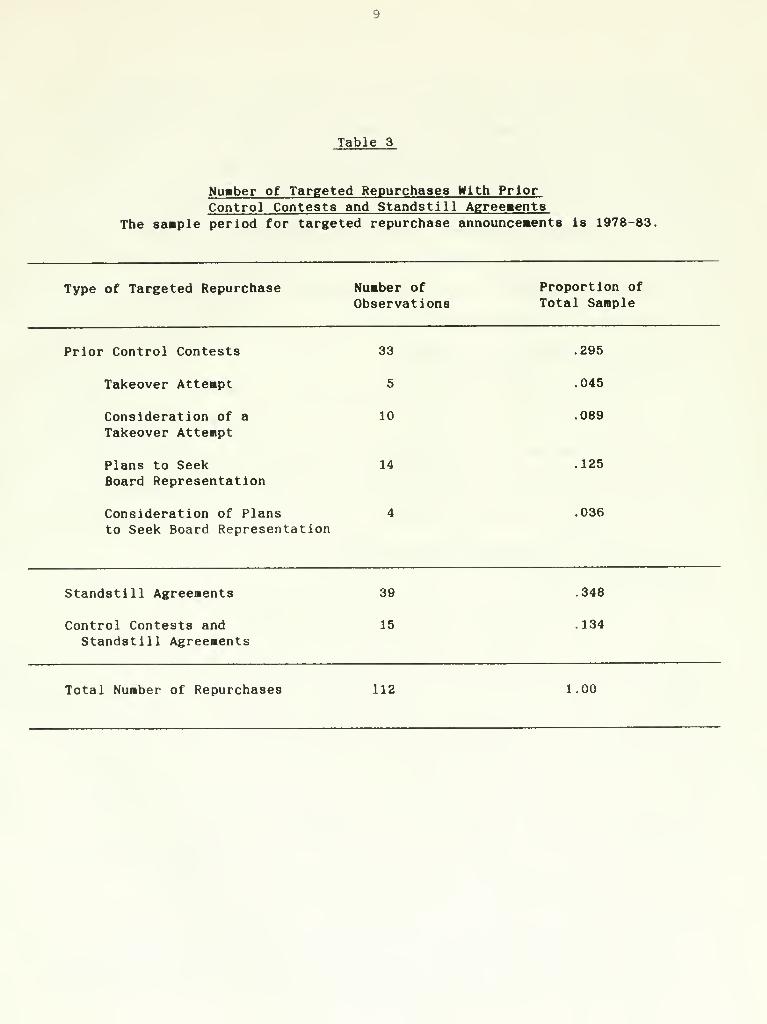
Table 3
Number of Targeted Repurchases With PriorControl Contests and Standstill Agreeaents
The sample period for targeted repurchase announceaents is 1978-83.
Type of Targeted Repurchase Number

10
Only one repurchasing firm (Zapata Corp.) appears more than once in the
sample of targeted repurchases. However, there are several firms that appear
ore than once in the sample as the seller in a targeted repurchase
transaction. The most frequently represented nationally listed selling firms
are Gulf and Western (9 purchases), Crane Corp. (4 purchases) and Walco
National (4 repurchases). In addition, firms controlled by Victor Posner are
associated with 8 targeted repurchases in the sample. Carl Icahn and the
Belzburgs are each associated with 3 repurchases.
3. Method of Measuring Abnormal Returns
The event study method pioneered by Fama , Fisher, Jensen, and Roll (1969)
is used to measure the price effects of the initial investment, intermediate
and outcome announcements. Since most stocks tend to move up or down with the
market, the realized stock returns are adjusted for market-wide movements to
isolate the component of the returns due to events related to the investment.
This adjustment is accomplished using linear regression to estimate the
5following market model:
R.^ = a. + ^.R ^ + £ .^. (1)Jt J "^J mt jt
The parameter p. measures the sensitivity of the jth firm's return (R. ) to
movements in the market index (R ^). The term B .R ^ In equation (1) is themt J mt
portion of the return to security j that Is due to market-wide factors. The
parameter a. measures that part of the average return of the stock which is not
due to market movements. Lastly, z. measures that part of the return to the
firm which is not due to movements in the market or the firm's average return.
Two sets of coefficients are estimated for each firm to incorporate
potential changes in the market model parameters. Coefficients before the
5. Fama (1976) describes the market model in detail.

11
initial announcement, a and p , are estimated using dally returns beginningB o
260 trading days before the initial announcement and ending 61 days before the
initial announcement. Similarly, coefficients after the targeted repurchase
announcement are estimated over the period beginning 61 days after the
announcement (if returns are available) thorough 260 days after the
announcement. In those cases in which 100 days of data are not available to
estimate either the before or after coefficient, returns before the initial
announcement and after the outcome announcement are combined to estimate the
coefficients. In all cases, returns for the 60 days before the Initial
announcement through 60 days following the outcome annoucement are excluded
from the estimation period.
Prediction errors are calculated for each firm for 60 days prior to the
initial announcement through 60 days after the targeted repurchase announcement
according to the following expression: „
B B •
R.^ - (a. + e .R ^) for t < Initial announcementJt J "^J mt
PE.^ = (2)J^ -A 'A
R.^ - (a. + 6 .R ^) for t > initial announcementJt J ^j mt -
The prediction errors equal the deviation of the daily returns from their
estimated normal relation with the market and represent abnormal returns. The
average abnormal return over an interval of days defined relative to an event
date for a sample of firms is calculated by summing the prediction errors over
the holding period for each firm and then averaging across firms.
To test the statistical significance of the abnormal returns, we compute
the following t-statistic:
6. When there are missing stock returns within a holding period, the normal
return is cumulated over the days in which there are missing stock returns.
This cumulative normal return is subtracted from the next observed stock return

12
t =
J
Z
j = l T =T,
PE.
T =T
Var(PE .^)Jt'
(3)
where t and t are the first and last days of the interval; J is the number of
observations and Var (PE ) is the variance of the prediction error of firm j
|n day t. The variance of the prediction errors is:
Var(PE.^) = S.Jt' J
(R
1 +mt _jni_
(N - l)Var(R )
m
(4)
,2 .
In (4), S. is the residual variance from the market model regression, R . isJ mj
the average market return over the estimation interval, and N is the number of
7days used to estimate the market model. The t-statistic adjusts for
hetroskediasticity in the prediction errors by standardizing the cumulative
prediction error for each firm by its standard deviation. This standardization
gives less weight to the prediction errors with more volatility, which are
measured less precisely.
4 . Common Stock Returns
4 . 1 Abnormal Returns Prior to and at the Initial Investment Announcement
Table 4 presents the average prediction errors for repurchasing and
selling firms for selected holding periods prior to and including the initial
investment announcement. These announcements appear to increase the stock
to calculate the abnormal return.7. The formula for the variance of PE . assumes that prediction errors are
independent across firms. We calculate the variance of the cumulativeprediction errors over event time as the sum of the individual variances. Thisis only an approximation since it ignores the covariances between predictionerrors
.
8. The average abnormal return and the t-statistic can differ in signbecause the former assigns uniform weights to each observation whereas the
latter assigns non-uniform weights (equal to the inverse standard deviation) to
each observation. A difference in sign is most likely to occur when the

13
Table 4
Average Prediction Errors Before and At the Initial Invesfent Announceaent
.
The sample period for targeted repurchase announcements Is 1978-1983;
t-statlstic. percent positive, and sample size are In parentheses.
a/Holding Period - Repurchasing Selling
Firms Firms
ID-60 to ID-41 0.74* 1.11%
(1.27,53,111) (0.95,48.52)
ID-40 to ID-21 3.51 -2.72
(3.43.57.111) (-1.76.38,52)
ID-20 to PD-1 2.57 -1.03
(3.84,53.111) (-0.95.38.52)
PD to ID-2 5.25 0.51
(8.63.70,101) (0.85,45,47)
ID-1 to ID 3.68 0.71
(13.02,72,111) (2.02,54,52)
a/ID Is the initial investment announcement date, which is the date of a
Wall Street Journal report or the date of a Schedule 13d filing with the SEC
PD is the purchase date, which is the date a five percent position in the target
firm was attained. When the purchase date cannot be determined, PD is defined to
be10 days prior to the date of the 13D filing.

14
prices of both repurchasing and selling firms. The average prediction error
for the day before and day of the initial investment announcement is 3.68% for
repurchasing firms. This is statistically significant with a t-statistic of
13.02 and 12% of the individual two-day prediction errors are positive. For
selling firms, the average prediction error over the two-day initial investment
period is 0.71* with a t-statlstic of 2.02. These significant positive
prediction errors at the initial disclosure of a 13d filing are similar to
those reported in Mikkelson and Ruback (1985) for all filings by listed firms
that occurred during 1978 through 1980 and are not associated with an
9outstanding takeover proposal. Therefore, the positive abnormal returns
associated with the Initial investment announcements are not peculiar to
investments that terminate in targeted repurchases.
Table 4 also indicates that repurchasing firms realize positive abnormal
returns in each holding period prior to the initial investment announcement.
Only the average prediction error in the period ID-60 to ID-41 is not
statistically significant. The largest average prediction error for
repurchasing firms is 5.25% with a t-statistic of 8.63 which occurs over the
period from the purchase date (PD) to two days prior to the initial investment
(ID-2). The purchase date is the day that the selling firm first obtained a 5%
position in the purchasing firm. In contrast, there are no significant
average abnormal returns are close to zero.9. For 13d filings that are not associated with outstanding takeover
proposals, Mikkelson and Ruback (1985) report average prediction errors of2.88% for target firms and 1.17% for firms that acquired 5% or more of the
target firm.10. In many cases we identified the filing date of Schedule 13d, but not
the date the 5% ownership position was attained. Since regulations require a
filing of Schedule 13d within ten days after reaching the 5% level, we chose to
define the purchase date as ten days before the filing date. In a few casesthere is no purchase date in advance of the earliest public disclosure, becauseThe Wall Street Journal reported plans to purchase shares more than ten days in
advance of a filing with the Securities and Exchange Commission.

15
abnormal returns for selling firms prior to the initial disclosure.
The 13d filing date can occur up to ten days following the attainment of
the five percent block and the filing firm can add to its ownership stake over
this period. Therefore, the difference between the abnormal returns during the
period PD to ID-2 for repurchasing and selling firms suggests that the market
reacts to the increased trading activity in the repurchasing firm's shares
prior to the disclosure of the filing firm's identity. The positive abnormal
returns for repurchasing firms that precede the purchase date may also reflect
the increased trading activity in the repurchasing firm's shares since the
filing firm may have spread its purchases over several weeks prior to obtaining
a five percent position.
4.2 Abnormal Returns At and After The Targeted Repurchase Announcement
Table 5 presents the average abnormal returns for repurchasing and selling
firms associated with targeted repurchase announcements and during selected
holding periods following the announcements. The average prediction error for
the day before and day of the announcement is -3.22% for repurchasing firms
with a t-statistic of -9.64 and 65% of the individual two-day prediction errors
are negative. In contrast, the average prediction error over the same two-day
period is 1.82% for selling firms with a t-statistic of 5.96 and 66% of the
individual two-day prediction errors are positive. These results, which are
consistent with the findings of Bradley and Wakeman (1983), Dann and DeAngelo
(1983), Holderness and Sheehan (1985), and Mikkelson and Ruback (1985),
indicate that targeted repurchase announcements decrease the stock prices of
repurchasing firms and increase the stock prices of selling firms.
There are no significant abnormal returns for selling firms in any of the
holding periods following the repurchase announcement. There are significant
abnormal returns following the repurchase announcement for repurchasing firms,
but the data are difficult to interpret. The average prediction error over the

16
Table 5
Average Prediction Errors At And AfterThe Announceaent Of A Targeted Repurchase
The sample period for the targeted repurchase announceaentsIs 1978-1983; t-statlstlcs, percent positive
and saaple size are In parentheses.
a/Holding Period - Repurchasing Selling
Firms Firms
TR-1 to TR -3.22% 1.82*(-9.64,35,112) (6.96.66,53)
TR+1 to TR+10 -0.31 -1.00(3.02.45.112) (-0.94,38.53)
TR+11 to TR+20 -1.24 0.19(-1.74.34.112) (0.45,51,53)
TR+21 to TR+40 2.33 1.66
(3.43.54.112) (1.58,51,53)
TR+41 to TR+60 -0.34 -0.55
(-0.86.46,107) (-0.37.51.53)
a/TR Is the date of the targeted repurchase announcement,

17
period beginning on the day after and ending ten days after the repurchase
announcement (TR+1 to TR+10), which is an equally weighted average of the sum
of the adjusted prediction errors for the 112 observations during this period,
is -0.31*. But the t-statistic, which weights the adjusted prediction error by
their standard deviation, is 3.02. Thus, the assessment of the abnormal returns
in this holding period depends on the weighting of Individual observations. In
the period TR+11 to TR+20 there are negative abnormal returns of -1.24* with a
t-statistic of -1.74. The average prediction error over the next twenty
days, TR+21 to TR+40, is positive with a t-statistic of 3.43. Finally, the
average prediction error over the period TR+41 to TR+60 is -0.34, which is not
statistically significant. The differences in the signs of the average
prediction errors in various intervals following the repurchase announcement
suggest that the two-day average prediction error at the repurchase
announcement is an unbiased estimate of the valuation effects of the
announcement
.
4.3 Total Stock Price Effects
To measure the valuation consequences of the investments that terminate in
targeted repurchases, we aggregate the abnormal returns from the beginning of
the investment through its conclusion. We define the beginning of the
investment as the day the selling firm attained a five percent position in the
repurchasing firm, which is the purchase date. The beginning of the investment
could alternately be defined as either the initial investment announcement,
11. Bradley and Wakeman (1983) report negative abnormal returns of forrepurchasing firms about -5.8* over the interval TR+1 to TR+18 which they argueis consistent with resolution of uncertainty that the targeted repurchase willoccur. In our data the average prediction errors in the twenty days followingthe targeted repurchase announcement is ambiguous since the average predictionerror and t-statistic differs in sign in the period TR+1 to TR+10. Also, the
period TR+1 to TR+20 is arbitrary since we have no evidence that uncertainty is
in fact resolved during this time period. The choice of the time periodappears to be critical since the abnormal return during the next twenty days,
TR+21 to TR+40, is 2.33* with a t-statistic of 3.43.

18
which follows the purchase date, or a day prior to the purchase date. While
the initial investment date is the first public announcement of the 13d filing,
the significant abnormal return for repurchasing firms over the interval from
the purchase date through two days before the initial investment indicates that
the market reacts to the increased trading activity in the shares of the
repurchasing firm prior to the initial disclosure. Since the increased trading
activity is associated with the investment, these abnormal returns should be
included in the measure of the valuation consequences of the investment. The
positive abnormal returns for repurchasing firms prior to the purchase date may
also be due to the increased trading in the repurchasing firm, which suggests
that the beginning of the investment occurs prior to purchase date. We chose
the purchase date instead of a prior date because it is the first date that we
can identify that the selling firm obtained shares of the repurchasing firm;
the dates of purchases prior to the attainment of a five percent block are
unavailable. The conclusion of the investment is the date on which the
targeted repurchase is announced.
In addition to the abnormal returns at the beginning and end of the
investment, the total valuation consequences of the Investment should include
the abnormal returns that occur between the 13d filing and the targeted
repurchases announcement. One possible estimate of the abnormal returns for
the period between the two announcement is the cumulative average prediction
error over the interval. An important difficulty with such a measure is that
the time interval between the initial investment and the targeted repurchase is
sufficiently long that the power of the tests of significance is low; the
average number of trading days between the two announcement is about 300
trading days. Consequently, we employ an alternative procedure in which we
aggregate the abnormal returns on the day before and day of relevant Wall
Street Journal announcements that occurred between the initial investment and

19
the targeted repurchase. The advantage of this method is that we exclude
extraneous events and their effects on stock price. This approach increases
the power of our tests by substantially reducing the variance of the total
abnormal returns.
To compute the total valuation consequences of the investment, we do not
simply sum the series of two-day prediction errors. Instead, we first compute
the abnormal price changes over the four stages of the investment: (1) the
interval from the purchase date to two days before the initial investment, (2)
the Initial investment, (3) the intermediate events and (4) the targeted
repurchase announcement. These abnormal price changes are divided by the
firm's share price on the day before the purchase date to obtain a measure
in return form, which we define as the adjusted prediction errors. The total
abnormal return for the investment, or total adjusted prediction error, is
calculated by summing the adjusted prediction errors for each of the four
12stages of the investment.
Table 6 presents the average adjusted prediction errors for repurchasing
and selling firms over the four stages of the investment and for the entire
investment. For repurchasing firms, the average average adjusted prediction
12.
For ease of computation, we do not use the actual stock prices of the firm.
Instead, we define a price index which equals one, the day before the date and
on each succeeding day equals the compound value of $1 that was invested in
the stock day before the initial announcement date.
T-1
P = n (1+R )
T-1 jt
t = -l
where P is the price index on day t and R. is the stock return of firm
j on day t. The adjusted prediction error, APE, , each day is calculated asJT
APE = PE P
JT JT T-1
where PE . is the prediction error on day tJT
20
errors are positive and statistically significant in the purchase, initial
investaent, and interaediate holding periods. On the day before and day of the
targeted repurchase announceaent , the average adjusted prediction error for
repurchasing firas is negative and statistically significant. The average
total adjusted prediction error, which is the average sua of the adjusted
prediction errors in each stage of the investaent, aeasures the valuation
consequences of the entire investaent. The average total adjusted prediction
error for repurchasing firas is 6.88* with a t-statistic of 8.06 and 69* of the
individual total adjusted prediction errors are positive.
Our aeasure of the total valuation consequences indicates that on average
stockholders of repurchasing firas benefit froa investaents that result in a
targeted repurchase. The data are consistent with the hypothesis that the
stock price of target firms rises at the tiae of the initial announceaent of
the investaent position in anticipation of a favorable outcoae, such as a
takeover. There are two possible coaponents of the negative abnoraal returns
at the repurchase announceaent: the reversal of expectations foraed at the
initial announcement and the premium paid to repurchasing stockholders. Since
the total abnoraal return is positive and statistically significant, the
increase in stock price associated with expectations foraed at the initial
announcement of the investment aore than offsets the stock price effects of the
targeted repurchase.
The average adjusted prediction errors for selling firms are positive
during the four stages of the investaent process. The average total adjusted

21
Table 6
Average Total and Holding Period Adjusted Prediction ErrorsThe saaple period for targeted repurchase announceaents is 1978-1983;
t-statistics, percent positive and saaple size are in parentheses.
HoldingPeriod
RepurchasingFirms
SellingFirns
Matched-Firms
Purchase Interval -a/
Initial Investment
Intermediate -
Targeted Repurchase
b/
b/
5.35(8.08,69,101)
3.68(12.61,72,111)
2.86(4.35,65.79)
-3.82
(-10.15,32,112)
0.49(0.63,43.47)
0.74(1.94.52,52)
0.06(-0.43,57,37)
2.10(5.88,66,53)
1.68(2.83,69.45)
2.08(6.62,69.49)
0.84(0.40.55.33)
-0.41
(-0.48,49.49)
Total -^ 6.88(8.06.69,111)
3.62%(3.70.69,52)
3.77*(4.53.63,49)
a/
b/
c/
d/
The purchase interval is from the purchase date through two daysbefore the initial investment announcement.
Includes the day before and day of the announcement.
The total average adjusted prediction error is the average sum of theadjusted prediction errors over the purchase interval, the initial investmentannouncement, the intermediate announcements, and the targeted repurchaseannouncement. Observations without initial investment or targetedrepurchase prediction errors are excluded from these calculations.
Statistics in this column are for a sample of 49 observations in whichdata are available for both repurchasing and selling firms. Adjustedprediction errors for each matched observation are calculated as thevalue-weighted average of the prediction errors for the repurchasing andselling firms, where the value weights equal the equity value of the firms.
The variance of the matched observations is the sum of the squared equity value timesthe variance of the adjusted prediction errors for repurchasing and selling firmsdivided by the squared sum of the values.
22
abnormal return is 3.62% with a t-statistic of 3.70 and 69% of the individual
adjusted prediction errors are positive. These data, therefore, indicate that
the stockholders of selling firms benefit from these investments.
Table 6 also presents the average adjusted prediction errors for 49
observations in which data are available for both repurchasing and selling
firas. The adjusted prediction errors for each of these matched observations
is calculated as the value weighted average of the adjusted prediction errors
for the repurchasing and selling firms. The value weight for the selling firm
is Its equity value on the day before the purchase date. To avoid double
counting, the value weight for the repurchasing firm is the value of
common stock that is not held by the selling firm on the day before the
purchase date.
The combined average adjusted prediction error on the day before and day
of the targeted repurchase announcement is -0.41%, which is insignificant.
This suggests that the significant average adjusted prediction errors of -3.81%
for repurchasing firms and 2.06% for selling firms are due to a wealth transfer
from the shareholders of the repurchasing firm to the shareholders of the
selling firm. However, the combined average total adjusted prediction error is
3.77% with a t-statistic of 4.53 and 63% of the combined observations are
positive. This result, together with the statistically significant average
total adjusted prediction errors for repurchasing and selling firms, indicate
that these Investments on average increase the value of both types of firms.
5. Cross-Sectional Analysis of Abnormal Returns for Repurchasing Firms
5. 1 The Effects of Control Contests and Standstill Agreements.
13. The number of shares not held by the selling firm is calculated as the
number of shares outstanding on the day before the purchase date minus the
number of shares repurchased.

23
Table 7 reports the average adjusted prediction errors for repurchasing
firms for the 32 targeted repurchases that are preceded by a control contest
and for the 80 targeted repurchases that are not preceded by such a contest.
The abnormal returns for the two types of targeted repurchases are virtually
identical in the purchase Interval and at the Initial Investment. The abnormal
returns associated with the intermediate announcements, however, are 5.01% for
repurchases that are preceded by control contests and 1.68% for other
repurchases. These higher abnormal returns for targeted repurchases preceded
by control contests reflect the announcements of the attempts to acquire
control or board representation that occur during the interval between the
initial Investment and the targeted repurchase.
The higher positive abnormal return for targeted repurchases preceded by
control contests during the intermediate interval is offset by a larger
negative abnormal return at the announcement of the targeted repurchase. The
abnormal return associated with the targeted repurchase announcements that are
preceded by control contests is -6.42% with a t-statistic of -7.29 and 73% of
the individual two-day adjusted prediction errors are negative. In contrast,
the two-day average adjusted prediction errors for the other targeted
repurchases is -2.73% with a t-statistic of -7.38. Consistent with these
results, Bradley and Wakeman (1983) find a negative price effect at the
announcement of targeted repurchases that are classified as terminating a
merger attempt that is several times greater than the price effects of other
repurchases
.
The average total prediction errors, which measure the valuation
consequences of the entire investment, are virtually identical for the two
types of targeted repurchases: 7.10% for repurchases preceded by control
contests and 6.78% for other targeted repurchases. These results indicate that
the stock price changes at the time of the targeted repurchase announcement are

24
Table 7
Average Total and Holding Period Adjusted Prediction Errors Of RepurchasingPlr»s Classified By The Presence of Control Contests and Standstill Agreeaents
The saaple period for targeted repurchase announcements is 1978-1983;t-statistics , percent positive and saaple size are in parentheses.
Holding Period Control Non-Control Standstill No StandstillContests Contests Agreeaent Agreeaent
a/Purchase Interval - 5.05% 5.48* 3.48% 6.31X
(3.57.70.30) (7.32.69,71) (3.29.65,34) (7.58,72.67)
b/Initial Investment- 4.69 3.25 4.10 3.45
(7.94,73,33) (9.88,72,78) (7.71,82,39) (9.89,67,72)
Intermediate - 5.01 1.68 4.14 2.02(2.74,71,28) (3.38,61,51) (4.71,74,31) (1.79,58,48)
-6.42 -2.73 -9.15 -0.97
(-7.29,27,33) (-7.38,34,79) (-14.89,15,39) (-1.69,41.73)
b/Targeted Repurchase - -6.42 -2.73 -9.15 -0.97
Total - 7.10% 6.78% 1.28% 9.91%(3.49,64,33) (7.35.72,78) (1.09,51,39) (9.21,79.72)
a/The purchase Interval Is from the purchase date through two days before the initialinvestment announcement.
Includes the day before and day of the announcement.
c/The total average adjusted prediction error is the average sum of the adjustedprediction errors over the purchase interval, the initial Investment, the intermediateannouncement, and the targeted repurchase announcement. Observations without initial
Investment or targeted repurchase prediction errors are excluded from these calculations.

25
incomplete aeasures of the economic effects of these investments. The similar
total abnormal returns for repurchasing firms in targeted repurchases that are
preceded by a control contest and those that are not, indicates that these two
types of investments are equally beneficial to the shareholder of repurchasing
firms - even though stock price decline associated with the targeted repurchase
announcement is larger when it follows the announcement of a control contest.
Table 7 also presents the average adjusted prediction errors for the 39
targeted repurchases that are accompanied by standstill agreements and for the
73 targeted repurchases without such agreements. The abnormal returns for the
two subsamples are similar during the first three stages of the investment.
But at the targeted repurchase announcement the losses are larger for
repurchases that are accompanied by a standstill agreement. For repurchases
with standstill agreement, the average adjusted prediction errors at the
targeted repurchase announcement are -9.15% with a t-statistic of -14.89 and
75% of the individual adjusted prediction errors are negative. In contrast,
the average prediction error at the targeted repurchase announcement is -0.97
for repurchases not accompanied by a standstill agreement which is
insignificant with a t-statistic of -1.69.
Unlike the subsample of targeted repurchases that are preceded by a
control contest, the larger losses at the targeted repurchase announcement for
repurchases accompanied by standstill agreements are not offset by larger gains
during the intermediate holding period. Thus, the average total adjusted
prediction error for repurchases accompanied by a standstill agreement is
1.28%, which is insignificant. In contrast, the average total prediction
errors for repurchases that are not accompanied by a standstill agreement is
9.91% with a t-statistic of 9.21 and 79% of the individual adjusted prediction
errors are positive.
The average adjusted returns for repurchasing firms appear to depend on

26
whether the targeted repurchase is preceded by a control contest and whether it
is accompanied by a standstill agreement. The average adjusted prediction
errors in Table 7 cannot, however, be used to separate these effects because
15 targeted repurchases are preceded by control contests and are accompanied by
standstill agreements.
To isolate the effect of control contests and standstill agreements, we
regress the adjusted prediction errors on two binary variables:
APE . = a„ + a, D, . + a. D- .+ £
.
J 1 Ij 2 2j J
where D . equals 1.0 of the targeted repurchase is preceded by a control
contest and zero otherwise; D equals 1.0 of the targeted repurchase is'-J
accompanied by a standstill agreement and zero otherwise. Table 8 presents the
estimated regression equations. The coefficients on the two binary variables
are insignificant for the purchase interval, initial investment, and
Intermediate holding periods. For the targeted repurchase announcement and
total holding periods, the coefficient on the standstill binary variable, a ,
are negative and statistically significant. The coefficients for the control
contest binary variable are smaller than the coefficients for D and are^ J
statistically insignificant. These regressions indicate that differences in
the average abnormal returns for repurchasing firms at the targeted repurchase
announcement, and the total throughout the investment, are explained by the
presence of a standstill agreement and not the termination of a control
contest.
5. 2 Premium and Information Reversal Effects
In this section, we examine two explanations for the negative abnormal
returns for repurchasing firms at the targeted repurchase announcement: the
premium effect and the information reversal effect . The premium effect is the
reduction in the stock prices of the repurchasing firm that is associated with

21
Table 8
The Relationship Between the Percentage Adjusted PredictionErrors and Characteristics of the Targeted Repurchase
The sample period for targeted repurchase announcements is 1978-1983;
t-statistics are in parentheses.
APE1 Ij 2 2j j
Holding Periodfor APE
.
J
Purchase Intervalb/
Initial Investment-
c/Intermediate -
c/
Targeted Repurchase-c/
3.

, 28
repurchasing its equity at a premium above its market price. The information
reversal effect is the reduction in stock prices that is associated with the
reversal of favorable expectations formed prior to the targeted repurchase
announcement. Mikkelson and Ruback (1985) reports that the stock price rise at
the initial investment announcement appears to be due to the expectation of a
favorable outcome, such as a takeover bid. When Investments terminate in
targeted repurchases, these favorable expectations are, at least in part,
reversed. This reversal occurs because the likelihood that the initial
purchaser will make a takeover bid is reduced. The reversal should be largest
when the targeted repurchases are preceded by control contests. Also, the
targeted repurchase may reduce reduce the likelihood of a completed takeover by
another potential bidder because of the repurchase demonstrates that the target
firm will oppose hostile takeover attempts.
To calculate the premium effect we assume that the targeted repurchase is
simply a wealth transfer between the non-participating shareholders of the
repurchasing firm and the shareholders of selling firm. This implies equity
value of the repurchasing firm prior to the targeted repurchase announcement,
N P , equals the equity value of the firm after the targeted repurchase,
(N^ - N,^ ) P plus the premium paid to the seller, N.F. :
b e b b
% ^0 = ('^0 - Ve ' \ ^b-^'^
where P is the stock price immediately prior to the targeted repurchase
announcement; P. is the repurchase price; P is the stock price after the
targeted repurchase announcement; N is the number of shares outstanding prior
to the repurchase and N is the number of shares repurchased. Rearranging (5)
provides an expression for the change in equity value associated with the
targeted repurchase:

29
^% - V (^ - Pq) = -\<^ -'^O^
^"^
We divide both sides of (6) by the equity value of the non-participating shares
on the day before the purchase date:
% - ^ = - ^^ypp) (7)
^bd ^% - \>^d
The left-hand side of (7) is the relative price change due to the targeted
repurchase announcement which is comparable to the adjusted prediction errors
at the targeted repurchase announcement.
Panel A of Table 9 presents the average targeted repurchase adjusted
prediction error for the 99 targeted repurchases with reliable information on
the per share price of the repurchased shares. The premium as a percent of the
equity value of non-participating shares on the day before the purchase date is
also presented. The sum of the targeted repurchase abnormal return and the
premium as a percent of the Initial equity value of non-participating shares is
defined as the residual component of the announcement.
For all observations, the average targeted repurchase adjusted prediction
error equals -3.60% and the premium as a percent of the initial equity value of
non-participating shares is 4.70%. The sum is 1.11% which indicates that stock
prices fall less than the amount predicted by the premium effect.
Nevertheless, for all observations, and the subsamples of 29 repurchases that
are preceded by control contests and the 70 repurchases that are not preceded
by control contests, the residual component is, on average, small relative to

30
Table 9
The Cross-Sectional Relation Firms Between the Targeted Repurchase Equity Value Chanee the Premium,and the Equity Value Change Prior to the Targeted Repurchase Announcement for Repurchasing Firms
AllObservations
Contro
I
Contests
Sample
No ControlContests
StandstillAgreements
No StandstillAgreements
Number of Observations 99 29 70 31 68
Panel A: Sample Averages
Targeted Repurchase AdjustedPrediction Error
-3.60% -6.28* -2.48S; -8. 99* -1.14X
Premium as a PercentInitial Equity Value
a/
Residual Conoonenent -b/
4.70
1.11
7.83
1.55
3.41
0.92
4.68
-4.31
4.71
3.57
Panel B: Regression estimates:c/
^S^ .- a„ * a, PREMIUM. * G.: Standard errors are in parenthesis
tr.j 1 J J
109.26

31
the adjusted prediction error. But the residual component for the repurchases
with standstills is -4.3%, whereas the residual component for other repurchases
is 3.57*.
To test the premium effect, we estimate the following regression:
Z^S .= a„ + a, PREMIUM. + Z. (8)
tr.j 1 J J
where aS . is the change in equity value for the non-participating sharestr, J
associated with the repurchase and PREMIUM, is the dollar value of the premium
14paid to the seller. The constant term, a , is included in the regression
to capture the average information effect. The premium effect implies that the
slope coefficient, a , should equal -1.0. Since the dollar equity value
changes are hetroskedastic , we estimate to the regressions using weighted least
squares, where the weights equal the inverse of the standard deviation of the
dollar equity value change associated with the targeted repurchase.
Panel B of Table 9 presents the estimated regression results for the whole
sample and for each subsample. Each of the estimated coefficients on the
PREMIUM, a , is negative. However, the hypothesis that these slope
coefficients equals -1.0 as predicted by the premium effect is reject for the
sample as a whole and for each subsample except the subsample of targeted
repurchases accompanied by standstill agreements. Furthermore, each of the
slope coefficients is not statistically different from zero. These results are
inconsistent with the premium effect and suggest that the targeted repurchase
14. AS . is calculated for each observation by multiplying the adjustedprediction etror for the targeted repurchase announcement by the equity value
of the non-participating shares on the day prior to the purchase date.
PREMIUM, is calculated by multiplying the number of shares repurchased by the
difference between the offer price and the market price two days prior to the
repurchase
.

is not a wealth transfer between the non-participating shareholders of the
repurchasing firm and the shareholders of the selling firm.
The two previous studies of targeted repurchases, Dann and DeAngelo (1983)
and Bradley and Wakeman (1983), present conflicting evidence on the prenium
effect. Dann and DeAngelo report in a footnote (page 297) that no significant
relationship exists between the equity value change at the targeted repurchase
announcement and the premium, a result which is consistent with our findings.
Bradley and Wakeman present regression results for a model which is similar to
(8). They report (Table 6, page 320) a coefficient on the premium of -1.013,
which is consistent with the premium effect. The differences in the results
appear to be related to the specification of the regression equations. Dann
and DeAngelo estimate their equations in return form; that is they divide both
sides of (8) by the equity value of the repurchasing firm prior to the targeted
repurchase announcement. In contrast, Bradley and Wakeman estimate their
equation in dollar values. Our analysis indicates that such unweighted dollar
value regressions are sensitive to outliers and have hetroskedastic errors.
Return form regressions appear to be less effected by these difficulties.
To test the information reversal hypothesis, we estimate the following
regression equation:
ZiS^ .= Y„ + Y, PREMIUM. + Y„ ^S ^ • + €.
tr,j 1 J 2 pretr.j j
where AS . is the change in equity value from the purchase date throughpretr
,
j
the intermediate events. This calculated by summing the adjusted prediction
errors during the purchase interval, initial investment, and Intermediate
announcement holding periods and multiplying the sum by the equity value of the
repurchasing firm on the day before the purchase date. The information

33
reversal effect implies that Y should be less than zero.
Panel C of Table 9 presents the regression tests of the information
reversal effect. Each of the estimated coefficients on the equity value change
prior to the targeted repurchase, y , is negative. The coefficients Y equals
-0.17 for the sample as a whole, which is statistically significant with a t-
statistic of -3.70. Similarly, the Y coefficients are statistically
significant for the subsample without control contests and the subsample
without standstill agreements. The coefficients for the smaller control
contest and standstill subsamples are not statistically significant with t-
statistics of -0.77 and -1.51. respectively. These results suggest that the
information reversed effect is an important factor in the cross-sectional
variation of the equity value declines associated with targeted repurchase
announcements. Each of the Y coefficients on the equity value change is closer
to zero than -1.0. The hypothesis that the coefficient equal -1.0 can be
rejected for the samplfe as a whole and for each subsample. This implies that
the information reversal is not complete and is consistent with the positive
and statistically significant average total prediction error for repurchasing
firms
.
6. Conclusions
This study presents new evidence about investments in common stock that
result in a targeted repurchase. First, for most investments, the total stock
price effect on the repurchasing firm is positive. The holder of shares from
the initial investment through the targeted repurchase typically benefits.
Second, the stock price declines at the targeted repurchase are explained more
by the positive stock return prior to the repurchase than by the premium paid
in repurchase. Thus, the fall in stock price at the targeted repurchase does
not simply reflect a wealth transfer to the selling stockholder. Third, the
targeted repurchases typicaly do not thwart outstanding takeover attempts.

34
Only 5 of 112 repurchases were from an investor who had announced a merger
proposal or tender offer for control.
Our evidence implies that it is misleading to interpret the stock price
effects of targeted repurchases in isolation of the price effects of preceding
events that are related to the investments. The price drop at the targeted
repurchase appears to be a partial reversal of the positive stock price effects
of prior events. This casts doubt on the view that the targeted repurchase
hams the repurchasing firms 's shareholders.
The evidence presented in this paper does resolve the debate about whether
targeted repurchases harm the shareholders of the repurchasing firm. This
issue cannot be resolved without identifying whether a more favorable course of
action, such as takeover, was available to the managers of the repurchasing
firm.

35
REFERENCES
1. Boland, J., Missing the bottom line on "Greenmail", The Wall StreetJournal July 25. 1984.
2. Bradley, Michael and L. Macdonald Wakeman , 1983, The wealth effects of
targeted share repurchases. Journal of Financial Economics, 11, 301-328.
3. Dann, Larry Y. and Harry DeAngelo, 1983, Standstill agreements, privatelynegotiated stock repurchases, and the market for corporate control,Journal of Financial Economics, 11, 275-30.
4. Dees, Gregory J., The ethics of "Greenmail", mimeo, Yale School of
Organization and Management, August 16, 1985.
5. Fana, Eugene, Foundations of Finance, 1976, (Basic Books, New York).
6. Fama, E., L. Fisher, M. Jensen, R. Roll, 1969, The adjustment of stockprices to new information. International Economic Review, 1-21.
7. Holderness. Clifford G. and Dennis P. Sheehan, 1984, Raiders or saviors?The evidence on six controversial investors, Journal of FinancialEconomics, forthcoming.
8. Kirkland. R., When paying off a raider benefits the shareholders. Fortune.April 30, 1984, pp. 152-8.
9. Jensen, Michael C. and Richard S. Ruback, 1983, The market for corporatecontrol: The scientific evidence, JOurnal of Financial Economics, 11,
5-50.
10. Mikkelson, Wayne H. and Richard S. Ruback, An empirical analysis of theinterfirm equity investment process, Journal of Financial Economics,forthcoming

v^
350ii U 10

//'''
Mil LIBRARIES
3 ^DflO D D3 Dbl bb?


,a\SESL

y^^r c^tiJL 15 oy\ Lx^-^ dj^^^iur