Embed Size (px)
Citation preview
Dividends, Share Repurchases, andthe Substitution Hypothesis
GUSTAVO GRULLON and RONI MICHAELY*
ABSTRACT
We show that repurchases have not only became an important form of payout forU.S. corporations, but also that firms finance their share repurchases with fundsthat otherwise would have been used to increase dividends. We find that youngfirms have a higher propensity to pay cash through repurchases than they did inthe past and that repurchases have become the preferred form of initiating a cashpayout. Although large, established firms have generally not cut their dividends,they also show a higher propensity to pay out cash through repurchases. Thesefindings indicate that firms have gradually substituted repurchases for dividends.Our results also suggest that before 1983, regulatory constraints inhibited firmsfrom aggressively repurchasing shares.
For decades, U.S. corporations have overwhelmingly preferred to pay outcash in the form of dividends rather than share repurchases, despite therelative tax advantage of capital gains over ordinary income. However, overthe last 20 years or so, share repurchase activity has experienced an ex-traordinary growth. According to aggregate data from Compustat, expendi-tures on share repurchase programs ~relative to total earnings! increasedfrom 4.8 percent in 1980 to 41.8 percent in 2000.
Furthermore, while share repurchase expenditures grew at an averageannual rate of 26.1 percent over the period 1980 to 2000, dividends onlygrew at an average annual rate of 6.8 percent. As a consequence of theselarge differences in growth rates, share repurchases as a percentage of totaldividends increased from 13.1 percent in 1980 to 113.1 percent in 2000. In1999 and 2000, industrial firms spent more money on share repurchasesthan on dividend payments. That is, for the first time in history, share re-purchase programs have become more popular than dividends.
What are the reasons for this change in corporate payout policy? Are cor-porations buying back shares with funds that they would otherwise haveused to pay dividends? And if so, why did this process not start muchearlier? The answers to these questions are important because they will
*Grullon is from Rice University and Michaely is from Cornell University and IDC. Wewould like to thank Eugene Fama; John Graham; Erik Lie; Maureen O’Hara; Oded Sarig;Robert Swieringa; participants in the 2002 AFA meetings; and seminar participants at Cornell,INSEAD, Norwegian School of Management, Rice, and USC.
THE JOURNAL OF FINANCE • VOL. LVII, NO. 4 • AUGUST 2002
1649
enhance our understanding of corporate payout policy in the United States.Furthermore, they may shed some light on the long-standing issue of whyfirms have historically preferred dividends over share repurchases.
Our objectives in this paper are threefold. First, we analyze the recenttrend in share repurchases. We show that in the last 15 years or so, themajority of firms initiate cash payouts to shareholders through repurchasesrather than cash dividends. Although large, more established firms did notcut or reduce the nominal amount of dividends, the growth rate in dividendpayments was ~and remains! significantly lower than it used to be, and theamount that firms spend on repurchases is much larger after the mid-1980s.1
Second, we focus on the analysis of whether firms use share repurchasesas a substitute for dividends. We directly investigate whether the increasesin the number and dollar amount of repurchases have been used as a sub-stitute for dividends. This is an important issue, especially in light of therecent evidence provided by Fama and French ~2001! that the number offirms paying dividends has dramatically declined over the past 20 years.
From a tax perspective, there is an obvious incentive for corporations tosubstitute share repurchases for dividends because capital gains are taxedat more favorable rates than ordinary income. Although the Tax Reform Act~TRA! of 1986 greatly reduced the relative tax advantage of capital gains,the gap between the top marginal rate on ordinary income and the marginalrate on capital gains is still positive and significant. For example, by the endof 2001, the top marginal rate on long-term capital gains was only 20 per-cent, while the top marginal rate on ordinary income was 39.6 percent. More-over, share repurchases have the advantage of allowing investors to postponethe realization of capital gains and thus the payment of taxes.
Knowing whether managers substitute repurchases for dividends will helpus understand whether managers take into account their shareholders’ taxstatus when they choose a payout method. Furthermore, understandingthe motivation behind the recent surge in share repurchase activity willallow us to better understand whether corporations view dividends andrepurchases as interchangeable payout methods, which would have impli-cations for many of the payout theories. The predictions of the variouspayout theories are not uniform on the subject. For example, John andWilliams ~1985!, Bernheim ~1991!, and Allen, Bernardo, and Welch ~2000!conclude that management uses dividends, as opposed to share repur-chases, to signal the firm’s quality. Thus, according to these theories, div-idends and repurchases are not interchangeable. On the other hand, Millerand Modigliani ~1961!, Bhattacharya ~1979!, Easterbrook ~1984!, Miller andRock ~1985!, and Jensen ~1986! imply that it is the payout ~as either div-idends or repurchases! that can be used to signal undervaluation or toreduce agency conf licts. Thus, substitution of repurchases for dividendswould be consistent with those theories.
1 The average growth rate in dividend payments declined from 15 percent in the 1970s to4.6 percent in the 1990s.
1650 The Journal of Finance
Our research provides a number of new results on the relation betweenrepurchase and dividend policy. We highlight several of them here. First,consistent with the substitution hypothesis, the empirical evidence in thispaper suggests that the marked increase in share repurchase activity in theUnited States has been financed with potential increases in dividends. Wefind that the share repurchase activity over the last two decades has helpedthe average total payout ratio of firms to stay relatively constant despite thedecline in the average dividend payout ratio. We also find that as a percent-age of the total number of firms distributing cash to their equityholders, thenumber of firms that repurchase shares increased from 31 percent in 1972to 80 percent in 2000.
Moreover, since the mid-1980s many more firms have decided to initiateshare repurchase programs rather than to initiate dividends. As a percent-age of the total number of firms initiating a cash distribution to their share-holders, the number of firms that initiated a buyback program increasedfrom 26.6 percent in 1972 to 84.2 percent in 2000. We also find that sincethe mid-1980s, corporations rely more on share repurchases than on divi-dends to increase their payout ratios.
It appears that share repurchase programs have become the preferredmethod of payout for many firms. This evidence is consistent with the recentfindings in Fama and French ~2001! that indicate that even after controllingfor firm characteristics, firms now have a lower propensity to pay dividendsthan they did in the past. However, contrary to their conclusion, we findevidence that firms have been substituting share repurchase for dividends.As we explain later, we believe that our results differ from those of Famaand French because they use a measure for repurchases that may under-estimate share repurchase activity relative to dividends ~by measuring netrepurchase activity and gross dividends! and that may include both financ-ing activities ~repurchases! and investment activities ~payment to labor!.
Second, our evidence suggests that large, established firms partially fi-nance their repurchase programs with potential dividend increases. UsingLintner ’s ~1956! dividend model to generate expected future dividend pay-ments, we find that dividend forecast errors are negatively correlated withshare repurchase activity. In other words, the difference between actual andexpected dividend payments tends to become more negative as the firm spendsmore money on share repurchases. This result is consistent with the predic-tions of the substitution hypothesis.
Complementing the previous findings, we also report that the market re-action surrounding the announcement of dividend decreases is significantlyless negative for repurchasing firms than for nonrepurchasing firms. Wefind that the market reaction to dividend decreases is not significantly dif-ferent from zero for repurchasing firms, and that it is significantly negativefor nonrepurchasing firms. These results further support the idea that sharerepurchases and dividends are close substitutes. We also find that the mar-ket reaction surrounding open market repurchase announcements was sig-nificantly more positive before the enactment of the 1986 TRA when the
Dividends, Share Repurchases, and the Substitution Hypothesis 1651
benefits from substituting were larger. Overall, the evidence presented inthis paper indicates that corporations are substituting share repurchases fordividends.
The paper ’s third objective is to understand why firms did not substituterepurchases for dividends earlier. That is, if share repurchases and divi-dends appear to be substitute payout methods, why did corporations notrepurchase more intensely before the mid-1980s when the tax benefits ofcapital gains were much higher? One possibility is that corporations were“simply wrong” for paying so much in dividends ~Grinblatt and Titman ~1998,p. 529!!. Another possibility is that the risk of violating the antimanipulativeprovisions of the Securities Exchange Act ~SEA! of 1934 deterred most cor-porations from repurchasing shares. Indeed, after the Securities and Ex-change Commission ~SEC! adopted Rule 10b-18, which, under certainconditions, provides a safe harbor to repurchasing corporations, repurchaseactivity experienced an upward structural shift.2
Just one year after the approval of Rule 10b-18, the aggregate amount ofcash spent on share repurchase programs tripled. Since then, the level ofshare repurchase activity in the United States has been at record highs.Even after controlling for the potential effects of other factors such as taxesand market conditions, the impact of the adoption of Rule 10b-18 on sharerepurchase activity remains economically and statistically significant.
The paper is organized as follows. Section I further develops the substi-tution hypothesis. Section II describes the data and Section III examines therecent trend in corporate payout policy in the United States. Section IVpresents a direct examination of the substitution hypothesis. Section V in-vestigates whether investors perceive that corporations are substituting sharerepurchases for dividends, and discusses the impact of tax changes. Sec-tion VI examines the effect of the adoption of Rule 10b-18 on share repur-chase activity. Section VII concludes.
I. Payout Policy and the Substitution Hypothesis
What does corporate finance theory research say about the relation be-tween dividends and share repurchases? At the most fundamental level, thedividend irrelevancy theory of Miller and Modigliani ~1961! implies that sharerepurchases and dividends are perfect substitutes ~given perfect and com-plete capital markets!. That is, given investment policy, the residual cashcan be paid to investors either through dividends or repurchases. The agencytheories of Easterbrook ~1984! and Jensen ~1986! also imply that one cancontrol managers’ actions by taking excess cash out of the firm. Whether theexcess cash is distributed through dividends or share repurchases will notaffect the final outcome.
2 As we discuss later in the paper, there is evidence that the SEC was concerned with firmsusing share repurchase programs to illegally manipulate their stock prices.
1652 The Journal of Finance
Most of the signaling models imply that dividends and repurchases areperfect substitutes. For example, in Bhattacharya ~1979!, the signaling costis the transaction cost associated with raising new capital, and in Miller andRock ~1985!, it is the cost of reducing investments. Neither is related to thechoice of payout. An exception is the John and Williams ~1985! model, inwhich the higher taxes on dividend are the costs of the signal. This modelsuggests that share repurchases and dividends are not interchangeable.
Allen et al. ~2000! develop a model in which share repurchases and divi-dends are not substitutes because the latter payout method attracts insti-tutions. Allen et al. argue that institutional investors are more likely todiscover whether a firm is overvalued or undervalued because institutionshave better information-gathering abilities and are also better monitors. Sinceinstitutions prefer dividends, only undervalued firms want to be monitored~or signal they are undervalued!; thus, these are the firms that will payhigher dividends. This signaling equilibrium is not achieved with sharerepurchases.
Investigating the extent of substitutability of dividends and repurchases,DeAngelo, DeAngelo, and Skinner ~2000! examine the relation between thedisappearance of special dividends and the appearance of repurchase pro-grams. They do not find evidence that share repurchase programs have re-placed special dividends and therefore no evidence for a substitution effect.Jagannathan, Stephens, and Weisbach ~2000! find that firms that pay div-idends have more stable earnings than do firms that use share repurchases.They conclude that share repurchases are used to pay out extraordinarytransitory earnings and dividends are used to pay out permanent earnings.
We could argue that if we just look at the sources and uses of funds iden-tity, share repurchases and dividends should be substitute payout methods.This argument is correct if all else is constant. However, firms can alwaysadjust their sources of funds, and therefore it is possible that dividends andshare repurchases are determined independently. For example, it is possiblethat dividends are determined together with investment, as Miller and Rock~1985! suggest, and that repurchases are determined independently. In sum-mary, current theories do not provide a unique prediction on what the rela-tion should be between dividends and share repurchases. It is clear that thequestion of the extent to which dividends and repurchases are substitutes isa central issue, and has important implications for many of the existingpayout theories.
II. Sample Selection and Definitions
Using the Industrial Compustat files ~Full-Coverage, Primary, Secondary,Tertiary, Research, and Back Files!, we create an initial sample of all thecompanies that appear on the files for at least one year over the period 1972to 2000. To remain in the final sample, each firm-year observation musthave information available on the following variables:
Dividends, Share Repurchases, and the Substitution Hypothesis 1653
1. Earnings ~EARN!. Defined as total earnings before extraordinary items~Compustat item #18!.
2. Market value ~MV!. Defined as market value of common stock at theend of the year ~Compustat item #24 times Compustat item #25!.
3. Dividends ~DIV !. Defined as total dollar amount of dividends declaredon the common stock of the firm during the year ~Compustat item #21!.
4. Repurchases ~REPO!. Defined as total expenditure on the purchase ofcommon and preferred stocks ~Compustat item #115! minus any reduc-tion in the value ~redemption value, Compustat item #56! of the netnumber of preferred stocks outstanding. ~This variable is not availablefor banks, utilities, and insurance companies. Therefore, these types offirms are not included in our final sample.! Our measure of repurchaseactivity is similar to the one used by Jagannathan et al. ~2000!. Whilewe measure the repurchase activity only for common stocks, their mea-sure uses the entire repurchase activity, which also includes preferredstocks. This difference, however, does not affect the results in this pa-per. We also compare our measure to the amount of repurchase activityreported by SDC ~amount of repurchases announced!. The correlationcoefficient between these two measures is 0.97 and the dollar amountsare similar.
For each observation in the final sample, we create the following variablesusing data from Compustat: MB is equal to the book value of the total assetsplus the market value of equity minus the book value of equity, scaled by thebook value of the total assets. CASH is the book value of cash and short-term investments ~Compustat item #1! scaled by the book value of the totalassets. ROA is the operating income before depreciation ~Compustat item#13! scaled by the book value of the total assets. The s~ROA! is the standarddeviation of ROA. NOPER is the nonoperating income before depreciation~Compustat item #61! scaled by the book value of the total assets. DEBT isthe book value of total long-term debt ~Compustat item #9! plus the bookvalue of total short-term debt ~Compustat item #44! scaled by the book valueof the total assets.
The final sample contains 15,843 firms, and an overall total of 134,646firm-year observations over the period 1972 to 2000.
III. Trends in Corporate Payout Policy
To examine the recent trends in corporate payout policy, we generate ag-gregate data by calendar year on share repurchase expenditures, cash div-idend expenditures, total earnings, and total market value of equity. We usethe data described in Section II above.
Throughout most of the 20th century, the predominant form of payout formost U.S. corporations has been the payment of dividends rather than therepurchase of common stocks ~see, e.g., Bagwell and Shoven ~1989! and Allenand Michaely ~2002!!. This pattern is confirmed in Table I. In the 1970s and
1654 The Journal of Finance
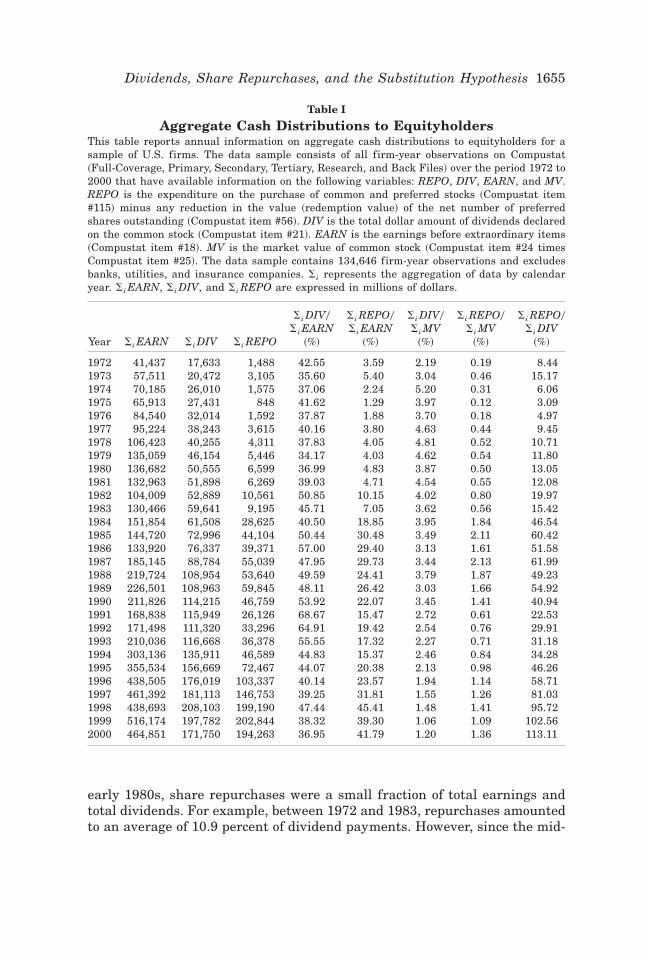
early 1980s, share repurchases were a small fraction of total earnings andtotal dividends. For example, between 1972 and 1983, repurchases amountedto an average of 10.9 percent of dividend payments. However, since the mid-
Table I
Aggregate Cash Distributions to EquityholdersThis table reports annual information on aggregate cash distributions to equityholders for asample of U.S. firms. The data sample consists of all firm-year observations on Compustat~Full-Coverage, Primary, Secondary, Tertiary, Research, and Back Files! over the period 1972 to2000 that have available information on the following variables: REPO, DIV, EARN, and MV.REPO is the expenditure on the purchase of common and preferred stocks ~Compustat item#115! minus any reduction in the value ~redemption value! of the net number of preferredshares outstanding ~Compustat item #56!. DIV is the total dollar amount of dividends declaredon the common stock ~Compustat item #21!. EARN is the earnings before extraordinary items~Compustat item #18!. MV is the market value of common stock ~Compustat item #24 timesCompustat item #25!. The data sample contains 134,646 firm-year observations and excludesbanks, utilities, and insurance companies. �i represents the aggregation of data by calendaryear. �i EARN, �i DIV, and �i REPO are expressed in millions of dollars.
Year �i EARN �i DIV �i REPO
�i DIV0�i EARN~%!
�i REPO0�i EARN~%!
�i DIV0�i MV~%!
�i REPO0�i MV~%!
�i REPO0�i DIV~%!
1972 41,437 17,633 1,488 42.55 3.59 2.19 0.19 8.441973 57,511 20,472 3,105 35.60 5.40 3.04 0.46 15.171974 70,185 26,010 1,575 37.06 2.24 5.20 0.31 6.061975 65,913 27,431 848 41.62 1.29 3.97 0.12 3.091976 84,540 32,014 1,592 37.87 1.88 3.70 0.18 4.971977 95,224 38,243 3,615 40.16 3.80 4.63 0.44 9.451978 106,423 40,255 4,311 37.83 4.05 4.81 0.52 10.711979 135,059 46,154 5,446 34.17 4.03 4.62 0.54 11.801980 136,682 50,555 6,599 36.99 4.83 3.87 0.50 13.051981 132,963 51,898 6,269 39.03 4.71 4.54 0.55 12.081982 104,009 52,889 10,561 50.85 10.15 4.02 0.80 19.971983 130,466 59,641 9,195 45.71 7.05 3.62 0.56 15.421984 151,854 61,508 28,625 40.50 18.85 3.95 1.84 46.541985 144,720 72,996 44,104 50.44 30.48 3.49 2.11 60.421986 133,920 76,337 39,371 57.00 29.40 3.13 1.61 51.581987 185,145 88,784 55,039 47.95 29.73 3.44 2.13 61.991988 219,724 108,954 53,640 49.59 24.41 3.79 1.87 49.231989 226,501 108,963 59,845 48.11 26.42 3.03 1.66 54.921990 211,826 114,215 46,759 53.92 22.07 3.45 1.41 40.941991 168,838 115,949 26,126 68.67 15.47 2.72 0.61 22.531992 171,498 111,320 33,296 64.91 19.42 2.54 0.76 29.911993 210,036 116,668 36,378 55.55 17.32 2.27 0.71 31.181994 303,136 135,911 46,589 44.83 15.37 2.46 0.84 34.281995 355,534 156,669 72,467 44.07 20.38 2.13 0.98 46.261996 438,505 176,019 103,337 40.14 23.57 1.94 1.14 58.711997 461,392 181,113 146,753 39.25 31.81 1.55 1.26 81.031998 438,693 208,103 199,190 47.44 45.41 1.48 1.41 95.721999 516,174 197,782 202,844 38.32 39.30 1.06 1.09 102.562000 464,851 171,750 194,263 36.95 41.79 1.20 1.36 113.11
Dividends, Share Repurchases, and the Substitution Hypothesis 1655
1980s, share repurchase programs have become a significant payout ratios.On average, between 1984 and 2000, the dollar amount distributed throughrepurchases relative to dividends was 57.7 percent, and it reached a high of113.11 percent in 2000.
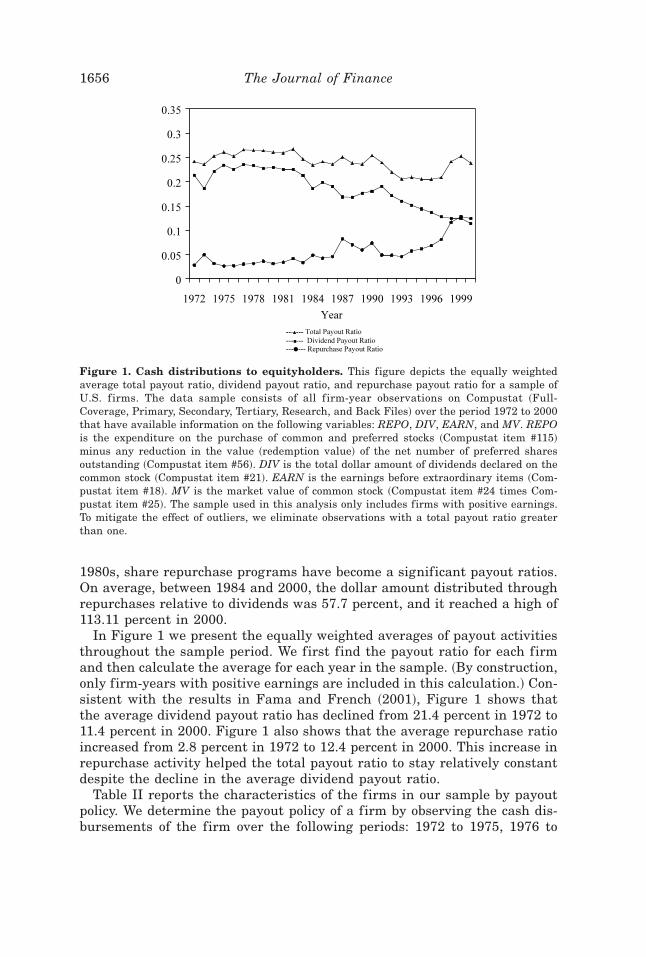
In Figure 1 we present the equally weighted averages of payout activitiesthroughout the sample period. We first find the payout ratio for each firmand then calculate the average for each year in the sample. ~By construction,only firm-years with positive earnings are included in this calculation.! Con-sistent with the results in Fama and French ~2001!, Figure 1 shows thatthe average dividend payout ratio has declined from 21.4 percent in 1972 to11.4 percent in 2000. Figure 1 also shows that the average repurchase ratioincreased from 2.8 percent in 1972 to 12.4 percent in 2000. This increase inrepurchase activity helped the total payout ratio to stay relatively constantdespite the decline in the average dividend payout ratio.
Table II reports the characteristics of the firms in our sample by payoutpolicy. We determine the payout policy of a firm by observing the cash dis-bursements of the firm over the following periods: 1972 to 1975, 1976 to
Figure 1. Cash distributions to equityholders. This figure depicts the equally weightedaverage total payout ratio, dividend payout ratio, and repurchase payout ratio for a sample ofU.S. f irms. The data sample consists of all f irm-year observations on Compustat ~Full-Coverage, Primary, Secondary, Tertiary, Research, and Back Files! over the period 1972 to 2000that have available information on the following variables: REPO, DIV, EARN, and MV. REPOis the expenditure on the purchase of common and preferred stocks ~Compustat item #115!minus any reduction in the value ~redemption value! of the net number of preferred sharesoutstanding ~Compustat item #56!. DIV is the total dollar amount of dividends declared on thecommon stock ~Compustat item #21!. EARN is the earnings before extraordinary items ~Com-pustat item #18!. MV is the market value of common stock ~Compustat item #24 times Com-pustat item #25!. The sample used in this analysis only includes firms with positive earnings.To mitigate the effect of outliers, we eliminate observations with a total payout ratio greaterthan one.
1656 The Journal of Finance
Ta
ble
II
Fir
mC
har
acte
rist
ics
by
Pay
out
Pol
icy
Th
ista
ble
repo
rts
desc
ript
ive
stat
isti
csby
payo
ut
poli
cyfo
ra
sam
ple
ofU
.S.
firm
s.W
ede
term
ine
the
payo
ut
poli
cyof
afi
rmby
obse
rvin
gth
eca
shdi
sbu
rsem
ents
ofth
efi
rmov
erth
efo
llow
ing
tim
epe
riod
s:19
72–1
975,
1976
–197
9,19
80–1
983,
1984
–198
7,19
88–1
991,
1992
–199
5,an
d19
96–2
000.
Th
eda
tasa
mpl
eco
nsi
sts
ofal
lfi
rm-y
ear
obse
rvat
ion
son
Com
pust
at~F
ull
-Cov
erag
e,P
rim
ary,
Sec
onda
ry,
Tert
iary
,R
esea
rch
,an
dB
ack
Fil
es!
over
the
peri
od19
72to
2000
that
hav
eav
aila
ble
info
rmat
ion
onth
efo
llow
ing
vari
able
s:R
EP
O,
DIV
,E
AR
N,
and
MV
.R
EP
Ois
the
expe
ndi
ture
onth
epu
rch
ase
ofco
mm
onan
dpr
efer
red
stoc
ks~C
ompu
stat
item
#115!
min
us
any
redu
ctio
nin
the
valu
e~r
edem
ptio
nva
lue!
ofth
en
etn
um
ber
ofpr
efer
red
shar
esou
tsta
ndi
ng~C
ompu
stat
item
#56!
.D
IVis
the
tota
ldo
llar
amou
nt
ofdi
vide
nds
decl
ared
onth
eco
mm
onst
ock
~Com
pust
atit
em#2
1!.
EA
RN
isth
eea
rnin
gsbe
fore
extr
aord
inar
yit
ems~C
ompu
stat
item
#18!
.M
Vis
the
mar
ket
valu
eof
com
mon
stoc
k~C
ompu
stat
item
#24
tim
esC
ompu
stat
item
#25!
.T
he
data
sam
ple
con
tain
s13
4,64
6fi
rm-y
ear
obse
rvat
ion
san
dex
clu
des
ban
ks,
uti
liti
es,
and
insu
ran
ceco
mpa
nie
s.A
SS
ET
Sis
the
book
valu
eof
asse
ts~C
ompu
stat
item
#6!.
MB
isth
em
arke
t-to
-boo
kra
tio@~
book
valu
eof
asse
ts�
mar
ket
valu
eof
equ
ity
�bo
okva
lue
ofeq
uit
y!0b
ook
valu
eof
asse
ts#.
CA
SH
isth
ebo
okva
lue
ofca
shan
dsh
ort-
term
inve
stm
ents~C
ompu
stat
item
#1!
scal
edby
the
book
valu
eof
the
tota
las
sets
.R
OA
isth
eop
erat
ing
inco
me
befo
rede
prec
iati
on~C
ompu
stat
item
#13!
scal
edby
the
book
valu
eof
the
tota
las
sets
.s~R
OA!
isth
est
anda
rdde
viat
ion
ofR
OA
.s~R
OA!
isca
lcu
late
dov
erth
esa
me
tim
epe
riod
su
sed
tode
term
ine
the
payo
ut
poli
cyof
afi
rm.N
OP
ER
isth
en
onop
erat
ing
inco
me
befo
rede
prec
iati
on~C
ompu
stat
item
#61!
scal
edby
the
book
valu
eof
the
tota
las
sets
.MB
,CA
SH
,an
dN
OP
ER
hav
ebe
entr
un
cate
dat
the
99th
perc
enti
le.
RO
Ah
asbe
entr
un
cate
dat
the
1st
and
99th
perc
enti
les.
AG
E.
8is
the
prop
orti
onof
firm
sth
ath
ave
been
trad
edin
am
ajor
exch
ange
for
mor
eth
anei
ght
year
s.D
IV0T
OT
AL
isth
eto
tal
amou
nt
ofdi
vide
nds
inea
chgr
oup
scal
edby
the
aggr
egat
eam
oun
tof
divi
den
ds.
RE
PO0T
OT
AL
isth
eto
tal
amou
nt
ofsh
are
repu
rch
ases
inea
chgr
oup
scal
edby
the
aggr
egat
eam
oun
tof
shar
ere
purc
has
es.
DIV
�0,
RE
PO
�0
DIV.
0,R
EP
O�
0D
IV�
0,R
EP
O.
0D
IV.
0,R
EP
O.
0
Mea
nM
edia
nN
Mea
nM
edia
nN
Mea
nM
edia
nN
Mea
nM
edia
nN
MV
167.
516
.315
,461
1,07
6.2
102.
88,
340
359.
028
.28,
202
1,80
3.6
144.
910
,307
AS
SE
TS
162.
320
.315
,456
1,72
3.4
166.
98,
340
311.
341
.58,
202
2,96
2.1
235.
710
,307
MB
1.94
1.38
14,0
891.
361.
118,
278
1.65
1.23
7,99
61.
351.
1310
,279
CA
SH
15.0
%7.
6%15
,272
9.3%
5.5%
8,31
015
.8%
9.2%
8,15
89.
2%5.
5%10
,302
RO
A�
3.8%
3.9%
15,0
2914
.1%
13.8
%8,
043
5.0%
9.1%
8,12
214
.5%
14.1
%10
,046
s~R
OA!
9.4%
6.1%
5,39
83.
6%2.
6%5,
224
7.5%
4.9%
4,62
93.
4%2.
5%7,
712
NO
PE
R1.
8%1.
1%14
,555
1.3%
0.9%
8,09
21.
7%1.
2%7,
930
1.3%
0.9%
10,0
94A
GE.
826
.5%
—12
,255
56.1
%—
5,01
834
.1%
—6,
796
68.4
%—
7,31
3D
IV0T
OT
AL
0%—
—31
.0%
——
0%—
—69
.0%
——
RE
PO0T
OT
AL
0%—
—0%
——
12.1
%—
—87
.9%
——
Dividends, Share Repurchases, and the Substitution Hypothesis 1657
1979, 1980 to 1983, 1984 to 1987, 1988 to 1991, 1992 to 1995, and 1996 to2000. For example, if a firm pays dividends in 1981 and repurchases sharesin 1982, then we classify this firm as a dividend-paying and repurchasingfirm ~DIV . 0, REPO . 0! during the period 1980 to 1983. ~We repeat allanalyses when we define a subperiod as one year. The results are qualita-tively the same.!
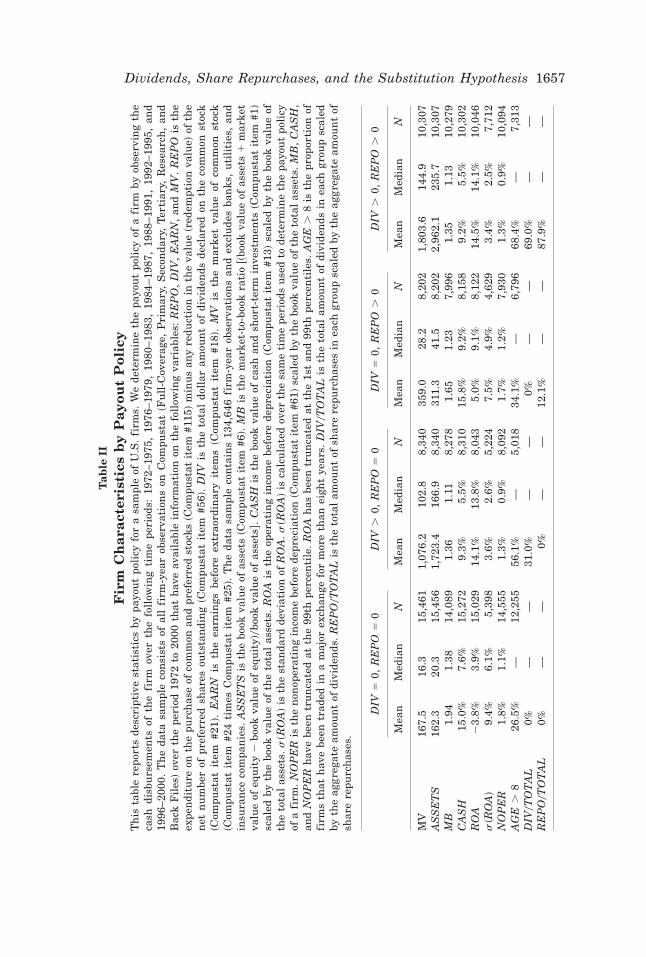
Table II reveals several interesting facts about the relation between firms’characteristics and payout policy. First, dividend-paying firms ~DIV . 0! aremuch larger and more profitable than firms that do not pay dividends~DIV � 0!. For example, the average ~median! market value of firms thatpay dividends and do not use repurchases is $1,076.2 million ~$102.8 mil-lion! and $1,803.6 million ~$144.9 million! for firms that both pay dividendsand repurchase. The average ~median! market value of firms that do not paydividends and do not repurchase is $167.5 million ~$16.3 million! and $359.0million ~$28.2 million! for firms that only repurchase. In addition, firms thatpay dividends have a lower variability of return on assets @s~ROA!# thanfirms that do not pay dividends ~regardless of their repurchase policy!. Themean ~median! standard deviation of the return on assets is 3.6 percent~2.6 percent! for firms that only pay dividends ~DIV . 0, REPO � 0!, and3.4 percent ~2.5 percent! for firms that pay dividends and repurchase shares~DIV . 0, REPO . 0!. Overall, it seems that the firms that pay dividendsbut do not repurchase shares ~DIV . 0, REPO � 0! are similar to those thatpay dividends and repurchase shares ~DIV . 0, REPO . 0!.
Firms that repurchase shares but do not pay dividends ~DIV � 0, REPO . 0!appear to have similar characteristics to firms that do not pay out any cash~DIV � 0, REPO � 0!. These are small, high market-to-book firms with highearnings volatility. The average ~median! standard deviation of the returnon assets is 7.5 percent ~4.9 percent! for repurchasing non-dividend-payingfirms and 9.4 percent ~6.1 percent! for nonpayers. There is a big differencein earnings volatility between firms that pay dividends and those that donot pay dividends.
The relation between earnings volatility and payout method is importantgiven the possibility that firms with higher earnings volatility may tend topay out more in the form of repurchases rather than dividends. A relevantcomparison is the findings of Jagannathan et al. ~2000!. Like them, wefind that firms that only repurchase have higher earnings volatility thando firms that only pay dividends. Moreover, we find that repurchasingfirms are younger than dividend-paying firms: Only 34.1 percent of therepurchasing firms ~DIV � 0, REPO . 0! in our sample have been tradedfor more than eight years. In contrast, we find that 63.4 percent of thedividend paying firms ~DIV . 0! in our sample have been traded for morethan eight years.3
3 CRSP started to report data on Nasdaq stocks only in 1972. Restricting our sample to theperiod 1980 to 2000, we can classify firms to “young” and “old” using eight years of trading asthe cutoff.
1658 The Journal of Finance

Table II also shows that if we condition on a firm paying dividends, thereis no difference between firms that do or do not repurchase shares. We donot find that firms that pay dividends and repurchase shares have morevolatile earnings, on average, than firms that only pay dividends ~Jagan-nathan et al. ~2000! find similar results in their paper!. This result is im-portant, because firms that pay dividends and repurchase shares ~earningsvolatility equal to 3.4 percent! account for 87.9 percent of the total aggregateexpenditures on share repurchases. On the other hand, firms that only re-purchase shares ~earnings volatility equal to 7.5 percent! account for only12.1 percent of the repurchase activity.
Thus, comparing firms that only repurchase to firms that only pay divi-dends may not reveal the entire picture concerning the relation betweenpayout method and earnings volatility. It seems that young firms are thosewho prefer to pay in the form of repurchases, which could be a reason for thefindings that repurchases are associated with higher volatility of earnings.
To control for the age differences, we investigate the dividend and repur-chase policies of established firms ~i.e., those firms that have been on theCompustat files over the entire period 1972 to 2000!. Our objective is toexamine whether changes in the variability of earnings can account for theincrease in the propensity to repurchase. We report the results in Table III.For each of the firms, we calculate the standard deviation of ROA, the non-operating income scaled by assets, the dividend payout ratio, and the repur-chase payout ratio for three distinct subperiods: ~1! 1972–1979, ~2! 1980–1991, and ~3! 1992–2000. Table III shows that although the average ~median!volatility of the return on assets slightly declined from 3.35 percent ~2.35percent! in the period 1972 to 1979 to 3.15 percent ~2.33 percent! in theperiod 1992 to 2000, the average ~median! repurchase payout ratio increasedfrom 5.98 percent ~0 percent! to 22.8 percent ~11.48 percent!. That is, for asample of mature, well-established firms, we do not find positive relationbetween share repurchase activity and earnings volatility.
We also estimate a cross-sectional regression of the change in the sharerepurchase payout ratio from period 1972 to 1979 to period 1992 to 2000 onthe change in the standard deviation of ROA over the same time period.Although not reported in a table, we find that the coefficient of the standarddeviation of ROA is insignificant. Consistent with the univariate analysis,this result does not suggest that firms that experience higher earnings vol-atility tend to use more repurchases relative to dividends.
Another dimension of the change in the way firms distribute cash to theirshareholders can be seen in Figure 2. The figure depicts the distribution offirms by payout method over the period 1972 to 2000. We determine thepayout policy of a firm by observing the cash disbursements of the firm overa period of a year. The most striking result from this figure is the decliningtrend in the proportion of firms that only pay dividends. In the 1970s andearly 1980s, most firms relied almost exclusively on dividend payments todistribute cash to their equityholders. This situation changed in the mid-1980s, when corporations started to rely more on share repurchase pro-
Dividends, Share Repurchases, and the Substitution Hypothesis 1659

grams. As a percentage of the total number of firms distributing cash totheir shareholders, the number of repurchasing firms increased from 31 per-cent in 1972 to 80 percent in 2000. This increase means that the number offirms only paying dividends as a percentage of the total number of firmsdistributing cash to their shareholders declined from 69.0 percent in 1972 to20 percent in 2000. Since the number of firms distributing cash has beenalmost constant over time, this evidence suggests that repurchases have beendisplacing dividends. This evidence is also consistent with the recent find-ings of Fama and French ~2001! that the proportion of dividend-paying firmshas declined over time. However, contrary to their results, we find evidenceconsistent with substitution.
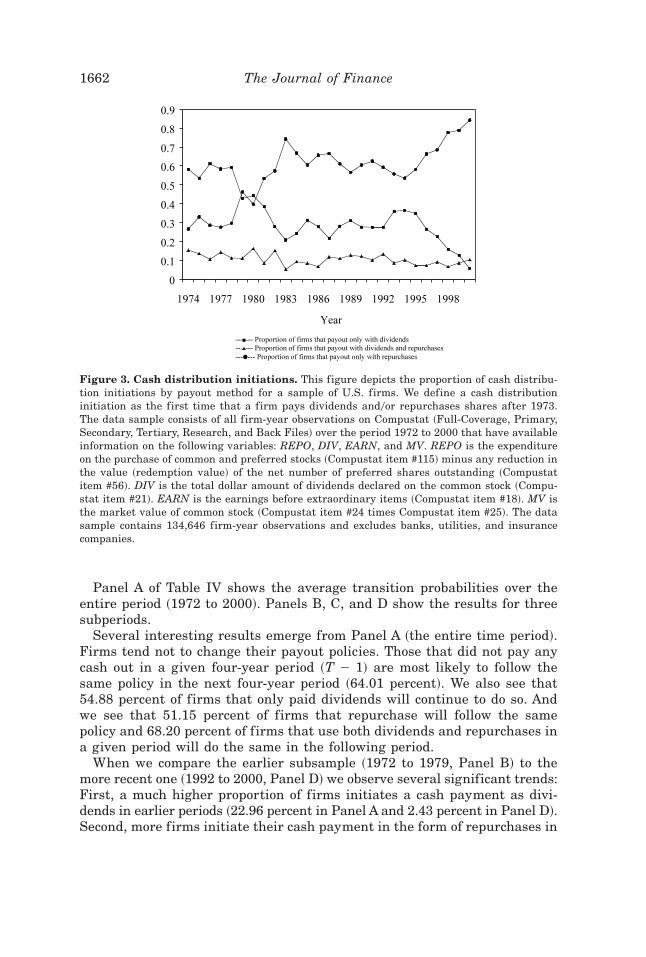
Figure 3 shows the proportion of cash distribution initiations by payoutmethod over the period 1974 to 2000. We define a cash distribution initia-tion as the first time that a firm pays dividends and0or repurchases sharesafter 1972. This figure shows that the proportion of firms that initiate acash distribution using only share repurchases increased from less than 27 per-
Table III
Relation between Cash Flow Volatility and Payout PolicyThis table examines the effects of cash f low volatility on payout policy for a sample of U.S.firms that have been on the Compustat files over the entire period 1972 to 2000 and whichhave available information on the following variables: REPO, DIV, EARN, and MV. REPO isthe expenditure on the purchase of common and preferred stocks ~Compustat item #115! minusany reduction in the value ~redemption value! of the net number of preferred shares outstand-ing ~Compustat item #56!. DIV is the total dollar amount of dividends declared on the commonstock ~Compustat item #21!. EARN is the earnings before extraordinary items ~Compustat item#18!. MV is the market value of common stock ~Compustat item #24 times Compustat item#25!. ROA is the operating income before depreciation ~Compustat item #13! scaled by the bookvalue of the total assets. s~ROA! is the standard deviation of ROA. s~ROA! is calculated overthe following time periods: 1972–1975, 1976–1979, 1980–1983, 1984–1987, 1988–1991, 1992–1995, and 1996–2000. NOPER is the nonoperating income before depreciation ~Compustat item#61! scaled by the book value of the total assets. DIV0EARN is the dividend payout ratio.REPO/EARN is the repurchase payout ratio. DIV0EARN, REPO/EARN, and NOPER havebeen truncated at the 99th percentile. ROA has been truncated at the 1st and 99th percentiles.The data sample contains 452 firms.
s~ROA! NOPER DIV0EARN REPO/EARN
Panel A: Period 1972–1979
Mean 3.35% 1.25% 26.57% 5.98%Median 2.35% 0.93% 25.59% 0.00%
Panel B: Period 1980–1991
Mean 3.57% 1.73% 36.46% 16.41%Median 2.69% 1.35% 32.56% 3.43%
Panel C: Period 1992–2000
Mean 3.15% 1.10% 35.15% 22.80%Median 2.33% 0.73% 31.15% 11.48%
1660 The Journal of Finance

cent in 1974 to more than 84 percent in 2000. This evidence indicates thatshare repurchases have become the preferred method of payout among firmsinitiating cash distributions to their equityholders.
Finally, we can draw a more complete picture by examining the dynamicsof firms’ payout methods during this time period. Table IV reports the tran-sition probabilities of changing from payout policy i at time T � 1 to payoutpolicy j at time T. As before, we determine the payout policy of a firm byobserving the cash disbursements of the firm over the following time peri-ods: 1972 to 1975, 1976 to 1979, 1980 to 1983, 1984 to 1987, 1988 to 1991,1992 to 1995, and 1996 to 2000. The firm’s payout policy can fall into one offour categories in each period: ~1! no cash distribution, ~2! only dividends,~3! only repurchases, and ~4! both dividends and repurchases. The transi-tions probabilities are equal to the number of firms changing their payoutpolicy from i to j divided by the total number of firms with payout policy i attime T � 1.
Figure 2. Distribution of firms by payout method. This figure depicts the distribution offirms by payout method for a sample of U.S. firms. We determine the payout policy of a firm byobserving the cash disbursements of the firm over a period of a year. The data sample consistsof all firm-year observations on Compustat ~Full-Coverage, Primary, Secondary, Tertiary, Re-search, and Back Files! over the period 1972 to 2000 that have available information on thefollowing variables: REPO, DIV, EARN, and MV. REPO is the expenditure on the purchase ofcommon and preferred stocks ~Compustat item #115! minus any reduction in the value ~re-demption value! of the net number of preferred shares outstanding ~Compustat item #56!. DIVis the total dollar amount of dividends declared on the common stock ~Compustat item #21!.EARN is the earnings before extraordinary items ~Compustat item #18!. MV is the marketvalue of common stock ~Compustat item #24 times Compustat item #25!. The data samplecontains 136,646 firm-year observations and excludes banks, utilities, and insurance companies.
Dividends, Share Repurchases, and the Substitution Hypothesis 1661
Panel A of Table IV shows the average transition probabilities over theentire period ~1972 to 2000!. Panels B, C, and D show the results for threesubperiods.
Several interesting results emerge from Panel A ~the entire time period!.Firms tend not to change their payout policies. Those that did not pay anycash out in a given four-year period ~T � 1! are most likely to follow thesame policy in the next four-year period ~64.01 percent!. We also see that54.88 percent of firms that only paid dividends will continue to do so. Andwe see that 51.15 percent of firms that repurchase will follow the samepolicy and 68.20 percent of firms that use both dividends and repurchases ina given period will do the same in the following period.
When we compare the earlier subsample ~1972 to 1979, Panel B! to themore recent one ~1992 to 2000, Panel D! we observe several significant trends:First, a much higher proportion of firms initiates a cash payment as divi-dends in earlier periods ~22.96 percent in Panel A and 2.43 percent in Panel D!.Second, more firms initiate their cash payment in the form of repurchases in
Figure 3. Cash distribution initiations. This figure depicts the proportion of cash distribu-tion initiations by payout method for a sample of U.S. firms. We define a cash distributioninitiation as the first time that a firm pays dividends and0or repurchases shares after 1973.The data sample consists of all firm-year observations on Compustat ~Full-Coverage, Primary,Secondary, Tertiary, Research, and Back Files! over the period 1972 to 2000 that have availableinformation on the following variables: REPO, DIV, EARN, and MV. REPO is the expenditureon the purchase of common and preferred stocks ~Compustat item #115! minus any reduction inthe value ~redemption value! of the net number of preferred shares outstanding ~Compustatitem #56!. DIV is the total dollar amount of dividends declared on the common stock ~Compu-stat item #21!. EARN is the earnings before extraordinary items ~Compustat item #18!. MV isthe market value of common stock ~Compustat item #24 times Compustat item #25!. The datasample contains 134,646 firm-year observations and excludes banks, utilities, and insurancecompanies.
1662 The Journal of Finance
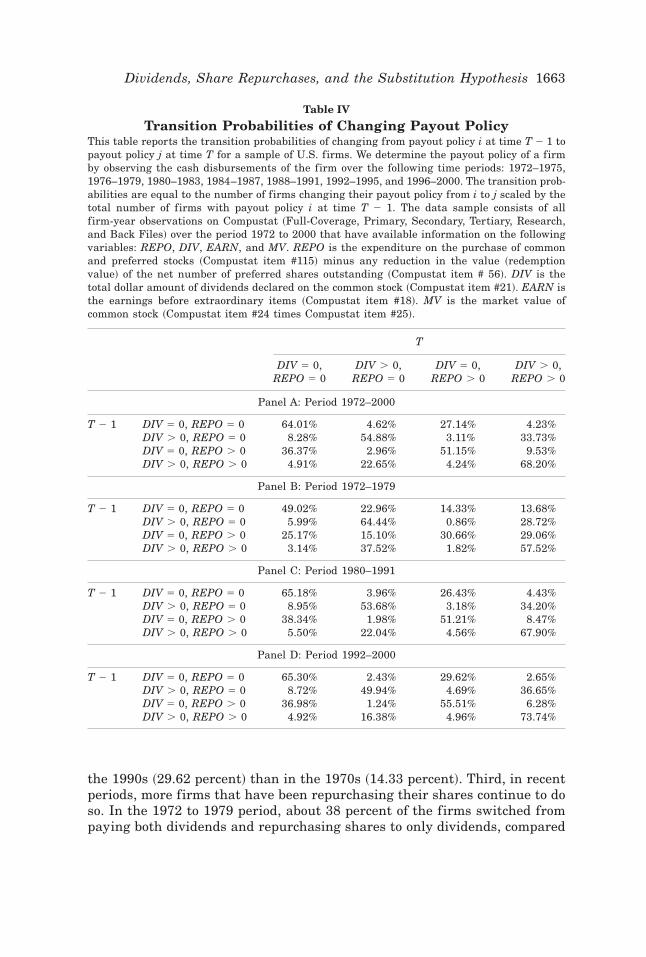
the 1990s ~29.62 percent! than in the 1970s ~14.33 percent!. Third, in recentperiods, more firms that have been repurchasing their shares continue to doso. In the 1972 to 1979 period, about 38 percent of the firms switched frompaying both dividends and repurchasing shares to only dividends, compared
Table IV
Transition Probabilities of Changing Payout PolicyThis table reports the transition probabilities of changing from payout policy i at time T � 1 topayout policy j at time T for a sample of U.S. firms. We determine the payout policy of a firmby observing the cash disbursements of the firm over the following time periods: 1972–1975,1976–1979, 1980–1983, 1984–1987, 1988–1991, 1992–1995, and 1996–2000. The transition prob-abilities are equal to the number of firms changing their payout policy from i to j scaled by thetotal number of firms with payout policy i at time T � 1. The data sample consists of allfirm-year observations on Compustat ~Full-Coverage, Primary, Secondary, Tertiary, Research,and Back Files! over the period 1972 to 2000 that have available information on the followingvariables: REPO, DIV, EARN, and MV. REPO is the expenditure on the purchase of commonand preferred stocks ~Compustat item #115! minus any reduction in the value ~redemptionvalue! of the net number of preferred shares outstanding ~Compustat item # 56!. DIV is thetotal dollar amount of dividends declared on the common stock ~Compustat item #21!. EARN isthe earnings before extraordinary items ~Compustat item #18!. MV is the market value ofcommon stock ~Compustat item #24 times Compustat item #25!.
T
DIV � 0,REPO � 0
DIV . 0,REPO � 0
DIV � 0,REPO . 0
DIV . 0,REPO . 0
Panel A: Period 1972–2000
T � 1 DIV � 0, REPO � 0 64.01% 4.62% 27.14% 4.23%DIV . 0, REPO � 0 8.28% 54.88% 3.11% 33.73%DIV � 0, REPO . 0 36.37% 2.96% 51.15% 9.53%DIV . 0, REPO . 0 4.91% 22.65% 4.24% 68.20%
Panel B: Period 1972–1979
T � 1 DIV � 0, REPO � 0 49.02% 22.96% 14.33% 13.68%DIV . 0, REPO � 0 5.99% 64.44% 0.86% 28.72%DIV � 0, REPO . 0 25.17% 15.10% 30.66% 29.06%DIV . 0, REPO . 0 3.14% 37.52% 1.82% 57.52%
Panel C: Period 1980–1991
T � 1 DIV � 0, REPO � 0 65.18% 3.96% 26.43% 4.43%DIV . 0, REPO � 0 8.95% 53.68% 3.18% 34.20%DIV � 0, REPO . 0 38.34% 1.98% 51.21% 8.47%DIV . 0, REPO . 0 5.50% 22.04% 4.56% 67.90%
Panel D: Period 1992–2000
T � 1 DIV � 0, REPO � 0 65.30% 2.43% 29.62% 2.65%DIV . 0, REPO � 0 8.72% 49.94% 4.69% 36.65%DIV � 0, REPO . 0 36.98% 1.24% 55.51% 6.28%DIV . 0, REPO . 0 4.92% 16.38% 4.96% 73.74%
Dividends, Share Repurchases, and the Substitution Hypothesis 1663
with 16.38 percent in the later period ~Panel D!. Firms that have been re-purchasing ~but not paying dividends! continue to do so at a higher propor-tion in the later period ~55.51 percent vs. 30.66 percent!. Fourth, that duringthe period 1972 to 1979, of the firms that only repurchased in a given pe-riod, 15.1 percent switched to only paying dividends in the following periodand 29.06 percent switched to using both methods of payments. Only 1.24percent and 6.28 percent, respectively, of the firms follow this strategy inthe later period. Finally, firms that use both methods of payment are lesslikely to switch to only dividends in the later periods. In the earlier period~Panel B!, 37.52 percent of firms that have been using both methods to dis-tribute cash to equityholders in period t � 1 switch to only dividends inperiod t. In the later period ~Panel D!, the proportion drops to 16.38 percent.In the 1972 to 1979 period, 57.52 percent of firms that paid in the form ofdividend and repurchases continue to do so, compared with 73.74 percent inthe 1990s. ~Using a binomial test, we find that all the differences discussedabove are significantly different from zero at the one percent level.!
Overall, the results in Table IV indicate that relative to the 1970s, U.S.corporations are more likely to use share repurchase programs and less likelyto use dividends. It seems that corporations have been changing their pref-erences on the form of payout they use to distribute cash.
Using a different measure of share repurchases, a recent paper by Famaand French ~2001! does not detect a strong relation between share repur-chase activity and changes in dividends. The Fama and French measuremay cloud the relation between dividends and repurchases, since their mea-sure of repurchases ~either the change in Treasury stocks or the amountrepurchased minus amount issued by the firm! involves not only repurchaseactivity, but also equity issuance and payment to labor in the form of stockoptions.
This measure may pose two problems. First, since our objective is to com-pare dividends to repurchases, we do not want to subtract another financingactivity of the firm ~equity issuance! from repurchases and not from divi-dends. Otherwise, we would be comparing net repurchase activity to grossdividends. Second, the exercise of stock options decreases the amount ofTreasury stocks, and therefore results in an underestimate of the true amountthat was repurchased ~see also Stephens and Weisbach, 1998!. Moreover,stock options are a form of payment to labor and should be viewed as such.Thus, by calculating the net change in Treasury stocks, we might be mea-suring a net impact of financing ~repurchases and equity issuance! and in-vestment decisions ~payment to labor!.
For example, imagine a firm that repurchases 1,000 shares, say for $10,000,and then a few months later the firm turns around and gives these sharesto its CEO as part of her compensation. The firm is involved in two distinctactions. The first is a financing action ~repurchase shares!, and the secondis an investment decision ~to pay the manager!. In this example, the netchange in Treasury stocks is zero. Thus, this measure of repurchase couldunderestimate the extent of repurchase activity since it combines payment
1664 The Journal of Finance
to labor through stocks and repurchase of shares. Indeed, Stephens and Weis-bach ~1998! show that measuring repurchase activity through changes inTreasury stocks results in estimates that are 60 percent lower than the mea-sures that use the cash amount spent on repurchases ~as we do! or the amountfirms announce they will repurchase.
IV. Share Repurchases, Dividends, andthe Substitution Hypothesis
To investigate on a firm level whether dividend-paying firms treat divi-dends and repurchases as alternative payout methods, we use Lintner’s ~1956!analysis of how firms determine their dividend policy. Lintner’s observationssuggest that firms’ dividend policy is a function of their targeted payoutratio and the speed of adjustment of current dividends. Using this model, wecalculate the expected dividend payment for a firm based on its past divi-dend behavior and determine whether actual dividend payments are aboveor below the expected dividend payment. By doing so, we can observe whetherfirms are deviating from their past dividend policies. If firms are substitut-ing repurchases for dividends, then we should find a negative correlationbetween the dividend forecast error ~actual minus expected! and share re-purchase activity. In other words, finding a negative correlation betweenthese two variables would indicate that share repurchases have been par-tially financed with potential dividend increases. Alternatively, finding apositive ~zero! correlation between these two variables would indicate thatdividends and share repurchases are complementary ~independent! payoutmethods.
We examine the effect of share repurchase activity on the dividend fore-cast error by using a sample of firms that have continuously paid dividendsover the entire preforecast period.4 We use two preforecast periods to esti-mate the parameters of the Lintner ~1956! model: 1973 to 1983 and 1973 to1990.
For each firm, we define the dividend-forecast error as
ERRORt, i � @�DIVt, i � ~b1, i � b2, i EARNt, i � b3, i DIVt�1, i !#0MVt�1, i ~1!
where �DIVt, i is the actual change in dividends in year t, EARNt, i is theearnings in year t, DIVt�1, i is the dividend level at year t � 1, and MVt�1, i isthe market value of equity in year t � 1. The coefficients b2, i and b3, i are theparameters of earnings and lagged dividends, respectively, from Lintner ’s~1956! model, which we have estimated over a preforecast period. ~Scaling
4 Using such firms results in more precise parameters for the Lintner ~1956! model. Werepeat the analysis by using portfolios of firms instead of individual firms. The results arequalitatively the same.
Dividends, Share Repurchases, and the Substitution Hypothesis 1665
by the market value of equity reduces the effects of heteroskedasticity andenables us to directly compare the forecast error to the repurchase and div-idend yield.!
On average, our estimates of the parameters of the Lintner ~1956! modelare consistent with the estimates reported in Fama ~1974! over the period1946 to 1968. The average estimate for the coefficient of earnings is 0.092when we estimate the model over the period 1973 to 1983. The averageestimate for the coefficient of lagged dividends is �0.208 and the averageadjusted R2 is 45.7 percent.
Table V shows the empirical relation between the dividend forecast error~ERROR! and the share repurchase yield ~RYIELD!. Consistent with thesubstitution hypothesis, the evidence indicates that the dividend forecasterror is negatively correlated with the share repurchase yield.5 The forecasterror becomes more negative ~monotonically! as the share-repurchase yieldincreases.6 That is, as firms repurchase more ~i.e., a higher repurchase yield!,the actual dividend is lower than the expected dividend. For example, themean ~median! dividend forecast error when there is no repurchase activity~Group 1! is equal to 0.044 percent ~0.012 percent! when the preforecastperiod is 1973 to 1983 and �0.060 percent ~�0.001 percent! when the pre-forecast period is 1973 to 1990. This small forecast error is an indicationthat the model works well in the absence of repurchase activity. On the otherhand, the mean ~median! dividend forecast error when share repurchase ishigh ~Group 5! is equal to �0.144 percent ~�0.177 percent! when the pre-forecast period is 1973 to 1983 and �0.326 percent ~�0.221 percent! whenthe preforecast period is 1973 to 1990. The differences in forecast errorsbetween Group 5 and Group 1 are negative and significantly different fromzero. Although not reported in the table, we also find that the difference inforecast errors between repurchasing firms and nonrepurchasing firms isnegative and statistically significant.
To examine the economic significance of the dividend forecast error, weestimate how large the average forecast error is relative to the average div-idend yield. We find that a forecasting error of �0.144 percent ~Group 5when the preforecast period is 1972 to 1983! implies a deviation of 5.11percent from the average dividend yield. A forecasting error of �0.326 per-cent ~Group 5 when the preforecast period is 1972 to 1990! implies a devi-ation of 14.05 percent from the average dividend yield. These comparisonsindicate that the magnitudes of the forecast errors are not trivial.
We could argue that the correlation between the dividend forecast errorand share repurchase activity is driven by differences in the firm char-acteristics. For example, a firm might decide to repurchase shares afterexperiencing an increase in earnings volatility. This situation could create
5 We note that the number of observations varies across groups. The reason for this is thatRYIELD is not uniformly distributed.
6 We also ran a simple regression of the ERROR on RYIELD, and found that the coefficientof RYIELD is negative and significantly different from zero at the one percent level.
1666 The Journal of Finance

Table V
Relation between Dividend Forecast Errorsand Share Repurchase Yield
This table examines the empirical relation between dividend forecast errors and share repur-chase yield for a sample of U.S. firms. We define the dividend forecast error as
ERRORt, i � @�DIVt, i � ~b1, i � b2, i EARNt, i � b3, i DIVt�1, i !#0MVt�1, i
where �DIVt, i is the actual change in dividends at time t, EARNt, i is the earnings at time t,DIVt�1, i is the dividend level at t � 1, and MVt�1, i is the market value of equity at time t � 1.The coefficients b1, i , b2, i , and b3, i are the parameters of Lintner ’s ~1956! model that have beenestimated for each firm over a preforecast period. To be included in the sample, each firm musthave paid dividends continuously over the entire preforecast period. If the absolute value of theforecasting error is greater than five percent, then the observation is eliminated to reduce theeffect of extreme values. RYIELD is the total expenditure on share repurchases at time t scaledby the market value of equity at time t � 1. DYIELD is the total expenditure on dividends attime t scaled by the market value of equity at time t � 1. The number of observations variesacross groups because RYIELD is not uniformly distributed. RYIELD and DYIELD have beentruncated at the 99th percentile.
Groups Ranked by Share Repurchase Yield
PreforecastPeriod
EntireSample
1~Low! 2 3 4
5~High! ~5–1!
1973–1983ERROR
Mean 0.017%b 0.044%a 0.030%b �0.034% �0.149%a �0.144%a �0.188%a
Median �0.009% 0.012%a �0.005%b �0.041%a �0.108%a �0.177%a �0.189%a
N 9,521 4,354 3,558 896 342 371 —
RYIELDMean 1.61%a 0.00% 1.01%a 4.29%a 7.27%a 14.61%a 14.61%a
Median 0.06%a 0.00% 0.81%a 4.19%a 7.06%a 12.70%a 12.70%a
N 9,521 4,354 3,558 896 342 371 —
DYIELDMean 2.82%a 3.00%a 2.66%a 2.68%a 2.52%a 2.82%a �0.18%b
Median 2.70%a 2.86%a 2.56%a 2.57%a 2.41%a 2.79%a �0.07%N 9,521 4,354 3,558 896 342 371 —
1973–1990ERROR
Mean �0.088%a �0.060%a �0.079%a �0.119%a �0.237%a �0.326%a �0.266%a
Median �0.026%a �0.001% �0.021%a �0.072%a �0.117%a �0.221%a �0.220%a
N 4,116 1,713 1,712 429 154 108 —
RYIELDMean 1.47%a 0.00% 1.04%a 4.23%a 7.21%a 12.31%a 12.31%a
Median 0.16%a 0.00% 0.86%a 4.11%a 7.00%a 11.34%a 11.34%a
N 4,116 1,713 1,712 429 154 108 —
DYIELDMean 2.64%a 2.88%a 2.53%a 2.41%a 2.06%a 2.32%a �0.56%a
Median 2.48%a 2.75%a 2.39%a 2.28%a 1.99%a 2.23%a �0.52%a
N 4,116 1,713 1,712 429 154 108 —
a,b Significantly different from zero at the one percent and five percent levels, respectively.
Dividends, Share Repurchases, and the Substitution Hypothesis 1667

a spurious correlation between the dividend forecast error and the sharerepurchase yield, because the increase in earnings volatility could be caus-ing both the decline in dividends and the increase in share repurchases.That is, it is possible that firms with high-repurchase yields have differ-ent characteristics than firms with low-repurchase yields. Therefore, theapparent substitution effect could be caused only by differences in firmcharacteristics.
Therefore, we control for several factors that might affect the decision ofthe method of payment. In Table VI, we report the results of cross-sectional regressions of the dividend forecast error on the repurchase yield,the logarithm of size, the return on assets, the volatility of return on as-sets, the nonoperating income scaled by total assets, and the debt-to-totalassets ratio. To reduce the effect of cross-correlated residuals, we use Famaand Macbeth ~1973! type regressions to estimate the coefficients and stan-dard errors. First, we estimate year-by-year annual average coefficients.Then, we estimate time-series averages for each coefficient. We estimatethe standard errors by using the Hansen–Hodrick standard error correc-tion method.
Our results indicate that the repurchase yield has a negative effect onthe dividend forecast error even after we control for firm characteristics.The average regression coefficient of RYIELD is equal to �0.01312 when thepreforecast period is 1973 to 1983 and �0.01766 when the preforecast periodis 1973 to 1990. These coefficients are significantly different from zero atthe one percent confidence level.
The evidence in this section seems to suggest that dividend-paying firmshave been substituting dividends with share repurchases.
V. Does the Market Perceive Dividendsand Repurchases as Substitutes?
Presumably, corporations substitute share repurchases for dividends be-cause it increases the value of the firm. Therefore, a relevant question ishow investors perceive this change in corporate policy. Answering this ques-tion is important, because it will allow us to test the substitution hypothesisfrom a different perspective. All else constant, if investors believe that it ismore likely that corporations are substituting share repurchases for divi-dends, then the market reaction to dividend cuts should be significantly lessnegative for repurchasing firms than for nonrepurchasing firms. If there isno substitution between dividends and repurchases, then the market reac-tion to dividend cuts should be the same for all types of firms.
Testing this hypothesis is not a trivial task because it is very rare forfirms to simultaneously announce a share repurchase program and a divi-dend reduction. ~One likely reason for the rarity of this event is that it makesit all too clear to the Internal Revenue Service ~IRS! that the announcedrepurchase is a perfect substitute to a dividend distribution.! However, whatwe can observe is the market reaction to firms’ announcements of dividend
1668 The Journal of Finance
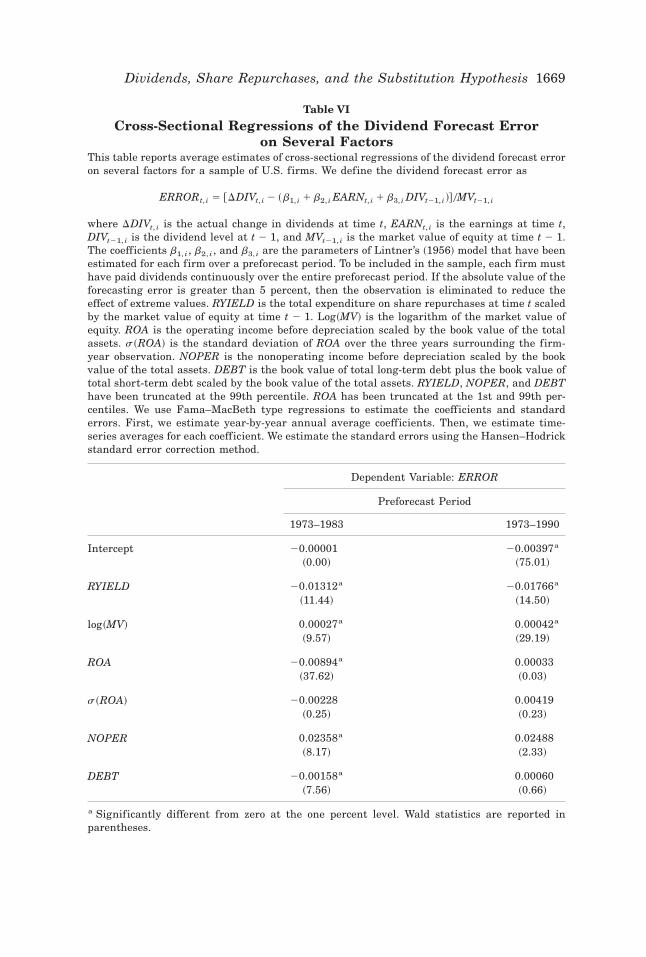
Table VI
Cross-Sectional Regressions of the Dividend Forecast Erroron Several Factors
This table reports average estimates of cross-sectional regressions of the dividend forecast erroron several factors for a sample of U.S. firms. We define the dividend forecast error as
ERRORt, i � @�DIVt, i � ~b1, i � b2, i EARNt, i � b3, i DIVt�1, i !#0MVt�1, i
where �DIVt, i is the actual change in dividends at time t, EARNt, i is the earnings at time t,DIVt�1, i is the dividend level at t � 1, and MVt�1, i is the market value of equity at time t � 1.The coefficients b1, i , b2, i , and b3, i are the parameters of Lintner ’s ~1956! model that have beenestimated for each firm over a preforecast period. To be included in the sample, each firm musthave paid dividends continuously over the entire preforecast period. If the absolute value of theforecasting error is greater than 5 percent, then the observation is eliminated to reduce theeffect of extreme values. RYIELD is the total expenditure on share repurchases at time t scaledby the market value of equity at time t � 1. Log~MV! is the logarithm of the market value ofequity. ROA is the operating income before depreciation scaled by the book value of the totalassets. s~ROA! is the standard deviation of ROA over the three years surrounding the firm-year observation. NOPER is the nonoperating income before depreciation scaled by the bookvalue of the total assets. DEBT is the book value of total long-term debt plus the book value oftotal short-term debt scaled by the book value of the total assets. RYIELD, NOPER, and DEBThave been truncated at the 99th percentile. ROA has been truncated at the 1st and 99th per-centiles. We use Fama–MacBeth type regressions to estimate the coefficients and standarderrors. First, we estimate year-by-year annual average coefficients. Then, we estimate time-series averages for each coefficient. We estimate the standard errors using the Hansen–Hodrickstandard error correction method.
Dependent Variable: ERROR
Preforecast Period
1973–1983 1973–1990
Intercept �0.00001 �0.00397a
~0.00! ~75.01!
RYIELD �0.01312a �0.01766a
~11.44! ~14.50!
log~MV! 0.00027a 0.00042a
~9.57! ~29.19!
ROA �0.00894a 0.00033~37.62! ~0.03!
s~ROA! �0.00228 0.00419~0.25! ~0.23!
NOPER 0.02358a 0.02488~8.17! ~2.33!
DEBT �0.00158a 0.00060~7.56! ~0.66!
a Significantly different from zero at the one percent level. Wald statistics are reported inparentheses.
Dividends, Share Repurchases, and the Substitution Hypothesis 1669
reduction. Although it is well documented that stock prices react negativelyto the announcement of dividend decreases ~see Asquith and Mullins ~1983!,Brickley ~1983!, Healy and Palepu ~1988!, Michaely, Thaler, and Womack~1995!!, it is still unclear whether the market reacts differently to this newsas a function of the firm’s repurchase policy. We investigate this issue inSection V.A.
If dividends and repurchases are substitutes and differential taxes play arole in this issue, then the market reaction to a share repurchase announce-ment should be a function of the relative taxation as well. In other words,the market reaction to these corporate events should be positively correlatedwith the marginal benefit of substituting share repurchases for dividends.We investigate this issue in Section V.B.
A. The Effect of Share Repurchases on the Market ReactionSurrounding Dividend Decreases
To assess the effect of share repurchase programs on the market reactionaround the announcement of dividend decreases, we collect a sample con-sisting of firms that reduced their cash dividends during the period 1974 to1996. Each observation in the sample satisfies the following criteria: ~1! thefirm’s financial data is available on CRSP and Compustat, ~2! its dividend ispaid quarterly, ~3! the dividend is taxable, ~4! the cash dividend change isgreater than 10 percent, and ~5! the cash dividend is not an omission. Theresulting sample contains 1,255 announcements of dividend decreases. Weclassify the firms in our sample of dividend decreases as repurchasing firmsor nonrepurchasing firms. To be classified as a repurchasing firm, a firmmust have repurchased shares over the two years prior to the announcementof the dividend decrease.
Table VII presents the results of this analysis. The three-day cumulativeabnormal return around the announcement of dividend decreases is signif-icantly less negative for nonrepurchasing firms than for repurchasing firms.On average, the market reaction to dividend decreases is not significantlydifferent from zero for nonrepurchasing firms. Although the mean ~median!market reaction around the announcements made by nonrepurchasing firmsis �1.93 percent ~�0.72 percent!, the mean ~median! market reaction aroundthe announcements made by repurchasing firms is only �0.45 percent~0.10 percent!. The differences between the two means ~1.48 percent! and thetwo medians ~0.82 percent! are significantly different from zero at the 1 per-cent level. Table VII also shows that the mean and median percentage changesin the cash dividend. Since the difference between these values is relativelysmall, we cannot attribute the difference in market reaction to differences inthe magnitude of the dividend changes.7
7 Conditioning on the firm repurchasing shares in only the prior year ~rather than in the twoyears before the announcement of dividend reduction!, we find similar results.
1670 The Journal of Finance
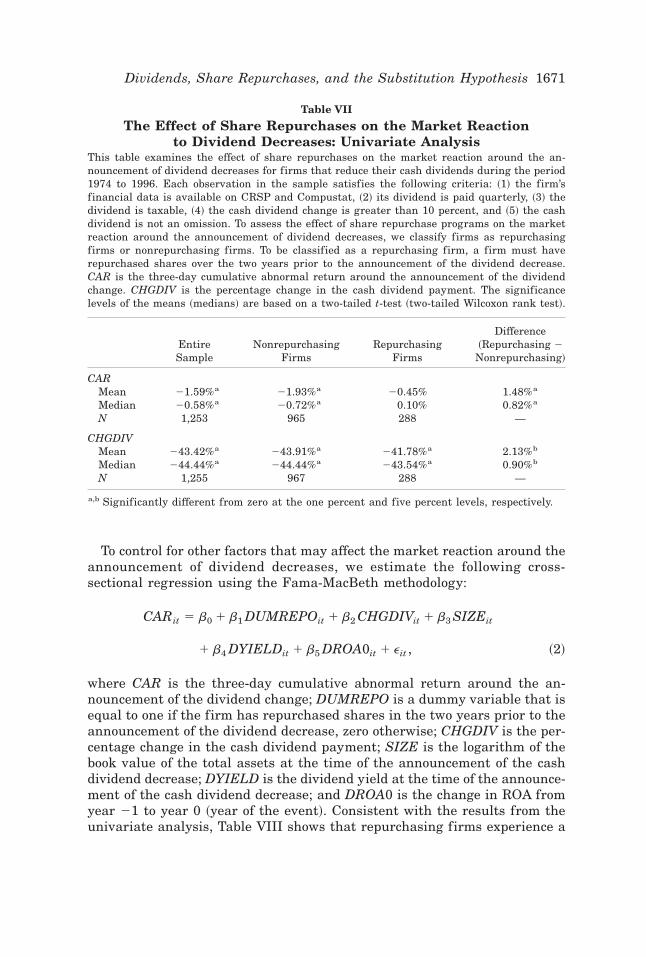
To control for other factors that may affect the market reaction around theannouncement of dividend decreases, we estimate the following cross-sectional regression using the Fama-MacBeth methodology:
CARit � b0 � b1 DUMREPOit � b2 CHGDIVit � b3 SIZEit
� b4 DYIELDit � b5 DROA0it � eit , ~2!
where CAR is the three-day cumulative abnormal return around the an-nouncement of the dividend change; DUMREPO is a dummy variable that isequal to one if the firm has repurchased shares in the two years prior to theannouncement of the dividend decrease, zero otherwise; CHGDIV is the per-centage change in the cash dividend payment; SIZE is the logarithm of thebook value of the total assets at the time of the announcement of the cashdividend decrease; DYIELD is the dividend yield at the time of the announce-ment of the cash dividend decrease; and DROA0 is the change in ROA fromyear �1 to year 0 ~year of the event!. Consistent with the results from theunivariate analysis, Table VIII shows that repurchasing firms experience a
Table VII
The Effect of Share Repurchases on the Market Reactionto Dividend Decreases: Univariate Analysis
This table examines the effect of share repurchases on the market reaction around the an-nouncement of dividend decreases for firms that reduce their cash dividends during the period1974 to 1996. Each observation in the sample satisfies the following criteria: ~1! the firm’sfinancial data is available on CRSP and Compustat, ~2! its dividend is paid quarterly, ~3! thedividend is taxable, ~4! the cash dividend change is greater than 10 percent, and ~5! the cashdividend is not an omission. To assess the effect of share repurchase programs on the marketreaction around the announcement of dividend decreases, we classify firms as repurchasingfirms or nonrepurchasing firms. To be classified as a repurchasing firm, a firm must haverepurchased shares over the two years prior to the announcement of the dividend decrease.CAR is the three-day cumulative abnormal return around the announcement of the dividendchange. CHGDIV is the percentage change in the cash dividend payment. The significancelevels of the means ~medians! are based on a two-tailed t-test ~two-tailed Wilcoxon rank test!.
EntireSample
NonrepurchasingFirms
RepurchasingFirms
Difference~Repurchasing �
Nonrepurchasing!
CARMean �1.59%a �1.93%a �0.45% 1.48%a
Median �0.58%a �0.72%a 0.10% 0.82%a
N 1,253 965 288 —
CHGDIVMean �43.42%a �43.91%a �41.78%a 2.13%b
Median �44.44%a �44.44%a �43.54%a 0.90%b
N 1,255 967 288 —
a,b Significantly different from zero at the one percent and five percent levels, respectively.
Dividends, Share Repurchases, and the Substitution Hypothesis 1671
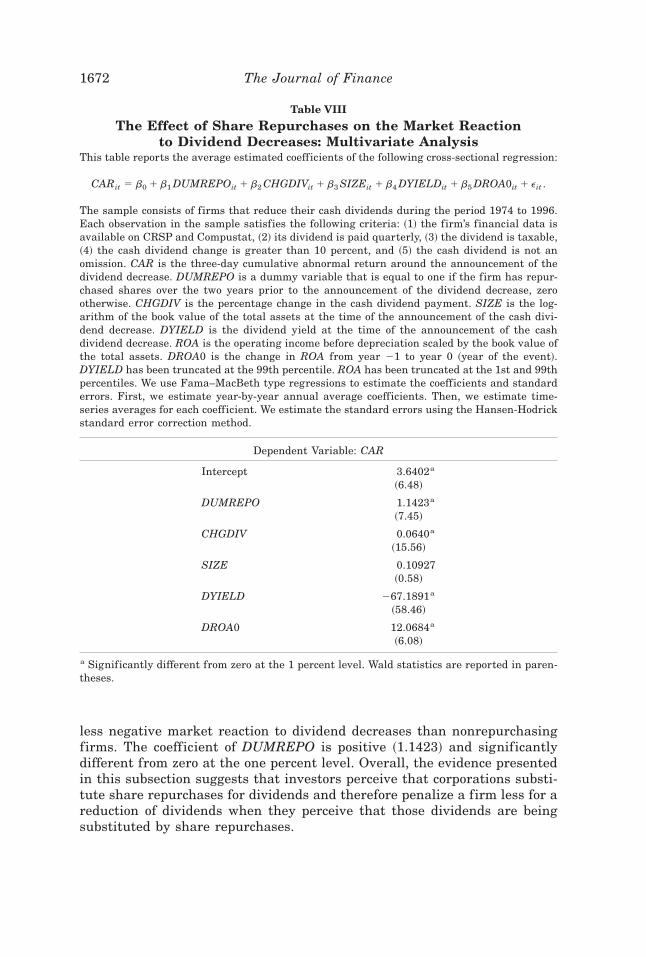
less negative market reaction to dividend decreases than nonrepurchasingfirms. The coefficient of DUMREPO is positive ~1.1423! and significantlydifferent from zero at the one percent level. Overall, the evidence presentedin this subsection suggests that investors perceive that corporations substi-tute share repurchases for dividends and therefore penalize a firm less for areduction of dividends when they perceive that those dividends are beingsubstituted by share repurchases.
Table VIII
The Effect of Share Repurchases on the Market Reactionto Dividend Decreases: Multivariate Analysis
This table reports the average estimated coefficients of the following cross-sectional regression:
CARit � b0 � b1 DUMREPOit � b2 CHGDIVit � b3 SIZEit � b4 DYIELDit � b5 DROA0it � eit .
The sample consists of firms that reduce their cash dividends during the period 1974 to 1996.Each observation in the sample satisfies the following criteria: ~1! the firm’s financial data isavailable on CRSP and Compustat, ~2! its dividend is paid quarterly, ~3! the dividend is taxable,~4! the cash dividend change is greater than 10 percent, and ~5! the cash dividend is not anomission. CAR is the three-day cumulative abnormal return around the announcement of thedividend decrease. DUMREPO is a dummy variable that is equal to one if the firm has repur-chased shares over the two years prior to the announcement of the dividend decrease, zerootherwise. CHGDIV is the percentage change in the cash dividend payment. SIZE is the log-arithm of the book value of the total assets at the time of the announcement of the cash divi-dend decrease. DYIELD is the dividend yield at the time of the announcement of the cashdividend decrease. ROA is the operating income before depreciation scaled by the book value ofthe total assets. DROA0 is the change in ROA from year �1 to year 0 ~year of the event!.DYIELD has been truncated at the 99th percentile. ROA has been truncated at the 1st and 99thpercentiles. We use Fama–MacBeth type regressions to estimate the coefficients and standarderrors. First, we estimate year-by-year annual average coefficients. Then, we estimate time-series averages for each coefficient. We estimate the standard errors using the Hansen-Hodrickstandard error correction method.
Dependent Variable: CAR
Intercept 3.6402a
~6.48!
DUMREPO 1.1423a
~7.45!
CHGDIV 0.0640a
~15.56!
SIZE 0.10927~0.58!
DYIELD �67.1891a
~58.46!
DROA0 12.0684a
~6.08!
a Significantly different from zero at the 1 percent level. Wald statistics are reported in paren-theses.
1672 The Journal of Finance

B. Share Repurchases, Dividends, and Taxes
If we assume that investors’ dividend tax rates are higher than their cap-ital gains tax rates, then every dollar the firm pays its shareholders througha repurchase and not through a dividend should be more valuable to inves-tors by the differential taxes between dividends and capital gains. If, on theother hand, firms are paying repurchases from retained earnings for exam-ple, and are not using repurchases as a substitute for dividends, then dif-ferential taxes should not affect investors’ reaction to repurchases.
We test this prediction by examining the effect of the Tax Reform Act of1986 on the market reaction surrounding share repurchase announcements.Since the Tax Reform Act of 1986 drastically reduced the difference betweendividends and capital gains, the substitution hypothesis predicts a reductionin the market reaction around share repurchase announcements after thistax reform.
With this objective in mind, we form a sample of firms that announce openmarket share repurchase programs over the period 1980 to 1997. We gatherdata on open market share repurchase announcements from two differentsources. Our main sample comes from announcements reported in the Se-curities Data Corporation’s U.S. Mergers and Acquisitions database over theperiod 1985 to 1997. This database contains a comprehensive sample of openmarket share repurchase announcements and covers most of the share re-purchase programs announced after 1984. We supplement this sample withannouncements of open market share repurchase programs reported in theWall Street Journal Index over the period 1980 to 1984.
The final sample satisfies the following criteria. ~1! The firm’s financialdata is available on CRSP and Compustat. ~2! The announcement of theshare repurchase program does not coincide with the announcement of adividend change. ~3! The firm discloses the number or the percentage ofshares sought during the duration of the share repurchase program. If thefirm only announces the number of shares sought, then we calculate thepercentage of shares sought by using the number of shares outstanding atthe announcement of the share repurchase program. ~4! The announcementof the open market share repurchase program is not made during the lastquarter of 1987.8 These selection criteria produce a sample of 3,935 open-market share repurchase announcements over the period 1980 to 1997.
We divide our sample of share repurchase announcements into two sub-samples, firms that announced open-market share repurchase programs priorto the approval of the tax reform, and firms that announced open-marketshare repurchase programs after the approval of the tax reform. Consistentwith the predictions of the substitution hypothesis, the results in Panel A of
8 Following Ikenberry, Lakonishok, and Vermaelen ~1995!, we exclude this period from thesample because many corporations established open-market share repurchase programs duringthis period to stabilize their stock prices after the market crash of October 1987. Furthermore,during this period, many companies did not announce the number of shares to repurchase overthe duration of the program.
Dividends, Share Repurchases, and the Substitution Hypothesis 1673
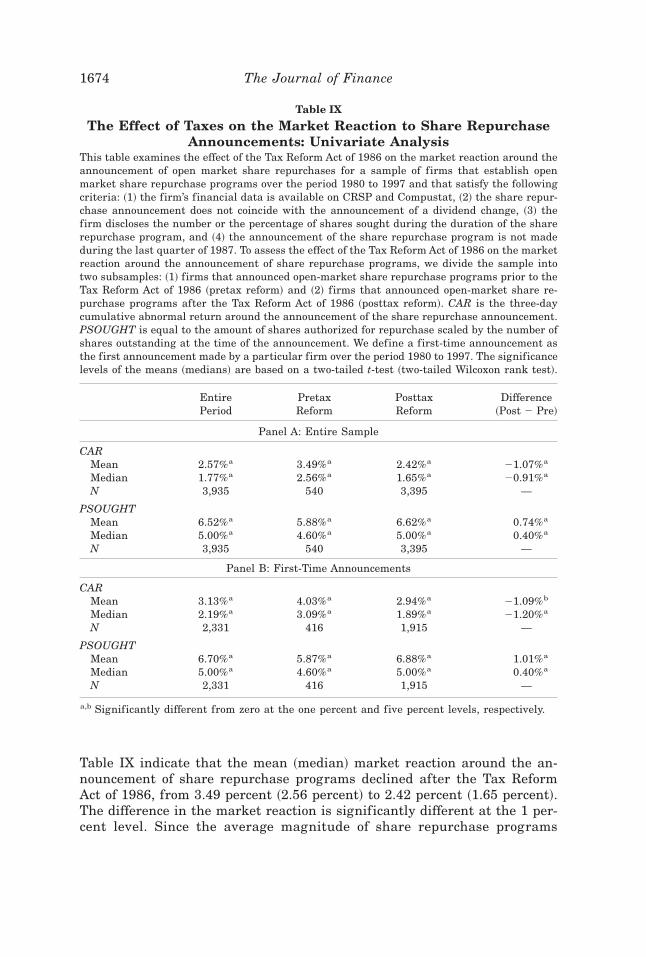
Table IX indicate that the mean ~median! market reaction around the an-nouncement of share repurchase programs declined after the Tax ReformAct of 1986, from 3.49 percent ~2.56 percent! to 2.42 percent ~1.65 percent!.The difference in the market reaction is significantly different at the 1 per-cent level. Since the average magnitude of share repurchase programs
Table IX
The Effect of Taxes on the Market Reaction to Share RepurchaseAnnouncements: Univariate Analysis
This table examines the effect of the Tax Reform Act of 1986 on the market reaction around theannouncement of open market share repurchases for a sample of firms that establish openmarket share repurchase programs over the period 1980 to 1997 and that satisfy the followingcriteria: ~1! the firm’s financial data is available on CRSP and Compustat, ~2! the share repur-chase announcement does not coincide with the announcement of a dividend change, ~3! thefirm discloses the number or the percentage of shares sought during the duration of the sharerepurchase program, and ~4! the announcement of the share repurchase program is not madeduring the last quarter of 1987. To assess the effect of the Tax Reform Act of 1986 on the marketreaction around the announcement of share repurchase programs, we divide the sample intotwo subsamples: ~1! firms that announced open-market share repurchase programs prior to theTax Reform Act of 1986 ~pretax reform! and ~2! firms that announced open-market share re-purchase programs after the Tax Reform Act of 1986 ~posttax reform!. CAR is the three-daycumulative abnormal return around the announcement of the share repurchase announcement.PSOUGHT is equal to the amount of shares authorized for repurchase scaled by the number ofshares outstanding at the time of the announcement. We define a first-time announcement asthe first announcement made by a particular firm over the period 1980 to 1997. The significancelevels of the means ~medians! are based on a two-tailed t-test ~two-tailed Wilcoxon rank test!.
EntirePeriod
PretaxReform
PosttaxReform
Difference~Post � Pre!
Panel A: Entire Sample
CARMean 2.57%a 3.49%a 2.42%a �1.07%a
Median 1.77%a 2.56%a 1.65%a �0.91%a
N 3,935 540 3,395 —
PSOUGHTMean 6.52%a 5.88%a 6.62%a 0.74%a
Median 5.00%a 4.60%a 5.00%a 0.40%a
N 3,935 540 3,395 —
Panel B: First-Time Announcements
CARMean 3.13%a 4.03%a 2.94%a �1.09%b
Median 2.19%a 3.09%a 1.89%a �1.20%a
N 2,331 416 1,915 —
PSOUGHTMean 6.70%a 5.87%a 6.88%a 1.01%a
Median 5.00%a 4.60%a 5.00%a 0.40%a
N 2,331 416 1,915 —
a,b Significantly different from zero at the one percent and five percent levels, respectively.
1674 The Journal of Finance
~PSOUGHT! increased slightly after the Tax Reform Act of 1986, we cannotattribute the decline in the average market reaction after the tax reform todifferences in the magnitude of the programs.
Since many repurchase programs that were authorized after the TRA of1986 were announced by firms with previous announcements, we could ar-gue that the decline in the average market reaction after 1986 is related tothe fact that share repurchase programs became more predictable. To inves-tigate this possibility, Panel B of Table IX reports the market reaction foronly first-time announcements. We define a first-time announcement as thefirst announcement made by a particular firm over the period 1980 to 1997.Consistent with our previous findings, the average ~median! market reac-tion declined after the TRA of 1986, from 4.03 percent ~3.09 percent! to 2.94percent ~1.89 percent!.
To control for other factors that might affect the market reaction aroundshare repurchase programs, we estimate the following cross-sectionalregression:
CARit � b0 � b1TAXt � b2 Log~PSOUGHTit !� b3 SIZEit � b4DYIELDit � eit .
~3!
where CAR is the three-day cumulative abnormal return around the an-nouncement of the open market share repurchase program, TAXt is the taxdifferential between the top marginal tax rate on ordinary income and thetop marginal tax rate on capital gains, Log~PSOUGHT! is the logarithm ofthe amount of shares authorized for repurchase scaled by the number ofshares outstanding at the time of the announcement, SIZE is the logarithmof the book value of the total assets at the time of the announcement of therepurchase program, and DYIELD is the dividend yield at the time of theannouncement of the repurchase program.
Table X presents the estimated coefficients from this cross-sectional re-gression. It shows that the differential tax variable is positively related tothe market reaction surrounding open market share repurchase programs~and significant at the five percent level!. We obtain similar results when weinclude only first-time announcers in the sample ~last column of the table!.Not surprisingly, the regression also indicates that the market reaction isinversely related to the market value of equity ~i.e., larger firms experiencea small market reaction to announced repurchases!, and it is positively re-lated to the amount of the announced repurchase.9
9 We also estimate a regression in which, for each year, the ordinary income and the capitalgains income tax rates are two separate variables. We find that only the coefficient of theordinary income tax rate is positive and significant, indicating that the source of tax savingscomes from the variation in the ordinary income tax rate.
Dividends, Share Repurchases, and the Substitution Hypothesis 1675
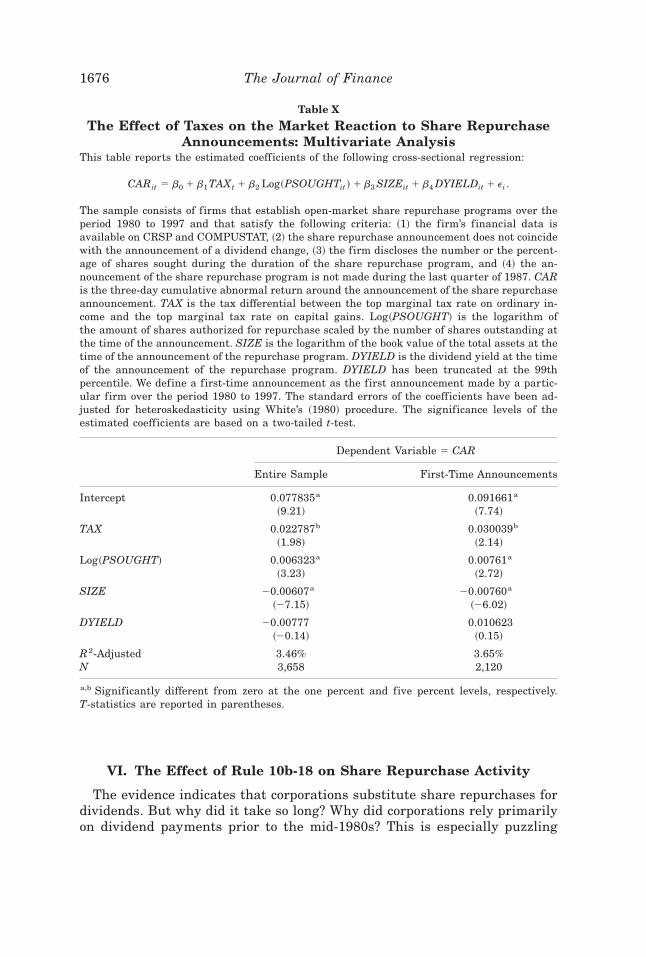
VI. The Effect of Rule 10b-18 on Share Repurchase Activity
The evidence indicates that corporations substitute share repurchases fordividends. But why did it take so long? Why did corporations rely primarilyon dividend payments prior to the mid-1980s? This is especially puzzling
Table X
The Effect of Taxes on the Market Reaction to Share RepurchaseAnnouncements: Multivariate Analysis
This table reports the estimated coefficients of the following cross-sectional regression:
CARit � b0 � b1TAXt � b2 Log~PSOUGHTit !� b3 SIZEit � b4 DYIELDit � ei .
The sample consists of firms that establish open-market share repurchase programs over theperiod 1980 to 1997 and that satisfy the following criteria: ~1! the firm’s financial data isavailable on CRSP and COMPUSTAT, ~2! the share repurchase announcement does not coincidewith the announcement of a dividend change, ~3! the firm discloses the number or the percent-age of shares sought during the duration of the share repurchase program, and ~4! the an-nouncement of the share repurchase program is not made during the last quarter of 1987. CARis the three-day cumulative abnormal return around the announcement of the share repurchaseannouncement. TAX is the tax differential between the top marginal tax rate on ordinary in-come and the top marginal tax rate on capital gains. Log~PSOUGHT! is the logarithm ofthe amount of shares authorized for repurchase scaled by the number of shares outstanding atthe time of the announcement. SIZE is the logarithm of the book value of the total assets at thetime of the announcement of the repurchase program. DYIELD is the dividend yield at the timeof the announcement of the repurchase program. DYIELD has been truncated at the 99thpercentile. We define a first-time announcement as the first announcement made by a partic-ular firm over the period 1980 to 1997. The standard errors of the coefficients have been ad-justed for heteroskedasticity using White’s ~1980! procedure. The significance levels of theestimated coefficients are based on a two-tailed t-test.
Dependent Variable � CAR
Entire Sample First-Time Announcements
Intercept 0.077835a 0.091661a
~9.21! ~7.74!
TAX 0.022787b 0.030039b
~1.98! ~2.14!
Log~PSOUGHT! 0.006323a 0.00761a
~3.23! ~2.72!
SIZE �0.00607a �0.00760a
~�7.15! ~�6.02!
DYIELD �0.00777 0.010623~�0.14! ~0.15!
R2-Adjusted 3.46% 3.65%N 3,658 2,120
a,b Significantly different from zero at the one percent and five percent levels, respectively.T-statistics are reported in parentheses.
1676 The Journal of Finance
given the heavier tax burden on dividends relative to capital gains. It ispossible that dividends have historically been the predominant form of cashdistribution, because, due to the potential risk of violating the antimanipu-lative provisions of the Securities Exchange Act of 1934, corporations werereluctant to repurchase shares on the open market
In some countries, such as Austria, Norway, and Israel, open-market sharerepurchases are prohibited and are considered price manipulation. Althoughshare repurchase programs have never been explicitly prohibited in the UnitedStates, there is reason to believe that regulatory agencies have been con-cerned with the potential impact of these programs on stock prices. Thisconcern is ref lected in the following statement made by a Senate Committeein 1967:
Corporate repurchases of their own securities may serve a number oflegitimate purposes. For example, they may result from a desire to re-duce outstanding capital stock following the cash sale of operating divi-sions or subsidiaries, or to have shares available for options, acquisitions,employee or stock purchase plans, and the like, without increasing thetotal number of shares outstanding. Repurchase programs, however, mayalso be utilized by management to preserve or strengthen their controlby counteracting tender offers or other attempted takeovers, or may bemade in order to increase the market price of the company’s shares.Whatever the motive behind the repurchase program, if the repurchasesare substantial they will have a significant impact on the market. ~Sen-ate Report No. 550, 90th Congress; 1967!.
Indeed, for decades, the SEC has occasionally charged companies withillegally manipulating their stock prices during share repurchase pro-grams.10 Due to the unique nature of stock buybacks, the SEC has beenconcerned that repurchasing firms might be engaging in certain types ofactivities that might disrupt the natural order of financial markets. Butuntil 1982, there were no explicit rules directly regulating share repurchaseactivity in the United States. This situation exposed repurchasing firms tothe risk of triggering a SEC investigation and being charged with illegalmarket manipulation. Since the direct and indirect costs of a regulatory in-quiry can be very large ~see Feroz, Park, and Pastena ~1991!, Karpoff andLott ~1993!, Nourayi ~1994!, and Beatty, Bunsis, and Hand ~1998!!, it seemsthat firms were indeed deterred from repurchasing shares.11
10 See, for example, Genesco, Inc., ~1964–66 Transfer Binder! Fed. Sec. L. Rep. ~CCH! ¶77,354~May 10, 1966!; SEC v. Georgia-Pacific Corporation, ~1964–66 Transfer Binder! Fed. Sec. L.Rep. ~CCH! ¶91,680, ~S.D.N.Y. 1960! ~complaint!; and Atlantic Research Corp., Sec. Exch. ActRelease No. 4657 ~December 6, 1963!, ~1961–64 Transfer Binder! Fed. Sec. L. Rep. ~CCH! ¶76,949.
11 Since the antimanipulative provisions of the SEA of 1934 apply to all participants involvedin an illegal manipulation scheme, this situation may have also deterred brokers and special-ists from participating in share repurchase programs as well.
Dividends, Share Repurchases, and the Substitution Hypothesis 1677

Aware of this problem, the SEC started to design guidelines for corpora-tions on how to carry out share repurchase programs without raising sus-picions of manipulative behavior. In 1967, the SEC proposed Rule 10b-10,which, if it had been approved, would have required repurchasing firms todisclose information and to comply with certain mandatory rules on the price,time, volume, and manner of share repurchases.12 In 1970, the SEC pro-posed Rule 13e-2, which in essence was very similar to Rule 10b-10.13 Otherversions of Rule 13e-2 were proposed in 1973 and 1980.14 However, the SECdid not adopt any of these rules.
As part of the deregulation wave of the early 1980s, the SEC finally ap-proved legislation to regulate open-market share repurchases. In 1982, theSEC adopted Rule 10b-18, which provides a safe harbor for repurchasingfirms against the antimanipulative provisions of the Securities ExchangeAct ~SEA! of 1934.15 Rule 10b-18 was adopted to establish guidelines forrepurchasing shares on the open market without violating Sections 9 ~a! ~2!or 10 ~b! of the SEA of 1934.16 In general, Rule 10b-18 requires that firmsrepurchasing shares on the open market should only use one broker or dealeron any single day, avoid trading on an uptick or during opening or the lasthalf-hour before the closing of the market, and limit the daily volume ofpurchases to a specified amount.
After the adoption of Rule 10b-18 in 1982, the chairman of the SEC at thattime, John Shad, expressed that “without the change, companies are inhib-ited from making big open-market buys” ~Wall Street Journal ~1982, p. 2!!.Apparently, the adoption of this rule represented a major change in the SEC’sregulatory policy. John Evans, a SEC commissioner at that time, said “thisis much-reduced regulation from what we had before” ~Wall Street Journal~1982, p. 2!!, suggesting that share repurchases were heavily regulated be-fore the adoption of Rule 10b-18.
Thus if managers were reluctant to repurchase shares because of the po-tential risk of being charged with illegal market manipulation, then sharerepurchase activity should have increased significantly after the adoption ofRule 10b-18 in 1982.
12 See Pub. L. No. 90-439, 82 Stat. 454 ~July 29, 1968!.13 SEC Release No. 34-8930 ~July 13, 1970!, 35 Fed. Reg. 11410 ~1970!.14 SEC Release No. 34-10539 ~December 6, 1973!, 38 Fed. Reg. 34341 ~1973!; SEC Release
No. 34-17222 ~October 17, 1980! 45 Fed. Reg. 70890 ~1980!.15 47 Fed. Reg. 53333 ~November 26, 1982!.16 Section 9 ~a! ~2! establishes that it will be illegal “to effect, alone or with one or more other
persons, a series of transactions in any security registered on a national securities exchangecreating actual or apparent active trading in such security, or raising or depressing the price ofsuch security, for the purpose of inducing the purchase or sale of such securities by others.”Similarly, Section 10 ~b! establishes that it will be unlawful “to use or employ, in connectionwith the purchase or sale of any security registered on a national securities exchange or anysecurity not so registered, any manipulative or deceptive or contrivance in contravention ofsuch rules and regulations as the Commission may prescribe as necessary or appropriate in thepublic interest or for the protection of investors.”
1678 The Journal of Finance
Is there an alternative explanation? Bagwell and Shoven ~1989, p. 135!offer the following explanation: “There are some aspects of share acquisitionwhich are learned only by experience. For repurchases there has been learn-ing through time. . . .” Grinblatt and Titman ~1998, p. 529! state: “While wecan only speculate on why U.S. firms paid out so much in tax-disadvantagedividends at that time, our best guess is that the decisions of financial man-agers at that time were simply wrong.” However, these alternative explana-tions do not make any predictions concerning when the change in payoutpolicy should have come.
To conduct empirical tests, we divide the sample into the pre-Rule 10b-18period ~1972 to 1982! and the post-Rule 10-b18 period ~1983 to 2000!. Sincethe variances of the different measures of share repurchase activity do notappear to be constant through time, we test the null hypothesis that sharerepurchase activity is similar over these two subperiods by using the Waldstatistic:
W � ~mI � mII !20~sI
2 � sII2 !, ~4!
where mI ~mII ! is the mean value of the variable of interest over the period1972 to 1983 ~1984 to 2000! and sI
2 ~sII2 ! is the sample variance of mI ~mII !.
Since the sample size is relatively small, we use the bounds test proposed byOhtani and Kobayashi ~1986! to determine the significance levels of the Waldstatistics.
Consistent with the idea that share repurchase activity was constrainedbefore the adoption of Rule 10b-18, Table XI shows that all the changes inthe measures of share repurchase activity are positive and statistically sig-nificant. Before the adoption of Rule 10b-18 ~prerule period!, the averageannual expenditure on share repurchase programs ~adjusted for inf lation!was only $5.5 billion. In contrast, after the adoption of Rule 10b-18 ~postruleperiod!, the average annual expenditure on share repurchase programs was$62 billion. This change represents an increase of almost 1,000 percent inthe average annual expenditure. Other measures of share repurchase activ-ity experienced similar increases. In general, the evidence presented in Table XIsuggests that share repurchase activity drastically increased after the adop-tion of Rule 10b-18.
However, these differences may be due to some other factors such as stockmarket activity, tax changes, or learning by the market. To control for theeffect of taxes, we use the tax differential between the top marginal tax rateon ordinary income and the top marginal tax rate on capital gains ~TAX!. Ifmanagers are trying to minimize dividend taxation by buying back shares,then this variable should have a positive coefficient. Finding that the taxbenefit of capital gains has had a positive effect on share repurchase activitywould reinforce the idea that managers were deterred from repurchasingshares in the past because the tax benefit of capital gains was much largerbefore the adoption of Rule 10b-18. To control for the effect of the stock
Dividends, Share Repurchases, and the Substitution Hypothesis 1679
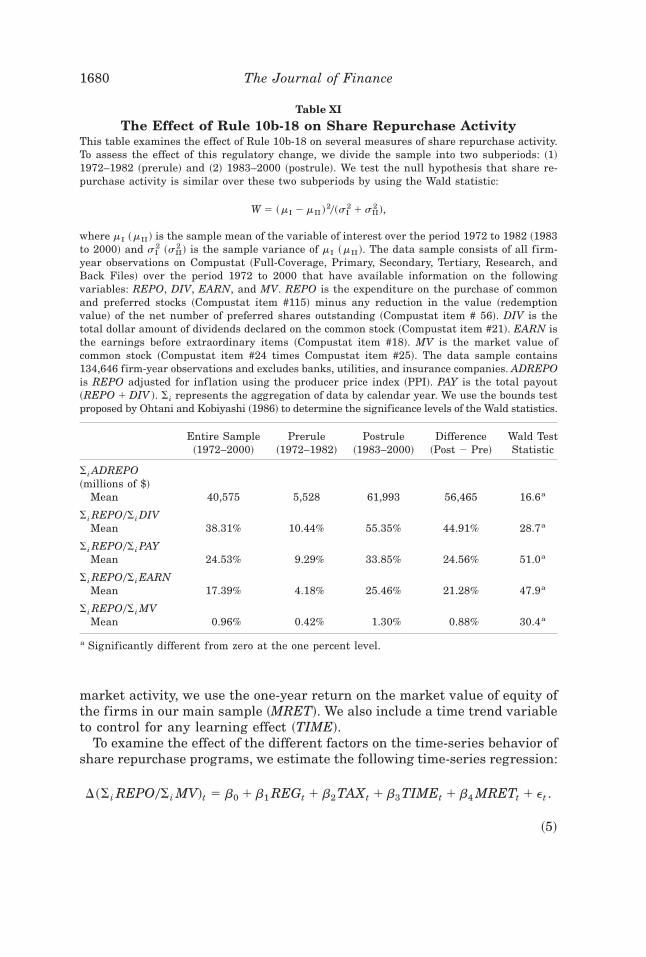
market activity, we use the one-year return on the market value of equity ofthe firms in our main sample ~MRET!. We also include a time trend variableto control for any learning effect ~TIME!.
To examine the effect of the different factors on the time-series behavior ofshare repurchase programs, we estimate the following time-series regression:
�~�i REPO0�i MV!t � b0 � b1 REGt � b2TAXt � b3TIMEt � b4 MRETt � et .
~5!
Table XI
The Effect of Rule 10b-18 on Share Repurchase ActivityThis table examines the effect of Rule 10b-18 on several measures of share repurchase activity.To assess the effect of this regulatory change, we divide the sample into two subperiods: ~1!1972–1982 ~prerule! and ~2! 1983–2000 ~postrule!. We test the null hypothesis that share re-purchase activity is similar over these two subperiods by using the Wald statistic:
W � ~mI � mII !20~sI
2 � sII2 !,
where mI ~mII ! is the sample mean of the variable of interest over the period 1972 to 1982 ~1983to 2000! and sI
2 ~sII2 ! is the sample variance of mI ~mII !. The data sample consists of all firm-
year observations on Compustat ~Full-Coverage, Primary, Secondary, Tertiary, Research, andBack Files! over the period 1972 to 2000 that have available information on the followingvariables: REPO, DIV, EARN, and MV. REPO is the expenditure on the purchase of commonand preferred stocks ~Compustat item #115! minus any reduction in the value ~redemptionvalue! of the net number of preferred shares outstanding ~Compustat item # 56!. DIV is thetotal dollar amount of dividends declared on the common stock ~Compustat item #21!. EARN isthe earnings before extraordinary items ~Compustat item #18!. MV is the market value ofcommon stock ~Compustat item #24 times Compustat item #25!. The data sample contains134,646 firm-year observations and excludes banks, utilities, and insurance companies. ADREPOis REPO adjusted for inf lation using the producer price index ~PPI!. PAY is the total payout~REPO � DIV !. �i represents the aggregation of data by calendar year. We use the bounds testproposed by Ohtani and Kobiyashi ~1986! to determine the significance levels of the Wald statistics.
Entire Sample~1972–2000!
Prerule~1972–1982!
Postrule~1983–2000!
Difference~Post � Pre!
Wald TestStatistic
�i ADREPO~millions of $!
Mean 40,575 5,528 61,993 56,465 16.6a
�i REPO0�i DIVMean 38.31% 10.44% 55.35% 44.91% 28.7a
�i REPO0�i PAYMean 24.53% 9.29% 33.85% 24.56% 51.0a
�i REPO0�i EARNMean 17.39% 4.18% 25.46% 21.28% 47.9a
�i REPO0�i MVMean 0.96% 0.42% 1.30% 0.88% 30.4a
a Significantly different from zero at the one percent level.
1680 The Journal of Finance
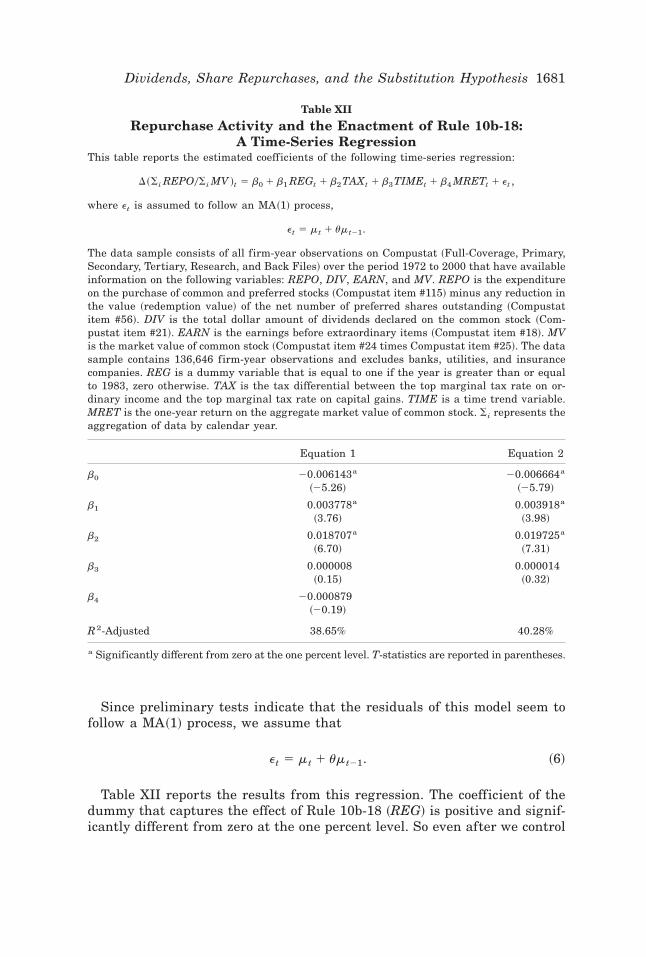
Since preliminary tests indicate that the residuals of this model seem tofollow a MA~1! process, we assume that
et � mt � umt�1. ~6!
Table XII reports the results from this regression. The coefficient of thedummy that captures the effect of Rule 10b-18 ~REG! is positive and signif-icantly different from zero at the one percent level. So even after we control
Table XII
Repurchase Activity and the Enactment of Rule 10b-18:A Time-Series Regression
This table reports the estimated coefficients of the following time-series regression:
�~�i REPO0�i MV !t � b0 � b1 REGt � b2TAXt � b3TIMEt � b4 MRETt � et ,
where et is assumed to follow an MA~1! process,
et � mt � umt�1.
The data sample consists of all firm-year observations on Compustat ~Full-Coverage, Primary,Secondary, Tertiary, Research, and Back Files! over the period 1972 to 2000 that have availableinformation on the following variables: REPO, DIV, EARN, and MV. REPO is the expenditureon the purchase of common and preferred stocks ~Compustat item #115! minus any reduction inthe value ~redemption value! of the net number of preferred shares outstanding ~Compustatitem #56!. DIV is the total dollar amount of dividends declared on the common stock ~Com-pustat item #21!. EARN is the earnings before extraordinary items ~Compustat item #18!. MVis the market value of common stock ~Compustat item #24 times Compustat item #25!. The datasample contains 136,646 firm-year observations and excludes banks, utilities, and insurancecompanies. REG is a dummy variable that is equal to one if the year is greater than or equalto 1983, zero otherwise. TAX is the tax differential between the top marginal tax rate on or-dinary income and the top marginal tax rate on capital gains. TIME is a time trend variable.MRET is the one-year return on the aggregate market value of common stock. �i represents theaggregation of data by calendar year.
Equation 1 Equation 2
b0 �0.006143a �0.006664a
~�5.26! ~�5.79!
b1 0.003778a 0.003918a
~3.76! ~3.98!
b2 0.018707a 0.019725a
~6.70! ~7.31!
b3 0.000008 0.000014~0.15! ~0.32!
b4 �0.000879~�0.19!
R2-Adjusted 38.65% 40.28%
a Significantly different from zero at the one percent level. T-statistics are reported in parentheses.
Dividends, Share Repurchases, and the Substitution Hypothesis 1681
for other factors, the effect of Rule 10b-18 on share repurchase activity ap-pears to be highly significant. Moreover, we note that the coefficient of thetax differential, TAX, is positive and statistically significant, which indi-cates that share repurchase activity is positively correlated with the relativetax benefit of capital gains ~after controlling for the change in regulation!.This result suggests that taxes are a significant determinant of share re-purchase activity. This evidence is consistent with the recent findings in Lieand Lie ~1999! and Sarig ~2000!, which indicate that the propensity to re-purchase shares increases with the relative tax benefit of capital gains.
Overall, the evidence in this section suggests that the adoption of Rule10b-18 had a positive and significant impact on share repurchase activity. Itseems that corporations were deterred from repurchasing shares before theadoption of Rule 10b-18. However, with the adoption of this safe-harbor ruleand thus no longer being threatened with being charged with stock manip-ulation, corporations have begun substituting repurchases for dividends.
VII. Conclusion
In a recent survey conducted by CFO Forum in 1997 ~a sample of 1,600chief financial officers!, among the CFOs who responded that they will payout cash to their shareholders, 5.5 percent of the CFOs said that they willraise dividends and 95.5 percent of the CFOs said they will buy back shares~Institutional Investor ~1997, p. 31!!. Comments such as those of Glenn Dav-enport, President and CEO of Marrison Health ~in 1998! are also consistentwith this view: “In our opinion, the reduction in long-term capital gains taxrate makes it more efficient to return capital to our shareowner through astock repurchase program instead of dividends.”
The main contribution of our paper is that it provides evidence that indeedcorporations have been substituting share repurchases for dividends. We showthat the majority of firms that initiate cash payments do so through sharerepurchases and that many firms that have been paying dividends have alsostarted to repurchase shares as well. The propensity of firms to initiate adividend payment in the 1990s is by order of magnitudes smaller than itwas in the 1970s. Established corporations distribute more of their cashf lows through repurchases and less through dividends.
Using Lintner ’s ~1956! dividend model to generate expected future divi-dend payments, we find that dividend forecast errors are negatively corre-lated with share repurchase activity. This result implies that the differencebetween actual and expected dividend payments tends to become more neg-ative as the firm spends more money on share repurchases. This evidencesupports the idea that share repurchases and dividends are substitutes.
We also show that when firms are engaged in repurchase programs, themarket reaction to dividend decreases is not significantly different from zero.Firms that cut their dividends and do not repurchase experience a signifi-cantly negative price drop to the announced dividend cut. When investorsperceive that dividends are being replaced by repurchases, they view the
1682 The Journal of Finance

reduction in dividends as less negative. We also show that differential taxesbetween dividends and capital gains seem to matter in that the market re-action to repurchases is more positive when the tax gains from repurchasesrelative to dividends are larger.
So if taxes seem to matter and corporations have been repurchasing moreand more since the mid-1980s, why did corporations not repurchase moreintensively in the past? One alternative is that it simply took a long time forcorporations to learn that paying out cash through repurchases would notresult in the IRS taxing repurchases at the ordinary income tax rates ~likedividends!, nor would it bring manipulation charges by the SEC. This iscertainly possible, but we argue in this paper that at the minimum, thisprocess was enhanced by the introduction of Rule 10b-18. This rule providesa safe harbor for repurchasing firms and makes the danger of being chargedwith manipulation much less severe. Empirically, we find that share repur-chase activity experienced an upward structural shift after the adoption ofRule 10b-18, consistent with the idea that share repurchases were morerestricted in the past.
Finally, the combined trend of a decreasing reliance on dividend paymentand the increasing reliance on repurchases also implies that nowadays, amore appropriate tool of valuation is total payout rather than dividend pay-out. For example, some researchers argue that the historically low level ofdividend yield is another indication of stock market overvaluation. The evi-dence here indicates that if we examine the total payout yield, this conclu-sion may be premature.
REFERENCES
Allen, Franklin, Antonio Bernardo, and Ivo Welch, 2000, A theory of dividends based on taxclientele, Journal of Finance 55, 2499–2536.
Allen, Franklin, and Roni Michaely, 2002, Payout policy, in George Constantinides, Milton Har-ris, and Rene Stulz, eds.: North-Holland Handbooks of Economics ~Elsevier, Amsterdam,The Netherlands!, forthcoming.
Asquith, Paul, and David W. Mullins, Jr., 1983, The impact of initiating dividend payments onshareholders’ wealth, Journal of Business 56, 77–96.
Bagwell, Laurie Simon, and John Shoven, 1989, Cash distributions to shareholders, Journal ofEconomic Perspectives 3, 129–140.
Beatty, Randolph P., Howard Bunsis, and John R. M. Hand, 1998, The indirect economic pen-alties in SEC investigations of underwriters, Journal of Financial Economics 50, 151–186.
Bernheim, B. Doug, 1991, Tax policy and the dividend puzzle, RAND Journal of Economics 22,455–476.
Bhattacharya, Sudipto, 1979, Imperfect information, dividend policy, and “the bird in the hand”fallacy, Bell Journal of Economics 10, 259–270.
Brickley, James A., 1983, Shareholder wealth, information signaling and the specially desig-nated dividend: An empirical study, Journal of Financial Economics 12, 187–209.
DeAngelo, Harry, Linda DeAngelo, and Doug Skinner, 2000, Special dividends and the evolu-tion of dividend signaling, Journal of Financial Economics 57, 309–354.
“Discounting dividends,” Institutional Investor, August 1997, 31.Easterbrook, Frank, 1984, Two agency-cost explanations of dividends, American Economic Re-
view 74, 650–659.
Dividends, Share Repurchases, and the Substitution Hypothesis 1683
Fama, Eugene, 1974, The empirical relationships between the dividend and investment deci-sions of firms, American Economic Review 64, 304–318.
Fama, Eugene, and Kenneth French, 2001, Disappearing dividends: Changing firm character-istics or lower propensity to pay? Journal of Financial Economics 60, 3–43.
Fama, Eugene, and James Macbeth, 1973, Risk, return and equilibrium: Empirical tests, Jour-nal of Political Economy 81, 607–636.
Feroz, Ehsan H., Kyungjoo Park, and Victor S. Pastena, 1991, The financial and market effectsof the SEC’s accounting and auditing enforcement releases, Journal of Accounting Research29, 107–142.
Grinblatt, Mark, and Sheridan Titman, 1998, Financial Markets and Corporate Strategy ~Irwin0McGraw Hill, Boston, MA!.
Healy, Paul M., and Krishna Palepu, 1988, Earnings information conveyed by dividend initia-tions and omissions, Journal of Financial Economics 21, 149–175.
Hudson, Richard L., “SEC eases way for repurchases of firm’s stock,” Wall Street Journal, 10November 1982, 2.
Ikenberry, David, Josef Lakonishok, and Theo Vermaelen, 1995, Market underreaction to openmarket share repurchases, Journal of Financial Economics 39, 181–208.
Jagannathan, Murray, Clifford P. Stephens, and Michael S. Weisbach, 2000, Financial f lexibil-ity and the choice between dividends and stock repurchases, Journal of Financial Econom-ics 57, 355–384.
Jensen, Michael, 1986, Agency costs of free cash f low, corporate finance, and takeovers, Amer-ican Economic Review 76, 323–329.
John, Kose, and John Williams, 1985, Dividends, dilution, and taxes: A signaling equilibrium,Journal of Finance 40, 1053–1070.
Karpoff, John M., and John R. Lott, Jr., 1993, The reputational penalty firms bear from com-mitting criminal fraud, Journal of Law and Economics 36, 757–802.
Lie, Eric, and Heidi Lie, 1999, The role of personal taxes in corporate decisions: An empiricalanalysis of share repurchases and dividends, Journal of Financial and Quantitative Analy-sis 34, 533–552.
Lintner, John, 1956, Distribution of incomes of corporations among dividends, retained earn-ings, and taxes, American Economic Review 46, 97–113.
Michaely, Roni, Richard Thaler, and Kent Womack, 1995, Price reactions to dividend initiationsand omissions: Overreaction or drift? Journal of Finance 50, 573–608.
Miller, Merton, and Franco Modigliani, 1961, Dividend policy, growth, and the valuation ofshares, Journal of Business 34, 411–433.
Miller, Merton, and Kevin Rock, 1985, Dividend policy under asymmetric information, Journalof Finance 40, 1031–1051.
“Morrison Health Case Inc. reports strong third quarter results,” Business Wire, 26 March1998.
Nourayi, Mahmoud, 1994, Stock price responses to the SEC’s enforcement actions, Journal ofAccounting and Public Policy 13, 333–347.
Ohtani, Kazuhiro, and Masahito Kobayashi, 1986, A bounds test for equality between sets ofcoefficients in two linear regression models under heteroskedasticity, Econometric Theory2, 220–231.
Sarig, Oded, 2000, A longitudinal analysis of corporate payout policies, Working paper, Tel AvivUniversity and the Wharton School.
Stephens, Clifford, and Michael Weisbach, 1998, Actual share reacquisitions in open marketrepurchases programs, Journal of Finance 53, 313–333.
White, Hall, 1980, A heteroskedasticity-consistent covariance matrix estimator and a direct testfor heteroskedasticity, Econometrica 48, 817–838.
1684 The Journal of Finance