Embed Size (px)
Citation preview
Abschlussarbeit WS 2013/2014
Hochschule für Technik und Wirtschaft Aalen
Fakultät Wirtschaftswissenschaften
Studiengang Internationale Betriebswirtschaft
zur Erlangung des Bachelorgrades "Bachelor of Arts”
vorgelegt von Philip Hettich
Matrikelnummer 29583
Margaretenstrasse 6
70327 Stuttgart
Erstbetreuer: Professor Dr. Ingo Scheuermann
Zweitbetreuer: Professor Dr. Markus Peter
Ausgabedatum: 04. November 2013
Abgabetermin: 04. Mai 2014
Factors of Success for Share Repurchases
What factors have to be given to ensure that share
repurchases create long-term shareholder value?
A Critical View
!
! ! I!
1. ABSTRACT!
This paper deals with the question of which factors have to be given for
successful share repurchases that create long-term shareholder value. Center of
the thesis is the agency theory and its influence on share repurchases. Based on
theoretical findings success factors for share repurchases are derived and then
verified by case studies.
The main drivers for a successful share repurchase elaborated by this paper are a
suitable long-term executive compensation, an independent board of directors and
a shareholder structure without a majority shareholder. Additionally the findings
show that tying repurchases to certain share price thresholds improves the quality
of share repurchases.
Keywords: Share Repurchase, Undervaluation, Agency Theory
! ! II!
TABLE!OF!CONTENTS!1.! Abstract ......................................................................................................... I!2.! Index of Abbreviations ............................................................................... III!3.! Table of Figures ......................................................................................... IV!4.! Index of Tables ............................................................................................ V!5.! Introduction, Objective and Scope of the Paper ........................................... 1!
5.1.! Introduction ........................................................................................... 1!5.2.! Objective and Methodology .................................................................. 2!5.3.! Scope and Bonds ................................................................................... 3!
6.! Mechanics and Accounting of Share Repurchases ...................................... 4!6.1.! Mechanics of Share Repurchases .......................................................... 4!6.2.! Accounting for Share Repurchases ....................................................... 6!
7.! Share Repurchases versus Dividends ........................................................... 7!7.1.! The Dividend Substitution Hypothesis ................................................. 8!
7.1.1.! The Preferential Tax Hypothesis .................................................... 8!7.1.2.! The Cash-Flow Permanence Hypothesis ........................................ 9!
7.2.! Share Repurchases, Dividends and Employee Stock Options ............ 10!8.! Motivations For Share Repurchases ........................................................... 11!
8.1.! Optimization of Capital Structure ....................................................... 12!8.2.! Increasing Earnings per Share Hypothesis .......................................... 15!8.3.! Undervaluation Hypothesis / Signaling Theory .................................. 21!
9.! Agency Theory ........................................................................................... 25!9.1.! Corporate Governance ......................................................................... 29!9.2.! Agency Theory, Corporate Governance and Repurchases .................. 30!
10.!What Makes a Successful Share Repurchase? ........................................... 31!11.! Investigation Methodology ......................................................................... 33!12.! Case Studies ................................................................................................ 34!
12.1.! International Business Machines ....................................................... 34!12.2.! Weight Watchers International .......................................................... 41!12.3.! Berkshire Hathaway .......................................................................... 50!
13.! Results and Conclusions ............................................................................. 58!14.! Bibliography ............................................................................................... 60!15.!Word of Honor Statement in German ........................................................ 69!
! ! III!
2. INDEX!OF!ABBREVIATIONS!
BV – Book Value
BVPS – Book Value per Share
CEO – Chief Executive Officer
DCF – Discounted Cash Flow
EPS – Earnings per Share
ESO – Employee Stock Option
FY – Fiscal Year
IBM – International Business Machines
IFRS – International Financial Reporting Standards
Inc. – Incorporated
IPO – Initial Public Offering
IT – Information Technology
LBO – Leveraged Buyout
Liab. – Liabilities
PSU – Performance Stock Unit
P/E – Price to Earnings
ROA – Return on Assets
ROE – Return on Equity
SEC – Securities and Exchange Commission
Unch. – Unchanged
USD – U.S. Dollar
U.S. – United States
WACC – Weighted Average Cost of Capital
!!!!!!

! ! IV!
3. TABLE!OF!FIGURES!
Figure 1: Payout Instruments ................................................................................. 5
Figure 2: IBM Treasury Stock, Annual Report 2013 .............................................. 7!Figure 3: WACC and Debt/Equity Ratio .............................................................. 14!Figure 4: Agency Theory Illustration .................................................................... 27!Figure 5: Manager Self-Dealing ............................................................................ 28!Figure 6: IBM Shares Outstanding ........................................................................ 35!Figure 7: IBM vs. S&P500 5-Year ........................................................................ 36!Figure 8: IBM 2013 CEO Compensation Components ........................................ 37!Figure 9: IBM Cash Flow From Financing and Diluted EPS 10-Year ................. 38!Figure 10: IBM CAPEX and Long-Term Debt 10 Year ...................................... 39!Figure 11: IBM Revenue Quarter on Quarter ....................................................... 39!Figure 12: 2013 IBM CEO Compensation ............................................................ 40!Figure 13: Weight Watchers Board of Directors Artal Nominees ........................ 42!Figure 14: Weight Watchers Board of Directors and CEO Compensation ........... 42!Figure 15: Weight Watchers Board of Directors Composition ............................. 43!Figure 16: Weight Watchers Key Numbers 2009-2013 ........................................ 43!Figure 17: Weight Watchers Share Price 5 Year .................................................. 44!Figure 18: Weight Watchers Share Repurchase Conditions ................................. 44!Figure 19: Weight Watchers Cash and Equivalents .............................................. 46!Figure 20: Weight Watchers Cash Flow Statement .............................................. 46!Figure 21: Weight Watchers Debt Issuance and Share Repurchase ..................... 46!Figure 22: Weight Watchers Income Statement Q1 2012 ..................................... 47!Figure 23: Weight Watchers CEO-dealings .......................................................... 48!Figure 24: Weight Watchers Balance Sheet After the Buyback ........................... 49!Figure 25: Berkshire Hathaway, Mr. Buffett Personal Holdings .......................... 51!Figure 26: Berkshire Hathaway Board of Directors Composition ........................ 52!Figure 27: Berkshire Hathaway Price-to-Book Value .......................................... 53!Figure 28: Berkshire Hathaway Statements of Changes in Shareholders´ Equity 54!Figure 29: Berkshire Hathaway Repurchase Threshold ........................................ 55!!!!

! ! V!
4. INDEX!OF!TABLES!
Table 1: Model Company Balance Sheet Before Buyback ................................... 15!Table 2: Model Company Balance Sheet After Buyback ..................................... 15!Table 3: Model Company Income ......................................................................... 15!Table 4: Model Company Valuation ..................................................................... 16!Table 5: Model Company Share Price Development ............................................ 18!Table 6: Model Company Earnings Estimates ...................................................... 19!Table 7: Model Company Balance Sheet .............................................................. 22!Table 8: Model Company Income Statement and Intrinsic Value ........................ 22!Table 9: Model Company Buyback of Undervalued Shares ................................. 23!Table 10: Model Company Buyback of Overvalued Shares ................................. 24!Table 11: Berkshire Hathaway Intrinsic Value per Share ..................................... 57!
!
! 1!
5. INTRODUCTION,!OBJECTIVE!AND!SCOPE!OF!THE!PAPER!
5.1. INTRODUCTION!
At present interesting things can be witnessed at the United States´ (U.S.) stock
market. More and more low yielding cash is piling up on corporate balance
sheets1, which cannot be profitably reinvested into the companies´ operations2.
Especially, but not only, companies in the technology sector such as Apple and
Microsoft generate earnings at a much higher pace, than they are able to reinvest
in their businesses3. Apple as an example has accumulated USD 147 billion in
cash and equivalents (e.g. marketable securities) by the end of September 2013.
This amount may still increase going forward even though Apple is investing in
its business on a large scale through capital expenditure and strategic
acquisitions4.!
Since investors demand a return when providing capital to a company it is
understandable that they don´t like to see too much of low yielding cash sitting on
the balance sheet. Hence management and investors seek for possibilities to return
those funds to the company owners, so they can find better, higher yielding
investments for that cash. Companies listed on the stock market either choose to
return cash to shareholders by paying out dividends or repurchasing their own
stock5. This is why Apple, pushed by its investors, initiated a USD 100 billion
program to return excess funds to shareholders until the end of 2015 by share
repurchases and dividends6. Recently in April 2014 that program was accelerated
by the commitment to return an additional USD 30 billion to shareholders by
share repurchases to clear cash of the balance sheet. But not just Apple also many
other companies have these kinds of payout programs in place7.
Unlike with dividend payments where shareholders typically receive a cash
payment, the profit from share repurchases is an appreciating share price8.
!!!!!!!!!!!!!!!!!!!!!!!!!!!!!!!!!!!!!!!!!!!!!!!!!!!!!!!!1 Schoenenberger, C. R., The Wallstreet Journal., Companies Continue to Hoard Cash (2013). 2 Demos, T./ Russolillo, S./ Jarzemsky, M., The Wallstreet Journal., Firms Send Record Cash Back to Investors (2013). 3 Harjani, A., US Corporate Cash (2013). 4 Apple Inc., 10-K Annual Report 2013 (2013). 5 Lahart, J., The Wallstreet Journal., Record Cash Piles (2010). 6 Apple Inc., 10-K Annual Report 2013 (2013). 7 Apple Press Info: Apple Expands Capital Return Program to Over $130 Billion (2014). 8 Blieffert, C., Der Aktienrückkauf aus empirischer Sicht (2008). p. 4

!
! 2!
However there are plenty of negative examples where companies repurchased
shares and the stock price did not react at all or even continued to slide. Dell, the
producer of personal computers, is such an example. Dell´s share price saw a
decline ever since it announced the increase of its share repurchase program in
early 20059. Back then Dell´s share price stood at over USD 40. Lately in 2013
Dell was taken private for only $13.85 a share10. For shareholders and the
company itself this buyback didn’t create any value at all. In fact the funds that
were spent to acquire shares destroyed value since later those shares could have
been purchased for just a fraction of what has been paid for them in 2005.
In the year of 2013 shares valued at a total
of USD 475,6 billion have been repurchased
by the fortune 500 U.S. listed companies,
which makes share repurchases the largest
payout instrument, even superior to dividend
payments 11 . Reviewing those buyback
programs it became obvious that there are a
lot of companies that have successfully
increased shareholder value by repurchasing
their own shares and other companies that
have failed to do so. To figure out the
reasons for those different outcomes, it is
necessary to elaborate factors beneficial to
successful share repurchases by analyzing companies that repurchased shares in
the past.
5.2. OBJECTIVE!AND!METHODOLOGY!
This paper intends to provide an answer to the question of which factors have to
be given to exercise a successful share repurchase that creates long-term
shareholder value.
!!!!!!!!!!!!!!!!!!!!!!!!!!!!!!!!!!!!!!!!!!!!!!!!!!!!!!!!9 Dobbs, R./ Rehm, W., Mc Kinsey & Company Member Edition, The value of share buybacks (2005). 10 De la Merced, M. J./ Hardy, Q., The New York Times, Battle for Dell (2013). 11 Press Release: S&P 500 Stock Buybacks Up 19% in 2013 (2014).
Figure 1: Payout Instruments Comparison
!
! 3!
First the paper will give a descriptive explanation into the mechanics of share
repurchases, then motivations for buying back stock will be elaborated and
discussed. Hereby the focus will be put on the signaling and undervaluation
hypothesis. These hypotheses are closely linked to agency theory and corporate
governance, which connect executive compensation and monitoring with the share
repurchase decision.
Derived from the theoretical findings, factors for successful share buybacks will
be formulated. Case studies of companies that have been active acquirers of their
own shares will then be consulted to verify those success factors.
In a conclusion these factors of success will be summarized and will serve as
guidelines to judge on the eventual successfulness of future share repurchases
from a shareholder´s point of view.
5.3. SCOPE!AND!BONDS!
The success factors of share buybacks analyzed in this paper are only focusing on
the situation in the U.S. and on companies listed on U.S stock exchanges.
Theories and drawn conclusions might not be applicable to countries outside the
U.S., as legal frameworks for share repurchases may differ from country to
country.
Furthermore the success-factors are discussed based on a shareholder point of
view.
A successful buyback in this paper is defined as a buyback that creates long-term
value for shareholders through an appreciating share price, thus investigating
returns right after the announcement of share repurchases will not be subject to
the analysis. Long-term in that case depicts a timeframe exceeding at least five
years. Also share repurchases pursuing other goals like serving as an acquisition
currency or protecting the company from hostile takeovers will not be covered
within this paper.
!
! 4!
6. MECHANICS!AND!ACCOUNTING!OF!SHARE!REPURCHASES!
6.1. MECHANICS!OF!SHARE!REPURCHASES!
The following paragraph gives an explanation on how share buybacks of publicly
traded companies actually function. There are basically three major and different
ways for companies to repurchase their own shares, either through a repurchase
on the open market, a tender offer respective Dutch auction tender offer,12 or the
method of a negotiated repurchase.13
The Open Market Repurchase is the most common way companies use to
repurchase shares. Approximately 90% of all share buybacks at the U.S. stock
market account for open market repurchases. 14 Companies performing this
method are regularly acquiring their own shares on the stock market at current
market price. Normally the amount that will be spent on the buyback and the
period during which shares will be repurchased is communicated in advance. The
expiration date and the amount of the program can be freely chosen but have to be
disclosed according to the SEC.15 However, such a program is not binding.
Should market conditions change unfavorably it can be terminated at any time.
Furthermore this method typically proves to be less costly than tender offerings as
no premium to market price has to be granted to shareholders. However an open
market repurchase requires highly liquid markets. Otherwise a large buyback
would strongly drive up the share price and the cost of the buyback would be
unreasonably high, because the sudden high demand for shares meets the
persisting low supply.16
Over time other ways to buy back shares have established. The Fixed-Price
Tender Offer, unlike open market repurchases, does not buy the shares at market
price but offers all shareholders to sell their shares at a fixed price to the company.
This method is benefiting large buybacks intending to repurchase a lot of shares in
a very short period of time, as prices are not driven up through the unusual high
demand in the stock. The company determines a fixed price at which shares can
!!!!!!!!!!!!!!!!!!!!!!!!!!!!!!!!!!!!!!!!!!!!!!!!!!!!!!!!12 Copeland, T. E./ Weston, J. F./ Shastri, K., Finazierungstheorie und Unternehmenspolitik (2008). p. 849f 13 Vermaelen, T., Foundations and Trends in Finance, Share Repurchases (2005). p. 7 14 Blieffert, C., Der Aktienrückkauf aus empirischer Sicht (2008). p. 13 15 Skadden, Corporate Finance Alert, Share Repurchases (2013). 16 Blieffert, C., Der Aktienrückkauf aus empirischer Sicht (2008). p. 13ff
!
! 5!
be tendered, a target number of shares that are offered to shareholders and an
expiration date for the offer. All shareholders are free to accept or reject the
offer.17 Such an offer usually contains a premium to the present market price as an
incentive for shareholders to separate from their shares. The higher the premium
the more shareholders are likely to accept the offer and vice versa. This premium
is critical for the fulfillment of the Fixed-Price Tender Offer and should be set as
low as possible in order to lower the cost of the buyback for the company, but just
as high as necessary to buyback the intended amount of shares. In America from
1984 to 1989 that premium averaged 11,9% on the market price of shares.18
The Dutch Auction Tender Offer tries to avoid that specific problem of setting
the correct premium as it limits itself to communicate the volume of shares to be
bought back. Then the company announces a period for shareholders to submit a
price, which they would sell their shares to the company for. The lowest price
submitted that is able to fetch the entire targeted buyback volume is now offered
to shareholders. Basically the difficulty of evaluating the premium is shifted from
the company to the shareholder. Premiums paid in America from 1984 to 1989
using the Dutch Auction Tender Offer averaged 7,7% of the market price.19
Another way to repurchase shares is the Negotiated Repurchase, where the
company is directly in talks with a major shareholder. Both parties negotiate on a
fixed price to which shares are bought back. That price typically contains a
premium to the current market price of the stock, too. Other shareholders are
locked out of that transaction and cannot participate. In the US this is the less used
method of repurchasing stock and almost solely applied to defend a company
against takeover, which is not subject to this paper.20
After the shares are bought back, they are either used as an acquisition currency
(acquisitions of companies can not only be paid in cash but also by using own
stock of the same value), held back for later reissuance on the market at an
higher price, used for employee compensation or most of the time the shares are
being retired, which is also the only type discussed in this paper.21 Retiring
!!!!!!!!!!!!!!!!!!!!!!!!!!!!!!!!!!!!!!!!!!!!!!!!!!!!!!!!17 Vermaelen, T., Foundations and Trends in Finance, Share Repurchases (2005). p. 3-5 18 Blieffert, C., Der Aktienrückkauf aus empirischer Sicht (2008). pp. 16-17 19 Blieffert, C., Der Aktienrückkauf aus empirischer Sicht (2008). pp. 17-18 20 Blieffert, C., Der Aktienrückkauf aus empirischer Sicht (2008). pp. 18-19 21 Investopedia, What happens when a company buys back its shares? (2009).
!
! 6!
shares reduces the total number of shares outstanding, as they cease to exist any
longer. This leaves shareholders that did not sell their shares to the buyback
program with a bigger ownership stake in the company, as holding the same
number of shares now accounts for a larger percentage of the reduced overall
share-count.22
6.2. ACCOUNTING!FOR!SHARE!REPURCHASES!
To understand the impact of share repurchases on companies it is necessary to
cover the basic accounting of such. However this chapter only gives explanations
on how accounting for repurchases in combination with the cancellation
respectively retirement of shares works. There are various methods of accounting
for repurchases, nevertheless only the cost-method will be covered as it is most
straightforward and sufficient for the purposes of this paper. Furthermore, it is
assumed that acquired shares are cancelled and not reissued at a later date.
International Financial Reporting Standards (IFRS) require recording share
repurchases on the balance sheet. Companies mostly fund share repurchases using
cash. Consequently the cash-position on the balance sheet´s asset side is reduced
by the number of shares acquired times the price paid per acquired share. On the
equity and liability side the acquisition of own shares impacts the item “treasury
stock”. Treasury stock represents shares of the own company. It is non-voting
stock and is not eligible for dividend payments. Basically it can be treated as
unissued capital. As the name “cost method” suggests, treasury stock is accounted
for on cost basis. It can be viewed as a contra account to equity. Hence, when
shares are repurchased, treasury stock is debited with the amount of acquired
shares valued at cost (or number of shares repurchased times price paid per
acquired share). Share repurchases thus reduce a company´s equity base similar to
a reduction of shareholder capital.23
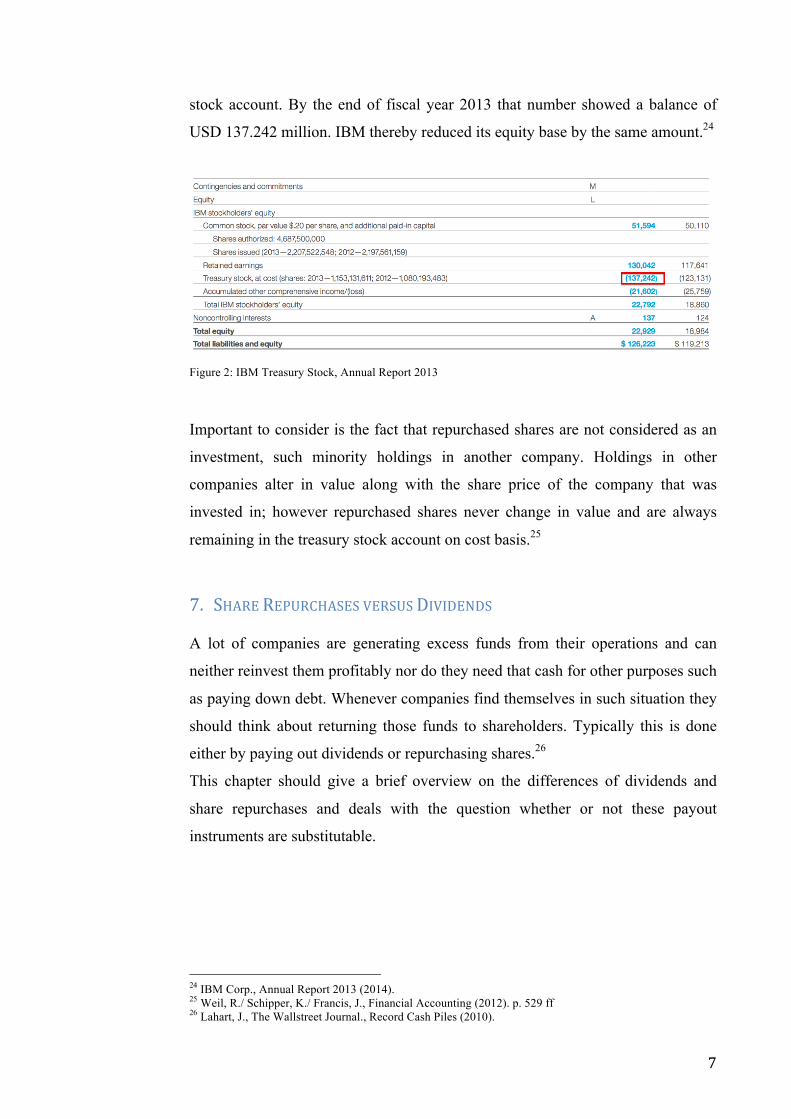
Figure 2 shows the liabilities and equity side of IBM´s 2013 balance sheet. IBM
has been buying back shares for years, which resulted in a very large treasury
!!!!!!!!!!!!!!!!!!!!!!!!!!!!!!!!!!!!!!!!!!!!!!!!!!!!!!!!22 Buffett, W. E., Letter to Shareholders 2012 (2013). 23Weil, R./ Schipper, K./ Francis, J., Financial Accounting (2012). p. 529 ff
!
! 7!
stock account. By the end of fiscal year 2013 that number showed a balance of
USD 137.242 million. IBM thereby reduced its equity base by the same amount.24
!Figure 2: IBM Treasury Stock, Annual Report 2013
Important to consider is the fact that repurchased shares are not considered as an
investment, such minority holdings in another company. Holdings in other
companies alter in value along with the share price of the company that was
invested in; however repurchased shares never change in value and are always
remaining in the treasury stock account on cost basis.25
7. SHARE!REPURCHASES!VERSUS!DIVIDENDS!
A lot of companies are generating excess funds from their operations and can
neither reinvest them profitably nor do they need that cash for other purposes such
as paying down debt. Whenever companies find themselves in such situation they
should think about returning those funds to shareholders. Typically this is done
either by paying out dividends or repurchasing shares.26
This chapter should give a brief overview on the differences of dividends and
share repurchases and deals with the question whether or not these payout
instruments are substitutable.
!
!!!!!!!!!!!!!!!!!!!!!!!!!!!!!!!!!!!!!!!!!!!!!!!!!!!!!!!!24 IBM Corp., Annual Report 2013 (2014). 25 Weil, R./ Schipper, K./ Francis, J., Financial Accounting (2012). p. 529 ff 26 Lahart, J., The Wallstreet Journal., Record Cash Piles (2010).
!
! 8!
7.1. THE!DIVIDEND!SUBSTITUTION!HYPOTHESIS!
As mentioned, companies distribute cash to shareholders by either paying
dividends or repurchasing stock. Historically there has been an affinity of U.S.
corporations towards paying dividends, because of the introduction of the
Securities and Exchange Act of 1934. This regulation strongly prohibited any
fraud in connection with buying and selling of securities. Therefore firms
hesitated to repurchase stock on the open market in fear of harsh punishments and
investigations because of market manipulation. Some 48 years later in 1982 the
SEC released a regulation that gave corporations the go-ahead to legally
repurchase shares.27 Therefore in the more recent years the trend to payout funds,
reversed in favor of share repurchases. From 1999 onwards more money has been
spent on buybacks than on dividends.28 The following gives an explanation on
why share buybacks might be the more attractive payout instrument. Modigliani
and Miller state in their dividend irrelevancy theory that dividends and buybacks
are perfectly substitutable when all investors behave rationally and a perfect
capital market is given. In a perfect capital market there is no information
asymmetry between the players in the market, there are no transactions costs such
as taxes when securities are bought and sold, and none of the market participants
is large enough to influence the price of securities with their transactions.29
7.1.1. THE!PREFERENTIAL!TAX!HYPOTHESIS!
Moving away from the perfect capital market and taking into account taxes, share
repurchases seem to be more attractive and not substitutable to dividends.
Dividends and share buybacks trigger different kinds of taxes. Dividends, in the
U.S., are taxed as income whereas the proceeds from share buybacks resulting
from an increasing share price are taxed at capital gains tax. In the past the capital
gains tax was significantly lower than the income tax, which induced corporations
to start choosing buybacks over dividends to lower tax payments for shareholders.
!!!!!!!!!!!!!!!!!!!!!!!!!!!!!!!!!!!!!!!!!!!!!!!!!!!!!!!!27 Voss, J., Major Themes in Economics, Why Repurchase Stock? (2012). 28 Grullon, G./ Michaely, R., Journal of Finance, Dividend Substitution Hypothesis (2002). 29 Miller, M. H./ Modigliani, F., Journal of Business, Dividend Policy (1961).

!
! 9!
30 This hypothesis is still valid in countries that tax dividends at a lower rate than
capital gains.31
Nowadays capital gains and dividends are taxed at the same rate. Sellers that have
held shares beyond a one-year period are subject to a 15%-20% capital gains tax,
when their marginal income tax rate is within the 25%-39,6% bracket 32 .
Dividends are taxed the same 15%-20% when the recipients find themselves in
the 25%-39,6% tax-bracket and are holder of the common stock for more than 60
days.33 However dividend payments trigger a tax event every time they are
distributed to the shareholders. Proceeds from share repurchases remain untaxed
until the shareholder decides to sell his holdings.
In case an investor is not seeking for income but decides to reinvest dividend
payments by buying more shares of the company, the investor would be better of
with repurchases as payout instrument. Each time the investor receives the
dividend he can reinvest 15%-20% less, because taxes have to be deducted.
Repurchases by contrast increase the share price but trigger no taxes.
For the reinvesting shareholder share repurchases are therefore preferable to
dividend payments based on a taxation point of view.34
7.1.2. THE!CASHCFLOW!PERMANENCE!HYPOTHESIS!
Surveys show that dividends are used to payout stable earnings, whereas share
buybacks are used to distribute extraordinary, less sustainable earnings. 35
Companies are reluctant to increase the dividend to an unsustainable level and
seek for other ways to distribute earnings in buying back shares, as it has been
discovered that share prices negatively react to dividend decreases. Whereas not
renewing or slowing down share repurchases is not perceived as badly by markets
since buybacks never include a commitment for future payouts. Furthermore
repurchasing fewer shares than intended or totally stop repurchasing can also
!!!!!!!!!!!!!!!!!!!!!!!!!!!!!!!!!!!!!!!!!!!!!!!!!!!!!!!!30 Amromin, G./ Harrison, P./ Liang, N. et al., Finance and Economics Discussion Series, Dividend Tax Cut (2005). 31 Grullon, G./ Michaely, R., Journal of Finance, Dividend Substitution Hypothesis (2002). 32 Wells Fargo, Tax Treatment of Dividend Income (2013). 33 Tax Foundation, Federal Capital Gains Tax Rates, 1988-2013 (2013). 34 Value-Aktien, Aktienrückkäufe aus Sicht der Aktionäre (2012). 35 Jagannathan, M./ Stephens, C. P./ Weisbach, M. S., Journal of Financial Economics, choice between dividends and stock repurchases (2000).
!
! 10!
indicate that other more profitable investments were found and thus prompt a
positive reaction.36
7.2. SHARE!REPURCHASES,!DIVIDENDS!AND!EMPLOYEE!STOCK!OPTIONS!
Apart from a beneficial taxation for the non-income seeking shareholder, share
repurchases are also preferable to dividends when employee stock options (ESO)
are granted to employees.
ESOs are a kind of equity compensation that companies give out to their
employees. Employees holding ESOs have the right to purchase stock of their
company at a determined price (strike price) and quantity. Usually ESOs are
equipped with a so-called vesting period during which the option holder is
restricted to exercise the ESOs. All this is settled in the option agreement. After
the expiration of the vesting period ESOs can be exercised, which means stock
can be acquired at strike price, and then be sold immediately at market price.
Consequently the greater the difference between strike- market price the more
valuable is the ESO and hence employee compensation.37 Employees are granted
stock options as a compensation for several reasons. Less well-capitalized
companies use stock options to be able to preserve funds that they otherwise
would have to spend when compensating in cash. Furthermore giving out ESOs to
employees aligns interests of shareholders and employees. Both parties now
benefit from an appreciating share price. In consequence employees are likely to
become more effective and productive which streamlines the business and puts
shareholder value in focus.38
Most of the time issued ESOs are not dividend protected, which means that
dividend payments to shareholders lead to a decrease in option value. Every time
a company pays a dividend, the share price decreases by the distributed amount.
After that markdown the stock trades ex-dividend. The value of ESOs is always
tied to the underlying; in that case the share price of the company that grants the
ESOs. A share price reduction caused by dividend payments thus reduces the
value of ESOs. Consequently ESOs of a company that does not pay a dividend are
more valuable than ESOs of an equal company that does. Share repurchases don’t !!!!!!!!!!!!!!!!!!!!!!!!!!!!!!!!!!!!!!!!!!!!!!!!!!!!!!!!36Voss, J., Major Themes in Economics, Why Repurchase Stock? (2012). 37 Summa, J., Employee Stock Options (2009). 38 Voss, J., Major Themes in Economics, Why Repurchase Stock? (2012).
!
! 11!
have that markdown disadvantage and hence are more beneficial to ESO
holders.39
Therefore to maximize personal net worth top-level executives holding significant
amounts of ESOs are incentivized to favor share repurchases over dividend
payments.40 A study by Christine Jolls supports that theory. The findings show
that at companies heavily relying on ESO based compensation more shares are
repurchased than at companies less reliant on that kind of employee
compensation.41
8. MOTIVATIONS!FOR!SHARE!REPURCHASES!
This chapter intends to outline the various reasons for corporation´s to repurchase
their shares. In 2005 Brav, Graham, Harvey and Michaely conducted a survey
where 384 financial executives were questioned and another 23 executives were
interviewed about their motives for share buybacks.
The most mentioned reason for repurchasing shares was an undervaluation of the
company at current share prices and the objective to inform shareholders about
that. Those two buyback reasons can be summarized and explained by the
Undervaluation Hypothesis or Signaling Theory. Coming in second was the
motivation to initiate a share repurchase program to increase earnings per share.
The matter behind that is covered in the Increasing Earnings per Share
Hypothesis. Another frequently named motivation for repurchasing stock was the
Optimization of the Capital Structure, without having to take on additional
debt.42
In the following chapter theories behind those motivations will be explained in
detail. However this paper does not cover share repurchases without the intention
of having a direct impact on shareholder value, such as defending the company
against a takeover, repurchasing shares that serve as an acquisition currency or
repurchasing shares that are held back for later reissuance.
!!!!!!!!!!!!!!!!!!!!!!!!!!!!!!!!!!!!!!!!!!!!!!!!!!!!!!!!39 Voss, J., Major Themes in Economics, Why Repurchase Stock? (2012). 40 Voss, J., Major Themes in Economics, Why Repurchase Stock? (2012). 41 Jolls, C., Stock Repurchases and Incentive Compensation (1998). 42 Brav, A./ Graham, J. R./ Harvey, C. R. et al., Tuck Contemporary Corporate Finance Issues III Conference Paper Payout policy in the 21st century (2005).
!
! 12!
8.1. OPTIMIZATION!OF!CAPITAL!STRUCTURE!
Share repurchases as stated above can be used as an instrument to optimize the
capital structure of a company without taking on additional debt. By that
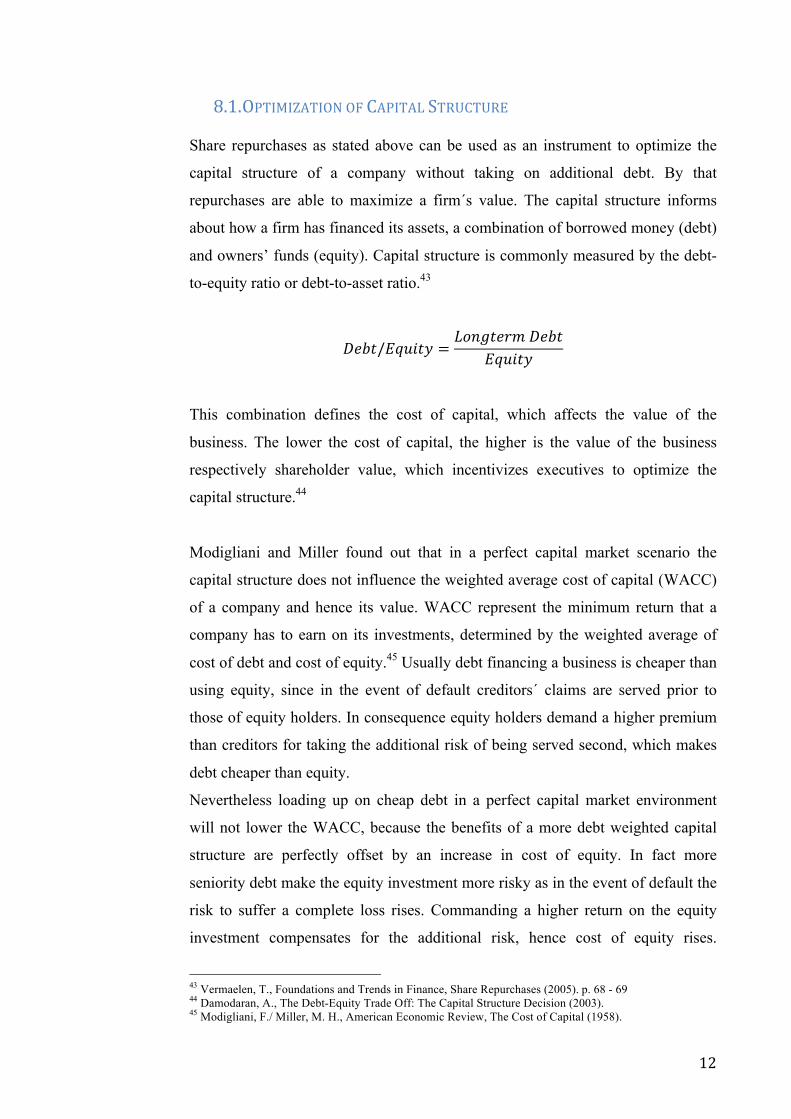
repurchases are able to maximize a firm´s value. The capital structure informs
about how a firm has financed its assets, a combination of borrowed money (debt)
and owners’ funds (equity). Capital structure is commonly measured by the debt-
to-equity ratio or debt-to-asset ratio.43
!"#$/!"#$%& = !"#$%&'(!!"#$!"#$%&
This combination defines the cost of capital, which affects the value of the
business. The lower the cost of capital, the higher is the value of the business
respectively shareholder value, which incentivizes executives to optimize the
capital structure.44
Modigliani and Miller found out that in a perfect capital market scenario the
capital structure does not influence the weighted average cost of capital (WACC)
of a company and hence its value. WACC represent the minimum return that a
company has to earn on its investments, determined by the weighted average of
cost of debt and cost of equity.45 Usually debt financing a business is cheaper than
using equity, since in the event of default creditors´ claims are served prior to
those of equity holders. In consequence equity holders demand a higher premium
than creditors for taking the additional risk of being served second, which makes
debt cheaper than equity.
Nevertheless loading up on cheap debt in a perfect capital market environment
will not lower the WACC, because the benefits of a more debt weighted capital
structure are perfectly offset by an increase in cost of equity. In fact more
seniority debt make the equity investment more risky as in the event of default the
risk to suffer a complete loss rises. Commanding a higher return on the equity
investment compensates for the additional risk, hence cost of equity rises.
!!!!!!!!!!!!!!!!!!!!!!!!!!!!!!!!!!!!!!!!!!!!!!!!!!!!!!!!43 Vermaelen, T., Foundations and Trends in Finance, Share Repurchases (2005). p. 68 - 69 44 Damodaran, A., The Debt-Equity Trade Off: The Capital Structure Decision (2003). 45 Modigliani, F./ Miller, M. H., American Economic Review, The Cost of Capital (1958).
!
! 13!
Therefore in a perfect capital market there is no valuation-benefit to be realized
from taking on debt. Thus companies would be indifferent choosing their capital
structure.46
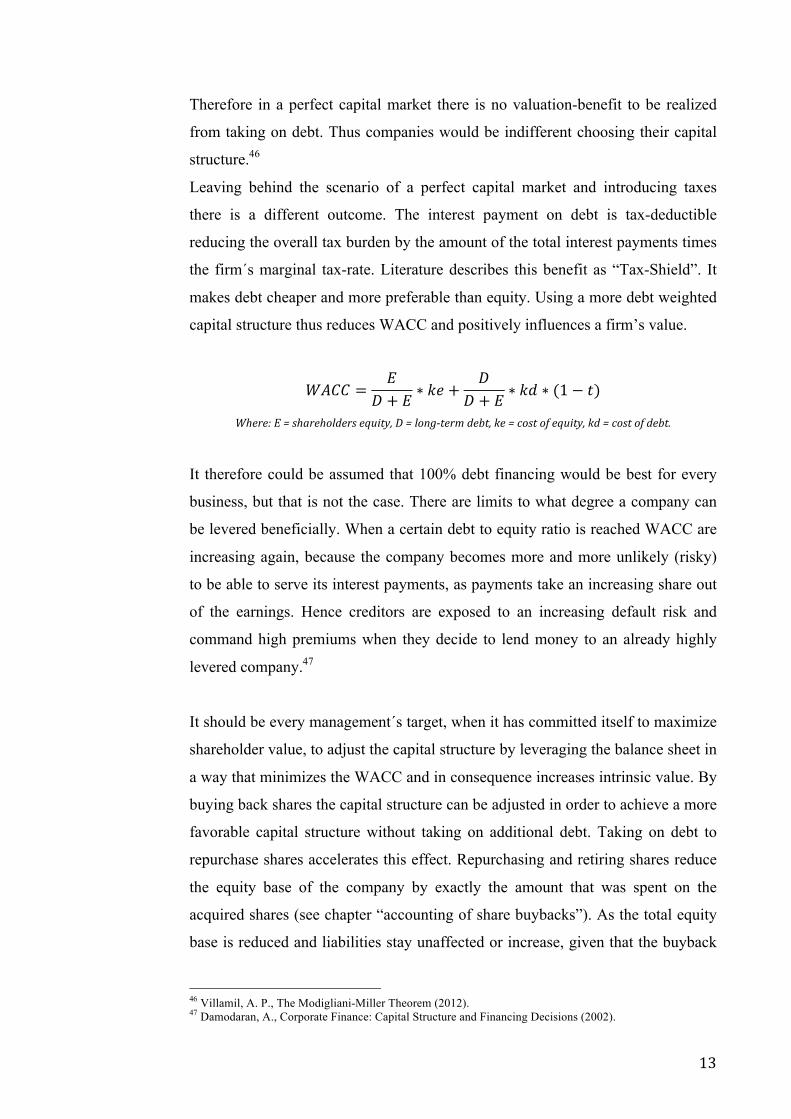
Leaving behind the scenario of a perfect capital market and introducing taxes
there is a different outcome. The interest payment on debt is tax-deductible
reducing the overall tax burden by the amount of the total interest payments times
the firm´s marginal tax-rate. Literature describes this benefit as “Tax-Shield”. It
makes debt cheaper and more preferable than equity. Using a more debt weighted
capital structure thus reduces WACC and positively influences a firm’s value.
!"## = !! + ! ∗ !" +
!! + ! ∗ !" ∗ (1− !)
Where:&E&=&shareholders&equity,&D&=&long7term&debt,&ke&=&cost&of&equity,&kd&=&cost&of&debt.&
It therefore could be assumed that 100% debt financing would be best for every
business, but that is not the case. There are limits to what degree a company can
be levered beneficially. When a certain debt to equity ratio is reached WACC are
increasing again, because the company becomes more and more unlikely (risky)
to be able to serve its interest payments, as payments take an increasing share out
of the earnings. Hence creditors are exposed to an increasing default risk and
command high premiums when they decide to lend money to an already highly
levered company.47
It should be every management´s target, when it has committed itself to maximize
shareholder value, to adjust the capital structure by leveraging the balance sheet in
a way that minimizes the WACC and in consequence increases intrinsic value. By
buying back shares the capital structure can be adjusted in order to achieve a more
favorable capital structure without taking on additional debt. Taking on debt to
repurchase shares accelerates this effect. Repurchasing and retiring shares reduce
the equity base of the company by exactly the amount that was spent on the
acquired shares (see chapter “accounting of share buybacks”). As the total equity
base is reduced and liabilities stay unaffected or increase, given that the buyback
!!!!!!!!!!!!!!!!!!!!!!!!!!!!!!!!!!!!!!!!!!!!!!!!!!!!!!!!46 Villamil, A. P., The Modigliani-Miller Theorem (2012). 47 Damodaran, A., Corporate Finance: Capital Structure and Financing Decisions (2002).
!
! 14!
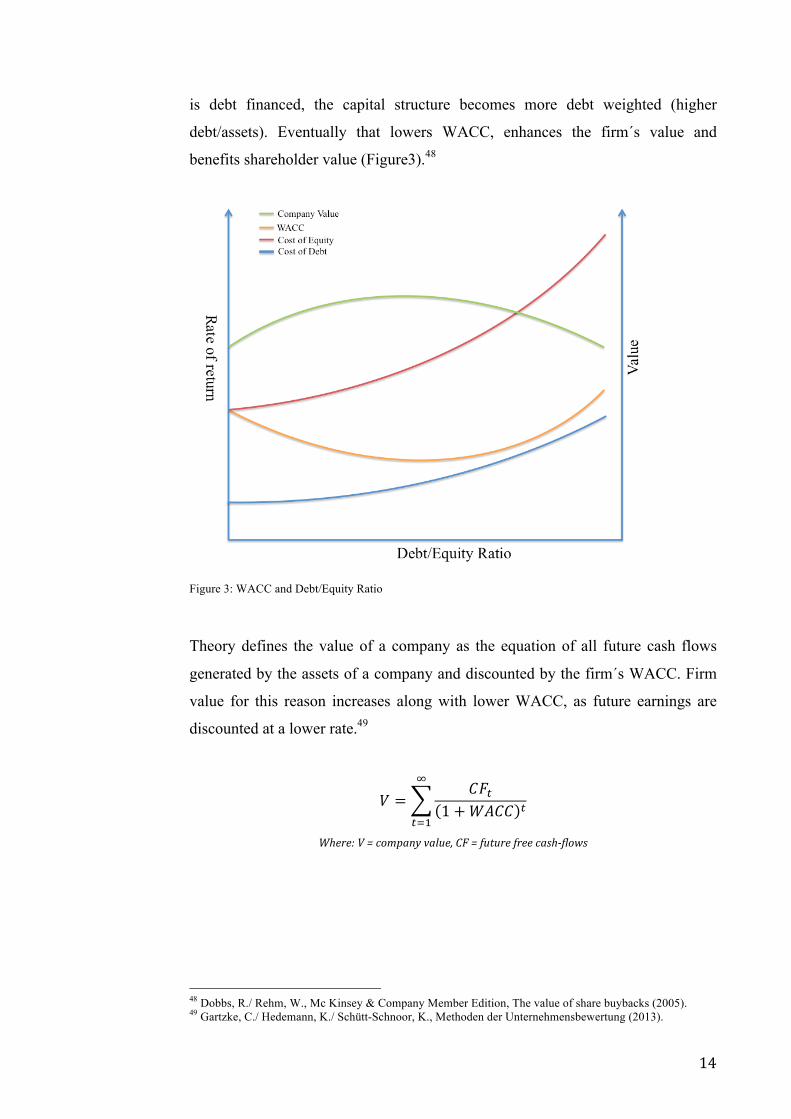
is debt financed, the capital structure becomes more debt weighted (higher
debt/assets). Eventually that lowers WACC, enhances the firm´s value and
benefits shareholder value (Figure3).48
Figure 3: WACC and Debt/Equity Ratio
Theory defines the value of a company as the equation of all future cash flows
generated by the assets of a company and discounted by the firm´s WACC. Firm
value for this reason increases along with lower WACC, as future earnings are
discounted at a lower rate.49
! = !!!1+!"## !
!
!!!
Where:&V&=&company&value,&CF&=&future&free&cash7flows&&
!!!!!!!!!!!!!!!!!!!!!!!!!!!!!!!!!!!!!!!!!!!!!!!!!!!!!!!!48 Dobbs, R./ Rehm, W., Mc Kinsey & Company Member Edition, The value of share buybacks (2005). 49 Gartzke, C./ Hedemann, K./ Schütt-Schnoor, K., Methoden der Unternehmensbewertung (2013).
!
! 15!
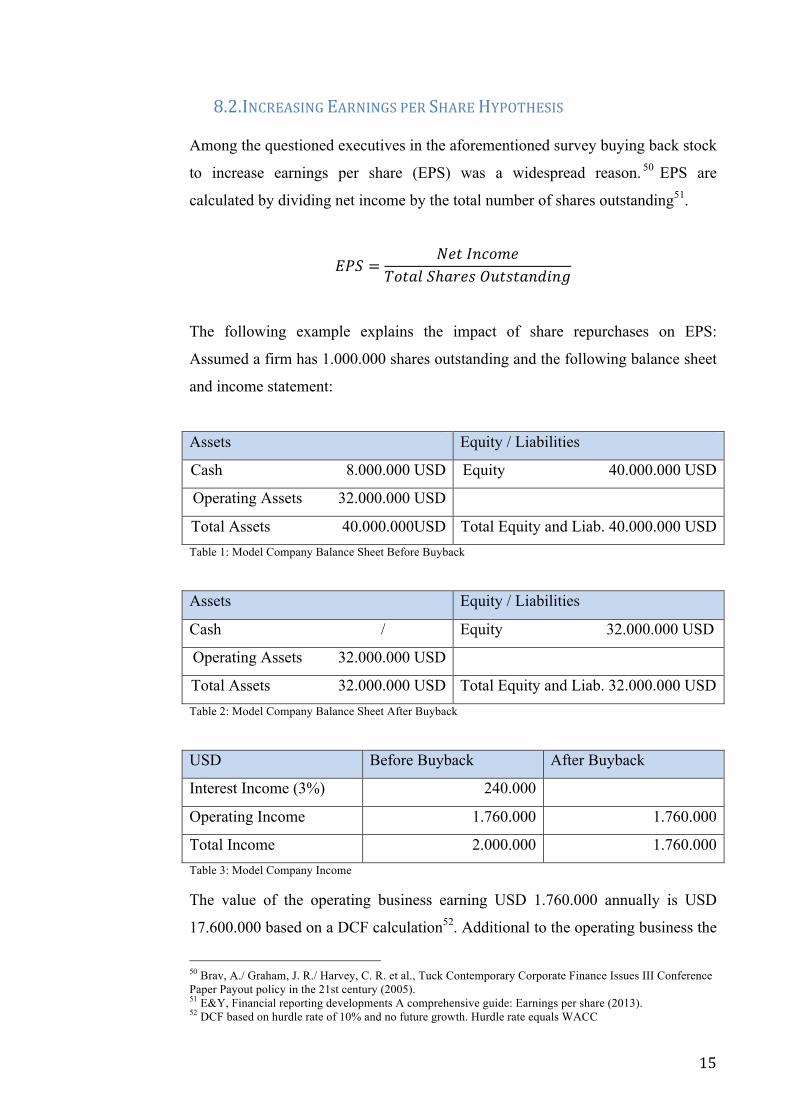
8.2. INCREASING!EARNINGS!PER!SHARE!HYPOTHESIS!
Among the questioned executives in the aforementioned survey buying back stock
to increase earnings per share (EPS) was a widespread reason. 50 EPS are
calculated by dividing net income by the total number of shares outstanding51.
!"# = !"#!!"#$%&!"#$%!!ℎ!"#$!!"#$#%&'(&)
The following example explains the impact of share repurchases on EPS:
Assumed a firm has 1.000.000 shares outstanding and the following balance sheet
and income statement:
Assets Equity / Liabilities
Cash 8.000.000 USD Equity 40.000.000 USD
Operating Assets 32.000.000 USD
Total Assets 40.000.000USD Total Equity and Liab. 40.000.000 USD Table 1: Model Company Balance Sheet Before Buyback
!Assets Equity / Liabilities
Cash / Equity 32.000.000 USD
Operating Assets 32.000.000 USD
Total Assets 32.000.000 USD Total Equity and Liab. 32.000.000 USD Table 2: Model Company Balance Sheet After Buyback
!USD Before Buyback After Buyback
Interest Income (3%) 240.000
Operating Income 1.760.000 1.760.000
Total Income 2.000.000 1.760.000 Table 3: Model Company Income
The value of the operating business earning USD 1.760.000 annually is USD
17.600.000 based on a DCF calculation52. Additional to the operating business the
!!!!!!!!!!!!!!!!!!!!!!!!!!!!!!!!!!!!!!!!!!!!!!!!!!!!!!!!50 Brav, A./ Graham, J. R./ Harvey, C. R. et al., Tuck Contemporary Corporate Finance Issues III Conference Paper Payout policy in the 21st century (2005). 51 E&Y, Financial reporting developments A comprehensive guide: Earnings per share (2013). 52 DCF based on hurdle rate of 10% and no future growth. Hurdle rate equals WACC

!
! 16!
firm holds USD 8.000.000 in cash, (earning USD 240.000 in interest income
annually) which equals a total intrinsic value of USD 25.600.000. Distributed on
1.000.000 shares equals a shares price of USD 25,6.
USD Before Buyback After Buyback
Value of Operations 17.600.000 17.600.000
Cash 8.000.000
Total Value of Equity 25.600.000 17.600.000 Table 4: Model Company Valuation
Using the above mentioned data (income before buyback USD 2.000.000 and
1.000.000 shares outstanding) EPS of USD 2 are calculated.
!"#$%"!!"#$%&':!!"# = 2.000.0001.000.000 = 2!
The firm now decides to use all of its cash to repurchase and retire shares, paying
USD 25,6 for each share, the firm is able to repurchase 312.500 shares. That
leaves the company with now 687.500 shares outstanding followed by a decrease
in income to USD 1.760.000 (Table 4). That is the case as the total amount of
USD 8.000.000 in cash on the balance sheet was used to buyback shares, and
therefore ceases to earn interest of USD 240.000 p.a. EPS after the buyback
consequently increase to USD 2,56.
!"#$%!!"#$%&':!!"# = 1.760.000687.500 = 2,56
Nevertheless the businesses intrinsic value (based on a DCF-calculation) does not
increase along with EPS. In fact income falls by USD 240.000 as the firm misses
out on interest payments and thus its intrinsic value is lowered.53 The increase in
EPS is only derived from a reduction of the equation´s denominator (shares
outstanding), which indicates the number of shares that total income is distributed
!!!!!!!!!!!!!!!!!!!!!!!!!!!!!!!!!!!!!!!!!!!!!!!!!!!!!!!!53 Dobbs, R./ Rehm, W., Mc Kinsey & Company Member Edition, The value of share buybacks (2005).

!
! 17!
on. That makes every share now accounting for a bigger part of net income and
the whole business as compared to before the buyback54.
An important ratio in conjunction with EPS is the price to earnings ratio (P/E),
which is often used by investors to compare valuations of companies of the same
industry. It also reveals future EPS growth expectations that investors have in the
stock. The higher the P/E the higher are expected future EPS.
! ! = !!ℎ!"#!!"#$%!"#
Using the above data the buyback-effect on the P/E ratio can be made obvious.
!"#$%"!!"#$%&':! ! = 25,62 = 12,8
!"#$%!!"#$%&':! ! = 25,62,56 = 10
The P/E ratio falls after shares are bought back and retired, because the loss in
income due to the missing interest proceeds is more than offset by an increasing
EPS induced by the reduced share count.
The drop of the P/E ratio can also be explained as follows: The share buyback acts
like a separator that deconsolidates the business into two independent units. One
unit represents cash and carries a P/E of 33,33! the other unit representing the
businesses operations carries a P/E of 10,00. The P/E of 12,8 represents the
weighted P/E ratio of both units. When the cash position is fully used to fund the
buyback the P/E lowers to that of the operating business, a P/E of 10.55
It could be assumed that a share price appreciation would take place after the
buyback as earnings are now distributed over less outstanding shares, which
makes every share representing a bigger part of the company´s earnings. But the
increase in EPS, triggered by the lower share count, is perfectly offset by a
decrease in intrinsic value (see Table 5 intrinsic value and shares outstanding
!!!!!!!!!!!!!!!!!!!!!!!!!!!!!!!!!!!!!!!!!!!!!!!!!!!!!!!!54 Voss, J., Major Themes in Economics, Why Repurchase Stock? (2012). 55 Dobbs, R./ Rehm, W., Mc Kinsey & Company Member Edition, The value of share buybacks (2005).
!
! 18!
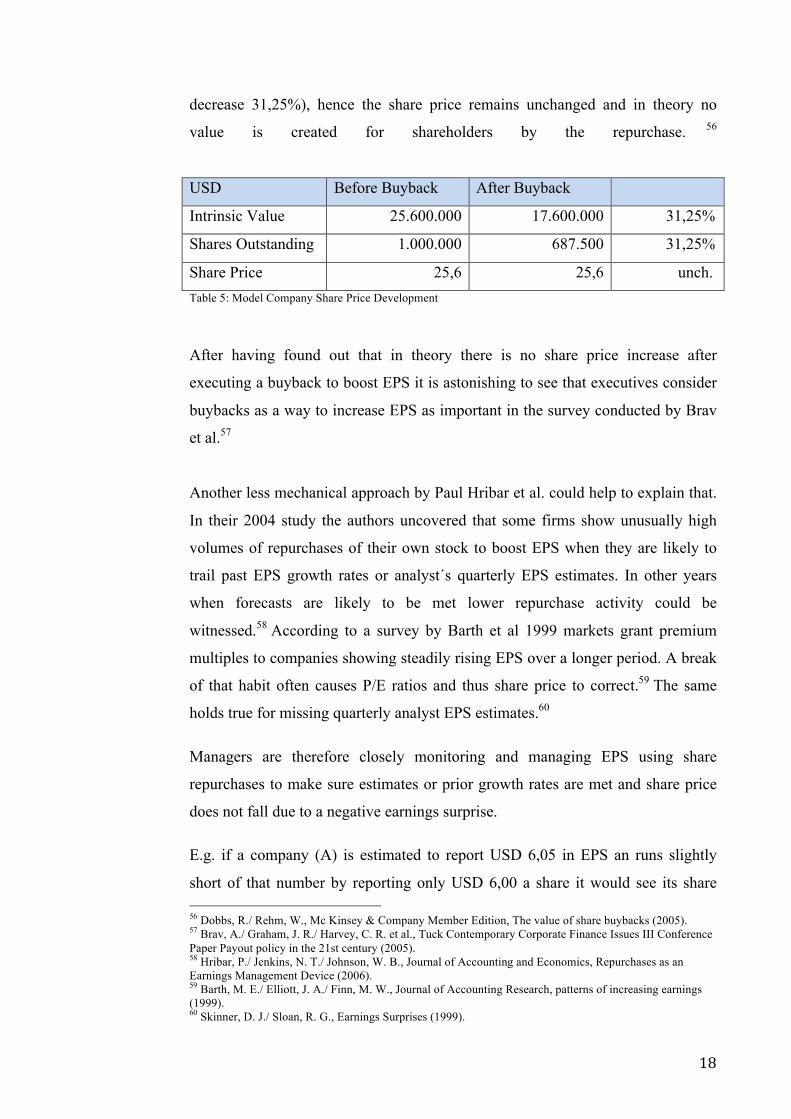
decrease 31,25%), hence the share price remains unchanged and in theory no
value is created for shareholders by the repurchase. 56
USD Before Buyback After Buyback
Intrinsic Value 25.600.000 17.600.000 31,25%
Shares Outstanding 1.000.000 687.500 31,25%
Share Price 25,6 25,6 unch. Table 5: Model Company Share Price Development
After having found out that in theory there is no share price increase after
executing a buyback to boost EPS it is astonishing to see that executives consider
buybacks as a way to increase EPS as important in the survey conducted by Brav
et al.57
Another less mechanical approach by Paul Hribar et al. could help to explain that.
In their 2004 study the authors uncovered that some firms show unusually high
volumes of repurchases of their own stock to boost EPS when they are likely to
trail past EPS growth rates or analyst´s quarterly EPS estimates. In other years
when forecasts are likely to be met lower repurchase activity could be
witnessed.58 According to a survey by Barth et al 1999 markets grant premium
multiples to companies showing steadily rising EPS over a longer period. A break
of that habit often causes P/E ratios and thus share price to correct.59 The same
holds true for missing quarterly analyst EPS estimates.60
Managers are therefore closely monitoring and managing EPS using share
repurchases to make sure estimates or prior growth rates are met and share price
does not fall due to a negative earnings surprise.
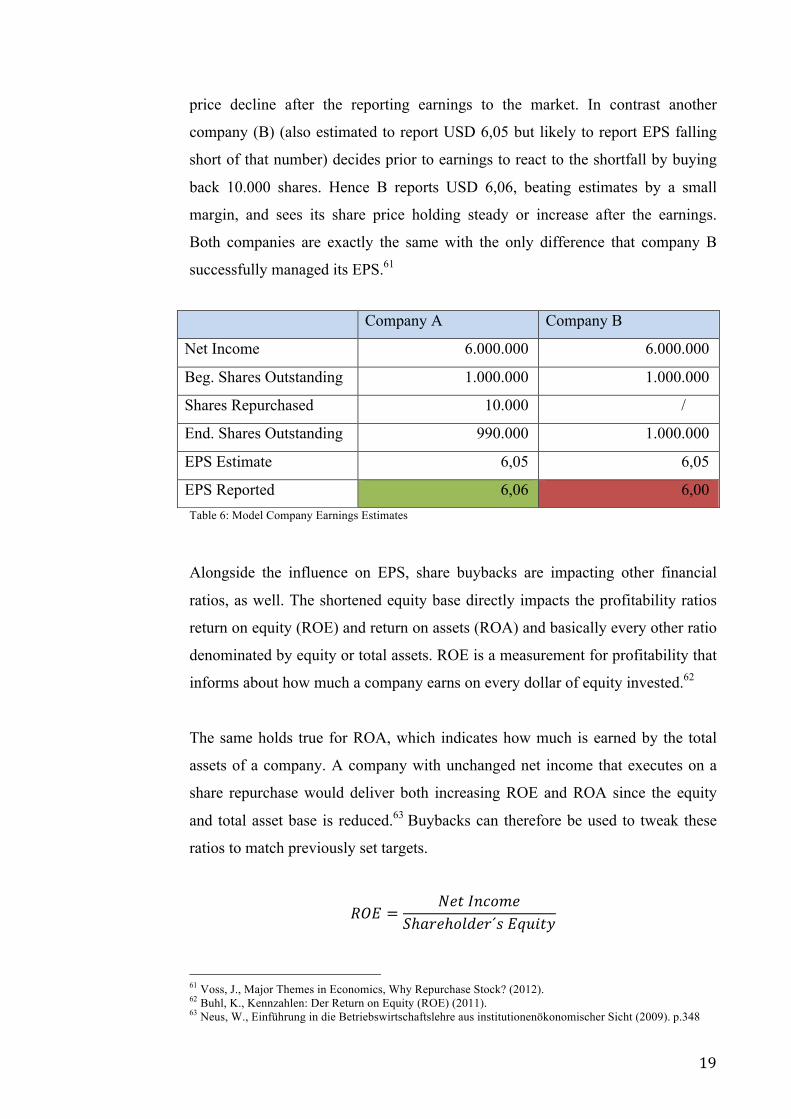
E.g. if a company (A) is estimated to report USD 6,05 in EPS an runs slightly
short of that number by reporting only USD 6,00 a share it would see its share !!!!!!!!!!!!!!!!!!!!!!!!!!!!!!!!!!!!!!!!!!!!!!!!!!!!!!!!56 Dobbs, R./ Rehm, W., Mc Kinsey & Company Member Edition, The value of share buybacks (2005). 57 Brav, A./ Graham, J. R./ Harvey, C. R. et al., Tuck Contemporary Corporate Finance Issues III Conference Paper Payout policy in the 21st century (2005). 58 Hribar, P./ Jenkins, N. T./ Johnson, W. B., Journal of Accounting and Economics, Repurchases as an Earnings Management Device (2006). 59 Barth, M. E./ Elliott, J. A./ Finn, M. W., Journal of Accounting Research, patterns of increasing earnings (1999). 60 Skinner, D. J./ Sloan, R. G., Earnings Surprises (1999).
!
! 19!
price decline after the reporting earnings to the market. In contrast another
company (B) (also estimated to report USD 6,05 but likely to report EPS falling
short of that number) decides prior to earnings to react to the shortfall by buying
back 10.000 shares. Hence B reports USD 6,06, beating estimates by a small
margin, and sees its share price holding steady or increase after the earnings.
Both companies are exactly the same with the only difference that company B
successfully managed its EPS.61
Table 6: Model Company Earnings Estimates
Alongside the influence on EPS, share buybacks are impacting other financial
ratios, as well. The shortened equity base directly impacts the profitability ratios
return on equity (ROE) and return on assets (ROA) and basically every other ratio
denominated by equity or total assets. ROE is a measurement for profitability that
informs about how much a company earns on every dollar of equity invested.62
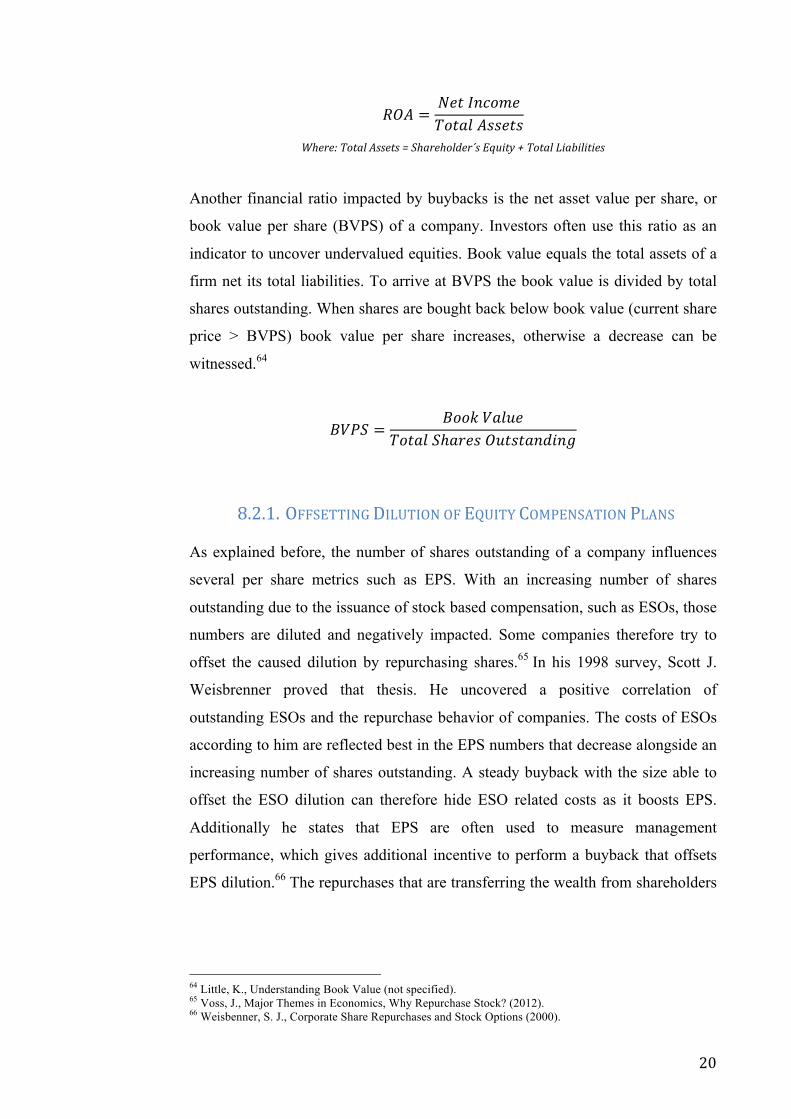
The same holds true for ROA, which indicates how much is earned by the total
assets of a company. A company with unchanged net income that executes on a
share repurchase would deliver both increasing ROE and ROA since the equity
and total asset base is reduced.63 Buybacks can therefore be used to tweak these
ratios to match previously set targets.
!"# = !"#!!"#$%&!ℎ!"#ℎ!"#$%´!!!"#$%&
!!!!!!!!!!!!!!!!!!!!!!!!!!!!!!!!!!!!!!!!!!!!!!!!!!!!!!!!61 Voss, J., Major Themes in Economics, Why Repurchase Stock? (2012). 62 Buhl, K., Kennzahlen: Der Return on Equity (ROE) (2011). 63 Neus, W., Einführung in die Betriebswirtschaftslehre aus institutionenökonomischer Sicht (2009). p.348
Company A Company B
Net Income 6.000.000 6.000.000
Beg. Shares Outstanding 1.000.000 1.000.000
Shares Repurchased 10.000 /
End. Shares Outstanding 990.000 1.000.000
EPS Estimate 6,05 6,05
EPS Reported 6,06 6,00
!
! 20!
!"# = !"#!!"#$%&!"#$%!!""#$"
Where:&Total&Assets&=&Shareholder´s&Equity&+&Total&Liabilities&
Another financial ratio impacted by buybacks is the net asset value per share, or
book value per share (BVPS) of a company. Investors often use this ratio as an
indicator to uncover undervalued equities. Book value equals the total assets of a
firm net its total liabilities. To arrive at BVPS the book value is divided by total
shares outstanding. When shares are bought back below book value (current share
price > BVPS) book value per share increases, otherwise a decrease can be
witnessed.64
!"#$ = !""#!!"#$%!"#$%!!ℎ!"#$!!"#$#%&'(&)
8.2.1. OFFSETTING!DILUTION!OF!EQUITY!COMPENSATION!PLANS!
As explained before, the number of shares outstanding of a company influences
several per share metrics such as EPS. With an increasing number of shares
outstanding due to the issuance of stock based compensation, such as ESOs, those
numbers are diluted and negatively impacted. Some companies therefore try to
offset the caused dilution by repurchasing shares.65 In his 1998 survey, Scott J.
Weisbrenner proved that thesis. He uncovered a positive correlation of
outstanding ESOs and the repurchase behavior of companies. The costs of ESOs
according to him are reflected best in the EPS numbers that decrease alongside an
increasing number of shares outstanding. A steady buyback with the size able to
offset the ESO dilution can therefore hide ESO related costs as it boosts EPS.
Additionally he states that EPS are often used to measure management
performance, which gives additional incentive to perform a buyback that offsets
EPS dilution.66 The repurchases that are transferring the wealth from shareholders
!!!!!!!!!!!!!!!!!!!!!!!!!!!!!!!!!!!!!!!!!!!!!!!!!!!!!!!!64 Little, K., Understanding Book Value (not specified). 65 Voss, J., Major Themes in Economics, Why Repurchase Stock? (2012). 66 Weisbenner, S. J., Corporate Share Repurchases and Stock Options (2000).
!
! 21!
to employees, hence share buybacks that offset the dilution represent the cost of
ESOs.67
8.3. UNDERVALUATION!HYPOTHESIS!/!SIGNALING!THEORY!
Most mentioned reason to justify a share repurchase among the executives
questioned in the survey by Brav et al. was that shares are repurchased, because
executives considered their shares undervalued.68 The undervaluation hypothesis
therefore is finding a lot of appreciation in literature. This paper puts that theory
in its center, as it seems that it gives the best hints on how to increase long-term
shareholder value by repurchasing shares.
As the name “undervaluation hypothesis” suggests, the theory claims that
executives buy back shares because of an undervaluation of their company at the
current stock price. A corporation´s shares are undervalued when they trade below
intrinsic value.69 The intrinsic value can be defined as the sum of all future
discounted cash flows that a business will earn in its lifetime.70 Hence executives
are repurchasing shares when, in their opinion, the stock is trading at a discount to
intrinsic value. Berkshire Hathaway Inc. is a very suitable example of a
corporation acting according to the undervaluation hypothesis. Warren Buffett,
chairman and CEO of Berkshire Hathaway Inc., informed investors in his 2012
letter to shareholders that his company would repurchase shares every time they
trade below 120% of book value per share, which according to Buffett presents a
meaningful discount to intrinsic value. At that price level he sees his company´s
shares significantly undervalued. In addition to his repurchasing commitment he
emphasized that repurchasing shares above the intrinsic value would hurt
shareholder value.71
To explain why a repurchase of overvalued shares hurts shareholder value it is
necessary to distinguish between shareholders participating in the buyback
program and continuing stockholders holding on to their shares. If a shareholder
!!!!!!!!!!!!!!!!!!!!!!!!!!!!!!!!!!!!!!!!!!!!!!!!!!!!!!!!67 Voss, J., Major Themes in Economics, Why Repurchase Stock? (2012). 68 Brav, A./ Graham, J. R./ Harvey, C. R. et al., Tuck Contemporary Corporate Finance Issues III Conference Paper Payout policy in the 21st century (2005). 69 Voss, J., Major Themes in Economics, Why Repurchase Stock? (2012). 70 Howell, R., The Wallstreet Journal., Intrinsic Value (2013). 71 Buffett, W. E., Letter to Shareholders 2012 (2013).
!
! 22!
decides to participate in the repurchase program and sells his shares to the
company he will most likely benefit nevertheless shares are over- or underpriced.
The increased demand for the shares caused by the repurchasing company usually
gives prices a short-term lift since demand for the shares increases. Additionally
signaling produces stock price rises after the announcement of a share
repurchase.72
The case is different with continuing shareholders that do not capitalize from
short-term share price gains and decide not to sell their shares to the company.
Continuing shareholders should have significant interest in management
repurchasing only undervalued shares, as intrinsic value is affected by the
buybacks. If overvalued shares are bought back the intrinsic value of a business
decreases and shareholder value is eventually going to be destroyed. The
following example illustrates that73.
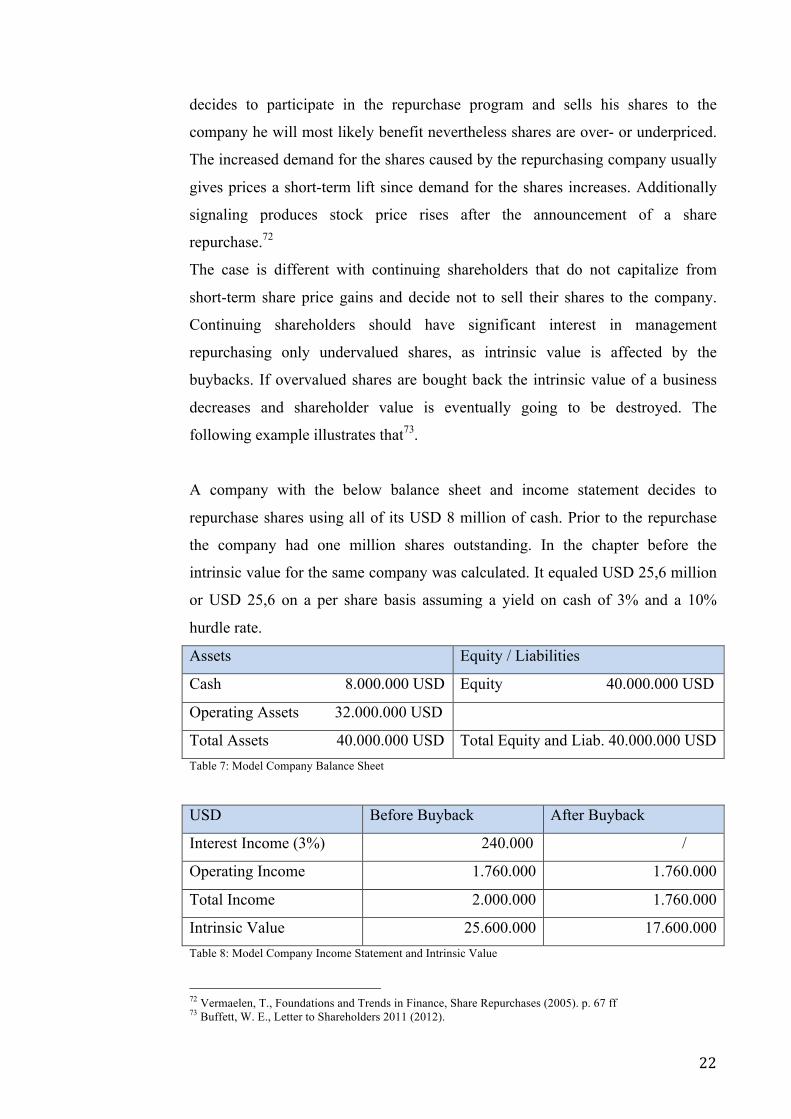
A company with the below balance sheet and income statement decides to
repurchase shares using all of its USD 8 million of cash. Prior to the repurchase
the company had one million shares outstanding. In the chapter before the
intrinsic value for the same company was calculated. It equaled USD 25,6 million
or USD 25,6 on a per share basis assuming a yield on cash of 3% and a 10%
hurdle rate.
Assets Equity / Liabilities
Cash 8.000.000 USD Equity 40.000.000 USD
Operating Assets 32.000.000 USD
Total Assets 40.000.000 USD Total Equity and Liab. 40.000.000 USD Table 7: Model Company Balance Sheet
!USD Before Buyback After Buyback
Interest Income (3%) 240.000 /
Operating Income 1.760.000 1.760.000
Total Income 2.000.000 1.760.000
Intrinsic Value 25.600.000 17.600.000 Table 8: Model Company Income Statement and Intrinsic Value
!!!!!!!!!!!!!!!!!!!!!!!!!!!!!!!!!!!!!!!!!!!!!!!!!!!!!!!!72 Vermaelen, T., Foundations and Trends in Finance, Share Repurchases (2005). p. 67 ff 73 Buffett, W. E., Letter to Shareholders 2011 (2012).

!
! 23!
The shares now trade below intrinsic value at USD 20 a share. Thus the firm is
able to repurchase 400.000 of its shares with its USD 8 million in cash, which
reduces outstanding shares to 600.000. Spending cash in order to acquire own
shares, as previously explained, reduces intrinsic value since the company is
missing out on interest payments. Intrinsic value after the repurchase hence
decreases to USD 17.6 million.
However repurchasing shares below intrinsic value reduces the share count at a
higher rate than intrinsic value of the business is decreasing. Shares outstanding of
the model company decrease at a 40% rate, whereas intrinsic value falls just
31,25%. On a per share basis though, intrinsic value increases 14,57%, from USD
25,6 to USD 29,33 per share making each share more valuable for investors (table
9).
USD Before Buyback After Buyback Alteration
Intrinsic Value 25.600.000 17.600.000 - 31,25%
Shares Outstanding 1.000.000 600.000 - 40,00%
Intrinsic Value / Share 25,60 29,33 +14,57%
Share Price 20,00
Shares Repurchased 400.000 Table 9: Model Company Buyback of Undervalued Shares
!The other way round the same holds true for repurchasing shares above intrinsic
value, in this example at 30 USD. Share count falls at a lower rate (-26,67%) as
only 266.666 shares can be bought back with USD 8 million, however intrinsic
value decreases by the same amount (-31,25%). Intrinsic value per share
consequently falls and each share now represents only USD 24 in intrinsic value,
USD 1,6 less than prior to the repurchase. For the investor that implies a
destruction of value caused by the share repurchase (table 10).

!
! 24!
USD Before Buyback After Buyback Alteration
Intrinsic Value 25.600.000 17.600.000 - 31,25%
Shares Outstanding 1.000.000 733.333 - 26,67%
Intrinsic Value / Share 25,60 24,00 - 6,25%
Share Price 30,00
Shares Repurchased 266.666 Table 10: Model Company Buyback of Overvalued Shares
!Markets are said to behave efficiently. That would implicate that the share price
represents intrinsic value at any time. However from time to time markets happen
to misprice equities and share prices deviate from intrinsic value (both to the up-
and downside). That creates opportunities for companies to increase intrinsic
value by repurchasing undervalued shares but also sets pitfalls of destroying value
when overpriced shares are acquired.74
In his 2011 letter to shareholders Buffett additionally expressed that his intention
is not to cash out shareholders cheaply by repurchasing undervalued shares, but to
inform about the corporation´s value and assets that shareholders are selling when
participating in the buyback program.75 This behavior is called signaling and goes
hand in hand with the undervaluation hypothesis. Every time a corporation
repurchases shares its executives are sending a signal to the markets that, in their
opinion, shares are trading at a discount to intrinsic value. This is understood as a
sign that the share price does not correctly reflect future cash flows and hence
suggests that the market undervalues the company at current share prices.76
Executives are typically having much better insight and access to information in
their company than outside investors have; an information asymmetry between
company insiders (executives) and non-insiders exists. Therefore executives are
credited of being able to value their own company more accurately than non-
insiders. 77 Since executives are appointed to act according to the owners
(shareholders) interest, they are trusted to only repurchase undervalued shares
since acquiring overvalued stock would diminish intrinsic value and hurt
!!!!!!!!!!!!!!!!!!!!!!!!!!!!!!!!!!!!!!!!!!!!!!!!!!!!!!!!74 Graham, B., Intelligent Investieren (2005). p. 224 ff 75 Buffett, W. E., Letter to Shareholders 2011 (2012). 76 Efficient markets do not have information asymmetries. 77 Buffett, W. E., Letter to Shareholders 2011 (2012).
!
! 25!
shareholders. Because of this, communicating or signaling of an undervaluation of
the company by buying back shares is highly valuable to shareholders. This is
also the reason why usually investors are buying up shares right after the
announcement of the buyback to take immediate advantage of the prevailing
mispricing. Consequently rising stock prices can be witnessed after the
announcement of a share buyback.78
Having discussed both the Undervaluation Hypothesis and the Signaling Theory it
becomes obvious that they always belong together. However the undervaluation
of a company seems to provide a better explanation to why executives choose to
buy back shares, while signaling gives a more sufficient answer as to why the
share price is usually reacting positively right after the buyback announcement.79
However there are various pitfalls when shares are acquired due to an
undervaluation. The most obvious prevailing risk is, whether or not executives are
right with their statement that shares are actually undervalued. Corporations and
their executives barely give insight into how they calculate the intrinsic value of
their companies, which makes it hard for shareholders to validate the correctness
of a repurchase decision.
Another difficulty that arises is a problem related to Agency Theory. The interests
of shareholders and the management of a company originally do not align. Each
party is desired to increase their own net-worth. Shareholders are eager to see
their company and share price thriving, whereas managers seek for the highest
possible compensation to increase their own net worth. Accordingly if
repurchasing shares can raise compensation the management could be willing to
even repurchase overvalued shares that destroy intrinsic value.80
9. AGENCY!THEORY!
Agency Theory deals with the separation of ownership and control within a
company. Usually managers (agent) raise capital from investors (principal),
because they do not have sufficient funds themselves to invest, or they want to !!!!!!!!!!!!!!!!!!!!!!!!!!!!!!!!!!!!!!!!!!!!!!!!!!!!!!!!78 Voss, J., Major Themes in Economics, Why Repurchase Stock? (2012). 79 Voss, J., Major Themes in Economics, Why Repurchase Stock? (2012). 80 Shleifer, A./ Vishny, R. W., Journal of Finance, A Survey of Corporate Governance (1997).

!
! 26!
cash out on their holdings of the business. Contrary the investor possesses excess
capital and needs the skills of the manager to generate a return on the capital.
After having invested the capital it is at the manager´s disposal. Consequently that
raises the question of how the investor can be assured that the manager is acting to
the investor´s benefit and is not wasting the money. A lack of security that
managers act in the interest of investors would result in a high risk to fund
businesses and accordingly decrease investments.81
To be sure that managers act in favor of investors a contract between the parties is
necessary. The optimal contract would be a contract fully aligning the interests of
investor and management. It would be determined how profits are split between
investor and manager and specified what is done with the capital in every
imaginable situation. However in the field, contracts never proved to be optimal
since a contract is not sufficient to regulate every eventuality because the future
cannot be foreseen.82 That’s why the parties have to find a solution to allocate the
residual control rights. Residual control rights are needed to give a party the
decision power in events not specified by the contract. But how should these
control rights be distributed?
The residual control rights could be given entirely to the investors in return for
providing the funding. Meaning in an event where a decision has to be made on a
subject not specified in the contract the manger has to consult the investors and let
them decide. But as initially mentioned the investor hires the manager for his
special skills. As the manager has all the specific knowledge and insights to the
company´s operations he is more suitable to exercise the control rights. An
information asymmetry exists. Investors are generally too uninformed to make
decisions on how to allocate funds. Especially when ownership is spread among
many small investors it is likely that some are not informed and don´t even want
to learn about the company they have invested in. Hence participating in the
governing of the company is not a reasonable option. Managers therefore end up
with significant power and control rights and are able to independently allocate
capital.83
!!!!!!!!!!!!!!!!!!!!!!!!!!!!!!!!!!!!!!!!!!!!!!!!!!!!!!!!81 Shleifer, A./ Vishny, R. W., Journal of Finance, A Survey of Corporate Governance (1997). 82 van der Wijst, N., Agency theory and corporate governance (2013). 83 Shleifer, A./ Vishny, R. W., Journal of Finance, A Survey of Corporate Governance (1997).
!
! 27!
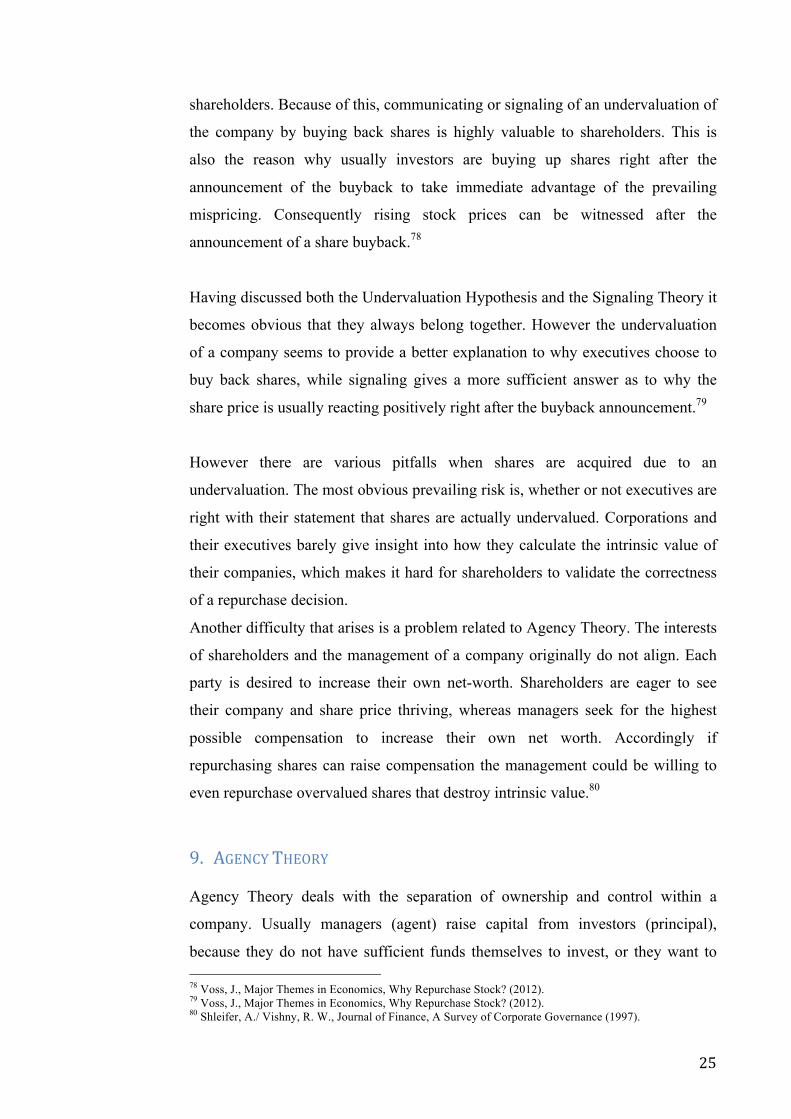
Those extensive control rights held by managers pose significant risk to investors.
In the past managers have expropriated investors, by allocating funds in a way
only serving their profit. E.g. managers have sold investor´s assets at a large
discount to companies owned by the managers themselves. Nowadays law
protects against that kind of theft, however that does not fully prevent fraud. Less
obvious actions to the negative for investors are still occurring nowadays, such as
managers that increase the size of the firm to an extent that hurts returns and
shareholder value but benefits their own goals.84 The loss a company takes
because of self-interested manager behavior and the company´s actions to prevent
that behavior is referred to as agency cost. With managers being able to pursue
self-interested actions with the goal of maximizing own net worth, regardless
investors are benefited or harmed, additional solutions have to be found to protect
investor´s funds from getting wasted.85
Figure 4: Agency Theory Illustration
Basically there are two major solutions to reduce agency cost. One is to give out
incentive contracts to managers and the other one is the development of advanced
monitoring systems to be able to better judge managerial behavior. Information
systems to reveal the behavior of managers in a company are e.g. detailed reports
on the operations of a business, an independent auditor and a functioning board of
directors that effectively supervises the behavior of managers 86 Incentive
!!!!!!!!!!!!!!!!!!!!!!!!!!!!!!!!!!!!!!!!!!!!!!!!!!!!!!!!84 Shleifer, A./ Vishny, R. W., Journal of Finance, A Survey of Corporate Governance (1997). 85 van der Wijst, N., Agency theory and corporate governance (2013). 86 Eisenhardt, K. M., Academy of Management Review. , Agency Theory (1989).
!
! 28!
contracts are attempting to align investors and managers interests. The larger the
benefits are that a manger can reap from residual control the costlier incentivizing
becomes. Efficient incentive contracts are tied to a ratio that reliably measures
management performance. Such contracts can occur in different forms e.g. equity
compensation by awarding stock options and direct ownership of shares (to make
the manager an owner of the company, too) or compensation based on factors
such as EPS or ROE.87
Contracting managers always presents a tradeoff of cost to monitor, measure
behavior and the cost used for incentive contracts and performance measurement.
Otherwise put, information in a corporation can be viewed as a commodity that
has a cost and can be purchased. When advanced information systems are
purchased to effectively monitor manager behavior, less cost has to be used on
incentive instruments and vice versa.88
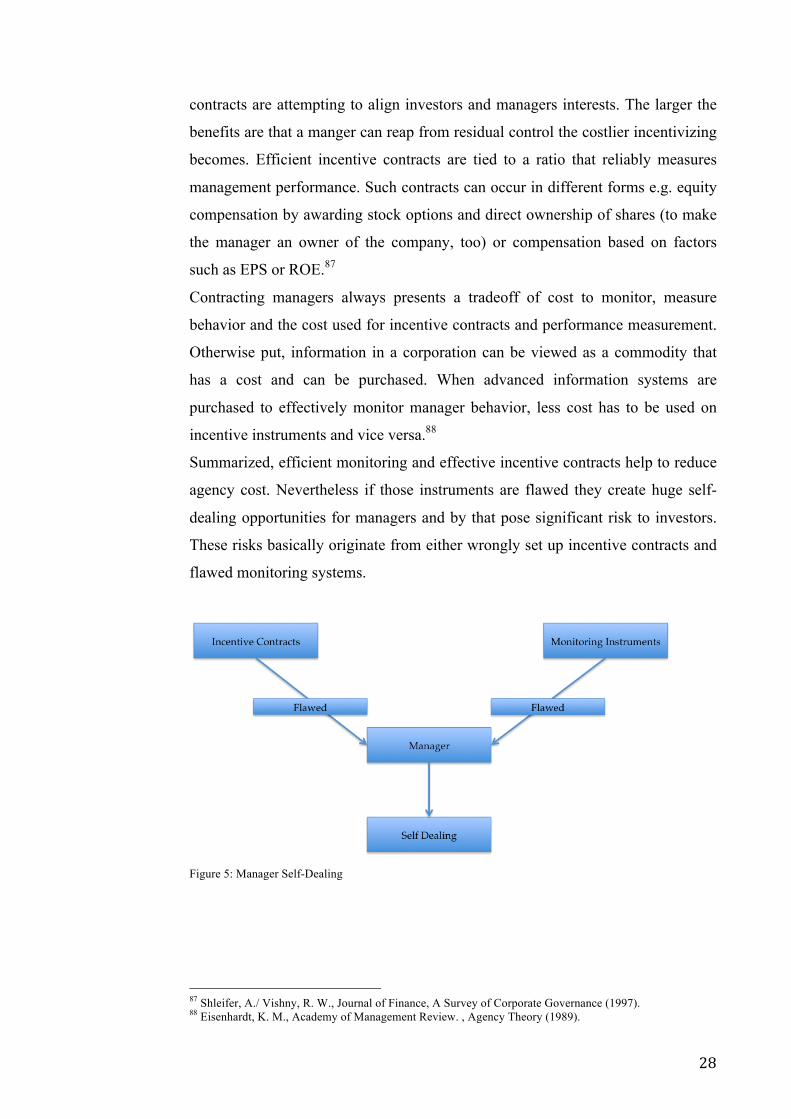
Summarized, efficient monitoring and effective incentive contracts help to reduce
agency cost. Nevertheless if those instruments are flawed they create huge self-
dealing opportunities for managers and by that pose significant risk to investors.
These risks basically originate from either wrongly set up incentive contracts and
flawed monitoring systems.
!Figure 5: Manager Self-Dealing
!!!!!!!!!!!!!!!!!!!!!!!!!!!!!!!!!!!!!!!!!!!!!!!!!!!!!!!!87 Shleifer, A./ Vishny, R. W., Journal of Finance, A Survey of Corporate Governance (1997). 88 Eisenhardt, K. M., Academy of Management Review. , Agency Theory (1989).
!
! 29!
9.1. CORPORATE!GOVERNANCE!
In the U.S., the Anglo-Saxon model of corporate governance presents a frameset
to protect shareholder interests and to legally tackle agency problems. U.S.
corporate governance puts in center shareholder interests, whereas other corporate
governance codes are aiming to protect other stakeholders´ interests such as
employees, as well. The main bodies that U.S. corporate governance is comprised
of are the Sarbanes-Oxley Act, the statues of the SEC, guidelines of the most
important stock exchanges NYSE (New York Stock Exchange) and NASD
(National Association of Security Dealers) and regional state law (e.g. Delaware
Corporate Law).89 Among the tasks of corporate governance are to ensure that
shareholders participate in governing the company by voting on important issues
at shareholder meetings and electing a board of directors to supervise managers.
Further corporate governance makes sure that relevant information about key
executives and the board members is disclosed.
To protect shareholder interests U.S. corporate governance defines
responsibilities, structure and composure of the board of directors that observes
firm executives. To follow the shareholder-centered approach of corporate
governance publicly listed firms are hierarchically organized, with management at
the bottom and shareholders represented by the board of directors at the top.90
U.S. Corporate governance statues differ from state to state as each state has
imposed its own acts on corporate governance. Nevertheless the key functions of
the board are universal and comprise of advisory and oversight tasks. Key
functions are defining a broad corporate strategy, approving yearly budgets,
informing about the company´s performance and ensuring independent auditing.
Most important for the purpose of this paper is the function of appointing the
CEO, monitor CEO performance and determining the compensation of the
company executives.91
The board of directors as the highest entity of a corporation has to be elected by
the shareholders. When there are board vacancies there is a nominating committee
composed of board directors that nominate a candidate for the position. This
!!!!!!!!!!!!!!!!!!!!!!!!!!!!!!!!!!!!!!!!!!!!!!!!!!!!!!!!89 Valuewalk, Corporate Governance: USA Versus Europe (2013). 90 OECD, OECD Publishing, Board Member Nomination and Election (2012). 91 Larcker, D. F., Board of Directors: Duties & Liabilities (2011).

!
! 30!
nominee then has to be approved by shareholder vote. According to Delaware
Corporate Law shareholders have one vote per voting share unless the corporation
has disclosed otherwise. Most of the publicly listed companies in the U.S. conduct
a system of majority votes. A candidate requires the majority of all the votes
casted at shareholder meetings to be elected a member of the board. Delaware
Corporate Law requires the annual appointment of the board of directors. The
company can freely choose the number of members appointed to the board. An
average U.S. board is comprised of 10 to 11 directors.92
U.S. boards of directors are one-tiered boards meaning both executive and non-
executive directors are present in the same board. Executive directors are
members of the board that also serve in the management of the company, which
makes them non-independent directors. There is no specific number of
independent board members required that are in no relationship to the company
and its management. Only the disclosure of any kind of relation is required. The
recent past shows a trend to totally independent boards or boards with the CEO as
only executive serving on the board. Nevertheless there are marginal cases of
boards that are comprised of a high number of non-independent directors.93
9.2. AGENCY!THEORY,!CORPORATE!GOVERNANCE!AND!REPURCHASES!
Agency Theory deals with the separation of ownership and control. Managers
controlling the company are eager to increase their own rather than the
shareholder´s net worth. This is why manager´s have to be incentivized and
monitored to assure they act according to shareholder´s interests.94 Corporate
Governance provides the frameset to protect shareholder´s interests. 95
Shareholders are represented by the board of directors, which oversees the
management. The board determines executive incentives, compensation and
monitors their performance.96
Executives that have superior insight together with the board of directors propose
share repurchase programs. Shareholders then may or may not approve the
program. But usually the programs get approved since shareholders, which are not !!!!!!!!!!!!!!!!!!!!!!!!!!!!!!!!!!!!!!!!!!!!!!!!!!!!!!!!92 OECD, OECD Publishing, Board Member Nomination and Election (2012). 93 OECD, OECD Publishing, Board Member Nomination and Election (2012). 94 Shleifer, A./ Vishny, R. W., Journal of Finance, A Survey of Corporate Governance (1997). 95 OECD, OECD Publishing, Board Member Nomination and Election (2012). 96 Larcker, D. F., Board of Directors: Duties & Liabilities (2011).
!
! 31!
able to access inside information, trust management and the board on their ability
to make a decision beneficial to shareholders.97 Optimal is a buyback decision that
creates long-term value for shareholders by acquiring undervalued shares as
elaborated in the chapter dealing with the undervaluation hypothesis.
Based on the previous findings in this chapter following assumptions can be
made, that are later verified by case studies. Incentive contracts and the board of
directors significantly influence the buyback decision. Wrongly negotiated
incentive compensation could motivate the management to propose a repurchase
of overvalued shares only to increase personal net worth. A compensation based
on per share targets could be such a flawed compensation. This would give the
manager the opportunity to directly influence the ratios by buying back shares and
raise his pay. The manager would likely purchase shares whenever he would
otherwise fail to reach the set target even when shares are overvalued. Intrinsic
value would then be destroyed and investor money wasted.
The board to protect shareholder´s assets should not approve such repurchases of
overvalued shares. A board however that does not effectively represent
shareholders interests could be harmful for the owners of the firm and approve
such repurchases. That could be the case when a board is consisting of a majority
of non-independent directors. Furthermore such a board, with its ability to decide
on management compensation could influence the repurchase decision by
negotiating a doubtful compensation package as mentioned above.
10. WHAT!MAKES!A!SUCCESSFUL!SHARE!REPURCHASE?!
The first part of this paper discussed the different ways eligible for corporations to
repurchase their shares. Among those the most important ones are the open
market repurchase, the fixed price tender offer and the Dutch auction tender offer.
After having explained how share buybacks are executed major theories as to why
companies repurchase shares were illustrated and the impacts that these theories
have on the companies were outlined. Among those reasons the most important
ones were the repurchase of shares due to an undervaluation and the signaling of
the same, the increase of EPS, and the optimization of the capital structure. !!!!!!!!!!!!!!!!!!!!!!!!!!!!!!!!!!!!!!!!!!!!!!!!!!!!!!!!97 Allen, F./ Michaely, R., Payout Policy (2002).
!
! 32!
Several other buyback reasons such as the dividend substitution will not be
discussed further, but were mentioned to provide a more complete view of the
subject.
Furthermore the agency theory was explicated. Agency theory is fundamental to
every corporation and its stakeholders as agency theory defines the important
relationship of owner and manager. It reveals major conflicts that when left
unresolved can confront the corporation with significant cost.98
Based on these theoretical findings factors that benefit the success of share
repurchases can be derived. As previously stated a successful share repurchase in
this paper is defined as a buyback program that creates shareholder value over the
long-term (more than five years) and not just right after the announcement of such
a program. The only possibility to achieve that kind of long-term value creation is
according to the undervaluation hypothesis to repurchase shares trading below
intrinsic value. Repurchasing shares below intrinsic value increases intrinsic value
per share, which in the long-term share prices tend to reflect.99 Effective signaling
goes hand in hand with the undervaluation of share prices. The more management
can be trusted on its committed to only repurchase undervalued shares the more
effective signaling becomes.100 But which factors have to be given ensuring that
only undervalued shares are repurchased?
In the following factors that could provide answers to that question are compiled
based on assumptions derived from the theoretical findings. Agency Theory gave
two major levers that encouraged self-dealing opportunities for managers when
wrongly applied. One of them being the incentive compensation and the other one
monitoring instruments represented by the board of directors.101
Derived from the prior findings incentive compensation has to align shareholders
and executives interests on a long-term appreciation in shareholder value. If that is
the case own shares should only be acquired when they trade below intrinsic
value. To make executives acting according to those interests compensation
should contain a large part of equity in form of e.g. restricted stock or ESOs that
!!!!!!!!!!!!!!!!!!!!!!!!!!!!!!!!!!!!!!!!!!!!!!!!!!!!!!!!98 Shleifer, A./ Vishny, R. W., Journal of Finance, A Survey of Corporate Governance (1997). 99 Voss, J., Major Themes in Economics, Why Repurchase Stock? (2012). 100 Voss, J., Major Themes in Economics, Why Repurchase Stock? (2012). 101 Eisenhardt, K. M., Academy of Management Review. , Agency Theory (1989).
!
! 33!
have to be held over the long-term. Furthermore performance, which the level of
compensation is based upon, should not be measured by per share numbers that
can be influenced by share repurchases such as ROE or EPS. If that is wished
anyway the performance measurements should be adjusted for the repurchased
shares, to take out their effect on the numbers. Otherwise executives would
repurchase as many shares as possible whether or not they are overvalued.
Second the board of directors should consist of a high number of independent
directors that are in no relationship to the executives. Those independent directors
grant that repurchase decisions of the management are weighed soundly and are
favorable to shareholders.
Furthermore a majority shareholder pursuing other interests than the creation of
long-term shareholder value could be harmful to a successful share repurchase.
This is the case because a majority shareholder can control the board and thus is
able to influence executives. These executives then certainly perform the
repurchase decision according to the majority shareholders intentions. If these
intentions do not align with other shareholders, for those such a repurchase is
likely to have a negative outcome.
Another necessary requirement should be that executives exactly know the
intrinsic value of their firm to make a reasonable repurchase decision. An
independent board and a correct compensation do not help if the management is
not aware what their company really is worth. To tackle that problem it could be
useful to tie the repurchase decision to a certain ratio such as BV and an adjusted
P/E that resembles the value of the company effectively.
All these assumptions are verified by the following case studies.
11. INVESTIGATION!METHODOLOGY!
After having elaborated the factors of success for share repurchases case studies
will be presented to verify the findings. These case studies address U.S. listed
companies that carried out share repurchases in the past or are still active buyers
of their own stock. To verify the developed success factors both negative and
positive examples of share repurchases will be put forth.
!
! 34!
Each case study has its own purpose and validates certain factors by either
showing how not respecting the factors of success negatively influences the
company and shareholder returns or how acting according to the findings produce
a successful share repurchase.
The repurchase decisions will be investigated using SEC-filings such as annual
reports, proxy statements, and other publicly accessible corporate information.102
Since the impact of the repurchase decisions cannot be fully isolated from other
forces influencing companies the results can be diluted and may not be
universally applicable to every U.S. corporation. To further strengthen the thesis
of that paper and prove the universal validity of the findings an empirical study
surveying a large number of companies should be conducted.
However by the investigation of three different companies the author feels
comfortable to provide broad guidelines that set a frameset for future successful
share repurchases that create long-term value for shareholders.
12. CASE!STUDIES!
The following three case studies each provide evidence for different factors of
success for share repurchases. The first case study deals with flawed incentive
compensation and the resulting agency cost caused by buyback decisions at
International Business Machines. The second case about Weight Watchers
International points out the importance of an independent board and warns of
dangers associated to a majority shareholder when own shares are acquired.
Finally the Berkshire Hathaway case study gives a textbook example of a
successful share repurchase program.
12.1. INTERNATIONAL!BUSINESS!MACHINES!
This case study will pay special attention to how executive incentive
compensation is affecting the buyback decision. Therefore executive
compensation will be analyzed and its impact on share repurchases and the overall
company performance will be illustrated. It will be exhibited how executive
!!!!!!!!!!!!!!!!!!!!!!!!!!!!!!!!!!!!!!!!!!!!!!!!!!!!!!!!102 All historical share price information is gathered from Google, Google Finance (not specified).
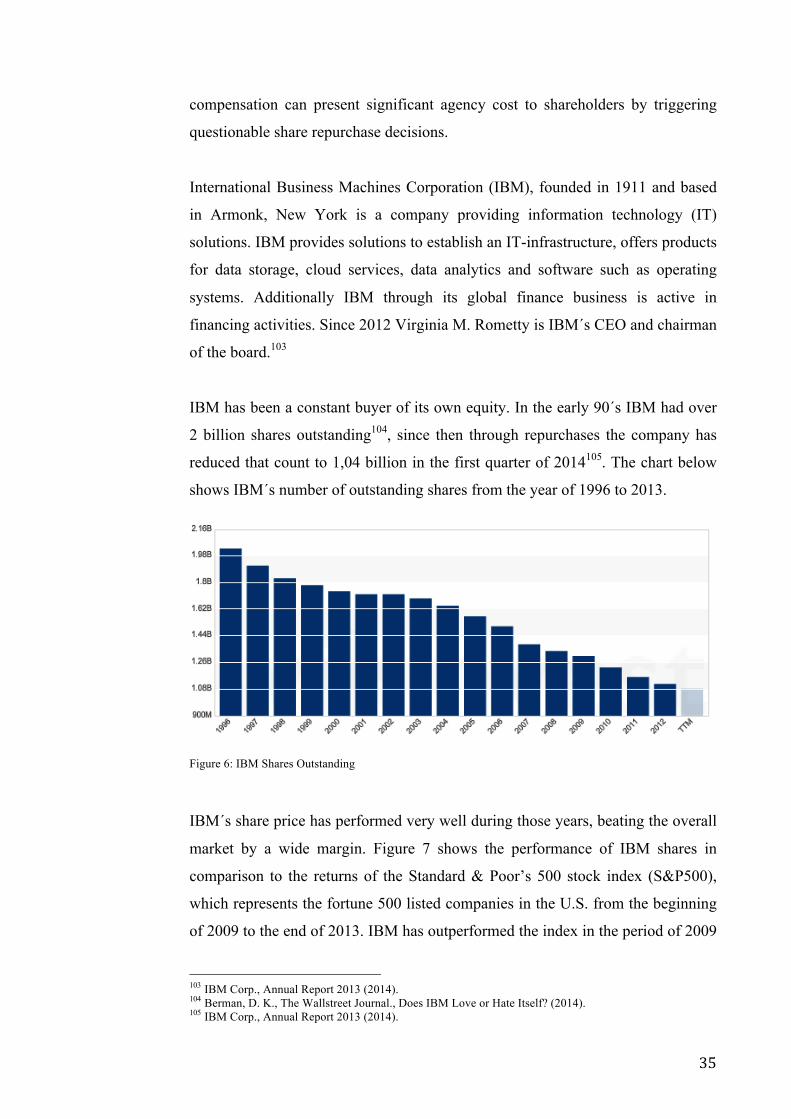
!
! 35!
compensation can present significant agency cost to shareholders by triggering
questionable share repurchase decisions.
International Business Machines Corporation (IBM), founded in 1911 and based
in Armonk, New York is a company providing information technology (IT)
solutions. IBM provides solutions to establish an IT-infrastructure, offers products
for data storage, cloud services, data analytics and software such as operating
systems. Additionally IBM through its global finance business is active in
financing activities. Since 2012 Virginia M. Rometty is IBM´s CEO and chairman
of the board.103
IBM has been a constant buyer of its own equity. In the early 90´s IBM had over
2 billion shares outstanding104, since then through repurchases the company has
reduced that count to 1,04 billion in the first quarter of 2014105. The chart below
shows IBM´s number of outstanding shares from the year of 1996 to 2013.
!Figure 6: IBM Shares Outstanding
IBM´s share price has performed very well during those years, beating the overall
market by a wide margin. Figure 7 shows the performance of IBM shares in
comparison to the returns of the Standard & Poor’s 500 stock index (S&P500),
which represents the fortune 500 listed companies in the U.S. from the beginning
of 2009 to the end of 2013. IBM has outperformed the index in the period of 2009
!!!!!!!!!!!!!!!!!!!!!!!!!!!!!!!!!!!!!!!!!!!!!!!!!!!!!!!!103 IBM Corp., Annual Report 2013 (2014). 104 Berman, D. K., The Wallstreet Journal., Does IBM Love or Hate Itself? (2014). 105 IBM Corp., Annual Report 2013 (2014).
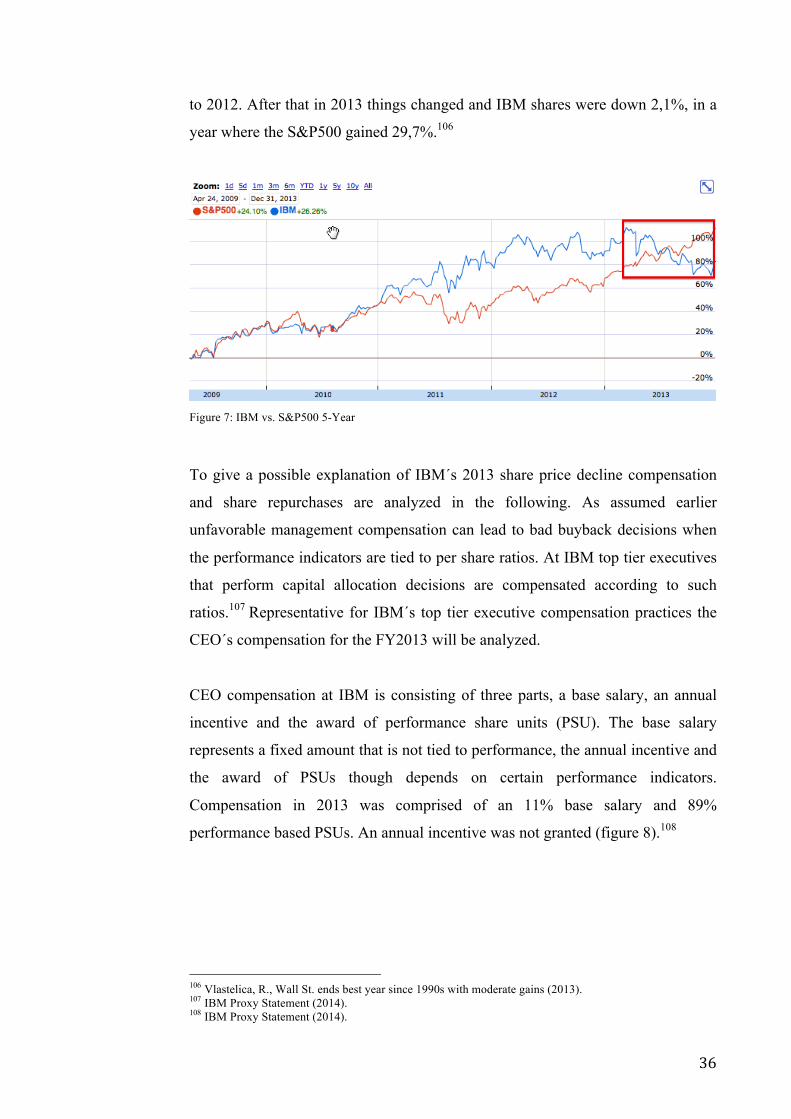
!
! 36!
to 2012. After that in 2013 things changed and IBM shares were down 2,1%, in a
year where the S&P500 gained 29,7%.106
!Figure 7: IBM vs. S&P500 5-Year
To give a possible explanation of IBM´s 2013 share price decline compensation
and share repurchases are analyzed in the following. As assumed earlier
unfavorable management compensation can lead to bad buyback decisions when
the performance indicators are tied to per share ratios. At IBM top tier executives
that perform capital allocation decisions are compensated according to such
ratios.107 Representative for IBM´s top tier executive compensation practices the
CEO´s compensation for the FY2013 will be analyzed.
CEO compensation at IBM is consisting of three parts, a base salary, an annual
incentive and the award of performance share units (PSU). The base salary
represents a fixed amount that is not tied to performance, the annual incentive and
the award of PSUs though depends on certain performance indicators.
Compensation in 2013 was comprised of an 11% base salary and 89%
performance based PSUs. An annual incentive was not granted (figure 8).108
!!!!!!!!!!!!!!!!!!!!!!!!!!!!!!!!!!!!!!!!!!!!!!!!!!!!!!!!106 Vlastelica, R., Wall St. ends best year since 1990s with moderate gains (2013). 107 IBM Proxy Statement (2014). 108 IBM Proxy Statement (2014).
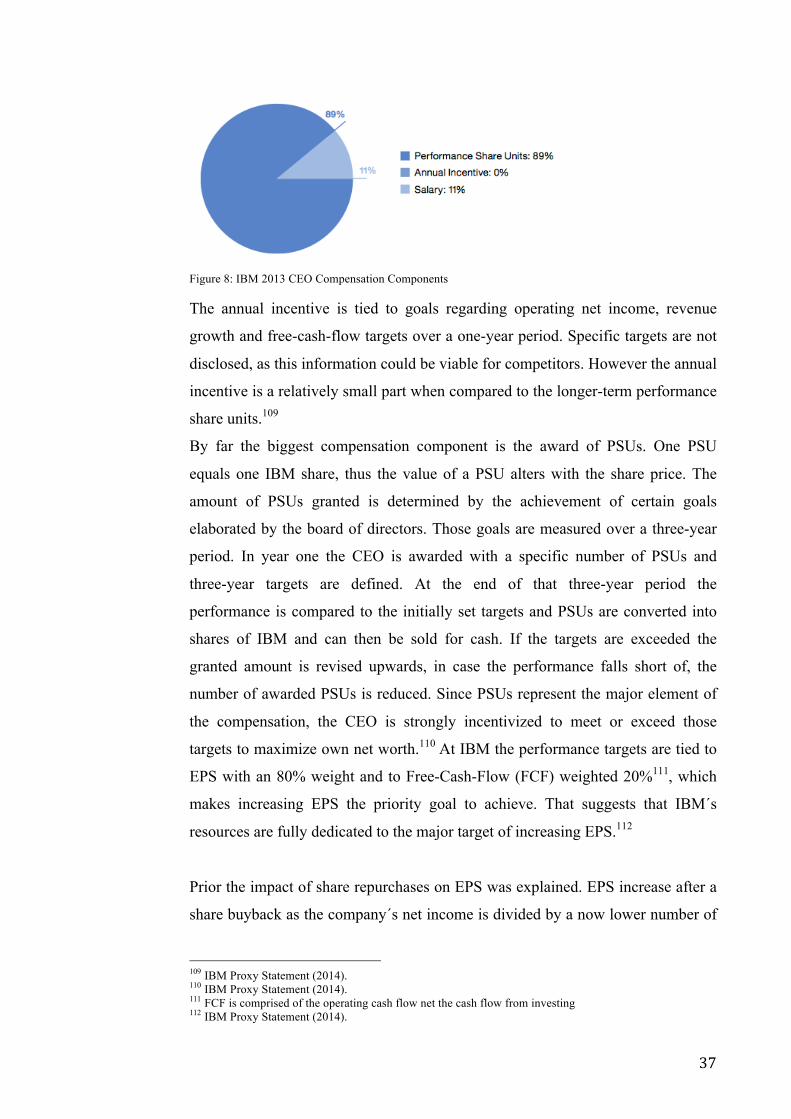
!
! 37!
!Figure 8: IBM 2013 CEO Compensation Components
The annual incentive is tied to goals regarding operating net income, revenue
growth and free-cash-flow targets over a one-year period. Specific targets are not
disclosed, as this information could be viable for competitors. However the annual
incentive is a relatively small part when compared to the longer-term performance
share units.109
By far the biggest compensation component is the award of PSUs. One PSU
equals one IBM share, thus the value of a PSU alters with the share price. The
amount of PSUs granted is determined by the achievement of certain goals
elaborated by the board of directors. Those goals are measured over a three-year
period. In year one the CEO is awarded with a specific number of PSUs and
three-year targets are defined. At the end of that three-year period the
performance is compared to the initially set targets and PSUs are converted into
shares of IBM and can then be sold for cash. If the targets are exceeded the
granted amount is revised upwards, in case the performance falls short of, the
number of awarded PSUs is reduced. Since PSUs represent the major element of
the compensation, the CEO is strongly incentivized to meet or exceed those
targets to maximize own net worth.110 At IBM the performance targets are tied to
EPS with an 80% weight and to Free-Cash-Flow (FCF) weighted 20%111, which
makes increasing EPS the priority goal to achieve. That suggests that IBM´s
resources are fully dedicated to the major target of increasing EPS.112
Prior the impact of share repurchases on EPS was explained. EPS increase after a
share buyback as the company´s net income is divided by a now lower number of
!!!!!!!!!!!!!!!!!!!!!!!!!!!!!!!!!!!!!!!!!!!!!!!!!!!!!!!!109 IBM Proxy Statement (2014). 110 IBM Proxy Statement (2014). 111 FCF is comprised of the operating cash flow net the cash flow from investing 112 IBM Proxy Statement (2014).
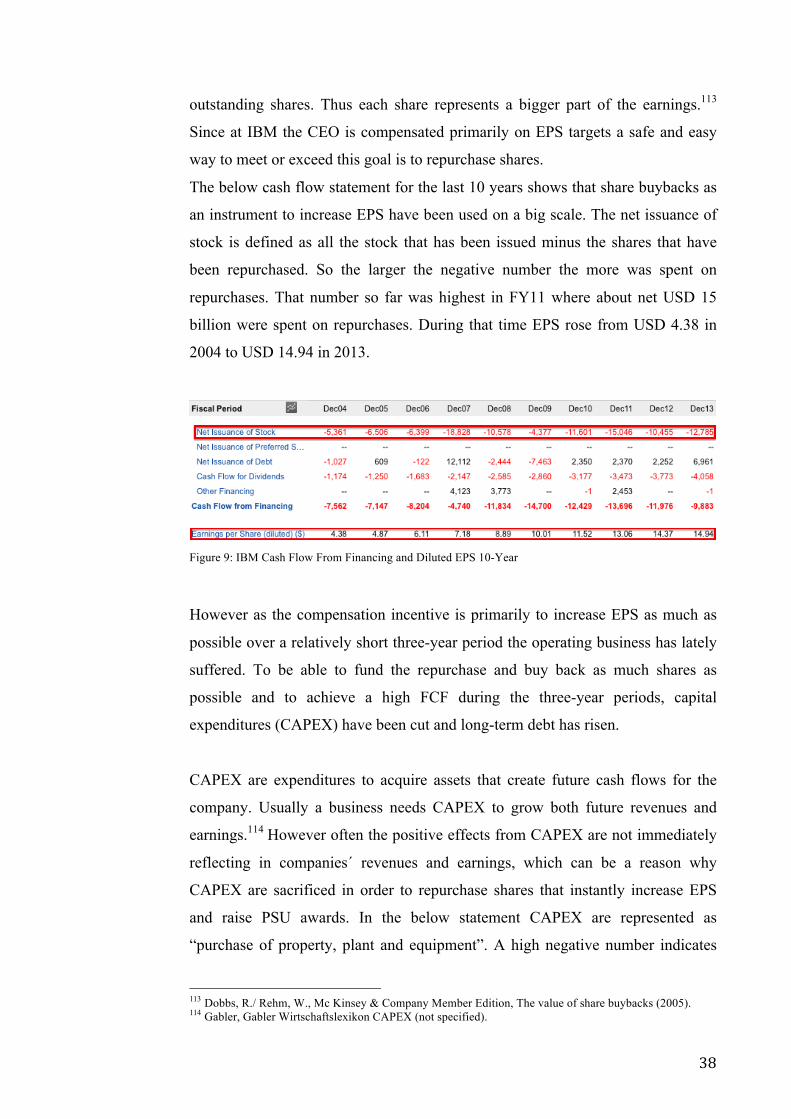
!
! 38!
outstanding shares. Thus each share represents a bigger part of the earnings.113
Since at IBM the CEO is compensated primarily on EPS targets a safe and easy
way to meet or exceed this goal is to repurchase shares.
The below cash flow statement for the last 10 years shows that share buybacks as
an instrument to increase EPS have been used on a big scale. The net issuance of
stock is defined as all the stock that has been issued minus the shares that have
been repurchased. So the larger the negative number the more was spent on
repurchases. That number so far was highest in FY11 where about net USD 15
billion were spent on repurchases. During that time EPS rose from USD 4.38 in
2004 to USD 14.94 in 2013.
!Figure 9: IBM Cash Flow From Financing and Diluted EPS 10-Year
However as the compensation incentive is primarily to increase EPS as much as
possible over a relatively short three-year period the operating business has lately
suffered. To be able to fund the repurchase and buy back as much shares as
possible and to achieve a high FCF during the three-year periods, capital
expenditures (CAPEX) have been cut and long-term debt has risen.
CAPEX are expenditures to acquire assets that create future cash flows for the
company. Usually a business needs CAPEX to grow both future revenues and
earnings.114 However often the positive effects from CAPEX are not immediately
reflecting in companies´ revenues and earnings, which can be a reason why
CAPEX are sacrificed in order to repurchase shares that instantly increase EPS
and raise PSU awards. In the below statement CAPEX are represented as
“purchase of property, plant and equipment”. A high negative number indicates
!!!!!!!!!!!!!!!!!!!!!!!!!!!!!!!!!!!!!!!!!!!!!!!!!!!!!!!!113 Dobbs, R./ Rehm, W., Mc Kinsey & Company Member Edition, The value of share buybacks (2005). 114 Gabler, Gabler Wirtschaftslexikon CAPEX (not specified).
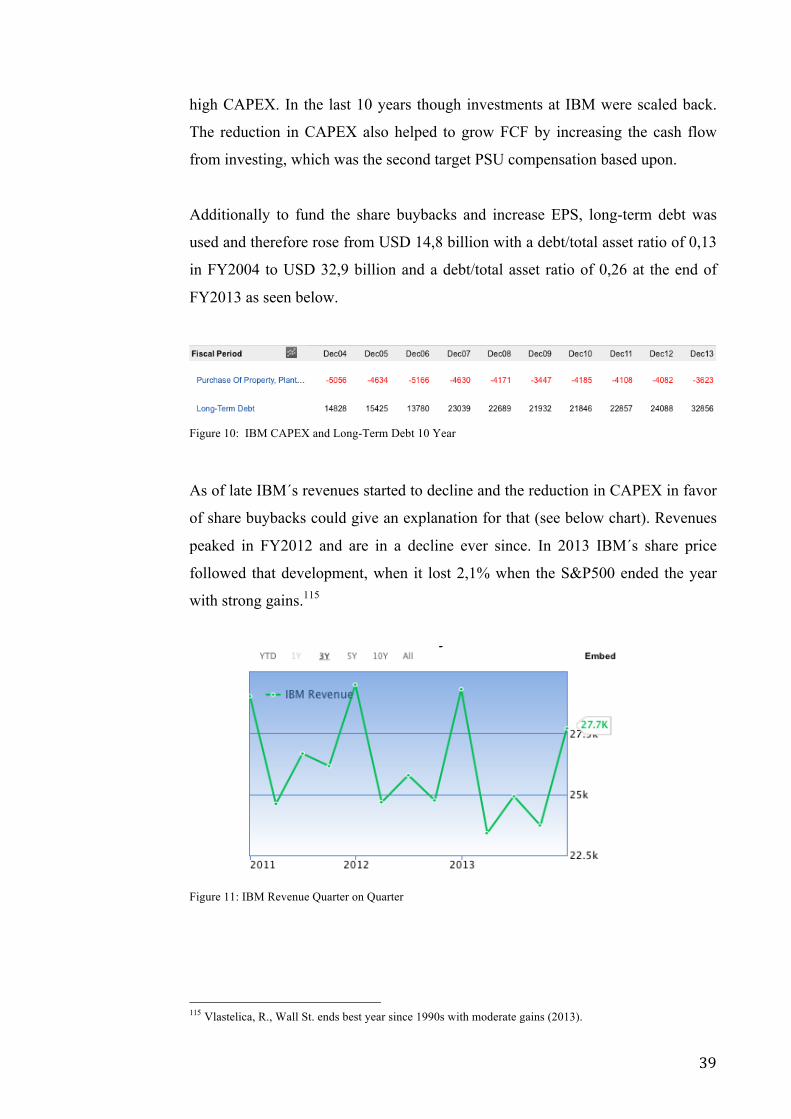
!
! 39!
high CAPEX. In the last 10 years though investments at IBM were scaled back.
The reduction in CAPEX also helped to grow FCF by increasing the cash flow
from investing, which was the second target PSU compensation based upon.
Additionally to fund the share buybacks and increase EPS, long-term debt was
used and therefore rose from USD 14,8 billion with a debt/total asset ratio of 0,13
in FY2004 to USD 32,9 billion and a debt/total asset ratio of 0,26 at the end of
FY2013 as seen below.
!Figure 10: IBM CAPEX and Long-Term Debt 10 Year
As of late IBM´s revenues started to decline and the reduction in CAPEX in favor
of share buybacks could give an explanation for that (see below chart). Revenues
peaked in FY2012 and are in a decline ever since. In 2013 IBM´s share price
followed that development, when it lost 2,1% when the S&P500 ended the year
with strong gains.115
!Figure 11: IBM Revenue Quarter on Quarter
!!!!!!!!!!!!!!!!!!!!!!!!!!!!!!!!!!!!!!!!!!!!!!!!!!!!!!!!115 Vlastelica, R., Wall St. ends best year since 1990s with moderate gains (2013).
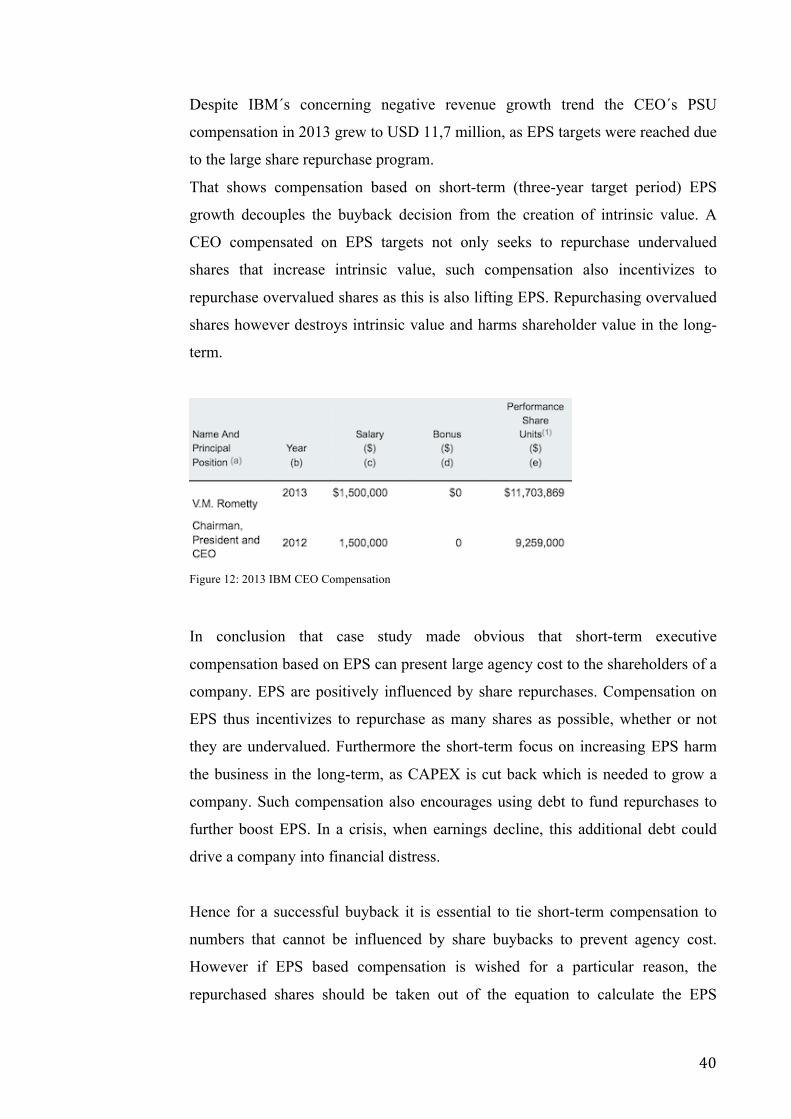
!
! 40!
Despite IBM´s concerning negative revenue growth trend the CEO´s PSU
compensation in 2013 grew to USD 11,7 million, as EPS targets were reached due
to the large share repurchase program.
That shows compensation based on short-term (three-year target period) EPS
growth decouples the buyback decision from the creation of intrinsic value. A
CEO compensated on EPS targets not only seeks to repurchase undervalued
shares that increase intrinsic value, such compensation also incentivizes to
repurchase overvalued shares as this is also lifting EPS. Repurchasing overvalued
shares however destroys intrinsic value and harms shareholder value in the long-
term.
!Figure 12: 2013 IBM CEO Compensation
In conclusion that case study made obvious that short-term executive
compensation based on EPS can present large agency cost to the shareholders of a
company. EPS are positively influenced by share repurchases. Compensation on
EPS thus incentivizes to repurchase as many shares as possible, whether or not
they are undervalued. Furthermore the short-term focus on increasing EPS harm
the business in the long-term, as CAPEX is cut back which is needed to grow a
company. Such compensation also encourages using debt to fund repurchases to
further boost EPS. In a crisis, when earnings decline, this additional debt could
drive a company into financial distress.
Hence for a successful buyback it is essential to tie short-term compensation to
numbers that cannot be influenced by share buybacks to prevent agency cost.
However if EPS based compensation is wished for a particular reason, the
repurchased shares should be taken out of the equation to calculate the EPS
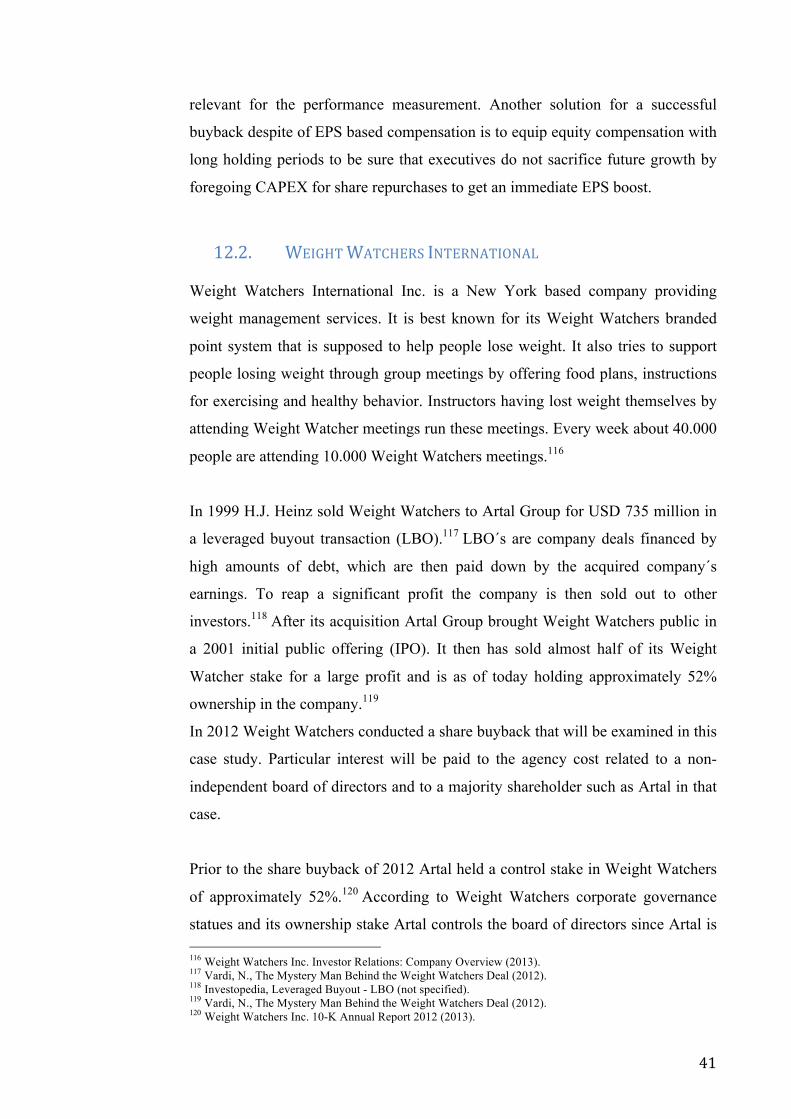
!
! 41!
relevant for the performance measurement. Another solution for a successful
buyback despite of EPS based compensation is to equip equity compensation with
long holding periods to be sure that executives do not sacrifice future growth by
foregoing CAPEX for share repurchases to get an immediate EPS boost.
12.2. WEIGHT!WATCHERS!INTERNATIONAL!
Weight Watchers International Inc. is a New York based company providing
weight management services. It is best known for its Weight Watchers branded
point system that is supposed to help people lose weight. It also tries to support
people losing weight through group meetings by offering food plans, instructions
for exercising and healthy behavior. Instructors having lost weight themselves by
attending Weight Watcher meetings run these meetings. Every week about 40.000
people are attending 10.000 Weight Watchers meetings.116
In 1999 H.J. Heinz sold Weight Watchers to Artal Group for USD 735 million in
a leveraged buyout transaction (LBO).117 LBO´s are company deals financed by
high amounts of debt, which are then paid down by the acquired company´s
earnings. To reap a significant profit the company is then sold out to other
investors.118 After its acquisition Artal Group brought Weight Watchers public in
a 2001 initial public offering (IPO). It then has sold almost half of its Weight
Watcher stake for a large profit and is as of today holding approximately 52%
ownership in the company.119
In 2012 Weight Watchers conducted a share buyback that will be examined in this
case study. Particular interest will be paid to the agency cost related to a non-
independent board of directors and to a majority shareholder such as Artal in that
case.
Prior to the share buyback of 2012 Artal held a control stake in Weight Watchers
of approximately 52%.120 According to Weight Watchers corporate governance
statues and its ownership stake Artal controls the board of directors since Artal is !!!!!!!!!!!!!!!!!!!!!!!!!!!!!!!!!!!!!!!!!!!!!!!!!!!!!!!!116 Weight Watchers Inc. Investor Relations: Company Overview (2013). 117 Vardi, N., The Mystery Man Behind the Weight Watchers Deal (2012). 118 Investopedia, Leveraged Buyout - LBO (not specified). 119 Vardi, N., The Mystery Man Behind the Weight Watchers Deal (2012). 120 Weight Watchers Inc. 10-K Annual Report 2012 (2013).
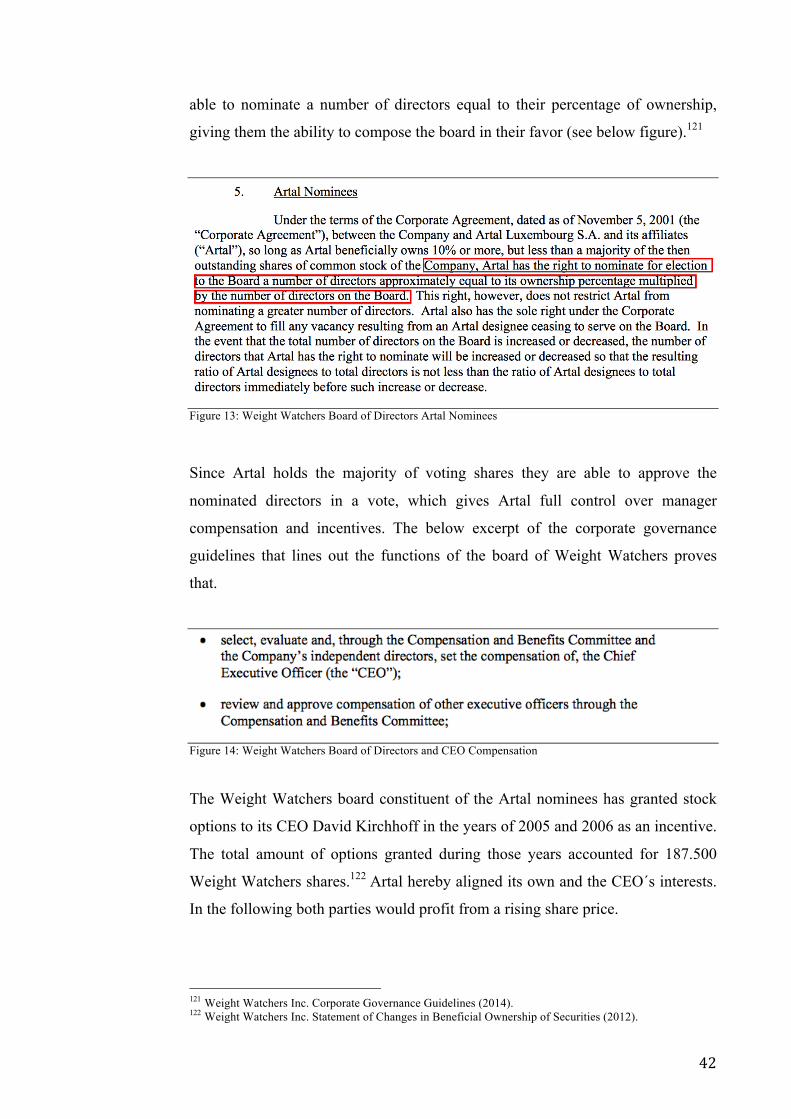
!
! 42!
able to nominate a number of directors equal to their percentage of ownership,
giving them the ability to compose the board in their favor (see below figure).121
!Figure 13: Weight Watchers Board of Directors Artal Nominees
Since Artal holds the majority of voting shares they are able to approve the
nominated directors in a vote, which gives Artal full control over manager
compensation and incentives. The below excerpt of the corporate governance
guidelines that lines out the functions of the board of Weight Watchers proves
that.
!Figure 14: Weight Watchers Board of Directors and CEO Compensation
!The Weight Watchers board constituent of the Artal nominees has granted stock
options to its CEO David Kirchhoff in the years of 2005 and 2006 as an incentive.
The total amount of options granted during those years accounted for 187.500
Weight Watchers shares.122 Artal hereby aligned its own and the CEO´s interests.
In the following both parties would profit from a rising share price.
!
!!!!!!!!!!!!!!!!!!!!!!!!!!!!!!!!!!!!!!!!!!!!!!!!!!!!!!!!121 Weight Watchers Inc. Corporate Governance Guidelines (2014). 122 Weight Watchers Inc. Statement of Changes in Beneficial Ownership of Securities (2012).
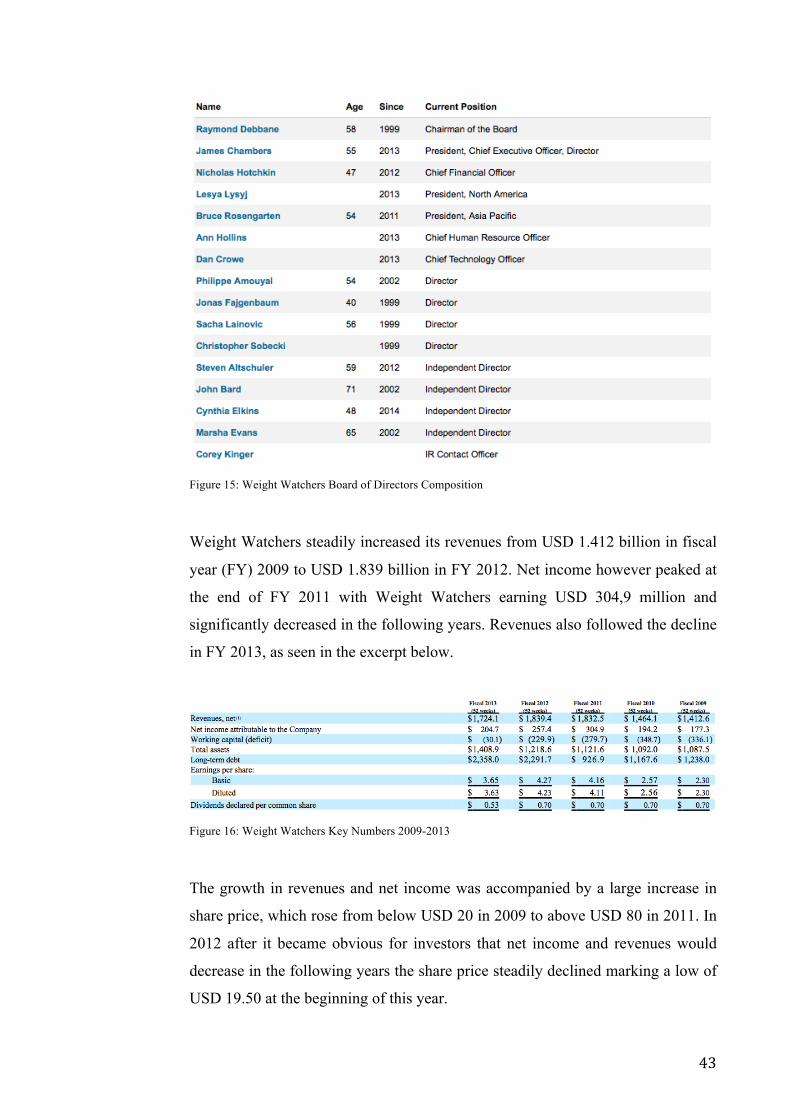
!
! 43!
!Figure 15: Weight Watchers Board of Directors Composition
Weight Watchers steadily increased its revenues from USD 1.412 billion in fiscal
year (FY) 2009 to USD 1.839 billion in FY 2012. Net income however peaked at
the end of FY 2011 with Weight Watchers earning USD 304,9 million and
significantly decreased in the following years. Revenues also followed the decline
in FY 2013, as seen in the excerpt below.
!Figure 16: Weight Watchers Key Numbers 2009-2013
The growth in revenues and net income was accompanied by a large increase in
share price, which rose from below USD 20 in 2009 to above USD 80 in 2011. In
2012 after it became obvious for investors that net income and revenues would
decrease in the following years the share price steadily declined marking a low of
USD 19.50 at the beginning of this year.
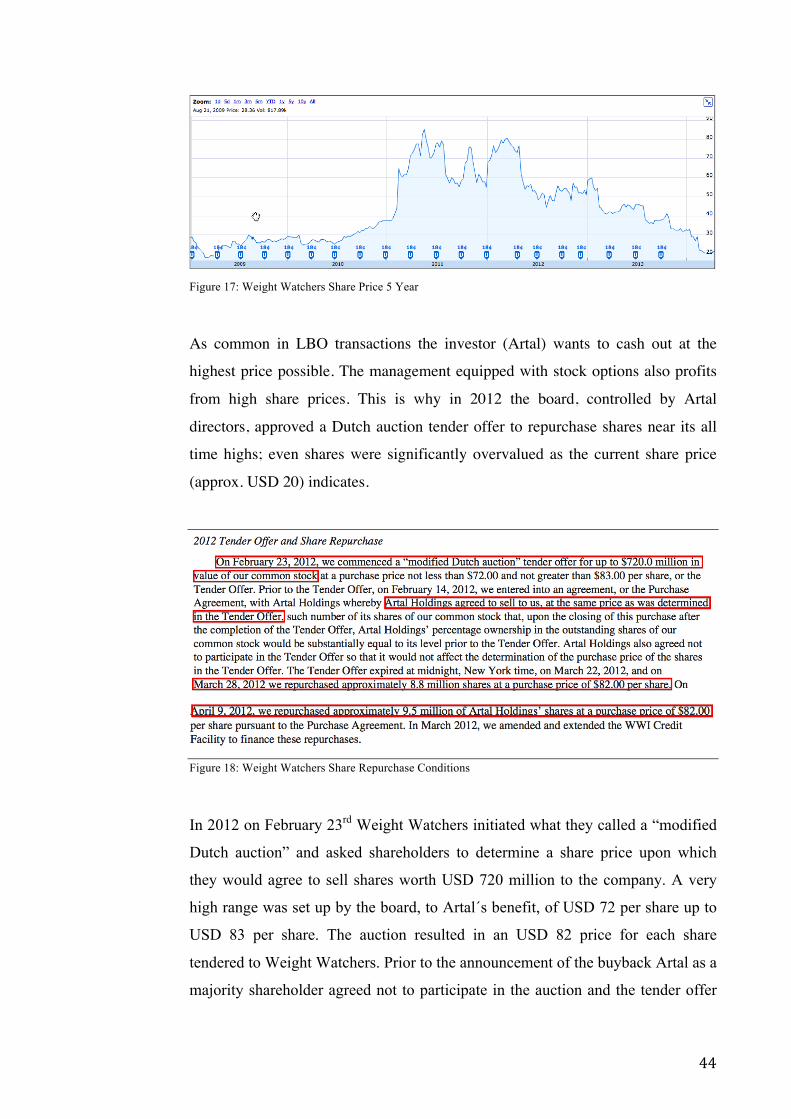
!
! 44!
!Figure 17: Weight Watchers Share Price 5 Year
As common in LBO transactions the investor (Artal) wants to cash out at the
highest price possible. The management equipped with stock options also profits
from high share prices. This is why in 2012 the board, controlled by Artal
directors, approved a Dutch auction tender offer to repurchase shares near its all
time highs; even shares were significantly overvalued as the current share price
(approx. USD 20) indicates.
!Figure 18: Weight Watchers Share Repurchase Conditions
In 2012 on February 23rd Weight Watchers initiated what they called a “modified
Dutch auction” and asked shareholders to determine a share price upon which
they would agree to sell shares worth USD 720 million to the company. A very
high range was set up by the board, to Artal´s benefit, of USD 72 per share up to
USD 83 per share. The auction resulted in an USD 82 price for each share
tendered to Weight Watchers. Prior to the announcement of the buyback Artal as a
majority shareholder agreed not to participate in the auction and the tender offer

!
! 45!
because they did not want to influence the purchase price. Simultaneously
however, the Weight Watchers board agreed to acquire for the same price
determined in the tender offer (USD 82 per share) as much shares from Artal that
they would hold an equal ownership stake in Weight Watchers as prior to the
tender offer, as figure 18 indicates.
Consequently Weight Watchers had to buy back 8.8 million shares for USD 82
each from shareholders other than Artal for a total of about USD 720 Mio.
!"#$"%!!""#$ = 8.8!!"##"$% ∗ $82 = $721,6!!"##"$%
And since they agreed on purchasing as much Artal shares as needed to keep
Artal´s stake in the company at 52%, Weight Watchers had to acquire another 9.5
million shares for USD 82 each costing the company USD 779 million.
!"#$%!!""#$ = 9.5!!"##"$% ∗ $82 = $779!!"##"$%
The total cost for the repurchase therefore is USD 1.500,6 million. Cash and
equivalents on the balance sheet that could be used to fund the buyback accounted
for USD 47,47 million and 2011 free-cash-flow (FCF) was at USD 356,68
million. Together they equaled only USD 404,15 million, by far not sufficient to
cover the total repurchase cost of USD 1,5 billion. Hence Weight Watchers had to
take on debt to be able to finance the buyback, which the Artal controlled board
also acknowledged (figures 19,20).
!"! = !"#$%&'()!!"#ℎ!"#$ + !"#ℎ!!"#$!!"#$!!"#$#%"#&!!"#$%$#$&'
2011!!"! = $401,89!!"##"$% − $45,21!!"##"$% = $!"#,!"!!"##"$%
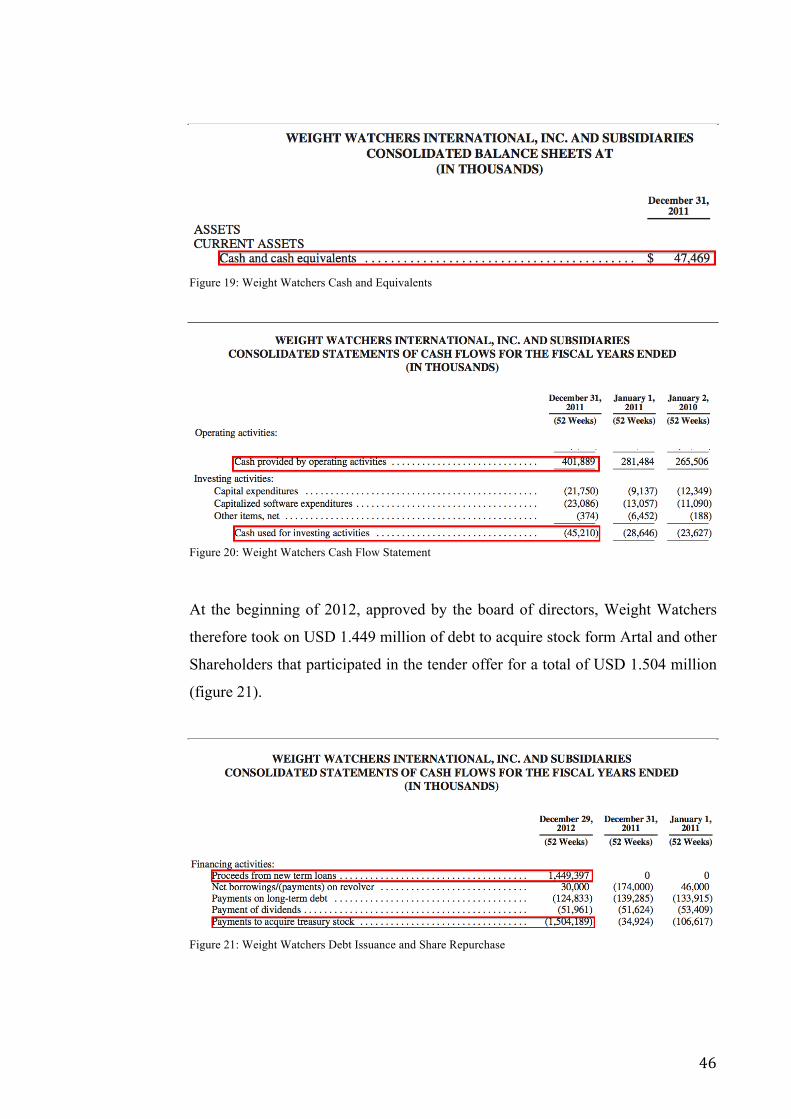
!
! 46!
!Figure 19: Weight Watchers Cash and Equivalents
!
Figure 20: Weight Watchers Cash Flow Statement
At the beginning of 2012, approved by the board of directors, Weight Watchers
therefore took on USD 1.449 million of debt to acquire stock form Artal and other
Shareholders that participated in the tender offer for a total of USD 1.504 million
(figure 21).
!Figure 21: Weight Watchers Debt Issuance and Share Repurchase
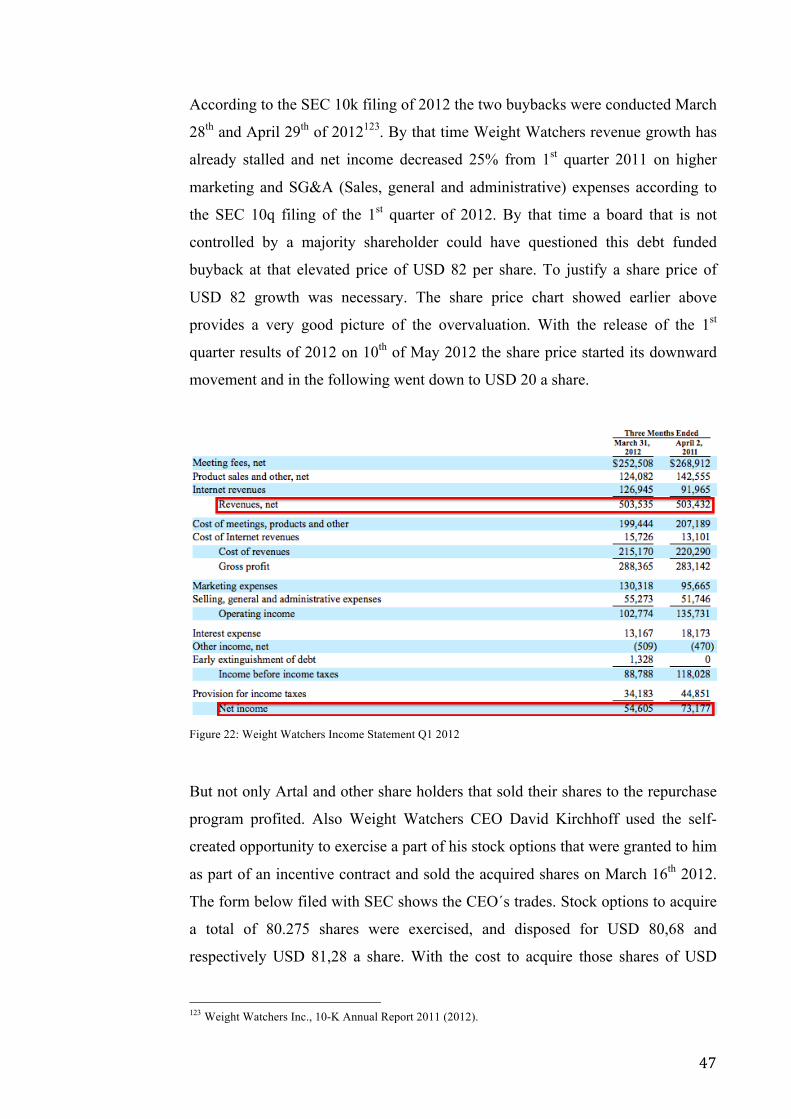
!
! 47!
According to the SEC 10k filing of 2012 the two buybacks were conducted March
28th and April 29th of 2012123. By that time Weight Watchers revenue growth has
already stalled and net income decreased 25% from 1st quarter 2011 on higher
marketing and SG&A (Sales, general and administrative) expenses according to
the SEC 10q filing of the 1st quarter of 2012. By that time a board that is not
controlled by a majority shareholder could have questioned this debt funded
buyback at that elevated price of USD 82 per share. To justify a share price of
USD 82 growth was necessary. The share price chart showed earlier above
provides a very good picture of the overvaluation. With the release of the 1st
quarter results of 2012 on 10th of May 2012 the share price started its downward
movement and in the following went down to USD 20 a share.
!Figure 22: Weight Watchers Income Statement Q1 2012
But not only Artal and other share holders that sold their shares to the repurchase
program profited. Also Weight Watchers CEO David Kirchhoff used the self-
created opportunity to exercise a part of his stock options that were granted to him
as part of an incentive contract and sold the acquired shares on March 16th 2012.
The form below filed with SEC shows the CEO´s trades. Stock options to acquire
a total of 80.275 shares were exercised, and disposed for USD 80,68 and
respectively USD 81,28 a share. With the cost to acquire those shares of USD
!!!!!!!!!!!!!!!!!!!!!!!!!!!!!!!!!!!!!!!!!!!!!!!!!!!!!!!!123 Weight Watchers Inc., 10-K Annual Report 2011 (2012).
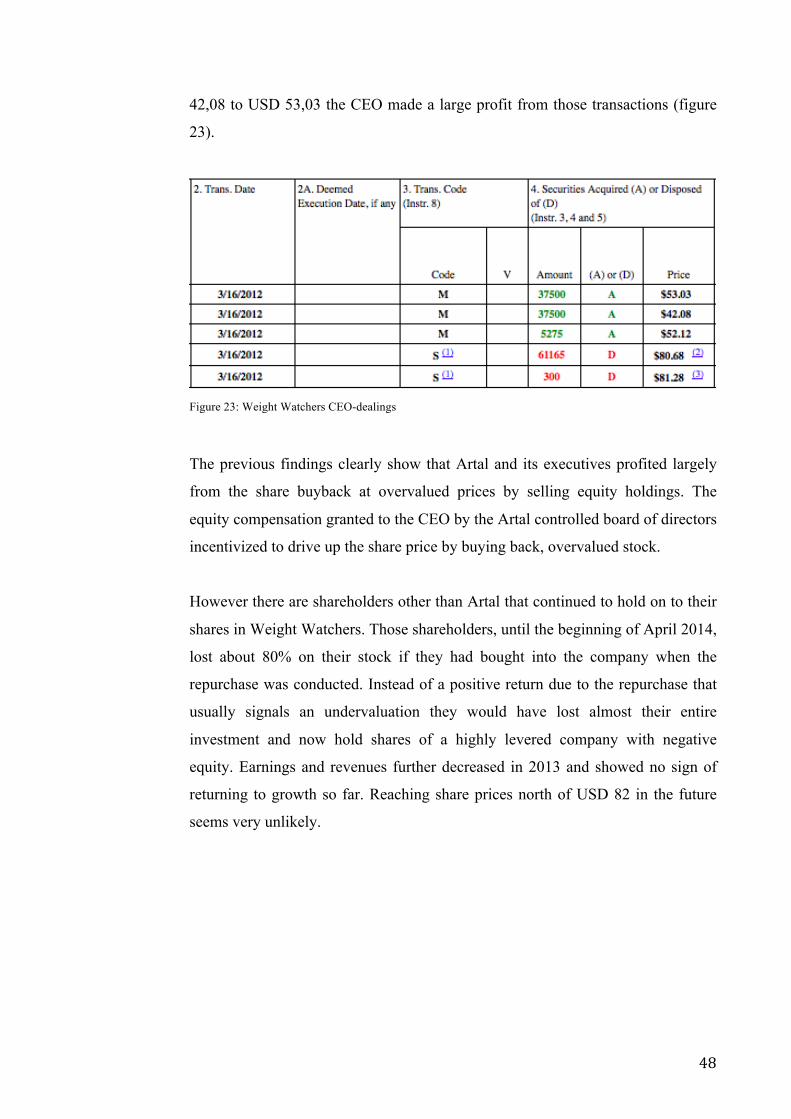
!
! 48!
42,08 to USD 53,03 the CEO made a large profit from those transactions (figure
23).
!Figure 23: Weight Watchers CEO-dealings
The previous findings clearly show that Artal and its executives profited largely
from the share buyback at overvalued prices by selling equity holdings. The
equity compensation granted to the CEO by the Artal controlled board of directors
incentivized to drive up the share price by buying back, overvalued stock.
However there are shareholders other than Artal that continued to hold on to their
shares in Weight Watchers. Those shareholders, until the beginning of April 2014,
lost about 80% on their stock if they had bought into the company when the
repurchase was conducted. Instead of a positive return due to the repurchase that
usually signals an undervaluation they would have lost almost their entire
investment and now hold shares of a highly levered company with negative
equity. Earnings and revenues further decreased in 2013 and showed no sign of
returning to growth so far. Reaching share prices north of USD 82 in the future
seems very unlikely.
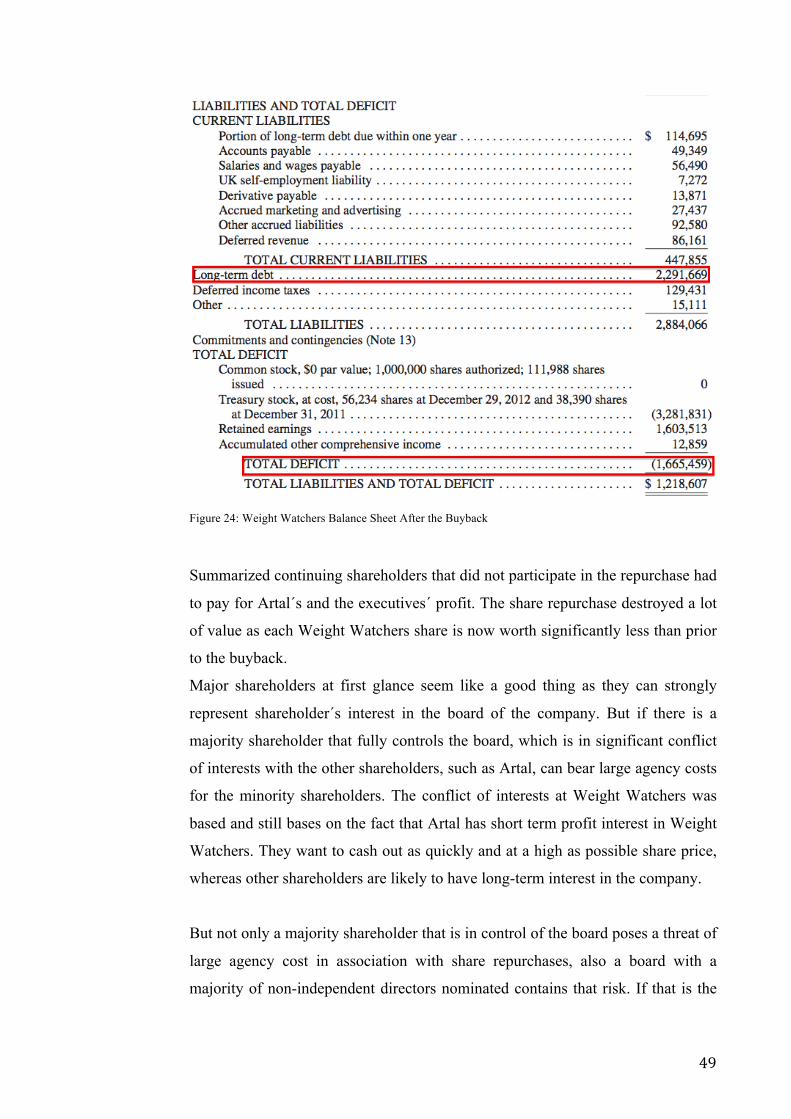
!
! 49!
!Figure 24: Weight Watchers Balance Sheet After the Buyback
Summarized continuing shareholders that did not participate in the repurchase had
to pay for Artal´s and the executives´ profit. The share repurchase destroyed a lot
of value as each Weight Watchers share is now worth significantly less than prior
to the buyback.
Major shareholders at first glance seem like a good thing as they can strongly
represent shareholder´s interest in the board of the company. But if there is a
majority shareholder that fully controls the board, which is in significant conflict
of interests with the other shareholders, such as Artal, can bear large agency costs
for the minority shareholders. The conflict of interests at Weight Watchers was
based and still bases on the fact that Artal has short term profit interest in Weight
Watchers. They want to cash out as quickly and at a high as possible share price,
whereas other shareholders are likely to have long-term interest in the company.
But not only a majority shareholder that is in control of the board poses a threat of
large agency cost in association with share repurchases, also a board with a
majority of non-independent directors nominated contains that risk. If that is the
!
! 50!
case and the board is controlled by a high number of executive directors, that are
both manager and director, the company is very likely to pursue interests of the
executives. For the buyback decision that implies buybacks wouldn´t be used as
an instrument to increase long-term value for the continuing shareholder but to
raise compensation of executives.
Hence for successful buybacks an independent board that has committed itself to
the goal of increasing long-term shareholder value is essential.
12.3. BERKSHIRE!HATHAWAY!
The previous case studies suggested that a non-independent board and incentive
compensation based on per share ratios such as EPS is contradictory to a
successful share buyback.
Berkshire Hathaway, a holding company, makes a good example of how to
extract long-term value for shareholders by buying back stock.
Berkshire Hathaway Inc. is an Omaha, Nebraska based holding company. The
firm holds subsidiaries active in various industries. These include insurance and
reinsurance, transportation, energy utilities, financial, manufacturing and services
and retail businesses. The managers of the Berkshire Hathaway subsidiaries make
operating decisions for the companies they are running. Investment decisions and
decisions on capital allocation for Berkshire Hathaway and its subsidiaries are
made by or after consultation with CEO and chairman of the board and Warren E.
Buffett and Vice Chairman of the board Charles T. Munger.124
Buffett as of July 5th 2013 owns 336.000 common Class A, and 1.567.907
common Class B shares in Berkshire Hathaway giving him a voting power of
34,08% and a 20,5% economic interest in the company (figure 25). Those values
differ as class B shares have inferior voting power when compared to the class A
share (1 class B shares represents 1/1.500th class A share, but 1 class B shares
only has 1/10.000th of the voting rights of a class A share)125. Buffett as the CEO
!!!!!!!!!!!!!!!!!!!!!!!!!!!!!!!!!!!!!!!!!!!!!!!!!!!!!!!!124 Berkshire Hathaway Inc. Annual Report 2013 (2014). 125 Buffett, W. E., Berkshire Class A and Class B Stock (1999).

!
! 51!
of the company holds that many shares, as he was the founder of the partnership
that was Berkshire Hathaway Inc.´s predecessor.126
The market capitalization (CAP) of Berkshire Hathaway, which is shares
outstanding times share price, is about USD 300 billion as of April 10th 2014.
!"# = !ℎ!"#$!!"#$#%&'(&) ∗ !ℎ!"#!!"#$%
!"# = 1.643.613!(!"#$$!!) ∗ $183.212 = $301,13!!"##"$%
According to the current share price of USD 183.212 (Class A) and USD 122,29
(Class B) as of April 15th 2014 the CEO´s personal holdings equal USD 61,75
billion.
!"#$%&'(!!"#$%&'(!!"# = 336.000 ∗ $183.212+ 1.567!!"##"$% ∗ $122,29= $61,75!!"##"$%!
Unlike with the Weight Watchers case this very large holding does not represent a
majority of voting rights (34,08%) and hence prevents the board of directors from
being controlled by a single large shareholder.
!Figure 25: Berkshire Hathaway, Mr. Buffett Personal Holdings
!!!!!!!!!!!!!!!!!!!!!!!!!!!!!!!!!!!!!!!!!!!!!!!!!!!!!!!!126 Livy, J., Warren Buffett: a short biography (2013).
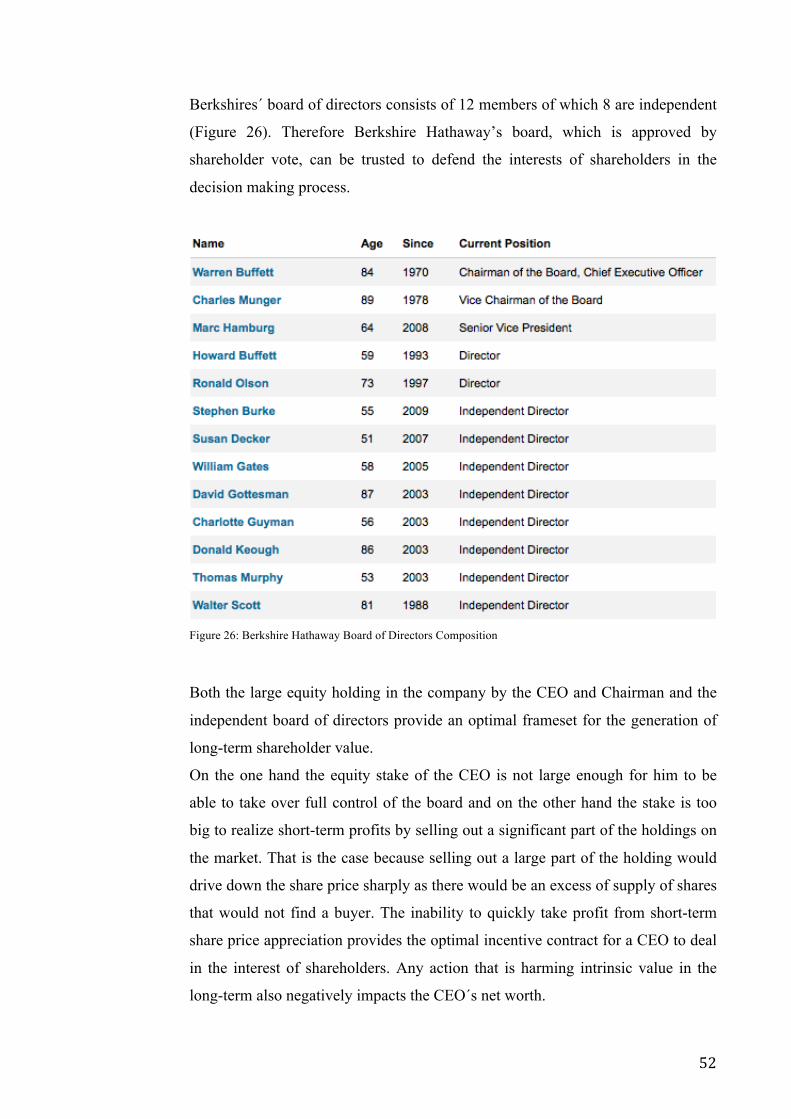
!
! 52!
Berkshires´ board of directors consists of 12 members of which 8 are independent
(Figure 26). Therefore Berkshire Hathaway’s board, which is approved by
shareholder vote, can be trusted to defend the interests of shareholders in the
decision making process.
!Figure 26: Berkshire Hathaway Board of Directors Composition
Both the large equity holding in the company by the CEO and Chairman and the
independent board of directors provide an optimal frameset for the generation of
long-term shareholder value.
On the one hand the equity stake of the CEO is not large enough for him to be
able to take over full control of the board and on the other hand the stake is too
big to realize short-term profits by selling out a significant part of the holdings on
the market. That is the case because selling out a large part of the holding would
drive down the share price sharply as there would be an excess of supply of shares
that would not find a buyer. The inability to quickly take profit from short-term
share price appreciation provides the optimal incentive contract for a CEO to deal
in the interest of shareholders. Any action that is harming intrinsic value in the
long-term also negatively impacts the CEO´s net worth.
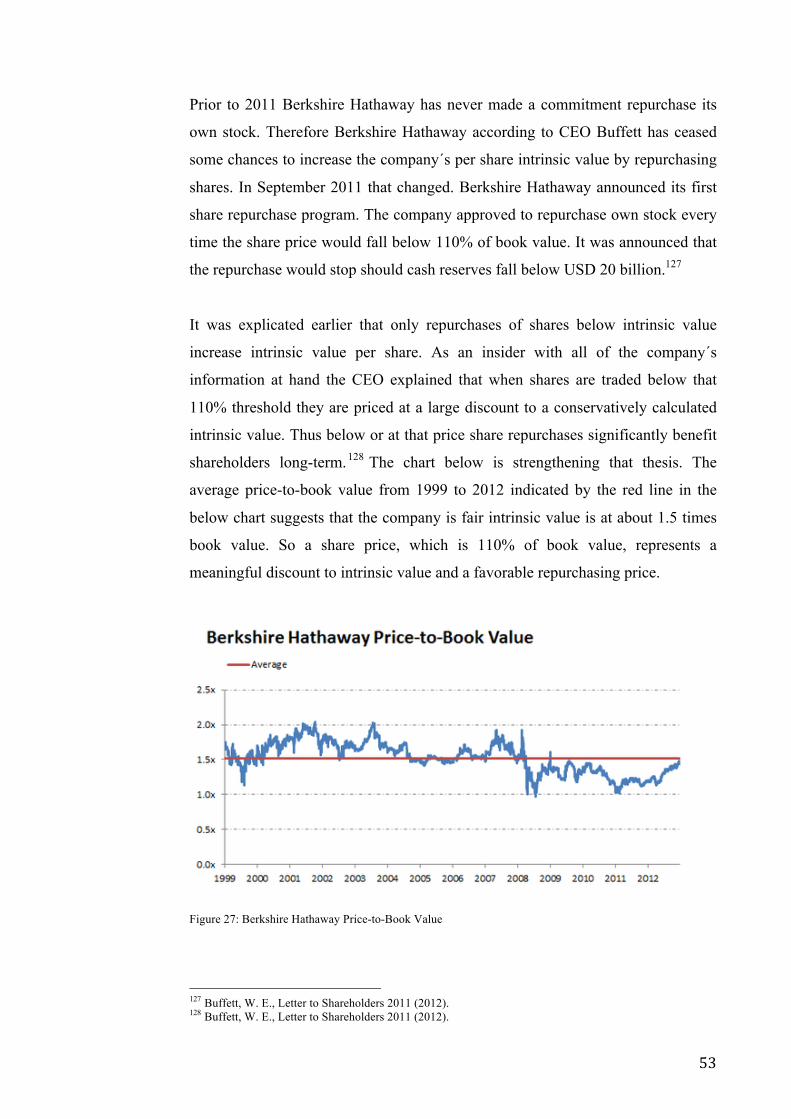
!
! 53!
Prior to 2011 Berkshire Hathaway has never made a commitment repurchase its
own stock. Therefore Berkshire Hathaway according to CEO Buffett has ceased
some chances to increase the company´s per share intrinsic value by repurchasing
shares. In September 2011 that changed. Berkshire Hathaway announced its first
share repurchase program. The company approved to repurchase own stock every
time the share price would fall below 110% of book value. It was announced that
the repurchase would stop should cash reserves fall below USD 20 billion.127
It was explicated earlier that only repurchases of shares below intrinsic value
increase intrinsic value per share. As an insider with all of the company´s
information at hand the CEO explained that when shares are traded below that
110% threshold they are priced at a large discount to a conservatively calculated
intrinsic value. Thus below or at that price share repurchases significantly benefit
shareholders long-term.128 The chart below is strengthening that thesis. The
average price-to-book value from 1999 to 2012 indicated by the red line in the
below chart suggests that the company is fair intrinsic value is at about 1.5 times
book value. So a share price, which is 110% of book value, represents a
meaningful discount to intrinsic value and a favorable repurchasing price.
!Figure 27: Berkshire Hathaway Price-to-Book Value
!!!!!!!!!!!!!!!!!!!!!!!!!!!!!!!!!!!!!!!!!!!!!!!!!!!!!!!!127 Buffett, W. E., Letter to Shareholders 2011 (2012). 128 Buffett, W. E., Letter to Shareholders 2011 (2012).
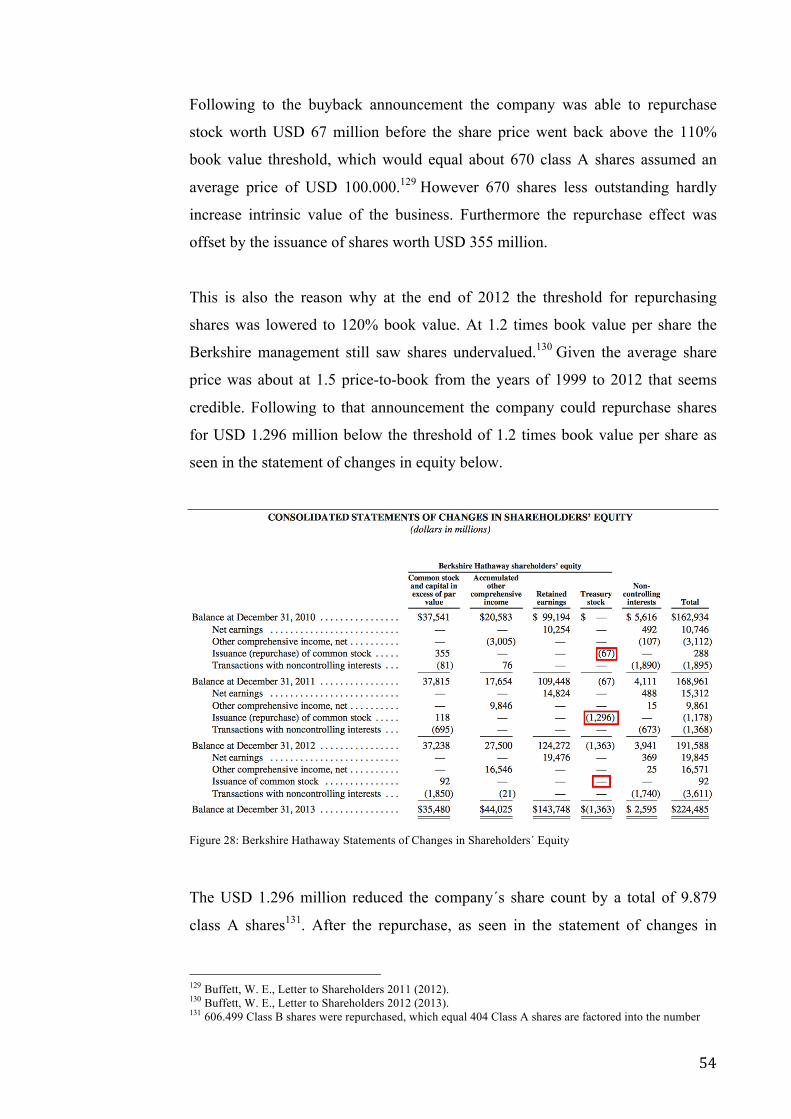
!
! 54!
Following to the buyback announcement the company was able to repurchase
stock worth USD 67 million before the share price went back above the 110%
book value threshold, which would equal about 670 class A shares assumed an
average price of USD 100.000.129 However 670 shares less outstanding hardly
increase intrinsic value of the business. Furthermore the repurchase effect was
offset by the issuance of shares worth USD 355 million.
This is also the reason why at the end of 2012 the threshold for repurchasing
shares was lowered to 120% book value. At 1.2 times book value per share the
Berkshire management still saw shares undervalued.130 Given the average share
price was about at 1.5 price-to-book from the years of 1999 to 2012 that seems
credible. Following to that announcement the company could repurchase shares
for USD 1.296 million below the threshold of 1.2 times book value per share as
seen in the statement of changes in equity below.
!Figure 28: Berkshire Hathaway Statements of Changes in Shareholders´ Equity
The USD 1.296 million reduced the company´s share count by a total of 9.879
class A shares131. After the repurchase, as seen in the statement of changes in
!!!!!!!!!!!!!!!!!!!!!!!!!!!!!!!!!!!!!!!!!!!!!!!!!!!!!!!!129 Buffett, W. E., Letter to Shareholders 2011 (2012). 130 Buffett, W. E., Letter to Shareholders 2012 (2013). 131 606.499 Class B shares were repurchased, which equal 404 Class A shares are factored into the number
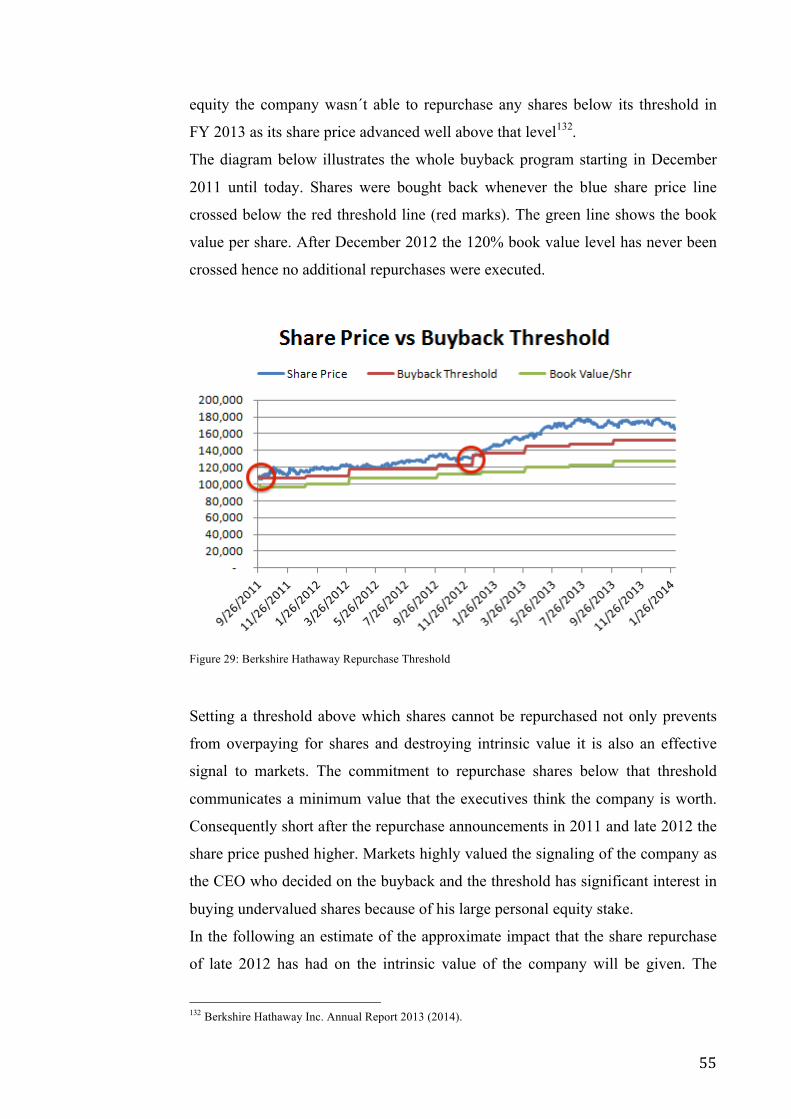
!
! 55!
equity the company wasn´t able to repurchase any shares below its threshold in
FY 2013 as its share price advanced well above that level132.
The diagram below illustrates the whole buyback program starting in December
2011 until today. Shares were bought back whenever the blue share price line
crossed below the red threshold line (red marks). The green line shows the book
value per share. After December 2012 the 120% book value level has never been
crossed hence no additional repurchases were executed.
!Figure 29: Berkshire Hathaway Repurchase Threshold
Setting a threshold above which shares cannot be repurchased not only prevents
from overpaying for shares and destroying intrinsic value it is also an effective
signal to markets. The commitment to repurchase shares below that threshold
communicates a minimum value that the executives think the company is worth.
Consequently short after the repurchase announcements in 2011 and late 2012 the
share price pushed higher. Markets highly valued the signaling of the company as
the CEO who decided on the buyback and the threshold has significant interest in
buying undervalued shares because of his large personal equity stake.
In the following an estimate of the approximate impact that the share repurchase
of late 2012 has had on the intrinsic value of the company will be given. The
!!!!!!!!!!!!!!!!!!!!!!!!!!!!!!!!!!!!!!!!!!!!!!!!!!!!!!!!132 Berkshire Hathaway Inc. Annual Report 2013 (2014).
!
! 56!
calculation is based on the assumption that intrinsic or fair value of the company
is at 1.4 times the company´s book value. This is below the average price of 1.5
times book value from 1999-2012 and thus a conservative number. The annual
report of 2013 shows that 9879 class A shares worth USD 1.296 million have
been repurchased in 2012.133 That makes an average repurchase price of 131.187
per class A share.
!"#$%&#!!"#$%&ℎ!"#!!"#$% = $1.296!!"##"$%! !9879 = 131.187
As the repurchase occurred in December 2012, the book value by end of FY2012
plus the amount spent on the repurchase will be used to calculate the estimated
intrinsic value prior to the buyback. This has to be done as repurchases reduce
shareholders equity and consequently reduce book value. Book value at the end of
FY2012 was USD 191.588 million, after adding back the USD 1.296 million for
repurchases the adjusted book value is USD 192.884 million. In per share
numbers that equals USD 116.807 per share calculated with an average of
1.651.294 Class A shares outstanding in FY2012. 1.651.294 will also be used as
the number of shares outstanding before the buyback. However the number
should be slightly higher as the average outstanding share count of FY2012
includes one month with the reduced shares outstanding after the buyback.134
The company´s estimated intrinsic value conservatively calculated is USD
270.037 million.
!"#$%"&%'!!"#$% = !" ∗ 1,4
!"#$%"&%'!!"#$% = $192.884!!"##"$% ∗ 1,4 = $270.037!
After the repurchase intrinsic value decreases as USD 1.296 million were spent on
the buyback. However as low yielding cash was used to fund the buyback the
interest payments that are foregone do not significantly reduce the businesses
intrinsic value.135 Nevertheless to be on the conservative side the present value of
!!!!!!!!!!!!!!!!!!!!!!!!!!!!!!!!!!!!!!!!!!!!!!!!!!!!!!!!133 Berkshire Hathaway Inc. Annual Report 2013 (2014). 134 Berkshire Hathaway Inc. Annual Report 2013 (2014). 135 Buffett, W. E., Letter to Shareholders 2011 (2012).
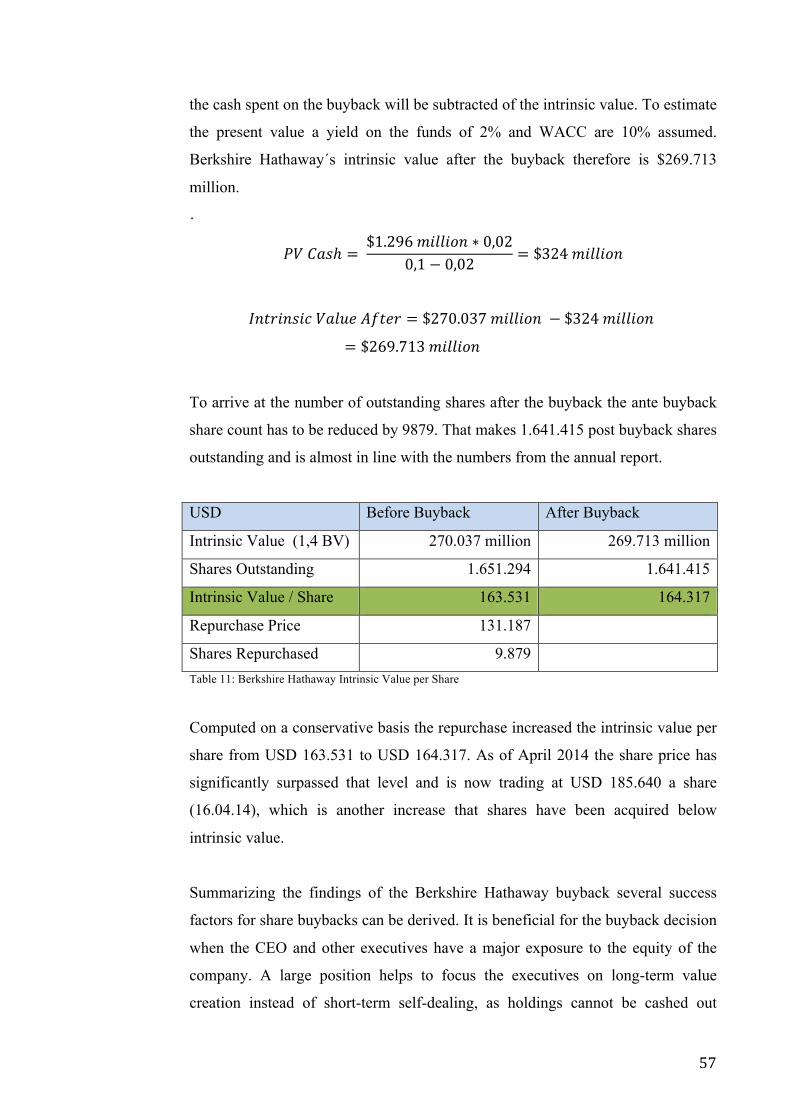
!
! 57!
the cash spent on the buyback will be subtracted of the intrinsic value. To estimate
the present value a yield on the funds of 2% and WACC are 10% assumed.
Berkshire Hathaway´s intrinsic value after the buyback therefore is $269.713
million.
.
!"!!"#ℎ = !$1.296!!"##"$% ∗ 0,020,1− 0,02 = $324!!"##"$%
!"#$%"&%'!!"#$%!!"#$% = $270.037!!"##"$%!− $324!!"##"$%!= $269.713!!"##"$%
To arrive at the number of outstanding shares after the buyback the ante buyback
share count has to be reduced by 9879. That makes 1.641.415 post buyback shares
outstanding and is almost in line with the numbers from the annual report.
USD Before Buyback After Buyback
Intrinsic Value (1,4 BV) 270.037 million 269.713 million
Shares Outstanding 1.651.294 1.641.415
Intrinsic Value / Share 163.531 164.317
Repurchase Price 131.187
Shares Repurchased 9.879 Table 11: Berkshire Hathaway Intrinsic Value per Share
!Computed on a conservative basis the repurchase increased the intrinsic value per
share from USD 163.531 to USD 164.317. As of April 2014 the share price has
significantly surpassed that level and is now trading at USD 185.640 a share
(16.04.14), which is another increase that shares have been acquired below
intrinsic value.
Summarizing the findings of the Berkshire Hathaway buyback several success
factors for share buybacks can be derived. It is beneficial for the buyback decision
when the CEO and other executives have a major exposure to the equity of the
company. A large position helps to focus the executives on long-term value
creation instead of short-term self-dealing, as holdings cannot be cashed out
!
! 58!
quickly. An alternative to a very large direct stake in the equity would be the
award of RSUs or ESOs equipped with selling restrictions of several years (more
than 5), which would also incentivize managers to pursue repurchases that
increase the firms´ intrinsic value and consequently increase the share price.
Another finding is that the holders of the large equity stake should not have total
control of the board. Berkshire Hathaway has a mostly independent board of
directors, which can assess the management decisions in favor of all shareholders.
Such a board can compensate the management adequately in order to pursue long-
term value creation (e.g. awarding RSUs or ESOs with long holding periods) or it
can hinder the management from proceeding with repurchases of overvalued stock
and other value destroying activities.
Beneficial and very helpful for the repurchase decision is the determination of a
threshold above which shares cannot be repurchased anymore. The management
should have a clear opinion on what its company is worth. It therefore should tie
the repurchase decision closely to an appropriate ratio that best reflects the value
of the business. Price-to-book is a telling ratio for holding companies, other
companies would fare better with different ratios such as P/E. Anytime the ratio
threshold is undercut shares should be repurchased. By that the management
would make sure that every time shares are repurchased intrinsic value is
increased. Such a repurchase tied to a threshold is also an effective signal to
markets as it sets a floor to the share price. The firm communicates it is worth at
least the amount at which it starts repurchasing shares. Executives holding large
equity positions enhance the strength of that signal, as they would suffer along
with other shareholders from bad buyback decisions.
13. RESULTS!AND!CONCLUSIONS!
The three case studies strengthen the significance of the elaborated factors of
success for share repurchases.
This paper developed several main drivers for successful share repurchases.
Critical is an independent board that freely determines management compensation
and monitors behavior, executive compensation has to incentivize long-term value
creation and should not be increasable by share repurchases. Additionally a
majority shareholder that has differing interests from the other owners of a
!
! 59!
company hinders the successful execution of share repurchases. Ultimately to
further prevent an acquisition of overvalued stock setting thresholds, tied to ratios
reflecting the company value, above which shares do not qualify for a repurchase
benefits the buyback decision and effectively communicates a minimum company
value to the markets.
The findings of this paper provide strong evidence whether or not future share
repurchase programs create long-term value for shareholders. Assuming a
company, which initiates a share repurchase, respects all of the above success
factors chances are high that shareholder value increases in the long-term.
However if none of those factors prevail at company that buys back its equity,
long-term shareholders should be aware of the high risk of an unfavorable
outcome and are advised to critically question the repurchase decision.
!
! 60!
14. BIBLIOGRAPHY!!
Literature:
Allen, F. & Michaely, R. 2002. Payout Policy.
http://fic.wharton.upenn.edu/fic/papers/01/0121.pdf (Accessed 10.04.2014).
Amromin, G., Harrison, P., Liang, N., et al. 2005. How Did the 2003 Dividend
Tax Cut Affect Stock Prices and Corporate Payout Policy? Finance and Economics Discussion Series (Online), http://www.federalreserve.gov/pubs/feds/2005/200557/200557pap.pdf (Accessed 29.04.2014).
Apple Inc. 2013. Apple Inc., 10-K Annual Report 2013.
http://investor.apple.com/secfiling.cfm?filingID=1193125C13C416534&CIK=320193 (Accessed 28.11.2013).
Apple Inc. 2014. Apple Press Info: Apple Expands Capital Return Program to
Over $130 Billion. http://www.apple.com/pr/library/2014/04/23AppleCExpandsCCapitalCReturnCProgramCtoCOverC130CBillion.html (Accessed 29.04.2014).
Barth, M. E., Elliott, J. A. & Finn, M. W. 1999. Market rewards associated with
patterns of increasing earnings. Journal of Accounting Research, 37, 387-413.
Berkshire Hathaway Inc. 2014. Berkshire Hathaway Inc. Annual Report 2013.
http://www.berkshirehathaway.com/2013ar/2013ar.pdf (Accessed 14.04.2014).
Berman, D. K. 2014. Does IBM Love or Hate Itself? The Wallstreet Journal.
(Online), http://online.wsj.com/news/articles/SB10001424052702304027204579334081811064124 (Accessed 18.04.2014).
Blieffert, C. 2008. Der Aktienrückkauf aus empirischer Sicht - Eine Analyse der Kurseffekte mit der Signal- und Free Cash Flow Hypothese für den deutschen Kapitalmarkt, Saarbrücken, VDM Verlag Dr. Müller.
Brav, A., Graham, J. R., Harvey, C. R., et al. 2005. Payout policy in the 21st
century. Tuck Contemporary Corporate Finance Issues III Conference Paper (Online), http://papers.ssrn.com/sol3/papers.cfm?abstract_id=571046 (Accessed 10.12.13).
Buffett, W. E. 1999. Comparative Rights and Relative prices of Berkshire Class A
and Class B Stock. http://www.berkshirehathaway.com/compab.pdf (Accessed 14.04.14).
!
! 61!
Buffett, W. E. 2012. Berkshire Hathaway Inc. Letter to Shareholders 2011.
http://www.berkshirehathaway.com/letters/2011ltr.pdf (Accessed 11.12.13).
Buffett, W. E. 2013. Berkshire Hathawy Inc. Letter to Shareholders 2012.
http://www.berkshirehathaway.com/letters/2012ltr.pdf (Accessed 11.12.13).
Buhl, K. 2011. Kennzahlen: Der Return on Equity (ROE).
http://www.investorCverlag.de/valueCanalyse/grundlagenCderCfundamentalanalyse/kennzahlenCderCreturnConCequityCroe/109101632/ (Accessed 30.04.2014).
Copeland, T. E., Weston, J. F. & Shastri, K. 2008. Finanzierungstheorie und
Unternehmenspolitik - Konzepte der kapitalmarktorientierten Unternehmensfinanzierung, 4, München.
Damodaran, A. 2002. Corporate Finance: Capital Structure and Financing
Decisions. http://people.stern.nyu.edu/adamodar/pdfiles/country/Brcapstr.pdf (Accessed 29.04.2014).
Damodaran, A. 2003. The Debt-Equity Trade Off: The Capital Structure
Decision. http://people.stern.nyu.edu/adamodar/pdfiles/ovhds/ch7.pdf (Accessed 27.04.2014).
De la Merced, M. J. & Hardy, Q. 2013. Long Battle for Dell Ends in Victory for
Founder. The New York Times (Online), http://dealbook.nytimes.com/2013/09/12/dellCshareholdersCapproveC24C9CbillionCbuyout/?_php=true&_type=blogs&_r=0 (Accessed 26.04.2014).
Demos, T., Russolillo, S. & Jarzemsky, M. 2013. Firms Send Record Cash Back
to Investors. The Wallstreet Journal. (Online), http://online.wsj.com/news/articles/SB10001424127887324034804578346772977321576 (Accessed 28.11.13).
Dobbs, R. & Rehm, W. 2005. The value of share buybacks. Mc Kinsey &
Company Member Edition (Online), http://www.uic.edu/classes/actg/actg516rtr/Readings/Markets/The!value!of!share!buybacks.htm (Accessed 29.11.13).

!
! 62!
Earnst and Young LLP. 2013. E&Y, Financial reporting developments A comprehensive guide: Earnings per share. http://www.google.de/url?sa=t&rct=j&q=&esrc=s&source=web&cd=17&ved=0CG4QFjAGOAo&url=http%3A%2F%2Fwww.ey.com%2Fpublication%2Fvwluassetsdld%2Ffinancialreportingdevelopments_bb1971_earningspershare_17october2013%2F%24file%2Ffinancialreportingdevelopments_bb1971_earningspershare_17october2013.pdf%3FOpenElement&ei=LgRdU738EsbPtAa9_YGABA&usg=AFQjCNFyCLskoX1NnQovjpFbdM8wLiFjlQ&sig2=DCAPcEmg0QTyBgNRT_MFmg (Accessed 27.04.2014).
Eisenhardt, K. M. 1989. Agency Theory: An Assessment and Review. Academy
of Management Review. , 14, 57-74. Gabler. not specified. Gabler Wirtschaftslexikon CAPEX.
http://wirtschaftslexikon.gabler.de/Archiv/569814/capexCv1.html (Accessed 29.04.2014).
Gartzke, C., Hedemann, K. & Schütt-Schnoor, K. 2013. Methoden der
Unternehmensbewertung im Vergleich. http://www.uniChamburg.de/fachbereicheCeinrichtungen/fb03/iwp/rut/Prasentation6.pdf (Accessed 13.03.2014).
Google. not specified. Google Finance.
http://www.google.com/finance?ei=409iU4ibBMSowAOFZA (Accessed 01.05.2014).
Graham, B. 2005. Intelligent Investieren, 6, München, Finanz Buch Verlag. Grullon, G. & Michaely, R. 2002. Dividends, Share Repurchases, and the
Substitution Hypothesis. Journal of Finance, 57, 1649-1648. Harjani, A. 2013. Apple now hoards 10% of US corporate cash (Online). CNBC.
http://www.cnbc.com/id/101079261 (Accessed 28.11.13). Howell, R. 2013. The Two Most-Important Words for a CEO: Intrinsic Value.
The Wallstreet Journal. (Online), http://blogs.wsj.com/experts/2013/11/25/theCtwoCmostCimportantCwordsCforCaCceoCintrinsicCvalue/ (Accessed 11.12.13).
Hribar, P., Jenkins, N. T. & Johnson, W. B. 2006. Stock Repurchases as an
Earnings Management Device. Journal of Accounting and Economics, 41, 3-27.
International Business Machines Corporation. 2014. IBM Corp., Annual Report
2013. http://www.ibm.com/annualreport/2013/bin/assets/2013_ibm_annual.pdf (Accessed 26.04.2014).

!
! 63!
International Business Machines Corp. 2014. IBM Inc. Notice of 2014 Annual Meeting and Proxy Statement. http://www.ibm.com/annualreport/2013/bin/assets/2014_ibm_proxy.pdf (Accessed 29.04.2014).
Investopedia. 2009. What happens when a company buys back its shares? ,
http://www.investopedia.com/ask/answers/05/retiredstock.asp (Accessed 26.04.2014).
Investopedia. not specified. Leveraged Buyout - LBO.
http://www.investopedia.com/terms/l/leveragedbuyout.asp (Accessed 20.03.2014).
Jagannathan, M., Stephens, C. P. & Weisbach, M. S. 2000. Financial flexibility
and the choice between dividends and stock repurchases. Journal of Financial Economics, 57, 355-384.
Jolls, C. 1998. Stock Repurchases and Incentive Compensation.
http://www.nber.org/papers/w6467.pdf?new_window=1 (Accessed 26.03.2014).
Lahart, J. 2010. U.S. Firms Build Up Record Cash Piles. The Wallstreet Journal.
(Online), http://online.wsj.com/news/articles/SB10001424052748704312104575298652567988246 (Accessed 27.11.2013).
Larcker, D. F. 2011. Board of Directors: Duties & Liabilities.
http://www.google.de/url?sa=t&rct=j&q=&esrc=s&source=web&cd=8&ved=0CJIBEBYwBw&url=http%3A%2F%2Fwww.gsb.stanford.edu%2Fsites%2Fdefault%2Ffiles%2Fdocuments%2F03.Board!Duties.pdf&ei=TnFeU_3PJMONtAayi4GQBg&usg=AFQjCNHeuI9FitT23DJj7C3IYx617Fturw&sig2=jQS5oe3AU_04J_OD0I5grg&bvm=bv.65397613,d.Yms (Accessed 28.04.2014).
Little, K. not specified. Understanding Book Value.
http://stocks.about.com/od/evaluatingstocks/a/bv.htm (Accessed 30.04.2014).
Livy, J. 2013. Warren Buffett: a short biography.
http://www.buffettsecrets.com/warrenCbuffettCbiography.htm (Accessed 29.04.2014).
Miller, M. H. & Modigliani, F. 1961. Dividend Policy, Growth, and the Valuation
of Shares. Journal of Business, 34, 411-433. Modigliani, F. & Miller, M. H. 1958. The Cost of Capital, Corporate Finance and
the Theory of Investment. American Economic Review, XLVIII, 291-296.
!
! 64!
Neus, W. 2009. Einführung in die Betriebswirtschaftslehre aus institutionenökonomischer Sicht, 6, Tübingen.
OECD. 2012. Board Member Nomination and Election. OECD Publishing
(Online), http://www.oecd.org/daf/ca/BoardMemberNominationElection2012.pdf (Accessed 07.04.2014).
Schoenenberger, C. R. 2013. Scarred by Financial Crisis, U.S. Companies
Continue to Hoard Cash. The Wallstreet Journal. (Online), http://online.wsj.com/news/articles/SB10001424127887323419604578573881623377200 (Accessed 28.11.2013).
Shleifer, A. & Vishny, R. W. 1997. A Survey of Corporate Governance. Journal
of Finance, 52, 737-783. Skadden. 2013. Share Repurchases. Corporate Finance Alert (Online),
http://www.skadden.com/newsletters/Corporate_Finance_Alert_Share_Repurchases.pdf (Accessed 29.04.2014).
Skinner, D. J. & Sloan, R. G. 1999. Earnings Surprises, Growth Expectations, and
Stock Returns or Don’t Let an Earnings Torpedo Sink Your Portfolio. http://papers.ssrn.com/sol3/papers.cfm?abstract_id=172060 (Accessed 27.04.2014).
Summa, J. 2009. Employee Stock Options. http://www.investopedia.com/university/employeeCstockCoptionsCeso/ (Accessed 22.03.14).
S&P Dow Jones Indices. 2014. Press Release: S&P 500 Stock Buybacks Up 19%
in 2013. http://www.cnbc.com/id/101526856 (Accessed 24.04.2014). Tax Foundation.org. 2013. Tax Foundation, Federal Capital Gains Tax Rates,
1988-2013. http://taxfoundation.org/article/federalCcapitalCgainsCtaxCratesC1988C2013 (Accessed 30.04.2014).
Value-Aktien. 2012. Aktienrückkäufe aus Sicht der Aktionäre.
http://valueaktien.wordpress.com/2012/12/20/aktienruckkaufeCausCsichtCderCaktionare/ (Accessed 30.04.2014).
Valuewalk. 2013. Corporate Governance: USA Versus Europe.
http://www.valuewalk.com/2013/01/corporateCgovernanceCusaCversusCeurope/ (Accessed 07.04.2014).
!
! 65!
van der Wijst, N. 2013. Agency theory and corporate governance. http://www.google.de/url?sa=t&rct=j&q=&esrc=s&source=web&cd=1&ved=0CDUQFjAA&url=http%3A%2F%2Fwww.cambridge.org%2Fve%2Fdownload_file%2F789244%2F&ei=Oig3U46SO8XUtQbW1oH4BQ&usg=AFQjCNGxagGZZwdRblwKOmXuJhI47qKcpA&sig2=VPXGAiBqlqLfpA10LggKKw&bvm=bv.63808443,d.Yms (Accessed 29.03.2014).
Vardi, N. 2012. The Mystery Man Behind Weight Watchers And The Private
Equity Deal Of The Century. http://www.forbes.com/sites/nathanvardi/2012/09/04/theCmysteryCmanCbehindCweightCwatchersCandCtheCprivateCequityCdealCofCtheCcentury/ (Accessed 09.04.2014).
Vermaelen, T. 2005. Share Repurchases. Foundations and Trends in Finance, 1,
171-268. Villamil, A. P. 2012. The Modigliani-Miller Theorem.
http://www.econ.uiuc.edu/~avillami/courseCfiles/PalgraveRev_ModiglianiMiller_Villamil.pdf (Accessed 09.03.2014).
Vlastelica, R. 2013. Wall St. ends best year since 1990s with moderate gains.
http://www.reuters.com/article/2013/12/31/usCmarketsCstocksCidUSBRE9BT0D720131231 (Accessed 18.04.2014).
Voss, J. 2012. Why do Firms Repurchase Stock? Major Themes in Economics,
Spring 2012, 55-75. Weight Watchers International Inc. 2012. Weight Watchers Inc. Statement of
Changes in Beneficial Ownership of Securities. http://google.brand.edgarConline.com/displayfilinginfo.aspx?FilingID=8495760C1147C13478&type=sect&TabIndex=2&companyid=69668&ppu=%2fdefault.aspx%3fsym%3dWTW (Accessed 20.02.2014).
Weight Watchers International Inc. 2012. Weight Watchers Inc., 10-K Annual
Report 2011. http://www.weightwatchersinternational.com/phoenix.zhtml?c=130178&p=irolCreportsAnnual (Accessed 29.04.2014).
Weight Watchers International Inc. 2013. Weight Watchers Inc. 10-K Annual
Report 2012. http://www.weightwatchersinternational.com/phoenix.zhtml?c=130178&p=irolCreportsAnnual (Accessed 09.04.2014).
Weight Watchers International Inc. 2013. Weight Watchers Inc. Investor
Relations: Company Overview. http://www.weightwatchersinternational.com/phoenix.zhtml?c=130178&p=irolCIRHome (Accessed 09.04.2014).

!
! 66!
Weight Watchers International Inc. 2014. Weight Watchers Inc. Corporate Governance Guidelines. http://media.corporateCir.net/media_files/nys/wtw/corp_gov/governance_guidelines.pdf (Accessed 10.04.2014).
Weil, R., Schipper, K. & Francis, J. 2012. Financial Accounting: An Introduction
to Concepts, Methods and Uses, Mason, Ohio, Cengage Learning. Wells Fargo & Co. 2013. Wells Fargo, Tax Treatment of Dividend Income.
https://http://www.wellsfargoadvisors.com/marketCeconomy/financialCarticles/investing/dividendCincomeCtax.htm (Accessed 30.04.2014).
Weisbenner, S. J. 2000. Corporate Share Repurchases in the 1990s: What Role Do
Stock Options Play. http://papers.ssrn.com/sol3/papers.cfm?abstract_id=234164 (Accessed 25.03.2014).
Figures Figure 1: Payout Instruments, Standard and Poor’s. 2012. Dividends And
Buybacks Soar. http://www.investors.com/image/A1div_131218.png.cms (Accessed 29.04.2014).
Figure 2: IBM Treasury Stock. IBM. 2014. IBM Annual Report 2013. Figure 3: WACC and Debt/Equity Ratio, Compiled by the author Figure 4: Agency Theory Illustration. Wikipedia.
http://en.wikipedia.org/wiki/Principal–agent_problem (Accessed 29.04.2014)
Figure 5: Manager Self-Dealing. Compiled by the author Figure 6: IBM Shares Outstanding. Rizzi Capital. 2013. IBM Shrinks - Analysts
Hate It. http://seekingalpha.com/article/1876891-ibm-shrinks-analysts-hate-itnding. (Accessed 29.04.2014).
Figure 7: IBM vs. S&P500 5-Year. Google Finance.
http://www.google.com/finance?q=ibm&ei=vAxgU6DlPKiAwAPF3AE (Accessed 29.04.2014).
Figure 8: IBM 2013 CEO Compensation Components. IBM. 2014. IBM Notice of
2014 Annual Meeting and Proxy Statement. http://www.ibm.com/annualreport/2013/bin/assets/2014_ibm_proxy.pdf (Accessed 29.04.2014).
Figure 9: IBM Cash Flow from Financing and Diluted EPS 10-Year. Gurufocus.
http://www.gurufocus.com/financials/IBM (Accessed 29.04.2014).
!
! 67!
Figure 10: IBM CAPEX and Long-term Debt 10-Year. Gurufocus
http://www.gurufocus.com/financials/IBM (Accessed 29.04.2014). Figure 11: IBM Revenue Quarter on Quarter. Gurufocus.
http://www.gurufocus.com/financials/IBM (Accessed 29.04.2014). Figure 12: IBM CEO Compensation. IBM. 2014. IBM Notice of 2014 Annual
Meeting and Proxy Statement. http://www.ibm.com/annualreport/2013/bin/assets/2014_ibm_proxy.pdf (Accessed 29.04.2014).
Figure 13: Weight Watchers Board of Directors Artal Nominees. Weight
Watchers Int. Inc. 2004. Corporate Governance Guidelines. http://media.corporate-ir.net/media_files/nys/wtw/corp_gov/governance_guidelines.pdf (Accessed 29.04.2014).
Figure 14: Weight Watchers Board of Directors and CEO Compensation. Weight
Watchers Int. Inc. 2004. Corporate Governance Guidelines. http://media.corporate-ir.net/media_files/nys/wtw/corp_gov/governance_guidelines.pdf (Accessed 29.04.2014).
Figure 15: Weight Watchers Board of Directors Composition. Reuters. People:
Weight Watchers International Inc. (WTWN) http://www.reuters.com/finance/stocks/companyOfficers?symbol=WTW.N (Accessed 29.04.2014).
Figure 16: Weight Watchers Key Numbers 2009-2013. Weight Watchers Int. Inc.
2014. 10-K Annual Report 2013. http://www.weightwatchersinternational.com/phoenix.zhtml?c=130178&p=irol-reportsAnnual (Accessed 29.04.2014).
Figure 17: Weight Watchers Share Price 5-Year. WTW. Google Finance.
http://www.google.com/finance?q=wtw&ei=BuxfU5CbEaWKwAPrwAE (Accessed 29.04.2014).
Figure 18: Weight Watchers Share Repurchase Conditions. Weight Watchers Int.
Inc. 2013. 10-K Annual Report 2012. http://www.weightwatchersinternational.com/phoenix.zhtml?c=130178&p=irol-reportsAnnual (Accessed 29.04.2014).
Figure 19: Weight Watchers Cash and Equivalents. Weight Watchers Int. Inc.
2012. 10-K Annual Report 2011 http://www.weightwatchersinternational.com/phoenix.zhtml?c=130178&p=irol-reportsAnnual (Accessed 29.04.2014).
!
! 68!
Figure 20: Weight Watchers Cash Flow Statement. Weight Watchers Int. Inc. 2012. 10-K Annual Report 2011. http://www.weightwatchersinternational.com/phoenix.zhtml?c=130178&p=irol-reportsAnnual (Accessed 29.04.2014).
Figure 21: Weight Watchers Debt Issuance and Share Repurchase. Weight
Watchers Int. Inc. 2013. 10-K Annual Report 2012. http://www.weightwatchersinternational.com/phoenix.zhtml?c=130178&p=irol-reportsAnnual (Accessed 29.04.2014).
Figure 22: Weight Watchers Income Statement Q1 2012. Weight Watchers Int.
Inc. 2012. 10-Q Quarterly Report Pursuant to Sections 13 or 15(d). http://www.weightwatchersinternational.com/phoenix.zhtml?c=130178&p=irol-reportsOther (Accessed 29.04.2014).
Figure 23: Weight Watchers CEO-dealings. Weight Watchers Int. Inc. 2012.
Statement of Changes in Beneficial Ownership of Securities. http://google.brand.edgar-online.com/displayfilinginfo.aspx?FilingID=8495760-1147-13478&type=sect&TabIndex=2&companyid=69668&ppu=%252fdefault.aspx%253fsym%253dWTW (Accessed 29.04.2014).
Figure 24: Weight Watchers Balance Sheet After the Buyback. Weight Watchers
Int. Inc. 2013. 10-K Annual Report 2012. http://www.weightwatchersinternational.com/phoenix.zhtml?c=130178&p=irol-reportsAnnual (Accessed 29.04.2014).
Figure 25: Berkshire Hathaway, Mr. Buffett Personal Holdings. W. E. Buffett.
2013. SEC Schedule 13D/A. http://yahoo.brand.edgar-online.com/displayfilinginfo.aspx?FilingID=9391461-1364-12903&type=sect&TabIndex=2&companyid=54239&ppu=%252fdefault.aspx%253fcik%253d1067983 (Accessed 29.04.2014).
Figure 26: Berkshire Hathaway Board of Directors Composition. Reuters. People:
Berkshire Hathaway Inc. http://www.reuters.com/finance/stocks/companyOfficers?symbol=BRKa.N (Accessed 29.04.2014).
Figure 27: Berkshire Hathaway Price-to-Book Value. S&P Capital IQ. 2013.
http://g.foolcdn.com/editorial/images/62906/brkpb1_large.png (Accessed 29.04.2014)
Figure 28: Berkshire Hathaway Statements of Changes in Shareholder´s Equity.
Berkshire Hathaway. 2013. 10-K Annual Report. http://www.berkshirehathaway.com/2013ar/201310-K.pdf (Accessed 29.04.2014)
Figure 29: Berkshire Hathaway Repurchase Threshold. The Rational Walk. 2014.
Berkshire Hathaway Stock Repurchase Odds Increase. http://www.rationalwalk.com/?p=13467 (Accessed 29.04.2014)
!
! 69!
15. WORD!OF!HONOR!STATEMENT!IN!GERMAN!
Hiermit versichere ich, die vorliegende Bachelorthesis selbstständig verfasst,
keine anderen Quellen als die angegebenen verwendet, sowie alle wörtlich oder
sinngemäß übernommenen Stellen in der Arbeit gekennzeichnet zu haben. Diese
Arbeit hat in gleicher oder ähnlicher Form noch keiner Prüfungsbehörde
vorgelegen.
Stuttgart, 30.04.2014
!
Philip Hettich